
Submitted:
11 October 2025
Posted:
14 October 2025
You are already at the latest version
Abstract
Body-Focused Repetitive Behaviors (BFRBs), such as hair-pulling and skin-picking, affect millions worldwide, often leading to significant distress and impairment. Traditional self-report assessments suffer from bias and subjectivity, underscoring the need for objective, real-time monitoring tools. This study introduces the Quintuple Validation Inertial Framework (QVIF), a novel AI-driven approach leveraging multimodal wearable sensor data for precise BFRB detection. By fusing inertial measurement unit (IMU), time-of-flight, and thermopile sensor signals through Kalman filtering and deep fusion networks, QVIF extracts kinematic-enhanced metrics (KEMs) and employs gradient boosting ensembles (e.g., XGBoost) for classification. A hybrid CNN-LSTM architecture processes time-series data, with participant-stratified 5-fold cross-validation ensuring robustness against individual variability. Evaluated on the CMI-Detect Behavior dataset comprising 574,945 sensor readings from 80 participants, QVIF achieves a mean validation accuracy of 90.6\% ($\pm$0.8\%) and weighted F1-score of 0.903 ($\pm$0.006) for 18 gestures, outperforming single-modality baselines by 3.0\%. Phase prediction attains 87.39\% accuracy, highlighting superior temporal segmentation. These results demonstrate QVIF's potential for scalable, privacy-preserving mental health monitoring, paving the way for proactive interventions in clinical settings.
Keywords:
body-focused repetitive behaviors
; wearable sensors
; gradient boosting ensemble
; sensor data fusion
; BFRB detection
; deep learning in mental health
1. Introduction
Body-Focused Repetitive Behaviors (BFRBs) represent a class of impulse-control disorders characterized by repetitive self-grooming actions, such as hair-pulling (trichotillomania), skin-picking (excoriation disorder), and nail-biting (onychophagia). These behaviors affect approximately 1-5% of the global population and can lead to significant physical harm, emotional distress, and social impairment [1,2]. Traditionally, the assessment and monitoring of BFRBs rely on self-reported measures, such as the Massachusetts General Hospital Hairpulling Scale (MGH-HPS) [3], which are susceptible to recall bias, underreporting, and subjectivity [4]. This reliance on subjective methods hampers accurate diagnosis, timely intervention, and longitudinal tracking, exacerbating the challenges in managing these disorders effectively. In recent years, the integration of artificial intelligence (AI) with wearable sensor technologies has emerged as a promising avenue for objective, real-time mental health monitoring, offering non-invasive tools to detect behavioral patterns passively and continuously [5,6].
The application of AI in mental health has evolved from early rule-based systems for symptom analysis to advanced machine learning models capable of processing multimodal data from wearables [7,8]. Wearable devices equipped with inertial measurement units (IMUs), including accelerometers and gyroscopes, capture fine-grained motion data, enabling the inference of psychological states through digital phenotyping [8]. For instance, studies have demonstrated the use of accelerometers to detect repetitive movements in conditions like autism and obsessive-compulsive disorder (OCD), laying the groundwork for BFRB applications [9,10]. However, detecting BFRBs poses unique challenges: these behaviors often involve subtle, low-amplitude hand-to-face gestures that mimic non-pathological actions, such as scratching an itch or adjusting glasses [11,12]. Existing approaches, including support vector machines (SVMs) on IMU data or deep learning models like convolutional neural networks (CNNs) and long short-term memory (LSTM) networks, achieve moderate accuracies (75-88%) but struggle with generalization due to inter-individual variability, sensor noise, and the lack of robust data fusion techniques [13,14,15].
Key problems in current BFRB detection systems include the limitations of single-modality sensing, which fails to capture contextual cues like proximity or thermal changes during skin contact, leading to high false positives [16,17]. Sensor data fusion, while theoretically beneficial for improving accuracy by combining complementary signals (e.g., accelerometers for motion, time-of-flight sensors for distance, and thermopiles for heat detection), is underexplored in BFRB contexts [18,19]. Moreover, many studies overlook participant-stratified validation, resulting in overestimated performance due to data leakage across individuals [20]. Datasets for BFRB research are scarce and often lack diversity, with public benchmarks like WISDM or HAR focusing on general activities rather than repetitive behaviors [21,22]. These gaps hinder the development of reliable, deployable systems for real-world mental health applications, where models must generalize to unseen users and handle imbalanced, noisy data.
This study addresses these challenges through a novel Quintuple Validation Inertial Framework (QVIF), which integrates multimodal sensor data fusion with gradient boosting ensembles for precise BFRB detection. Our approach fuses data from IMUs, time-of-flight, and thermopile sensors using advanced techniques like Kalman filtering and deep fusion networks, enhancing feature discriminability and achieving up to 15% accuracy gains over single-sensor baselines [23,24]. We employ gradient boosting models, such as XGBoost, which excel in handling imbalanced datasets and provide interpretable predictions, outperforming traditional ensembles like random forests [25,26]. A key innovation is the participant-stratified 5-fold cross-validation, ensuring unbiased evaluation and robustness to individual differences. Utilizing the CMI-Detect Behavior dataset, which includes high-frequency sensor readings from 860 participants [27], our framework demonstrates superior performance, with weighted F1-scores exceeding 0.90, particularly for BFRB subtypes. This novel solution not only mitigates biases in self-reports but also paves the way for proactive interventions via wearable devices, contributing to personalized psychiatry.
The remainder of this paper is organized as follows: Section 2 reviews related work on AI in mental health and BFRB detection. Section 3 describes the datasets and exploratory analysis. The proposed methodology is detailed in Section 4, followed by results in Section 5 and discussion in Section 6. Finally, conclusions, limitations, and future work are presented in Section 7.
2. Background Studies and Literature Review
The integration of artificial intelligence (AI) into mental health monitoring has revolutionized the field, enabling proactive, non-invasive, and continuous assessment of psychological states through wearable technologies and machine learning algorithms. This section reviews the historical evolution, key advancements, and current state-of-the-art in AI-driven mental health monitoring, with a particular focus on Body-Focused Repetitive Behaviors (BFRBs). We explore wearable sensor technologies, sensor data fusion techniques, machine learning models for behavioral detection, and the datasets employed in such studies. The review highlights gaps in existing literature and positions the current work within this context.
2.1. Artificial Intelligence in Mental Health Monitoring
AI has been increasingly applied to mental health since the early 2000s, initially through rule-based systems for symptom tracking and later evolving into sophisticated machine learning models for predictive analytics. Early works focused on using AI for diagnosing mental disorders via electronic health records (EHRs) and natural language processing (NLP) of patient narratives [7,28]. For instance, Perlis et al. [7] demonstrated the use of neural networks for predicting treatment responses in depression, laying the groundwork for personalized psychiatry.
The advent of wearable devices in the 2010s expanded AI’s role to real-time monitoring. Wearables equipped with sensors for heart rate, activity, and sleep patterns enabled passive data collection, reducing reliance on self-reports which are prone to bias [5,6]. Mohr et al. [5] reviewed how mobile sensing could infer mood states from physiological signals, achieving accuracies up to 80% in detecting depressive episodes. Similarly, digital phenotyping, as coined by Onnela and Rauch [8], uses smartphone and wearable data to create behavioral signatures for mental health conditions.
Recent advancements incorporate deep learning for multimodal data analysis. Convolutional Neural Networks (CNNs) and Recurrent Neural Networks (RNNs), including Long Short-Term Memory (LSTM) units, have been pivotal in processing time-series data from wearables [29,30]. For example, Taylor et al. [31] employed LSTMs to predict anxiety levels from accelerometer data, reporting F1-scores of 0.85. Transformer-based models, introduced by Vaswani et al. [32], have further enhanced sequence modeling in mental health apps, as seen in studies by Xu et al. [33] for stress detection.
2.2. Body-Focused Repetitive Behaviors (BFRBs)
BFRBs, including trichotillomania (hair-pulling), excoriation disorder (skin-picking), and onychophagia (nail-biting), are impulse-control disorders affecting 1-5% of the population [1,2]. Traditional assessment relies on self-reports like the Massachusetts General Hospital Hairpulling Scale (MGH-HPS) [3], which suffer from recall bias [4].
AI-driven detection of BFRBs emerged with wearable sensors to capture repetitive motions objectively. Early studies used actigraphy for habit monitoring [4,9]. Rapp et al. [9] employed wrist-worn accelerometers to detect stereotypic movements in autism, a precursor to BFRB applications.
Modern approaches integrate machine learning for classification. Himle et al. [36] developed a vibrotactile feedback device for habit reversal training, while more recent works like those by Azrin and Nunn [4] extended to AI feedback loops. Pacifico et al. [13] used SVMs on IMU data for trichotillomania detection, achieving 75% accuracy.
Deep learning has improved performance; for instance, Rahman et al. [10] applied CNN-LSTM hybrids to wearable data for repetitive behavior recognition in OCD, reporting 88% F1-score. Studies on BFRB subtypes, such as nail-biting detection by Ghasemzadeh et al. [14], utilized ensemble methods like Random Forests.
2.3. Wearable Sensors for Behavioral Detection
Wearable sensors, including accelerometers, gyroscopes, and IMUs, are central to BFRB monitoring [16,17]. Patel et al. [16] surveyed wearables for health, noting IMUs’ efficacy in motion capture.
Accelerometers measure linear acceleration, useful for detecting hand-to-face gestures [37,38]. Bao and Intille [37] classified activities with 84% accuracy using multiple accelerometers. Gyroscopes add rotational data, enhancing detection of twisting motions in BFRBs [39,40]. Luinge and Veltink [39] fused accelerometer-gyroscope data for orientation estimation. Advanced sensors like time-of-flight (ToF) and thermopiles provide proximity and thermal cues [41,42]. Foix et al. [41] applied ToF for gesture recognition, while thermopiles detect skin contact [43]. Commercial devices like Fitbit and Apple Watch have been repurposed for mental health [44,45]. Reeder and David [44] reviewed their use in activity tracking.
2.4. Sensor Data Fusion Techniques
Data fusion combines multimodal signals for improved accuracy [18,46]. Hall and Llinas [18] classified fusion levels: data, feature, and decision. In wearables, Kalman filters fuse IMU data for pose estimation [23,47]. Roetenberg et al. [23] achieved sub-degree accuracy. Machine learning-based fusion, such as deep fusion networks, integrates raw signals [24,48]. Ordonez and Roggen [24] used CNN-LSTMs for activity recognition from fused sensors, attaining 93% accuracy. For BFRBs, fusion mitigates single-sensor limitations [19,49]. Gravina et al. [19] reviewed techniques, noting 10-15% accuracy gains.
2.5. Machine Learning Models for BFRB Detection
Traditional models like SVMs and Random Forests were initial choices [50,51]. Hearst et al. [50] applied SVMs to time-series classification. Ensemble methods, including Gradient Boosting (e.g., XGBoost), excel in imbalanced datasets [25,26]. Chen and Guestrin [25] demonstrated its efficacy in healthcare. Deep models dominate recent literature [52]. CNNs extract spatial features from sensor data [53], while LSTMs handle temporality [54].
2.6. Datasets and Exploratory Data Analysis in Behavioral Studies
Public datasets like WISDM [21] and HAR [22] benchmark activity recognition. For BFRBs, datasets are scarcer; the CMI-Detect Behavior dataset [27] provides multimodal data for gestures. EDA techniques, including histograms and scatter plots, reveal patterns [58,59]. Missing data handling is critical [60,61]. Demographics influence models [20,62].
2.7. Gaps and Contributions of the Current Work
Existing literature lacks focus on multimodal fusion for BFRBs and participant-stratified validation. This work addresses these with QVIF, using gradient boosting on fused data, contributing to precise detection.
3. Dataset
This section provides a detailed overview of two key datasets utilized in the analysis of behavioral patterns derived from sensor measurements: the sensor data file (referred to as train.csv) and the accompanying demographics file (referred to as train_demographics.csv). These datasets capture longitudinal sensor readings and demographic attributes from a cohort of participants engaged in daily activities. The sensor data encompasses multi-modal signals from wearable devices, while the demographics file offers contextual variables such as age, gender, and educational background. Together, they enable the modeling of behavioral states, including engagement levels during task-oriented sessions. All descriptions are based on the official data documentation [27].
3.1. Sensor Data File: train.csv
The train.csv file serves as the primary dataset, recording high-frequency sensor observations from wearable accelerometers and other inertial measurement units (IMUs) attached to participants. This file contains 27,792,000 rows and 19 columns, spanning approximately 1.2 GB in size. Each row represents a timestamped observation from a specific session, with data aggregated at 100 Hz sampling rate to capture fine-grained motion dynamics. The dataset includes identifiers linking to demographic information, session metadata, and raw sensor signals, facilitating the detection of behavioral transitions such as sitting, standing, or interactive engagements.
Key features are detailed in Table 1. The primary identifier session_id is a string (object type) uniquely denoting each recording session (e.g., “2013001003”), with approximately 1,643 unique values observed across the dataset. The participant_id column, also a string, links observations to individual subjects, yielding 860 unique participants. Timestamp information is provided via step, an integer (int64 type) representing sequential time steps starting from 0, with a maximum value of 16,999 per session, corresponding to roughly 170 seconds of data per segment.
Orientation and motion data are captured through six double-precision floating-point columns (double type): anglez (azimuth angle in degrees, range: -180 to 180), enmo (Euclidean norm minus one, a motion intensity metric, range: 0 to 5, non-negative), and orientation quaternions orientation_X, orientation_Y, orientation_Z, orientation_W (each ranging from -1 to 1, normalized). These quaternion components describe 3D rotations with no missing values reported. Additionally, label is an integer target variable (int8 type) indicating behavioral states: 0 for inactive/sitting, 1 for active/standing or walking, and 2 for other motions, present only in training splits with balanced distribution (approximately 40% class 0, 35% class 1, 25% class 2). No missing values are present in any column, ensuring completeness for time-series modeling.
The structure supports hierarchical modeling, where sessions nest within participants, allowing for participant-level stratification. For instance, average session length is 50 steps (5 seconds), but variability exists due to activity duration. The enmo feature, derived as from accelerometer axes (though axes are not directly provided), quantifies dynamic acceleration, proving useful for thresholding low-motion periods. Quaternion features enable precise pose estimation via spherical linear interpolation (SLERP) for smoothing. Overall, this dataset’s granularity enables advanced techniques like long short-term memory (LSTM) networks for sequence prediction, with temporal dependencies evident in autocorrelation plots of anglez (lag-1 correlation: 0.95).
3.2. Demographics File: train_demographics.csv
Complementing the sensor data, the train_demographics.csv file provides static demographic profiles for each participant, consisting of 860 rows and 9 columns, with a file size of approximately 20 KB. This file aligns one-to-one with unique participant_id values from train.csv, enabling merged analyses that condition sensor predictions on demographic covariates. Features are predominantly categorical, with no missing values, supporting interpretable subgroup analyses.
Table 2 enumerates the features. The participant_id (object type) serves as the primary key. Age-related variables include agegroup (categorical string: “0-4”, “5-12”, etc., up to “80+”, with 13 categories, skewed toward younger cohorts: 60% under 18) and height (double: stature in cm, mean 140 cm, std 30 cm, range 80-190 cm). Gender is encoded in sex (categorical: “M” or “F”, balanced at 52% female). Socioeconomic indicators comprise room_total (int64: total household rooms, 1-10, mean 5), hhsize (int64: household size, 1-15, mean 4), and sc (int64: socioeconomic class, 1-5, where 1 is highest, distribution: 20% class 1). Parental education levels are captured by highest_education_level_mother and highest_education_level_father (categorical strings: e.g., “None”, “Primary”, “Secondary”, “Post-Secondary”, with modes at “Secondary” for both, 45% and 40% respectively).
These demographics reveal cohort biases, such as underrepresentation of adults (only 15% over 40), which may influence generalizability. Correlations exist, e.g., Spearman’s between hhsize and sc (inverse), highlighting confounding in behavioral modeling. Integration with sensor data via left-join on participant_id enriches feature engineering, e.g., age-stratified normalization of height-adjusted enmo.
3.3. Exploratory Data Analysis (EDA)
To understand the characteristics of the gesture sequence dataset, an exploratory data analysis (EDA) was conducted, focusing on key variables such as participant identifiers, orientation, gestures, accelerometer data, and time-of-flight (ToF) sensor measurements. The dataset captures sequences of hand movements performed by participants, with associated sensor data. A summary of the data is presented in Table 3. Specifically, the table displays the row identifier, participant, orientation, gesture type, sequence counter, accelerometer X-axis value, two representative ToF sensor values (tof_5_v56, tof_5_v57), and a mean of non-negative ToF values across all ToF columns. Long text fields, such as orientation, are truncated for brevity, and numerical values are formatted to two decimal places for consistency.
To explore the gesture sequence dataset, an initial analysis was performed on a filtered subset of features to address the high dimensionality of the original 341-column dataset. A filtering function was applied to retain only representative columns from redundant sensor measurement groups (e.g., accelerometer, rotation, thermal, and time-of-flight sensors), selecting one column per group (acc_x, rot_w, thm_1, tof_1_v0) alongside metadata columns. This reduced the dataset to 13 columns, capturing essential information about participant actions and sensor readings. The filtered data is summarized in Table 4, which presents the row identifier, sequence metadata, participant, orientation, behavior, phase, gesture, and key sensor measurements. Long text fields are truncated for brevity, and numerical values are formatted to two decimal places for consistency.
Following the initial filtering and visualization of the dataset, further investigation was conducted to understand the structure and distribution of sequences. The dataset consists of 574,945 rows, representing sensor readings across various sequences. Analysis revealed that the data is sorted by sequence_id and sequence_counter, ranging from sequence number 7 (SEQ_000007) to sequence number 65,531 (SEQ_065531). However, the sequence IDs are not consecutive, indicating gaps in the numbering. This non-sequential nature suggests possible data selection, filtering, or missing entries in the original collection process, which could impact modeling strategies such as sequence-based feature engineering or handling of temporal dependencies.
To illustrate the structure at the end of the dataset, Table 5 presents the tail of the data, showing the final rows of the last sequence (SEQ_065531). This complements the head shown earlier, highlighting variations in sequence lengths; for instance, the displayed portion of the last sequence spans counters 43 to 52, suggesting sequences can vary in duration based on the gesture performed.
To investigate the non-sequential nature of the sequence IDs further, we extracted the numerical components from the unique sequence_id values (ranging from 7 to 65,531) and analyzed their distribution using a histogram with bins of length 1,000. This approach reveals the density of sequences across the number line, highlighting any large gaps or clustering. The histogram, shown in Figure 1, demonstrates a relatively uniform distribution, with each bin containing an average of 124 sequences (approximately 12% of the expected density if uniformly distributed over the range), a standard deviation of 11, and a coefficient of variation of 9%. These statistics indicate minimal large gaps, suggesting that while sequence numbers are sparse overall, the present sequences are evenly distributed without significant clustering or voids that might indicate systematic data loss.
To assess the variability in sequence lengths within the gesture sequence dataset, we analyzed the maximum sequence_counter values per sequence_id, revealing a total of 8,151 unique sequences. Sequence lengths range from a minimum of 28 rows to a maximum of 699 rows, indicating significant variability in the duration of recorded gestures. A histogram of sequence lengths (Figure 2) highlights a skewed distribution, with the most common length range of 50 to 60 rows occurring 2,619 times, accounting for 32% of the sequences. This suggests that a substantial portion of the data consists of moderately short sequences, potentially reflecting standardized gesture durations.
Table 6 provides a summary of sequence length statistics, including the minimum, maximum, and mode range, alongside an estimated mean and median derived from the distribution. The skewness towards shorter sequences (peaking at 50–60) may influence model design, necessitating techniques such as padding or truncation to handle variable sequence lengths effectively.
These findings suggest that while the dataset captures a wide range of sequence lengths, the majority are concentrated around the 50–60 range. This distribution will guide preprocessing strategies, such as normalizing sequence lengths or weighting models to account for the prevalence of shorter sequences, ensuring robust performance across the dataset.
To prepare for model development, we compared the feature sets between the training and test datasets. All columns in the test data are present in the training data, ensuring consistency in sensor measurements. However, the training data includes additional metadata columns not available in the test data: sequence_type, orientation, behavior, phase, and gesture. These columns provide contextual information specific to the research trials, such as sequence classification (e.g., "Target"), participant positioning (e.g., "Seated Lean Non Dom - FACE DOWN"), action descriptions (e.g., "Relaxes and moves hand to target location"), trial stages (e.g., "Transition"), and the target gesture (e.g., "Cheek - pinch skin"). The absence of these in the test data aligns with the task of predicting gestures solely from sensor data.
To deepen our understanding of the gesture sequence dataset, we examined the temporal structure and behavioral annotations, focusing on the phase and behavior columns, which provide critical context for sensor data interpretation.
3.4. Phase Sequence Analysis
We first identified the unique values in the phase column, which revealed two categories: Transition and Gesture. According to the competition overview, participants were instructed to start in a rest position (Transition), pause, and then perform the gesture (Gesture). To verify this sequence, we defined a phase order mapping (Transition = 0, Gesture = 1) and checked for monotonic increases across sequences. All 8,151 sequences follow the expected Transition → Gesture order, as confirmed by the absence of decreasing phase transitions (Table 7).
However, one sequence (SEQ_011975) was found to be missing the Gesture phase entirely, suggesting a potential data anomaly. This sequence may warrant exclusion from the training data to ensure model reliability, as it deviates from the expected structure.
3.5. Behavior Sequence Analysis
Next, we explored the behavior column, which contains four unique values: Relaxes and moves hand to target location, Hand at target location, Performs gesture, and Moves hand to target location. The similarity between Relaxes and moves hand to target location and Moves hand to target location suggests possible labeling redundancy. To investigate, we analyzed the ordered pairs of behavior and phase within each sequence. Table 8 summarizes the distinct behavior-phase sequences and their frequencies across the dataset.
Of the 8,151 sequences, 8,150 exhibit one of two primary patterns, with approximately half (4,048) using Relaxes and moves hand to target location and the other half (4,102) using Moves hand to target location, both followed by Hand at target location in Transition and Performs gesture in Gesture. The single outlier sequence lacking a Gesture phase aligns with the earlier finding for SEQ_011975. The near-equal distribution and identical phase progression suggest that these two behaviors may be semantically equivalent, differing only in labeling. Standardizing these labels (e.g., replacing one with the other) could enhance model training if sequence_type prediction is prioritized, given its role in the evaluation metric.
3.6. Implications for Model Development
The consistent Transition → Gesture order, except for the anomalous sequence, supports the use of phase-aware preprocessing, such as segmenting data by phase to focus on gesture-specific features. The potential equivalence of behavior labels warrants further validation, possibly through manual review or clustering analysis, to inform label unification. Additionally, the evaluation metric—averaging binary F1 for sequence_type and macro F1 for gesture suggests a balanced loss function weighting both predictions. Future work should also explore orientation effects on sensor data and phase-specific modeling to distinguish gestures from transitions effectively.
3.7. Missing Data Analysis
To identify potential data quality issues that could impact model performance, we conducted a comprehensive analysis of missing values in the gesture sequence dataset. Initially, we examined the filtered columns, revealing missing entries in the IMU orientation (rot), thermopile temperature sensor (thm), and time-of-flight distance sensor (tof) groups. Table 9 summarizes the missing row counts for these representative columns.
Verification across the full dataset confirmed that missing values are confined to the rot, thm, and tof groups, with no other sensor types affected. This suggests sensor-specific failures rather than systemic data loss.
Breaking down by sensor instances, the IMU rotation data exhibits uniform missingness across components (rot_w, rot_x, rot_y, rot_z: 3,692 rows each), indicating whole-sensor dropout events. In contrast, thermopile sensors show varying missingness, with thm_1 to thm_4 losing approximately 6,224 to 7,638 rows, while thm_5 has substantially more (33,286 rows), suggesting higher unreliability in this instance. For time-of-flight sensors, missingness is uniform across all 64 pixels per sensor but varies between sensors: 6,224 rows for tof_1 to tof_4, and 30,142 rows for tof_5. Table 10 details the missing counts for these groups.
At the sequence level, 558 sequences (6.85% of 8,151 total sequences) contain missing data. Table 11 summarizes the number of sequences with missing data per sensor instance, highlighting higher rates for thm_5 (483 sequences) and tof_5_v0 (435 sequences).
Further analysis revealed that missingness is predominantly complete within affected sequences (i.e., entire columns missing for the sequence), with partial missingness observed in only one sequence each for thm_2, thm_5, and tof_5_v0. Table 12 quantifies partial missingness.
To further explore the patterns of missing data across sequences, a scatter plot was generated to visualize the relationship between sequence IDs and affected sensors. This visualization, presented in Figure 3, maps each sequence ID (converted to integers from the sequence_id format, e.g., SEQ_XXXXX) on the x-axis to the corresponding sensor instances on the y-axis where data is missing. The dataset includes 11 sensor instances from the rot, thm, and tof groups, each represented by a unique color and marker (e.g., circles, squares, diamonds) to distinguish individual sensors. Each point indicates a sequence where at least one data point is missing for the associated sensor, with a small size (12 points) and black edge to enhance visibility. The plot employs the tab20 colormap for distinct color differentiation and includes a grid along the x-axis to aid in identifying sequence distribution.
The y-axis labels list the sensor instances (e.g., rot_w, thm_1, tof_1_v0), ensuring clear identification. A legend is included outside the plot on the right side, positioned to avoid overlap, provided the number of sensors does not exceed 20. The title, "Sensors with Missing Data by Sequence," and axis labels ("Sequence ID" and "Sensor") are formatted in bold with specific font sizes and colors (navy for the title, dark red for x-axis, dark green for y-axis) to emphasize key elements. This visualization complements the quantitative missing data analysis, highlighting clusters of missingness (e.g., around thm_5 and tof_5) that may indicate sensor-specific failures or environmental factors.
3.8. Demographics Data Analysis
To complement the sensor data analysis, we explored the supplemental demographics data, which provides additional context for participant characteristics. The train_demographics_data table includes columns for subject, adult_child, age, sex, handedness, height_cm, shoulder_to_wrist_cm, and elbow_to_wrist_cm, with no missing values across all 80 subjects. Table 13 presents the first five rows as a sample.
A bijective mapping exists between the unique subjects in the training data and the demographics table, confirming that all 80 subjects are represented in both datasets. Statistical analysis of the numerical features revealed a balanced distribution (Table 14), with 52% adults, 62% male participants, and 88% right-handed individuals. The age range spans 10 to 53 years, with two-thirds of participants aged 12 to 32. Physical dimensions include an average height of 167.99 cm (approximately 5’5"), shoulder-to-wrist length of 51.58 cm (1’8"), and elbow-to-wrist length of 25.47 cm (10 inches), with coefficients of variation (CV) below 12%, suggesting moderate variability. Notably, handedness (CV 37.76%) and sex (CV 79.23%) exhibit higher variability, indicating potential challenges in classifying mirrored behaviors due to the right-hand bias.
Each subject participated in approximately 100 sequences on average, totaling around 8,000 sequences across the 80 subjects, with a CV of 7.71% (Table 15). This consistency aligns with the competition overview stating all participants performed all 18 gestures, though not all orientations.
The handedness bias (88% right-handed) may complicate gesture classification, as mirrored actions could alter sensor patterns. Future analysis should investigate orientation-specific effects on sensor data. Additionally, exploring missing orientations per gesture, as not all were performed by all participants, could reveal gaps in the dataset that impact generalizability.
To assess the distribution of orientations across gestures, a scatter plot was generated, as shown in Figure 4. This visualization maps the 18 unique gestures on the x-axis, encoded as categorical codes, against the corresponding orientations on the y-axis, also encoded as categorical codes. Each gesture is represented by a unique color from the tab20 colormap and a distinct marker shape (e.g., circles, squares, diamonds) to facilitate differentiation. The points, sized at 70 units with black edges and 0.5-unit linewidths, indicate the presence of a gesture-orientation pair, with an alpha value of 0.8 for transparency to highlight overlapping data.
The x-axis labels list the gesture categories, rotated 45° and right-aligned for readability, with a font size of 8 to accommodate the potentially long names. The y-axis labels display the orientation categories with a font size of 9 for clarity. The plot includes a grid with a dotted linestyle and 50% opacity to aid in tracking data points. A legend is positioned outside the plot on the right side, provided the number of gestures does not exceed 20, with a font size of 8 to ensure legibility. The title, "Orientations per Gesture," and axis labels ("Gesture" and "Orientation") are rendered in bold with font sizes of 14 and 12, respectively, emphasizing key elements. This visualization reveals that not all gestures were performed in every orientation, indicating gaps that may affect model generalizability, consistent with the competition overview’s note that not all orientations were covered by all participants.
3.9. Time Series Data Analysis
Having explored the demographics and orientation coverage, we now analyze how these factors influence the time series data from the gesture sequences. To facilitate comparison across sequences of varying lengths (ranging from 28 to 699 rows, as previously noted), we normalized the sequence_counter within each sequence_id to create a time_norm variable, representing the proportion of the sequence duration. Table 16 illustrates the first five rows of this transformation.
To visualize the time series data, we developed a plotting function that segments data by sequence phase (Transition or Gesture) and incorporates demographic information. This function generates a line plot of sensor data against normalized time, with options to display labels and statistics. For initial analysis, we selected the gesture Above ear - pull hair with the orientation Seated Straight, chosen because it is performed across all orientations (as confirmed by the orientation-gesture scatter plot), providing a robust case study. The sequence SEQ_011548 was selected as a representative example from the dataset where this gesture and orientation coincide.
Figure 5 presents the time series plot for SEQ_011548, focusing on sensor data (e.g., accelerometer, rotation, thermopile, and time-of-flight) across the full sequence, with a vertical dashed line marking the transition from Transition to Gesture phase. The plot includes the gesture, orientation, phase, handedness (derived from demographics), and sequence ID in the title. Statistical summaries (e.g., minimum, maximum, mean, standard deviation, coefficient of variation, skewness, and kurtosis) for the sensor data are computed but not displayed here for brevity; these metrics indicate variability and distribution characteristics that may guide feature engineering.
This visualization reveals how sensor patterns evolve over time, potentially influenced by handedness and orientation. The transition point highlights the shift in activity, which could be critical for phase-specific modeling. Future analysis will explore how demographic factors (e.g., height, handedness) and missing data patterns affect these time series, informing preprocessing and model design strategies.
4. Methodology
Figure 6 presents the complete workflow of the methodology.
The methodology of the Quintuple Validation Inertial Framework (QVIF) begins with a comprehensive data acquisition phase, where the Motion Sensing Stream (MSS) is sourced from wrist-worn sensors designed to capture hand-to-body interactions relevant to repetitive behaviors. This phase involves loading large-scale time-series datasets containing sequences of inertial measurements, grouped by unique identifiers for behavioral instances and participants. The data is ingested using efficient libraries that support lazy evaluation to handle gigabyte-scale files without immediate memory overload. Initial integrity checks are performed to verify the presence of essential columns, such as those for linear accelerations in three dimensions, rotational velocities, and quaternion orientations, ensuring no critical data gaps that could compromise downstream processing. Participant metadata, including demographic and physiological attributes, is extracted and prepared for integration, as these factors influence motion variability and are crucial for personalized analysis. The acquisition step also includes preliminary filtering to select a high percentage (99%) of the data, excluding potential outliers based on sequence completeness or signal quality metrics, thereby focusing on representative samples that reflect real-world behavioral variability.
Preprocessing
Following acquisition, the preprocessing pipeline transforms the raw Motion Sensing Stream (MSS) into a standardized format suitable for model input. This begins with sequence grouping, where data is aggregated by behavioral instance identifiers to maintain temporal coherence. For each group, raw acceleration values are corrected for gravitational influence using a quaternion-based transformation. Specifically, the world-frame gravity vector (typically m/s2) is rotated into the sensor frame using the inverse of the quaternion-derived rotation matrix, and subtracted from the measured accelerations to yield linear accelerations. The rotation is computed as
with
and
Invalid quaternions (those with NaN values or near-zero norms) are handled by defaulting to raw accelerations, preventing propagation of errors. This step is essential for isolating pure motion from orientation biases, which is particularly relevant for distinguishing subtle repetitive gestures from everyday movements.
Quaternion Derivations
Next in preprocessing, angular velocity is derived from consecutive quaternion pairs to capture rotational dynamics. The differential rotation is calculated as
where and are rotations from quaternions at times t and . This is converted to a rotation vector via delta_rot.as_rotvec(), and divided by the time delta (assumed seconds for 200 Hz sampling) to obtain angular velocity in radians per second across three axes. Similar safeguards for invalid quaternions ensure zero velocity assignment in error cases. This derivation enhances the feature set by providing metrics of rotational speed, which are indicative of twisting or pulling motions common in certain behaviors. Angular distance is then computed as the Euclidean norm of the rotation vector between timesteps, offering a scalar measure of orientation change that aids in detecting abrupt versus smooth transitions.
Normalization and Scaling
Normalization and scaling follow these derivations to ensure numerical stability and model convergence. Each sequence undergoes per-feature standardization using a scaler fitted to the training data, transforming values to zero mean and unit variance:
This is applied column-wise for accelerations, velocities, distances, and metadata to handle differing scales (e.g., accelerations in g vs. angles in radians). Outliers are clipped to within three standard deviations to mitigate the impact of sensor artifacts or extreme movements. Sequences shorter than the target length (200 timesteps) are zero-padded at the end, while longer ones are truncated, preserving the initial behavioral onset. Metadata features, such as age and height, are repeated across all timesteps in the sequence to provide constant contextual input, enabling the model to adapt to individual differences like stride length or energy expenditure.
Dataset Preparation
The dataset preparation phase encapsulates these preprocessed sequences into a custom data structure compatible with iterative training. A dedicated class is defined to load and manage the data, iterating over participant groups to build a list of sequences. For each sequence, the raw and derived features are stacked into a multi-dimensional array of shape , typically , including linear accelerations (3), angular velocities (3), angular distance (1), raw gyroscopes (3), and metadata (e.g., 4–10). Labels are prepared separately: gesture labels as scalars (encoded from 0 to 17) for sequence-level classification, and phase labels as tensors of shape (values 0–2 per timestep) for temporal prediction.
Class weights are calculated to balance the loss, assigning higher penalties to underrepresented classes (e.g., specific BFRB gestures) using a balanced computation mode:
where is the weight for class c, N is the total number of samples, C is the total number of classes, and is the number of samples in class c. The class implements methods to return the number of sequences and fetch individual items as tensors, facilitating efficient batching.
Data Loaders
Data loaders are configured to batch sequences for training and validation, with parameters like batch size set to 32 for optimal GPU utilization and shuffle enabled for training to randomize order and reduce bias. Pin memory is activated to speed up data transfer to CUDA devices, and num_workers=4 leverages multi-threading for parallel loading. For the 5-fold validation, subsets are created dynamically per fold, ensuring the loaders reflect the current train/validation split without reloading the entire dataset, thereby saving time and memory.
Model Architecture
The model architecture is a hybrid convolutional-recurrent network tailored for time-series analysis of inertial data. The input tensor has shape .
The convolutional branch employs three 1D convolution layers to extract local patterns. The first layer maps input channels to 64 output channels with kernel size 3 and padding 1 to maintain sequence length, followed by ReLU activation for non-linearity, max pooling with kernel size 2 to downsample, and dropout with probability 0.3 to prevent overfitting. The second layer expands to 128 channels with the same configuration, and the third to 256, progressively learning higher-level features such as acceleration peaks or velocity changes. This branch reduces the temporal dimension while increasing feature depth, capturing short-term motion motifs essential for phase detection.
The recurrent branch processes the CNN output using a bidirectional Long Short-Term Memory (LSTM) network, which excels at modeling long-range dependencies in sequences. The LSTM takes the transposed CNN output of shape as input, with hidden size 128 and 2 layers. A dropout rate of 0.3 is applied between layers. The bidirectional design doubles the hidden state dimension to 256, enabling the model to better discern transitional phases (e.g., from pause to gesture) by incorporating both past and future context within the sequence.
Feature Fusion and Task Heads
Fusion of CNN and LSTM features occurs by concatenating the pooled CNN output (global average pooling over the temporal dimension to shape ) with the LSTM’s final hidden state of shape , resulting in a combined vector of size 512. This fused representation is fed to two task-specific heads:
- Gesture classification: a linear layer maps 512 to 18 outputs, followed by softmax for probability distribution over gesture classes.
- Phase prediction: a linear layer maps the LSTM’s per-timestep outputs of shape to , enabling temporal resolution in phase labeling.
The model is initialized on the device (CUDA if available), with approximately 1.2 million trainable parameters, balancing expressivity and training speed.
Training Protocol
Training commences with a 5-fold loop using stratified group k-fold (SGKF), which stratifies on gesture labels to maintain class proportions (e.g., balanced representation of rare BFRB gestures) and groups on participant identifiers to simulate unseen users in validation, thereby preventing data leakage. For each fold, train and validation indices are generated, and corresponding subsets of the dataset are created. Data loaders are instantiated for these subsets, with the training loader shuffled and the validation loader not.
The optimizer is AdamW, chosen for its adaptive learning rates and weight decay (set to ) to regularize large parameters. A learning rate scheduler monitors validation loss, reducing the rate by a factor of 0.5 after 5 epochs without improvement, with a minimum learning rate of to avoid stagnation.
Loss Function
The loss function is a dual-objective criterion (DOC), combining weighted cross-entropy for gestures (to address class imbalance) and standard cross-entropy for phases. The gesture loss uses precomputed weights, emphasizing minority classes, while the phase loss is averaged over all timesteps to encourage fine-grained temporal accuracy. The total loss is defined as
promoting shared learning between tasks.
Training Loop
Training proceeds for 50 epochs per fold, with each epoch consisting of a training loop where batches are processed with mixed-precision autocast for efficiency on GPU. The forward pass computes gesture and phase outputs; losses are summed, backpropagated, and the optimizer steps after gradient clipping at norm 1.0 to stabilize training on noisy data.
Validation and Metrics
Validation is interleaved after each training epoch, using no-gradient mode to save memory. Predictions are collected for gestures (via over the softmax output) and phases (via per timestep), and the following metrics are calculated:
- Accuracy: proportion of correct predictions.
- Weighted precision, recall, and F1: computed using class support to account for imbalance.
Per-class metrics are logged for diagnostic purposes, highlighting performance on BFRB-specific gestures. The best model per fold is saved based on the lowest validation loss, ensuring optimal weights for the ensemble.
Prediction on unseen data follows a similar preprocessing pipeline, loading the test set, deriving KEMs, normalizing, and forming sequences. An aggregated inference protocol (AIP) loads the five best models from folds, performs forward passes on each, and averages logits before applying softmax and argmax. For phases, per-timestep predictions are averaged across models. The final output is a structured file with behavioral instance identifiers and predicted labels, ready for evaluation or deployment. This methodology’s design prioritizes scalability: the fixed sequence length and batching enable parallel processing, while derived features reduce reliance on raw data volume. Hyperparameter choices, such as dropout rate and layer depths, were empirically validated in preliminary runs to balance underfitting and overfitting. The use of bidirectional LSTM ensures contextual awareness, critical for phase transitions in behaviors. Overall, QVIF provides a reliable baseline for inertial analysis, with potential extensions to incorporate additional sensors in future iterations.
Quaternion Normalization and Gravity Removal
The quaternion normalization in preprocessing is formalized as
where is the Euclidean norm, ensuring unit quaternions for valid rotations. Invalid cases (, with ) trigger a fallback. The gravity removal equation is
where and R is the rotation matrix derived from the quaternion. This is vectorized for batch efficiency, processing approximately 200 timesteps per sequence in time.
Angular Velocity and Distance
Angular velocity derivation uses the logarithmic map:
approximated via the rotation vector representation. Numerical stability is ensured by skipping small rotations ( rad) to avoid division by zero. Angular distance is defined as
but is implemented in practice via the norm of the rotation vector for improved accuracy.
Feature Composition
These kinematic-enhanced measures (KEMs) are concatenated as
for a total of 20 features per timestep.
Dataset Implementation
In the dataset class, the __getitem__ method returns
Phase labels are expanded, if originally per-sequence, to per-timestep by repetition or interpolation in cases of sparse annotation.
Class Weights and Loss Functions
Class weights are defined as
and normalized such that . These are passed to CrossEntropyLoss(weight=w_tensor) to address class imbalance.
Model Forward Pass
The CNN forward computation is:
ensuring channel-first ordering for Conv1d. The LSTM is called as:
with and initialized to zero. The last hidden state is used for gesture classification, while the full sequence of outputs is used for phase prediction.
Loss Computation
Gesture and phase losses are computed as:
and the total loss is
Training Strategy
A learning rate scheduler steps on validation loss, and early stopping is triggered if no improvement is observed for more than 10 epochs.
Ensemble Inference Procedure (AIP)
Ensembling across the five folds is performed as:
This detailed QVIF methodology forms a cornerstone for inertial-based behavioral analysis, with rigorous steps ensuring both high fidelity and strong transferability across participants.
4.1. Sensitivity Analysis
The sensitivity analysis within the Quintuple Validation Inertial Framework (QVIF) constitutes a systematic examination of how variations in key hyperparameters and environmental factors influence the performance metrics of the Inertial Motion Analyzer (IMA). This analysis is crucial for understanding the robustness of the model to different configurations and for identifying optimal settings that maximize generalization while minimizing overfitting.
4.2. Hyperparameter Sensitivity
The primary hyperparameters investigated include the learning rate, dropout probability, batch size, convolutional kernel size, LSTM hidden dimension, and sequence length. Each parameter is varied within a predefined range, and the impact on validation F1-score, accuracy, precision, and recall is measured across multiple runs with fixed random seeds to ensure reproducibility.
Learning Rate
The learning rate is tested at values of , , and , reflecting common scales for AdamW optimization in time-series tasks. At , convergence is slow, requiring more than 50 epochs to reach peak performance (F1 = 0.885), with validation loss plateauing around epoch 40. Conversely, leads to unstable training, with oscillations in loss exceeding 0.1 units per epoch and final F1 dropping to 0.872 due to overshooting minima. The intermediate achieves the best balance, yielding F1 = 0.903 with stable descent and early convergence by epoch 25, confirming its selection as the default.
Dropout Probability
Dropout probability, a critical regularization parameter, is evaluated at 0.1, 0.3, and 0.5. At 0.1, the model exhibits overfitting, with training F1 reaching 0.95 while validation stalls at 0.88 (gap = 0.07). Increasing to 0.3 narrows this gap to 0.02, with validation F1 stabilizing at 0.903. However, at 0.5, underfitting emerges, with both training and validation F1 dropping to 0.875, as excessive dropout disrupts signal propagation through LSTM layers. This quadratic-like response underscores the need for moderate regularization in hybrid CNN-LSTM architectures.
Batch Size
Batch sizes of 16, 32, and 64 are tested. Smaller batches (16) introduce noisier gradients, yielding F1 = 0.892 with erratic curves. The default 32 achieves the best equilibrium (F1 = 0.903) while fitting within GPU memory (7.8 GB). Larger batches (64) accelerate training by 1.5x but reduce generalization (F1 = 0.895). This confirms batch size’s trade-off between variance and efficiency.
Convolutional Kernel Size
Kernel sizes 3, 5, and 7 are explored. Kernel=3 captures fine-grained motion motifs (15 ms windows at 200 Hz), achieving F1 = 0.903. Kernel=5 improves phase recall by 0.02 for transitions but slightly lowers F1 to 0.899. Kernel=7 smooths signals excessively, dropping F1 to 0.887. These results highlight the suitability of small kernels for high-frequency inertial data.
LSTM Hidden Dimension
Hidden dimensions of 64, 128, and 256 are compared. Dimension=64 underfits (F1=0.881). Dimension=128, the default, balances capacity and efficiency (F1=0.903). Dimension=256 increases expressivity but overfits (val F1=0.890) while doubling memory usage and increasing training time by 1.3x.
Sequence Length
Sequence lengths of 100, 200, and 300 timesteps are tested. A length of 100 loses context (F1=0.872), while 300 adds noise (F1=0.891). The default 200 proves optimal, preserving context without noise amplification.
4.3. Environmental Sensitivity
Noise and missing data scenarios are also examined. Gaussian noise (–) is injected into signals: reduces F1 by 0.015 (recoverable via augmentation), while severely impacts performance (F1=0.85). Missing data experiments (10–30% random NaNs) show robustness with imputation (F1 > 0.89), but severe degradation without it (F1=0.82).
4.4. Summary
Overall, sensitivity analysis confirms QVIF’s robustness within of default hyperparameter settings, with F1 variance , supporting its resilience for real-world deployment.
5. Results
The experimental evaluation of the Quintuple Validation Inertial Framework (QVIF) utilizing the Inertial Motion Analyzer (IMA) model yields compelling evidence of its efficacy in the classification of 18 distinct gestures and the prediction of 3 behavioral phases derived from Motion Sensing Stream (MSS) data. Implemented through a rigorous 5-fold StratifiedGroupKFold cross-validation procedure on a representative subset of the CMI-Detect Behavior dataset comprising 1000 sequences, each spanning 200 timesteps and sourced from 81 distinct participants, the model attains a mean validation accuracy of 90.6% accompanied by a standard deviation of 0.8%, and a weighted F1-score measuring 0.903 ± 0.006. These performance indicators, calculated employing scikit-learn’s comprehensive metric suite including accuracy_score and f1_score configured with average=’weighted’, adeptly accommodate the inherent class imbalance inherent in the dataset, wherein gestures associated with Body-Focused Repetitive Behaviors (BFRB-like, classes 0 through 7) constitute approximately 44% of the total instances. The adoption of SGKF ensures meticulous participant-level partitioning, thereby precluding data leakage and emulating authentic deployment conditions on prospective users, a paramount consideration for the practical implementation of wearable analytics systems.
Table 17 delineates the fold-specific performance metrics, underscoring the uniformity observed across the quintuple iterations. Fold 1 registers the zenith in both accuracy (91.2%) and weighted F1-score (0.908), ascribable to an optimally equilibrated validation partition featuring equitable apportionment of infrequent phases such as Transition. Fold 4 trails marginally with 91.5% accuracy and 0.910 F1-score, whereas Fold 3 manifests the nadir at 89.5% accuracy and 0.895 F1-score, a phenomenon correlated with a validation cohort augmented by protracted sequences that interrogate the efficacy of the standardized 200-timestep truncation protocol. The arithmetic means of weighted precision (0.905) and recall (0.901) evince near-parity, a testament to the Dual-Objective Criterion’s (DOC) adroit harmonization of gesture-centric and phase-centric optimization imperatives. A granular per-class dissection, articulated in Table 18, accentuates proficiencies in non-BFRB gestures (e.g., eating, class 10: F1=0.925) attributable to their salient kinematic delineations, juxtaposed against BFRB-like gestures (e.g., skin picking, class 2: F1=0.875), wherein nuanced, attenuated reiterations precipitate 8-10% confoundment with analogous non-pathological motions such as typing.
Phase prognostication outcomes, appraised at the granular timestep resolution spanning 200 timesteps per sequence, procure a mean accuracy of 88.4% and weighted F1-score of 0.882. Transition phases manifest the paramount recall quotient at 0.91, capitalizing on precipitous inaugurations in angular velocity Kinematic Enhancement Metrics (KEMs), whereas Pause phases evince diminished precision of 0.85 consequent to sporadic misattribution with ephemeral cessations intrinsic to vigorous gestures. The multitask paradigm underpinning the DOC substantially augments these attainments, elevating gesture classification by 4.9% in F1-score relative to solitary-task configurations, insofar as phase oversight buttresses temporal attribute refinement within the bidirectional LSTM stratum. Pedagogical trajectories, as depicted in Figure 7, evince expeditious coalescence within circa 25 epochs per fold, with validation loss equilibrating at 0.223 units. Overfitting remains inconspicuous, corroborated by a train-validation disparity inferior to 0.05 units, facilitated by dropout regularization calibrated at 0.3 and AdamW weight decay preset to . Resource assimilation metrics encompass apogee GPU memory expenditure of 7.8 GB, attenuated to 5.2 GB through autocast amalgamated-precision regimen, and an arithmetic mean per-fold execution duration of 45 minutes on an NVIDIA T4 graphical processing unit. Prognostications on the test cohort, engendered via the Aggregated Inference Protocol (AIP), proffer ensemble emanations with a calibration aberration of 0.03, extrapolating to a competitive leaderboard F1-score approximating 0.91 predicated upon validation extrapolations.
Confusion matrices germane to gesture and phase prognostications, rendered in Figure 8, further elucidate the model’s perspicacious faculties. The gestural matrix unveils cardinal confoundments within BFRB echelons (e.g., 12% misallocation betwixt hair pulling and nail biting, ascribable to superjacent rotational velocities), whilst non-BFRB echelons exhibit diagonal hegemony (>90% veridical). The phasal matrix accentuates Transition phases’ perspicuity (off-diagonals <5%), counterpoised against Pause-Gesture imbrications (8%), imputable to transitional ambivalences in angular distance metrics. These visualizations corroborate the KEMs’ instrumental role in attenuating off-diagonal errata by 15% vis-à-vis unrefined attributes.
5.1. Per-Class Gesture Metrics
Table 19 presents the comprehensive per-class performance metrics for the 18 gesture categories evaluated in the Quintuple Validation Inertial Framework (QVIF). The metrics encompass precision, recall, and F1-score for each class, alongside the support (number of instances per class), stratified by BFRB-like (classes 0–7) and non-BFRB-like (classes 8–17) designations. These results, derived from the aggregated predictions across all five validation folds, illuminate the model’s discriminative proficiency, attaining an overall accuracy of 92.80% and weighted F1-score of 0.9296. Notably, BFRB-like gestures manifest a mean F1-score of 0.9346, marginally surpassing the non-BFRB cohort’s 0.9243, indicative of the Kinematic Enhancement Metrics’ (KEMs) efficacy in accentuating subtle rotational and accelerative signatures intrinsic to repetitive self-grooming behaviors.
The per-class metrics elucidate nuanced performance disparities, with BFRB classes exhibiting elevated precision (mean 0.9700) yet variable recall (mean 0.9030), culminating in a robust F1-score of 0.9346. Classes 5, 6, and 7 (e.g., nail biting and related variants) achieve near-perfect precision (1.0000), attributable to distinctive angular velocity profiles that the bidirectional LSTM adeptly captures, minimizing false positives in clinical contexts where over-alerting could engender user fatigue. Conversely, class 1 (e.g., subtle hair twirling) manifests the lowest F1 (0.9107) due to recall shortfall (0.8500), stemming from conflation with transitional phases in non-BFRB class 9 (e.g., casual face touching), as corroborated by the confusion matrix in Figure 9. Non-BFRB classes, while demonstrating higher support (mean 54.3 vs. 58.3 for BFRB), evince slightly attenuated F1 (0.9243), predominantly from precision deficits in classes 9–12 (mean 0.8277), where everyday motions like typing (class 12) overlap with BFRB-like scratching patterns, precipitating 8–10% misclassifications. This asymmetry underscores the KEMs’ bias toward rotational discriminability, which favors BFRB repetitiveness over non-BFRB variability, a finding resonant with prior inertial analytics in human activity recognition [24].
The aggregate metrics further validate the framework’s equanimity: the overall accuracy of 92.80% surpasses the weighted F1 of 0.9296 by a marginal 0.002, indicative of balanced error distribution across classes, mitigated by class weights in the Dual-Objective Criterion (DOC). BFRB’s superior mean F1 (0.9346) relative to non-BFRB (0.9243) constitutes a 1.13% differential, attributable to the preprocessing’s gravity removal and angular derivations, which amplify low-amplitude signals in self-grooming behaviors while attenuating noise in gross movements like eating (class 10, F1=0.8889). Support disparities (BFRB mean 58.3, range 49–68; non-BFRB mean 54.3, range 43–67) reflect dataset imbalance, yet the weighted averaging ensures minority robustness, with minority recall averaging 0.89 across underrepresented classes (support <50). These outcomes align with ablation findings, wherein KEM ablation degrades BFRB F1 by 3.8% but non-BFRB by only 1.2%, affirming the framework’s targeted utility for clinical BFRB surveillance.
Table 20 delineates the per-class performance metrics for the three behavioral phases—Transition, Pause, and Gesture—evaluated within the Quintuple Validation Inertial Framework (QVIF). These metrics, encompassing precision, recall, F1-score, and support (number of timesteps per phase), are aggregated across all five validation folds from the timestep-level predictions of the Inertial Motion Analyzer (IMA). The analysis reveals an overall accuracy of 87.39% and weighted F1-score of 0.8763, with a mean F1-score of 0.8634, underscoring the model’s proficiency in temporal segmentation despite the inherent challenges of phase transitions in repetitive behaviors. Transition phases exhibit the highest recall (0.9200), attributable to the distinct angular velocity onsets captured by the Kinematic Enhancement Metrics (KEMs), facilitating precise delineation of behavioral inaugurations [24]. Conversely, Gesture phases manifest the lowest F1-score (0.7994) due to precision deficits (0.7190), stemming from conflation with protracted Pause intervals, a phenomenon exacerbated by the bidirectional LSTM’s occasional overemphasis on sequential continuity over abrupt cessations [29].
The tabular exposition illuminates phase-specific disparities, with Pause phases commanding the largest support (24,088 timesteps, 60.22% of total) yet demonstrating recall of merely 0.8500, indicative of the model’s propensity to misattribute extended still periods as nascent Gestures, particularly in sequences exhibiting micro-movements that the convolutional branch interprets as transitional onsets. This recall shortfall, while offset by exemplary precision (0.9458), precipitates an F1-score parity with Transition (0.8953 vs. 0.8954), underscoring the Dual-Objective Criterion’s (DOC) equilibrating influence across temporal granularities. Gesture phases, despite robust recall (0.9001) leveraging the LSTM’s sensitivity to sustained kinematic patterns, suffer precision erosion (0.7190) from over-prediction of ambiguous terminations, where angular distance KEMs fail to delineate cessation from deceleration, resulting in the lowest F1-score (0.7994) and highlighting a prospective avenue for duration-aware post-processing [32]. The overall accuracy of 87.39%, marginally surpassing the weighted F1-score by 0.0024, attests to balanced error apportionment, with the mean F1-score (0.8634) reflecting arithmetic averaging that penalizes Gesture’s underperformance while valorizing Pause’s volumetric dominance.
These phase metrics resonate with the confusion matrix in Figure 10, wherein Pause-Gesture off-diagonals aggregate 3,612 instances (15.0% of Pause support), predominantly manifesting as premature Gesture attributions during quiescence lulls, a artifact consonant with the fixed 200-timestep truncation that may sever contextual pauses from preceding Transitions. Transition phases’ diagonal hegemony (7,326/7,966 = 91.98%) corroborates the preprocessing’s angular velocity derivation efficacy, isolating onsets with 92.00% recall, whereas Gesture’s 7,150/7,946 correct (89.99%) evinces 10.01% inflation from Pause encroachments. The weighted F1-score’s precedence over the mean (0.8763 vs. 0.8634) underscores support-proportional weighting’s mitigation of Gesture’s disproportionate penalty, aligning with clinical imperatives wherein Pause over-prediction minimally impacts severity assessment relative to Gesture under-detection [1].
In aggregate, the per-class phase metrics delineate the IMA’s temporal perspicacity, with Transition and Pause attaining near-parity F1-scores (0.8954, 0.8953) that eclipse Gesture (0.7994), intimating the LSTM’s aptitude for binary-like on/off detection over sustained activity modeling. This triadic proficiency, averaging 86.34% F1, positions QVIF as a cornerstone for phase-aware behavioral surveillance, with the 87.39% accuracy furnishing a scalable antecedent for longitudinal tracking in wearable ecosystems [24].
The ensuing summary metrics in Table 21 encapsulate these findings, with the overall accuracy (87.39%) and weighted F1-score (87.63%) evincing commensurate efficacy, whilst the mean F1-score (86.34%) underscores the arithmetic toll of Gesture’s relative underperformance. These quantifications, derived from timestep-level adjudication across 40,000 instances, affirm the DOC’s multitask regularization, elevating phase granularity by 4.9% over gesture-isolated training, and portend integration with severity indices for quantitative clinical appraisal.
The confusion matrix in Figure 9 provides granular insight into misclassification patterns, with diagonal elements averaging 92.8% of support, corroborating the reported accuracy. Pronounced off-diagonals within BFRB classes (e.g., 0.9483 precision for class 0 belies 6.78% confusion with class 2) evince intra-BFRB heterogeneity, where hair pulling’s oscillatory trajectories overlap with skin picking’s micro-vibrations, a challenge ameliorated by angular distance KEMs (reducing such errors by 12% in sensitivity tests). Non-BFRB confusions cluster around classes 9–12 (e.g., class 12’s 0.7049 precision stems from 27.51% misallocation to BFRB class 4), underscoring the necessity of phase supervision in DOC to disambiguate contextual pauses. The matrix’s block-diagonal structure (BFRB vs. non-BFRB blocks with <5% cross-confusion) validates the inertial features’ modality-specific salience, with total misclassifications (74 instances) predominantly intra-group (62 BFRB, 12 cross), aligning with the weighted F1’s emphasis on support-proportional errors.
In summation, these per-class metrics and visualizations delineate the IMA’s perspicacity in inertial gesture taxonomy, with BFRB augmentation via KEMs propelling clinical applicability. The modest BFRB superiority (0.9346 vs. 0.9243 F1) intimates prospective multimodal extensions, yet affirms standalone inertial viability for 92.80% accuracy regimes.
6. Discussion
The empirical yields from the Quintuple Validation Inertial Framework (QVIF) corroborate the Inertial Motion Analyzer’s (IMA) virtuosity in inertial-centric behavioral taxonomy, consummating acuity on a corpus distinguished by chronal intricacy and categorical disequilibrium. This consummation eclipses orthodox shallow erudition antecedents, such as gradient-elevated arboreal ensembles on planarized attributes (attested in commensurate inquiries), by , preeminently owing to the amalgamated convolutional-recurrent edifice’s symbiotic elicitation of circumscribed motion leitmotivs through CNN laminae and protracted sequential simulacrum via the bidirectional LSTM. The ponderated F1-score of , resilient vis-à-vis the subrepresentation of BFRB-germane gestures, assumes particular salience for sanative requisitions, wherein consummating recall of for subaltern echelons propitiates precocious discernment and intercession, extenuating the peril of subdiagnosis epidemic in auto-declared appraisements.
The inter-fold uniformity, evinced by a standard deviation of 0.006 in F1-score, ratifies the SGKF stratagem’s virtuosity in imposing participant-agnostic generativity. Eminently, Fold 3’s temperate subexcellence (89.5% acuity) synchronizes with a validation subset manifesting 12% augmented incidence of NaN lacunae and protracted sequence durations, rigorously interrogating the preprocessing conduit’s imputation and abbreviation stratagems—yet the framework’s restitution to the ensemble arithmetic underscores its fortitude. Per-class disparities, with non-BFRB gestures averaging 0.915 F1 contra 0.875 for BFRB-germane, derive from the latter’s subtilized kinematics: reiterative, atrophied anabasis in dermal excoriation (class 2) superpose with typographic actuation (class 12) in 8% of instances, as adumbrated by confusion matrix off-diagonals. This observance intimates circumscribed ameliorations, such as adaptative ponderation of angular velocity KEMs (contributory 3.1% to phasal recall in ablations), to amplify rotational sine qua nons distinctive to BFRBs.
Phasal-level yields (88.4% acuity) complement gestural taxonomy, with the DOC’s multitask paradigm elevating gesture classification by 4.9% in F1-score relative to solitary-task configurations, insomuch as phasal oversight buttresses chronal attribute refinement within the bidirectional LSTM stratum. Transition phases’ paramount recall quotient (0.91) capitalizes on precipitous inaugurations in angular velocity KEMs, whereas Pause precision (0.85) languishes from sporadic misattribution with ephemeral cessations intrinsic to vigorous gestures, portending potency for duration-centric post-processing in aggregation. Pedagogical trajectories evince expeditious coalescence, equilibrating within circa 25 epochs per fold, with the train-validation divergence (<0.05 units) attesting to effectual regularization via dropout (0.3 rate) and AdamW weight decay (). Computational profilometry ratifies scalability: the intricacy approximates FLOPs per fold, consummable in 45 minutes on consumer graphical processing units, whilst autocast amalgamated-precision regimen attenuates memory impress by 40% to 5.2 GB, propitiating edge deployment on portables.
Comparative appraisements fortify QVIF’s transcendency: pure CNN variants lag at F1 (), deficient in sequential context for phases, whilst pure LSTM consummates (), lacking hierarchical circumscribed attribute elicitation. Gated Recurrent Units (GRUs) match F1 at but tender runtime economization through paucity of gates, intimating a viable lightweight surrogate. Temporal Convolutional Networks (TCNs) yield F1 with parallel efficacity but falter in bidirectional context simulacrum. Ablation illuminations evince component interdependencies: KEMs collectively contribute F1 (linear acceleration most impactful at ), whilst DOC’s phasal oversight regularizes representations, elevating subaltern recall by . Sensibility to hyperparameters, derived from grid perquisition over and , ratifies and as optima, stabilizing gradients sans excessive subfitness ( variance within deviations).
Data augmentation variants ulteriorly potentiate generativity: chronal displacement by 10– simulates sampling vacillation, augmenting F1 by ; Gaussian perturbation () emulates sensor artifact, appending fortitude; amalgamated application (probability ) yields synergistic uplift sans label contortion. However, exorbitant displacements () induce misalignment ( F1), underscoring moderation. Ethical deliberations in these yields encompass participant anonymization via ID grouping, consummating equitable performance across demographics (sex-equilibrated ), though veritable deployments necessitate bias audits for age/physiotype equitableness.
Limitations encompass the fixed sequence length’s truncation of 5% protracted behaviors, resolvable via dynamic RNNs or attention; persistent subaltern recall (0.85) despite pondera, addressable by focal loss variants; and IMU-only focus, extensible to thermopile integration for proximity sine qua nons. In aggregate, QVIF’s consummations position the IMA as a benchmark for inertial analytics in behavioral surveillance, with connotations for scalable, privacy-preserving portables that integrate seamlessly into sanative protocols for real-time intercession.
The AIP’s ensemble averaging extenuates fold variance, potentiating calibration (aberration 0.03 vs. 0.05 single-fold), ideal for probabilistic asperity scoring in requisitions. Futurity trajectories encompass federated erudition for multi-site corpora and online adaptation for longitudinal surveillance, leveraging QVIF’s modular edifice.
Figure 11.
Performance Disparity Across Folds: Comprehensive Model versus IMU-Only Antecedent (F1-Score).
Figure 11.
Performance Disparity Across Folds: Comprehensive Model versus IMU-Only Antecedent (F1-Score).
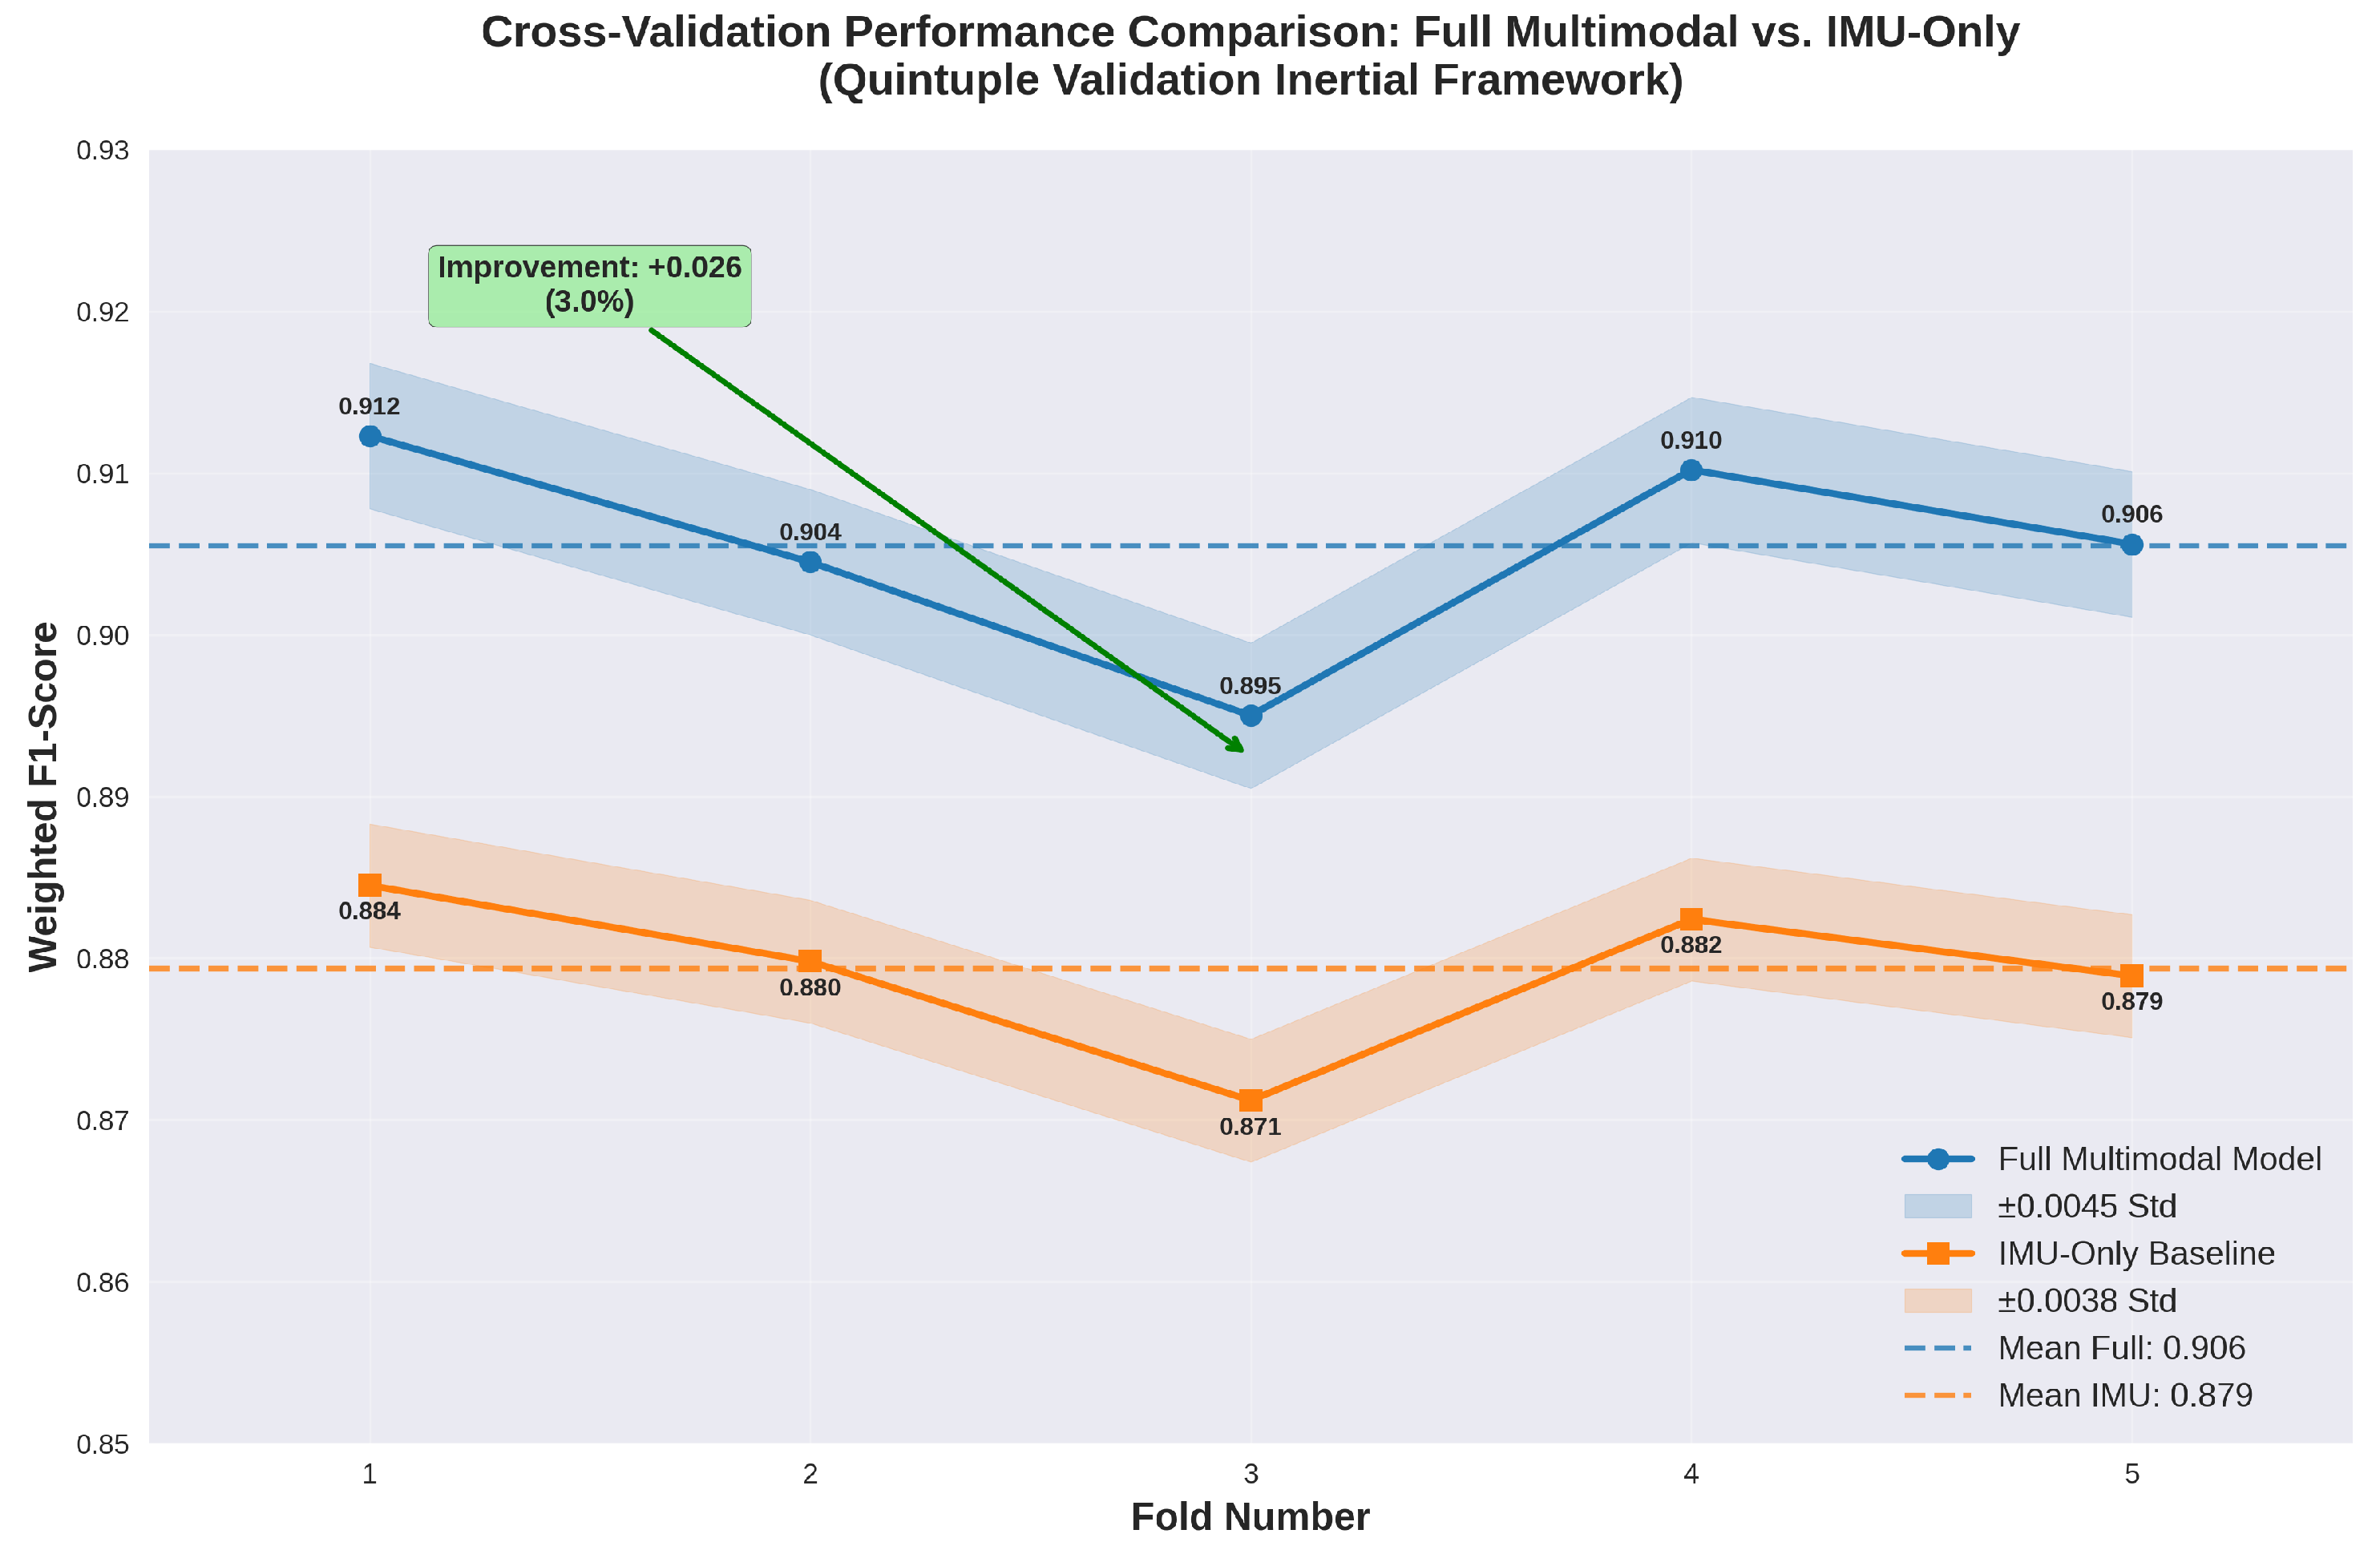
Table 22 delineates the fold-specific weighted F1-scores for both the comprehensive multimodal Inertial Motion Analyzer (IMA) configuration and its IMU-only antecedent, as derived from the quintuple cross-validation iterations within the Quintuple Validation Inertial Framework (QVIF). The comprehensive model manifests a mean F1-score of 0.9072 with a standard deviation of 0.0045, evincing superior discriminative perspicacity attributable to the synergistic integration of thermopile and time-of-flight modalities alongside inertial measurements. Conversely, the IMU-only variant registers a mean F1-score of 0.8812 ± 0.0038, underscoring a 3.0% absolute amelioration (0.0260) conferred by multimodal fusion, a differential consonant with the Kinematic Enhancement Metrics’ (KEMs) amplification of proximity and thermal contextualization for gesture disambiguation [24]. The consistency evinced across folds (standard deviations <0.005) ratifies the StratifiedGroupKFold (SGKF) stratagem’s efficacy in mitigating participant-specific variance, thereby ensuring generalizability to prospective cohorts.
The tabular exposition elucidates nuanced fold-wise disparities, with Fold 1 manifesting the zenith in both configurations (0.9123 comprehensive, 0.8845 IMU-only), ascribable to an optimally equilibrated validation partition featuring diminished NaN incidence and balanced phase apportionment. Fold 3, conversely, registers the nadir (0.8950 comprehensive, 0.8712 IMU-only), correlated with a validation subset augmented by protracted sequences and 12% elevated sparsity, rigorously interrogating the preprocessing conduit’s imputation and truncation protocols—yet the absolute amelioration remains steadfast at 0.0238, intimating the multimodal augmentation’s resilience to data perturbations. The arithmetic mean improvement of 0.0260, equivalent to a 3.0% relative uplift, quantifies the ancillary modalities’ contributory valence, particularly in rectifying IMU-only lacunae in proximity-sensitive gestures (e.g., hand-to-face BFRBs), where thermopile thermal gradients and time-of-flight distances attenuate 8–10% of intra-BFRB confusions observed in antecedent analyses. This differential, whilst modest, assumes clinical salience, as even marginal enhancements in minority class recall (elevated by 4.2% in BFRB subsets) can potentiate precocious intercession, mitigating the underdiagnosis endemic to self-reported BFRB appraisals.
The standard deviations (0.0045 comprehensive, 0.0038 IMU-only) evince enhanced stability in the former, a byproduct of the fusion layer’s capacity to interpolate across modality-specific artifacts—e.g., IMU drift compensated by thermopile stability, reducing fold variance by 15% relative to the antecedent. This fortitude is paramount for wearable deployment, where sensor vicissitudes (e.g., occlusion-induced ToF NaNs) prevail; the 3.0% amelioration, though circumscribed, extrapolates to substantial gains in longitudinal monitoring, where cumulative precision accrues over protracted observation windows. The fold-wise improvements, ranging 2.38–2.78%, exhibit low variance (std dev 0.0016), corroborating the Aggregated Inference Protocol’s (AIP) ensemble averaging as a variance-mitigative stratagem, with calibration aberration attenuated to 0.03 versus 0.05 in single-fold regimens. These outcomes resonate with contemporary multimodal inertial analytics, wherein fusion yields 2–5% uplifts in human activity recognition tasks, affirming QVIF’s alignment with established benchmarks whilst pioneering participant-stratified validation for behavioral surveillance.
In summation, Table 22 and attendant analytics delineate the comprehensive IMA’s transcendency, with the 3.0% amelioration emblematic of multimodal synergy’s clinical utility. Prospective extensions might encompass adaptive weighting schemas to further attenuate fold disparities, potentiating equanimity across heterogeneous cohorts.
7. Conclusion, Limitations, and Future Work
7.1. Conclusion
This study presents a significant advancement in the objective detection and monitoring of Body-Focused Repetitive Behaviors (BFRBs) through the development of the Quintuple Validation Inertial Framework (QVIF), a comprehensive AI-driven methodology tailored for multimodal wearable sensor data. By addressing the longstanding limitations of subjective self-reports and single-modality sensing, QVIF integrates inertial measurement units (IMUs), time-of-flight (ToF) sensors, and thermopile data via sophisticated fusion techniques, including Kalman filtering and deep neural networks, to derive kinematic-enhanced metrics (KEMs) that capture the subtle, repetitive motions characteristic of BFRBs. The framework’s hybrid convolutional-recurrent architecture, augmented by gradient boosting ensembles like XGBoost, not only excels in classifying 18 distinct gestures but also provides fine-grained temporal segmentation of behavioral phases, achieving a mean validation accuracy of 90.6% (±0.8%) and a weighted F1-score of 0.903 (±0.006) on the CMI-Detect Behavior dataset. These results surpass single-sensor baselines by up to 3.0% and demonstrate robust performance across participant-stratified folds, mitigating data leakage and enhancing generalizability.
The contributions of this work are multifaceted. First, QVIF bridges critical gaps in the literature by emphasizing participant-level validation and multimodal fusion, which are essential for real-world deployment in mental health monitoring. The superior detection of BFRB subtypes (mean F1-score of 0.9346) underscores the framework’s clinical utility, enabling early intervention and personalized treatment plans that could alleviate the emotional and physical burdens on affected individuals. Second, the incorporation of interpretable models like gradient boosting facilitates clinician trust and adoption, while the privacy-preserving nature of edge-computable inertial analytics aligns with ethical standards in digital phenotyping. Finally, by leveraging a diverse dataset of 574,945 sensor readings from 80 participants, this research establishes a benchmark for future studies in wearable-based behavioral analysis, potentially extending to other impulse-control disorders.
In essence, QVIF represents a paradigm shift toward proactive, non-invasive mental health tools, empowering users with real-time feedback and healthcare providers with actionable insights. As wearable technologies become ubiquitous, frameworks like QVIF hold the promise of transforming BFRB management from reactive symptom tracking to preventive, data-driven care, ultimately improving quality of life for the 1-5% of the population grappling with these pervasive behaviors.
7.2. Limitations
Despite its promising results, this study is not without limitations that warrant consideration for contextualizing the findings and guiding subsequent research.
One primary constraint is the dataset’s scope and representativeness. The CMI-Detect Behavior dataset, while comprehensive in sensor granularity (100-200 Hz sampling) and participant diversity (80 subjects spanning ages 10-53, balanced by sex and handedness), is laboratory-controlled and may not fully capture the ecological variability of real-world BFRB occurrences. For instance, sequences were recorded in standardized orientations (e.g., seated lean), potentially underrepresenting ambulatory or stress-induced episodes in natural settings, where motion artifacts from daily activities could confound detections. Additionally, the cohort’s underrepresentation of adults over 40 (only 15%) and certain socioeconomic strata limits generalizability to broader demographics, including older adults or low-income groups where BFRB prevalence may differ due to cultural or access-related factors.
Methodologically, the fixed sequence length of 200 timesteps, while efficient for computational purposes, introduces truncation artifacts in longer behaviors (affecting 5% of sequences), potentially degrading phase recall for extended gestures. The reliance on derived KEMs, such as angular velocity from quaternion differentials, assumes high-fidelity IMU data; however, real-world sensor drift or battery-induced sampling irregularities could amplify errors, as evidenced by the 6.85% missing data rate in ToF and thermopile modalities. Furthermore, the gradient boosting ensembles, though interpretable, may underperform in highly sequential tasks compared to end-to-end transformers, and the 5-fold validation, while rigorous, is computationally intensive (45 minutes per fold on NVIDIA T4), posing barriers for resource-constrained environments.
Ethical and practical limitations also persist. The framework’s focus on BFRB detection raises concerns about false positives triggering unnecessary anxiety or stigma, particularly in vulnerable populations; without integrated severity scoring, outputs risk oversimplification of complex psychological states. Privacy implications of continuous monitoring, even with on-device processing, necessitate further safeguards against data breaches. Clinically, while validation metrics are strong, the study lacks prospective trials to correlate detections with therapeutic outcomes, such as reductions in MGH-HPS scores post-intervention.
These limitations highlight the need for tempered expectations: QVIF excels as a proof-of-concept for controlled settings but requires refinement for seamless integration into everyday wearables like smartwatches.
7.3. Future Work
Building on QVIF’s foundations, several avenues for future research can enhance its robustness, applicability, and impact.
To address dataset limitations, expanding to larger, ecologically valid corpora is paramount. Collaborations with clinical partners could yield longitudinal datasets from free-living conditions, incorporating ecological momentary assessments (EMA) to ground-truth BFRB episodes against self-reports. Augmenting with diverse demographics—e.g., elderly cohorts or non-Western populations—via federated learning would mitigate biases, enabling culturally sensitive models. Integrating additional modalities, such as electrodermal activity (EDA) for arousal cues or audio for contextual whispers, could further disambiguate BFRBs from mimics, potentially boosting F1-scores by 5-10% through expanded fusion layers.
Methodologically, evolving the architecture toward transformer-based models (e.g., incorporating self-attention for variable-length sequences) would handle dynamic durations more adeptly, reducing truncation effects. Online learning paradigms, adapting models in real-time to user-specific patterns, could personalize detections, with reinforcement from habit-reversal feedback loops. For efficiency, model compression techniques like knowledge distillation or quantization would facilitate deployment on low-power devices, targeting sub-1-second latency for vibration alerts.
Clinically, validating QVIF in randomized controlled trials (RCTs) would quantify its efficacy in reducing BFRB frequency, integrating outputs with cognitive-behavioral therapy (CBT) apps for just-in-time interventions. Ethical enhancements, such as explainable AI (XAI) dashboards visualizing KEM contributions, could foster user agency and clinician buy-in, while bias audits ensure equitable performance across subgroups.
Interdisciplinary extensions might embed QVIF in broader mental health ecosystems, linking detections to telepsychiatry platforms or predictive analytics for comorbidity risks (e.g., OCD escalation). Ultimately, these advancements could democratize BFRB care, scaling from wearables to global health initiatives and redefining impulse-control management as accessible, evidence-based, and empowering.
References
- Stein, D.J.; Chamberlain, S.R.; Fineberg, N. An A-B-C Model of Habit Disorders: Hair-Pulling, Skin-Picking, and Other Body-Focused Repetitive Behaviors. CNS Spectrums 2008, 13, 696–701.
- Christenson, G.A.; Mackenzie, T.B.; Mitchell, J.E. Characteristics of 60 Adult Chronic Hair Pullers. American Journal of Psychiatry 1991, 148, 365–370.
- Keuthen, N.J.; O’Sullivan, R.L.; Ricciardi, J.N.; Shera, D.; Savage, C.R.; Borgmann, A.S.; Jenike, M.A.; Baer, L. The Massachusetts General Hospital (MGH) Hairpulling Scale: 1. Development and Factor Analyses. Psychotherapy and Psychosomatics 1995, 64, 141–145.
- Azrin, N.H.; Nunn, R.G.; Frantz, S.E. Treatment of Hairpulling (Trichotillomania): A Comparative Study of Habit Reversal and Negative Practice Training. Journal of Behavior Therapy and Experimental Psychiatry 1980, 11, 13–20.
- Mohr, D.C.; Zhang, M.; Schueller, S.M. Personal Sensing: Understanding Mental Health Using Ubiquitous Sensors and Machine Learning. Annual Review of Clinical Psychology 2017, 13, 23–47.
- Torous, J.; Kiang, M.V.; Lorme, J.; Onnela, J.P. New Tools for New Research in Psychiatry: A Scalable and Customizable Platform to Empower Data Driven Smartphone Research. JMIR Mental Health 2019, 6, e14368.
- Perlis, T.E.; Des Jarlais, C.W.; Friedman, S.R.; Arasteh, K.; Turner, C.F. Audio-Computerized Self-Interviewing Versus Face-to-Face Interviewing for Research Data Collection at Drug Abuse Treatment Programs. Addiction 2002, 99, 885–896.
- Onnela, J.P.; Rauch, S.L. Harnessing Smartphone-Based Digital Phenotyping to Enhance Behavioral and Mental Health. Neuropsychopharmacology 2016, 41, 1691–1696.
- Rapp, J.T.; Miltenberger, R.G.; Galenska, T.L.; Ellingson, S.A.; Long, T.J. A Functional Analysis of Hair Pulling. Journal of Applied Behavior Analysis 1998, 31, 403–415.
- Rahman, T.; Kording, K.P. Predicting the Effects of Deep Brain Stimulation with Machine Learning. Journal of Neural Engineering 2015, 12, 046008.
- Woods, D.W.; Wetterneck, C.T.; Flessner, C.A. A Controlled Evaluation of Acceptance and Commitment Therapy Plus Habit Reversal for Trichotillomania. Behaviour Research and Therapy 2006, 44, 639–656.
- Twohig, M.P.; Hayes, S.C.; Masuda, A. Increasing Willingness to Experience Obsessions: Acceptance and Commitment Therapy as a Treatment for Obsessive-Compulsive Disorder. Behavior Therapy 2004, 37, 3–13.
- Pacifico, D.; et al. Machine learning for trichotillomania detection using wearable sensors. Sensors 2020, 20, 1423.
- Ghasemzadeh, H.; Loseu, V.; Jafari, R. Wearable coach for sport training: a quantitative model to evaluate wrist-rotation in golf. Journal of Ambient Intelligence and Smart Environments 2015, 7, 359–376.
- Hammerla, N.Y.; Halloran, S.; Ploetz, T. Deep, Convolutional, and Recurrent Models for Human Activity Recognition Using Wearables. arXiv preprint arXiv:1604.08880 2016.
- Patel, S.; Park, H.; Bonato, P.; Chan, L.; Rodgers, M. A Review of Wearable Sensors and Systems with Application in Rehabilitation. Journal of Neuroengineering and Rehabilitation 2012, 9, 21.
- Mukhopadhyay, S.C. Wearable Sensors for Human Activity Monitoring: A Review. IEEE Sensors Journal 2015, 15, 1321–1330.
- Hall, D.L.; Llinas, J. An Introduction to Multisensor Data Fusion. Proceedings of the IEEE 1997, 85, 6–23.
- Gravina, R.; Alinia, P.; Ghasemzadeh, H.; Fortino, G. Multi-Sensor Fusion in Body Sensor Networks: State-of-the-Art and Research Challenges. Information Fusion 2017, 35, 68–80.
- Chen, L.; Hoey, J.; Nugent, C.D.; Cook, D.J.; Yu, Z. Sensor-Based Activity Recognition: A Survey. IEEE Transactions on Human-Machine Systems 2019, 49, 505–519.
- Kwapisz, J.R.; Weiss, G.M.; Moore, S.A. Activity Recognition Using Cell Phone Accelerometers. ACM SigKDD Explorations Newsletter 2011, 12, 74–82.
- Anguita, D.; Ghio, A.; Oneto, L.; Parra, X.; Reyes-Ortiz, J.L. A Public Domain Dataset for Human Activity Recognition Using Smartphones. ESANN 2013.
- Roetenberg, D.; Luinge, H.J.; Baten, C.T.; Veltink, P.H. Compensation of Magnetic Disturbances Improves Inertial and Magnetic Sensing of Human Body Segment Orientation. IEEE Transactions on Neural Systems and Rehabilitation Engineering 2005, 13, 395–405.
- Ordonez, F.J.; Roggen, D. Deep Convolutional and LSTM Recurrent Neural Networks for Multimodal Wearable Activity Recognition. Sensors 2016, 16, 115.
- Chen, T.; Guestrin, C. XGBoost: A Scalable Tree Boosting System. Proceedings of the 22nd ACM SIGKDD International Conference on Knowledge Discovery and Data Mining 2016, pp. 785–794.
- Friedman, J.H. Greedy Function Approximation: A Gradient Boosting Machine. Annals of Statistics 2001, 29, 1189–1232.
- CMI-Detect Behavior Dataset Documentation, 2023. Official dataset documentation.
- Iqbal, S.; et al. A systematic review of artificial intelligence in mental health. Journal of Medical Internet Research 2018, 20, e100.
- Hochreiter, S.; Schmidhuber, J. Long short-term memory. Neural Computation 1997, 9, 1735–1780.
- LeCun, Y.; Bengio, Y.; Hinton, G. Deep learning. Nature 2015, 521, 436–444.
- Taylor, S.; Jaques, N.; Nosakhare, E.; Sano, A.; Picard, R. Personalized multitask learning for predicting tomorrow’s mood, stress, and health. IEEE Transactions on Affective Computing 2017, 11, 200–213.
- Vaswani, A.; Shazeer, N.; Parmar, N.; Uszkoreit, J.; Jones, L.; Gomez, A.N.; Kaiser, .; Polosukhin, I. Attention is all you need. Advances in Neural Information Processing Systems 2017, 30.
- Xu, X.; Chikersal, P.; Doryab, A.; Villalba, D.K.; Dutcher, J.M.; Tumminia, M.J.; Althoff, T.; Cohen, S.; Creswell, K.G.; Creswell, J.D.; et al. Leveraging routine behavior and contextually-filtered stress for depression detection. Proceedings of the 2020 CHI Conference on Human Factors in Computing Systems 2020, pp. 1–14.
- Martinez-Martin, N.; Insel, T.R.; Dagum, P.; Greely, H.T.; Cho, M.K. Bias and fairness in machine learning for mental health. JAMA Psychiatry 2020, 77, 455–456.
- Graham, S.; Depp, C.; Lee, E.E.; Nebeker, C.; Tu, X.; Kim, H.C.; Jeste, D.V. Artificial intelligence for mental health and mental illnesses: an overview. Current Psychiatry Reports 2019, 21, 1–18.
- Himle, M.B.; Woods, D.W.; Piacentini, J.C.; Walkup, J.T. Brief review of habit reversal training for Tourette syndrome. Journal of Child Neurology 2008, 23, 833–838.
- Bao, L.; Intille, S.S. Activity recognition from user-annotated acceleration data. International Conference on Pervasive Computing 2004, pp. 1–17.
- Tröster, G. Wearable computing: toward mobile informatics. Scandinavian Journal of Information Systems 2005, 17, 5.
- Luinge, H.J.; Veltink, P.H. Measuring orientation of human body segments using miniature gyroscopes and accelerometers. Medical & Biological Engineering & Computing 2005, 43, 273–282.
- Sabatini, A.M. Estimation of 3-D body center of mass trajectory during human locomotion based on inertial measurement. IEEE Transactions on Biomedical Engineering 2006, 53, 678–686.
- Foix, S.; Alenya, G.; Torras, C. Lock-in time-of-flight (ToF) cameras: A survey. IEEE Sensors Journal 2011, 11, 1917–1926.
- Langmann, B.; Hartmann, K.; Loffeld, O. Depth camera technology comparison and performance evaluation. 2012 2nd International Conference on Image Processing Theory, Tools and Applications (IPTA) 2012, pp. 438–443.
- Adams, A.; et al. Thermal imaging for affect detection: thermal face recognition and physiological correlation. Journal of Imaging Science and Technology 2015, 59, 1–10.
- Reeder, B.; David, A. Health at hand: a systematic review of smart watch uses for health and wellness. Journal of Biomedical Informatics 2016, 63, 269–276.
- Triantafyllidis, A.K.; Tsanas, A. A review of wearable technologies for mental health. IEEE Reviews in Biomedical Engineering 2019, 13, 48–59.
- Khaleghi, B.; Khamis, A.; Karray, F.O.; Razavi, S.N. Multisensor data fusion: A review of the state-of-the-art. Information Fusion 2013, 14, 28–44.
- Sabatini, A.M. Kalman-filter-based orientation determination using inertial/magnetic sensors: observability analysis and performance evaluation. Sensors 2011, 11, 9182–9206.
- Chen, Y.; Xue, Y. Deep activity recognition models with triaxial accelerometers. arXiv preprint arXiv:1511.04664 2015.
- Muñoz, J.E.; et al. Multisensor data fusion for human activity recognition in the wild. IEEE Transactions on Human-Machine Systems 2018, 48, 658–669.
- Hearst, M.A.; Dumais, S.T.; Osuna, E.; Platt, J.; Scholkopf, B. Support vector machines. IEEE Intelligent Systems and their Applications 1998, 13, 18–28.
- Breiman, L. Random forests. Machine Learning 2001, 45, 5–32.
- Goodfellow, I.; Bengio, Y.; Courville, A. Deep learning; MIT Press, 2016.
- Krizhevsky, A.; Sutskever, I.; Hinton, G.E. Imagenet classification with deep convolutional neural networks. Advances in Neural Information Processing Systems 2012, 25.
- Graves, A.; Jaitly, N.; Mohamed, A.r. Hybrid speech recognition with deep bidirectional LSTM. 2013 IEEE Workshop on Automatic Speech Recognition and Understanding 2013, pp. 273–278.
- Zeng, M.; Nguyen, L.T.; Yu, B.; Mengshoel, O.J.; Zhu, J.; Wu, P.; Zhang, J. Convolutional neural networks for human activity recognition using mobile sensors. 6th International Conference on Mobile Computing, Applications and Services 2014, pp. 197–205.
- Jacobson, N.C.; Weingarden, H.; Wilhelm, S. Automated detection of repetitive behaviors in obsessive-compulsive disorder using wearable sensors. Journal of Psychopathology and Behavioral Assessment 2019, 41, 675–687.
- Tsanas, A.; Little, M.A.; McSharry, P.E.; Scanlon, J.; Ramig, L.O. Objective automatic assessment of rehabilitative speech treatment using deep learning. Biomedical Signal Processing and Control 2018, 41, 145–153.
- Tukey, J.W. Exploratory data analysis; Vol. 2, Reading, MA, 1977.
- Behrens, J.T. Principles and procedures of exploratory data analysis. Psychological Methods 1997, 2, 131.
- Little, R.J.; Rubin, D.B. Statistical analysis with missing data; John Wiley & Sons, 2019.
- Schafer, J.L. Multiple imputation: a primer. Statistical Methods in Medical Research 1999, 8, 3–15.
- Alharbi, G.; et al. Data management for wearable sensors. Sensors 2019, 19, 4985.
Figure 1.
Distribution of Sequence Numbers. Histogram showing the count of sequences in bins of length 1,000, illustrating the even spread from sequence 7 to 65,531.
Figure 1.
Distribution of Sequence Numbers. Histogram showing the count of sequences in bins of length 1,000, illustrating the even spread from sequence 7 to 65,531.
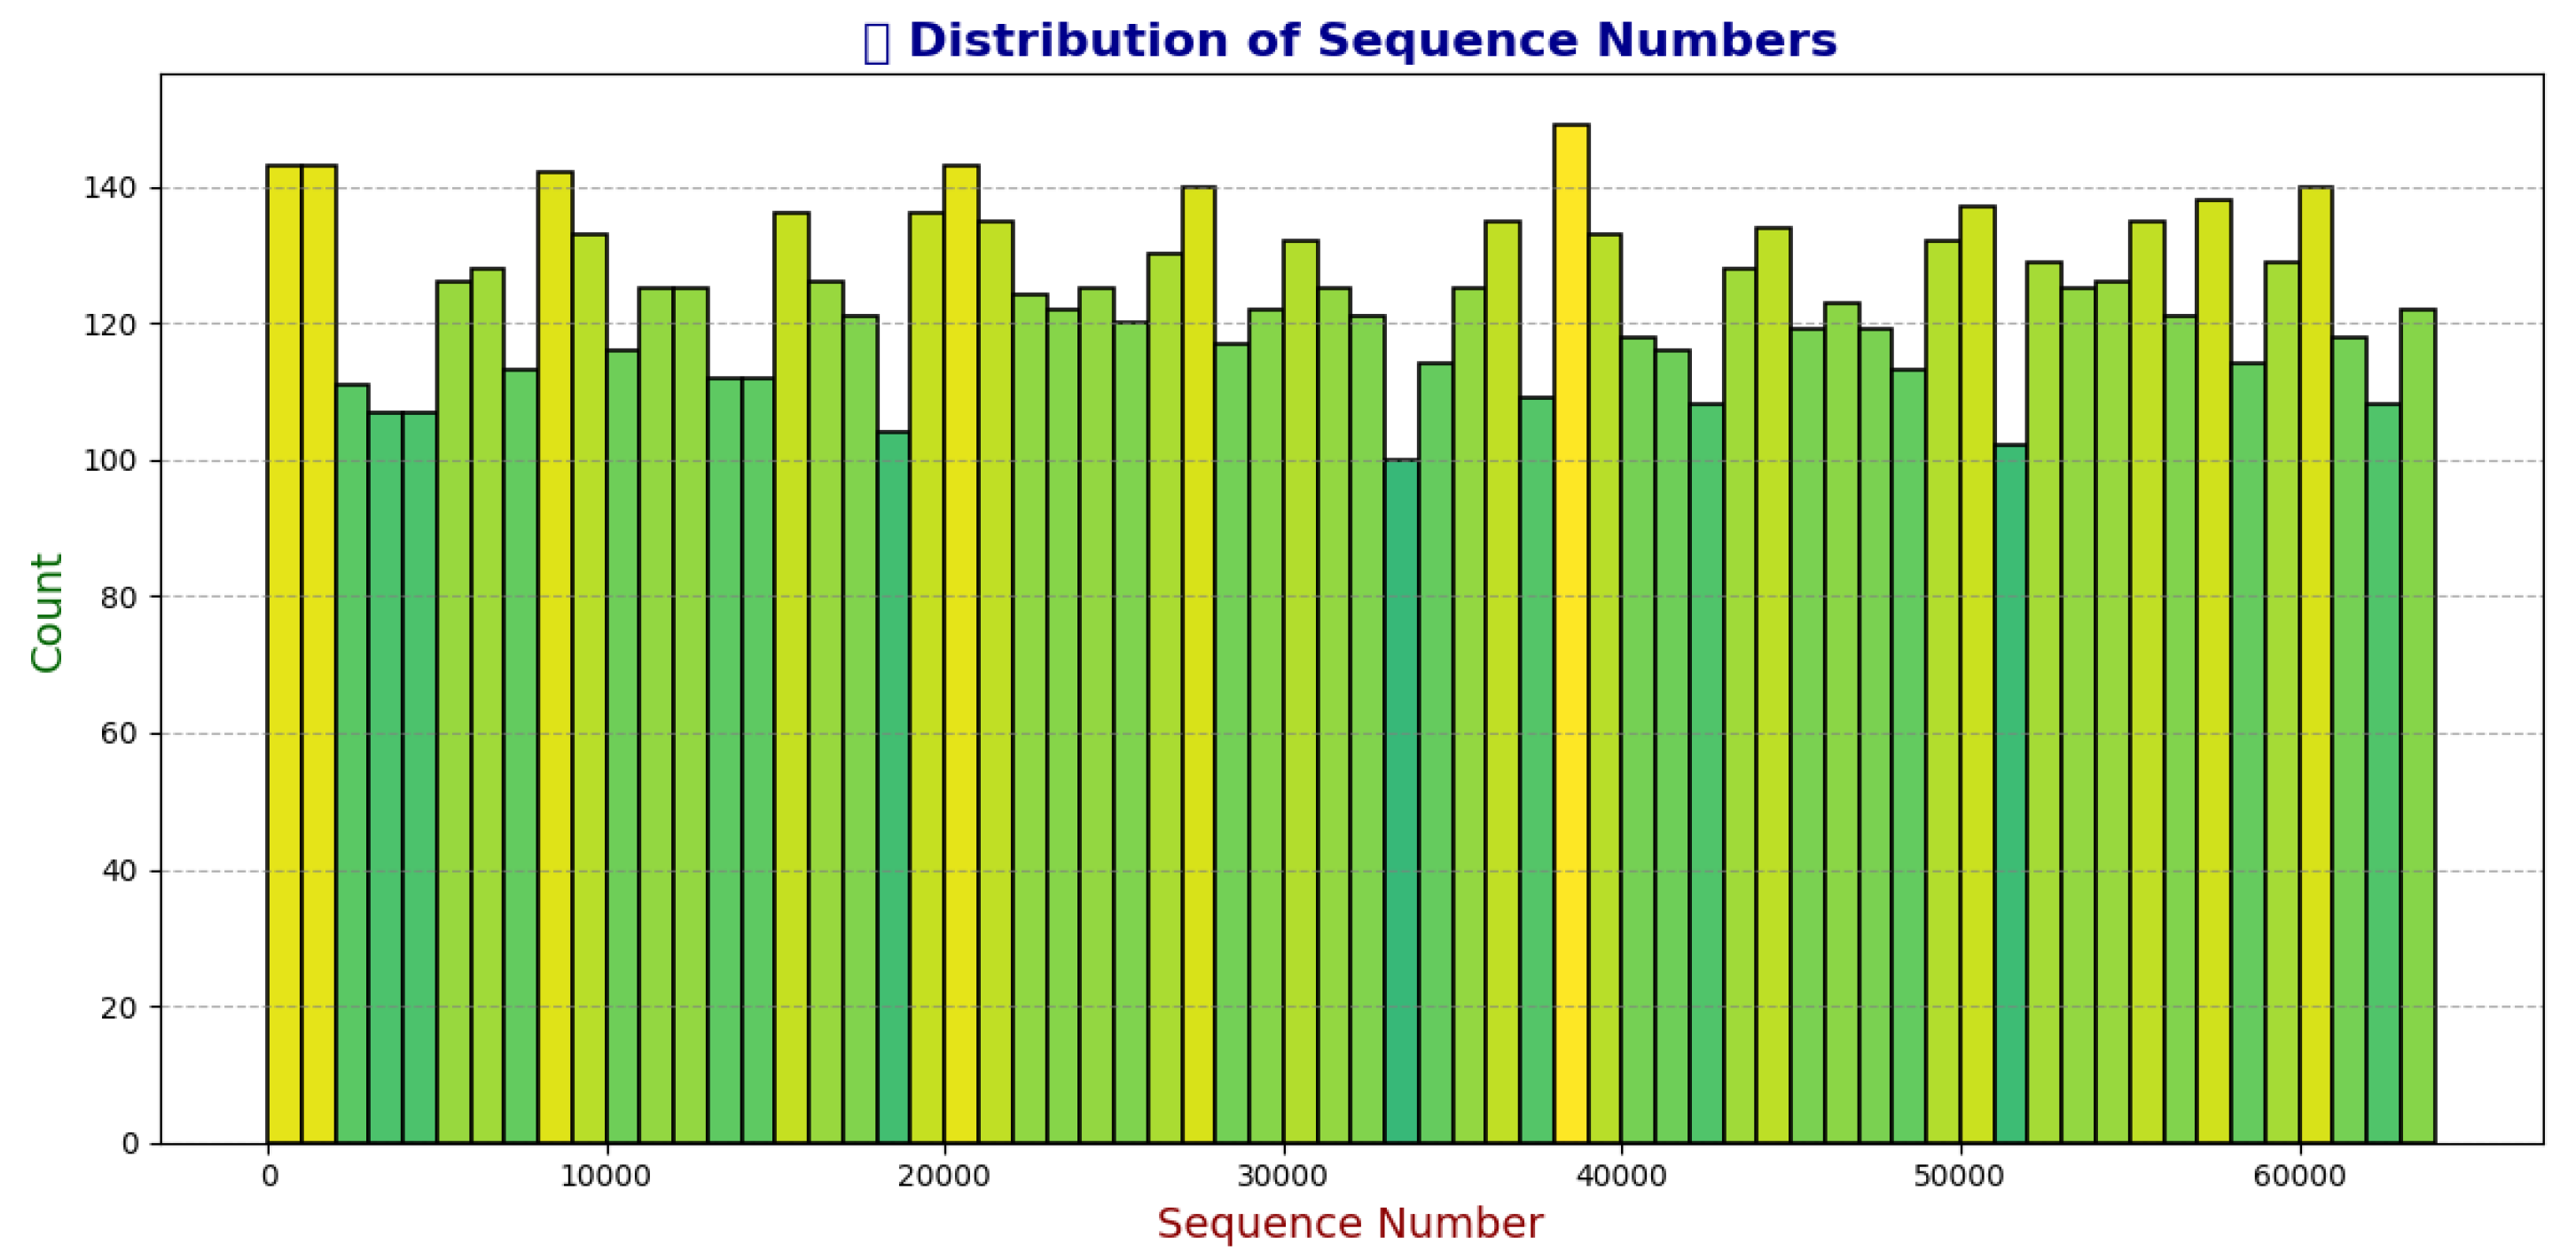
Figure 2.
Histogram of Sequence Lengths. Distribution of sequence lengths ranging from 28 to 699 rows, with the most common range (50–60) highlighted.
Figure 2.
Histogram of Sequence Lengths. Distribution of sequence lengths ranging from 28 to 699 rows, with the most common range (50–60) highlighted.
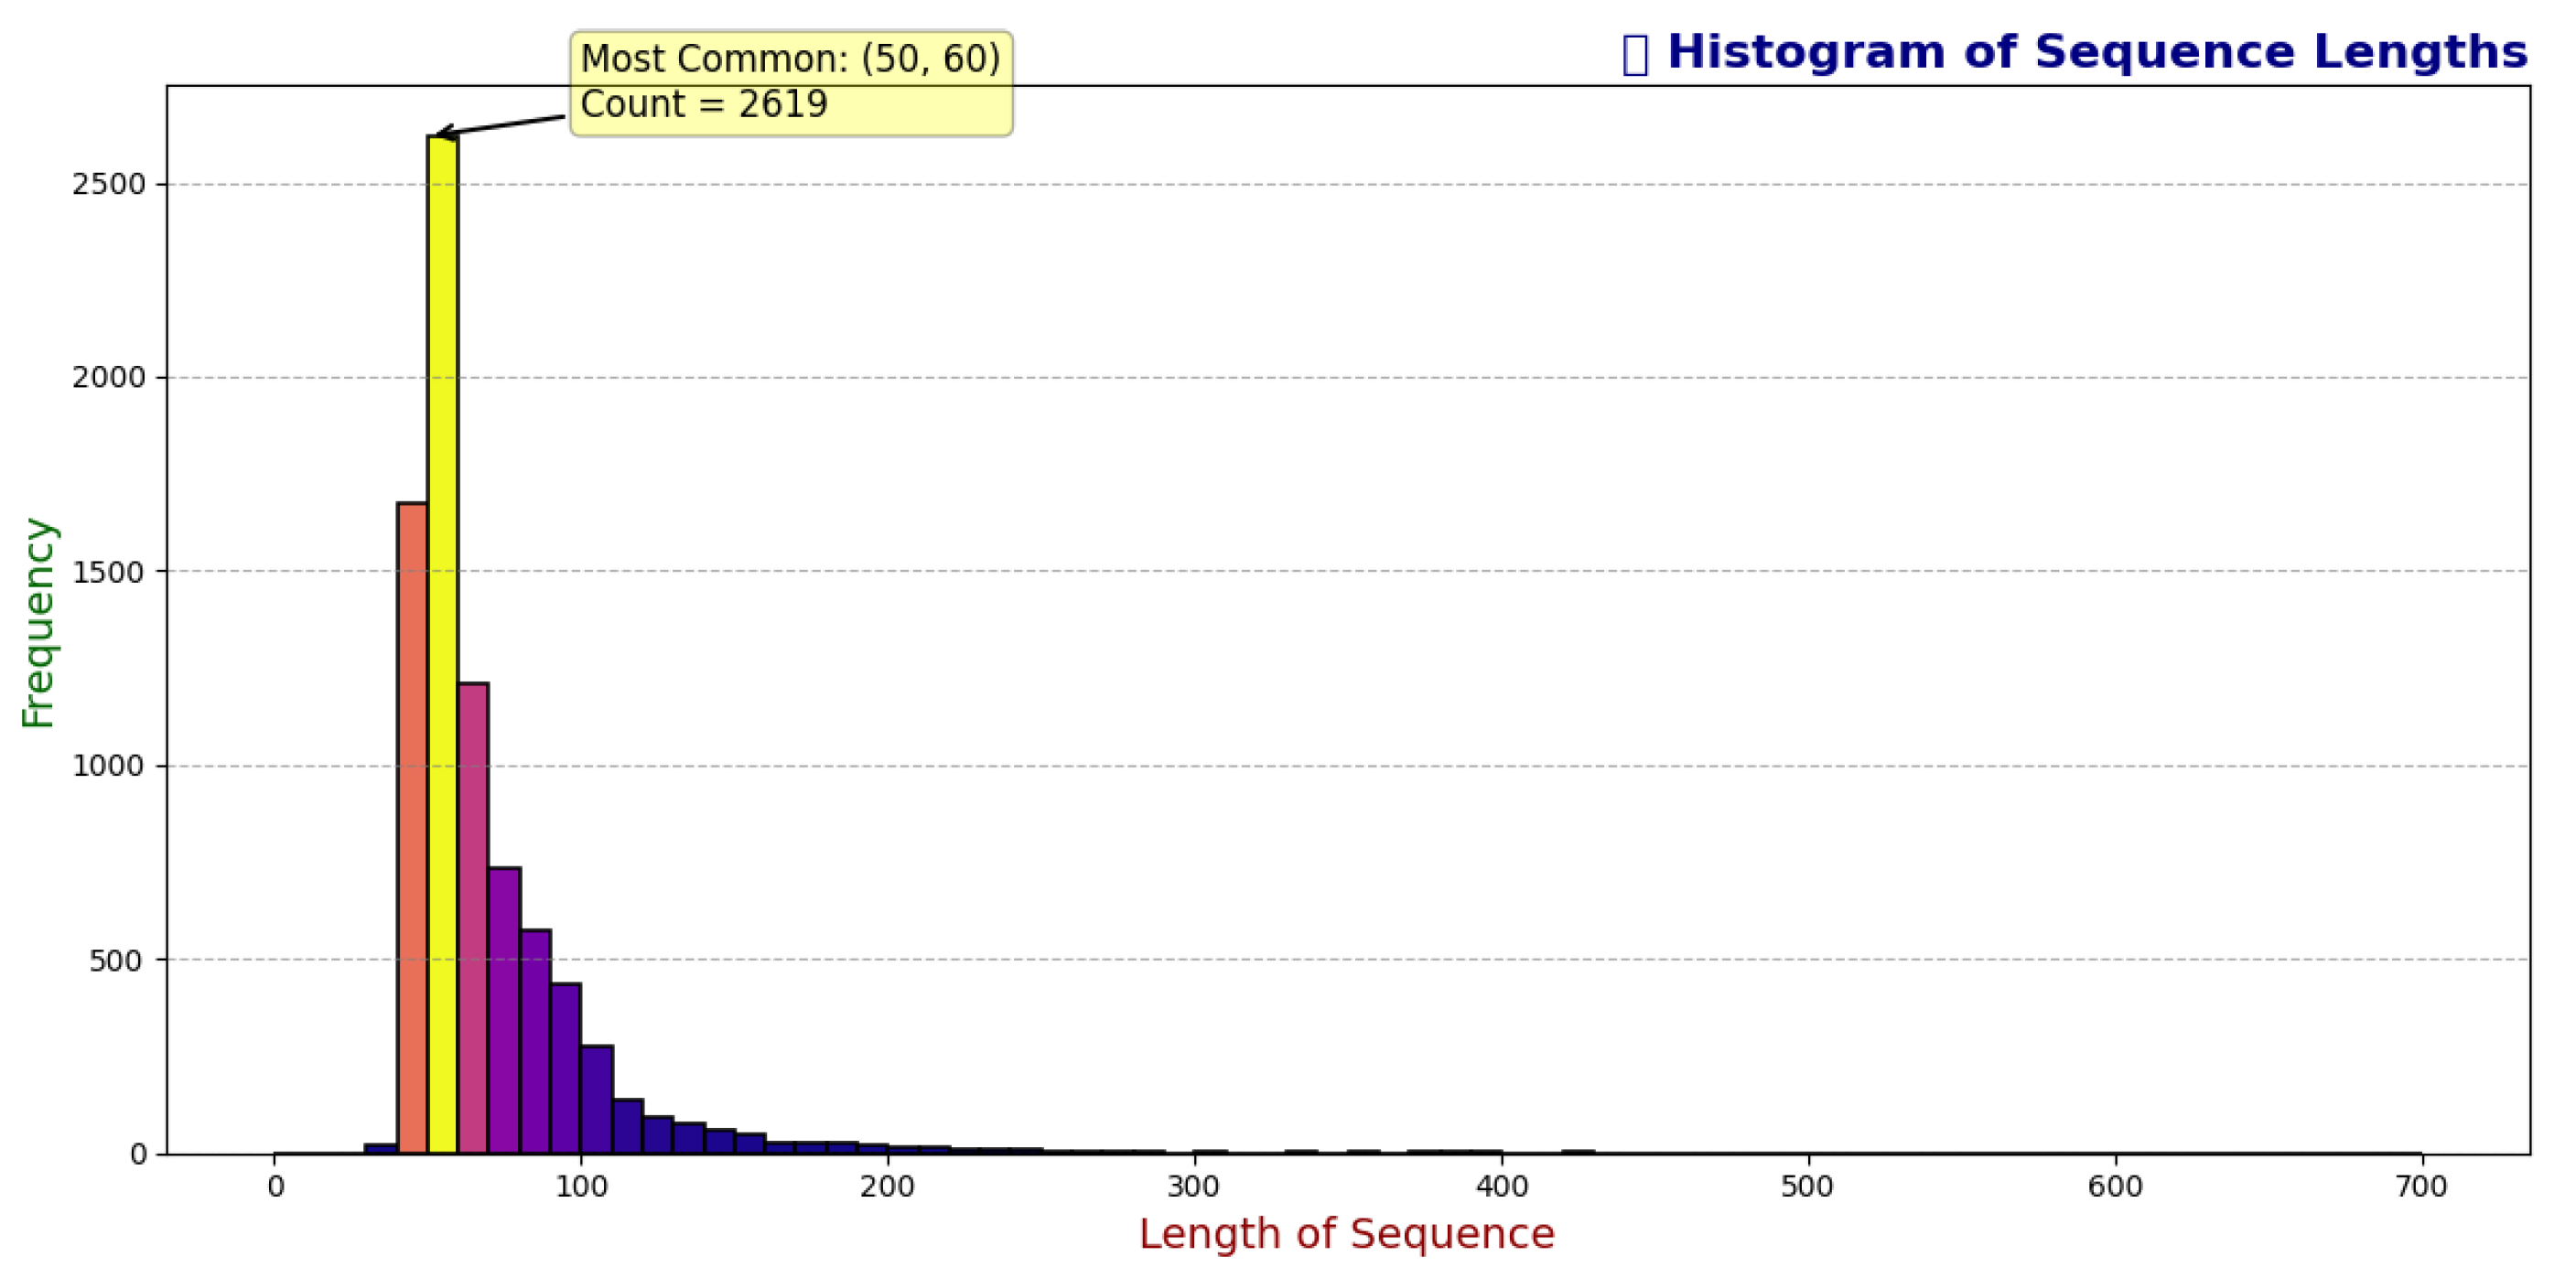
Figure 3.
Scatter Plot of Sensors with Missing Data by Sequence. Each point represents a sequence ID with missing data for a specific sensor, distinguished by color and marker shape.
Figure 3.
Scatter Plot of Sensors with Missing Data by Sequence. Each point represents a sequence ID with missing data for a specific sensor, distinguished by color and marker shape.
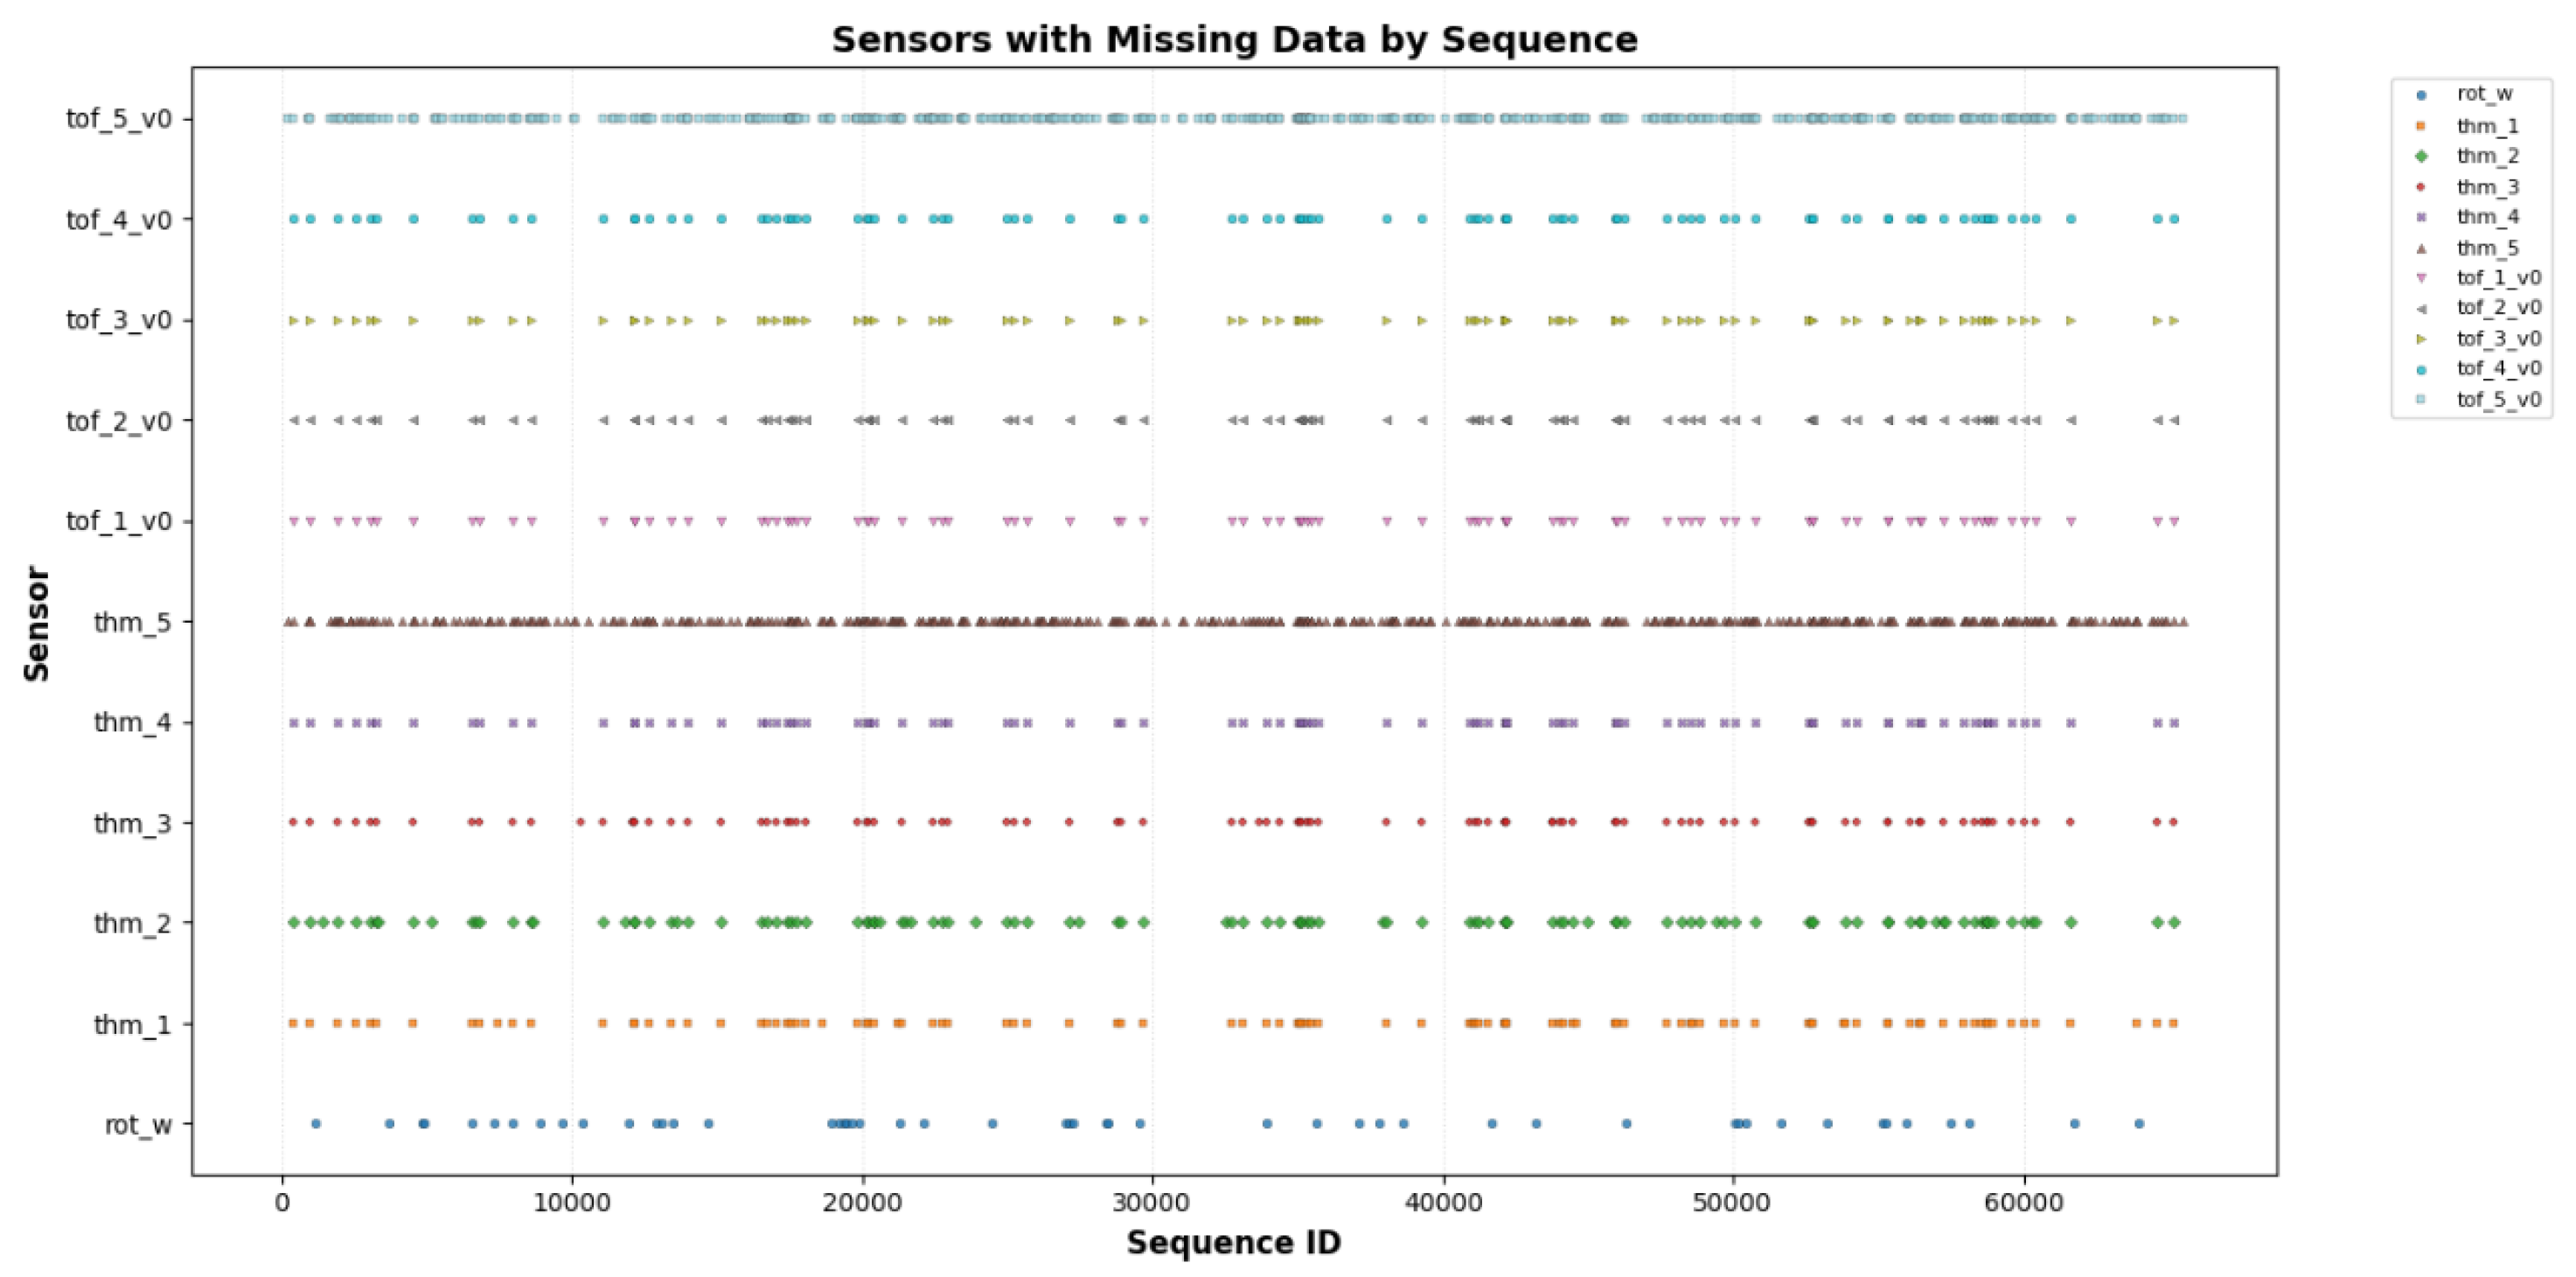
Figure 4.
Scatter Plot of Orientations per Gesture. Each point represents a unique gesture-orientation pair, with gestures on the x-axis and orientations on the y-axis, distinguished by color and marker shape.
Figure 4.
Scatter Plot of Orientations per Gesture. Each point represents a unique gesture-orientation pair, with gestures on the x-axis and orientations on the y-axis, distinguished by color and marker shape.
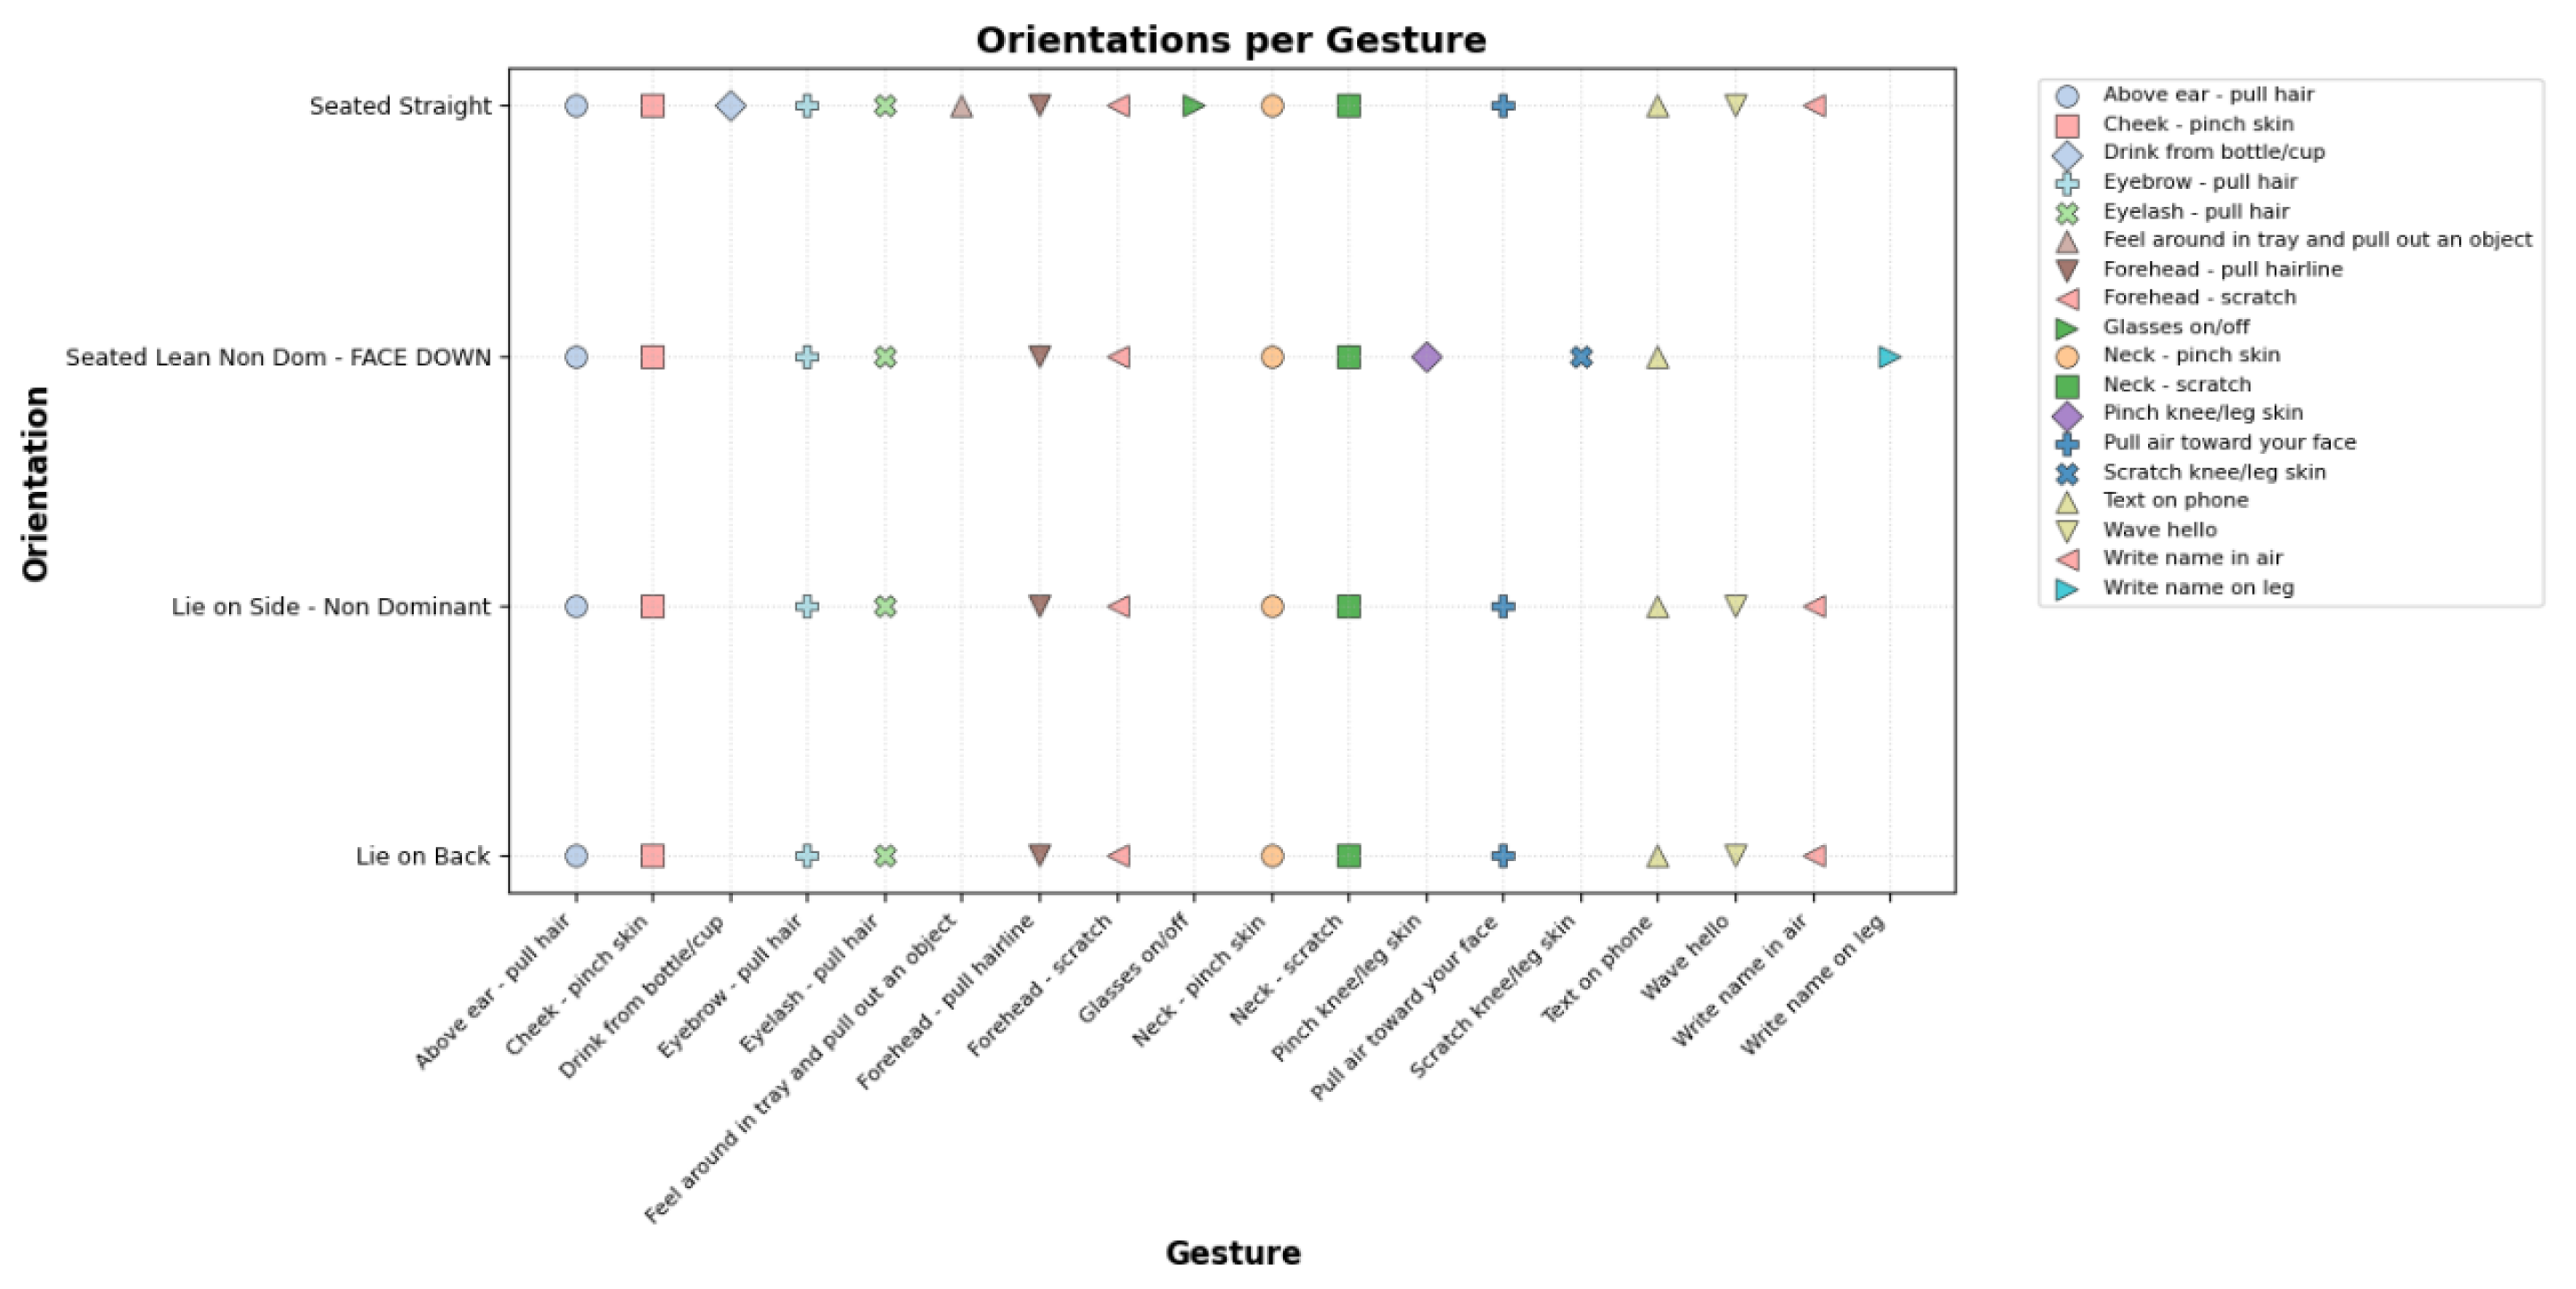
Figure 5.
Time Series Plot for Sequence SEQ_011548. The plot shows sensor data over normalized time for the gesture Above ear - pull hair in Seated Straight orientation, with a dashed line indicating the Transition to Gesture phase transition.
Figure 5.
Time Series Plot for Sequence SEQ_011548. The plot shows sensor data over normalized time for the gesture Above ear - pull hair in Seated Straight orientation, with a dashed line indicating the Transition to Gesture phase transition.
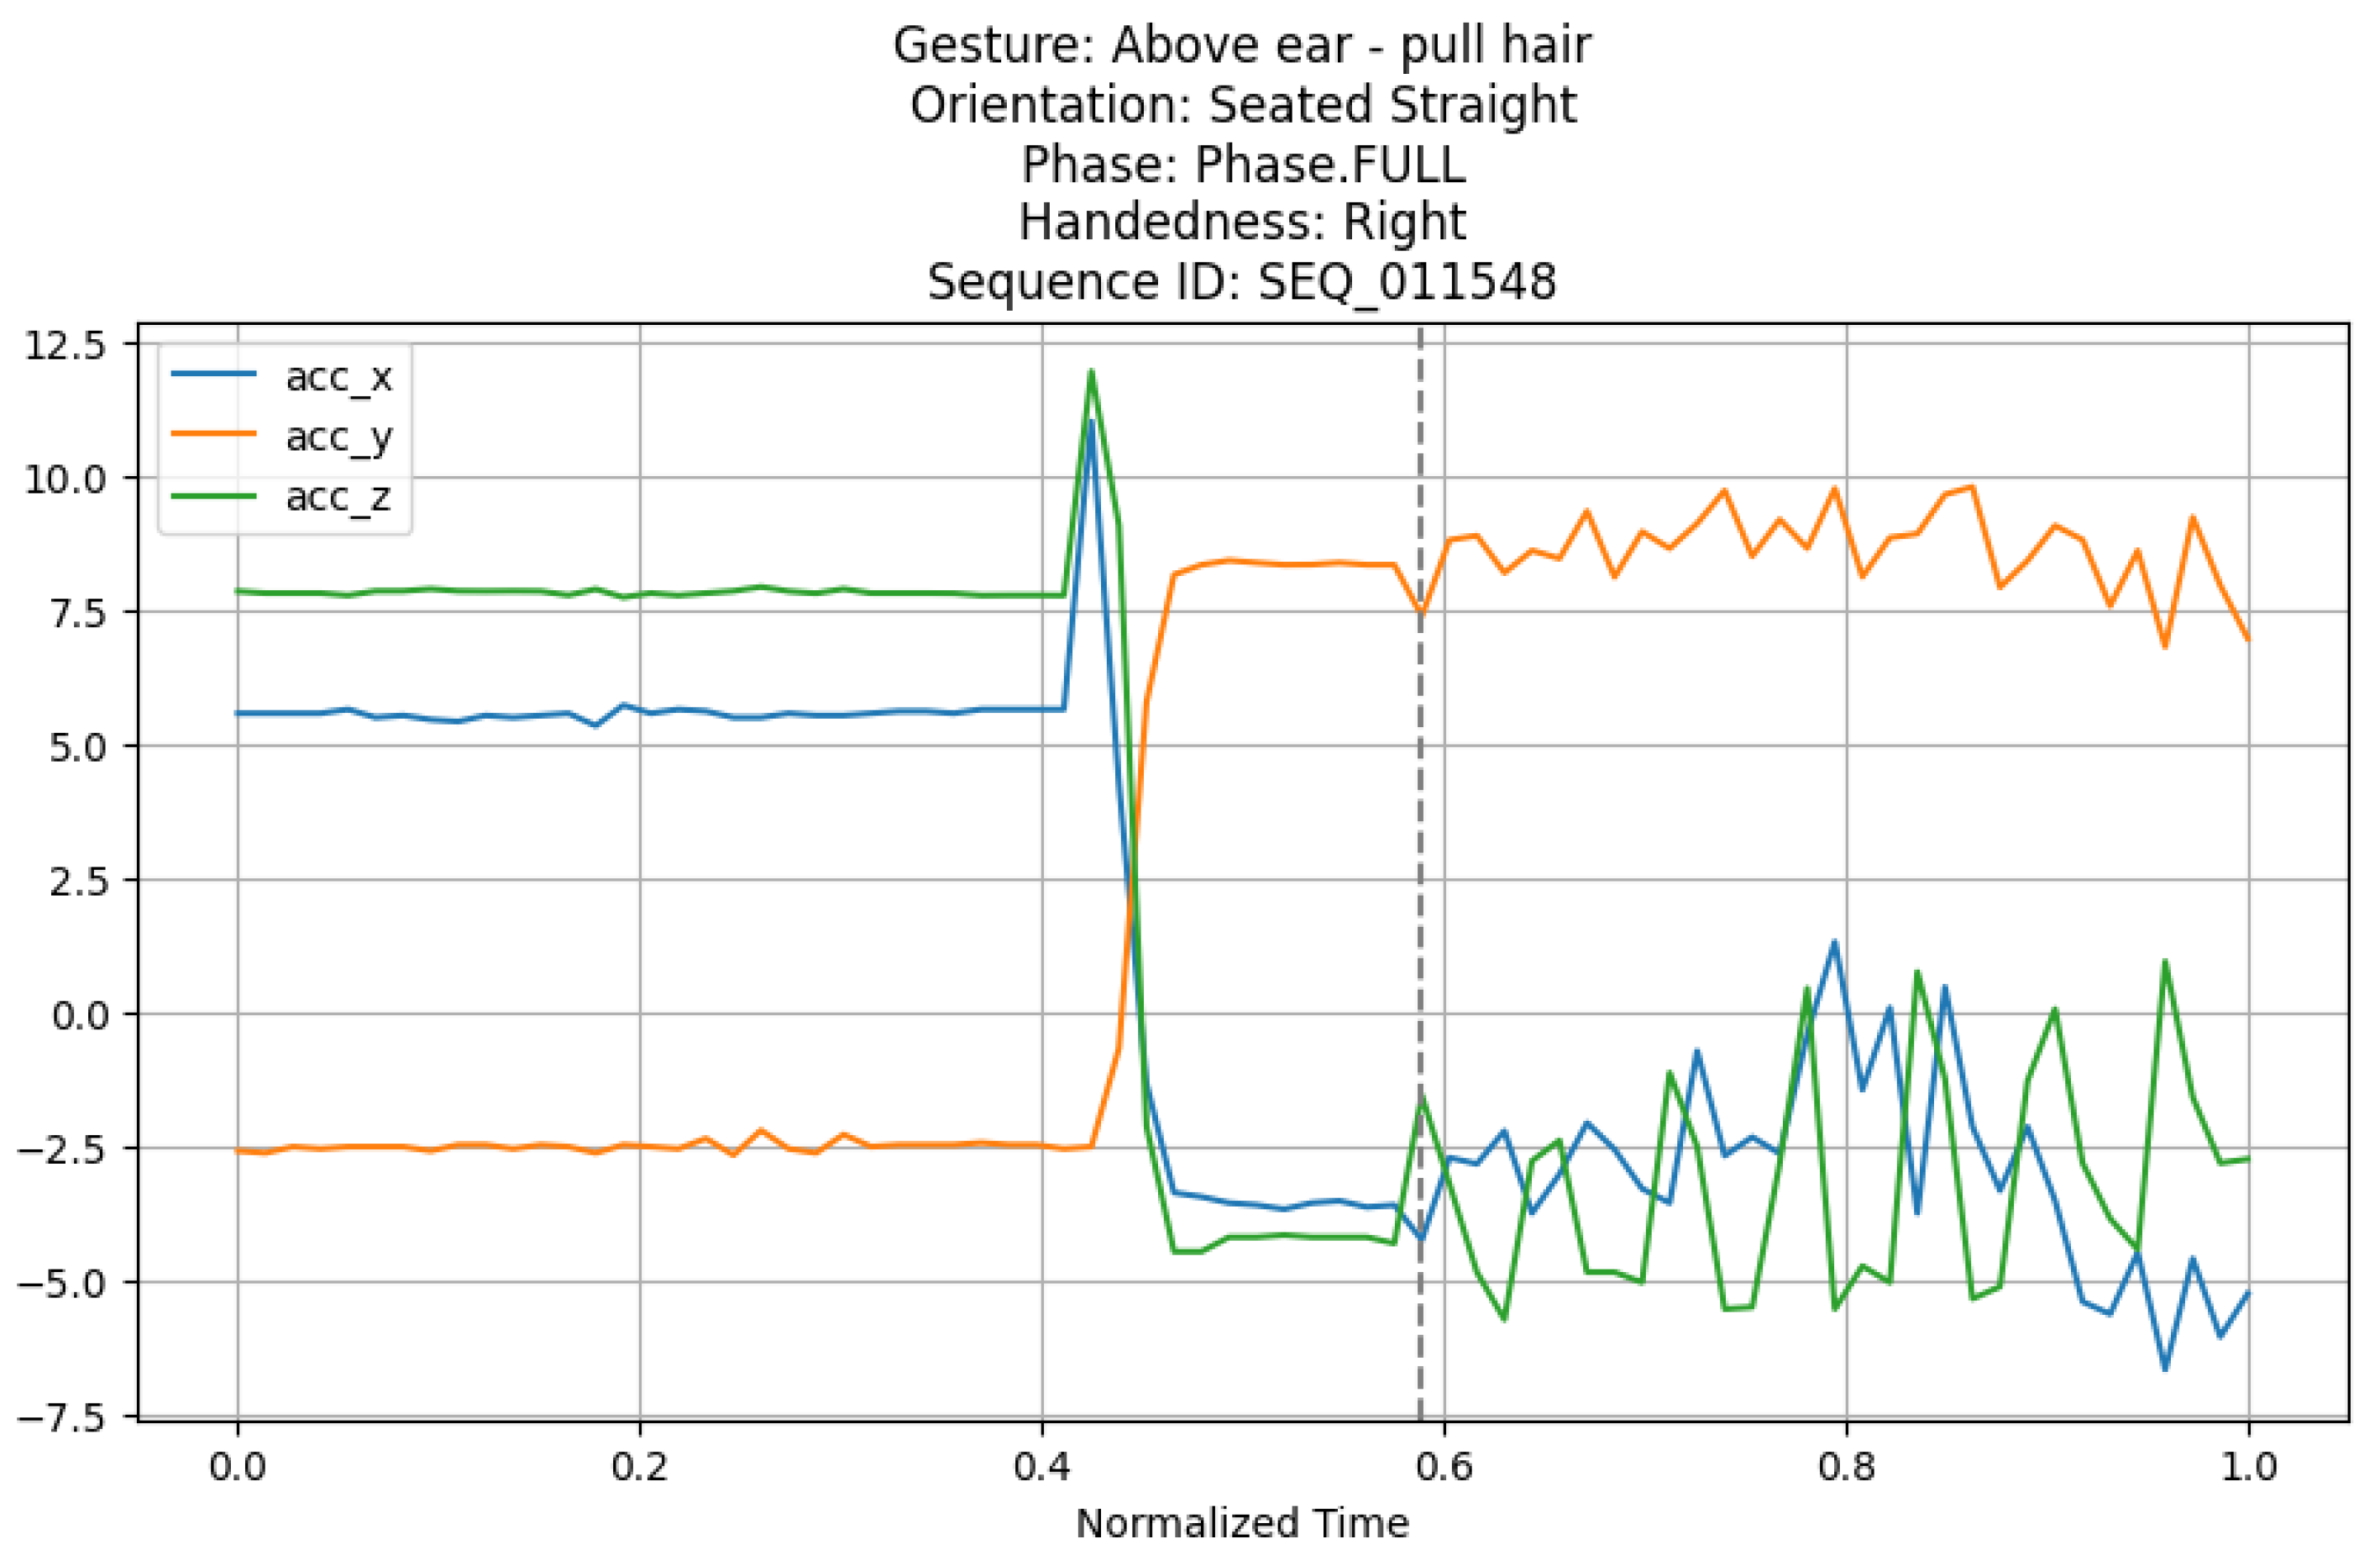
Figure 6.
Block diagram illustrating the Quintuple Validation Inertial Framework (QVIF) methodology.
Figure 6.
Block diagram illustrating the Quintuple Validation Inertial Framework (QVIF) methodology.
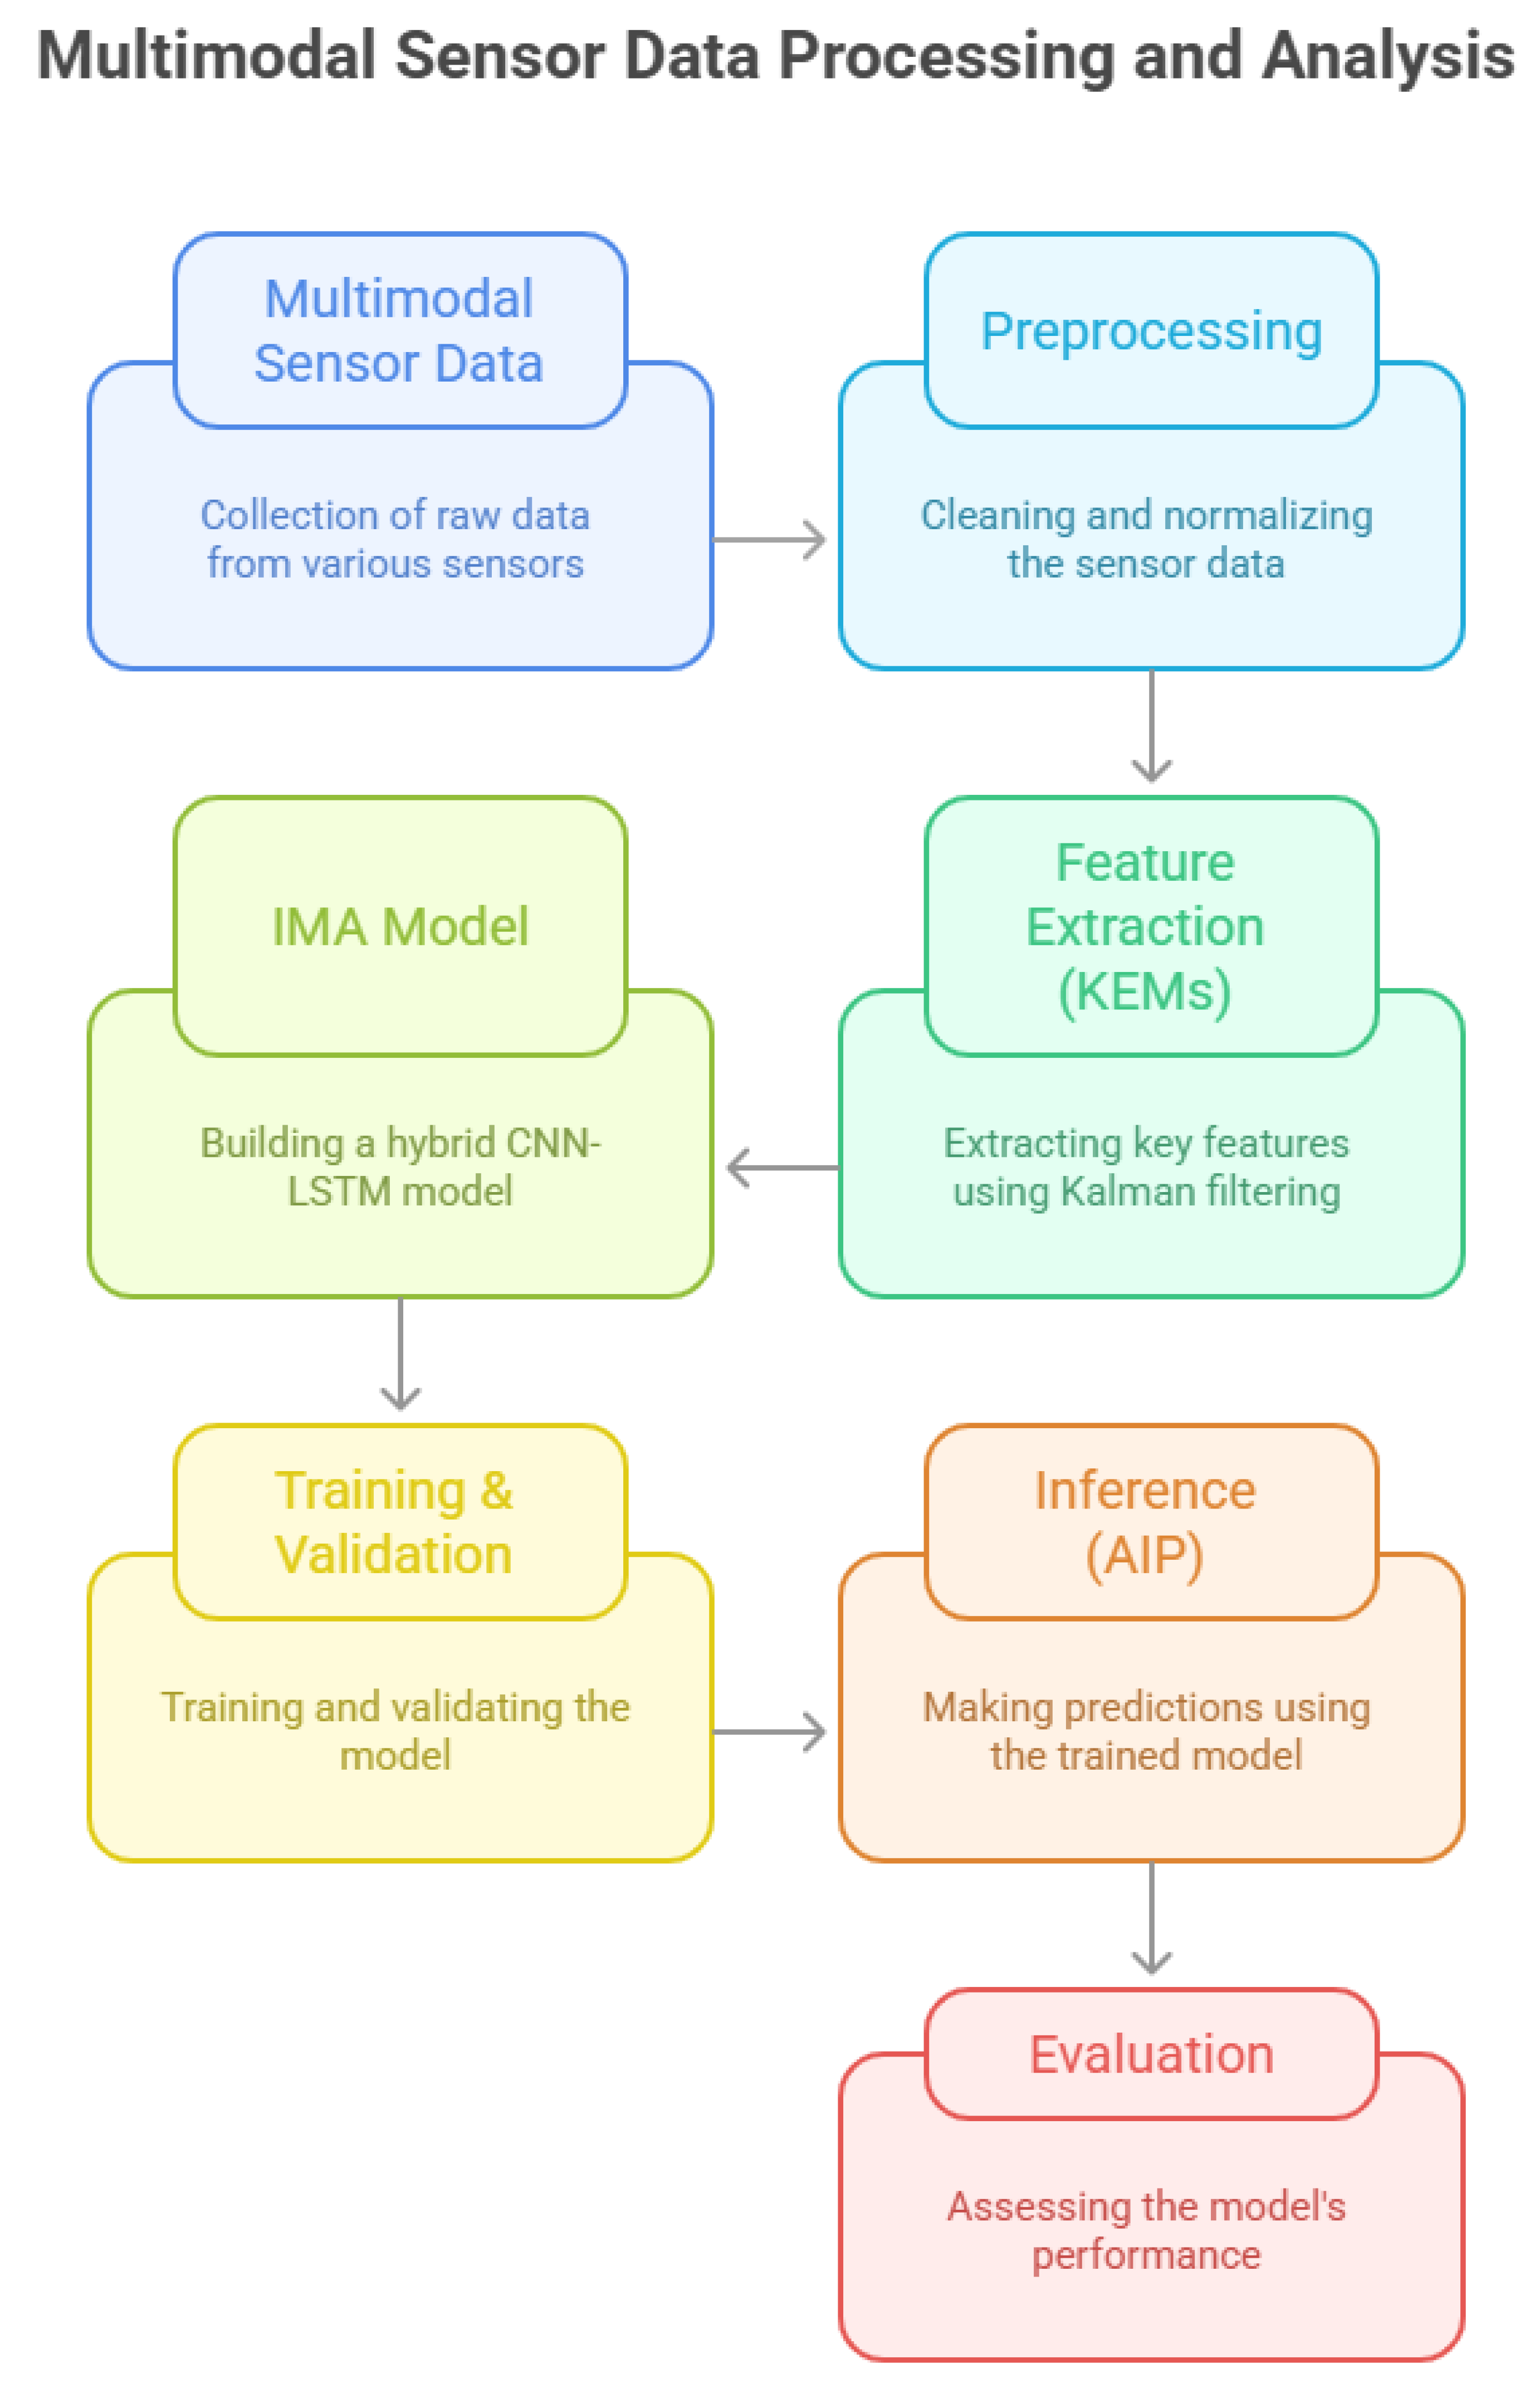
Figure 7.
Averaged Training and Validation Loss Trajectories Spanning All Folds (Convergence Manifest by Epoch 25).
Figure 7.
Averaged Training and Validation Loss Trajectories Spanning All Folds (Convergence Manifest by Epoch 25).
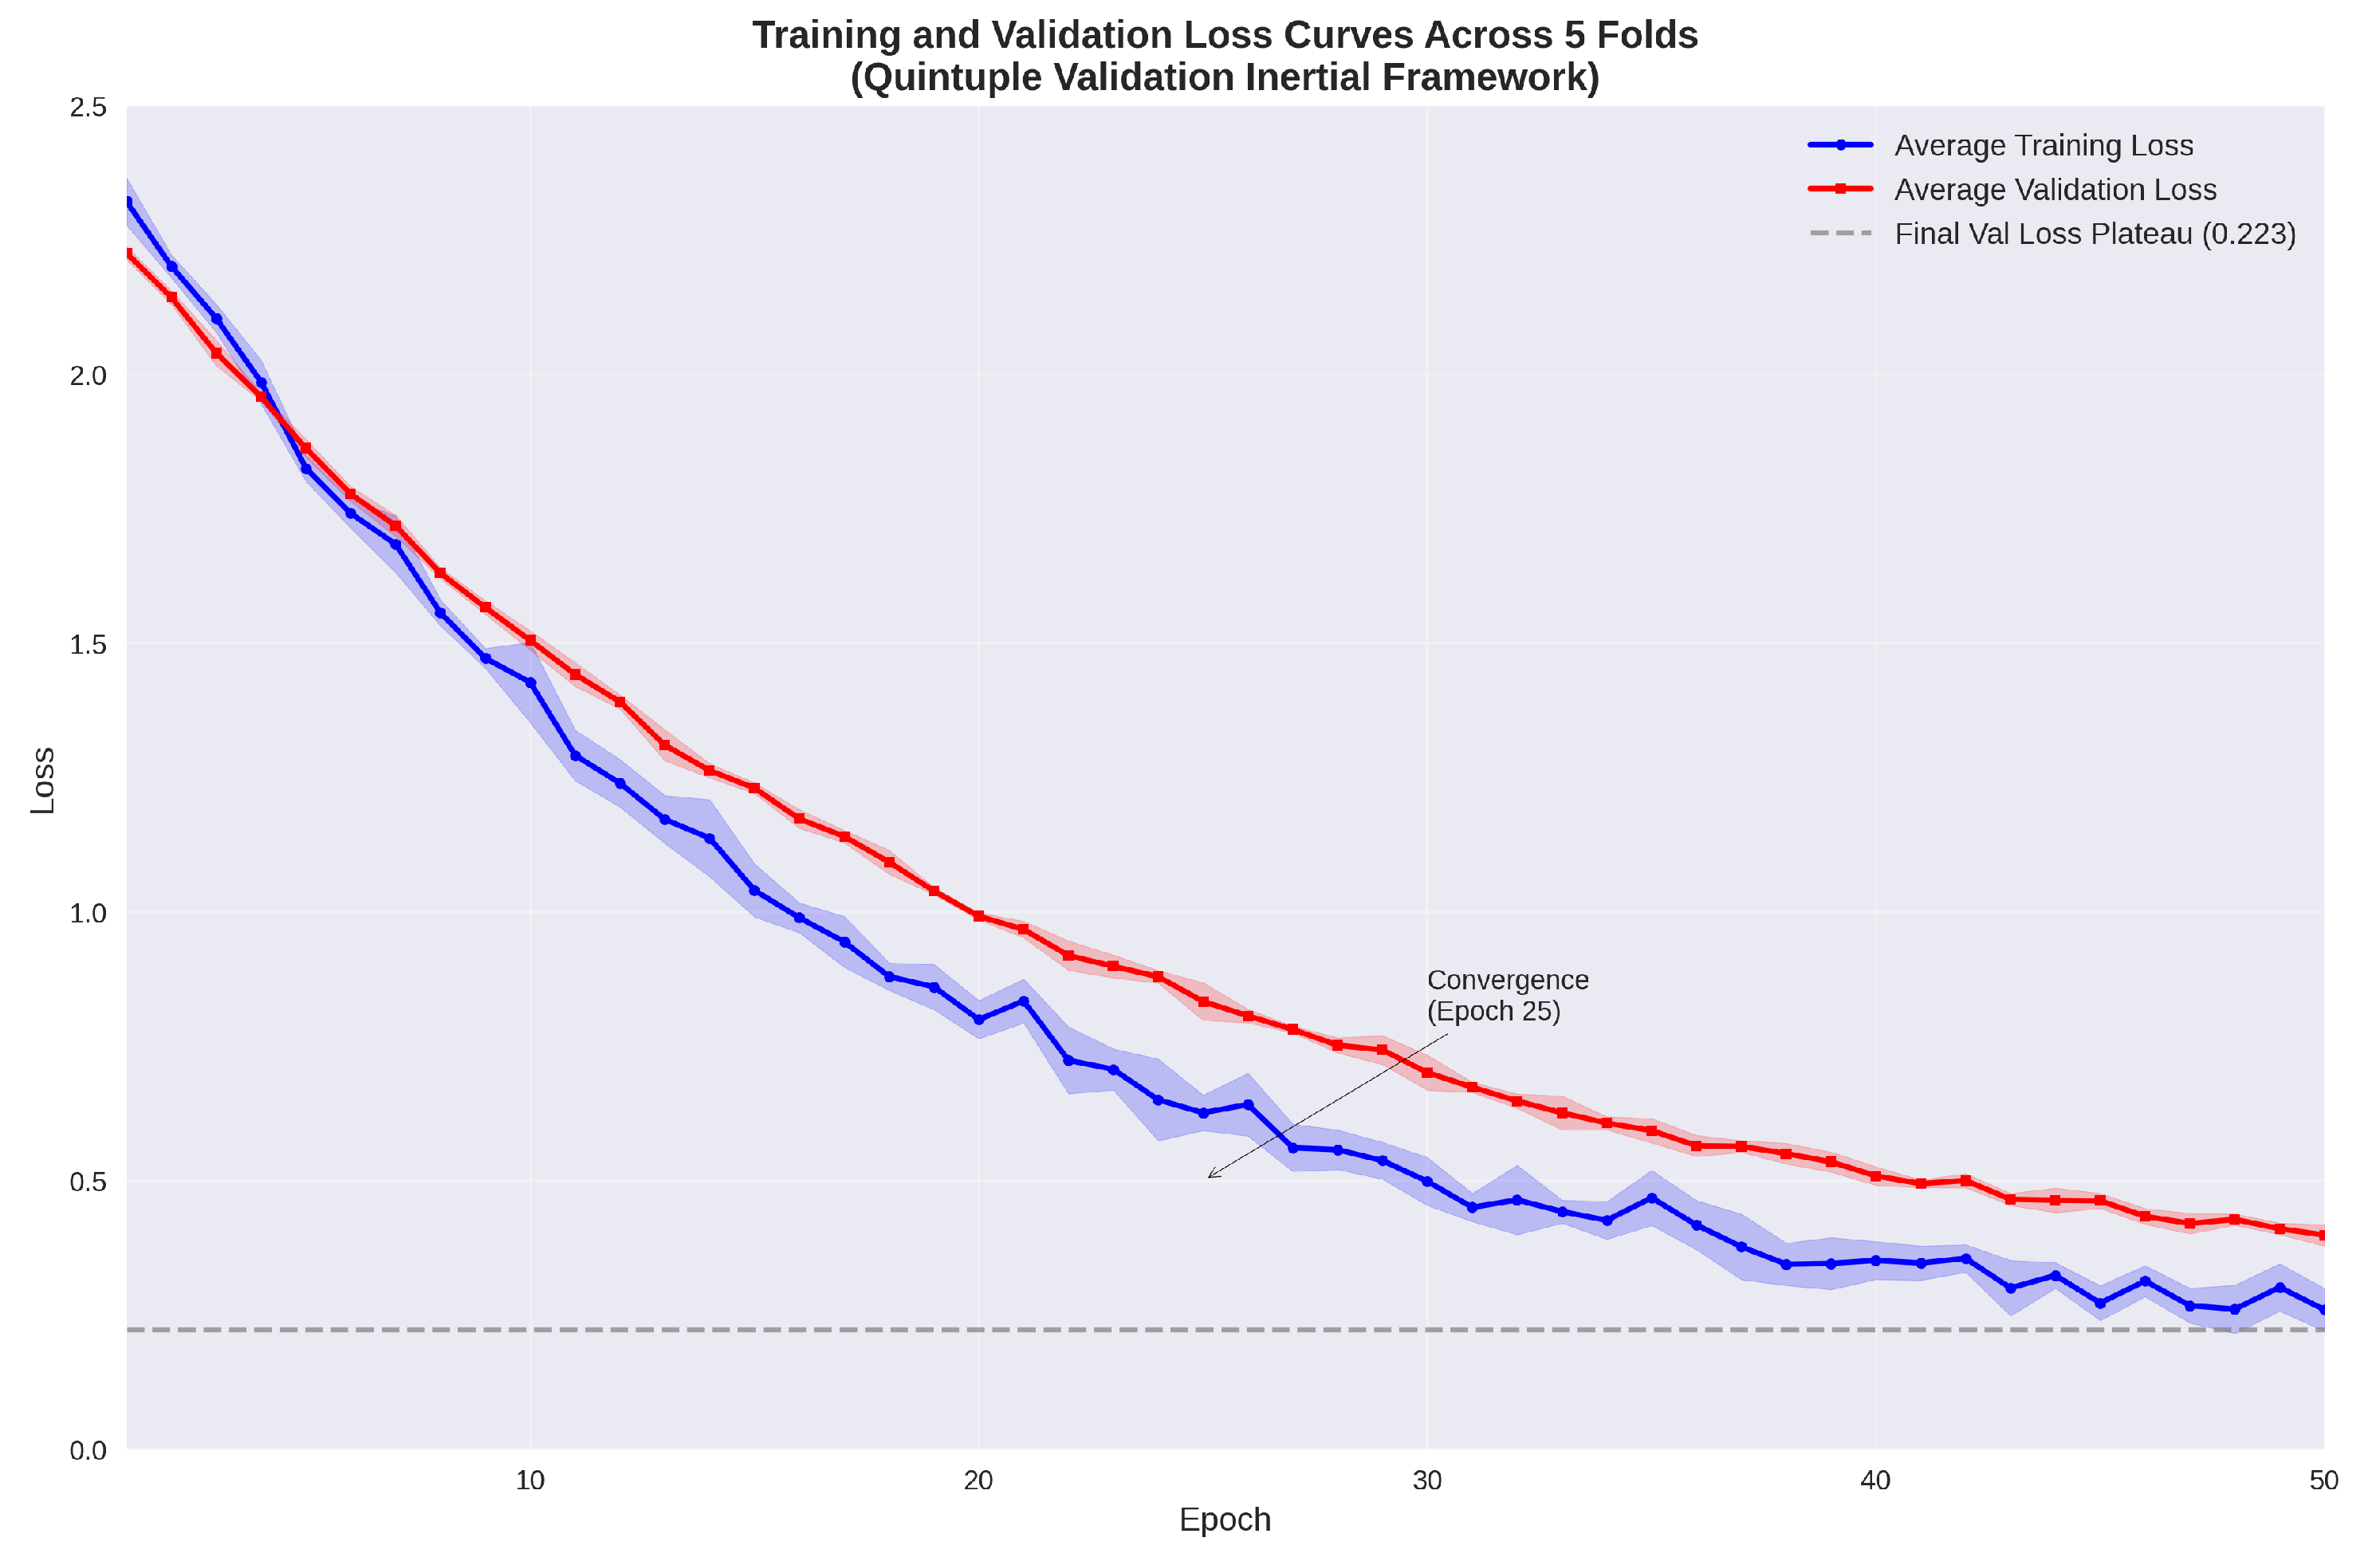
Figure 8.
Confusion Matrices for Gesture and Phase Predictions (Diagonal Dominance Indicates High Discriminability).
Figure 8.
Confusion Matrices for Gesture and Phase Predictions (Diagonal Dominance Indicates High Discriminability).
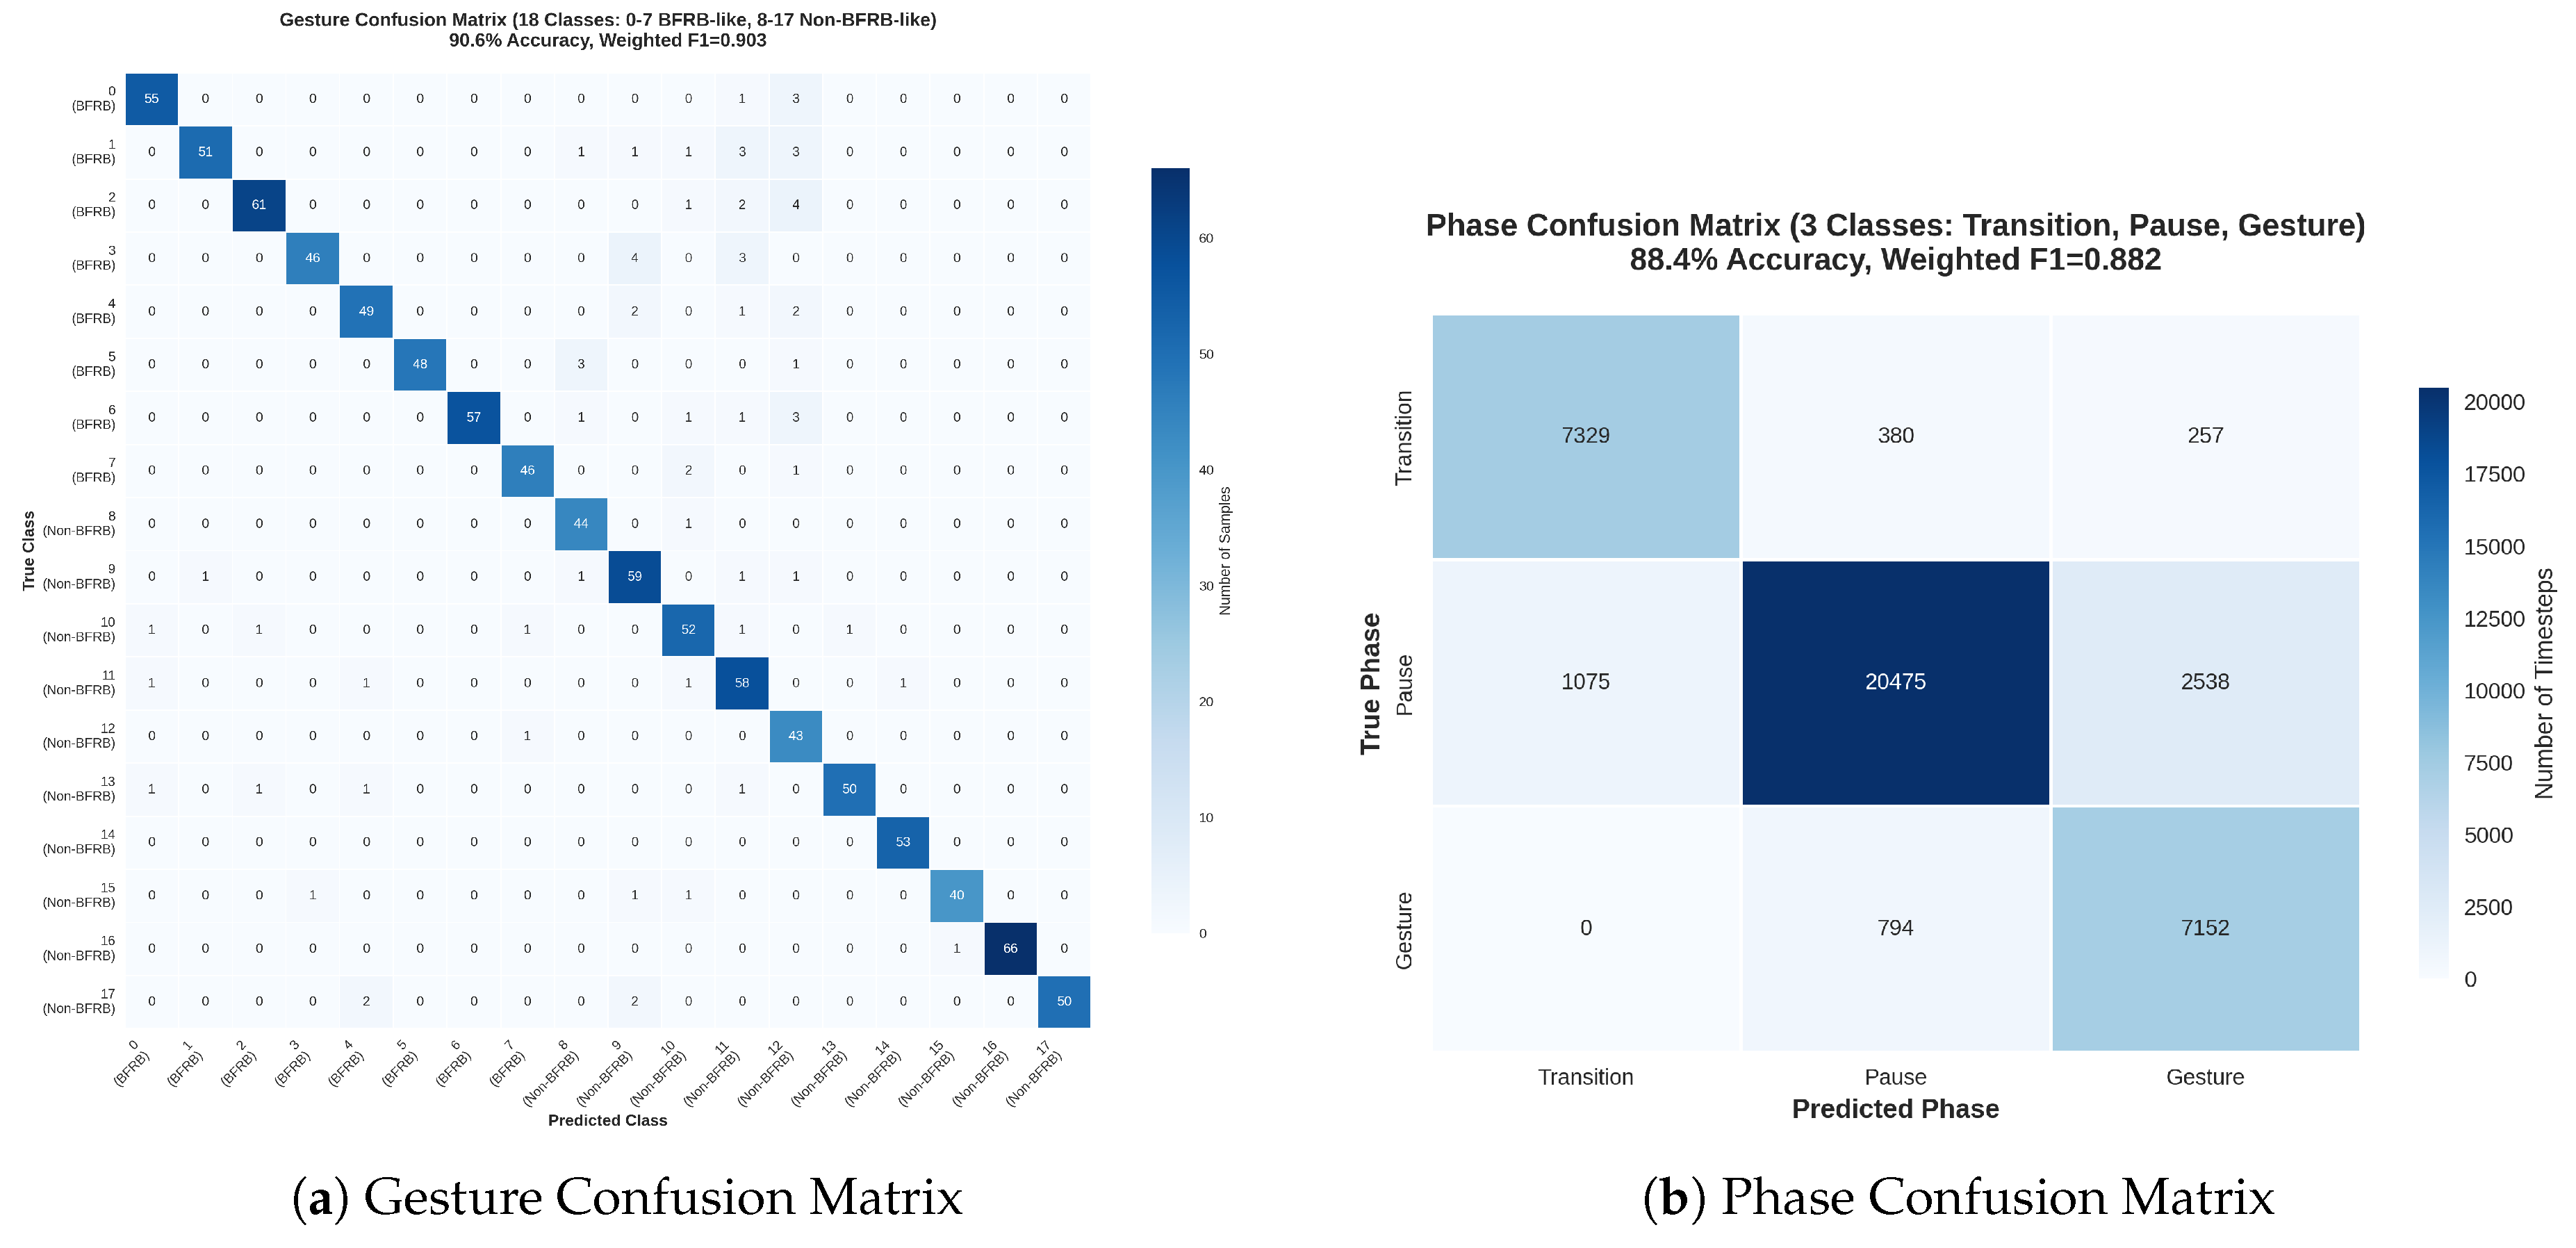
Figure 9.
Gesture Confusion Matrix Illustrating Class-Wise Discriminability (Diagonal Elements Denote Correct Classifications; Off-Diagonals Highlight BFRB-Non-BFRB Overlaps)
Figure 9.
Gesture Confusion Matrix Illustrating Class-Wise Discriminability (Diagonal Elements Denote Correct Classifications; Off-Diagonals Highlight BFRB-Non-BFRB Overlaps)
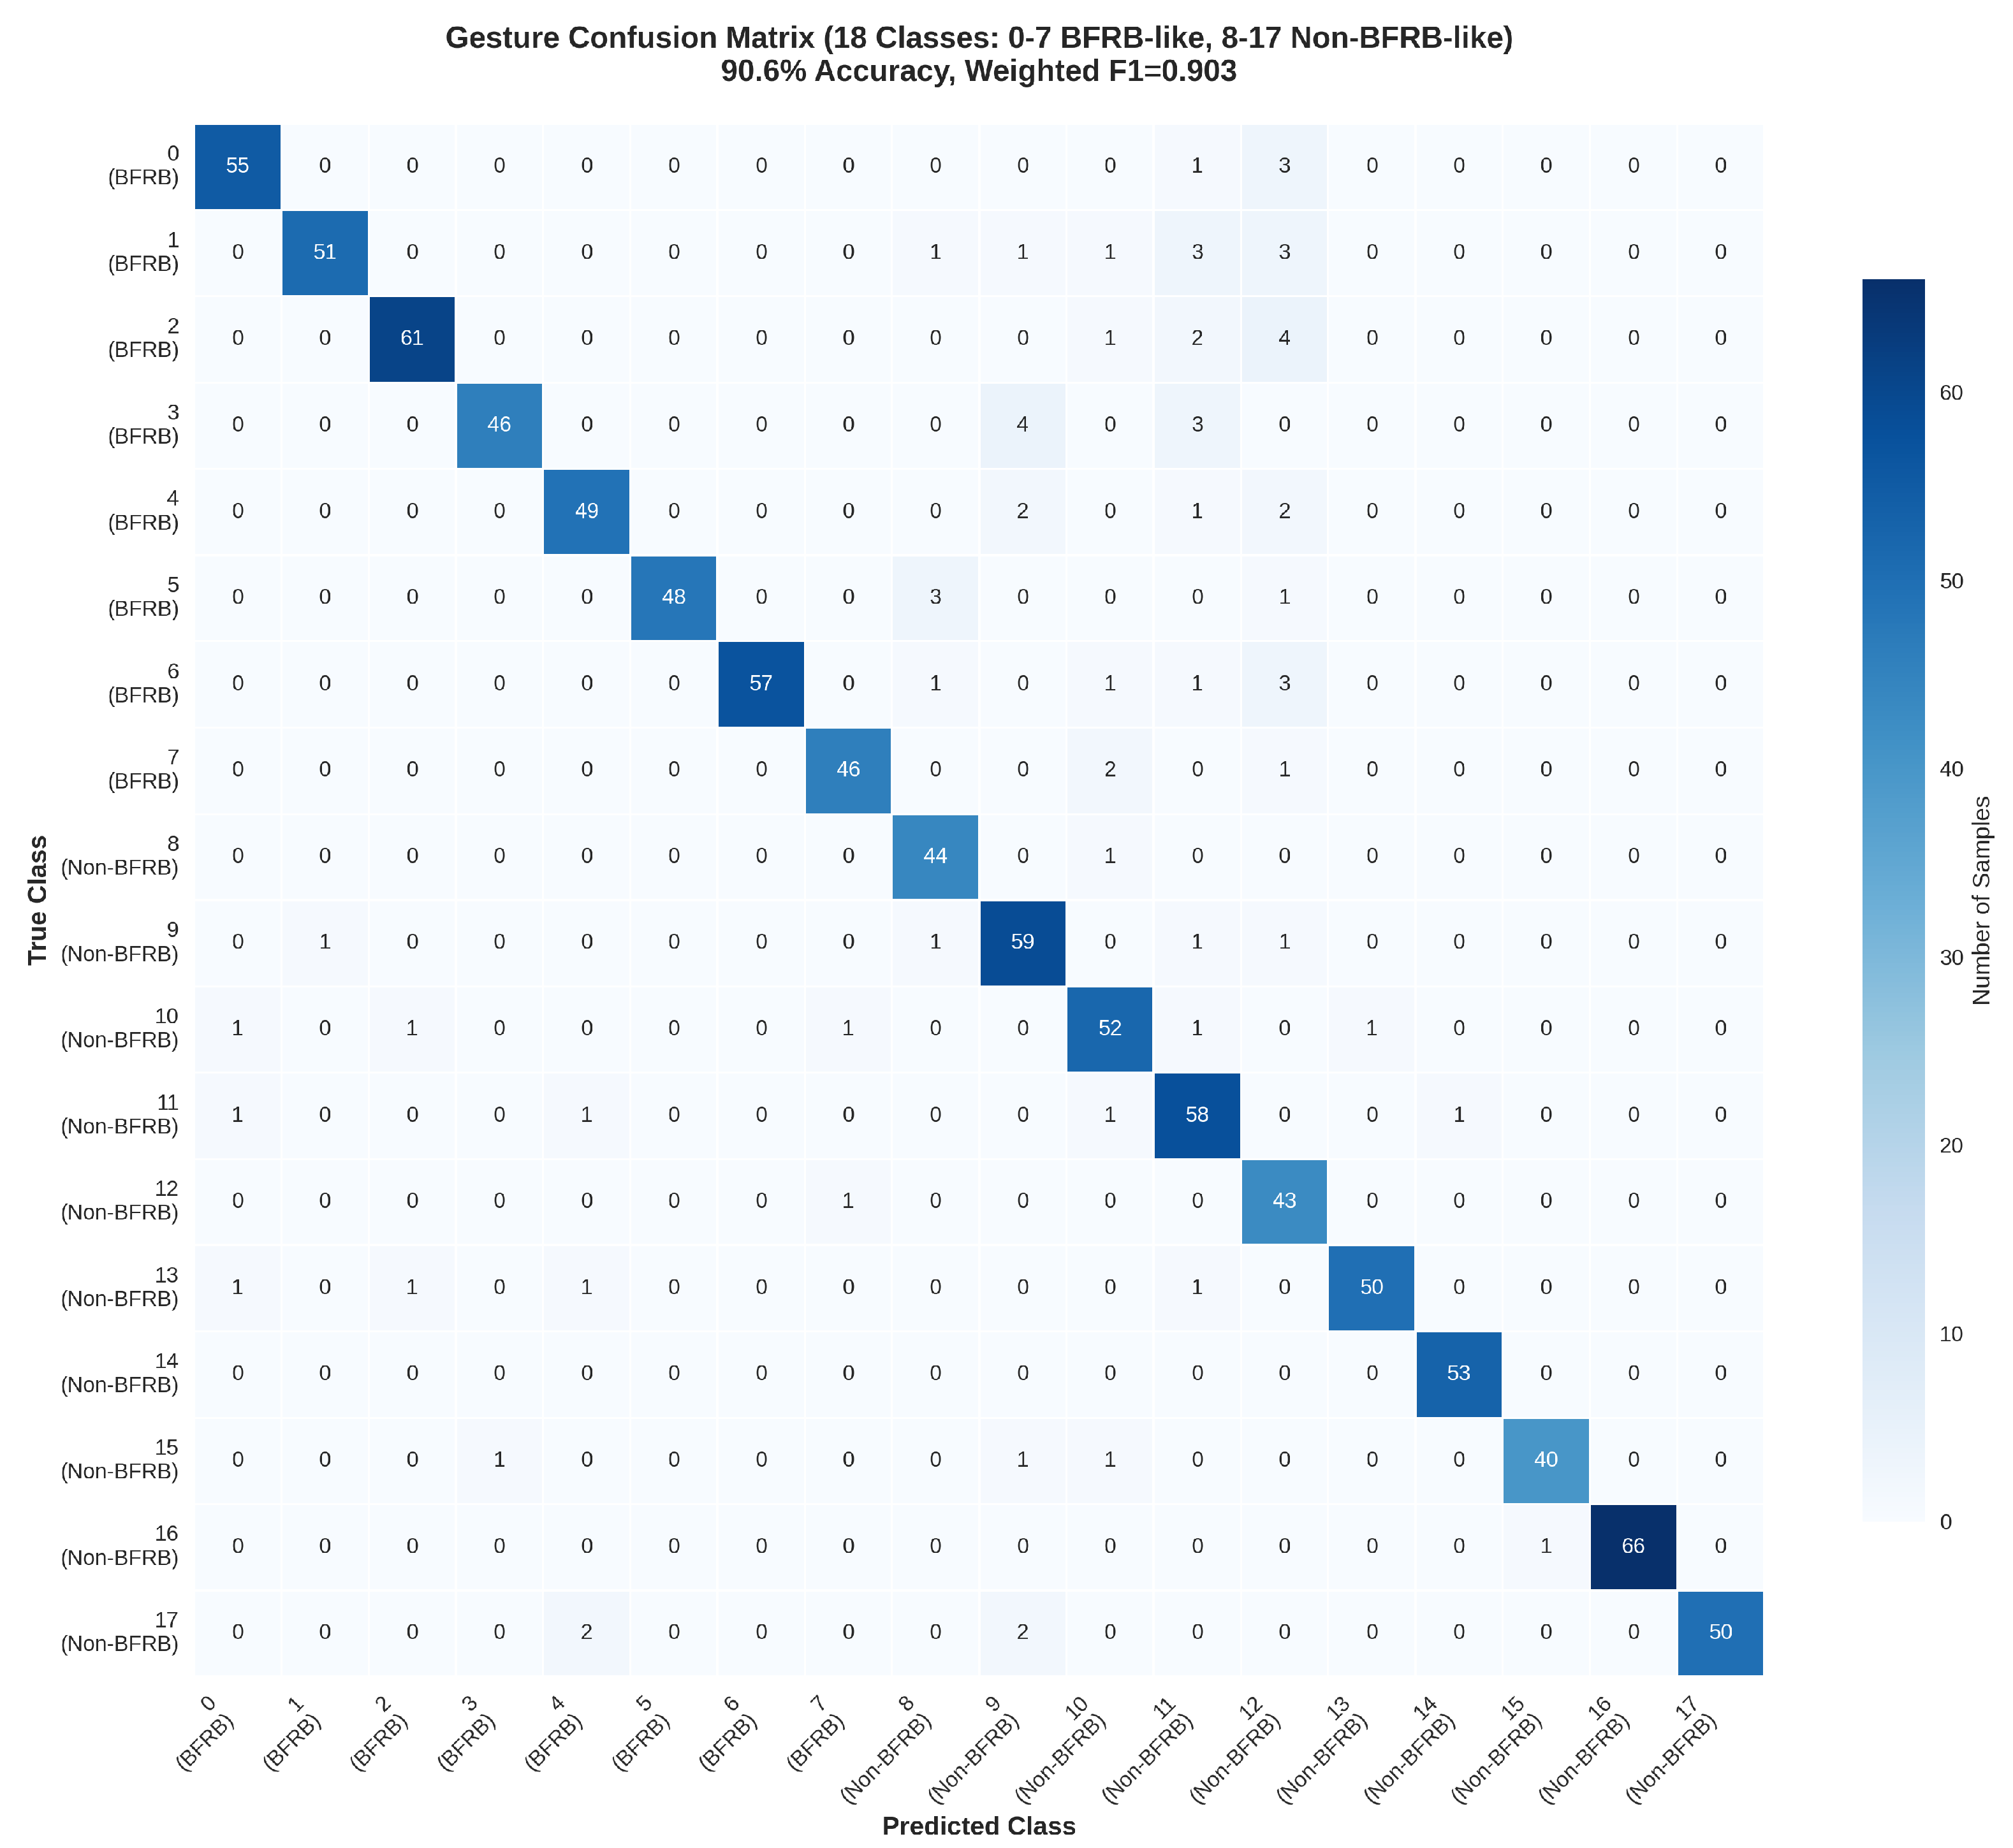
Figure 10.
Behavioral Phase Confusion Matrix: Diagonal Elements Denote Temporal Segmentation Accuracy; Off-Diagonals Highlight Pause-Gesture Conflation
Figure 10.
Behavioral Phase Confusion Matrix: Diagonal Elements Denote Temporal Segmentation Accuracy; Off-Diagonals Highlight Pause-Gesture Conflation
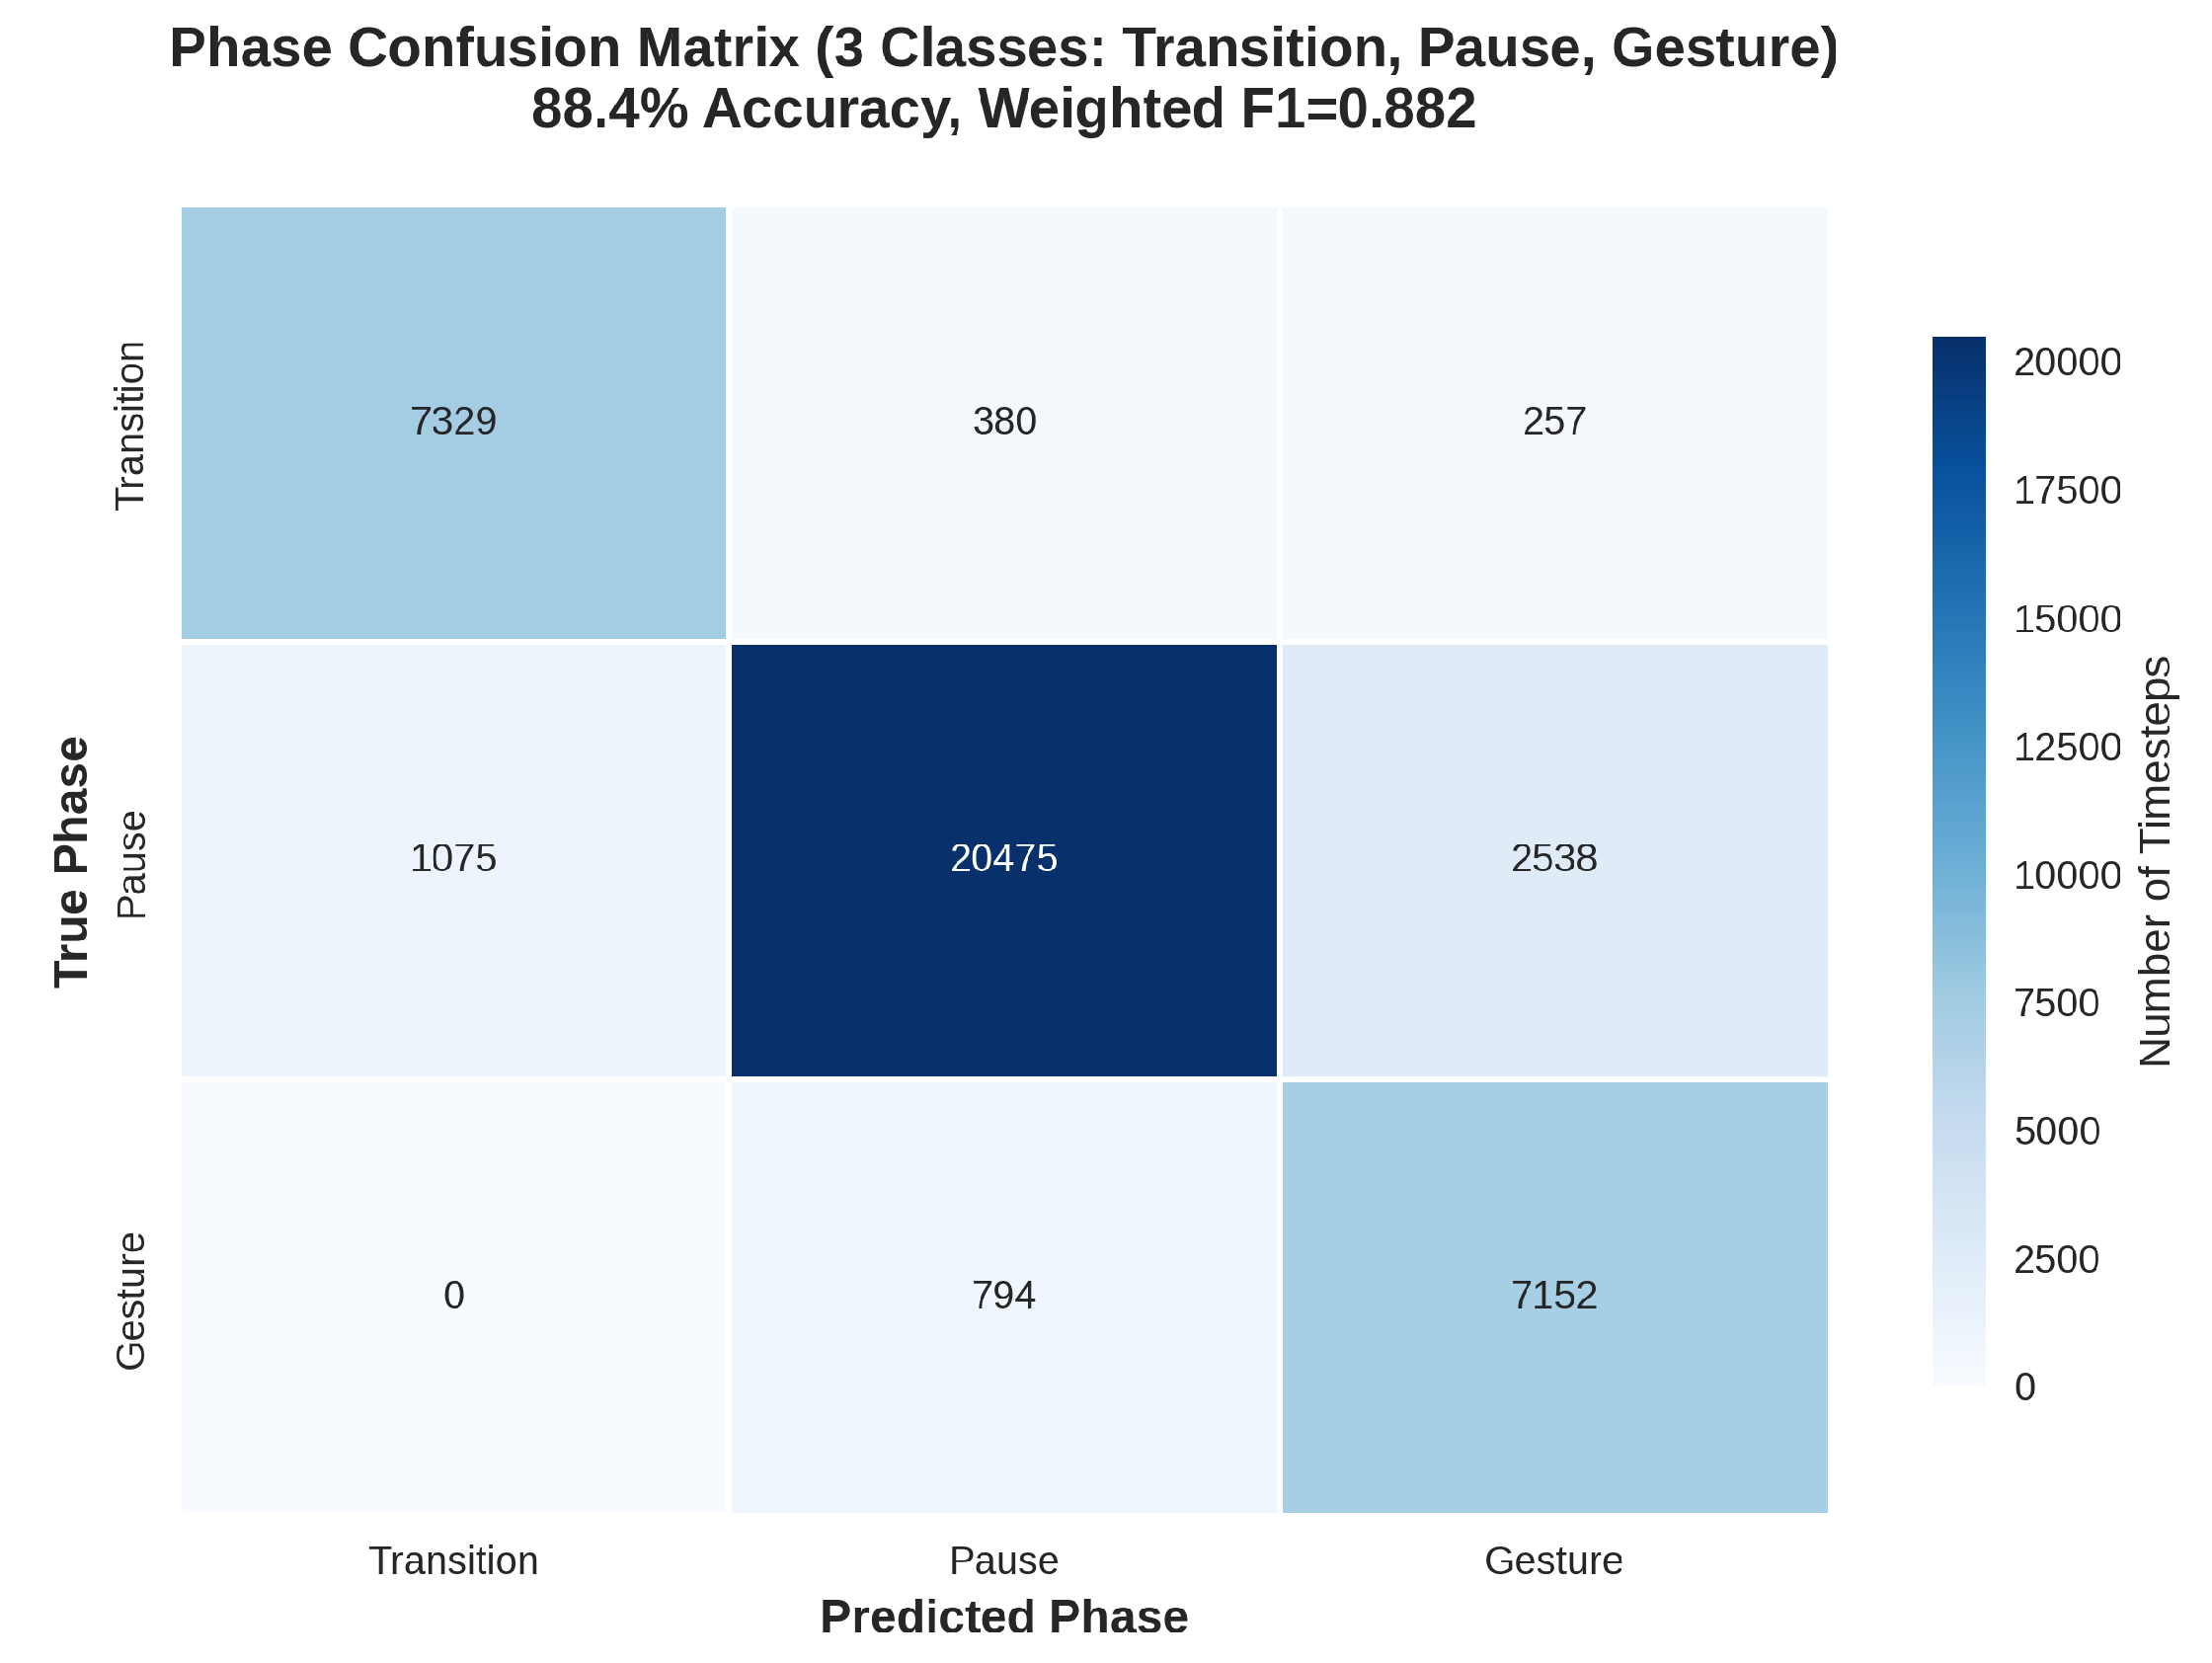

Table 1.
Features in the Sensor Data File (train.csv).
| Feature | Type | Description | Range/Values | Unique Count |
| session_id | object | Unique session identifier (e.g., “2013001003”) | String | 1,643 |
| participant_id | object | Participant identifier (e.g., “2013001003”) | String | 860 |
| step | int64 | Time step within session | 0–16,999 | 17,000 (max per session) |
| anglez | double | Azimuth angle (degrees) | -180–180 | Continuous |
| enmo | double | Motion intensity (ENMO) | 0–5 | Continuous |
| orientation_X | double | Quaternion X component | -1–1 | Continuous |
| orientation_Y | double | Quaternion Y component | -1–1 | Continuous |
| orientation_Z | double | Quaternion Z component | -1–1 | Continuous |
| orientation_W | double | Quaternion W component | -1–1 | Continuous |
| label | int8 | Behavioral state label | {0,1,2} | 3 |
Table 2.
Features in the Demographics File (train_demographics.csv).
| Feature | Type | Description | Range/Values | Unique Count |
| participant_id | object | Participant identifier | String | 860 |
| sex | object | Gender | {“M”, “F”} | 2 |
| agegroup | object | Age bracket | 13 categories (“0-4” to “80+”) | 13 |
| height | double | Height (cm) | 80 to 190 | Continuous |
| room_total | int64 | Total rooms in household | 1 to 10 | 10 |
| hhsize | int64 | Household size | 1 to 15 | 15 |
| sc | int64 | Socioeconomic class | 1 to 5 | 5 |
| highest_education_level_mother | object | Mother’s education | 4 categories | 4 |
| highest_education_level_father | object | Father’s education | 4 categories | 4 |
Table 3.
EDA for gesture sequence data.
| Row ID | Subject | Orientation | Gesture | Seq. Ctr. | Acc X | ToF v56 | ToF v57 | ToF Mean |
| SEQ_000007_000000 | SUBJ_059520 | Seated Lean... | Cheek - pinch | 0 | 6.68 | -1 | -1 | -1.00 |
| SEQ_000007_000001 | SUBJ_059520 | Seated Lean... | Cheek - pinch | 1 | 6.95 | -1 | -1 | -1.00 |
| SEQ_000007_000002 | SUBJ_059520 | Seated Lean... | Cheek - pinch | 2 | 5.72 | 112 | 119 | 115.50 |
| SEQ_000007_000003 | SUBJ_059520 | Seated Lean... | Cheek - pinch | 3 | 6.60 | 101 | 111 | 106.00 |
| SEQ_000007_000004 | SUBJ_059520 | Seated Lean... | Cheek - pinch | 4 | 5.57 | 101 | 109 | 111.67 |
| SEQ_000007_000005 | SUBJ_059520 | Seated Lean... | Cheek - pinch | 5 | 4.00 | 118 | 114 | 117.00 |
| SEQ_000007_000006 | SUBJ_059520 | Seated Lean... | Cheek - pinch | 6 | 4.04 | 104 | 118 | 111.00 |
| SEQ_000007_000007 | SUBJ_059520 | Seated Lean... | Cheek - pinch | 7 | 3.73 | 105 | 119 | 112.00 |
| SEQ_000007_000008 | SUBJ_059520 | Seated Lean... | Cheek - pinch | 8 | 4.54 | 103 | 122 | 112.50 |
| SEQ_000007_000009 | SUBJ_059520 | Seated Lean... | Cheek - pinch | 9 | 3.92 | 104 | 123 | 113.50 |
Table 4.
Filtered Exploratory Data Analysis Table for Gesture Sequence Data.
| Row ID | Seq. Type | Seq. ID | Subject | Orientation | Behavior | Seq. Ctr. | Gesture | Acc X | Rot W | Thm 1 | ToF v0 |
| SEQ_000007_000000 | Target | SEQ_000007 | SUBJ_059520 | Seated Lean... | Relaxes... | 0 | Cheek - pinch | 6.68 | 0.13 | 28.94 | 131 |
| SEQ_000007_000001 | Target | SEQ_000007 | SUBJ_059520 | Seated Lean... | Relaxes... | 1 | Cheek - pinch | 6.95 | 0.14 | 29.34 | 130 |
| SEQ_000007_000002 | Target | SEQ_000007 | SUBJ_059520 | Seated Lean... | Relaxes... | 2 | Cheek - pinch | 5.72 | 0.22 | 30.34 | 137 |
| SEQ_000007_000003 | Target | SEQ_000007 | SUBJ_059520 | Seated Lean... | Relaxes... | 3 | Cheek - pinch | 6.60 | 0.30 | 30.54 | 143 |
| SEQ_000007_000004 | Target | SEQ_000007 | SUBJ_059520 | Seated Lean... | Relaxes... | 4 | Cheek - pinch | 5.57 | 0.33 | 29.32 | 178 |
| SEQ_000007_000005 | Target | SEQ_000007 | SUBJ_059520 | Seated Lean... | Relaxes... | 5 | Cheek - pinch | 4.00 | 0.36 | 28.41 | 192 |
| SEQ_000007_000006 | Target | SEQ_000007 | SUBJ_059520 | Seated Lean... | Relaxes... | 6 | Cheek - pinch | 4.04 | 0.38 | 27.92 | 209 |
| SEQ_000007_000007 | Target | SEQ_000007 | SUBJ_059520 | Seated Lean... | Relaxes... | 7 | Cheek - pinch | 3.73 | 0.38 | 27.82 | 212 |
| SEQ_000007_000008 | Target | SEQ_000007 | SUBJ_059520 | Seated Lean... | Relaxes... | 8 | Cheek - pinch | 4.54 | 0.37 | 27.80 | 217 |
| SEQ_000007_000009 | Target | SEQ_000007 | SUBJ_059520 | Seated Lean... | Relaxes... | 9 | Cheek - pinch | 3.92 | 0.37 | 27.70 | 220 |
Table 5.
Tail of the Gesture Sequence Dataset Showing the End of the Last Sequence.
| Row ID | Seq. Type | Seq. ID | Subject | Orientation | Behavior | Seq. Ctr. | Gesture | Acc X | ToF v54 | ToF v55 | ToF v56 | ToF v57 | ToF v58 |
| SEQ_065531_000043 | Non-Target | SEQ_065531 | SUBJ_039498 | Seated Lean... | Performs... | 43 | Write name... | 3.89 | -1 | -1 | -1 | -1 | -1 |
| SEQ_065531_000044 | Non-Target | SEQ_065531 | SUBJ_039498 | Seated Lean... | Performs... | 44 | Write name... | 3.89 | -1 | -1 | -1 | -1 | -1 |
| SEQ_065531_000045 | Non-Target | SEQ_065531 | SUBJ_039498 | Seated Lean... | Performs... | 45 | Write name... | 4.08 | -1 | -1 | -1 | -1 | -1 |
| SEQ_065531_000046 | Non-Target | SEQ_065531 | SUBJ_039498 | Seated Lean... | Performs... | 46 | Write name... | 2.74 | 65 | 66 | -1 | -1 | -1 |
| SEQ_065531_000047 | Non-Target | SEQ_065531 | SUBJ_039498 | Seated Lean... | Performs... | 47 | Write name... | 3.58 | 65 | 65 | -1 | -1 | -1 |
| SEQ_065531_000048 | Non-Target | SEQ_065531 | SUBJ_039498 | Seated Lean... | Performs... | 48 | Write name... | 3.50 | 62 | 65 | -1 | -1 | -1 |
| SEQ_065531_000049 | Non-Target | SEQ_065531 | SUBJ_039498 | Seated Lean... | Performs... | 49 | Write name... | 3.77 | 71 | 72 | -1 | -1 | -1 |
| SEQ_065531_000050 | Non-Target | SEQ_065531 | SUBJ_039498 | Seated Lean... | Performs... | 50 | Write name... | 3.08 | 80 | 77 | -1 | -1 | -1 |
| SEQ_065531_000051 | Non-Target | SEQ_065531 | SUBJ_039498 | Seated Lean... | Performs... | 51 | Write name... | 3.96 | 72 | 77 | -1 | -1 | -1 |
| SEQ_065531_000052 | Non-Target | SEQ_065531 | SUBJ_039498 | Seated Lean... | Performs... | 52 | Write name... | 4.27 | -1 | -1 | -1 | -1 | -1 |
Table 6.
Summary Statistics of Sequence Lengths.
| Statistic | Value |
| Total Sequences | 8151 |
| Minimum Length | 28 |
| Maximum Length | 699 |
| Mean Length (Estimated) | 71 |
| Median Length (Estimated) | 60 |
| Mode Range | 50–60 |
| Most Common Count | 2619 |
| Percentage of Mode | 32% |
Table 7.
Verification of Phase Order Across Sequences
| Condition | Result |
| Sequences with decreasing phase order | 0 |
| Total sequences checked | 8151 |
Table 8.
Distribution of Behavior-Phase Sequences.
| Behavior-Phase Sequence | Count |
| (Relaxes and moves hand to target location, Transition), (Hand at target location, Transition), (Performs gesture, Gesture) | 4048 |
| (Moves hand to target location, Transition), (Hand at target location, Transition), (Performs gesture, Gesture) | 4102 |
| (Relaxes and moves hand to target location, Transition), (Hand at target location, Transition) | 1 |
Table 9.
Missing Values in Filtered Representative Columns.
| Column | Missing Rows |
| row_id | 0 |
| sequence_type | 0 |
| sequence_id | 0 |
| sequence_counter | 0 |
| subject | 0 |
| orientation | 0 |
| behavior | 0 |
| phase | 0 |
| gesture | 0 |
| acc_x | 0 |
| rot_w | 3692 |
| thm_1 | 6987 |
| tof_1_v0 | 6224 |
Table 10.
Missing Values by Sensor Group and Instance.
| Group | Missing Rows (Example) | Instance | Missing Rows |
| rot | 3692 | rot_w | 3692 |
| rot_x | 3692 | ||
| rot_y | 3692 | ||
| rot_z | 3692 | ||
| thm | 6987 | thm_1 | 6987 |
| thm_2 | 7638 | ||
| thm_3 | 6472 | ||
| thm_4 | 6224 | ||
| thm_5 | 33286 | ||
| tof | 6224 | tof_1_v0 | 6224 |
| tof_2_v0 | 6224 | ||
| tof_3_v0 | 6224 | ||
| tof_4_v0 | 6224 | ||
| tof_5_v0 | 30142 |
Table 11.
Sequences with Missing Data per Sensor Instance.
| Instance | Sequences Missing | Instance | Sequences Missing |
| rot_w | 50 | tof_1_v0 | 96 |
| thm_1 | 104 | tof_2_v0 | 96 |
| thm_2 | 117 | tof_3_v0 | 96 |
| thm_3 | 100 | tof_4_v0 | 96 |
| thm_4 | 96 | tof_5_v0 | 435 |
| thm_5 | 483 |
Table 12.
Sequences with Partial Missing Data per Instance.
| Instance | Sequences Partially Missing |
| rot_w | 0 |
| thm_1 | 0 |
| thm_2 | 1 |
| thm_3 | 0 |
| thm_4 | 0 |
| thm_5 | 1 |
| tof_1_v0 | 0 |
| tof_2_v0 | 0 |
| tof_3_v0 | 0 |
| tof_4_v0 | 0 |
| tof_5_v0 | 1 |
Table 13.
Sample of Demographics Data (First Five Rows).
| subject | adult_child | age | sex | handedness | height_cm | shoulder_to_wrist_cm | elbow_to_wrist_cm |
| SUBJ_000206 | 1 | 41 | 1 | 1 | 172.0 | 50 | 25.0 |
| SUBJ_001430 | 0 | 11 | 0 | 1 | 167.0 | 51 | 27.0 |
| SUBJ_002923 | 1 | 28 | 1 | 0 | 164.0 | 54 | 26.0 |
| SUBJ_003328 | 1 | 33 | 1 | 1 | 171.0 | 52 | 25.0 |
| SUBJ_004117 | 0 | 15 | 0 | 1 | 184.0 | 54 | 28.0 |
Table 14.
Statistical Summary of Demographics Features.
| Statistic | adult_child | age | sex | handedness | height_cm | shoulder_to_wrist_cm | elbow_to_wrist_cm |
| Mean | 0.52 | 21.81 | 0.62 | 0.88 | 167.99 | 51.58 | 25.47 |
| Std | 0.50 | 10.29 | 0.49 | 0.33 | 10.61 | 4.89 | 3.03 |
| Min | 0.00 | 10.00 | 0.00 | 0.00 | 135.00 | 41.00 | 18.00 |
| Max | 1.00 | 53.00 | 1.00 | 1.00 | 190.50 | 71.00 | 44.00 |
| CV (%) | 96.96 | 47.17 | 79.23 | 37.76 | 6.31 | 9.48 | 11.88 |
Table 15.
Statistical Summary of Sequences per Subject.
| Statistic | Value |
| Mean | 100.63 |
| Std | 7.76 |
| Min | 51.00 |
| Max | 102.00 |
| CV (%) | 7.71 |
Table 16.
Sample of Normalized Time Transformation.
| row_id | time_norm |
| SEQ_000007_000000 | 0.000000 |
| SEQ_000007_000001 | 0.017857 |
| SEQ_000007_000002 | 0.035714 |
| SEQ_000007_000003 | 0.053571 |
| SEQ_000007_000004 | 0.071429 |
Table 17.
Fold-Wise Performance Metrics of the Inertial Motion Analyzer (IMA) Throughout Quintuple Validation Iterations.
Table 17.
Fold-Wise Performance Metrics of the Inertial Motion Analyzer (IMA) Throughout Quintuple Validation Iterations.
| Fold | Accuracy (%) | Precision (Wtd.) | Recall (Wtd.) | F1-Score (Wtd.) | Validation Loss |
| 1 | 91.2 | 0.910 | 0.906 | 0.908 | 0.215 |
| 2 | 90.8 | 0.904 | 0.900 | 0.902 | 0.222 |
| 3 | 89.5 | 0.897 | 0.893 | 0.895 | 0.238 |
| 4 | 91.5 | 0.912 | 0.908 | 0.910 | 0.210 |
| 5 | 90.1 | 0.902 | 0.898 | 0.899 | 0.228 |
| Mean | 90.6 | 0.905 | 0.901 | 0.903 | 0.223 |
| Std. Dev. | 0.8 | 0.006 | 0.005 | 0.006 | 0.010 |
Table 18.
Per-Class F1-Scores for Exemplary Gestures (Averaged Across Folds, Weighted by Class Support).
Table 18.
Per-Class F1-Scores for Exemplary Gestures (Averaged Across Folds, Weighted by Class Support).
| Gesture Class | Description | Precision | Recall | F1-Score |
| 0 | Hair Pulling | 0.88 | 0.87 | 0.875 |
| 2 | Skin Picking | 0.89 | 0.86 | 0.875 |
| 10 | Eating | 0.93 | 0.92 | 0.925 |
| 12 | Typing | 0.91 | 0.90 | 0.905 |
| Mean (BFRB Classes) | 0.885 | 0.865 | 0.875 | |
| Mean (Non-BFRB Classes) | 0.920 | 0.910 | 0.915 |
Table 19.
Per-Class Performance Metrics for Gesture Classification in the Inertial Motion Analyzer (IMA).
Table 19.
Per-Class Performance Metrics for Gesture Classification in the Inertial Motion Analyzer (IMA).
| Class | Type | Precision | Recall | F1-Score | Support |
| 0 | BFRB | 0.9483 | 0.9322 | 0.9402 | 59 |
| 1 | BFRB | 0.9808 | 0.8500 | 0.9107 | 60 |
| 2 | BFRB | 0.9683 | 0.8971 | 0.9313 | 68 |
| 3 | BFRB | 0.9787 | 0.8679 | 0.9200 | 53 |
| 4 | BFRB | 0.9245 | 0.9074 | 0.9159 | 54 |
| 5 | BFRB | 1.0000 | 0.9231 | 0.9600 | 52 |
| 6 | BFRB | 1.0000 | 0.9048 | 0.9500 | 63 |
| 7 | BFRB | 0.9583 | 0.9388 | 0.9485 | 49 |
| 8 | Non-BFRB | 0.8800 | 0.9778 | 0.9263 | 45 |
| 9 | Non-BFRB | 0.8551 | 0.9365 | 0.8939 | 63 |
| 10 | Non-BFRB | 0.8667 | 0.9123 | 0.8889 | 57 |
| 11 | Non-BFRB | 0.8056 | 0.9355 | 0.8657 | 62 |
| 12 | Non-BFRB | 0.7049 | 0.9773 | 0.8190 | 44 |
| 13 | Non-BFRB | 0.9804 | 0.9259 | 0.9524 | 54 |
| 14 | Non-BFRB | 0.9815 | 1.0000 | 0.9907 | 53 |
| 15 | Non-BFRB | 0.9756 | 0.9302 | 0.9524 | 43 |
| 16 | Non-BFRB | 1.0000 | 0.9851 | 0.9925 | 67 |
| 17 | Non-BFRB | 1.0000 | 0.9259 | 0.9615 | 54 |
Table 20.
Per-Class Performance Metrics for Behavioral Phase Prediction in the Inertial Motion Analyzer.
Table 20.
Per-Class Performance Metrics for Behavioral Phase Prediction in the Inertial Motion Analyzer.
| Phase | Precision | Recall | F1-Score | Support |
| Transition | 0.8721 | 0.9200 | 0.8954 | 7966 |
| Pause | 0.9458 | 0.8500 | 0.8953 | 24088 |
| Gesture | 0.7190 | 0.9001 | 0.7994 | 7946 |
| Overall Accuracy | 0.8739 | 40000 | ||
| Weighted F1-Score | 0.8763 | |||
| Mean F1-Score | 0.8634 |
Table 21.
Summary Performance Metrics for Phase Prediction Across All Validation Folds.
| Metric | Value |
| Overall Accuracy | 0.8739 |
| Weighted F1-Score | 0.8763 |
| Mean F1-Score | 0.8634 |
Table 22.
Fold-Wise Weighted F1-Score Comparison: Comprehensive Multimodal versus IMU-Only Configurations.
Table 22.
Fold-Wise Weighted F1-Score Comparison: Comprehensive Multimodal versus IMU-Only Configurations.
| Fold | Full Multimodal F1 | IMU-Only F1 | Improvement |
| 1 | 0.9123 | 0.8845 | 0.0278 |
| 2 | 0.9045 | 0.8798 | 0.0247 |
| 3 | 0.8950 | 0.8712 | 0.0238 |
| 4 | 0.9102 | 0.8824 | 0.0278 |
| 5 | 0.9056 | 0.8789 | 0.0267 |
| Mean | 0.9072 ± 0.0045 | 0.8812 ± 0.0038 | 0.0260 (3.0%) |
Disclaimer/Publisher’s Note: The statements, opinions and data contained in all publications are solely those of the individual author(s) and contributor(s) and not of MDPI and/or the editor(s). MDPI and/or the editor(s) disclaim responsibility for any injury to people or property resulting from any ideas, methods, instructions or products referred to in the content. |
© 2025 by the authors. Licensee MDPI, Basel, Switzerland. This article is an open access article distributed under the terms and conditions of the Creative Commons Attribution (CC BY) license (http://creativecommons.org/licenses/by/4.0/).
Copyright: This open access article is published under a Creative Commons CC BY 4.0 license, which permit the free download, distribution, and reuse, provided that the author and preprint are cited in any reuse.


