
Submitted:
24 December 2025
Posted:
24 December 2025
You are already at the latest version
Abstract
Introduction: In malaria-endemic regions, women remain vulnerable to malaria infection even at the time of delivery and shortly thereafter. However, the immunological mechanisms underlying this susceptibility remain poorly characterized. This exploratory study investigated whether cytokine-based immune profiles could help identify primigravid women at increased risk of malaria infection at delivery, potentially informing postpartum risk prediction. Methods: We assessed a cohort of 33 primigravid women from Nanoro, Burkina Faso (mean age 19 years; range 18–20.5), at the time of delivery. Immune profiles were developed by measuring antibody responses to Plasmodium falciparum antigens (PfCSP, PfAMA-1, and EBA-175) and levels of key cytokines (IL-4, IL-10, IL-6, TNF-α, and IFN-γ) using enzyme immunoassays. Multivariate analyses, including principal component analysis (PCA) and hierarchical clustering, were used to detect immune profile patterns. Results: Three distinct immune profiles were identified: (1) a low-inflammatory cluster with reduced IL-6 and TNF-α; (2) a TNF-α–dominant cluster; and (3) a highly pro-inflammatory cluster with elevated IL-6 and TNF-α. Bootstrapping confirmed the stability of these clusters (AU ≥ 92%). All women in the most inflammatory cluster were infected with Plasmodium falciparum at delivery (Fisher’s exact test, p = 0.04). Conclusions: Cytokine-driven immune profiles at delivery reflect biologically distinct inflammatory states among primigravidae. Elevated IL-6 and TNF-α levels were strongly associated with active malaria infection at delivery. These findings highlight the potential of cytokine-based profiling as a hypothesis-generating tool for identifying women at increased risk of malaria around childbirth.
Keywords:
postpartum malaria
; primigravidae
; cytokine profiling
; immune biomarkers
; hierarchical clustering
; TNF-α
; IL-6
; Burkina Faso
1. Introduction
Malaria remains a pressing global health concern, particularly in regions such as sub-Saharan Africa where the disease is endemic. In 2022, the World Health Organization reported approximately 249 million malaria cases and over 600,000 associated deaths, with pregnant women and children under five being the most affected [1]. Among pregnant women, primigravidae, those experiencing their first pregnancy, face increased susceptibility to malaria and its complications due to limited exposure and immunological naivety [2,3]. While malaria risk during pregnancy is well-documented, evidence suggests that vulnerability may persist into the early postpartum period, reflecting incomplete immune recovery or residual placental parasitaemia [3,4,5,6]. Primigravidae may therefore enter the postpartum period with an unbalanced immune profile that predisposes them to infection recurrence. re more susceptible to postpartum malaria due to their lack of anti-adhesion antibodies against Plasmodium falciparum and the short-lived nature of VAR2CSA-specific responses acquired during pregnancy [7,8,9]. Elevated levels of interleukin-10 (IL-10) and soluble TNF receptor II (sTNF-RII) have shown promise as diagnostic biomarkers in this group, with strong correlations to parasite density [10]. Additionally, iron biomarkers such as ferritin and soluble transferrin receptor are linked to increased malaria risk, suggesting iron status plays a modulatory role in susceptibility [11]. In recent years, immunoprofiling has emerged as a powerful tool to identify host susceptibility to infection by characterizing individual immune signatures. Studies have shown that cytokine balance and antibody responses can stratify individuals based on clinical risk, even in the absence of active infection [12,13]. Additionally, system biology approaches have demonstrated the predictive utility of such immune profiling for disease outcomes [14]. In this study, we set out to explore whether immune profiles at the time of delivery could help reveal distinct patterns among first-time mothers and offer clues about their risk of developing malaria after childbirth. Given the scarcity of data on the immunological state of women at the time of delivery, particularly in first pregnancies, this study aimed to generate exploratory evidence rather than confirmatory conclusions. We therefore used an unsupervised multivariate approach to identify cytokine- and antibody-based immune profiles that might signal increased infection risk at delivery and potentially inform future postpartum monitoring. Rather than focusing on any single marker, we looked at a combination of antibody responses to Plasmodium falciparum antigens (PfCSP, PfAMA-1, EBA-175) alongside several key cytokines (IL-4, IL-10, IL-6, TNF-α, and IFN-γ). Using principal component analysis and hierarchical clustering, our goal was to uncover broader immune signatures and understand how they might relate to malaria status at delivery [15,16].
2. Materials and Methods
2.1. Study Setting
This study was conducted in the catchment area of the Nanoro Health and Demographic Surveillance System (HDSS), located approximately 85 kilometers west of Ouagadougou, in the central-west region of Burkina Faso. The surveillance area, established and maintained by the Clinical Research Unit of Nanoro (CRUN) since 2019, includes 24 villages and monitors a population of over 63,000 inhabitants [17]. Malaria transmission in the region is highly seasonal, with peaks occurring during the rainy season from June to October, accounting for nearly 50% of all outpatient consultations during this period. Pregnant women remain particularly vulnerable, with malaria prevalence rates ranging from 24% to over 50%, depending on diagnostic methods. Younger women and those not receiving intermittent preventive treatment with sulfadoxine-pyrimethamine (IPT-SP) are at greater risk. The challenge is further exacerbated by asymptomatic infections, which complicate timely detection [18,19,20,21,22]. According to the 2023 national health report [23], IPT-SP coverage in Nanoro remains suboptimal, with only 38.3% of pregnant women completing the recommended three-dose regimen. Ongoing malaria control strategies in the area focus on increasing IPT-SP uptake and the distribution of insecticide-treated nets (ITNs) to reduce the maternal malaria burden.
2.2. Study Design and Population
This study was part of the COSMIC trial (ISRCTN37225929), which evaluated malaria prevention strategies in pregnancy [24]. The design, recruitment procedures, and characteristics of the study population have been extensively described in a previous publication [25]. Briefly, the broader study followed a cohort of thirty-three primigravid women from delivery through three months postpartum. However, the present analysis focuses exclusively on data collected at the time of delivery. This includes immunological assessments, malaria screening, and placental evaluations. All participants were recruited from the control group of the COSMIC trial (standard IPTp-SP regimen) and provided written informed consent prior to enrolment.
2.3. Sample Collection and Laboratory Procedures
Peripheral venous blood (10 mL) was drawn at each time point into heparinized tubes. Samples were processed within four hours, centrifuged at 1800 rpm for 10 min, and stored at −80 °C for subsequent cytokine analysis. Dried blood spots were collected on filter paper for DNA extraction and PCR. Hemoglobin concentration was measured using a Hemocue® Hb 301 device. Placental biopsy specimens (2 × 2 × 1 cm) were collected from the maternal-facing surface of the placenta immediately after delivery, fixed in 10% buffered formalin, and embedded in paraffin for histopathology.
2.4. Malaria Diagnosis
Malaria screening was conducted during antenatal care (ANC) visits at peripheral health facilities (Centre de Santé et de Promotion Sociale (CSPS)), in line with Burkina Faso’s NMCP guidelines, using PfHRP2-based RDTs (SD BIOLINE Malaria Ag P.f®, Standard Diagnostics Inc., Korea) and microscopy. Testing was performed only after obtaining written informed consent. Positive RDT results were defined by the presence of both control and test lines.
Blood smears were collected at enrolment, delivery, and postnatal follow-up, preferably during child vaccination visits (~6–7 days postpartum). Slides were stained with 3% Giemsa for 45 minutes, then examined independently by two blinded expert microscopists. Parasite density was calculated per 200 leukocytes (or 500 if <10 parasites), and smears were considered negative after scanning 100 high-power fields. Discrepancies were resolved by a third reader, with the final result based on the two closest counts.
2.5. PCR-Based Malaria Detection
Genomic DNA was extracted from dried blood spots (DBS) using the QIAamp DNA Mini Kit (QIAGEN, Valencia, CA, USA), following the manufacturer’s instructions. Extracted samples were stored at –20°C until further processing. To assess Plasmodium falciparum genetic diversity, we performed a nested PCR targeting the msp2 gene, using a total reaction volume of 25 µL. For the first round, 5 µL of DNA extract was used, followed by 1 µL of product in the second round with family-specific primers as previously described [26,27].
PCR amplification involved an initial denaturation at 94°C for 5 minutes, followed by 36 cycles of denaturation at 94°C for 1 minute, annealing at 58°C for 2 minutes, and extension at 72°C for 2 minutes, with a final elongation step at 72°C for 10 minutes. Amplified fragments were separated by agarose gel electrophoresis, stained with ethidium bromide, and visualized under UV light. Fragment sizes were estimated using Photo CaptMW software (v11.01).
2.6. Immunological Biomarker Quantification
2.6.1. Cytokine Quantification
Cytokine concentrations in plasma were analysed to assess the inflammatory and regulatory immune environment at delivery [28]. Blood samples were centrifuged at 1800 rpm for 10 minutes, and plasma was stored at −80 °C until analysis. ELISA kits (eBioscience, BioSource Europe, Invitrogen) validated for human cytokine detection were used. All kits were run according to manufacturer instructions. Cytokine concentrations were quantified using plates pre-coated with monoclonal antibodies specific to each cytokine. Plasma samples were thawed on ice and diluted (1:2 or 1:4) based on expected assay range. Standard curves were generated using recombinant cytokines supplied in each kit, typically ranging from 15 to 1000 pg/mL. Samples, controls, and standards were tested in duplicate. Detection was achieved using biotin-conjugated detection antibodies, followed by streptavidin-Horseradish peroxidase (HRP) and tetramethylbenzidine (TMB) substrate. Optical density was measured at 450 nm (reference 570 nm) using a Multiskan™ GO reader (Thermo Fisher Scientific). The lower limit of detection was 15 pg/mL for all cytokines.
To evaluate assay precision, inter- and intra-assay coefficients of variability (CVs) were calculated based on the standard deviation divided by the mean of measured concentrations. Inter-assay CVs assess plate-to-plate consistency using control values across multiple assays runs, while intra-assay CVs quantify variability between duplicate measurements within the same plate. CVs were computed from calculated concentrations rather than raw optical densities. Acceptable thresholds were defined as <15% for inter-assay CVs and <10% for intra-assay CVs. Elevated intra-assay CVs may indicate pipetting issues or sample viscosity challenges, which can be mitigated through proper sample preparation and pipette calibration.
2.6.2. Antibody Quantification
Plasma IgG antibody responses to three P. falciparum antigens, PfCSP (circumsporozoite protein), PfAMA-1 (apical membrane antigen 1), and EBA-175 (erythrocyte binding antigen), were measured by enzyme-linked immunosorbent assay (ELISA). These antigens were selected to represent key stages of the parasite life cycle: sporozoite (PfCSP), merozoite invasion (PfAMA-1), and erythrocyte binding (EBA-175).
High-binding 96-well ELISA plates were coated overnight at 4 °C with 1 µg/mL of each recombinant antigen in carbonate-bicarbonate buffer (pH 9.6). Plates were then blocked with 5% non-fat dry milk in PBS-Tween (0.05%) for 1 hour at room temperature. Plasma samples were diluted at 1:100 in blocking buffer and added in duplicate. Following incubation and washing, bound antibodies were detected using horseradish peroxidase-conjugated goat anti-human IgG (Life Technologies, A24470), and colour development was achieved using TMB substrate. Reactions were stopped with 1M H₂SO₄, and absorbance was read at 450 nm. A positive control (pooled plasma from hyperimmune multigravid women in Nanoro) and a negative control (plasma from malaria-naïve Caucasian donors) were included on each plate. Seropositivity was defined as any sample with an optical density (OD) value exceeding the mean + 2 standard deviations of the negative control group.
2.7. Histological Assessment of Placental Malaria
At delivery, placental biopsy samples approximately 2 × 2 × 1 cm in size were collected from the maternal surface and immediately fixed in 10% neutral buffered formalin to preserve tissue integrity. Samples were then processed and embedded in paraffin wax for histological evaluation. Thin sections were stained with hematoxylin and eosin and examined by experienced microscopists blinded to clinical outcomes. Based on standard morphological criteria described by Bulmer et al., placental malaria was classified into four categories: acute infection (presence of parasites without malaria pigment), chronic infection (parasites and pigment present), past infection (no parasites or pigment), and no infection (absence of both parasites and pigment) [29].
2.8. Data Analysis
2.8.1. Statistical Analyses
All statistical analyses were conducted using R version 4.3.1 (R Foundation for Statistical Computing) and GraphPad Prism version 9.5 (GraphPad Software, USA). Descriptive statistics were used to summarize demographic characteristics, clinical variables, and immunological biomarkers. Continuous variables were reported as means with standard deviations (SD) or medians with interquartile ranges (IQR), depending on the underlying data distribution. Categorical variables were summarized as frequencies and percentages. Given the limited sample size (n = 33), all analyses were treated as exploratory and hypothesis-generating. No multivariable modelling was applied beyond unsupervised clustering, as the aim was to describe immune heterogeneity rather than infer causality. Associations between immune profiles and malaria infection were further examined using Fisher’s exact test to assess infection distribution across clusters.
2.8.2. Principal Component Analysis (PCA)
To identify latent immune profiles, Principal Component Analysis (PCA) was performed on the complete panel of immunological biomarkers, including cytokine levels (IL-4, IL-6, IL-10, TNF-α, IFN-γ) and antibody responses (PfAMA-1, PfCSP, EBA-175). Biomarker concentrations were log-transformed where necessary to approximate normality. Hierarchical clustering was then applied to the PCA scores using Ward’s linkage method and Euclidean distance to stratify participants into immunologically distinct clusters. These clusters were interpreted as immune profiles and used for subsequent analyses.
To explore immune heterogeneity at the individual level, we created a heatmap based on scaled concentrations of eight selected immune biomarkers: PfCSP, PfAMA-1, EBA-175, IL-4, IL-10, TNF-α, IL-6, and IFN-γ. Each row represented a participant, and each column corresponded to a specific biomarker. Colour gradients reflected the relative expression levels, making it easier to visually detect patterns of immune responses across different clusters. Before visualization, all biomarker values were standardized using z-score transformation.
Associations between immune profiles and clinical characteristics including malaria infection at delivery, anaemia, number of IPTp-SP doses, season of delivery, and placental malaria were evaluated using chi-square or Fisher’s exact tests for categorical variables, and ANOVA or Kruskal–Wallis tests for continuous variables, as appropriate based on distribution. Special emphasis was placed on comparing malaria infection rates across clusters to explore potential links between immune profile and susceptibility. Given the exploratory nature of the study, no corrections for multiple comparisons were applied. Statistical significance was set at p < 0.05.
2.8.3. Cluster Stability via Bootstrapping
To test how reliable the immune profiles were after unsupervised clustering, we carried out a cluster stability assessment using non-parametric bootstrapping. We applied hierarchical clustering to scaled data from eight key immunological biomarkers: three antibody titers (PfAMA-1, PfCSP, and EBA-175) and five cytokines (IL-4, IL-6, IL-10, TNF-α, and IFN-γ). The clustering method used Ward’s linkage and Euclidean distance within a PCA-transformed feature space.
We measured cluster stability using the pvclust algorithm, which runs 1000 bootstrap resampling iterations and reports two key metrics:
- The Approximately Unbiased (AU) p-value, based on multiscale bootstrap resampling
- The Bootstrap Probability (BP), based on standard resampling
Clusters with AU p-values of 95% or higher were deemed statistically stable. This validation step ensured the internal consistency of the immune profiles identified by the clustering algorithm.
3. Results
3.1. Demographic Characteristics
A total of 33 primigravid women were enrolled, with a mean age of 19 years (SD = 1.6; range 18 - 20.5 years). Anaemia (Hb ≤ 11 g/dL) was observed in 60.6% of participants, and nearly half (48.5%) were infected with Plasmodium falciparum at delivery. Slightly more than half (51.5%) had received ≤ 2 IPTp-SP doses during their pregnancy. The mean parasite density of peripheral infection at delivery was 540.9 parasites/μL, with a wide range observed from 0 to 5584 parasites/μL. Among the 21 participants with placental samples, only 4.8% had active placental malaria, 19.1% had past infections, and 76.2% had no evidence of infection. Dystocia was observed in 18.2% of deliveries. Most deliveries (60.6%) occurred during the high-transmission season (Table 1).
3.2. Descriptive Statistics of Immunological Biomarkers Immediately After Delivery
Plasma antibody titers and cytokine concentrations varied widely across individuals (Table 2). Mean antibody levels were: PfAMA-1 (0.625 ± 0.380), EBA-175 (2.160 ± 1.164), and PfCSP (1.328 ± 0.997).
Cytokine levels showed a predominance of pro-inflammatory mediators: IL-6 (186.87 ± 328.06 pg/mL) and TNF-α (189.69 ± 270.02 pg/mL), compared with lower IFN-γ (0.035 ± 0.029 pg/mL).
3.3. Immunological Profiles of the Study Population Independently to Their Malaria Status
Principal Component Analysis (PCA) applied to the eight immunological biomarkers revealed three distinct immune clusters (Profiles 1–3) explaining 71% of total variance.
The first two principal components were primarily driven by IL-6 and TNF-α, separating pro-inflammatory and low-inflammatory individuals (Figure 1a).
Hierarchical clustering on PCA scores further confirmed three discrete immune profiles (Figure 1b):
- Cluster 1: Low-inflammatory profile: characterized by reduced IL-6 and TNF-α.
- Cluster 2: TNF-α–dominant profile: elevated TNF-α with moderate IL-6.
- Cluster 3: Highly pro-inflammatory profile: marked by simultaneous elevation of IL-6 and TNF-α.
These clusters were biologically consistent and statistically robust. Bootstrapping validation yielded AU p-values of 98%, 92%, and 96% for Clusters 1, 2, and 3, respectively, confirming strong internal stability. Cluster 3 participants demonstrated the highest IL-6 and TNF-α values (mean IL-6: 1117.6 pg/mL; TNF-α: 604.9 pg/mL), indicating a markedly pro-inflammatory immune phenotype.
The first profile primarily included individuals with low levels of IL-6 and TNF-α, indicative of a subdued pro-inflammatory response (Table 3).
The second profile consisted of individuals with elevated levels of TNF-α, suggesting a heightened pro-inflammatory state (Table 4).
The third profile mainly comprised individuals with elevated levels of both IL-6 and TNF-α, reflecting a strong pro-inflammatory response (Table 5).
3.4. Cluster Stability via Bootstrapping
Bootstrapping analysis validated the reliability of the immunological clusters identified in this study. Hierarchical clustering of PCA-transformed biomarker data revealed three distinct and statistically robust immune profiles (Figure 2): (i) Cluster 1: Low-inflammatory profile (AU = 98%, BP = 95%); (ii) Cluster 2: TNF-α–dominant profile (AU = 92%, BP = 89%); and (iii) Cluster 3: Highly pro-inflammatory profile, marked by elevated IL-6 and TNF-α levels (AU = 96%, BP = 94%)
The high support values confirm that these clusters are stable and unlikely to reflect random variation. Notably, all individuals in Cluster 3 were infected with Plasmodium falciparum at delivery and exhibited the most pronounced pro-inflammatory responses.
To further illustrate these differences, biomarker expression was visualized at the individual level using a heatmap (Figure 3). Clear cytokine-driven patterns emerged: Cluster 3 participants consistently showed elevated IL-6 and TNF-α, while Cluster 1 displayed low levels of these pro-inflammatory markers. Antibody responses, by contrast, did not distinctly separate the clusters, underscoring cytokine expression as a more reliable indicator of immune variation in this population.
3.5. Cluster Analysis According to the Malaria Status of Primigravid Women
We performed principal component analysis (PCA) on all immunological biomarkers to identify patterns and group individuals into clusters based on their immunological profiles. Subsequently, hierarchical clustering was applied to refine these groupings. Our analysis yielded three main clusters (labelled as Cluster 1, Cluster 2, and Cluster 3) as described in Table 6. Cluster 1 contained the largest number of individuals (n=23), where approximately 48% were infected with malaria at delivery, and 52% were not infected. Cluster 2 comprised 7 individuals, with 28.57% being infected and 71.43% being non-infected at delivery. Particularly, Cluster 3 consisted of 3 individuals, and all were infected at delivery, representing 100% of this cluster.
A significant association was observed between immune profile and malaria infection at delivery (Fisher’s exact test (2-sided), p = 0.04). All three participants in Cluster 3 (characterized by elevated IL-6 and TNF-α) were infected at delivery, whereas infection rates were lower in Cluster 1 (47.8%) and Cluster 2 (28.6%).
These results support the hypothesis that pro-inflammatory cytokine elevations are linked to active infection status.
4. Discussion
This exploratory immunoprofiling study identified three biologically distinct cytokine-driven immune phenotypes among primigravid women at delivery. Using principal component and clustering analyses, we observed that pro-inflammatory profiles (elevated IL-6 and TNF-α) were consistently associated with active Plasmodium falciparum infection.
These findings are hypothesis-generating and suggest that cytokine-based immune signatures, rather than antibody responses alone, may provide early immunological indicators of delivery-time malaria infection and postpartum vulnerability. These clusters demonstrated strong statistical support, with bootstrap values of 98%, 92%, and 96%, respectively indicating that the observed patterns reflect true biological variation rather than random noise.
Notably, all women in the most inflammatory group (Cluster 3) were infected at delivery, pointing to a potential link between this hyperinflammatory immune state and increased risk of postpartum malaria. This heterogeneity was further illustrated in a participant-level heatmap, where clear differences in cytokine expression patterns were observed across clusters. Together, these findings highlight the potential utility of integrated biomarker signatures, rather than relying on individual markers, to better identify women at elevated risk for malaria-related complications during the postpartum period.
The pro-inflammatory clusters we identified align with earlier work highlighting the central role of cytokines in malaria pathogenesis during pregnancy. Moormann et al. [30] demonstrated elevated TNF-α and IFN-γ levels in placental malaria cases, which were associated with intrauterine growth retardation (IUGR) and poor pregnancy outcomes. Our data refine this understanding by revealing those individuals in Cluster 3, exhibiting distinctly elevated IL-6 and TNF-α, were exclusively infected at delivery. This suggests that combined cytokine elevation may serve as a more accurate immunological signature of susceptibility than isolated markers.
Interestingly, antibody responses to Plasmodium falciparum antigens (PfCSP, PfAMA-1, EBA-175) did not differentiate between clusters, indicating that humoral immunity alone may not sufficiently capture immunological vulnerability. This observation is consistent with previous studies showing that high antibody titers do not necessarily confer clinical protection, particularly in primigravidae with limited previous exposure [14]. Thus, our findings support a growing consensus that cellular and cytokine-mediated responses may better stratify risk in endemic settings.
IL-10, an anti-inflammatory cytokine, was variably expressed across the clusters. Cluster 3 individuals showed elevated levels of both IL-10 and TNF-α, which could reflect a compensatory regulatory response to heightened inflammation. Othoro et al. [31] suggested that a low IL-10/TNF-α ratio is associated with severe malaria-related anemia. While our data did not explore this ratio explicitly, future analyses could assess whether imbalances in these cytokines modulate postpartum vulnerability and recovery.
From a methodological perspective, the application of PCA and unsupervised clustering allowed us to uncover latent immune phenotypes that traditional univariate approaches might overlook. This aligns with systems biology methodologies previously employed in vaccine research [14] and underscores the value of integrated immunoprofiling in maternal health research. Though our sample size limited the statistical power to detect associations between profiles and postpartum outcomes, the immunological signatures we uncovered lay the groundwork for predictive modelling in larger cohorts.
Given the exploratory nature and small sample size of this study, the results should be interpreted with caution. However, the identified immune signatures provide a foundation for larger longitudinal studies to assess whether cytokine profiles at delivery can predict postpartum malaria risk and guide preventive interventions.
5. Conclusions
This study reveals substantial immunological heterogeneity among primigravidae at delivery, with distinct cytokine profiles that correlate with malaria infection status. These results contribute to a nuanced understanding of postpartum malaria risk and support the development of targeted monitoring or prophylactic strategies based on immune profiling. Further longitudinal studies are reasonable to explore the prognostic potential of these immune signatures in postpartum malaria recurrence and clinical outcomes.
Author Contributions
Conceptualization and design, OT; experiments, OT and TR; formal analysis, investigation, OT and TR; resources and shared materials, HDFHS and HT; writing—original draft OT; writing—review and editing, HS, IV, MTC; project administration and funding acquisition, HDFHS and HT. All authors have read and agreed to the published version of the manuscript.
Funding
The main study to which the present one was nested received financial support from the Belgium cooperation (DGD-ITM Framework Agreement 4 – FA4 2017-2021), and from the European Union (FP7-Health-F3-305662).
Institutional Review Board Statement
The study was conducted in accordance with the Declaration of Helsinki and approved by the Institutional Ethics Committee of Centre Muraz/IRSS (Reference A007-2014/CEI-CM dated 12th February 2014).
Informed Consent Statement
Informed consent was obtained from all subjects involved in the study.
Data Availability Statement
All data generated and analysed during this study are included in this published article. Raw data supporting the findings of this study are available from the corresponding author on request.
Acknowledgments
We would like to thank pregnant women who consented at the Nanoro Health District, for their cooperation.
Conflicts of Interest
The authors declare no conflicts of interest.
Abbreviations
The following abbreviations are used in this manuscript:
| IL | Interleukin |
| TNF-α | Tumor Necrosis Factor-alpha |
| IFN-γ | Interferon-gamma |
| IPTp-SP | Intermittent Preventive Treatment in Pregnancy with Sulfadoxine–Pyrimethamine |
| PfCSP | Plasmodium falciparum Circumsporozoite Protein |
| PfAMA-1 | Plasmodium falciparum Apical Membrane Antigen 1 |
| EBA-175 | Erythrocyte Binding Antigen-175 |
| DBS | Dried Blood Spot |
| ELISA | Enzyme-Linked Immunosorbent Assay |
| PCA | Principal Component Analysis |
| HDSS | Health and Demographic Surveillance System |
| ANC | Antenatal Care |
| RDT | Rapid Diagnostic Test |
| OD | Optical Density |
| CRUN | Clinical Research Unit of Nanoro |
References
- WHO (2023) World malaria report 2023. https://www.who.int/publications/i/item/9789240086173. Accessed 28 Oct 2024.
- Desai M, Kuile FO ter, Nosten F, et al. (2007) Epidemiology and burden of malaria in pregnancy. Lancet Infect Dis 7:93–104. [CrossRef]
- Rogerson SJ, Hviid L, Duffy PE, et al. (2007) Malaria in pregnancy: pathogenesis and immunity. Lancet Infect Dis 7:105–117. [CrossRef]
- RW S, BL N, ME P, C M (2001) The burden of malaria in pregnancy in malaria-endemic areas. Am J Tropical Medicine Hyg 64:28–35. [CrossRef]
- Tomlinson A, Semblat J-P, Gamain B, Chêne A (2021) VAR2CSA-Mediated Host Defense Evasion of Plasmodium falciparum Infected Erythrocytes in Placental Malaria. Front Immunol 11:624126. [CrossRef]
- Doritchamou JY, Renn JP, Jenkins B, et al. (2022) A single full-length VAR2CSA ectodomain variant purifies broadly neutralizing antibodies against placental malaria isolates. eLife 11:e76264. [CrossRef]
- Ataíde R, Mayor A, Rogerson SJ (2014) Malaria, primigravidae, and antibodies: knowledge gained and future perspectives. Trends Parasitol 30:85–94. [CrossRef]
- Fried M, Nosten F, Brockman A, et al. (1998) Maternal antibodies block malaria. Nature 395:851–852. [CrossRef]
- Fried M, Kurtis JD, Swihart B, et al. (2018) Antibody levels to recombinant VAR2CSA domains vary with Plasmodium falciparum parasitaemia, gestational age, and gravidity, but do not predict pregnancy outcomes. Malar J 17:106. [CrossRef]
- Ruizendaal E, Schallig HDFH, Bradley J, et al. (2017) Interleukin-10 and soluble tumor necrosis factor receptor II are potential biomarkers of Plasmodium falciparum infections in pregnant women: a case-control study from Nanoro, Burkina Faso. Biomark Res 5:34. [CrossRef]
- Diallo S, Roberts SA, Gies S, et al. (2020) Malaria early in the first pregnancy: Potential impact of iron status. Clin Nutr 39:204–214. [CrossRef]
- Rénia L, Goh YS (2016) Malaria Parasites: The Great Escape. Front Immunol 7:463. [CrossRef]
- Jäschke A, Coulibaly B, Remarque EJ, et al. (2017) Merozoite Surface Protein 1 from Plasmodium falciparum Is a Major Target of Opsonizing Antibodies in Individuals with Acquired Immunity against Malaria. Clin Vaccine Immunol 24:. [CrossRef]
- Li S, Rouphael N, Duraisingham S, et al. (2014) Molecular signatures of antibody responses derived from a systems biology study of five human vaccines. Nat Immunol 15:195–204. [CrossRef]
- Jolliffe IT, Cadima J (2016) Principal component analysis: a review and recent developments. Philos Trans R Soc A: Math, Phys Eng Sci 374:20150202. [CrossRef]
- Xu R, II DW (2005) Survey of Clustering Algorithms. IEEE Trans Neural Netw 16:645–678. [CrossRef]
- Derra K, Rouamba E, Kazienga A, et al. (2012) Profile: Nanoro Health and Demographic Surveillance System. Int J Epidemiology 41:1293–1301. [CrossRef]
- Zango SH, Lingani M, Valea I, et al. (2020) Malaria and curable sexually transmitted infections in pregnant women: A two-years observational study in rural Burkina Faso. PLoS ONE 15:e0242368. [CrossRef]
- Kattenberg JH, Tahita CM, Versteeg IAJ, et al. (2012) Evaluation of Antigen Detection Tests, Microscopy, and Polymerase Chain Reaction for Diagnosis of Malaria in Peripheral Blood in Asymptomatic Pregnant Women in Nanoro, Burkina Faso. Am Soc Trop Med Hyg 87:251–256. [CrossRef]
- Fuente IM– de la, Tahita MC, Bérenger K, et al. (2024) Malaria diagnosis challenges and pfhrp2 and pfhrp3 gene deletions using pregnant women as sentinel population in Nanoro region, Burkina Faso. Pathog Glob Heal 118:481–491. [CrossRef]
- Zango SH, Lingani M, Valea I, et al. (2021) Association of malaria and curable sexually transmitted infections with pregnancy outcomes in rural Burkina Faso. BMC Pregnancy Childbirth 21:722. [CrossRef]
- Tahita MC, Tinto H, Menten J, et al. (2013) Clinical signs and symptoms cannot reliably predict Plasmodium falciparum malaria infection in pregnant women living in an area of high seasonal transmission. Malaria J 12:464–464. [CrossRef]
- MoH (2024) Ministry of Health’s 2023 Health Indicators Dashboard.
- Consortium C, Scott S, D’Alessandro U, et al. (2019) Community-based Malaria Screening and Treatment for Pregnant Women Receiving Standard Intermittent Preventive Treatment With Sulfadoxine-Pyrimethamine: A Multicenter (The Gambia, Burkina Faso, and Benin) Cluster-randomized Controlled Trial. Clin Infect Dis Official Publ Infect Dis Soc Am 68:586–596. [CrossRef]
- Ousmane T, Hermann S, Isidore Y W, et al. (2018) Naturally acquired antibody to DBL5 and ID1-ID2a dynamics in primigravid women during postpartum in a rural setting of Burkina Faso. African Journal of Immunology Research 5:453–462.
- Wooden J, Kyes S, Sibley CH (1993) PCR and strain identification in Plasmodium falciparum. Parasitol Today 9:303–305. [CrossRef]
- Singh RP, Nie X, Singh M, et al. (2002) Sodium sulphite inhibition of potato and cherry polyphenolics in nucleic acid extraction for virus detection by RT-PCR. J Virol Methods 99:123–131. [CrossRef]
- Perez-Mazliah D, Langhorne J (2015) CD4 T-Cell Subsets in Malaria: TH1/TH2 Revisited. Front Immunol 5:671. [CrossRef]
- BULMER JN, RASHEED FN, FRANCIS N, et al. (1993) Placental malaria. I. Pathological classification. Histopathology 22:211–218. [CrossRef]
- Moormann AM, Sullivan AD, Rochford RA, et al. (1999) Malaria and Pregnancy: Placental Cytokine Expression and Its Relationship to Intrauterine Growth Retardation. J Infect Dis 180:1987–1993. [CrossRef]
- Othoro C, Lal AA, Nahlen B, et al. (1999) A Low Interleukin-10 Tumor Necrosis Factor-α Ratio Is Associated with Malaria Anemia in Children Residing in a Holoendemic Malaria Region in Western Kenya. J Infect Dis 179:279–282. [CrossRef]
Figure 1.
Principal component analysis (PCA) and hierarchical clustering identified three distinct immunological profiles among participants. Panel (1a) displays the distribution of individuals across the first two principal components, highlighting variation in immunological responses. Panel (1b) shows a dendrogram generated via hierarchical clustering, illustrating relationships between individuals based on immunological similarity. These methods together facilitated the identification of meaningful patterns in high-dimensional biomarker data.
Figure 2.
Bootstrapped dendrogram of participant immune profiles. Dendrogram generated from hierarchical clustering using Ward’s linkage and Euclidean distance on PCA-transformed biomarker data (PfCSP, PfAMA-1, EBA-175, IL-4, IL-10, IL-6, TNF-α, IFN-γ). Cluster stability was assessed through 1000 bootstrap iterations using the pvclust method. Red rectangles indicate statistically supported clusters with high Approximately Unbiased (AU) p-values (Cluster 1: 98%, Cluster 2: 92%, Cluster 3: 96%). The consistent grouping of participants supports the biological robustness of the identified immune profiles.
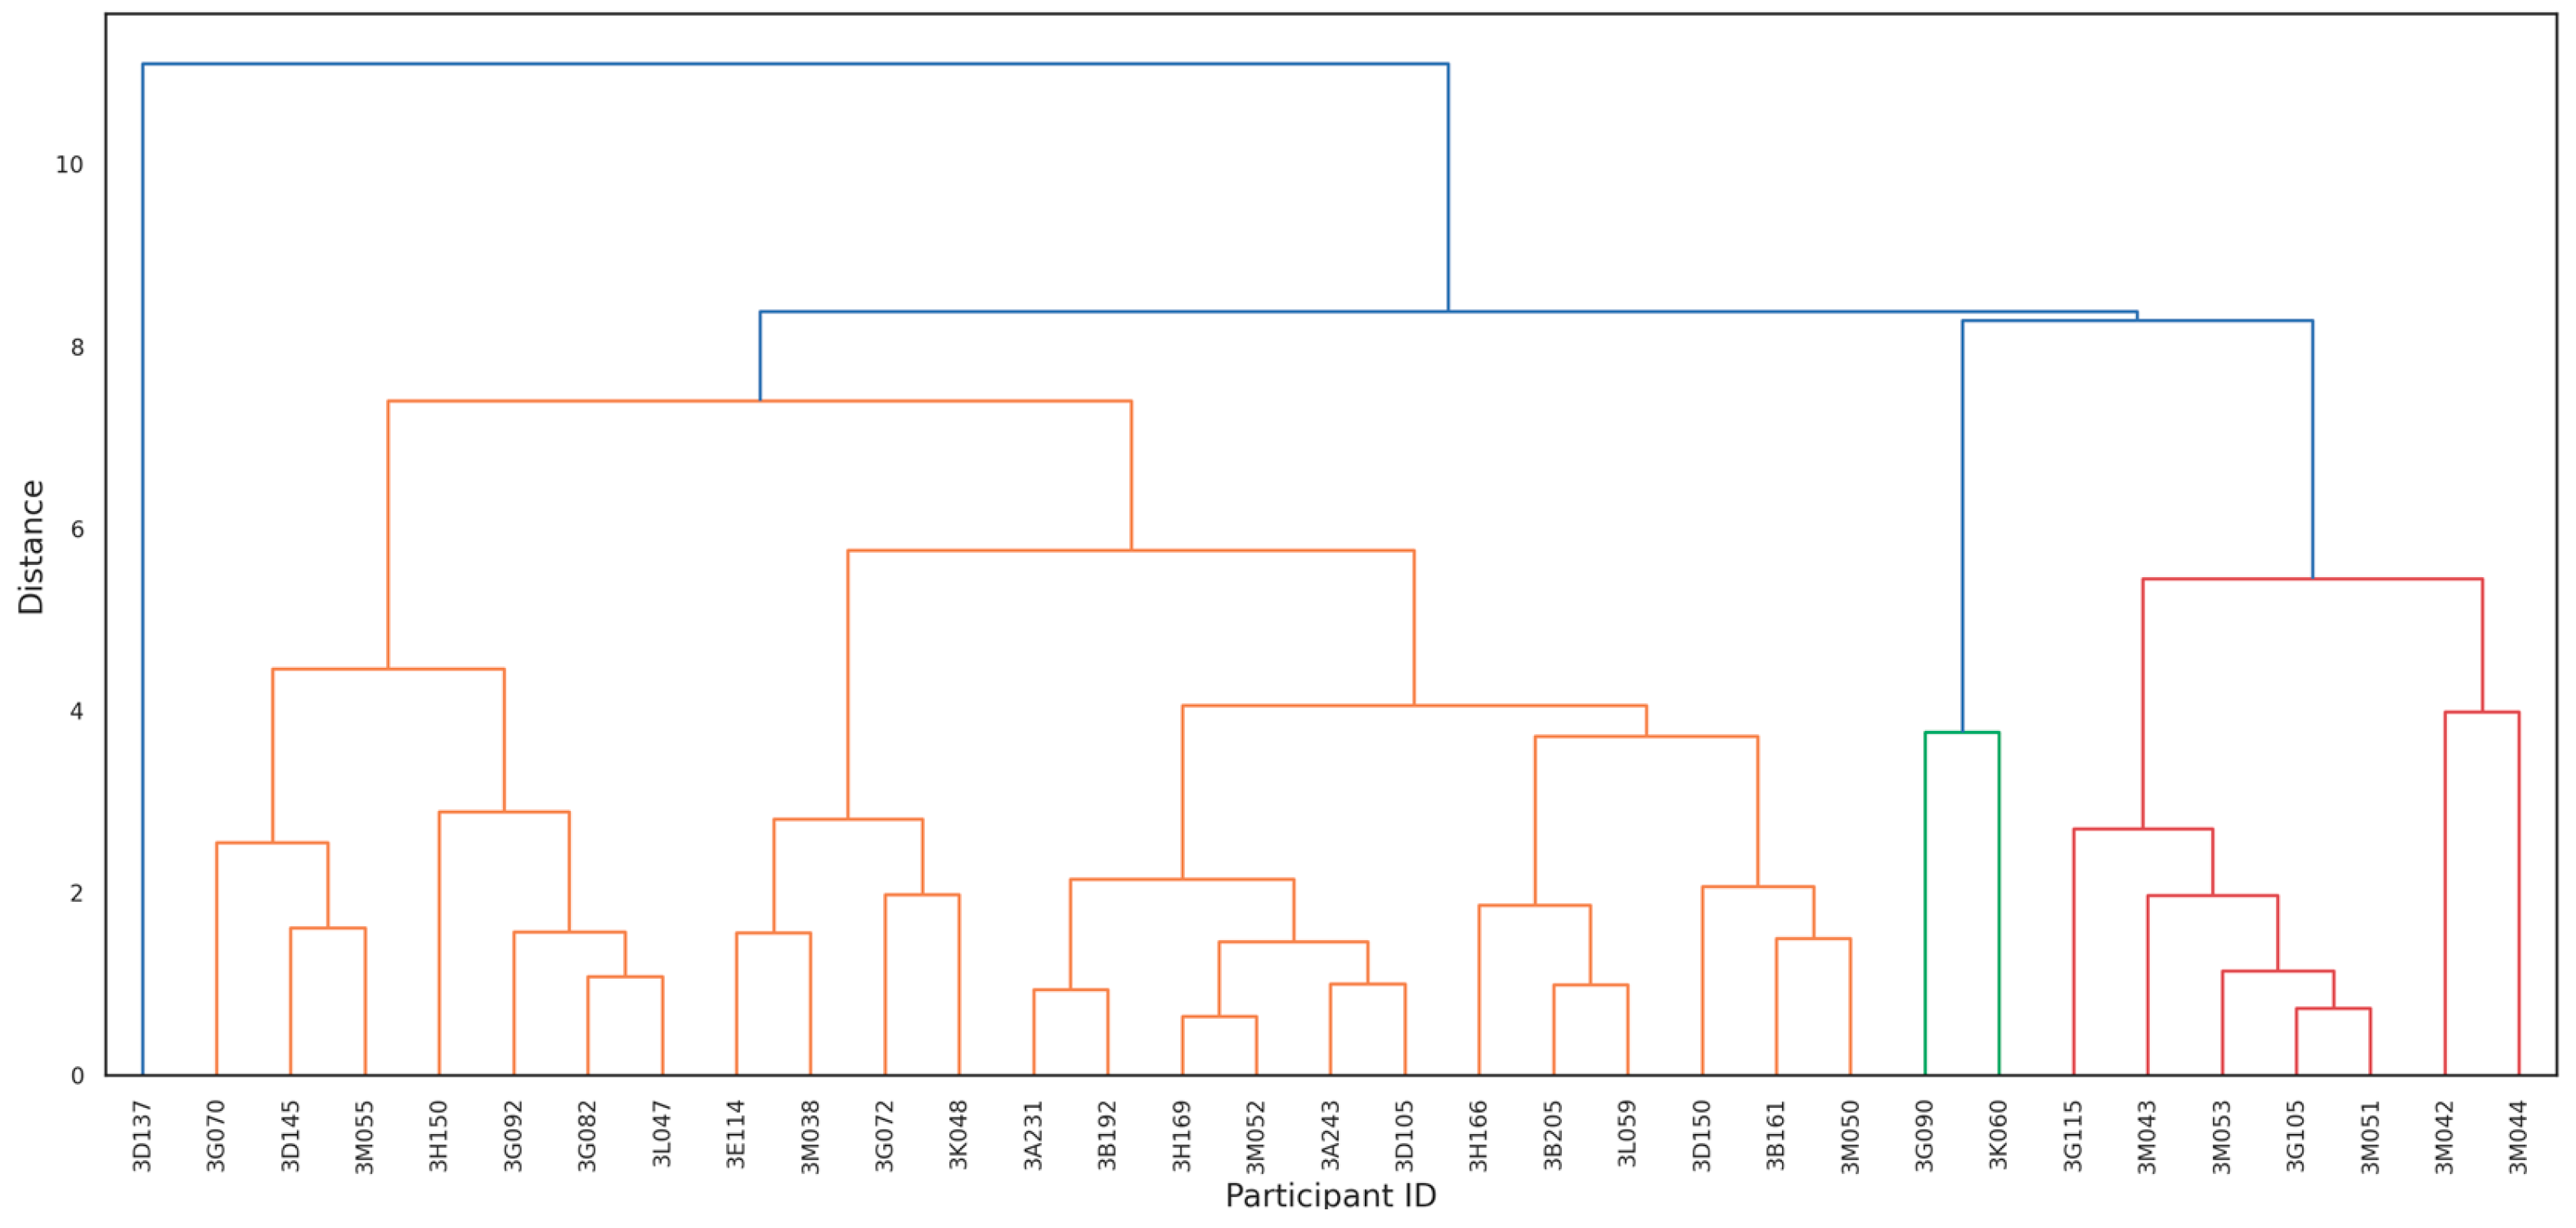
Figure 3.
Heatmap of immune biomarker expression across all study participants. Columns represent individual biomarkers (PfCSP, PfAMA-1, EBA-175, IL-4, IL-10, IL-6, TNF-α, IFN-γ), while rows represent individual participants grouped by cluster assignment. Color scale reflects standardized (z-score) expression values, with red indicating higher and blue indicating lower relative expression.
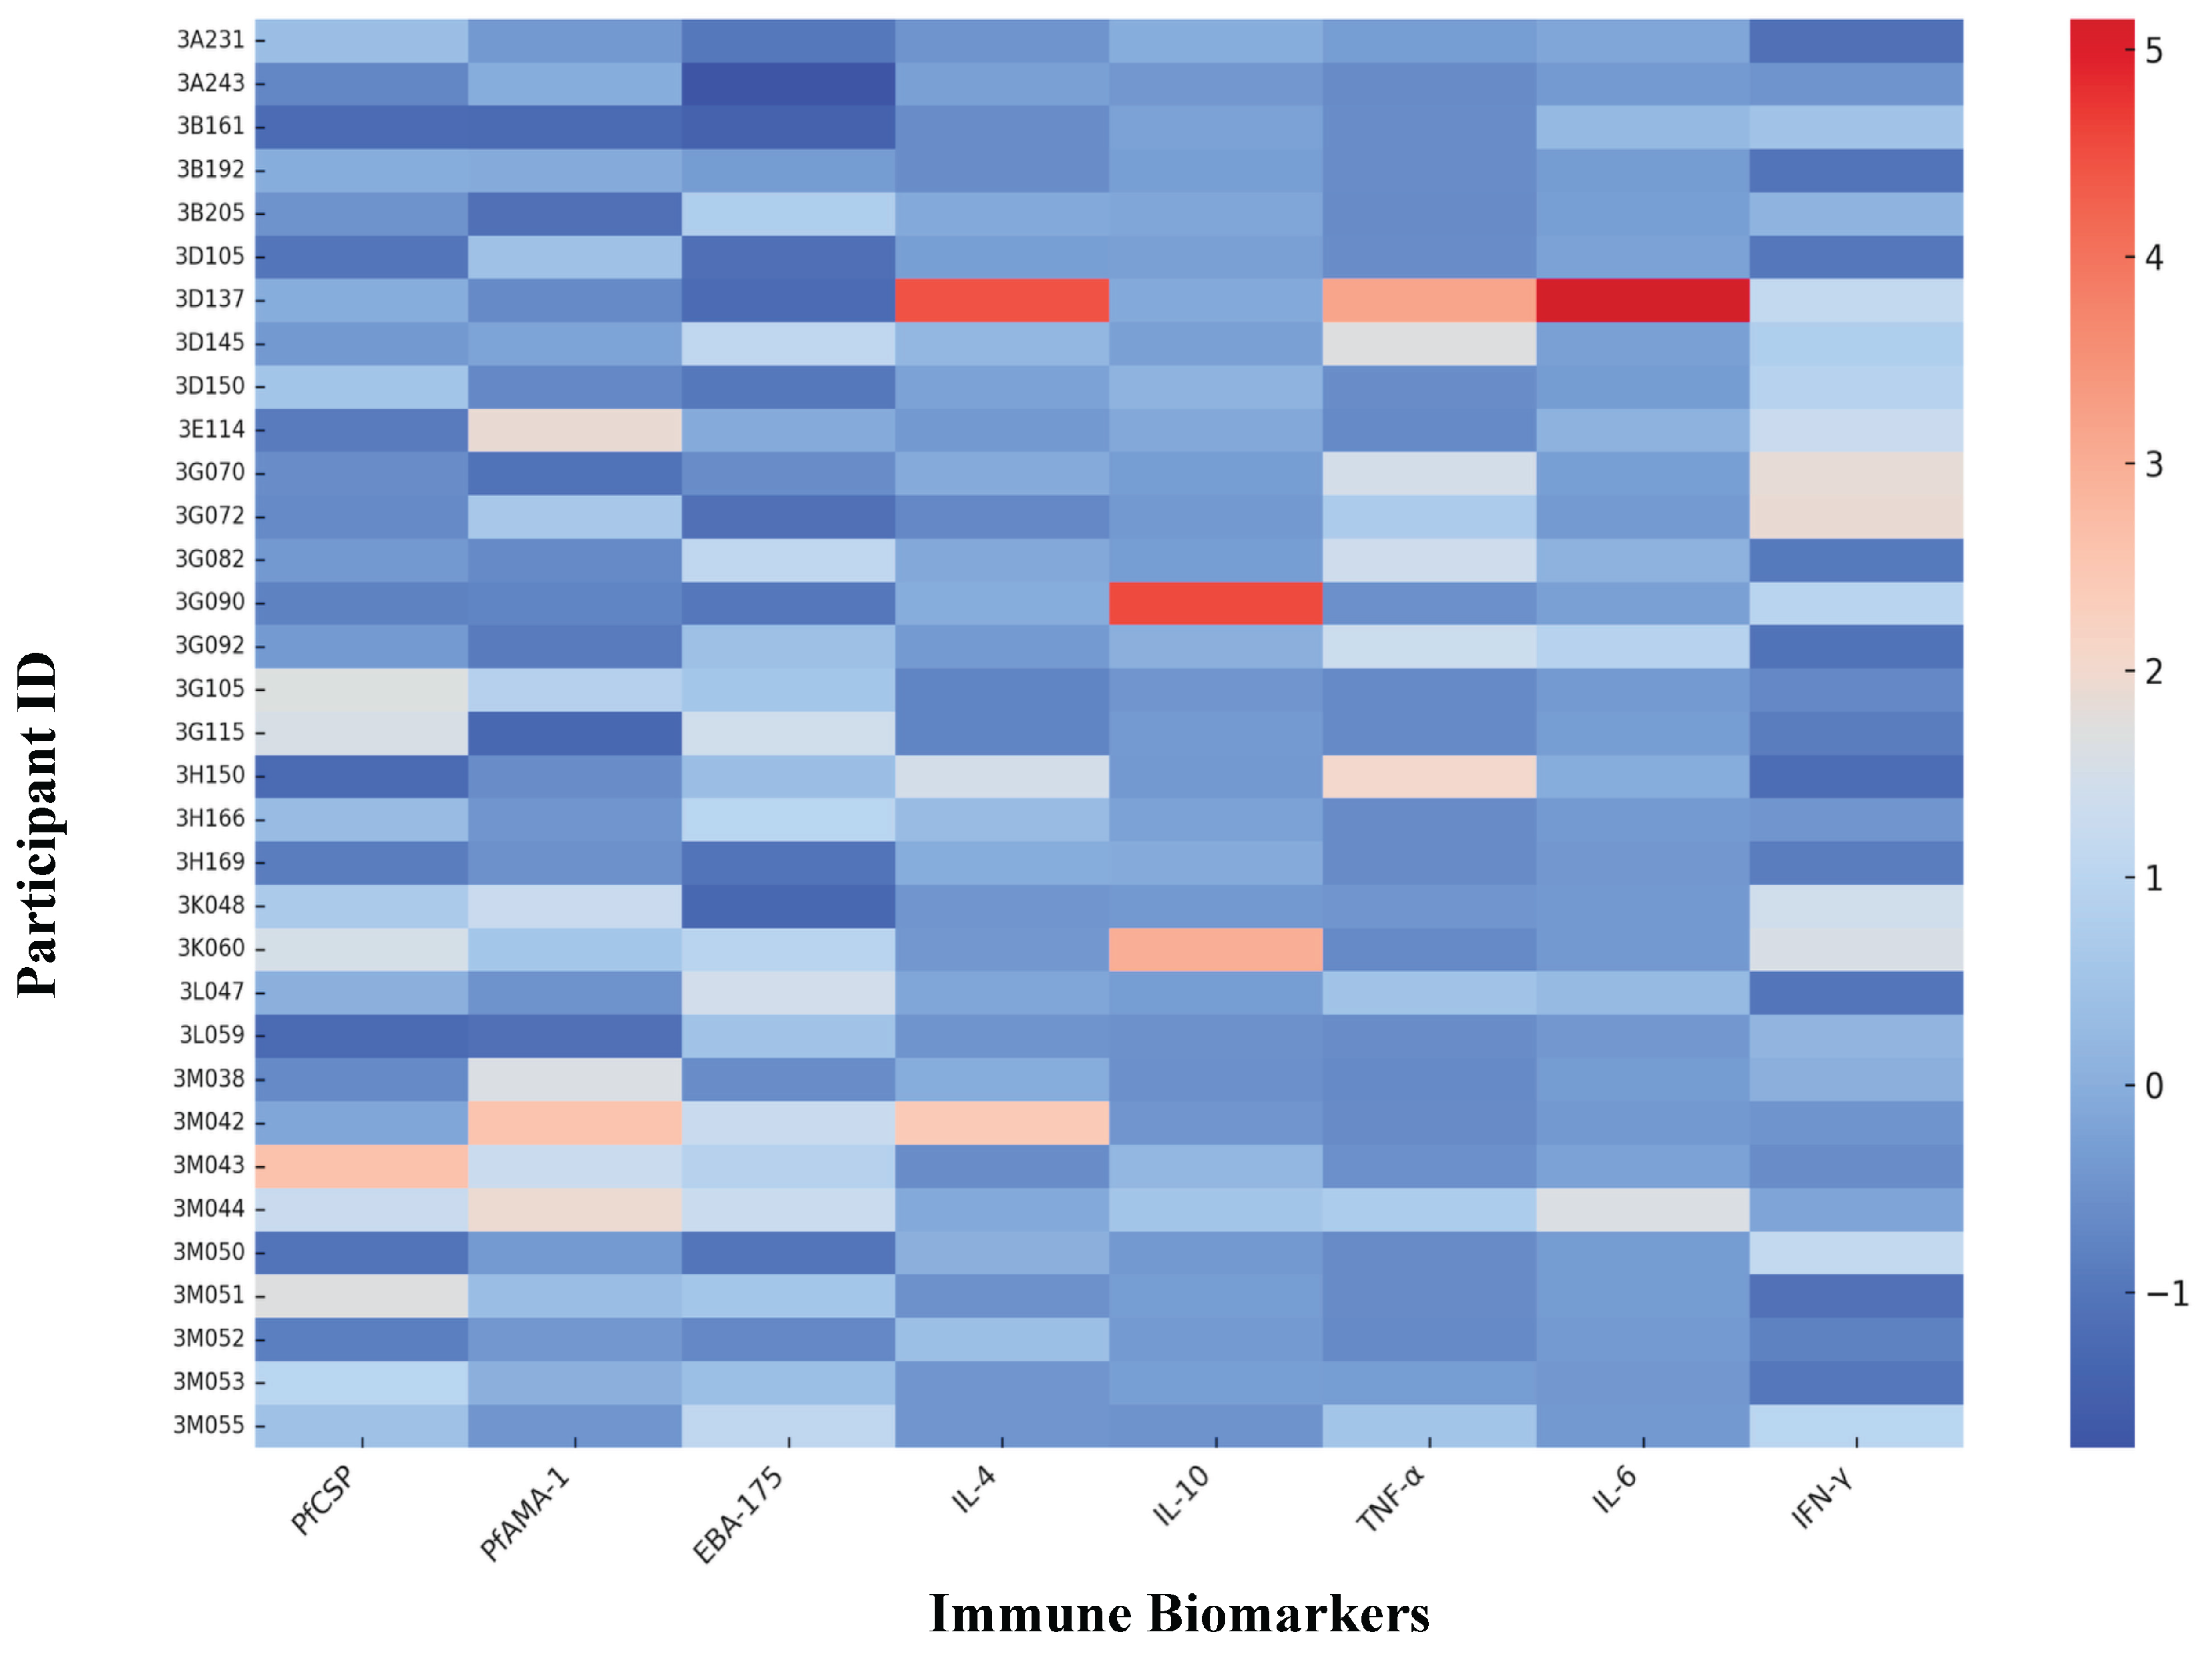

Table 1.
Summary of baseline characteristics among primigravid participants at delivery (n = 33).
| Characteristic | Value |
| Age (years), Mean ± SD | 19 ± 1.6 |
| Anaemia at delivery (Hb≤ 11g/dl), n (%) | 20 (60.6) |
| IPTp-SP doses, n (%) | |
| ≤ 2 doses | 17 (51.5) |
| > 2 doses | 16 (48.5) |
| Peripheral parasite density at delivery, Mean (min-max) | 540.9 parasites/µL (0–5584) |
| Malaria infection at delivery, n (%) | 16 (48.5) |
| Placental malaria status (N = 21), n (%) | |
| – Active | 1 (4.8) |
| – Past only | 4 (19.1) |
| – No infection | 16 (76.2) |
| Delivery conditions, n (%) | |
| Dystocia | 6 (18.2) |
| Period of delivery, n (%) | |
| High transmission season | 20 (60.6) |
| Low transmission season | 13 (39.4) |
Abbreviations: IPTp-SP, intermittent preventive treatment in pregnancy with sulfadoxine-pyrimethamine; SD, standard deviation.
Table 2.
Immunological biomarker concentrations among primigravid participants at delivery (n = 33).
Table 2.
Immunological biomarker concentrations among primigravid participants at delivery (n = 33).
| Biomarker | Mean | Std. Dev | Q1 | Median | Q3 |
| IgGT_PfAMA1 | 0.625 | 0.380 | 0.381 | 0.477 | 0.845 |
| IgGT_EBA175 | 2.160 | 1.164 | 1.043 | 2.567 | 3.292 |
| IgGT_PfCSP | 1.328 | 0.997 | 0.540 | 0.960 | 1.864 |
| IL-10 | 15.530 | 22.507 | 7.014 | 9.031 | 13.128 |
| IL-4 | 30.999 | 17.496 | 21.827 | 26.277 | 31.600 |
| IL-6 | 186.873 | 328.056 | 31.919 | 57.103 | 153.484 |
| IFN-γ | 0.035 | 0.029 | 0.009 | 0.023 | 0.063 |
| TNF-α | 189.689 | 270.024 | 10.438 | 21.656 | 364.931 |
Abbreviations: IgGT, total IgG titer; IL, interleukin; IFN-γ, interferon gamma; TNF-α, tumor necrosis factor alpha; Q1 and Q3, first and third quartiles.
Table 3.
Immunological biomarkers in the cluster 1.
| Mean | Std.Dev | Q1 | Median | Q3 | |
| IgGT_AMA1 | 0.665 | 0.399 | 0.372 | 0.595 | 0.954 |
| IgGT_EBA175 | 1.967 | 1.133 | 0.996 | 1.775 | 3.073 |
| IgGT_PfCSP | 1.411 | 1.114 | 0.473 | 1.174 | 2.318 |
| IL-10 | 17.463 | 26.550 | 6.812 | 9.155 | 13.966 |
| IL-4 | 28.171 | 14.549 | 20.440 | 23.454 | 31.600 |
| IL-6* | 75.910 | 85.140 | 27.608 | 47.585 | 95.485 |
| IFN-γ | 0.032 | 0.026 | 0.011 | 0.022 | 0.062 |
| TNF-α* | 25.439 | 30.029 | 7.838 | 15.044 | 28.751 |
*: Higher values were observed for IL-6 and TNF-α.
Table 4.
Immunological biomarkers in the cluster 2.
| Mean | Std.Dev | Q1 | Median | Q3 | |
| IgGT_AMA1 | 0.472 | 0.194 | 0.382 | 0.434 | 0.550 |
| IgGT_EBA175 | 2.712 | 1.130 | 1.458 | 3.399 | 3.415 |
| IgGT_PfCSP | 0.935 | 0.530 | 0.673 | 0.952 | 1.371 |
| IL-10 | 7.674 | 1.812 | 6.998 | 8.410 | 8.674 |
| IL-4 | 33.127 | 15.944 | 22.497 | 29.439 | 37.097 |
| IL-6 | 152.564 | 129.522 | 31.178 | 95.791 | 263.601 |
| IFN-γ | 0.045 | 0.038 | 0.007 | 0.058 | 0.087 |
| TNF-α* | 551.411 | 177.349 | 364.931 | 605.935 | 698.965 |
*: Higher value was observed for TNF-α.
Table 5.
Immunological biomarkers in the cluster 3.
| Mean | Std.Dev | Q1 | Median | Q3 | |
| IgGT_AMA1 | 0.669 | 0.582 | 0.289 | 0.380 | 1.339 |
| IgGT_EBA175 | 2.348 | 1.479 | 0.741 | 2.646 | 3.656 |
| IgGT_PfCSP | 1.606 | 0.833 | 0.960 | 1.312 | 2.546 |
| IL-10 | 19.039 | 7.862 | 13.128 | 16.029 | 27.962 |
| IL-4 | 47.721 | 35.773 | 24.123 | 30.159 | 88.881 |
| IL-6* | 1117.641 | 382.957 | 736.716 | 1113.609 | 1502.598 |
| IFN-γ | 0.035 | 0.031 | 0.005 | 0.031 | 0.068 |
| TNF-α* | 604.922 | 188.436 | 421.158 | 595.901 | 797.706 |
*: Higher values were observed for IL-6 and TNF-α.
Table 6.
Distribution of primigravida in different Clusters.
| Cluster | Malaria status | Total | ||||
| Infected | Non-Infected | |||||
| Profile 1 - (n, %) | 11 (47.83) | 12 (52.17) | 23 (69.70) | |||
| Profile 2 - (n, %) | 2 (28.57) | 5 (71.43) | 7 (21.21) | |||
| Profile 3 - (n, %) | 3 (100.00) | 0 (0.00) | 3 (9.09) | |||
| Total - (n, %) | 16 (48.48) | 17 (51.52) | 33 (100) | |||
Disclaimer/Publisher’s Note: The statements, opinions and data contained in all publications are solely those of the individual author(s) and contributor(s) and not of MDPI and/or the editor(s). MDPI and/or the editor(s) disclaim responsibility for any injury to people or property resulting from any ideas, methods, instructions or products referred to in the content. |
© 2025 by the authors. Licensee MDPI, Basel, Switzerland. This article is an open access article distributed under the terms and conditions of the Creative Commons Attribution (CC BY) license (http://creativecommons.org/licenses/by/4.0/).
Copyright: This open access article is published under a Creative Commons CC BY 4.0 license, which permit the free download, distribution, and reuse, provided that the author and preprint are cited in any reuse.


