
Submitted:
23 December 2025
Posted:
24 December 2025
You are already at the latest version
Abstract
This study evaluated the effects of ammonium sulfate [(NH₄)₂SO₄] addition and land use history on greenhouse gas emissions (CH₄, CO₂, N₂O) and inorganic nitro-gen dynamics (NH₄⁺ and NO₃⁻) in Brazilian Cerrado soils. Soil samples from native and agricultural areas (0–20 cm) were collected in four representative regions (Araras, Sorocaba, Itirapina, and Brasília) and incubated under controlled conditions, analyzed by gas chromatography and colorimetric methods. Nitrogen fertilization inhibited CH₄ consumption in both native and agricultural soils from Araras, Brasília, and Itirapina, and in Itirapina reversed the flux to emissions, likely due to microbial competition and soil texture, with CH₄ consumption positively correlated with sand content (r = 0.55). CO₂ emissions increased in native soils from Araras and Brasília but decreased in ag-ricultural Araras, suggesting that fertile, moist soils favor respiration, while higher carbon stocks stabilize emissions (r = –0.47). N₂O emissions increased in native soils, especially in Araras, Itirapina, and Sorocaba, reflecting intensified nitrification and denitrification, whereas agricultural soils responded heterogeneously. Nitrogen addi-tion reduced NO₃⁻ consumption and increased NH₄⁺ consumption, indicating enhanced oxidation and microbial assimilation. These results show that land-use history modulates soil biogeochemical responses to nitrogen, emphasizing the need for site-specific fertilization to mitigate emissions and promote agricultural sustainability in the Cerrado.
Keywords:
ammonium sulfate
; greenhouse gases
; Cerrado
; nitrification
1. Introduction
The Brazilian Cerrado occupies approximately 2 million km², representing about 23% of Brazil’s territory, and is considered one of the country’s main agricultural frontiers due to its strategic role in food production, biodiversity conservation, and the provision of ecosystem services [1,2]. Its soils, often characterized by low fertility, high acidity, and limited organic matter content, pose significant challenges to agricultural productivity, requiring intensive management practices, such as fertilization, to enable crop production [1]. Over the past five decades, the Cerrado has undergone rapid agricultural expansion, with large-scale cultivation of crops such as soybean, maize, and sugarcane, driven by the application of nitrogen and phosphorus fertilizers to address natural nutrient deficiencies [3]. While these practices have transformed the region into a global agricultural powerhouse, they have also raised concerns about environmental impacts, including greenhouse gas (GHG) emissions, soil degradation, and alterations in nutrient cycling dynamics [4]. Additionally, GHG emissions in Brazil are significantly driven by the conversion of native vegetation, primarily forests, into agricultural land, contributing to approximately 70% of total emissions, according to estimates from the most recent National Inventory of Emissions and Removals of Greenhouse Gases, based on the National Inventory Report (NIR) 2024 and detailed in the Methodological Note of the MCTI 2025 [5]. Nitrogen fertilizers are key to boosting crop yields in Cerrado agriculture and affect soil biogeochemical processes [1,6]. Nitrogen inputs stimulate microbial activities such as nitrification and denitrification, which can increase emissions of nitrous oxide (N₂O), a potent GHG with a global warming potential approximately 300 times greater than that of carbon dioxide (CO₂) [7,8]. Moreover, different land uses, such as agriculture, may contribute to methane (CH₄) emissions under anaerobic conditions, such as those caused by soil compaction, and increase CO₂ fluxes due to enhanced microbial respiration [9]. The historical use of fertilizers, or fertilization history, also shapes soil microbial communities and organic matter stocks, potentially amplifying or mitigating these effects over time [10]. In the Cerrado, where soils are highly weathered and sensitive to management changes, the interaction between current nitrogen additions and fertilization history is crucial for understanding environmental outcomes. Effective fertilizer management in the Cerrado is essential not only to optimize agricultural productivity but also to minimize ecological impacts. Poorly managed fertilization can lead to nutrient leaching, soil acidification, and increased GHG emissions, compromising the sustainability of this biome [4,6]. Conversely, the development and adoption of appropriate soil management technologies, such as fertilization strategies tailored to the specific conditions of the Cerrado, can enhance nutrient use efficiency, reduce environmental impacts, and promote sustainable intensification [1]. Given the Cerrado’s role in global carbon and nitrogen cycles, understanding how nitrogen management affects soil processes across different locations is critical for guiding agricultural policies and climate change mitigation strategies. This study investigates the effects of nitrogen addition and fertilization history on greenhouse gas emissions (CH₄, CO₂, and N₂O), nutrient consumption (NH₄⁺ and NO₃⁻), and soil pH variation in four Cerrado sites: Araras, Brasília, Sorocaba, and Itirapina. Using a double factorial experimental design, the objective is to elucidate the main effects of nitrogen addition and fertilization history, as well as their interaction, providing insights into the biogeochemical responses of Cerrado soils to agricultural management. The results contribute to the development of sustainable fertilization management strategies, balancing productivity and environmental conservation in this strategic biome.
2. Results
The fluxes of methane (CH₄), carbon dioxide (CO₂), and nitrous oxide (N₂O), as well as the consumption of nitrate (NO₃⁻) and ammonium (NH₄⁺), were evaluated under different combinations of land use (native and agricultural) and nitrogen application (with and without ammonium sulfate). Data were collected from four Cerrado sites—Araras, Sorocaba, Itirapina, and Brasília. Table 1 presents the means and standard deviations of gas emissions, soil pH, and NH₄⁺ and NO₃⁻ concentrations for each site and land use.
2.1. Effect of Ammonium Sulfate Addition on Methane (CH₄) Fluxes
In agricultural soils, CH₄ consumption decreased after ammonium sulfate addition in Araras (from -0.4 ± 0.2 to near 0 µg kg soil⁻¹ day⁻¹), Brasília (from -0.7 ± 0.1 to near 0 µg kg soil⁻¹ day⁻¹), and Itirapina, where consumption shifted to net emissions (from -0.2 ± 0.3 to +0.5 ± 0.2 µg kg soil⁻¹ day⁻¹) (Figure 1a). In Sorocaba, CH₄ fluxes remained close to neutral (0.3 ± 0.1 µg kg soil⁻¹ day⁻¹), with no significant response to fertilization.
In native soils, ammonium sulfate addition also reduced CH₄ consumption in Araras (from -23.7 ± 0.5 to -5.2 ± 0.3 µg kg soil⁻¹ day⁻¹), Brasília (from -24.0 ± 0.8 to -6.0 ± 0.4 µg kg soil⁻¹ day⁻¹), and Itirapina (from -3.4 ± 0.6 to near 0 µg kg soil⁻¹ day⁻¹) (Figure 1b). Native soils from Sorocaba showed no significant variation, maintaining fluxes near 0.2 ± 0.1 µg kg soil⁻¹ day⁻¹.
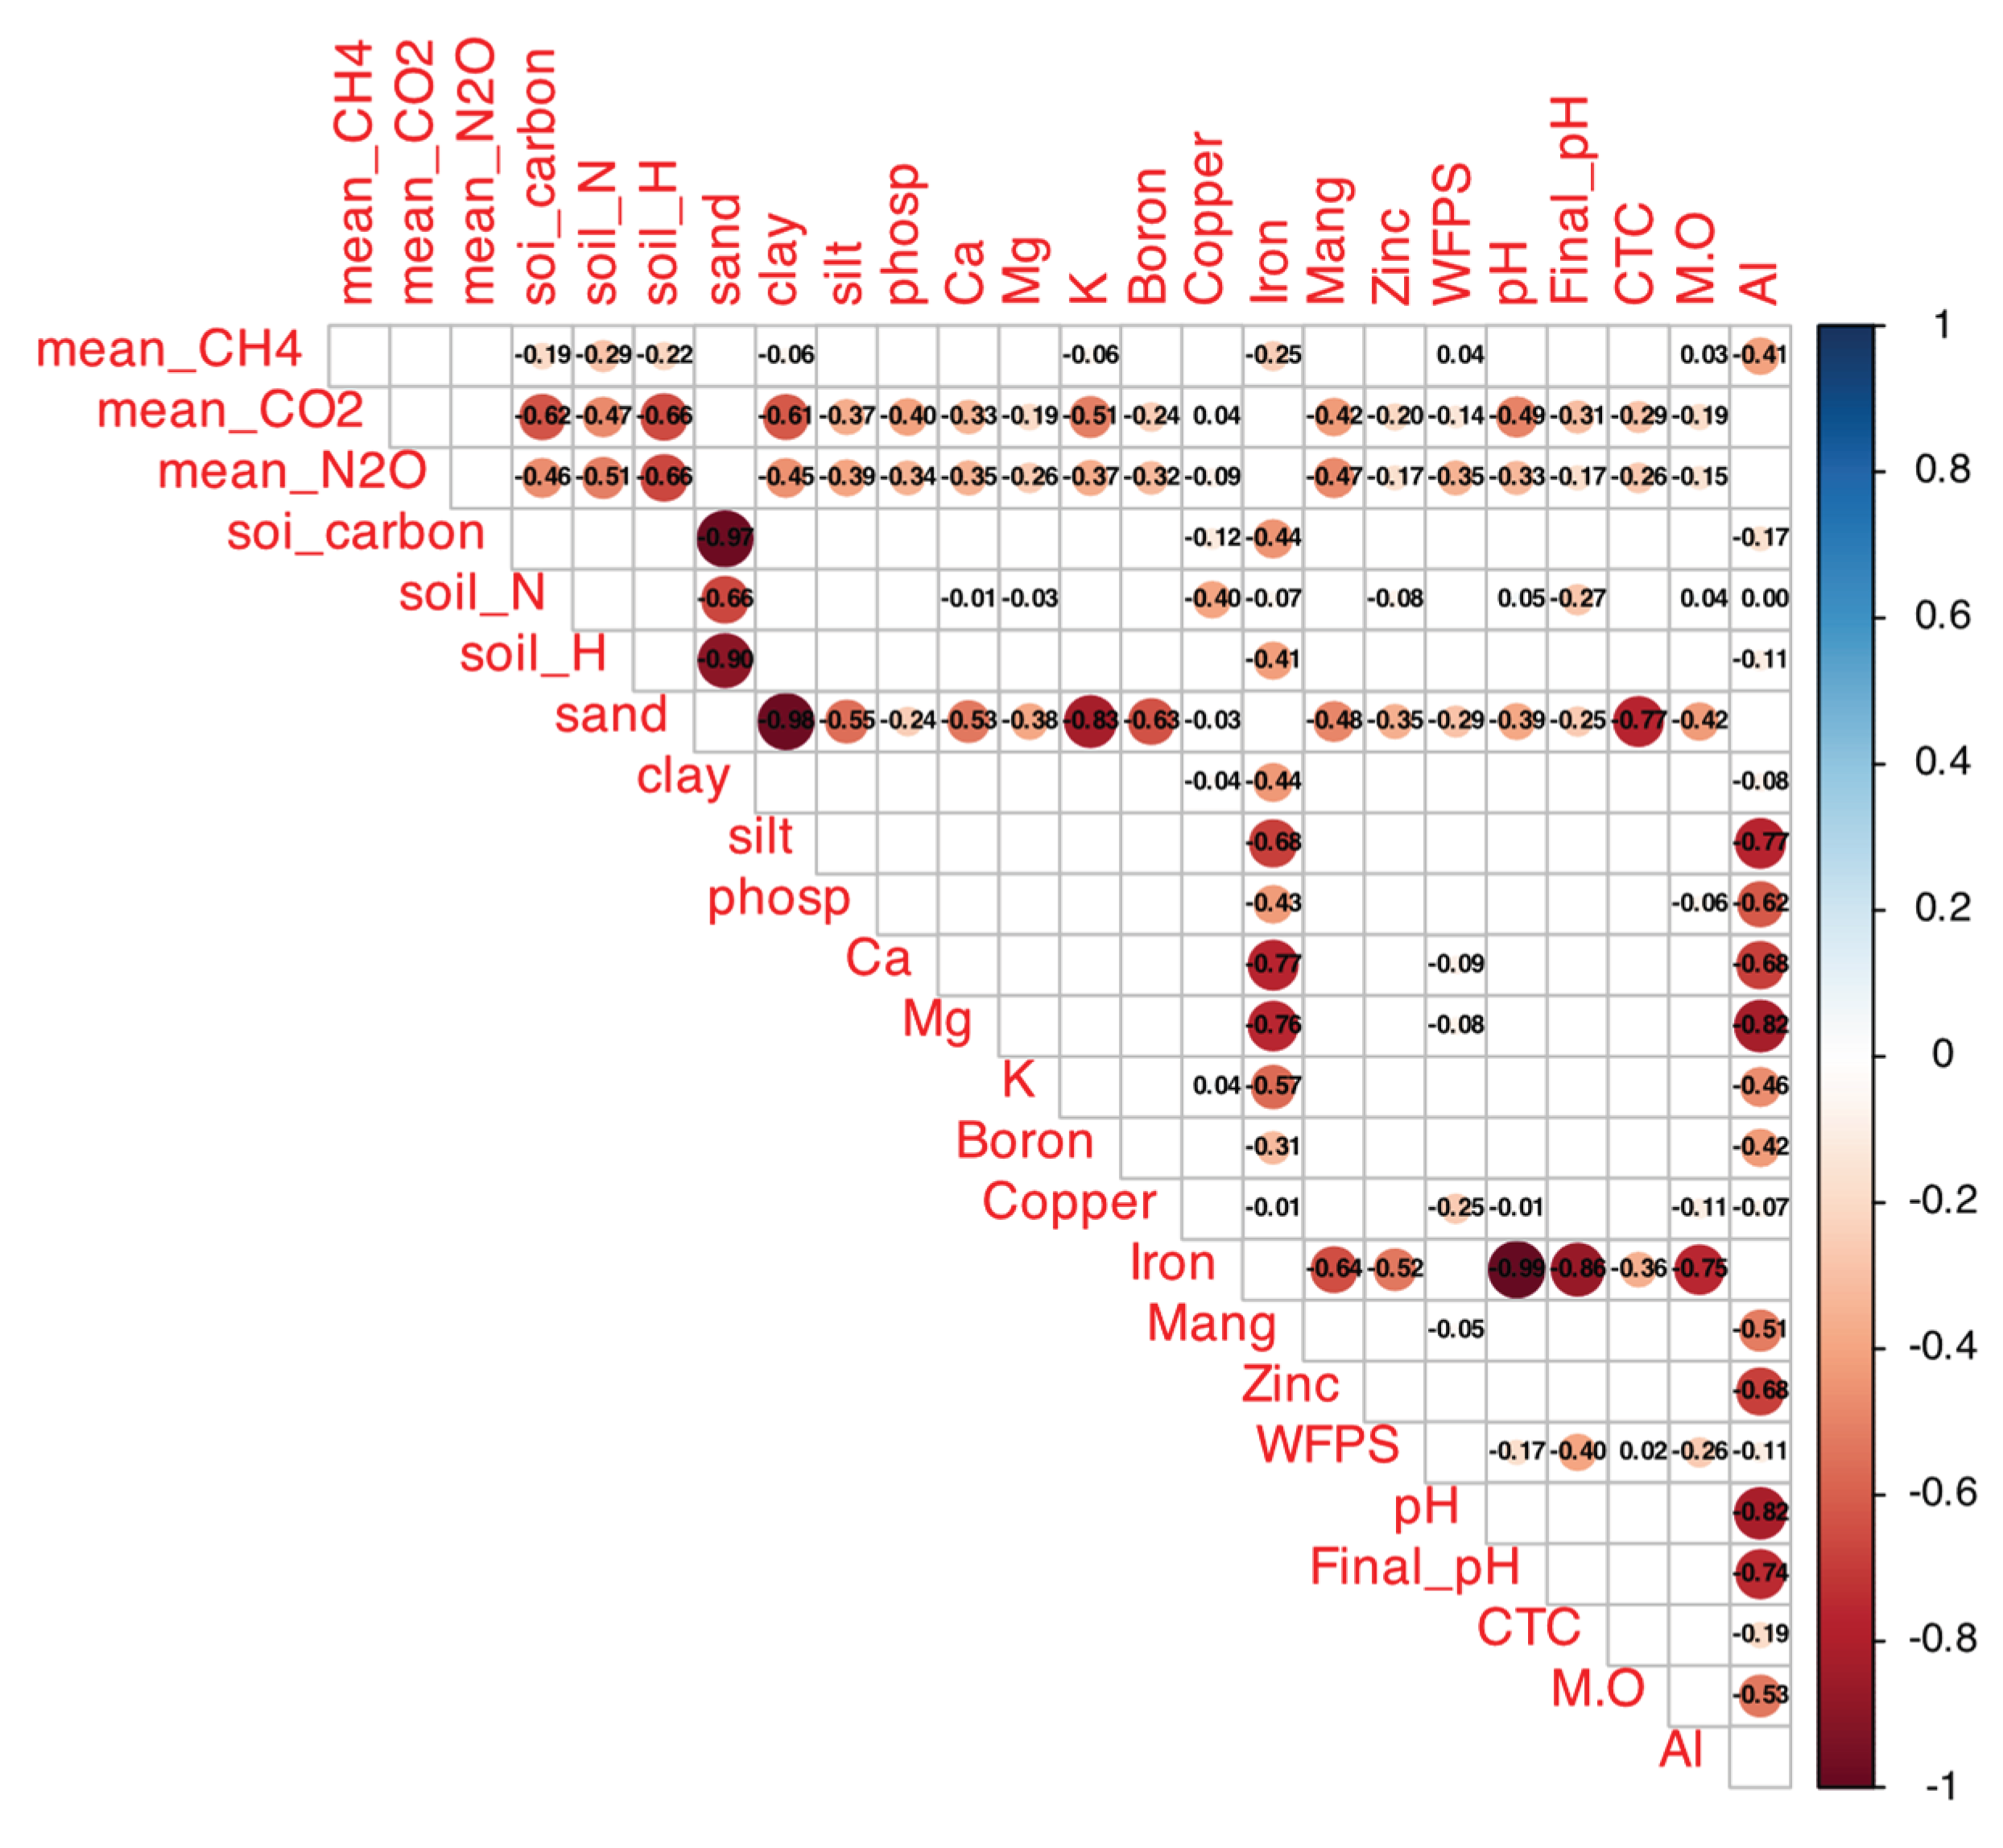
The correlation matrix (Figure S1) revealed negative correlations of CH₄ fluxes with soil carbon content (r = -0.46, p < 0.05) and total nitrogen (r = -0.47, p < 0.05), a positive correlation with sand content (r = 0.55, p < 0.05), and a negative one with clay content (r = -0.55, p < 0.05). Baseline CH₄ fluxes (Table 1) were -23.7 ± 0.5 µg kg soil⁻¹ day⁻¹ in native Araras, -24.0 ± 0.8 µg kg soil⁻¹ day⁻¹ in native Brasília, 0.2 ± 0.1 µg kg soil⁻¹ day⁻¹ in native Sorocaba, and -3.4 ± 0.6 µg kg soil⁻¹ day⁻¹ in native Itirapina.
2.2. Effect of Ammonium Sulfate Addition on Carbon Dioxide (CO₂) Fluxes
In agricultural soils, ammonium sulfate addition reduced CO₂ emissions in Araras (from 7473.04 ± 4180.79 to 5200.50 ± 3000.12 mg kg soil⁻¹ day⁻¹), increased them in Brasília (from 4084.12 ± 1013.36 to 6000.75 ± 1200.45 mg kg soil⁻¹ day⁻¹), and caused no significant changes in Itirapina (8178.47 ± 3613.80 mg kg soil⁻¹ day⁻¹) or Sorocaba (11010.61 ± 5245.86 mg kg soil⁻¹ day⁻¹) (Figure 2a).
In native soils, CO₂ emissions increased in Araras (from 4287.08 ± 1951.41 to 6500.30 ± 2100.67 mg kg soil⁻¹ day⁻¹) and Brasília (from 6358.41 ± 1478.54 to 8200.90 ± 1600.33 mg kg soil⁻¹ day⁻¹), with no significant variation in Itirapina (7428.24 ± 2490.61 mg kg soil⁻¹ day⁻¹) or Sorocaba (4547.27 ± 2580.50 mg kg soil⁻¹ day⁻¹) (Figure 2b).
According to the correlation matrix (Figure S1), CO₂ fluxes were positively correlated with total nitrogen (r = 0.66, p < 0.05) and clay content (r = 0.55, p < 0.05), and negatively correlated with sand content (r = -0.55, p < 0.05) and total carbon (r = -0.47, p < 0.05).
2.3. Effect of Ammonium Sulfate Addition on Nitrous Oxide (N₂O) Fluxes
In agricultural soils, ammonium sulfate addition reduced N₂O emissions in Araras (from 0.70 ± 1.79 to 0.10 ± 0.05 µg kg soil⁻¹ day⁻¹) and Itirapina (from 41.32 ± 80.62 to 10.50 ± 15.33 µg kg soil⁻¹ day⁻¹), increased them in Brasília (from 0.37 ± 0.38 to 1.20 ± 0.45 µg kg soil⁻¹ day⁻¹), and caused no significant changes in Sorocaba (12.92 ± 50.46 µg kg soil⁻¹ day⁻¹) (Figure 3a).
In native soils, N₂O emissions increased in Araras (from 0.42 ± 1.40 to 1.50 ± 0.60 µg kg soil⁻¹ day⁻¹), Itirapina (from 55.01 ± 51.27 to 75.20 ± 60.10 µg kg soil⁻¹ day⁻¹), and Sorocaba (from 2.68 ± 17.12 to 10.30 ± 20.05 µg kg soil⁻¹ day⁻¹), with no significant change in Brasília (2.18 ± 5.49 µg kg soil⁻¹ day⁻¹) (Figure 3b).
The correlation matrix (Figure S1) showed positive correlations of N₂O fluxes with total nitrogen (r = 0.68, p < 0.05), total carbon (r = 0.62, p < 0.05), and clay content (r = 0.51, p < 0.05), and a negative correlation with sand content (r = -0.52, p < 0.05).
2.4. Effect of Ammonium Sulfate Addition on Nitrate and Ammonium Consumption
Ammonium sulfate addition influenced NO₃⁻ and NH₄⁺ consumption patterns across sites and land uses (Figure 4 and Figure 5). Negative Δ values indicate net consumption (reduction in concentration), while near-zero or positive values indicate reduced consumption or accumulation.
In agricultural soils, NO₃⁻ consumption decreased in Araras (Δ from -15.0 ± 3.2 to -2.5 ± 1.0 mg kg⁻¹) and Brasília (Δ from -12.5 ± 2.8 to -1.8 ± 0.9 mg kg⁻¹), increased in Sorocaba (Δ from -5.0 ± 1.5 to -20.0 ± 4.0 mg kg⁻¹), and remained high in Itirapina (30.7 ± 5.2 mg kg⁻¹) (Figure 4a). NH₄⁺ consumption increased in Araras (Δ from -3.0 ± 0.8 to -10.5 ± 2.0 mg kg⁻¹) and Brasília (Δ from -4.5 ± 1.0 to -12.0 ± 2.5 mg kg⁻¹), was nearly complete in Itirapina (Δ from -1.0 ± 0.3 to -1.5 ± 0.4 mg kg⁻¹), and showed no significant change in Sorocaba (Δ -1.2 ± 0.5 mg kg⁻¹) (Figure 5a).
In native soils, NO₃⁻ consumption decreased in Araras (Δ from -10.0 ± 2.0 to -1.5 ± 0.7 mg kg⁻¹) and Brasília (Δ from -8.0 ± 1.8 to -1.0 ± 0.5 mg kg⁻¹), increased in Sorocaba (Δ from -15.0 ± 3.5 to -25.0 ± 5.0 mg kg⁻¹), and showed no significant change in Itirapina (Δ -2.0 ± 0.6 mg kg⁻¹) (Figure 4b). NH₄⁺ consumption increased in Araras (Δ from -5.0 ± 1.2 to -15.0 ± 3.0 mg kg⁻¹), Brasília (Δ from -6.0 ± 1.5 to -18.0 ± 3.5 mg kg⁻¹), Itirapina (Δ from -3.5 ± 0.9 to -10.0 ± 2.0 mg kg⁻¹), and Sorocaba (Δ from -4.0 ± 1.0 to -12.0 ± 2.5 mg kg⁻¹) (Figure 5b).
The correlation matrix (Figure S1) showed that NO₃⁻ consumption was negatively correlated with total nitrogen (r = -0.55, p < 0.05), while NH₄⁺ consumption was positively correlated with clay content (r = 0.48, p < 0.05) and negatively with sand content (r = -0.50, p < 0.05). Both nitrogen forms were positively correlated with total carbon (r = 0.45–0.50, p < 0.05).
3. Discussion
The addition of ammonium sulfate significantly influenced greenhouse gas emissions (CH₄, CO₂, N₂O) and inorganic nitrogen dynamics (NO₃⁻, NH₄⁺) in Cerrado soils, with responses varying by land use and site-specific edaphic factors such as texture, carbon, and nitrogen content [1]. The findings highlight the complex interplay between nitrogen fertilization, microbial activity, and soil properties, underscoring the need for tailored management strategies to mitigate environmental impacts and enhance agricultural sustainability in the Cerrado [6]. Below, the results are discussed in the context of prior studies, with an emphasis on novel insights into precision agriculture potential.
3.1. Effect of Ammonium Sulfate Addition on Methane (CH₄) Fluxes
The reduction in CH₄ consumption in agricultural and native soils of Araras, Brasília, and Itirapina, and the reversal to emissions in Itirapina’s agricultural soils, indicate that ammonium sulfate inhibits methanotrophic activity [11]. This aligns with Bodelier and Laanbroek’s findings that NH₄⁺ competitively inhibits methane monooxygenase (MMO), reducing CH₄ oxidation efficiency [19]. The pronounced effect in Itirapina suggests heightened sensitivity, possibly due to lower baseline methanotrophic populations or higher NH₄⁺ availability [11]. In contrast, Sorocaba’s neutral CH₄ balance, consistent with Nishisaka et al. [7], likely results from higher clay content limiting gas diffusivity, as clay-rich soils restrict O₂ and CH₄ access to methanotrophs [17,18].
The positive correlation with sand content (r = 0.55) and negative correlation with clay (r = -0.55) highlight texture’s role in facilitating CH₄ transport to oxidation zones [11,17,18]. Araras and Brasília, with sandy soils, exhibited high baseline consumption (-23.7 and -24.0 µg kg⁻¹ day⁻¹, respectively), comparable to Tate’s estimate of 8 kg C-CH₄ ha⁻¹ year⁻¹ for high-oxidation soils [13,14]. The negative correlations with soil carbon (r = -0.46) and nitrogen (r = -0.47) suggest that fertile soils support robust methanotrophic communities, but nitrogen addition disrupts this balance [11]. Carmo et al. [12] reported similar seasonal reductions in CH₄ consumption in Atlantic Forest soils with high NH₄⁺ levels (~40 mg kg⁻¹), reinforcing nitrogen’s inhibitory role [12].
An innovative perspective is the potential to use soil texture and microbial data to predict CH₄ sink capacity in Cerrado soils. By mapping sand content and methanotrophic gene abundance (e.g., pmoA), precision agriculture could identify areas where reduced nitrogen inputs or organic amendments, like sugarcane straw [16], maintain CH₄ sinks, enhancing the biome’s role in climate change mitigation.
3.2. Effect of Ammonium Sulfate Addition on Carbon Dioxide (CO₂) Fluxes
The divergent CO₂ responses—increased emissions in native Araras and Brasília soils, reduced emissions in agricultural Araras, and no significant changes in Itirapina and Sorocaba—reflect the complex interplay of nitrogen availability and carbon cycling [20]. Increased emissions in native soils align with Carmo et al.’s observations of enhanced microbial respiration in nitrogen-enriched tropical forests [12]. The reduction in agricultural Araras soils may result from nitrogen immobilization by high C:N ratio residues, as reported by Pitombo et al. in sugarcane fields [16]. Escanhoela et al. [15] noted similar suppression in organic orchards, suggesting management history influences carbon dynamics [15].
The positive correlation with total nitrogen (r = 0.66) indicates that nitrogen stimulates decomposer activity, intensifying organic matter mineralization [20]. The positive correlation with clay (r = 0.55) and negative with sand (r = -0.55) suggest clay-rich soils, with greater water retention, favor respiration [18,20]. The negative correlation with total carbon (r = -0.47) implies that carbon-rich soils have stable stocks, reducing CO₂ release, as seen in Escanhoela et al.’s low-carbon-dynamics orchards [15].
A novel insight is the opportunity to leverage soil carbon stability for carbon sequestration. By integrating texture and carbon stock data into predictive models, farmers could adjust nitrogen rates to minimize CO₂ emissions in clay-rich soils while promoting residue incorporation in sandy soils to stabilize carbon, aligning with sustainable intensification goals [6,16].
3.3. Effect of Ammonium Sulfate Addition on Nitrous Oxide (N₂O) Fluxes
The increased N₂O emissions in native soils of Araras, Itirapina, and Sorocaba, and variable responses in agricultural soils (reductions in Araras and Itirapina, increases in Brasília), highlight the sensitivity of nitrification and denitrification to nitrogen inputs [7,12]. Native soils’ strong response, especially in Itirapina, suggests high nitrifying and denitrifying gene abundance, as noted by El-Hawwary et al. [20]. The reductions in agricultural Araras and Itirapina align with Pitombo et al.’s findings that straw retention mitigates N₂O emissions by immobilizing nitrogen [16]. Brasília’s increased emissions may reflect favorable nitrification conditions, as seen in El-Hawwary et al.’s active agricultural soils [20]. Sorocaba’s moderate response in agricultural soils is consistent with Nishisaka et al.’s observations of low nitrogen dynamics due to moisture retention [7].
The positive correlations with total nitrogen (r = 0.68), carbon (r = 0.62), and clay (r = 0.51), and negative with sand (r = -0.52), indicate that fertile, clay-rich soils favor denitrification under anoxic conditions [12,16,20]. These patterns align with Carmo et al.’s reports of high emissions in moist tropical soils [12].
Innovatively, the variability in N₂O responses suggests that real-time soil moisture and texture monitoring could optimize fertilizer timing. Precision tools, such as soil sensors, could reduce N₂O emissions by applying nitrogen during drier periods in clay-rich soils, minimizing denitrification hotspots and supporting Cerrado sustainability [6].
3.4. Effect of Ammonium Sulfate Addition on Nitrate and Ammonium Consumption
The reduced NO₃⁻ consumption in Araras and Brasília (agricultural and native) and increased consumption in native Sorocaba reflect differences in nitrification saturation and microbial activity [16,21]. The high NO₃⁻ concentrations in agricultural Itirapina (30.7 mg/kg) indicate accelerated nitrification, consistent with O’Sullivan et al.’s findings in near-neutral soils [23]. Increased NH₄⁺ consumption across most sites, particularly in Araras and Brasília, suggests enhanced oxidation by ammonia-oxidizing bacteria (AOB) and archaea (AOA), as reported by Norton [22] and Leininger et al. [25]. Sorocaba’s lower NH₄⁺ response in agricultural soils may stem from sandy textures limiting retention [23].
The negative correlation between NO₃⁻ consumption and total nitrogen (r = -0.55) and positive correlations between NH₄⁺ consumption and clay (r = 0.48) and carbon (r ≈ 0.45–0.50) highlight the roles of fertility and texture in nitrogen cycling [7,16,20,21]. These align with Medeiros et al.’s observations of microbial immobilization in carbon-rich soils [21].
A novel contribution is the potential to use microbial community profiling (e.g., AOB/AOA abundance) alongside texture and pH data to predict nitrogen retention efficiency. This could inform variable-rate fertilization strategies, reducing nutrient losses and emissions while optimizing crop yields in the Cerrado [1,6].
3.5. Innovative Perspective: Precision Agriculture in the Cerrado
This study’s findings reveal that Cerrado soils’ biogeochemical responses to nitrogen fertilization are highly site-specific, driven by texture, carbon/nitrogen stocks, and microbial dynamics [1,11,16,20]. An innovative approach is to develop a precision agriculture framework integrating soil texture mapping, real-time moisture monitoring, and microbial community analysis (e.g., methanotrophic, nitrifying, and denitrifying genes) [13,19,22,25]. By combining these data with predictive models, farmers could adjust nitrogen rates and timing to minimize CH₄, CO₂, and N₂O emissions while maximizing nutrient retention. For instance, sandy soils like Araras and Brasília could use lower nitrogen doses with straw incorporation to preserve CH₄ sinks [16], while clay-rich soils like Sorocaba could benefit from sensor-based timing to avoid N₂O peaks [7,12]. This approach, grounded in the study’s edaphic variability, could position the Cerrado as a model for sustainable intensification, balancing productivity with climate change mitigation [1,6].
4. Materials and Methods
4.1. Experimental Design
Soils were collected from four Brazilian regions, encompassing Cerrado areas and transition zones between Cerrado and Atlantic Forest, organized into pairs of adjacent natural and agricultural areas (Figure 6, Figure A1, Appendix A.1) [1]. The criterion for inclusion in the experiment was that cultivated areas had a history of annual nitrogen fertilization, regardless of crop type. Four sites meeting this criterion were selected: Araras (SP), Sorocaba (SP), Itirapina (SP), and Brasília (DF), including two with perennial crops (citrus and sugarcane) and two with semi-perennial crops (sugarcane and maize/soybean rotation). The experimental design comprised four treatments: natural soil; natural soil with nitrogen addition; cultivated soil; and cultivated soil with nitrogen addition, each with eight replicates. This allowed for the evaluation of the effects of land use and nitrogen addition on CH₄, CO₂, and N₂O gas fluxes, as well as nitrate and ammonium consumption.
4.2. Soil Sampling and Processing
Soils were collected from the 0–20 cm layer in the autumn of 2016, immediately after harvest, to avoid residual fertilizer effects [1]. Approximately 10 kg of soil was collected and air-dried. After drying, the soil was sieved through a 2 mm mesh, homogenized, and analyzed for chemical attributes according to the methods of van Raij et al. [26]. For the setup of eight microcosms (four replicates, with or without nitrogen addition), 3 to 5 kg of sieved soil was required, depending on the sample’s bulk density. Inorganic nitrogen, in the forms of NO₃⁻ and NH₄⁺, was determined using colorimetric methods described by Norman et al. [27] and Krom [28]. Microcosms were set up according to Pitombo et al. [29], with pre-incubation at 40% moisture to stabilize microbial activity. In treatments with nitrogen addition, ammonium sulfate [(NH₄)₂SO₄] was applied at a rate of 100 mg N kg⁻¹ of soil, equivalent to 50 kg N ha⁻¹. After pre-incubation, soil moisture was adjusted to 45%, and artificial root exudates were added, as described by Ahmed et al. [30], to maintain the basal microbial respiration rate, used as a reference for CO₂ fluxes. Measurements of N₂O, CO₂, and CH₄ fluxes were performed using gas chromatography, with samples collected at different time intervals after microcosm closure, following the protocol described by Pitombo et al. [29]. Analyses were conducted on a Shimadzu GC 2014 chromatograph (Kyoto, Japan), calibrated daily with N₂O, CO₂, and CH₄ standards at varying concentrations. The system was equipped with a packed HayeSep™ N column (1.5 m, 80–100 mesh) for N₂O separation and a packed Shimalite™ Q column (0.5 m, 100–180 mesh) for CH₄ separation, while CO₂ was quantified by flame ionization detection. Helium and nitrogen were used as carrier gases.
4.3. Statistical Analysis
To evaluate the effects of nitrogen treatment on soil gas fluxes (CH₄, CO₂, and N₂O) and variations in ammonium (NH₄⁺) and nitrate (NO₃⁻) concentrations, non-parametric Dunn tests with Bonferroni correction were applied for multiple comparisons. This choice was justified by the lack of normality and homoscedasticity assumptions in some variables. Comparisons were conducted separately for agricultural and natural areas, considering stratification by experimental site. Results were summarized in boxplots, with adjusted significance values (p.adj) graphically overlaid on the distributions, highlighting significant differences between nitrogen treatments. Additionally, a Spearman correlation analysis was performed between physicochemical variables and gas fluxes to identify association patterns. Correlation coefficients were presented in a visual matrix (heatmap) constructed with the corrplot package, displaying only significant correlations (p < 0.05). All statistical analyses were conducted in the R environment (R Core Team, version 4.5.1) [31], using the ggplot2, ggpubr, rstatix, and corrplot packages.
5. Conclusions
The addition of ammonium sulfate [(NH₄)₂SO₄] consistently altered the dynamics of greenhouse gas emissions and inorganic nitrogen consumption in Cerrado soils, with responses modulated by land use type and local characteristics [1]. Overall, fertilization stimulated respiratory and nitrifying processes, increasing CO₂ and N₂O emissions and reducing CH₄ oxidation [7,20]. These results confirm that the conversion of native areas and the use of nitrogen fertilizers intensify greenhouse gas emissions, highlighting the need for management practices that mitigate these impacts [1,6]. Native soils showed greater sensitivity to added nitrogen, with increased consumption of NH₄⁺ and NO₃⁻ and elevated N₂O emissions, indicating that mineral nitrogen inputs can destabilize natural cycling processes [7]. In agricultural soils, responses were more moderate, with partial inhibition of CH₄ oxidation and increased CO₂ emissions, suggesting microbial adaptation to intensive management [11,20]. Differences among sites, such as the higher CH₄ oxidation capacity in the sandy soils of Araras and Brasília and the neutral balance in Sorocaba, underscore the role of edaphic factors, including texture, carbon content, and moisture, in regulating biogeochemical processes [1,11]. Collectively, the results indicate that nitrogen fertilization disrupts the balance between oxidative and reductive soil processes, causing Cerrado ecosystems to shift from acting as sinks to emitting CH₄, contributing to increased net greenhouse gas emissions and intensifying the role of these soils as sources of N₂O [7,11].
Author Contributions
Conceptualization, H.D.Q. and J.B.C.; methodology, R.H.T.; software, R.H.T.; validation, H.D.Q., R.H.T., and J.B.C.; formal analysis, H.D.Q.; investigation, H.D.Q.; resources, J.B.C.; data curation, H.D.Q.; writing—original draft preparation, H.D.Q.; writing—review and editing, R.H.T. and J.B.C.; visualization, H.D.Q. and R.H.T.; supervision, J.B.C.; project administration, J.B.C.; funding acquisition, J.B.C. All authors have read and agreed to the published version of the manuscript.
Funding
This research was funded by São Paulo Research Foundation - FAPESP, grant number 12/50694-6, Coordination for the Improvement of Higher Education Personnel - CAPES (Master’s scholarship to H.D.Q.), and National Council for Scientific and Technological Development - CNPq, Postdoctoral fellowship to Leonardo Machado Pitombo (151572/2018-6) and Productivity Grant to R.H.T. (305987/2025-9).
Institutional Review Board Statement
Not applicable.
Informed Consent Statement
Not applicable.
Data Availability Statement
Not applicable.
Acknowledgments
The authors are grateful to FAPESP (grant number 12/50694-6), CAPES for the Master’s scholarship granted to H.D.Q., and CNPq for the Postdoc scholarship granted to Leonardo Machado Pitombo (151572/2018-6) and for the Productivity Grant to R.H.T. (305987/2025-9). During the preparation of this manuscript, the authors used OpenAI’s GPT (ChatGPT) for the purposes of improving clarity, grammar, and flow of the English text in sections of the manuscript. The authors have reviewed and edited the output and take full responsibility for the content of this publication.
Conflicts of Interest
The authors declare no conflicts of interest. The funders had no role in the design of the study; in the collection, analyses, or interpretation of data; in the writing of the manuscript; or in the decision to publish the results.
Abbreviations
The following abbreviations are used in this manuscript:
| Abbreviation | Definition |
| CH₄ | Methane |
| CO₂ | Carbon Dioxide |
| N₂O | Nitrous Oxide |
| NH₄⁺ | Ammonium |
| NO₃⁻ | Nitrate |
| GHG | Greenhouse Gas |
| FAPESP | São Paulo Research Foundation |
| CAPES | Coordination for the Improvement of Higher Education Personnel |
| CNPq | National Council for Scientific and Technological Development |
| AOB | Ammonia-Oxidizing Bacteria |
| AOA | Ammonia-Oxidizing Archaea |
| MMO | Methane Monooxygenase |
Appendix A
Appendix A.1
Figure A1.
Spearman correlation matrix between mean GHG fluxes (CH₄, CO₂, N₂O) and soil attributes (total C, total N, sand, clay, silt, P, Ca, Mg, K, B, Cu, Fe, Mn, Zn, WFP, initial/final pH, CEC, TOC, OM, Al) in native and agricultural soils from Cerrado sites. Colors indicate r values (blue: positive, up to 1; red: negative, down to -1); filled cells indicate p < 0.05 (empty: not significant). Generated with corrplot (R v4.5.1), data aggregated across treatments.
References
- Lopes, A. S.; Guimarães Guilherme, L. R. A career perspective on soil management in the Cerrado region of Brazil. Adv. Agron. 2016, 137, 1–72. [Google Scholar] [CrossRef]
- Sano, E. E.; Rodrigues, A. A.; Martins, E. S.; Bettiol, G. M.; Bustamante, M. M. C.; Bezerra, A. S.; Bolfe, E. L. Cerrado ecoregions: A spatial framework to assess and prioritize Brazilian savanna environmental diversity for conservation. J. Environ. Manag. 2019, 232, 818–828. [Google Scholar] [CrossRef] [PubMed]
- Nascimento, A. F. D.; Rodrigues, R. D. A. R.; Silveira, J. G. D.; Silva, J. J. N. D.; Daniel, V. D. C.; Segatto, E. R. Nitrous oxide emissions from a tropical Oxisol under monocultures and an integrated system in the Southern Amazon–Brazil. Rev. Bras. Cienc. Solo 2020, 44, e0190123. [Google Scholar] [CrossRef]
- Gomes, L.; Simões, S. J.; Dalla Nora, E. L.; de Sousa-Neto, E. R.; Forti, M. C.; Ometto, J. P. H. Agricultural expansion in the Brazilian Cerrado: Increased soil and nutrient losses and decreased agricultural productivity. Land 2019, 8, 12. [Google Scholar] [CrossRef]
- Ministério da Ciência; Tecnologia e Inovação [MCTI. Nota metodológica: Desagregação das estimativas de emissões e remoções do inventário nacional de gases de efeito estufa por unidade federativa (1990 a 2022) . Ministério da Ciência, Tecnologia e Inovação, Brasília. 2025. Available online: https://www.gov.br/mcti (accessed on 20 October 2025).
- Gomes, L. C.; Bianchi, F. J. J. A.; Cardoso, I. M.; Fernandes, R. B. A.; Filho, E. I. F.; Schulte, R. P. O. Agroforestry systems can mitigate greenhouse gas emissions in the Brazilian Cerrado. Agrofor. Syst. 2019, 93, 1447–1459. [Google Scholar] [CrossRef]
- Nishisaka, C. S.; Youngerman, C.; Meredith, L. K.; do Carmo, J. B.; Navarrete, A. A. Differences in N₂O fluxes and denitrification gene abundance in the wet and dry seasons through soil and plant residue characteristics of tropical tree crops. Front. Environ. Sci. 2019, 7, 11. [Google Scholar] [CrossRef]
- IPCC. Climate change 2021: The physical science basis. Contribution of Working Group I to the sixth assessment report of the Intergovernmental Panel on Climate Change; Cambridge University Press, 2021. [Google Scholar]
- Siqueira Neto, M.; Piccolo, M. D. C.; Costa Junior, C.; Cerri, C. C.; Bernoux, M. Emissão de gases do efeito estufa em diferentes usos da terra no bioma Cerrado. Rev. Bras. Cienc. Solo 2011, 35, 63–76. [Google Scholar] [CrossRef]
- Bodelier, P. L. E.; Pérez, G.; Veraart, A. J.; Krause, S. Methanotroph ecology, environmental distribution and functioning. In Methanotrophs: Microbiology fundamentals and biotechnological applications;Microbiology Monographs; Lee, E. Y., Ed.; Springer: Cham, Switzerland, 2019; Vol. 32, pp. 1–38. [Google Scholar] [CrossRef]
- Bodelier, P. L. E.; Laanbroek, H. J. Nitrogen as a regulatory factor of methane oxidation in soils and sediments. FEMS Microbiol. Ecol. 2004, 47, 265–277. [Google Scholar] [CrossRef]
- do Carmo, J. B.; Sousa Neto, E. R.; Duarte-Neto, P. J.; Ometto, J. P. H. B.; Martinelli, L. A. Conversion of the coastal Atlantic forest to pasture: Consequences for the nitrogen cycle and soil greenhouse gas emissions. Agric. Ecosyst. Environ. 2012, 148, 37–43. [Google Scholar] [CrossRef]
- Tate, K. R. Soil methane oxidation and land-use change: From process to mitigation. Soil Biol. Biochem. 2015, 80, 260–272. [Google Scholar] [CrossRef]
- Price, S. J.; Sherlock, R. R.; Kelliher, F. M.; McSeveny, T. M.; Tate, K. R.; Condron, L. M. Pristine New Zealand forest soil is a strong methane sink. Glob. Chang. Biol. 2004, 10, 16–26. [Google Scholar] [CrossRef]
- Escanhoela, A. S. B.; Pitombo, L. M.; Brandani, C. B.; Navarrete, A. A.; Bento, C. B.; do Carmo, J. B. Organic management increases soil nitrogen but not carbon content in a tropical citrus orchard with pronounced N₂O emissions. J. Environ. Manag. 2019, 234, 13–20. [Google Scholar] [CrossRef]
- Pitombo, L. M.; Cantarella, H.; Packer, A. P. C.; Ramos, J. C.; Carmo, J. B. Straw preservation reduced total N₂O emissions from a sugarcane field. Soil Use Manag. 2017, 33, 583–594. [Google Scholar] [CrossRef]
- Hütsch, B. W. Tillage and land use effects on methane oxidation rates and their vertical profiles in soil. Biol. Fertil. Soils 1998, 27, 284–292. [Google Scholar] [CrossRef]
- Ball, B. C.; Smith, K. A.; Klemedtsson, L.; Brumme, R.; Sitaula, B. K.; Hansen, S.; Priemé, A.; MacDonald, J.; Horgan, G. W. The influence of soil gas transport properties on methane oxidation in soil. J. Environ. Qual. 1997, 26, 135–141. [Google Scholar] [CrossRef]
- Bodelier, P. L. E.; Laanbroek, H. J. Nitrogen as a regulatory factor of methane oxidation in soils and sediments. FEMS Microbiol. Ecol. 2004, 47, 265–277. [Google Scholar] [CrossRef] [PubMed]
- El-Hawwary, A.; Brenzinger, K.; Lee, H. J.; Dannenmann, M.; Ho, A. Greenhouse gas (CO₂, CH₄, and N₂O) emissions after abandonment of agriculture. Biol. Fertil. Soils 2022, 58, 579–591. [Google Scholar] [CrossRef]
- Medeiros, E.; Cerri, C. E. P.; Cherubin, M. R.; Maia, S. M. F. Greenhouse gas emissions and carbon stock in agricultural soils of the Cerrado biome under different management systems. Soil Use Manag. 2021, 37, 739–750. [Google Scholar] [CrossRef]
- Norton, J. M. Nitrification in agricultural soils. In Nitrogen in agricultural systems; Schepers, J. S., Raun, W. R., Eds.; American Society of Agronomy, Crop Science Society of America, Soil Science Society of America: Madison, WI, USA, 2008; pp. 173–199. [Google Scholar] [CrossRef]
- O’Sullivan, C. A.; Wakelin, S. A.; Tillman, R. W. Nitrogen cycling in grazed pastures at elevated CO₂: N₂O emissions and soil N dynamics. Nutr. Cycl. Agroecosyst 2022, 122, 149–165. [Google Scholar] [CrossRef]
- Qiao, C.; Liu, L.; Hu, S.; Compton, J. E.; Greaver, T. L.; Li, Q. Soil nitrogen cycling following repeated nitrogen fertilizer application in a tropical wet forest. Glob. Biogeochem. Cycles 2018, 32, 1230–1243. [Google Scholar] [CrossRef]
- Leininger, S.; Urich, T.; Schloter, M.; Schwark, L.; Qi, J.; Nicol, G. W.; Prosser, J. I.; Schuster, S. C.; Schleper, C. Archaea predominate among ammonia-oxidizing prokaryotes in soils. Nature 2006, 442, 806–809. [Google Scholar] [CrossRef]
- van Raij, B.; Andrade, J. C.; Cantarella, H.; Quaggio, J. A. Análise química para avaliação da fertilidade de solos tropicais; Instituto Agronômico: Campinas, Brazil, 2001. [Google Scholar]
- Norman, R. J.; Edberg, J. C.; Stucki, J. W. Determination of nitrate in soil extracts by dual-wavelength ultraviolet spectrophotometry. Soil Sci. Soc. Am. J. 1985, 49, 1182–1185. [Google Scholar] [CrossRef]
- Krom, M. D. Spectrophotometric determination of ammonia: A study of a modified Berthelot reaction using salicylate and dichloroisocyanurate. Analyst 1980, 105, 305–316. [Google Scholar] [CrossRef]
- Pitombo, L. M.; Ramos, J. C.; Quevedo, H. D.; do Carmo, K. P.; Paiva, J. M. F.; Pereira, E. A.; do Carmo, J. B. Methodology for soil respirometric assays: Step by step and guidelines to measure fluxes of trace gases using microcosms. MethodsX 2018, 5, 1083–1092. [Google Scholar] [CrossRef] [PubMed]
- Ahmed, M. A.; Banfield, M.; Sanaullah, M.; Van Zwieten, L.; Carminati, A. Root Exudates Induce Soil Macroaggregation Facilitated by Fungi in Subsoil. Front. Environ. Sci. 2018, 6, 140. [Google Scholar] [CrossRef]
- R Core Team. R: A Language and Environment for Statistical Computing; R Foundation for Statistical Computing: Vienna, Austria, 2025; Available online: https://www.R-project.org/.
Figure 1.
Methane (CH₄) fluxes in agricultural (a) and natural (b) soils from four Cerrado sites (Araras, Brasília, Itirapina, Sorocaba) in response to ammonium sulfate [(NH₄)₂SO₄] addition. Boxplots represent mean values (box) and confidence intervals (lines), with points indicating outliers. “no” indicates the absence of nitrogen, and “yes” indicates nitrogen addition. Values are expressed in µg CH₄ m⁻² h⁻¹, with scales adjusted for agricultural (a) and natural (b) soils. Significant differences (p < 0.05) between treatments are indicated by asterisks (*).
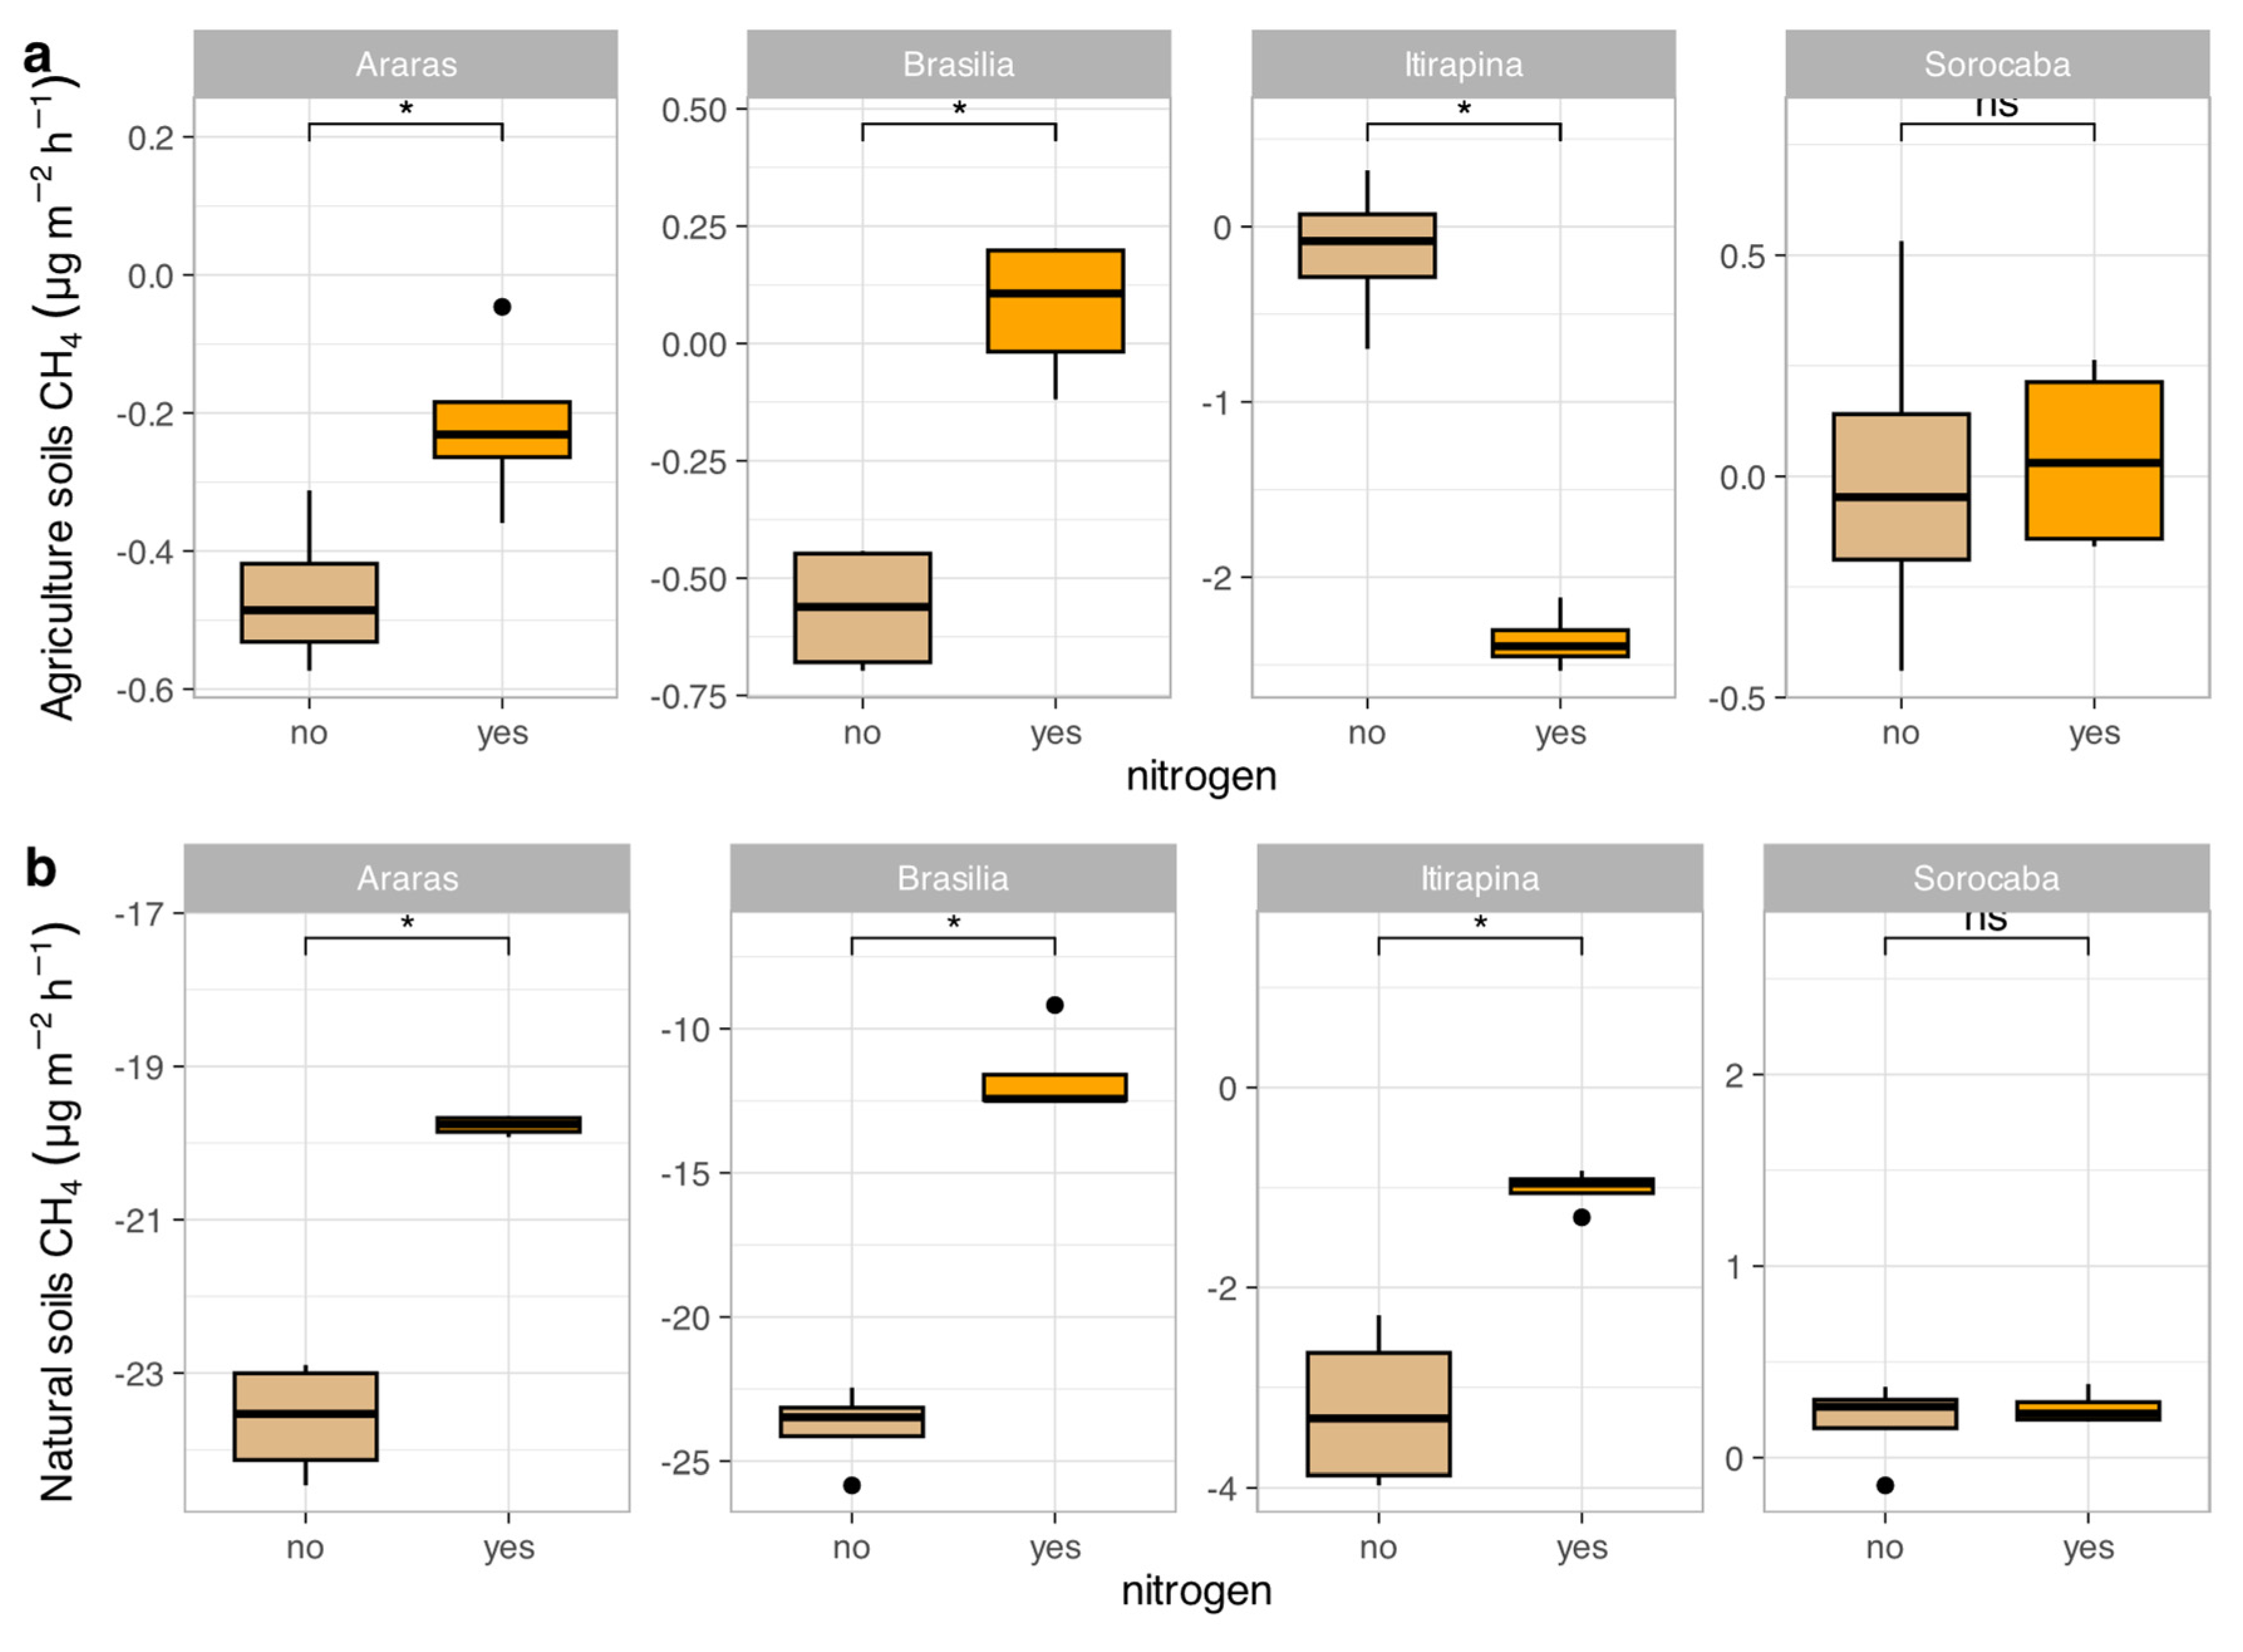
Figure 2.
Carbon dioxide (CO₂) fluxes in agricultural (a) and natural (b) soils from four Cerrado sites (Araras, Brasília, Itirapina, Sorocaba) in response to ammonium sulfate [(NH₄)₂SO₄] addition. Boxplots represent mean values (box) and confidence intervals (lines), with points indicating outliers. “no” indicates the absence of nitrogen, and “yes” indicates nitrogen addition. Values are expressed in µg CO₂ m⁻² h⁻¹, with scales adjusted for agricultural (a) and natural (b) soils. Significant differences (p < 0.05) between treatments are indicated by asterisks (*), while “ns” denotes no significant difference.
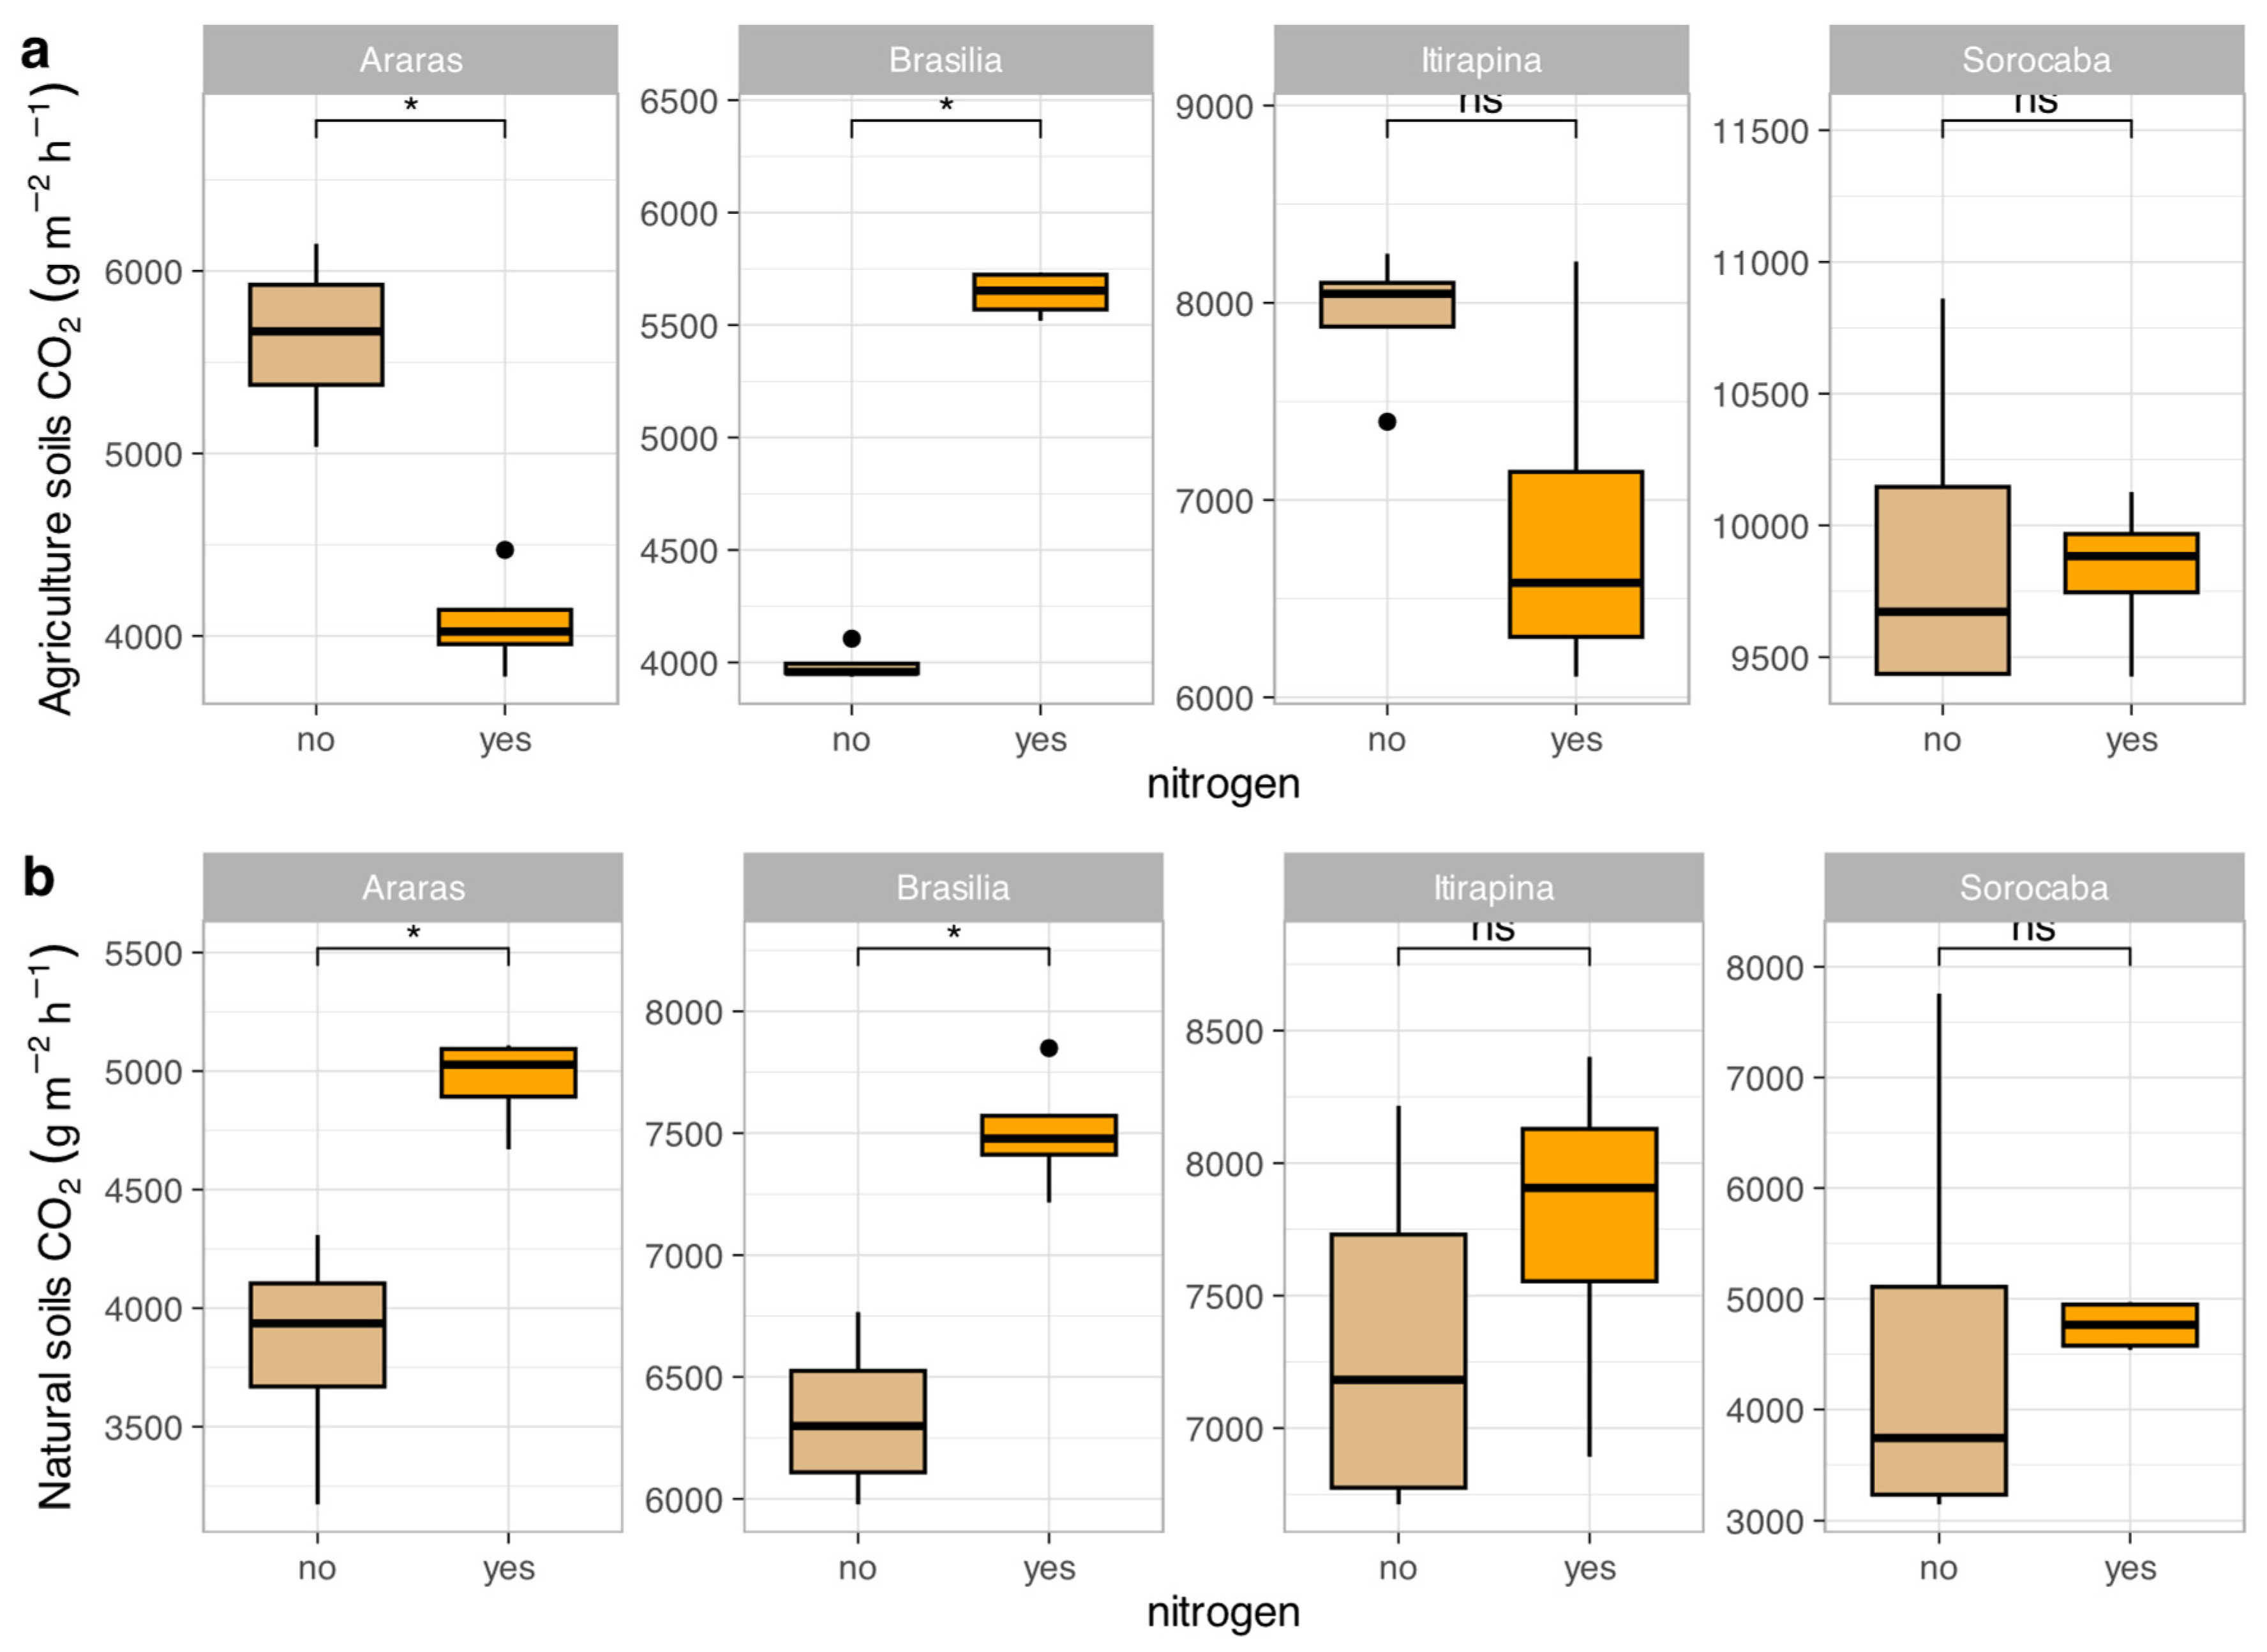
Figure 3.
Nitrous oxide (N₂O) fluxes in agricultural (a) and natural (b) soils from four Cerrado sites (Araras, Brasília, Itirapina, Sorocaba) in response to ammonium sulfate [(NH₄)₂SO₄] addition. Boxplots represent mean values (box) and confidence intervals (lines), with points indicating outliers. “no” indicates the absence of nitrogen, and “yes” indicates nitrogen addition. Values are expressed in µg N₂O m⁻² h⁻¹, with scales adjusted for agricultural (a) and natural (b) soils. Significant differences (p < 0.05) between treatments are indicated by asterisks (*), while “ns” denotes no significant difference.
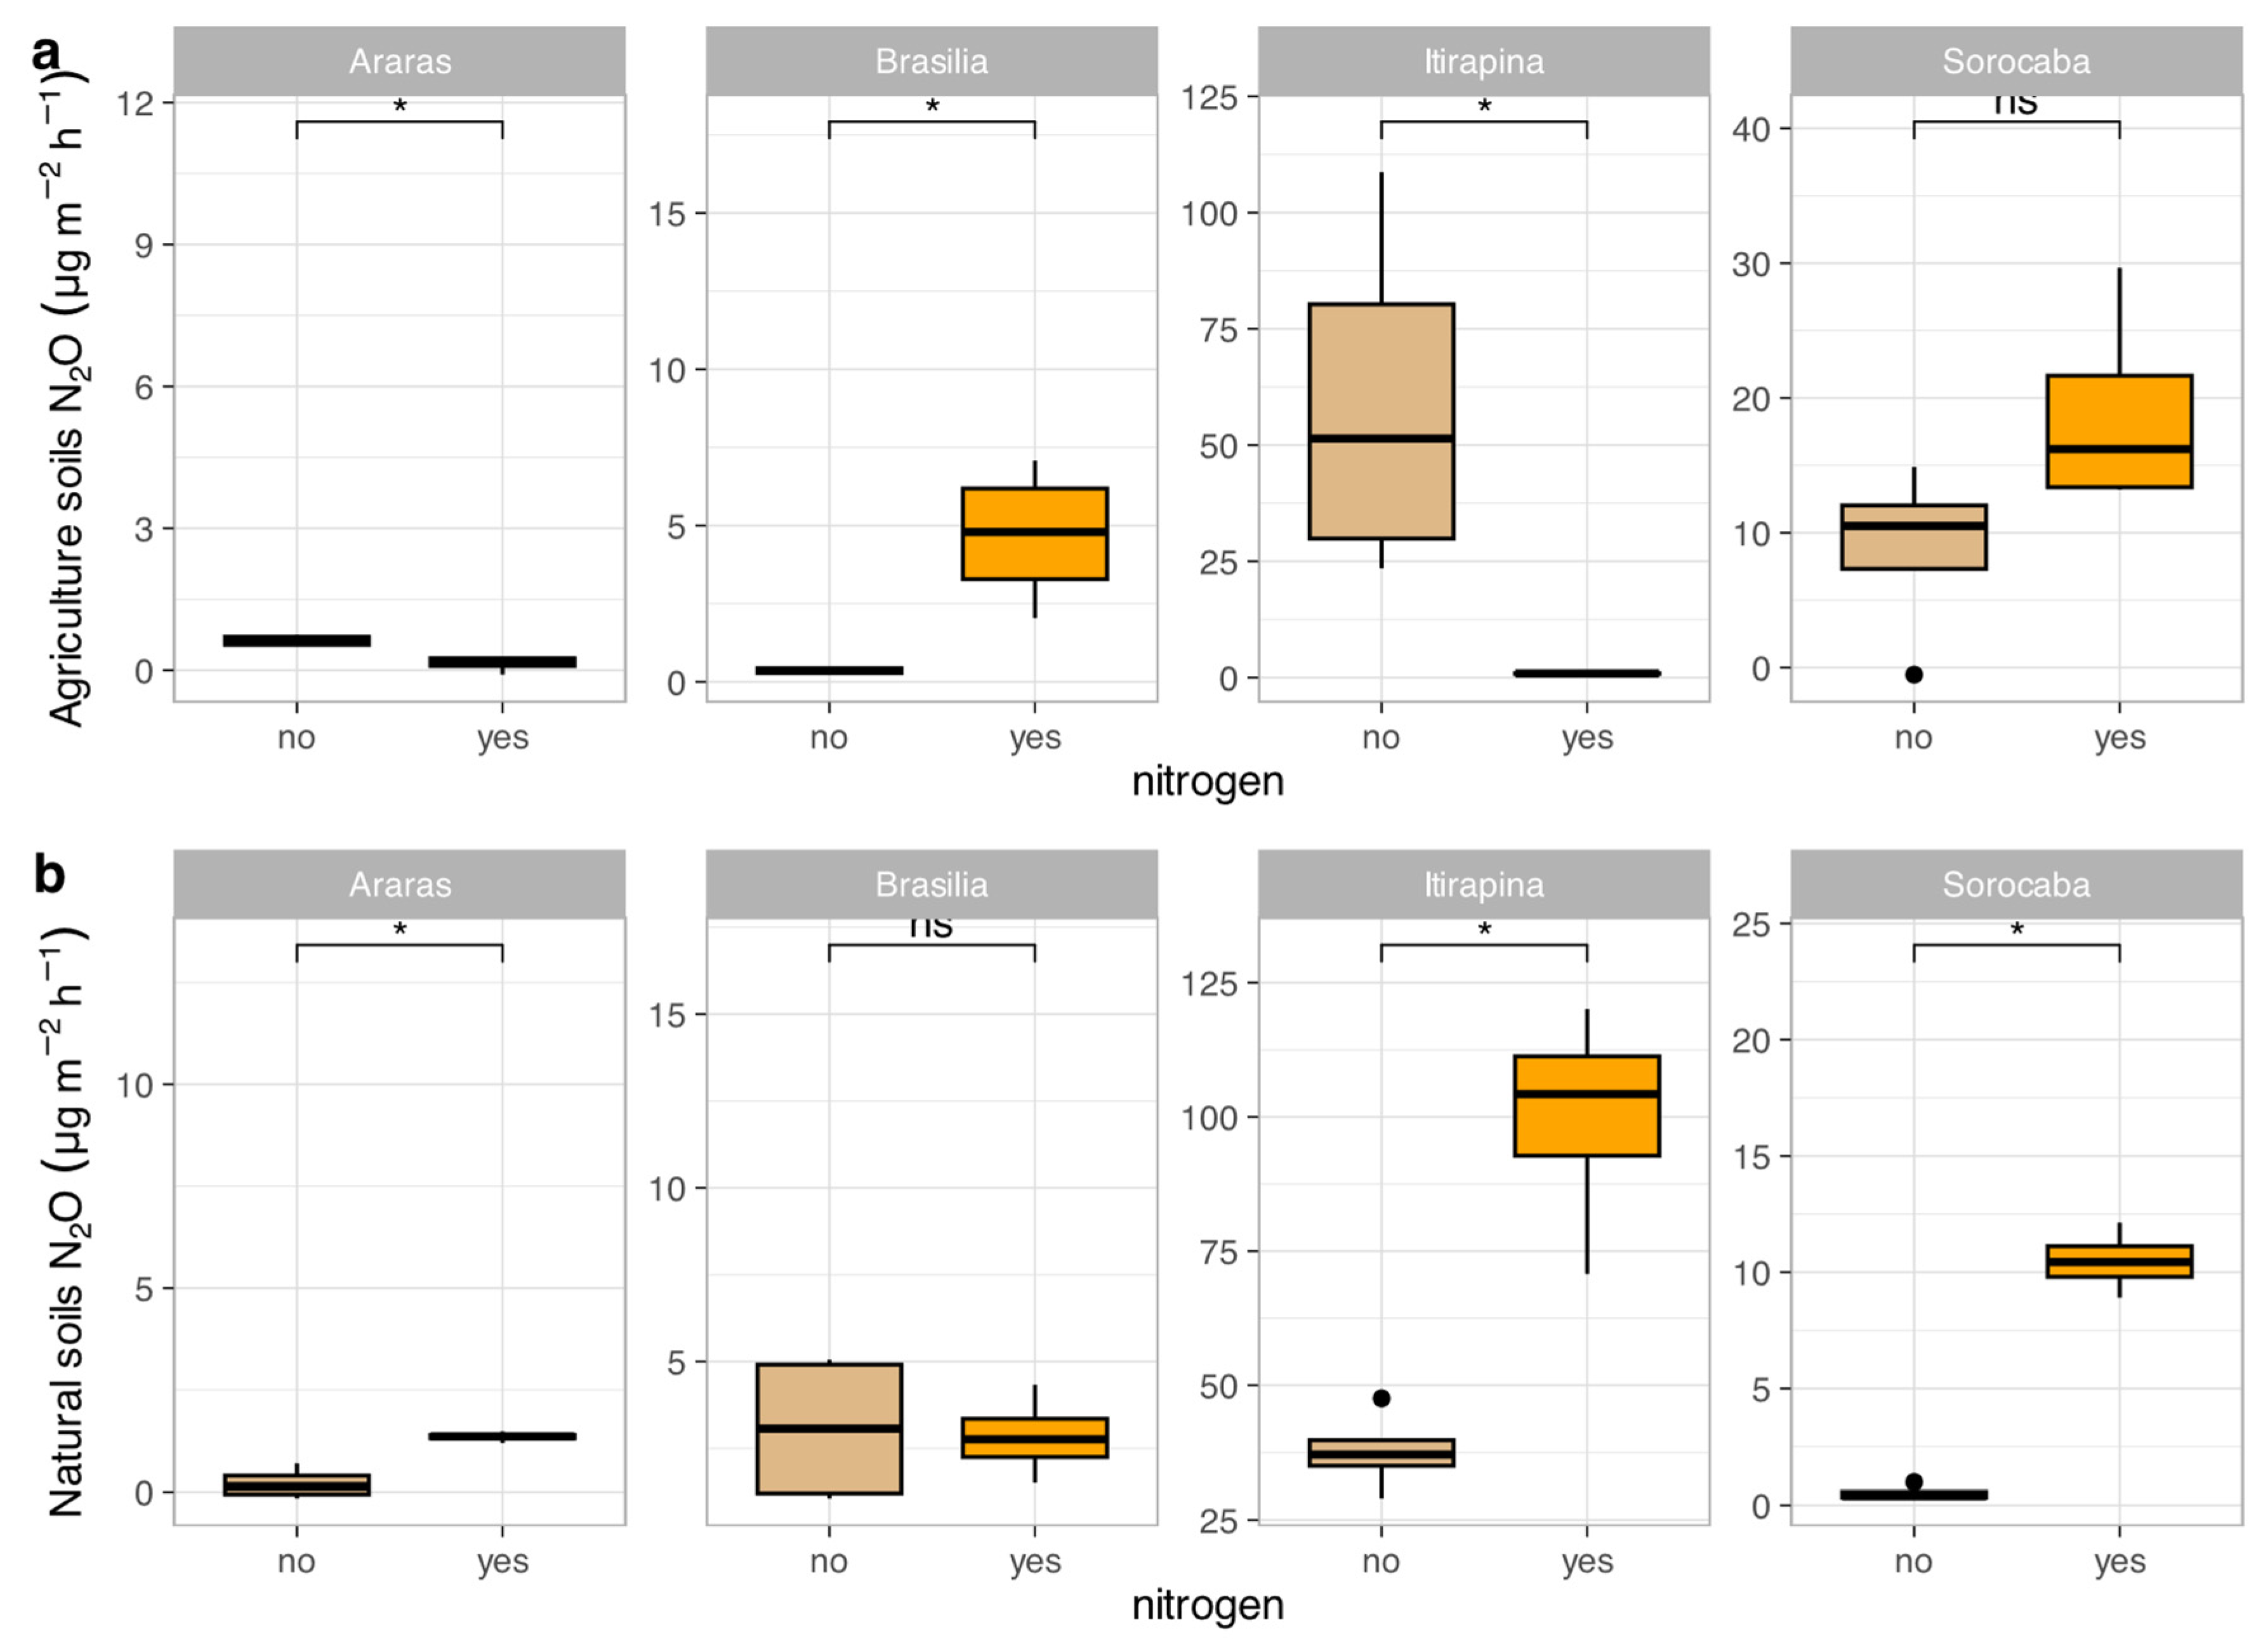
Figure 4.
Variation in nitrate concentrations (Δ NO₃⁻) in agricultural (a) and natural (b) soils from four Cerrado sites (Araras, Brasília, Itirapina, Sorocaba) in response to ammonium sulfate [(NH₄)₂SO₄] addition. Boxplots represent mean values (box) and confidence intervals (lines), with points indicating outliers. “no” indicates the absence of nitrogen, and “yes” indicates nitrogen addition. Values are expressed in mg NO₃⁻ kg⁻¹ soil, with scales adjusted for agricultural (a) and natural (b) soils. Significant differences (p < 0.05) between treatments are indicated by asterisks (*), while “ns” denotes no significant difference.
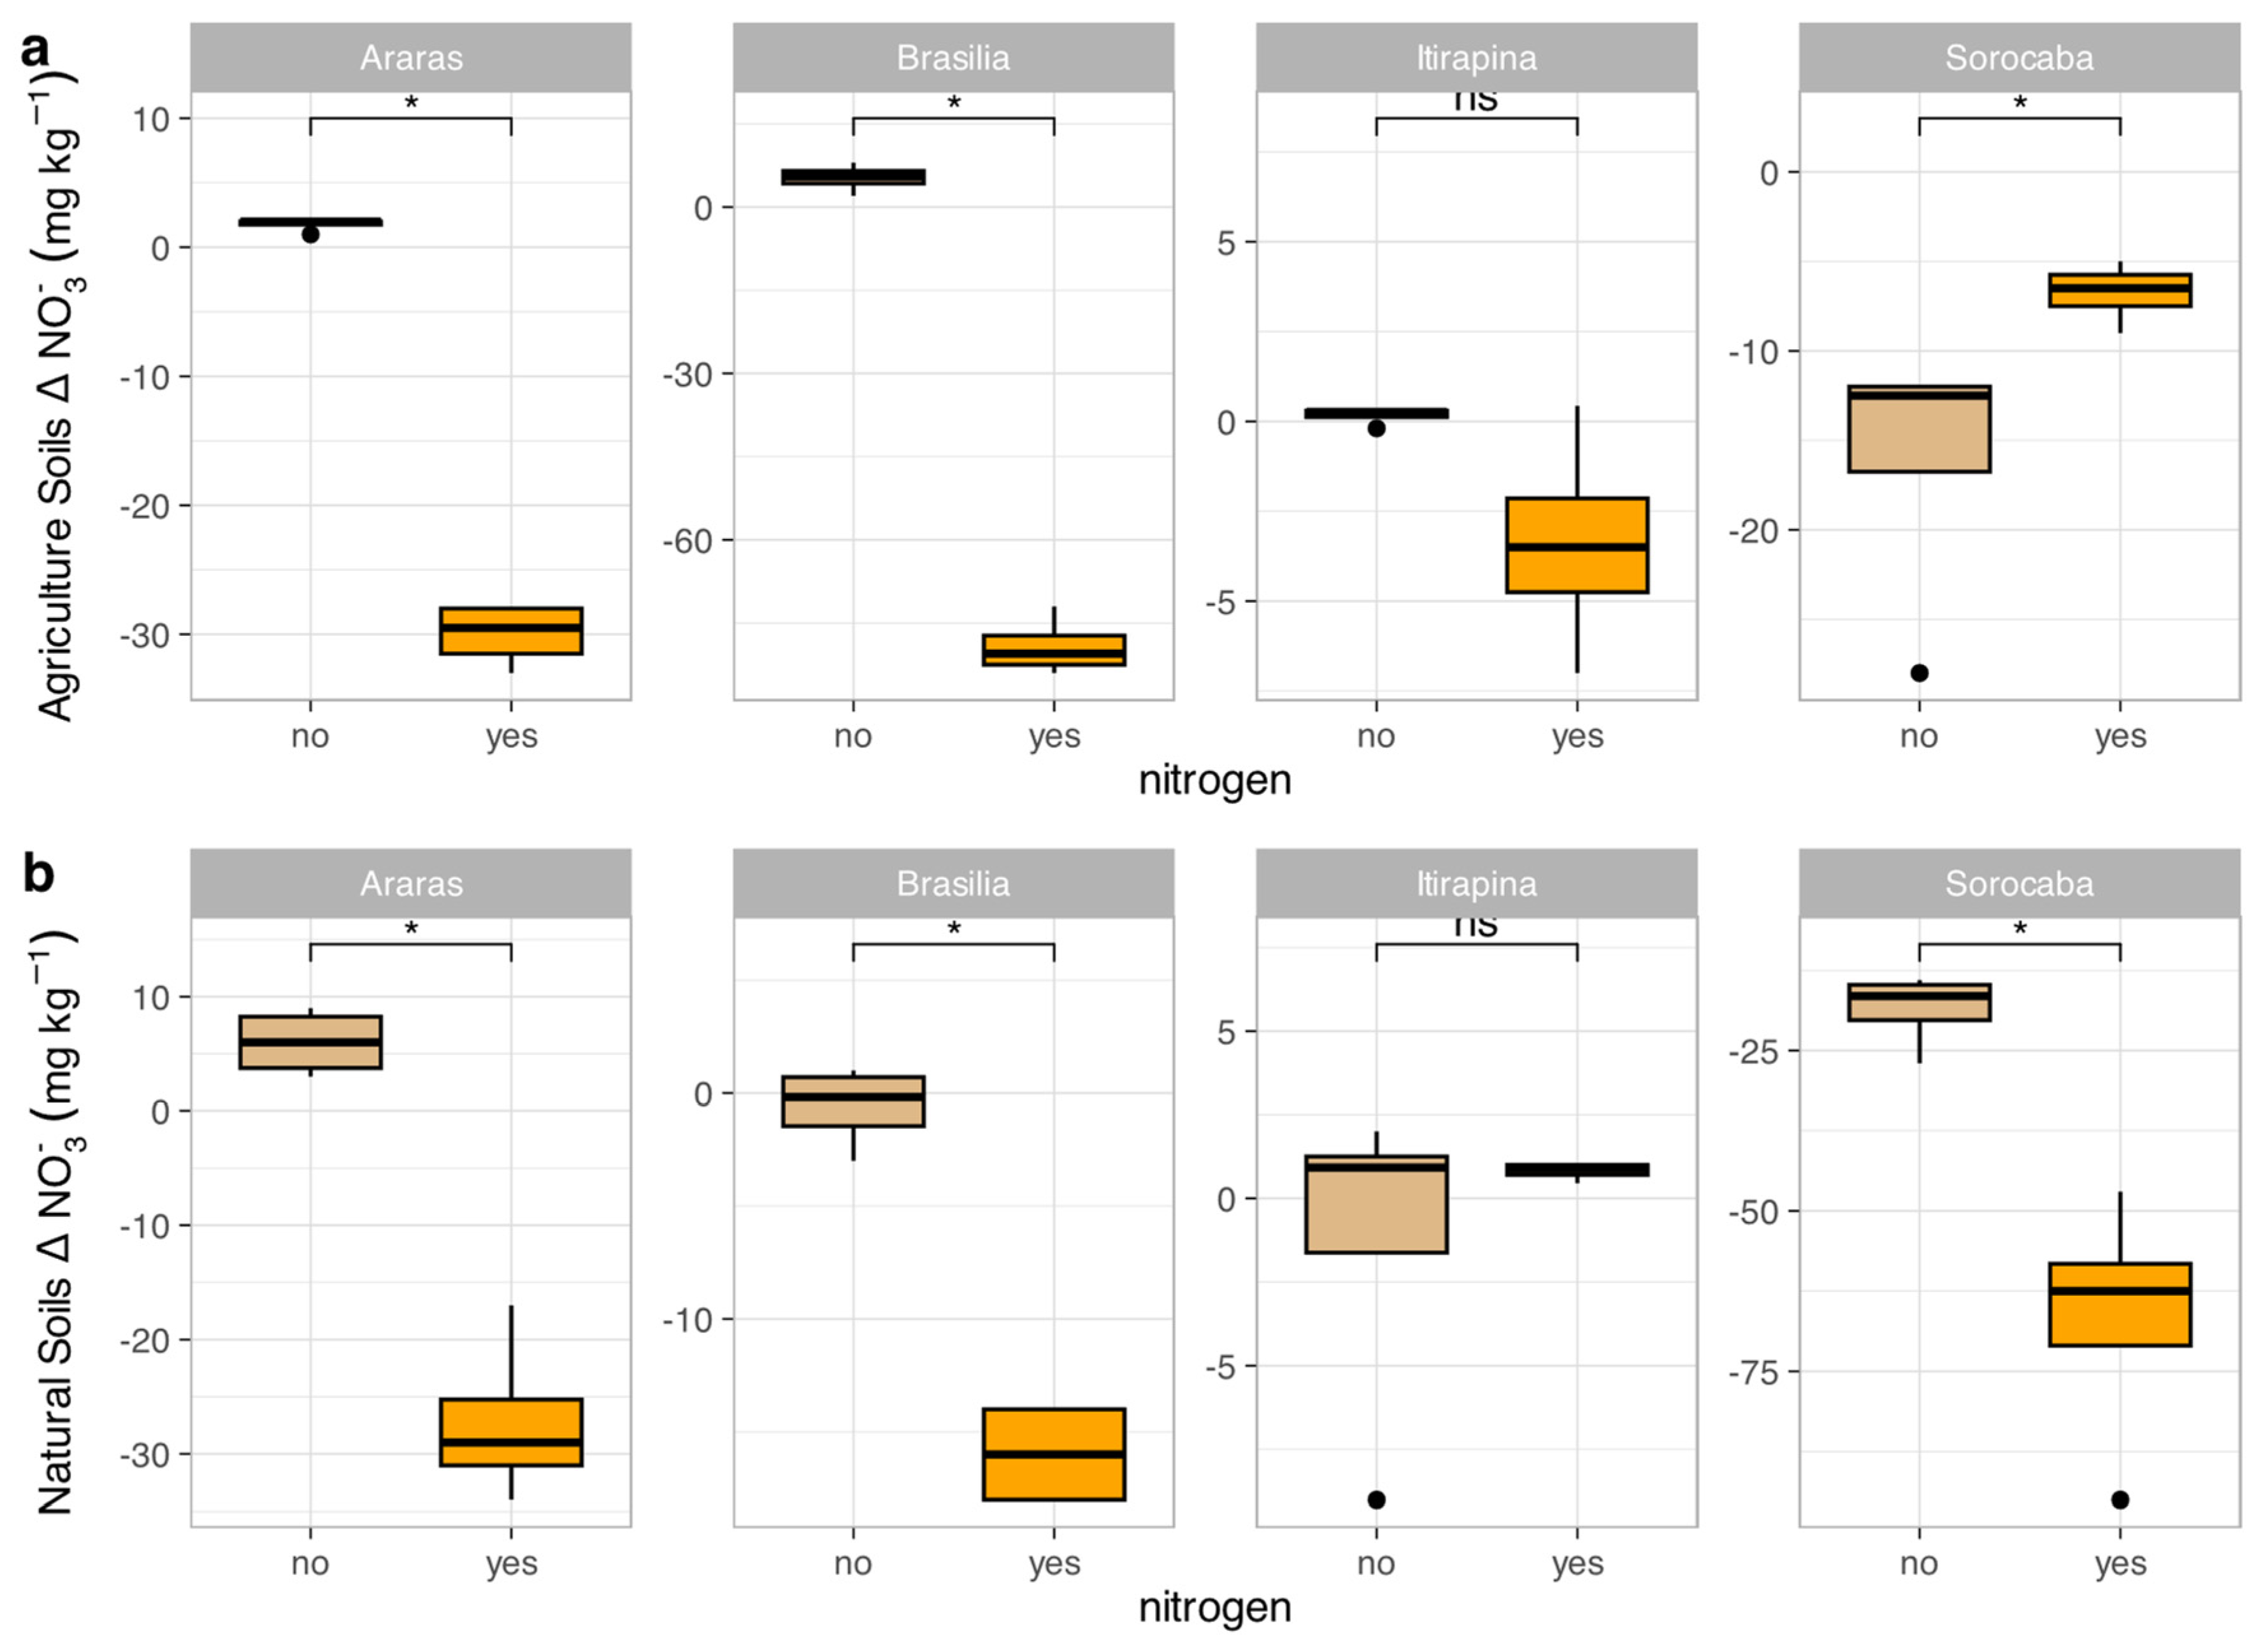
Figure 5.
Variation in ammonium concentrations (Δ NH₄⁺) in agricultural (a) and natural (b) soils from four Cerrado sites (Araras, Brasília, Itirapina, Sorocaba) in response to ammonium sulfate [(NH₄)₂SO₄] addition. Boxplots represent mean values (box) and confidence intervals (lines), with points indicating outliers. “no” indicates the absence of nitrogen, and “yes” indicates nitrogen addition. Values are expressed in mg NH₄⁺ kg⁻¹ soil, with scales adjusted for agricultural (a) and natural (b) soils. Significant differences (p < 0.05) between treatments are indicated by asterisks (*), while “ns” denotes no significant difference.
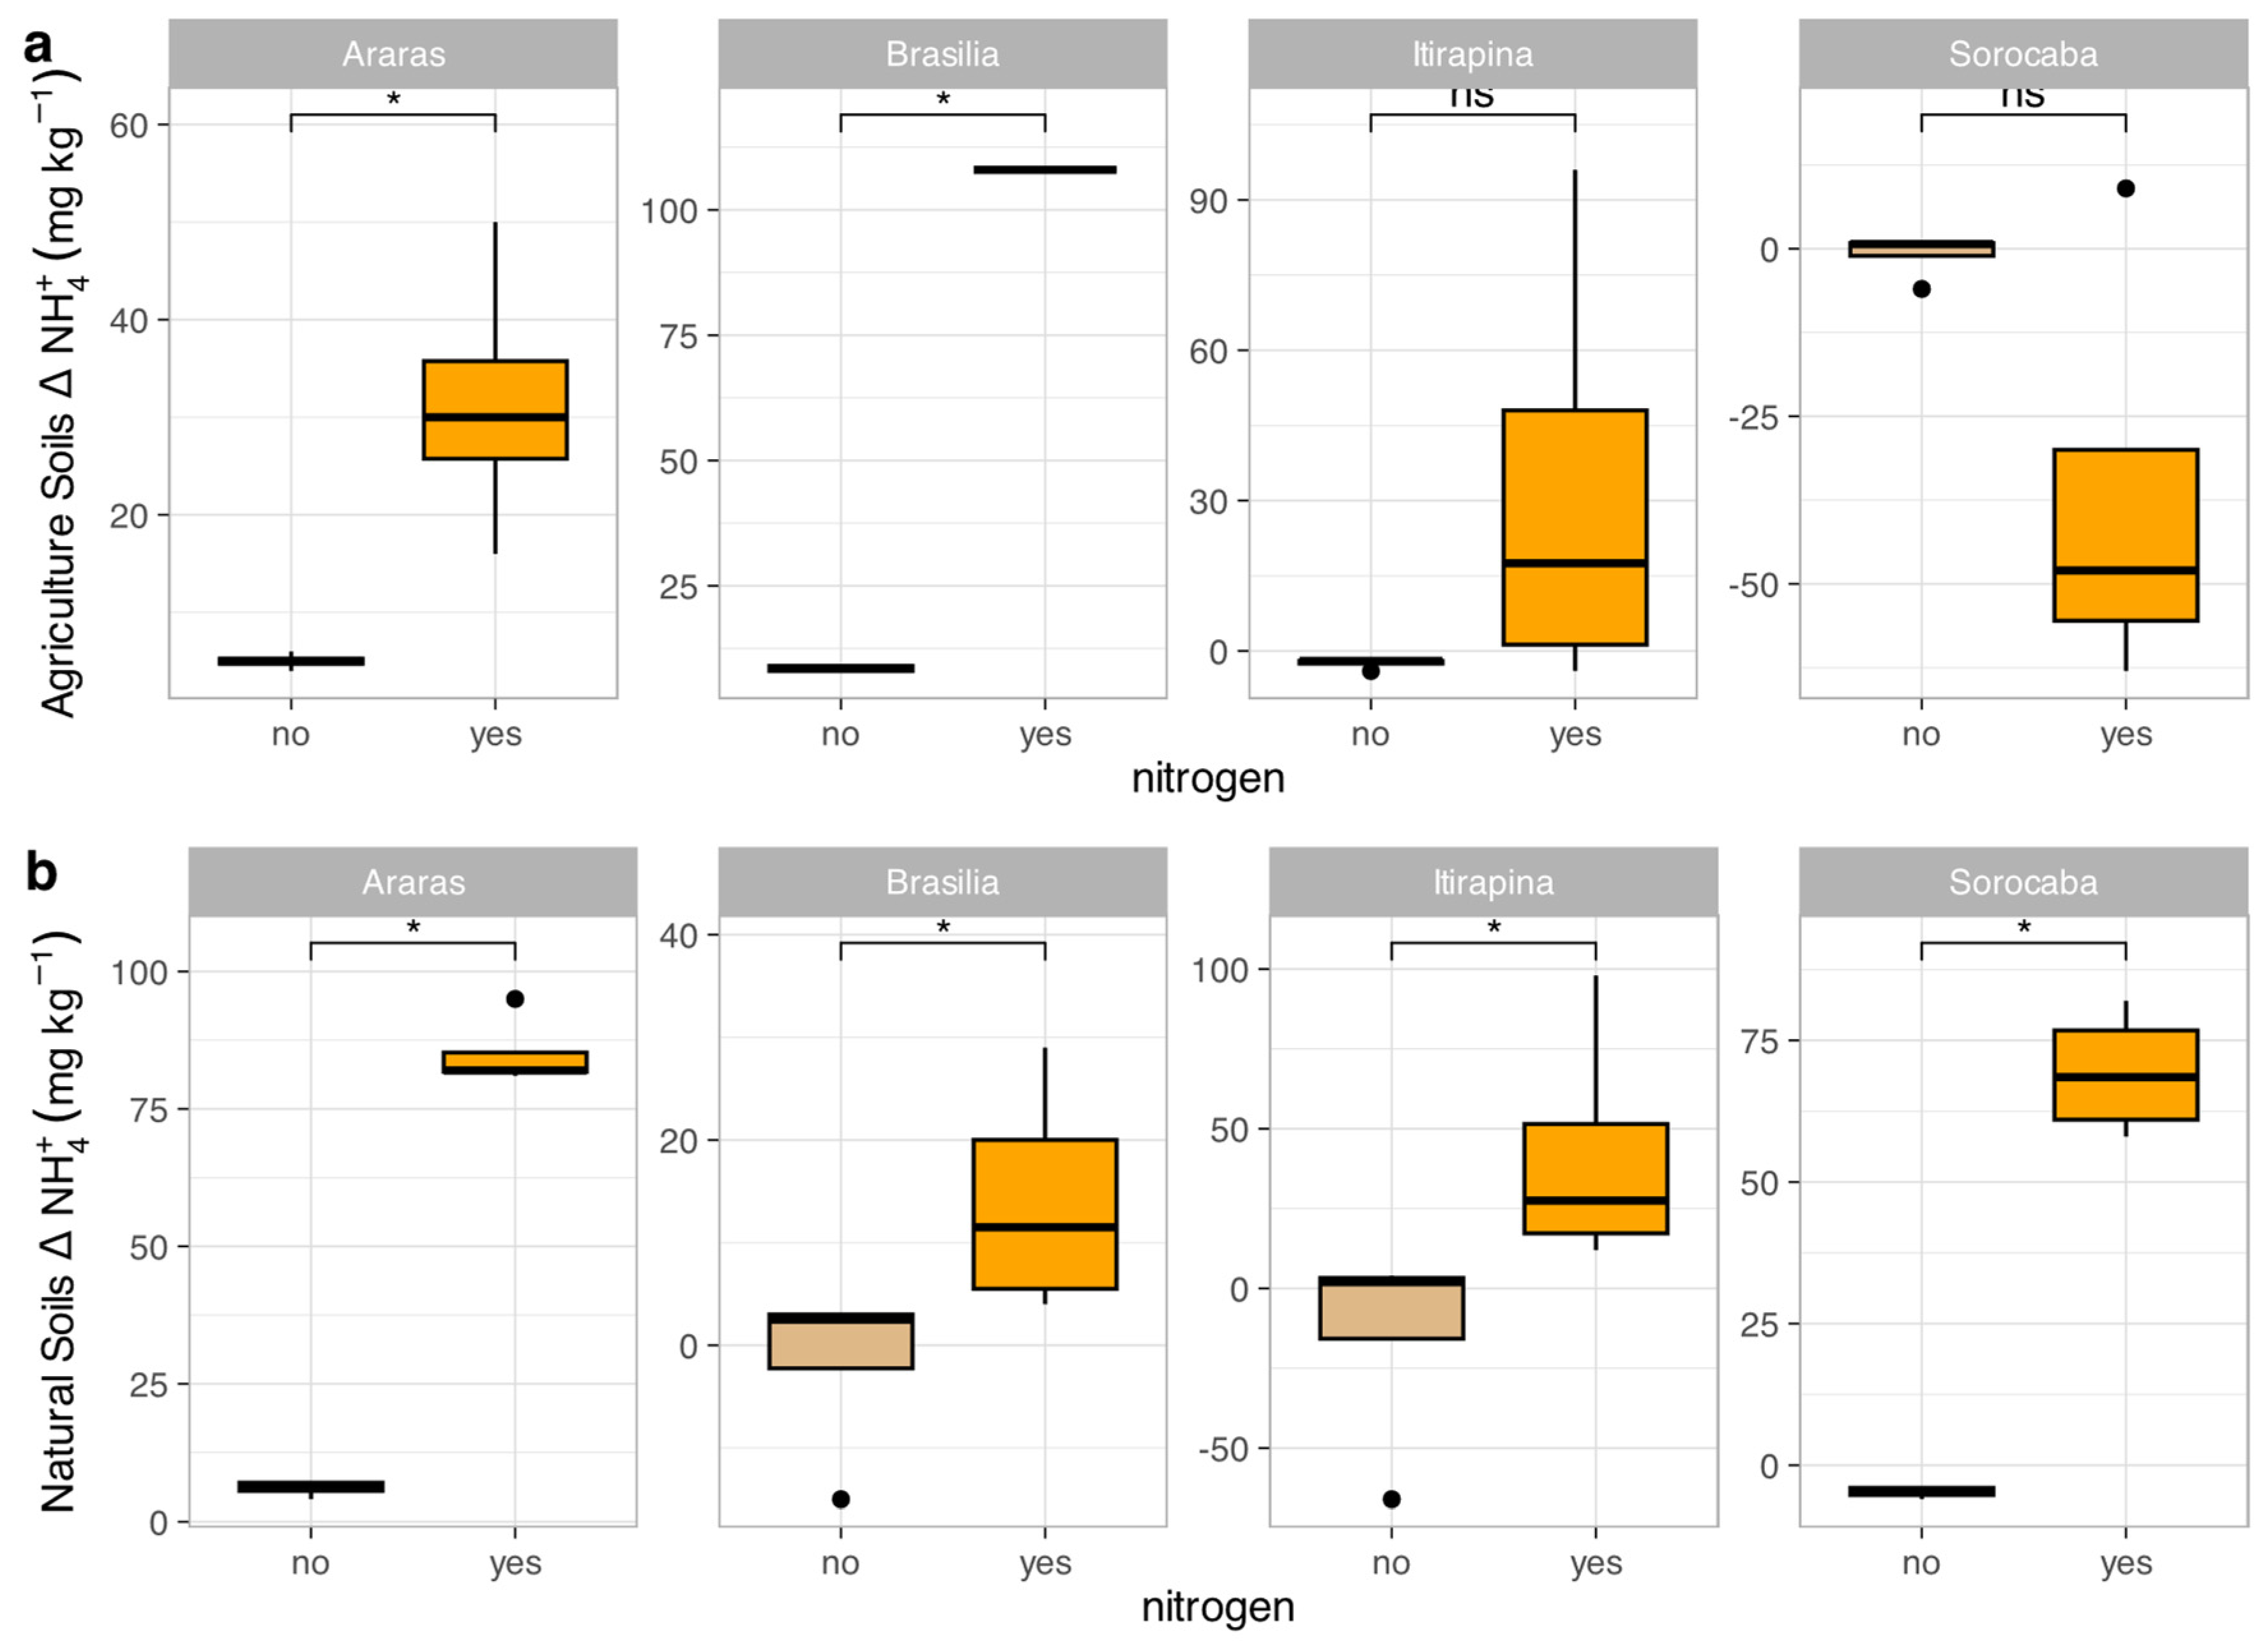
Figure 6.
Map of Brazil highlighting the Cerrado biome (yellow area with Orange outline), based on IBGE shapefiles processed using R software. Red dots indicate collection sites in natural forest fragments located in the cities of Araras, Sorocaba, Itirapina, and Brasília. The geographic coordinates of the collection sites were overlaid on the country’s basemap using the ggplot2, sf, and rnaturalearth libraries.
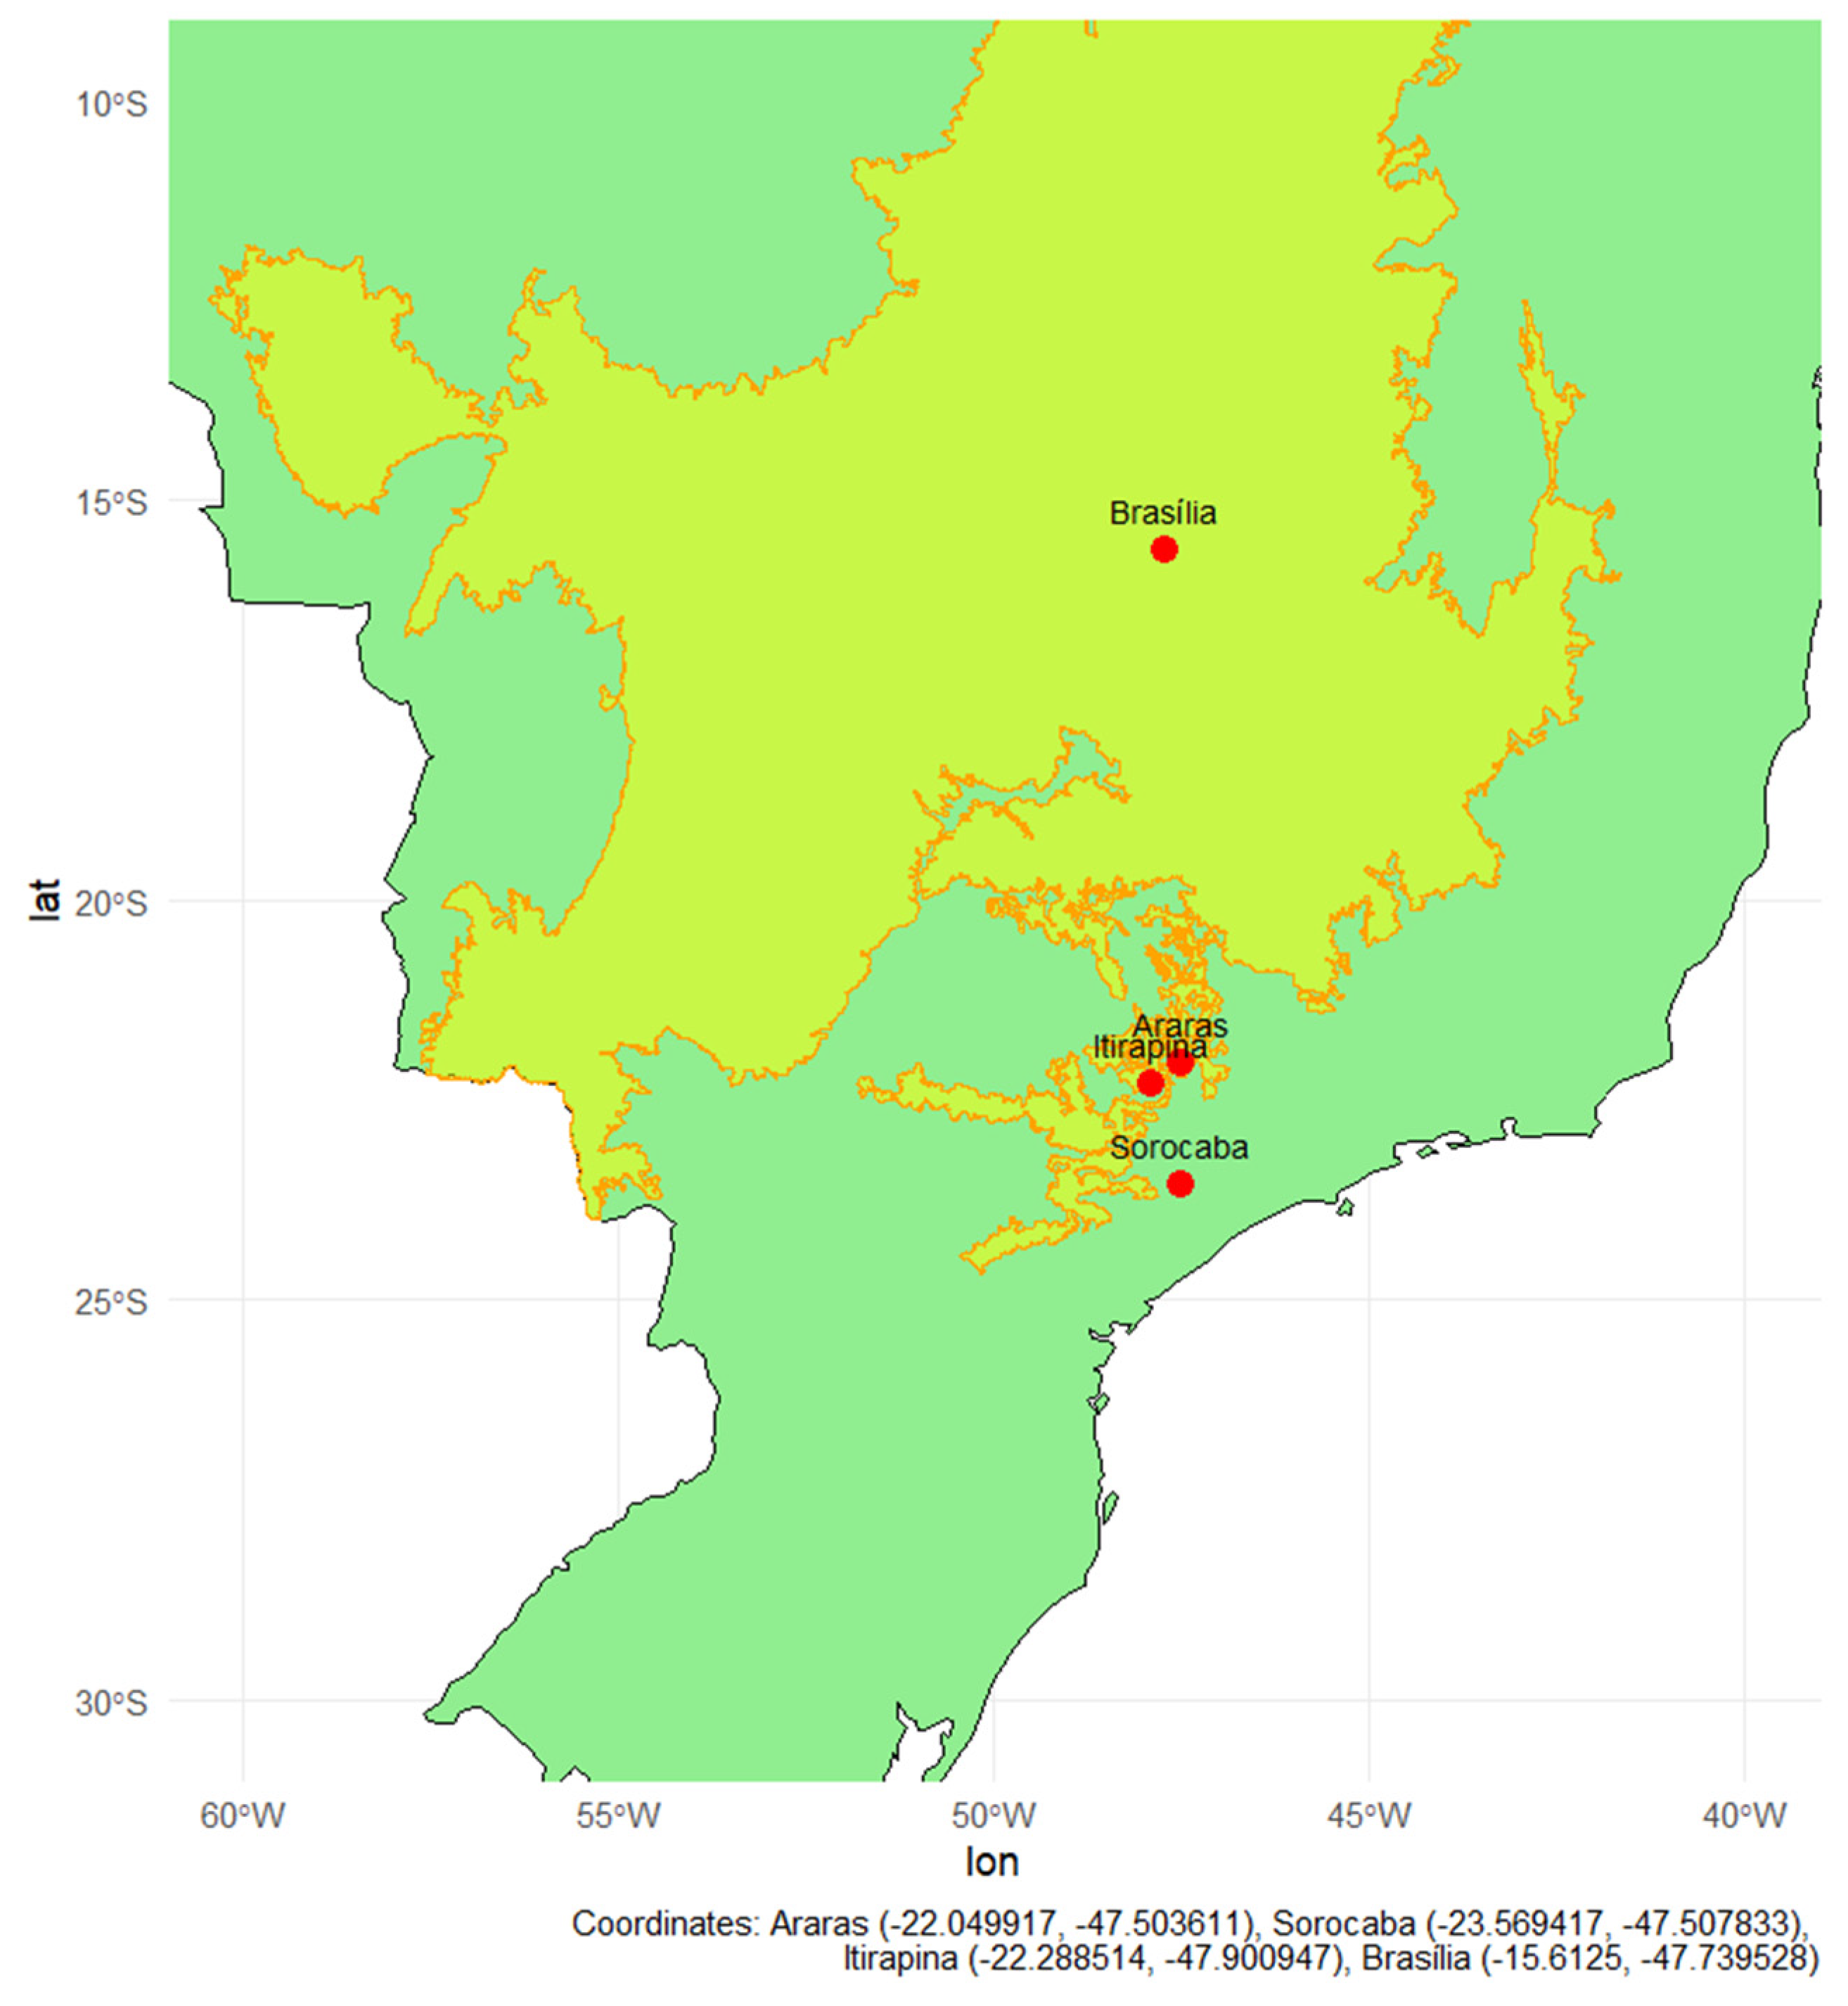

Table 1.
Mean greenhouse gas fluxes (CH₄, CO₂, and N₂O), pH, and inorganic nitrogen concentrations (NH₄⁺ and NO₃⁻) in soils under native vegetation and adjacent cultivated land at each study site.
Table 1.
Mean greenhouse gas fluxes (CH₄, CO₂, and N₂O), pH, and inorganic nitrogen concentrations (NH₄⁺ and NO₃⁻) in soils under native vegetation and adjacent cultivated land at each study site.
| Site | Land Use | CH4 (µg kg soil-1day-1) |
CO2 ( g kg soil-1day-1) |
N2O ( µg kg soil-1day-1) |
pH |
NH4 + (mg/kg) |
NO3- (mg/kg) |
|---|---|---|---|---|---|---|---|
| Araras | Native | -23,7 ± 0,5 | 4287,08±1951,41 | 0,42 ± 1,40 | 6,1 | 7,5 | 24,6 |
| Sugar Cane | 0,4 ± 0,2 | 7473,04±4180,79 | 0,70 ± 1,79 | 4,7 | 5,5 | 2,7 | |
| Sorocaba | Native | 0,2 ± 0,1 | 4547,27±2580,50 | 2,68 ± 17,12 | 6,4 | 1,0 | 49,9 |
| Citrus | 0,3 ± 0,1 | 11010,61±5245,86 | 12,92 ± 50,46 | 5,0 | 1,4 | 9,2 | |
| Brasília | Native | -24,0 ±0,8 | 6358,41± 1478,54 | 2,18 ± 5,49 | 4,2 | 8,0 | 6,6 |
| Mayze/Soybeans | -0,7 ±0,1 | 4084,12± 1013,36 | 0,37 ± 0,38 | 5,0 | 8,8 | 21,7 | |
| Itirapina | Native | -3,4 ± 0,6 | 7428,24± 2490,61 | 55,01 ± 51,27 | 3,9 | 6,4 | 1,7 |
| Sugar Cane | -0,2 ± 0,3 | 8178,47±3613,80 | 41,32 ± 80,62 | 5,3 | 1,9 | 1,0 |
Disclaimer/Publisher’s Note: The statements, opinions and data contained in all publications are solely those of the individual author(s) and contributor(s) and not of MDPI and/or the editor(s). MDPI and/or the editor(s) disclaim responsibility for any injury to people or property resulting from any ideas, methods, instructions or products referred to in the content. |
© 2025 by the authors. Licensee MDPI, Basel, Switzerland. This article is an open access article distributed under the terms and conditions of the Creative Commons Attribution (CC BY) license (http://creativecommons.org/licenses/by/4.0/).
Copyright: This open access article is published under a Creative Commons CC BY 4.0 license, which permit the free download, distribution, and reuse, provided that the author and preprint are cited in any reuse.


