
Submitted:
23 December 2025
Posted:
24 December 2025
You are already at the latest version
Abstract
European Air Quality Directive defines benzo(a)pyrene as the chemical index for Polycyclic Aromatic Hydrocarbons (PAHs) carcinogenicity and sets a limit for its concentration in PM10 to address the exposure risk associated with the class. It also mandates monitoring six additional PAHs at a limited number of selected sites to assess the benzo(a)pyrene's contribution to the class in ambient air.
For this aim, as part of the "Reti Speciali" project, benzo(a)pyrene and seven other PAHs were measured at 10 urban sites across Italy in 2016-2019 and the spatial and temporal pattern of these compounds were analyzed to evaluate benzo(a)pyrene's effectiveness in representing the carcinogenicity of the entire PAHs class.
Results showed that in Italy, benzo(a)pyrene accounted for 61% ± 4.4% of total carcinogenicity when benzo(a)anthracene, benzo(b)fluoranthene, benzo(k)fluoranthene, dibenzo(a-h)anthracene, and indenopyrene were considered, and about 5% less when chrysene was also added. This value varies by site (from 51%± 11% in Taranto to 66% ± 7.5% in Cosenza) and decreases in summer due to benzo(a)pyrene's strong photochemical degradation. In Europe, this percentage is generally similar or lower. For instance, in the United Kingdom, across 24 urban sites, it averages 56%± 2.9%.
These findings suggest that benzo(a)pyrene does not represent the overall carcinogenicity of PAHs nor a constant percentage, highlighting the need to further investigate the use of benzo(a)pyrene as the sole marker of PAHs toxicity.
Keywords:
PAHs
; benzo(a)pyrene
; carcinogenicity marker
; ambient air
; air quality directive
; BEC
; urban sites
1. Introduction
Polycyclic Aromatic Hydrocarbons (PAHs) are a class of compounds constituted by two or more fused aromatic rings containing only carbon and hydrogen. These compounds are produced from natural sources, such as forest fires, or anthropogenic sources [1]. Among anthropogenic sources, the incomplete combustion of organic material is the main process leading to the formation of PAHs. Consequently, industrial processes that require the use of fossil fuels or biomass, fuel electric power plants, domestic heating, transport of goods and people, can be listed among the most important sources [2]. The interest in PAHs is mainly due to their toxic properties, especially carcinogenicity [3,4,5,6].
International Agency for Research on Cancer (IARC) has classified benzo(a)pyrene as a human carcinogen (Group 1); cyclopenta(cd)pyrene, dibenzo(a,h)anthracene, and dibenzo(a,l)pyrene as probable human carcinogens (Group 2A); benzo(j)aceanthrylene, benzo(a)anthracene, benzo B, J and K fluoranthenes, benzo(c)phenanthrene, chrysene, dibenzo(a,h)pyrene, dibenzo(a,i)pyrene, indeno(1,2,3-cd)pyrene, and 5-methylchrysene as possible human carcinogens (Group 2B) [3]. In the European Union, under CLP Regulation concerning the Classification, Labelling and Packaging of substances and mixtures [7], numerous PAHs are classified as hazardous. The harmonised classifications for PAHs considered in this study, when established, are listed in the supplementary material, Table S1.
All PAHs classified as carcinogenic are constituted by 4 or more aromatic rings, there-fore their presence is prevalent in the particulate phase of the atmosphere [8,9]. Consequently, the most relevant risk associated with PAHs exposure through breathing is connected to the inhalation of particles [10]. Given that according to IARC and CLP classifications Benzo(a)pyrene (BaP) is the most toxic PAH, the European Chemicals Agency (ECHA) reported that national and international bodies, after having assessed different options, concluded that BaP is a good representative for overall PAHs cancer risk via inhalation route.
Shifting to a regulatory perspective, global air-quality legislation generally focuses on a set of major pollutants (e.g., PM10, PM2,5, NO2), although there is no common legal framework for ambient air quality standards worldwide [11]. It should be emphasized that regulatory approaches for PAHs vary even more. For instance, in the United States PAHs are identified as Hazardous Air Pollutants by the US EPA and as Toxic Air Contaminants by the California Air Resources Board; however, none of these designations mandate routine monitoring of PAHs [12] and an ambient concentration limits have not been established [13,14] , similarly to the Republic of Korea [15].
By contrast in China the national ambient air-quality standard (GB 3095-2012) estab-lishes for BaP a target value of 1 ng/m3 [16], the same as the EU standard. Indeed, the most recent EU Air Quality Directive [17], establishes a limit value of 1.0 ng/m3 for BaP in PM10 as annual average, to be attained by the 1st January 2030. Furthermore, consistently with the previous legislation, the approach adopted by European legislation provides that, to assess the contribution of BaP to PAHs in the ambient air, each Member State shall monitor other relevant PAHs at a limited number of measurement sites to identify possible geographical variation and long-term trends. The compounds shall include at least: benzo(a)anthracene (BaA), benzo(b)fluoranthene (BbF) benzo(j)fluoranthene (BjF), benzo(k)fluoranthene (BkF), indeno(1,2,3-cd)pyrene (IPY) and dibenzo(a,h)anthracene (DBA).
Nevertheless, scientific literature suggests that considering BaP alone as index of air-borne PAH carcinogenicity can produce an underestimation of the real effect, also considering that other PAHs in the mixture could have synergistic effects that increase toxicity [18]. Additionally, as PAHs are bound to particles, which can themselves cause adverse health effects, the PAHs carcinogenic potential can be enhanced [19].
Verifying and continuously assessing the reliability of using BaP as the sole marker for the entire PAHs class in air quality legislation is particularly important, especially con-sidering that EU legislation for other matrices, such as water [20] and foodstuff [21], mandates compliance with limits for the sum of four PAHs, and also taking into account that the assessment of combined effects of chemicals is regarded as a priority at international level [22].
In this context, from fall 2016 to fall 2019, as part of the “Reti Speciali” project (promoted by the Italian Ministry of Environment and Energy Security) [23,24], an investigation on PM10 bound PAHs started in Italy at ten urban sites, with the aim to identify the geographical variations and long-term trends of the ambient air concentrations of PAHs considered by the European Directive (hereinafter referred to as carcinogenic PAHs).
The purpose was to assess the spatial and temporal consistency between BaP and other carcinogenic PAHs, as well as to evaluate the carcinogenic potential associated solely to BaP compared to the total across different seasons and environmental contexts.
Although limited in duration, the Reti Speciali results reported in this study aim to improve the understanding of BaP’s reliability as a toxicity marker for the entire class of compounds, in order to gather evidence on how effective BaP is as a marker for ensuring a high level of protection of human health. Moreover, the results obtained in Italy were compared with available European data to broaden the information base and gain a more comprehensive perspective.
2. Materials and Methods
2.1. Sites of Study
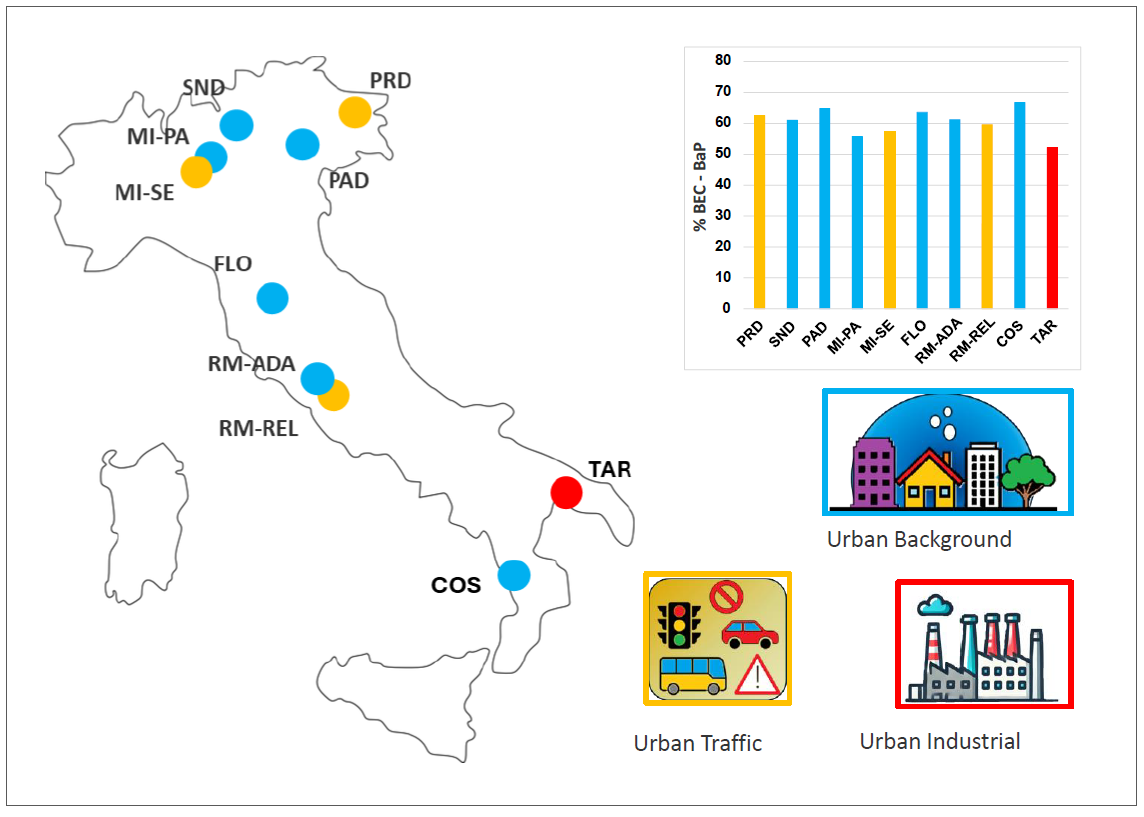
Sites were chosen to cover the entire Italian peninsula. Ten monitoring stations were considered, all located in urban areas. Urban sites were selected because they are potentially more representative of the highest average exposure levels of the population, and because approximately 80% of the Italian population lives in towns and cities [25]. The selection also aimed to ensure representativeness with respect to urbanization levels, emission load, orography, meteorological conditions, and population exposure. Among the ten sites, six were classified as urban background, three as traffic stations, and one (in Taranto) as industrial. The large cities of Milan, Rome, and Florence represent urban areas with higher populations where traffic is the predominant source of pollution. To capture potential differences, in Milan and Rome two sites were monitored, representing background and traffic typologies. Padua, Pordenone, and Sondrio are cities in northern Italy. Located in Po Valley, Padua and Pordenone are characterized by a significant presence of manufacturing industries. In contrast, Sondrio, at 307 meters above sea level in the Valtellina (Alp’s area), stands out for its more rural economy, which is tied to natural resources and tourism. Cosenza and Taranto exemplify two distinct economic and geographical models in southern Italy. Cosenza is an inland city in northern Calabria surrounded by a sparsely populated area and has an economy mainly focused on manufacturing and agri-food production. On the other hand, Taranto, a coastal city on Apulia’s Ionian Sea, relies heavily on steel production, port operations, and maritime activities, and suffers from decades of industrial pollution from the former ILVA steel plant and associated industries, which have caused significant public health concerns [26].
Table 1 provides information about the characteristics of individual stations, whereas Figure S1 and Tables S2 and S3 illustrate respectively their positions across the national territory, the total annual precipitation along with the average annual temperature, and annual PM10 levels over the three- year period.
2.2. Sampling and Analytical Procedures
The samples collection lasted for three years and began, depending on the sites, in November or December 2016, ending at the end of November 2019. Table S4 provides details on the weeks during which samples were collected, and atmospheric concentration values of PAHs are available.
Samplings were carried out according to UNI EN 12341:2014 standard on quartz fiber filters. Filters were collected daily for over 24 hours starting at midnight. In the first period, filters were analyzed individually. From mid-2017 for some cities filters were combined to form weekly samples. The percentage of analyses performed on weekly samples increased progressively during 2017 until it became the only way of processing the samples by the first months of 2018. In total, about 4,600 daily filters were collected and 2,000 samples were analyzed, resulting in average sampling data coverage of 42% over the three-year period (min. 34% at Pordenone, max 47% at Padua). To ensure maximum data comparability, all analyses were conducted by the laboratories of the Veneto Agency for Environmental Protection (ARPA Veneto). Analyses were carried out according to the reference UNI EN 15549:2008 standard (Air quality-Standard method for the measurement of the concentration of benzo[a]pyrene in ambient air) and the International standard ISO 16362:2005 (Ambient air-Determination of particle phase polycyclic aromatic hydrocarbons by high performance liquid chromatography) for the instrumental setting.
The compounds analyzed included benzo(a)pyrene (BaP), benzo(a)anthracene (BaA), benzo(b)fluoranthene (BbF), benzo(k)fluoranthene (BkF), dibenzo(a,h)anthracene (DBA), and indeno(1,2,3-cd)pyrene (IPY). In addition, chrysene (CHR) and benzo(g,h,i)perylene (BPE) were monitored.
Prior to analysis, samples were stored in the dark at a temperature of -20 °C. Filters were ultrasonically extracted using acetonitrile. The extracts were filtered through 0.20 µm PTFE filters, then analyzed by HPLC coupled to a fluorescence detector, using a gradient of water and acetonitrile as carrier agent for their elution (flow rate of 0.5 mL/min). The compound BjF was not detected because it exhibits low fluorescence, and its quantification limit was significantly higher than the amounts found in the filters.
The method was validated using certified reference materials: ERMCZ100 (Fine Dust-PM10 like) and NIST SRM 1648a (Urban Particulate Matter). Recovery efficiencies ranged between 75% and 125% (80% for BaP). The limits of detection (LODs) were calculated by measuring surrogate standards (PAH-600-1 Standard Solution, 100 µg/mL, in Acetonitrile supplied by Ultrascientific Italia, Bologna). Tests were performed both by direct injection of the diluted standard and by adding it to the quartz filters used for atmospheric particulate sampling.
For the analysis carried out on individual filters, the calculated method LODs were about 0.02 ng/m³ for all congeners. In the database, the lower LOD data has been re-placed with LOD/2. For each set of analyses, a blank filter from the same lot as the sampled filters was examined. Field blanks were also performed on filters that remained at the sampling station during the same period as the sampled filters. In both cases, the PAHs concentrations were below the method’s detection limits.
For the statistical treatment of data, the software R and Origin were used.
2.3. Equivalent Toxicity
Typically, Toxic Equivalency Factors (TEFs) are used to assess the total toxicity of PAHs relative to BaP [27,28]. In our case, we attempted to reverse this approach, examining what percentage of the total PAHs toxicity equivalency could be attributed to BaP alone. Many approaches have been developed to classify the carcinogenic potency of different PAHs compared to that one of BaP [29,30]. With the aim of conducting the study within a framework based on recognized institutional references, we considered as reference the “Guidance for Calculating Benzo(a)pyrene Equivalents for Cancer Evaluations of Polycyclic Aromatic Hydrocarbons”, published by the US Agency for Toxic Substances and Disease Registry [31]. The Agency recommends using Potency Equivalency Factors (PEF) which are specific for the estimation of cancer risk. Most of these values are derived by California Office of Environmental Health Hazard Assessment, through a comparative analysis of the relative toxicity of each congener to that of BaP, on the basis of a thorough scientific review of chemical structures and toxicological databases. As BPE is classified as a Category 3 substance by the IARC – indicating it is not classifiable as to its carcinogenicity to humans [3] - we chose not to include it in the calculation of the Equivalent Toxicity, in line with the guidance recommendations, although many authors attribute a certain degree of carcinogenicity to this compound as well [32,33,34]. Table 2 shows the PEFs values.
To calculate the total BaP equivalent we multiplied the concentration of each PAH (congener) to its PEF to obtain a BaP equivalent concentration (BEC) and then we added the resulting values:
where:
- BECi is the BaP equivalent concentration of the ith individual congener
- xi is the measured concentration for the ith individual congener
- PEFi is the potency equivalency factor (PEF) of the ith individual congener
2.4. European Data for BEC Determination
In order to make a coherent comparison between the Italian BEC values and those from other European countries, we used as reference the database which merges the official data originating both from EU Database AirBase and AQ e-Reporting [35]
From the database we selected:
- data referred to 2017, 2018 and 2019.
- data related to urban air quality station areas.
- air quality stations for which concentration data of all PAHs of interest (BaP, BaA, BbF, BkF, DBA, IPY in PM10) were available.
- sites with a data coverage ≥ 30%.
3. Results and Discussion
3.1. Spatiotemporal Variation of PAHs
Figure 1 shows the box plots of the sum of the eight evaluated PAHs (hereafter referred to as total PAHs) over the entire measurement period. The box plots highlight the wide data dispersions due to the strong oscillations of atmospheric PAHs concentrations between the cold and warm seasons. The decrease in PAHs concentrations starts in late spring and is strictly linked to three main factors: 1) the increase in atmospheric mixing with the increase in temperature and the consequent dilution of all pollutants; 2) the lack of sources linked to domestic heating; 3) the photochemical reactivity of PAHs, resulting in increased atmospheric degradation during periods of enhanced solar irradiation. At this regard Figure S2 reports as an example the trend of BaP during the whole measurement period.
Regarding average concentrations, the highest total PAH levels were recorded in Sondrio and Padua (8.7 ± 12 ng/m³ and 8.1 ± 11.8 ng/m³, respectively). In all other locations, average total PAH concentrations were lower, ranging from 3.8 ± 5.5 ng/m³ in Pordenone to 1.2 ± 1.0 ng/m³ in Taranto. Figure 2 provides a comparison of the single compound’s average concentration at the various sites. BaP over the period exceeded the target value of 1 ng/m3 established by the Directive in Sondrio and Padua (concentrations equal to 1.59 ± 2.2 and 1.55 ± 2.19 ng/m3, respectively). Except for Sondrio in 2019, this exceedance was also observed when considering the annual average over the three years monitored. BPE, among the PAHs more linked to traffic emission, was generally the compound with the highest average concentration. Exceptions were the northern cities Pordenone, Padua and Sondrio. In the first two cities, the compound with the highest concentration was BaP, in Sondrio the highest values were associated with BaA and CHR. DBA consistently exhibited the lowest concentrations among the compounds analysed. Its average values ranged from 0.13 ± 0.13 ng/m³ in Sondrio to 0.04 ± 0.02 ng/m³ in Cosenza. Taranto was the unique site where DBA concentration was always above the detection limit.
Results suggest that the Italian cities investigated can be categorized into three groups based on the measured PAH concentrations. The first group, characterized by the highest levels, comprises three northern cities: Sondrio, Padua, and Pordenone. This pattern underscores the strong influence of local geographic and climatic conditions on ambient PAH concentrations, as well as the dominant contribution of biomass combustion. Sondrio—located in a valley and known for the extensive use of biomass fuels—recorded the highest concentrations despite being the smallest city in terms of population. Padua and Pordenone, both situated in the Po Valley and characterized by substantial industrial activity, also displayed elevated levels, but it is worth noting that in the Veneto and Friuli Venezia Giulia regions, where these cities are located, biomass combustion is considered the main source of BaP; in Veneto, in particular, 93% of BaP originates from biomass combustion [36,37].
Belonging to the second group are the largest urban centres Milan, Rome, and Florence, where vehicular traffic represents the main source of atmospheric pollutants. The third group includes Taranto and Cosenza, both located in southern Italy. It is worth noting that, although the monitoring site in Taranto is situated near a large steel plant, PAH concentrations in the city have drastically decreased since 2013. These reductions are primarily attributed to the decline in steel plant production levels and the implementation of pollution control measures [38]. Moreover, Taranto’s coastal location naturally promotes the effective dispersion of pollutants.
Most of the variation in total PAH levels is not due to significant differences in the concentrations of individual compounds, but rather to the overall behaviour of the entire class. In fact, the Spearman test used to analyse similarities and differences among the patterns of single-PAH average concentrations returned coefficient values (see Table S5) that were greater than 0.65 in most cases, reflecting moderate to high correlations in the profiles [39]. Nonetheless, some deviations were observed when source contributions differed more markedly. In particular, Sondrio did not show a significant correlation with any of the other cities, and Taranto did not correlate with Padua or Pordenone.
To highlight seasonal variations in the PAHs profile and the behaviour of individual PAHs across different periods of the year—linked to changes in source intensity and compound behaviours in the atmosphere —data were analysed using seasonal average concentration values. Figure 3 illustrates the average seasonal concentrations of PAHs over the measurement period and put in the evidence that PAH concentration seasonal cycle was less evident in southern cities such as Cosenza and Taranto, where winters are milder. In particular, Taranto showed the minimal seasonal variation, likely due to the continuous influence of industrial emissions, which contribute to more stable PAH levels throughout the year.
Concerning the behaviour of the singular PAHs, Figure S3 presents a box plot reporting the percentage contribution of each PAH to the total and Table S6 provides the minimum and maximum percentages of each compound in each town. The maximum proportion of BaP in total PAHs was 20%, recorded in Cosenza and Padua, while the minimum was 9%, detected in Sondrio, Milan Pascal, and Rome Regina Elena. BPE showed in general the highest percentage among compounds.
The percentage of each compound, in relation to the total varies within a range of less than 15%, regardless of season or geographic location of the site, except for BEP in Florence (% min 11- % max 33). The variability of PAHs concentrations was further examined using PCA analysis [40,41].
For the statistical analysis, the (normalized) data matrix comprised 8 variables (the compounds) and 130 rows of observations, representing the 13 seasonal average PAH values for the 10 cities. The biplot for the entire measurement campaign is shown in Figure 4 with additional details provided in the supplementary material (Tables S7-S8). The first two principal components explain approximately 97% of the data variability and a strong correlation among PAHs (grouping of vectors) exists, with the sole exception of DBA. The PCA showed a relevant and homogeneous contribution from both low- and high-molecular-weight PAHs in PC1, indicating a common pyrogenic origin that can be interpreted as a general combustion-related source widespread across Italy. Meanwhile, PC2 was dominated by a positive loading of DBA, a compound typically associated with industrial activities and high-temperature combustion. Consistent outcomes were also obtained with seasonal data (see as an example winter period in Tables S9–S10, Figures S4), and further confirmation comes from the analysis of diagnostic ratios, whose results are reported in the Supporting Information (Table S11-S20, Figures S5-S9) [41,42,43,44,45,46,47,48,49,50,51,52,53,54]
The distribution of observations on the biplot shows that most data points are clustered together, apart from winter measurements, particularly from Sondrio and Padua, appearing more distant. The PCA results seem to indicate that, given the measured compounds, the selection of BaP as a representative congener of the entire class is acceptable in order to describe both concentration and profile variability. This is also confirmed by the high level of correlation existing between BaP and the sum of PAHs (considering all the cities, R2 is never below 0.994).
3.2. Percentage of BaP Relative to Total Carcinogenic PAHs and Its Contribution to BEC in Italy
To investigate BaP role as carcinogenic index, we focused on the percentage contribution of BaP alone to carcinogenic PAHs concentration (sum of BaP, BaA, BbF, BkF, DBA, IPY). At this regard, Table 3 reports, for the coverage period of the entire monitoring campaign, the average percentages of BaP in the carcinogenic PAHs and the variability of the values expressed as % standard deviation.
The results indicate that BaP contributes to carcinogenic PAHs in the range 19% ± 2.7% in Taranto, and 26% ± 2.8% in Cosenza. In terms of variability of % BaP vs. carcinogenic PAHs, the Milan Pascal site exhibited the greatest range, with a percentage standard deviation of 24% from the mean. The lowest variability was observed in Cosenza (% standard deviation 11). The PCA analysis suggested that in the monitored cities, BaP, due to its high clustering with nearly all PAHs, can serve as a representative marker for the compounds analysed in this study; nonetheless there is no strong correlation between the concentrations of BaP and the percentage of carcinogenic PAHs it represents (R²=0.18 in Italy).
Carcinogenic PAH BECs in Italy (Table3) range from 2.2±2.1 ng/m³ in Sondrio to 0.31±0.14 ng/m³ in Taranto. The percentage of toxicity attributed solely to benzo(a)pyrene ranged from a minimum of 51% ± 11 observed in Taranto (due to the relatively higher contribution of DBA) to a maximum of 66% ± 7.5% in Cosenza.
Taken together, these findings suggest that using BaP alone as a marker for the toxicity of the entire PAHs class captures in average about the 61% ± 4.4% of the carcinogenicity when BaP, BaA, BbF, BkF, DBA, and IPY are included in the calculation. This percentage decreases by roughly 5% when chrysene is additionally considered.
Results show that BaP plays a major role in the overall toxicity of PAHs; nevertheless, it neither reflects the total toxicity of the class nor represents a constant percentage of it.
3.3. Comparison with European Data
The situation observed in Italy was compared with that of other European countries to identify potential differences. Table 4 presents the concentrations of BaP and carcino-genic PAHs, along with the percentage contribution of BaP to total carcinogenic PAHs and the relative BEC at urban monitoring stations in 11 European countries, based on 2019 data collected from the European Air Quality Portal. The choice of using 2019 data was driven by the greater availability of information for that year.
As for the concentrations of BaP and the percentage of carcinogenic PAHs it represents, no strong correlation is observed in Europe (R² = 0.48), in agreement with results observed in Italy. The highest percentages of BaP have been observed in Croatia and Poland (around 22-23%), and the lowest in Cyprus and Spain (14-15%). Although data are often available for fewer than 10 monitoring stations, the existing records indicate that the percentage of BaP in Italy is comparable to that observed in the United Kingdom, Poland, Croatia, and Lithuania. In other countries, BaP percentages generally appear to be lower. Data are also reported for 2017 and 2018 in the Supplementary Material in Tables S21 and S22.
Concerning the percentage contribution of BaP to BEC, it is generally lower or similar to the average value observed in Italy, with the sole exception of Lithuania, where the value is 63%±1.2% (see Table 4). Among all countries, Spain shows the greatest standard deviation in % BEC-BaP, with BaP representing only 33% ±13% of the total BEC. The %BEC-BaP in European countries remained almost unchanged in 2017 and 2018, except for Spain, where it increased to 44% ± 12% and 50% ± 12 respectively. However, it should be noted that the monitoring sites for which data were available varied each year, and data coverage was most often ≤30% (see Tables S21 and S22).
4. Conclusions
The spatio-temporal study of PAHs in 10 urban Italian sites showed that BaP is capable of representing the behaviour of the entire PAHs class with a good degree of ap-proximation. However, when considering its effectiveness as a marker for the carcinoge-nicity of the class, it was found that BaP contributes between 51% ± 11% and 66% ± 7.5% to the overall toxicity of PAHs when BaP, BaA, BbF, BkF, DBA, and IPY are included.
Taking into account that PAHs — particularly those with four rings — may also be present in the gas phase, which was not investigated in this study, and that several PAHs occurring in ambient air are suspected to have carcinogenic effects (including BPE, one of the most abundant PAHs detected at Italian sites), the percentage attributed to BaP could be even lower.
Moreover, the toxicity percentage associated with BaP varies from site to site and is not constant throughout the year due to changes in the profiles of the class resulting from variations in sources and atmospheric processes to which the congeners are exposed due to meteorological conditions.
The study of data from urban sites available in official EU databases highlighted that, in 2019, the percentage of toxicity associated with BaP in 11 European countries was ge-nerally similar to or lower than that observed in Italy (33 ± 13% – 63 ± 1.2%).
The results suggest that it would be valuable to continue the assessment/investigation of BaP as a marker of PAHs toxicity, also considering the WHO’s Report on PAHs [55], which states that evaluating BaP alone might underestimate the cancer risk of the studied airborne PAHs mixtures.
The findings could support to national and European authorities in the ongoing process of establishing updated legislation to address the combined effects of chemicals, to better protect human health and the environment from risks posed by simultaneous exposure to multiple chemicals.
Supplementary Materials
The following supporting information can be downloaded at the website of this paper posted on Preprints.org, Table S1: EU harmonized classification for PAHs considered in the study; Table S2: Total annual precipitation (mm) and average temperature (°C) recorded for the investigated cities during the three-year period (2017- 2019); Table S3: Annual average concentrations of PM₁₀ (µg/m³) measured at the different monitoring stations during the three-year period (2017 – 2019); Table S4: Schedule of the weeks for which PAHs concentration data were collected; Table S5: Spearman correlation coefficients of the eight PAHs average concentration across the ten cities; Table S6: Minimum and maximum percentages of individual compounds relative to total PAHs, calculated on the basis of seasonal averages; Table S7: Eigenvalue of the correlation matrix for PCA analysis of seasonal PAHs throughout the entire monitoring campaign; Table S8: Coefficients of the PCA analysis throughout the entire monitoring campaign; Table S9: Eigenvalues of the correlation matrix for PCA analysis of seasonal PAHs in winter; Table S10: Coefficients of the PCA analysis for PAHS measured in winter; Table S11: Average diagnostic ratios calculated on data aggregated for astronomical season; Table S12 p-values of the Student’s t-tests for comparing the ratio values determined during the December-January and May-June periods in the same city; Table S13: p-values of the Student’s t-tests for comparing the BaA/(BaA+CHR) ratio values determined during the December-January periods; Table S14: p-values of the Student’s t-tests for comparing the BaA/(BaA+CHR) ratio values determined during the May-June periods; Table S15: p-values of the Student’s t-tests for comparing the IPY/(IPY+BPE) ratio values determined during the December-January periods; Table S16: p-values of the Student’s t-tests for comparing the IPY/(IPY+BPE) ratio values determined during the May-June periods; Table S17: p-values of the Student’s t-tests for comparing the BbF/BkF ratio values determined during the December-January periods; Table S18: p-values of the Student’s t-tests for comparing the BbF/BkF ratio values determined during the May-June periods; Table S19: p-values of the Student’s t-tests for comparing the BaP/BPE ratio values determined during the December-January periods; Table S20: p-values of the Student’s t-tests for comparing the BaP/BPE ratio values determined during the May-June periods; Table S21: BaP, carcinogenic PAHs concentrations, %BaP vs. carcinogenic PAHs, BaP equivalent concentration values (BEC) and percentage contribution of BaP to BEC (% BEC-BaP) in urban stations of ten European countries in 2017; Table S22: BaP, carcinogenic PAHs concentrations, %BaP vs. carcinogenic PAHs, BaP equivalent concentration values (BEC) and percentage contribution of BaP to BEC (% BEC-BaP) in urban stations of ten European countries in 2018; Figure S1: Positions of the monitoring sites across the Italian territory; Figure S2: Trend of BaP in the investigated sites during the whole measurement period; Figure S3: Box plot of the percentages of each PAH relative to total PAHs, evaluated using seasonal data over the entire measurement period; Figure S4: PCA biplot illustrating the projection of the variable (PAHs) onto the first two principal components based on data from all sites in winter; Figure S5: BaA/BaA+CHR diagnostic ratio values during the periods December–January and May–June; Figure S6: IPY/IPY+BPE diagnostic ratio values during the periods December–January and May–June; Figure S7: BbF/BkF diagnostic ratio values during the periods December–January and May–June; Figure S8: BaP/BEP diagnostic ratio values during the periods December–January and May–June; Figure S9: Means Comparison Plot of the post-hoc Tukey test for the ANOVA comparison of group means of the seasonal BaP/BPE ratios.
Author Contributions
Conceptualization, C.B and S.S.; methodology, C.B and S.S.; software, F.D ; data cu-ration, M.B., F.D., G.F.; writing—original draft preparation, C.B. and S.S.; writing—review and editing, C.B., S.S., M.B., F.D., M.C., G.F., C.L.; visualization, M.B., F.D., M.C.; funding acquisition-project administration, C.L. All authors have read and agreed to the published version of the manuscript.
Funding
The Authors would like to acknowledge the financial contribution received from the Agreement for the launch of special networks referred to in legislative decree no. 155 of the 13th August 2010, between the Ministry of environment and protection of land and sea (now Ministry of Environment and Energy Security), the National Council of Research (CNR), the National agency for new technologies, energy and sustainable economic development (ENEA) and the Istituto Superiore di Sanità (ISS), signed on the 23rd of December 2010, and approved by Directorial Decree, Prot. No. DVA-DEC-2010-993 of 27th of December 2010.
Data Availability Statement
The data presented in this paper is available on request at https://sdi.iia.cnr.it/nets/.
Acknowledgments
This work would not have been possible without the financial support of the Italian Ministry of Environment and Energy Security that involved CNR in the implementation of European legislation on ambient air quality. We take the opportunity to thank the colleagues from the Ministry and from the other partners involved in the project, ISS (Istituto Superiore di Sanità) and ENEA (Italian National Agency for New Technologies, Energy and Sustainable Economic Development), for the long and fruitful cooperation. Monitoring activities were carried out with the essential cooperation of ISS and the Regional Agencies for the Protection of the Environment (ARPA) of Calabria, Friuli Venezia Giulia, Lazio, Lombardia, Marche, Puglia, Toscana and Veneto. A special thanks also to all the colleagues from CNR that were involved, in various capacities, during the long story of the project.
Conflicts of Interest
The authors declare no conflicts of interest. The funder role consisted of general participation in the study design and authorization of the publication of the results.
References
- Lammel, G. Polycyclic Aromatic Compounds in the Atmosphere – A Review Identifying Research Needs. Polycycl Aromat Compd 2015, 35, 316–329. [Google Scholar] [CrossRef]
- Ravindra, K.; Sokhi, R.; Van Grieken, R. Atmospheric Polycyclic Aromatic Hydrocarbons: Source Attribution, Emission Factors and Regulation. Atmos Environ 2008, 42, 2895–2921. [Google Scholar] [CrossRef]
- IARC. Some Non-heterocyclic Polycyclic Aromatic Hydrocarbons and Some Related Exposures; IARC Monographs on the Evaluation of Carcinogenic Risks to Humans.: Lyon. France, 2010; Volume 92. [Google Scholar]
- Kim, K.H.; Jahan, S.A.; Kabir, E.; Brown, R.J.C. A Review of Airborne Polycyclic Aromatic Hydrocarbons (PAHs) and Their Human Health Effects. Environ Int 2013, 60, 71–80. [Google Scholar] [CrossRef]
- SCOEL. SCOEL/REC/404; Polycyclic Aromatic Hydrocarbon mixtures containing benzo[a]pyrene (PAH). Recommendation from the Scientific Committee on Occupational Exposure Limits. European Commission: Luxembourg, 2006.
- ECHA. Scientific Report for Evaluation of Limit Values for Polycyclic Aromatic Hydrocarbons at the Workplace; European Chemicals Agency: Helsinki, Finland, 2022. [Google Scholar]
- Regulation (EC) No 1272/2008 of the European Parliament and of the Council of 16 December 2008 on classification, labelling and packaging of substances and mixtures, amending and repealing Directives 67/548/EEC and 1999/45/EC, and amending Regulation (EC) No 1907/2006.
- Chrysikou, L.P.; Samara, C.A. Seasonal Variation of the Size Distribution of Urban Particulate Matter and Associated Organic Pollutants in the Ambient Air. Atmos Environ 2009, 43, 4557–4569. [Google Scholar] [CrossRef]
- Gaga, E.O.; Arı, A. Gas-Particle Partitioning and Health Risk Estimation of Polycyclic Aromatic Hydrocarbons (PAHs) at Urban, Suburban and Tunnel Atmospheres: Use of Measured EC and OC in Model Calculations. Atmos Pollut Res 2019, 10, 1–11. [Google Scholar] [CrossRef]
- WGPAH. Working Group on Polycyclic Aromatic Hydrocarbons. Ambient Air Pollution by Polycyclic Aromatic Hydrocarbons (PAH). In Position Paper; European Communities: Luxembourg, 2001. [Google Scholar]
- UNEP. Regulating Air Quality: The First Global Assessment of Air Pollution Legislation; United Nations Environment Programme: Nairobi, Kenya, 2021; ISBN 978-92-807-3872-5. [Google Scholar]
- Noth, E.M.; Lurmann, F.; Perrino, C.; Vaughn, D.; Minor, H.A.; Hammond, S.K. Decrease in Ambient Polycyclic Aromatic Hydrocarbon Concentrations in California’s San Joaquin Valley 2000–2019. Atmos Environ 2020, 242, 117818. [Google Scholar] [CrossRef]
- U.S. Environmental Protection Agency (EPA). Priority Pollutant List. U.S. Environmental Protection Agency, 2015. Available online: https://www.epa.gov/sites/default/files/2015-09/documents/priority-pollutant-list-epa.pdf (accessed on 19 December 2025).
- Zhang, J.; Li, J.; Wang, P.; Chen, G.; Mendola, P.; Sherman, S.; Ying, Q. Estimating Population Exposure to Ambient Polycyclic Aromatic Hydrocarbon in the United States – Part I: Model Development and Evaluation. Environ Int 2017, 99, 263–274. [Google Scholar] [CrossRef] [PubMed]
- Baek, K.M.; Seo, Y.K.; Kim, J.Y.; Baek, S.O. Monitoring of Particulate Hazardous Air Pollutants and Affecting Factors in the Largest Industrial Area in South Korea: The Sihwa-Banwol Complex. Environmental Engineering Research 2020, 25, 908–923. [Google Scholar] [CrossRef]
- Wu, Z.; Chen, X.; Wang, Z.; Chen, H.; Wang, Z.; Mu, Q.; Wu, L.; Wang, W.; Tang, X.; Li, J.; et al. Modeling of Polycyclic Aromatic Hydrocarbons (PAHs) from Global to Regional Scales: Model Development (IAP-AACM_PAH v1.0) and Investigation of Health Risks in 2013 and 2018 in China. Geosci Model Dev 2024, 17, 8885–8907. [Google Scholar] [CrossRef]
- Directive (EU) 2024/2881 of the European Parliament and of the Council of 23 October 2024 on ambient air quality and cleaner air for Europe (recast).
- Liu, X.; Zhang, H.; Pan, W.; Xue, Q.; Fu, J.; Liu, G.; Zheng, M.; Zhang, A. A Novel Computational Solution to the Health Risk Assessment of Air Pollution via Joint Toxicity Prediction: A Case Study on Selected PAH Binary Mixtures in Particulate Matters. Ecotoxicol Environ Saf 2019, 170, 427–435. [Google Scholar] [CrossRef]
- Pehnec, G.; Jakovljević, I. Carcinogenic Potency of Airborne Polycyclic Aromatic Hydrocarbons in Relation to the Particle Fraction Size. Int J Environ Res Public Health 2018, 15. [Google Scholar] [CrossRef]
- Directive (EU) 2020/2184 of the European Parliament and of the Council of 16 December 2020 on the quality of water intended for human consumption.
- Commission Regulation (EU) 2023/915 of 25 April 2023 on maximum levels for certain contaminants in food and repealing Regulation (EC) No 1881/2006.
- OECD. Considerations for Assessing the Risks of Combined Exposure to Multiple Chemicals. In Series on Testing and Assessment, No. 296; Environment, Health and Safety Division, Environment Directorate; OECD: Paris, France, 2018. [Google Scholar]
- Reti Speciali. Reti Speciali, 2025 https://www.retispeciali.it. accessed on. (accessed on 12 December 2025).
- Martino, M.; Tassone, A.; Angiuli, L.; Naccarato, A.; Dambruoso, P.R.; Mazzone, F.; Trizio, L.; Leonardi, C.; Petracchini, F.; Sprovieri, F.; et al. First Atmospheric Mercury Measurements at a Coastal Site in the Apulia Region: Seasonal Variability and Source Analysis. Environmental Science and Pollution Research 2022, 29, 68460–68475. [Google Scholar] [CrossRef]
- Eurostat. Statistics Explained: Urban–Rural Europe. 2024. Available online: https://ec.europa.eu/eurostat/statistics-explained/index.php?title=Urban-rural_Europe_-_introduction (accessed on 16 December 2025).
- Leogrande, S.; Alessandrini, E.R.; Stafoggia, M.; Morabito, A.; Nocioni, A.; Ancona, C.; Bisceglia, L.; Mataloni, F.; Giua, R.; Mincuzzi, A.; et al. Industrial Air Pollution and Mortality in the Taranto Area, Southern Italy: A Difference-in-Differences Approach. Environ Int 2019, 132. [Google Scholar] [CrossRef]
- Bostrom, C.E.; Gerde, P.; Hanberg, A.; Jernström, B.; Johansson, C.; Kyrklund, T.; et al. Cancer Risk Assessment, Indicators, and Guidelines for Polycyclic Aromatic Hydrocarbons in the Ambient Air. Environ. Health Perspect. 2002, 110 Suppl. 3, 451–488. [Google Scholar] [CrossRef] [PubMed]
- Delgado-Saborit, J.M.; Stark, C.; Harrison, R.M. Carcinogenic Potential, Levels and Sources of Polycyclic Aromatic Hydrocarbon Mixtures in Indoor and Outdoor Environments and Their Implications for Air Quality Standards. Environ Int 2011, 37, 383–392. [Google Scholar] [CrossRef] [PubMed]
- Tomasetig, F.; Tebby, C.; Graillot, V.; Zeman, F.; Pery, A.; Cravedi, J.P.; Audebert, M. Comparative Genotoxic Potential of 27 Polycyclic Aromatic Hydrocarbons in Three Human Cell Lines. Toxicol Lett 2020, 326, 99–105. [Google Scholar] [CrossRef] [PubMed]
- Aquilina, N.J.; Harrison, R.M. Evaluation of the Cancer Risk from PAHs by Inhalation: Are Current Methods Fit for Purpose? Environ Int 2023, 177. [Google Scholar] [CrossRef]
- ATSDR. Guidance for Calculating Benzo(a)pyrene Equivalents for Cancer Evaluations of Polycyclic Aromatic Hydrocarbons; Agency for Toxic Substances and Disease Registry, U.S. Department of Health and Human Services; Public Health Service: Atlanta, GA, USA, April 2022. [Google Scholar]
- Nisbet, I.C.T.; LaGoy, P.K. Toxic Equivalency Factors (TEFs) for Polycyclic Aromatic Hydrocarbons (PAHs). Regulatory Toxicology and Pharmacology 1992, 16, 290–300. [Google Scholar] [CrossRef]
- Larsen, J.C.; Larsen, P.B. Chemical Carcinogens. In Air Pollution and Health; Hester, R.E., Harrison, R.M., Eds.; The Royal Society of Chemistry: Cambridge, UK, 1998; pp. 33–35. [Google Scholar]
- Collins, J.F.; Brown, J.P.; Alexeeff, G.V.; Salmon, A.G. Potency Equivalency Factors for Some Polycyclic Aromatic Hydrocarbons and Polycyclic Aromatic Hydrocarbon Derivatives. Regul. Toxicol. Pharmacol. 1998, 28, 45–54. [Google Scholar] [CrossRef]
- European Environment Agency (EEA). European Air Quality Portal; European Environment Agency: Copenhagen, Denmark, 2025. AirQualityStatistics. Available online: https://discomap.eea.europa.eu/App/AQViewer/index.html?fqn=Airquality_Dissem.b2g (accessed on 11 June 2025).
- Regione Autonoma Friuli-Venezia Giulia. Rapporto Ambientale del Piano Regionale della Qualità dell’Aria; Decreto del Presidente della Regione n. 049 del 18 aprile 2024, Allegato 2; Regione Autonoma Friuli-Venezia Giulia: Trieste, Italy, 2024. [Google Scholar]
- Regione del Veneto. Piano Regionale di Tutela e Risanamento dell’Atmosfera; Regione del Veneto, Italy, 2025. Available online: https://www.regione.veneto.it/web/ambiente-e-territorio/piano-di-qualita-dellaria (accessed on 27 November 2025).
- Puglia, ARPA. Relazione annuale sulla qualità dell’aria a Taranto (anno 2020); ARPA Puglia: Bari, Italy, 2020. Available online: https://www.arpa.puglia.it/pagina3086_relazioni-annuali-sui-dati-della-qualit-dellaria-di-taranto.html (accessed on 24 November 2025).
- Rupakheti, D.; Khaiwal, R.; Chakraborty, D.; Pratap Singh, B. Statistical Analysis, Source Apportionment, and Toxicity of Particulate- and Gaseous-Phase PAHs in the Urban Atmosphere.
- Brown, A.S.; Brown, R.J.C. Correlations in Polycyclic Aromatic Hydrocarbon (PAH) Concentrations in UK Ambient Air and Implications for Source Apportionment. Journal of Environmental Monitoring 2012, 14, 2072–2082. [Google Scholar] [CrossRef] [PubMed]
- Xing, W.; Yang, L.; Zhang, H.; Zhang, X.; Wang, Y.; Bai, P.; Zhang, L.; Hayakawa, K.; Nagao, S.; Tang, N. Variations in Traffic-Related Polycyclic Aromatic Hydrocarbons in PM2.5 in Kanazawa, Japan, after the Implementation of a New Vehicle Emission Regulation. J Environ Sci (China) 2022, 121, 38–47. [Google Scholar] [CrossRef] [PubMed]
- Katsoyiannis, A.; Breivik, K. Model-Based Evaluation of the Use of Polycyclic Aromatic Hydrocarbons Molecular Diagnostic Ratios as a Source Identification Tool. Environmental Pollution 2014, 184, 488–494. [Google Scholar] [CrossRef]
- Dvorská, A.; Komprdová, K.; Lammel, G.; Klánová, J.; Plachá, H. Polycyclic Aromatic Hydrocarbons in Background Air in Central Europe - Seasonal Levels and Limitations for Source Apportionment. Atmos Environ 2012, 46, 147–154. [Google Scholar] [CrossRef]
- Han, Y.; Chen, Y.; Feng, Y.; Song, W.; Cao, F.; Zhang, Y.; Li, Q.; Yang, X.; Chen, J. Different Formation Mechanisms of PAH during Wood and Coal Combustion under Different Temperatures. Atmos Environ 2020, 222. [Google Scholar] [CrossRef]
- Ray, D.; Ghosh, S.K.; Raha, S. Impacts of Photochemical Ageing on the Half-Lives and Diagnostic Ratio of Polycyclic Aromatic Hydrocarbons Intrinsic to PM2.5 Collected from ‘Real-World’ like Combustion Events of Wood and Rice Straw Burning. J Hazard Mater 2019, 366, 10–15. [Google Scholar] [CrossRef]
- Zheng, X.; Wu, Y.; Zhang, S.; Hu, J.; Zhang, K.M.; Li, Z.; He, L.; Hao, J. Characterizing Particulate Polycyclic Aromatic Hydrocarbon Emissions from Diesel Vehicles Using a Portable Emissions Measurement System. Sci Rep 2017, 7. [Google Scholar] [CrossRef]
- Famiyeh, Lord; Chen, K.; Xu, J.; Sun, Y.; Guo, Q.; Wang, C.; Lv, J.; Tang, Y.T.; Yu, H.; Snape, C.; et al. A Review on Analysis Methods, Source Identification, and Cancer Risk Evaluation of Atmospheric Polycyclic Aromatic Hydrocarbons. Science of the Total Environment 2021, 789. [Google Scholar] [CrossRef]
- Cecinato, A.; Guerriero, E.; Balducci, C.; Muto, V. Use of the PAH Fingerprints for Identifying Pollution Sources. Urban Clim 2014, 10, 630–643. [Google Scholar] [CrossRef]
- Tobiszewski, M.; Namieśnik, J. PAH Diagnostic Ratios for the Identification of Pollution Emission Sources. Environmental Pollution 2012, 162, 110–119. [Google Scholar] [CrossRef] [PubMed]
- Yunker, M.B.; Macdonald, R.W.; Vingarzan, R.; Mitchell, R.H.; Goyette, D.; Sylvestre, S. PAHs in the Fraser River Basin: A Critical Appraisal of PAH Ratios as Indicators of PAH Source and Composition.
- Akyüz, M.; Çabuk, H. Particle-Associated Polycyclic Aromatic Hydrocarbons in the Atmospheric Environment of Zonguldak, Turkey. Science of the Total Environment 2008, 405, 62–70. [Google Scholar] [CrossRef] [PubMed]
- Finardi, S.; Radice, P.; Cecinato, A.; Gariazzo, C.; Gherardi, M.; Romagnoli, P. Seasonal Variation of PAHs Concentration and Source Attribution through Diagnostic Ratios Analysis. Urban Clim 2017, 22, 19–34. [Google Scholar] [CrossRef]
- Manoli, E.; Kouras, A.; Samara, C. Profile Analysis of Ambient and Source Emitted Particle-Bound Polycyclic Aromatic Hydrocarbons from Three Sites in Northern Greece. Chemosphere 2004, 56, 867–878. [Google Scholar] [CrossRef]
- Clément, N.; Muresan, B.; Hedde, M.; François, D. PAH Dynamics in Roadside Environments: Influence on the Consistency of Diagnostic Ratio Values and Ecosystem Contamination Assessments. Science of the Total Environment 2015, 538, 997–1009. [Google Scholar] [CrossRef]
- WHO. Human health effects of polycyclic aromatic hydrocarbons as ambient air pollutants: report of the Working Group on Polycyclic Aromatic Hydrocarbons of the Joint Task Force on the Health Aspects of Air Pollution; WHO Regional Office for Europe: Copenhagen; CC BY-NC-SA 3.0 IGO: Licence, 2021. [Google Scholar]
Figure 1.
Box plots of the sum of the eight evaluated PAHs over the entire measurement period.
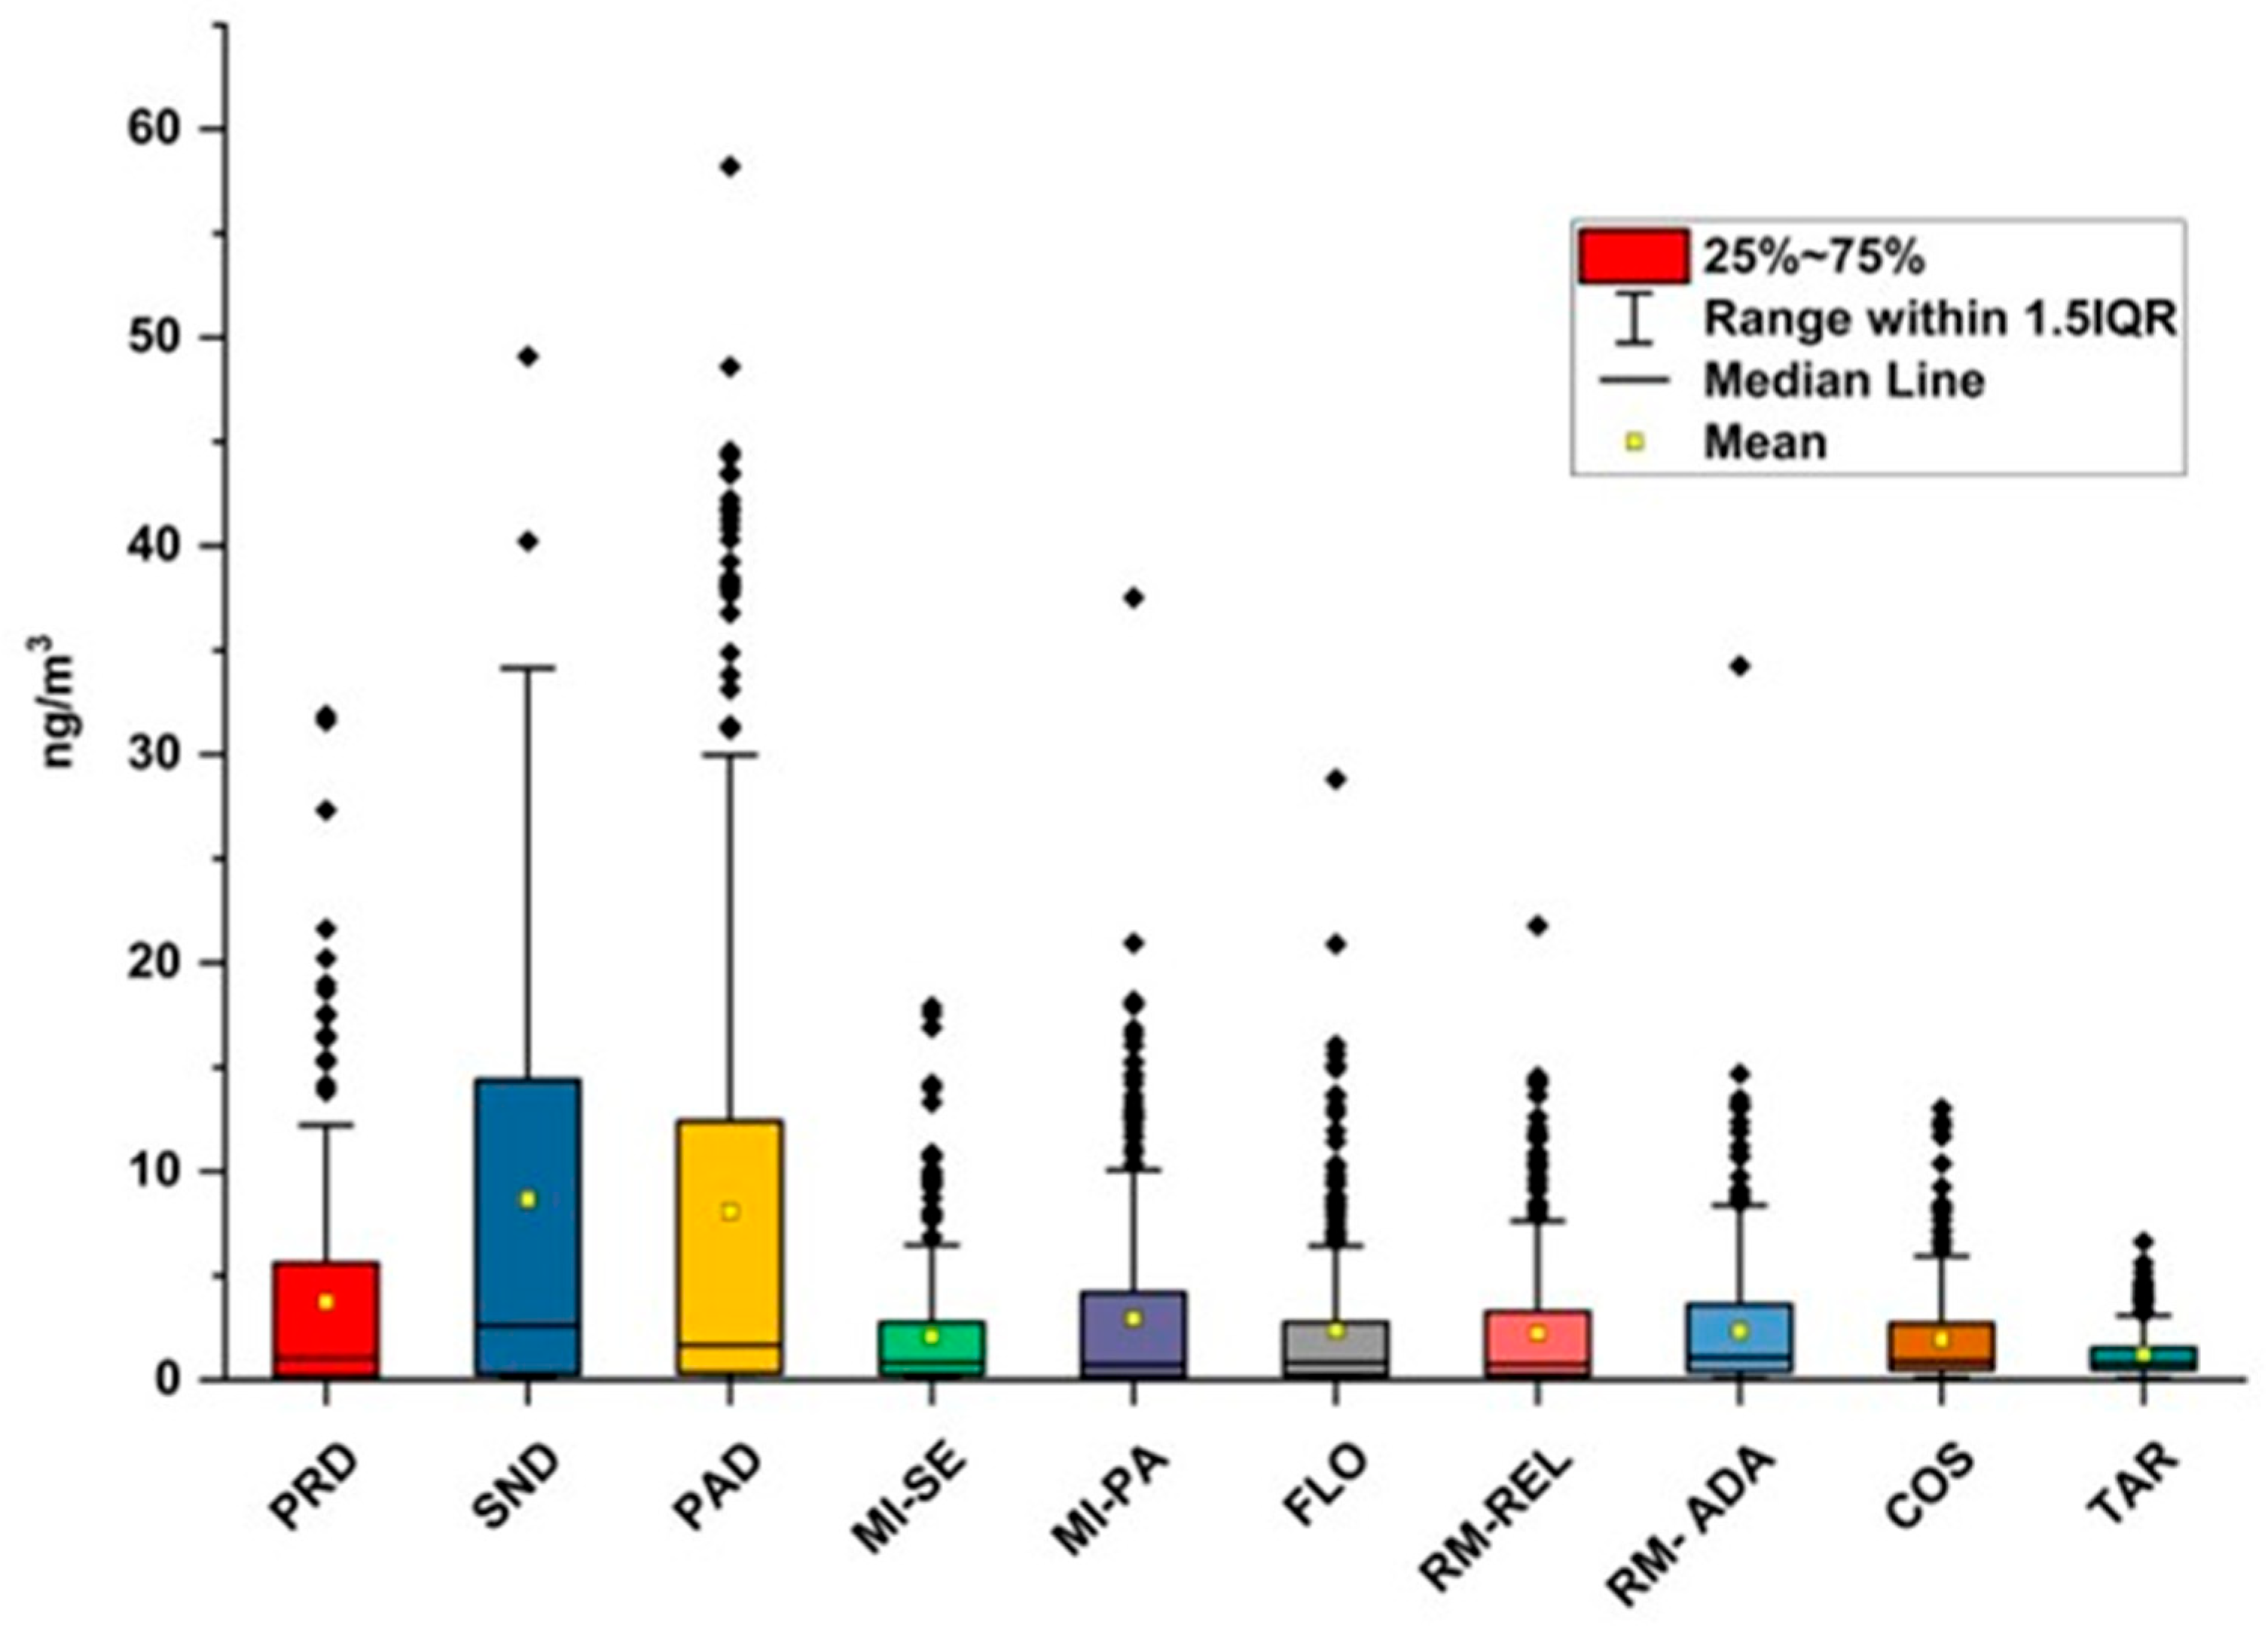
Figure 2.
Comparison of the average compound’s concentration at the various sites. Each site is identified by a unique color.
Figure 2.
Comparison of the average compound’s concentration at the various sites. Each site is identified by a unique color.
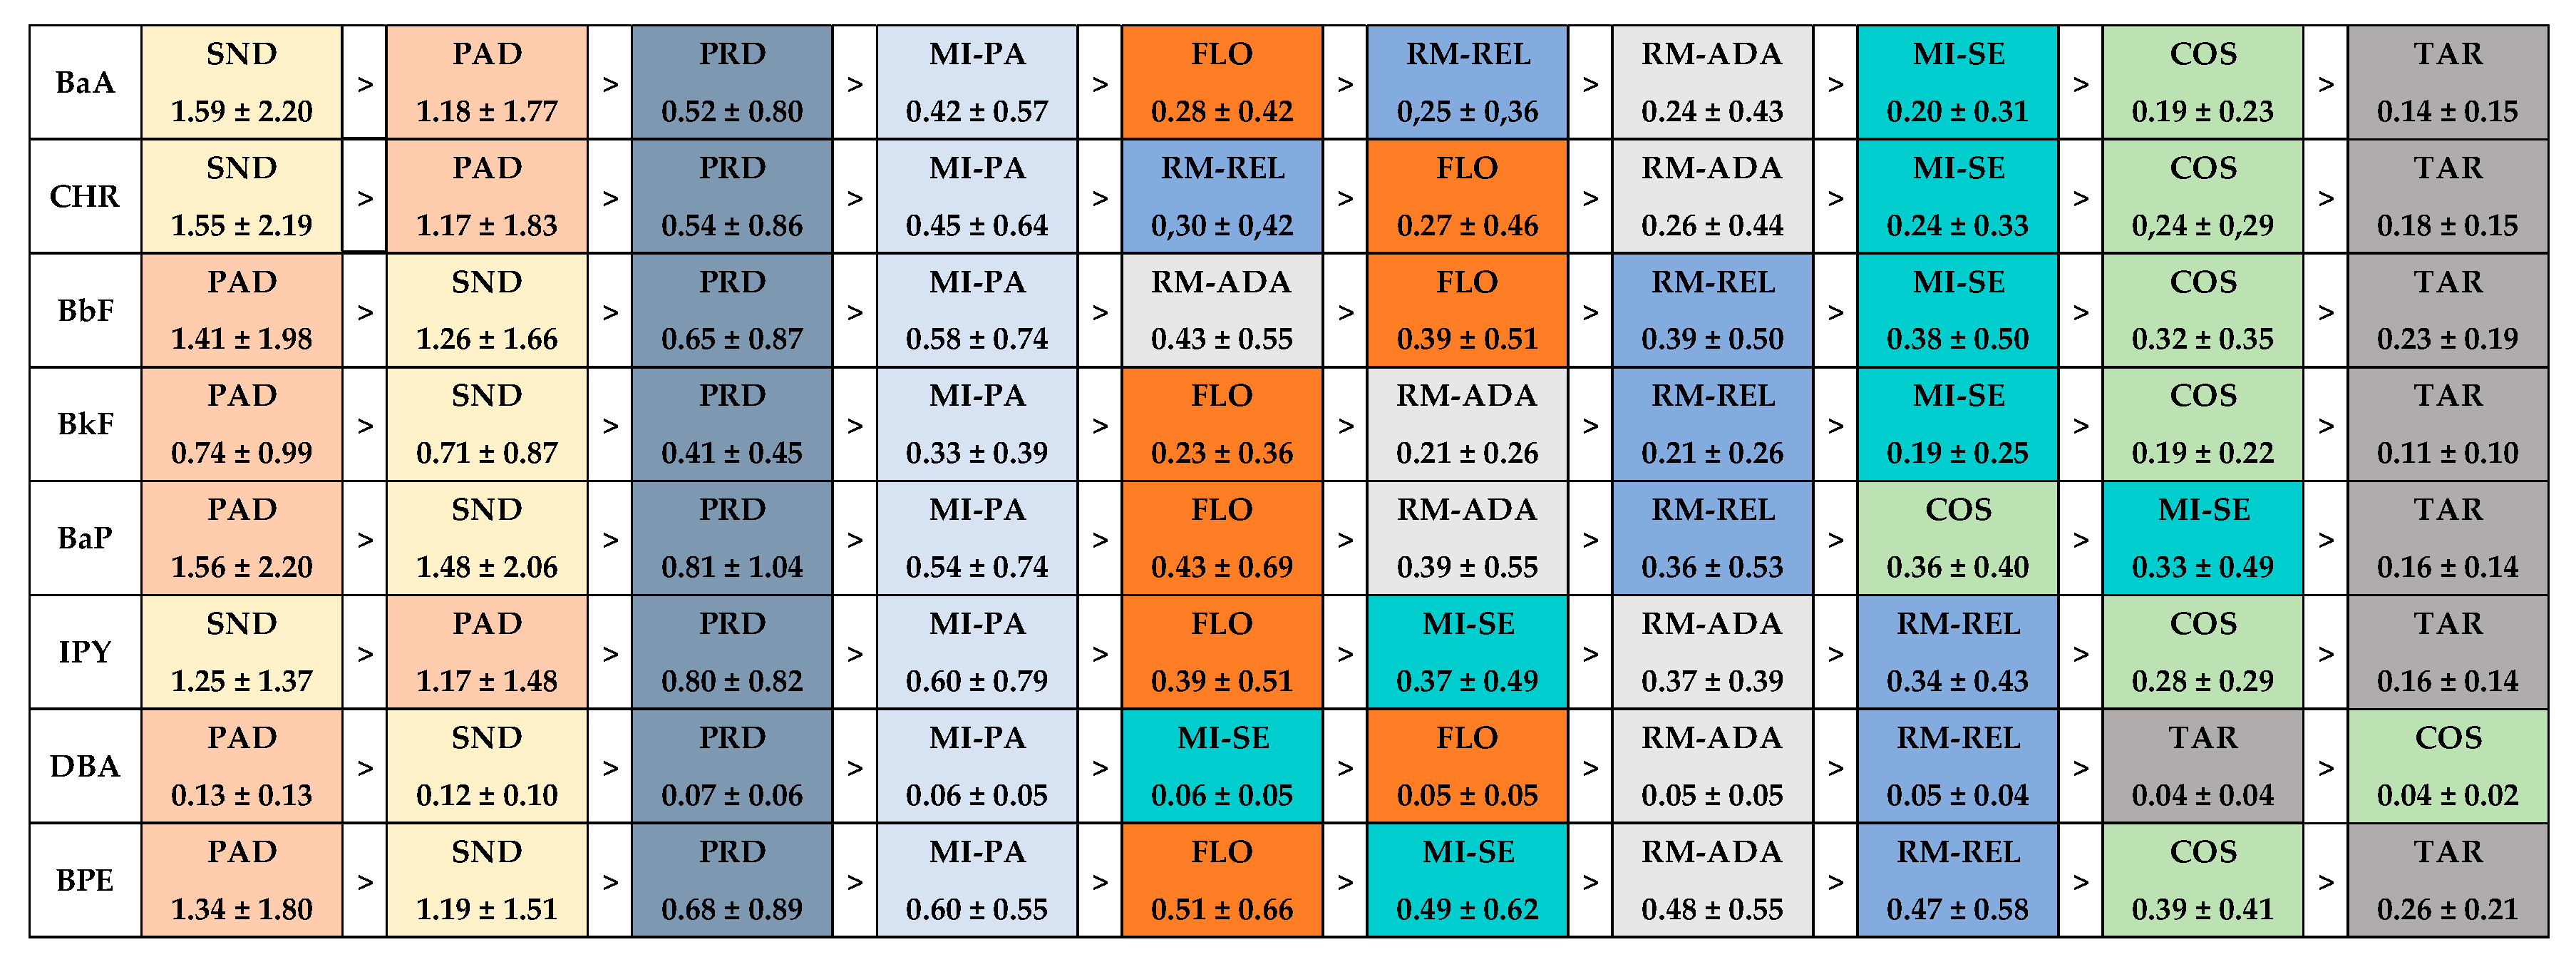
Figure 3.
Average seasonal PAHs concentrations.
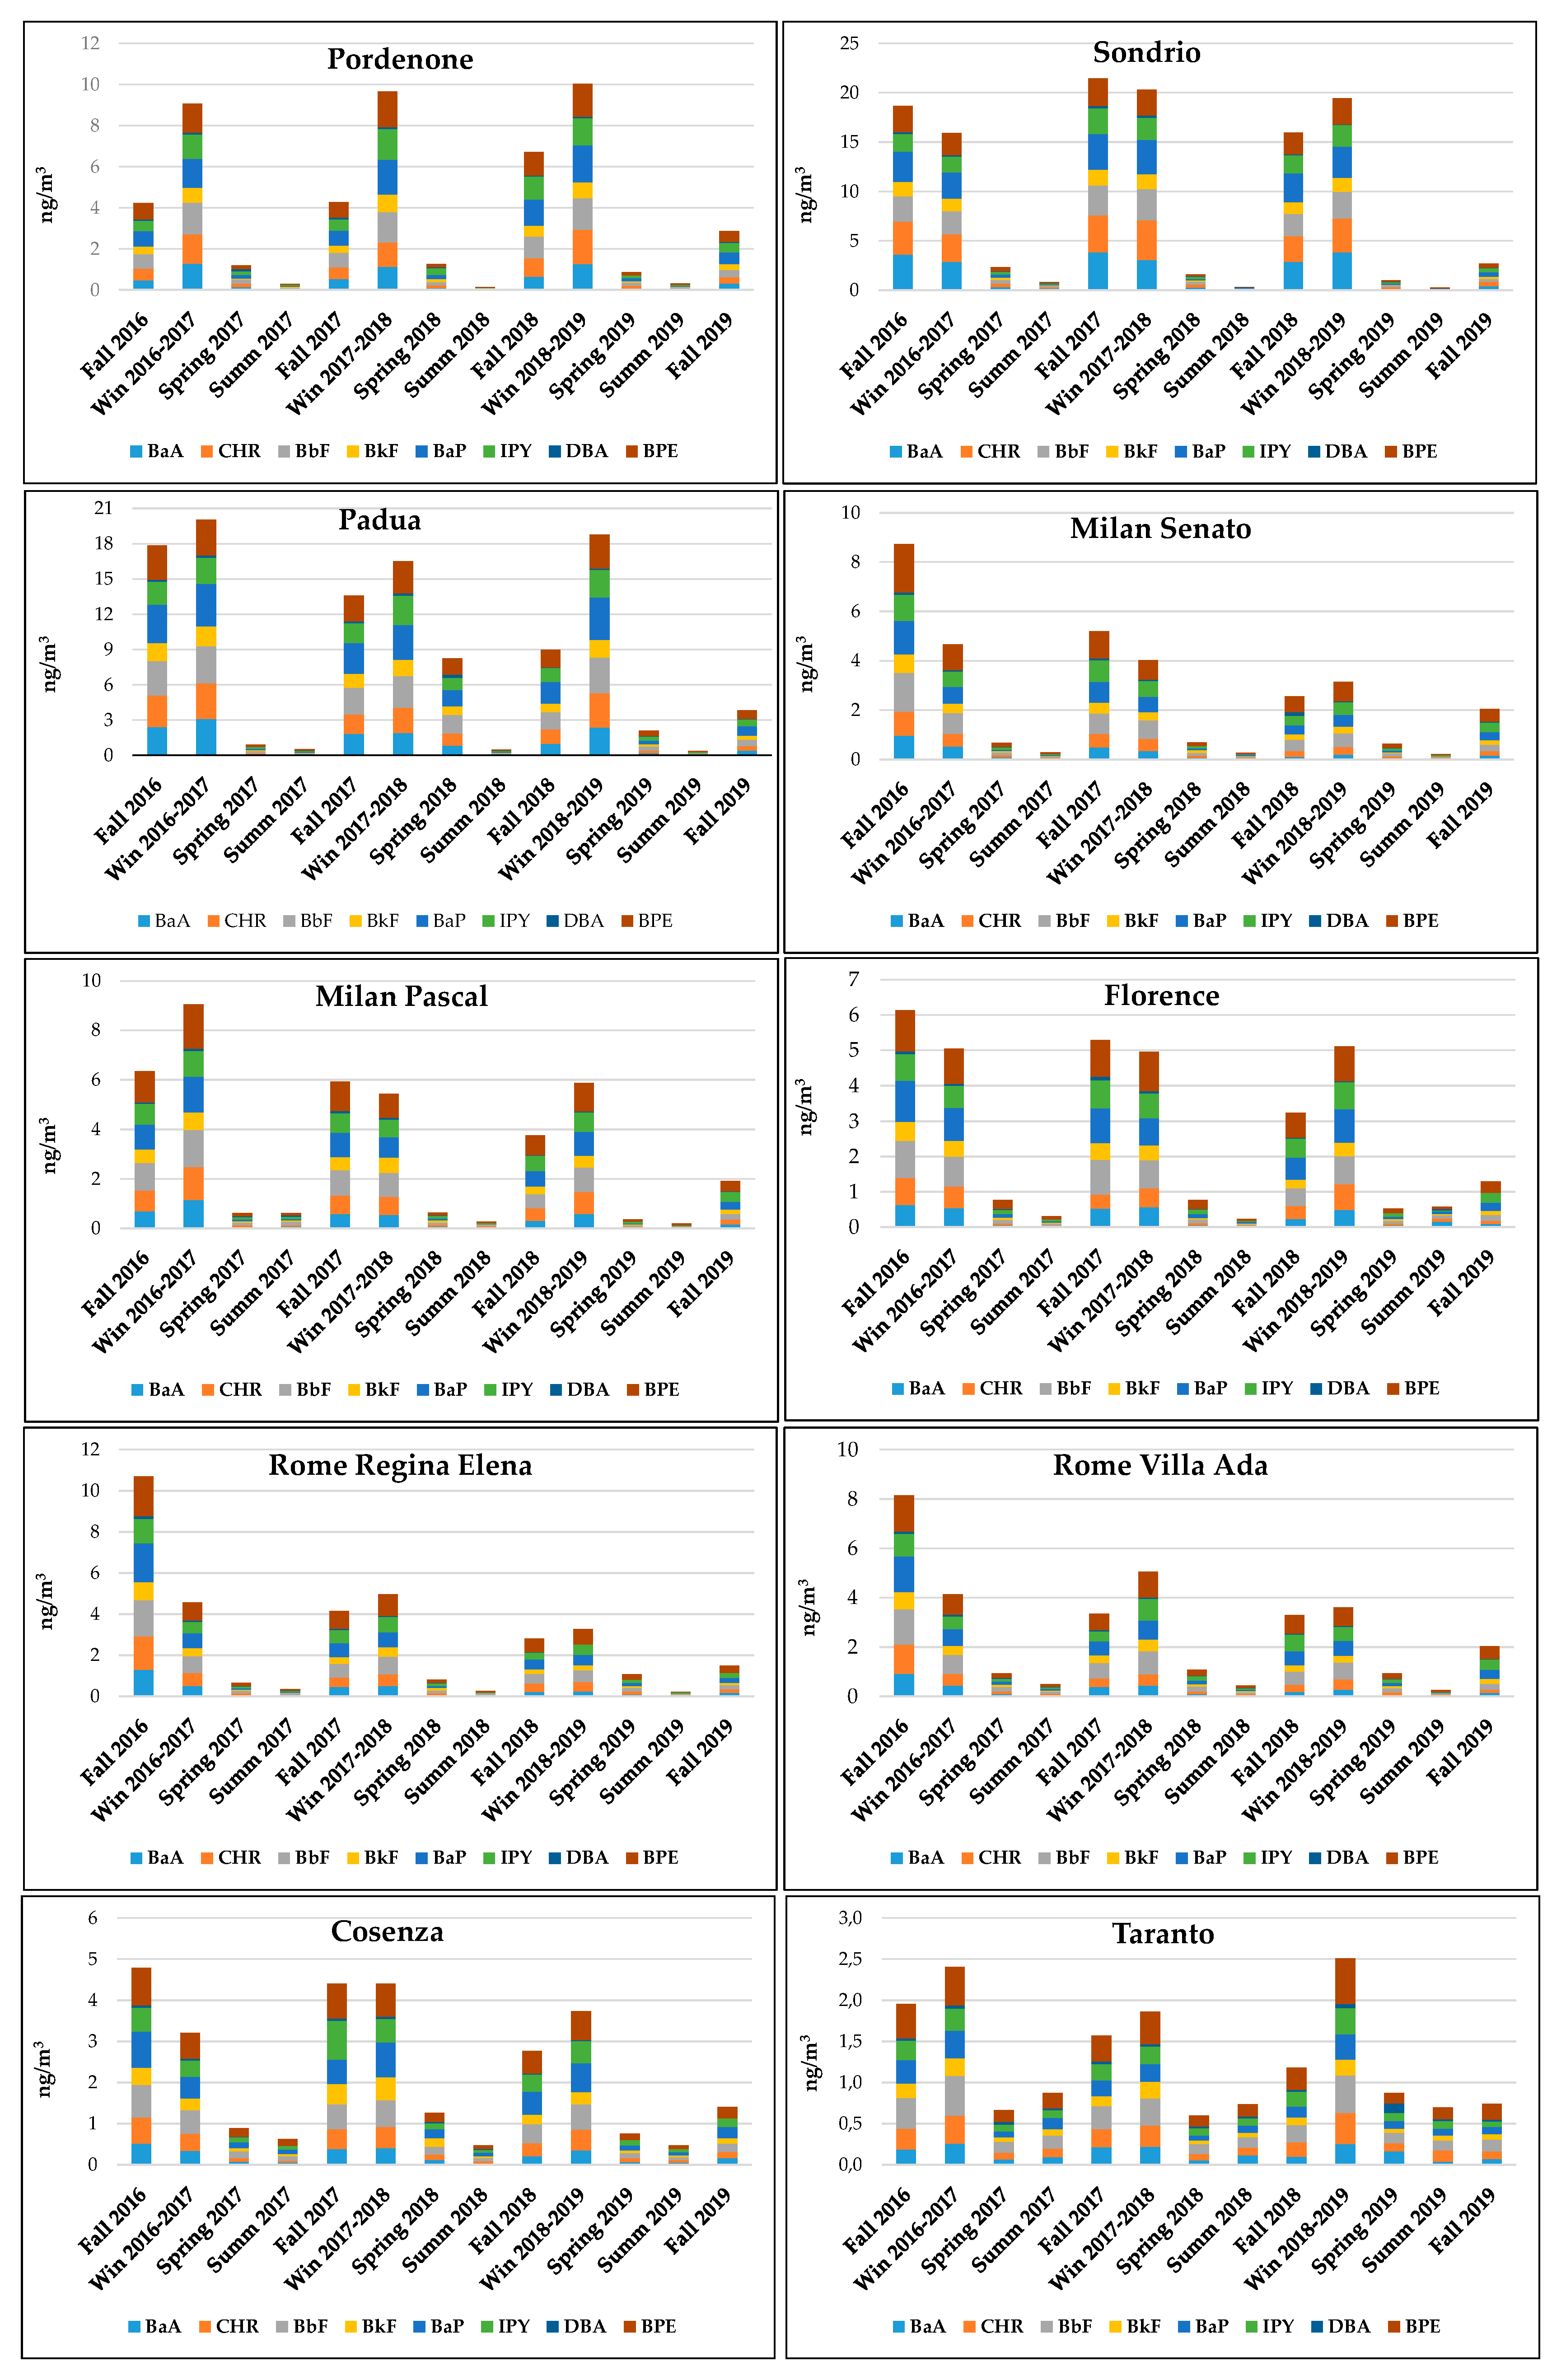
Figure 4.
Biplot of Principal Component Analysis (PCA) showing the projection of variables (PAHs) onto the first two principal components. Observation labels indicate the site, season (F= fall; W = winter; SP= spring; S = summer), and year of measurement. Black, red, green, and blue ellipses represent the 95% confidence intervals for measurements conducted in fall, spring, summer, and winter, respectively.
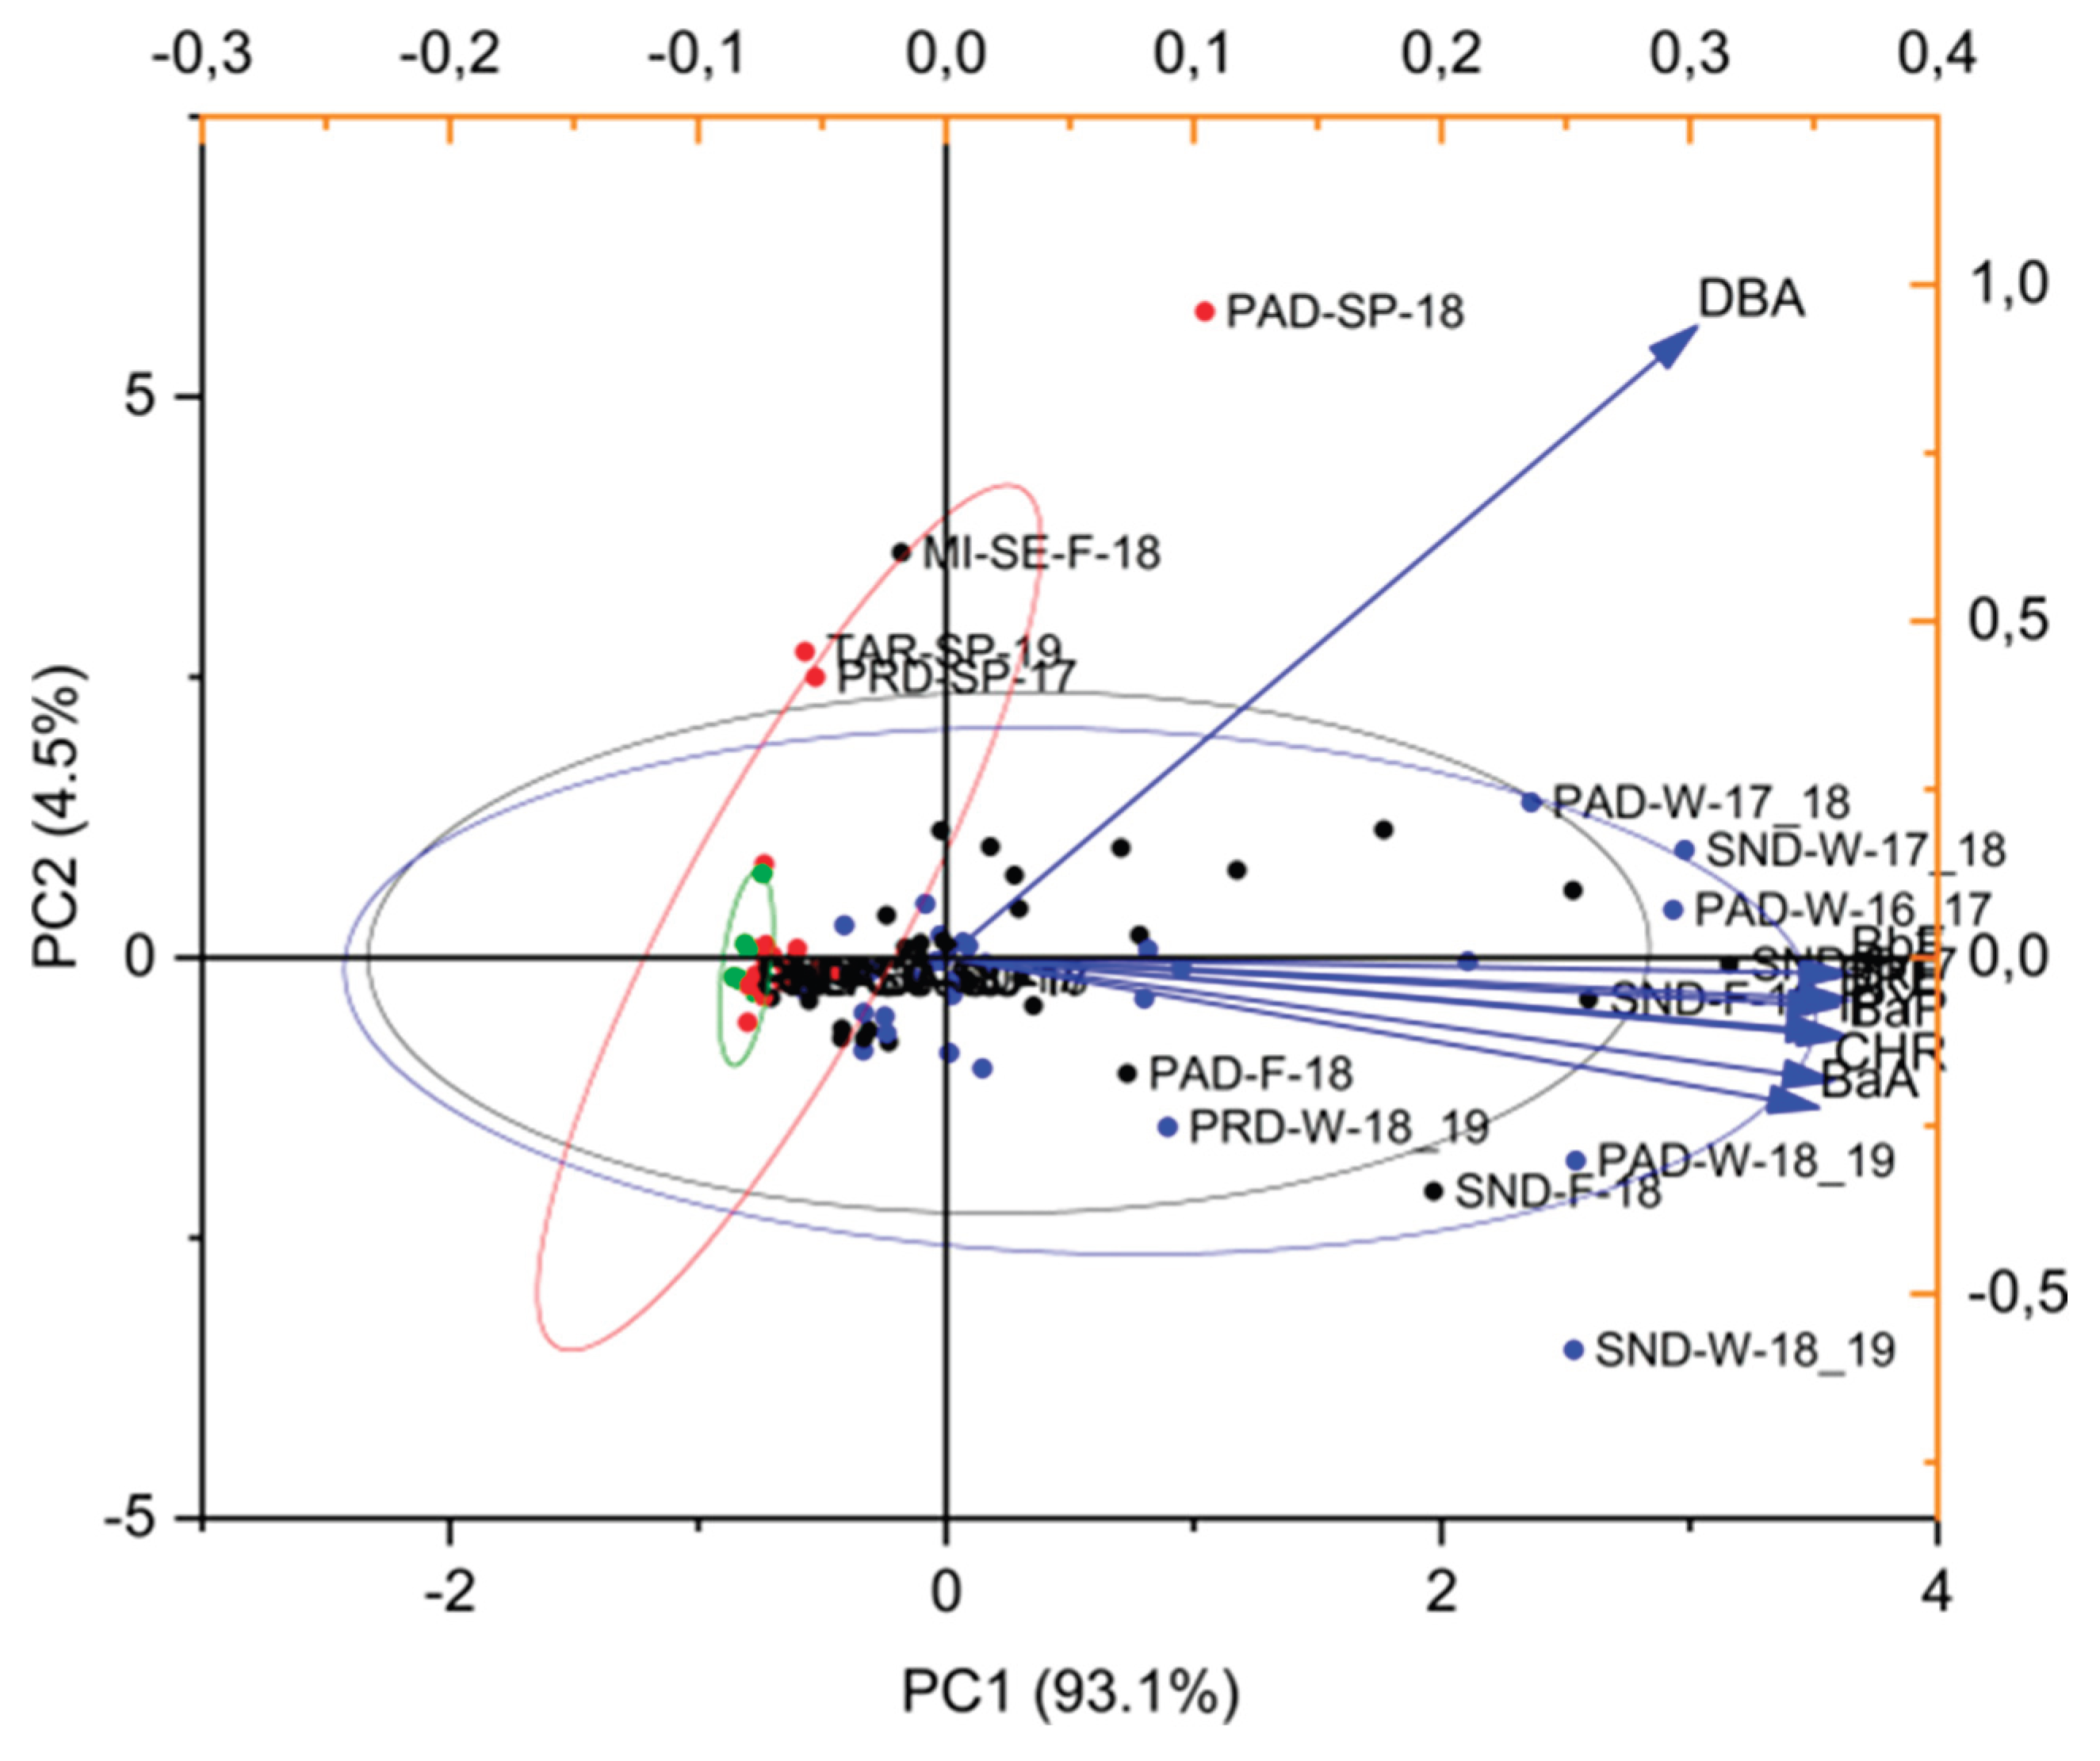

Table 1.
Basic information of monitoring stations.
| ID | Region | Municipality | Inhabitants | Naming | Classification | Latitude | Longitude |
|---|---|---|---|---|---|---|---|
| SND | Lombardy | Sondrio | 21,244 | Centro, v.Paribelli |
Urban background |
46°10’04.29” | 9°52’45.07” |
| PRD | Friuli- Venezia Giulia | Pordenone | 52,344 | Pordenone centro |
Urban traffic |
45°57’44.20” | 12°39’28.81” |
| MI-PA | Lombardy | Milan | 1,371,850 | Milano Pascal - Città Studi |
Urban background |
45°28’42.01” | 9°13’54.07” |
| MI-SE | Lombardy | Milan | 1,371,850 | Milano Senato |
Urban traffic |
45°28’13.89” | 9°11’50.94” |
| PAD | Veneto | Padua | 207,301 | PD-Mandria |
Urban background |
45°22’15.50” | 11°50’27.00” |
| FLO | Tuscany | Florence | 363,837 | FI- Bassi |
Urban background |
43°47’08.31” | 11°17’11.87” |
| RM-ADA | Latium | Rome | 2,754,719 | Villa Ada |
Urban background |
41°55’58.48” | 12°30’25.09” |
| RM-REL | Latium | Rome | 2,754,719 | ISS station – Viale Regina Elena |
Urban traffic |
41°54’16.46” | 12°31’2.66” |
| TAR | Apulia | Taranto | 186,798 | Taranto via Machiavelli |
Urban Industrial |
40°29’18.71” | 17°13’33.14” |
| COS | Calabria | Cosenza | 63,693 | Città dei Ragazzi |
Urban background |
39°18’52.26” | 16°14’43.97” |
Table 2.
Potency Equivalency Factors (PEFs) for PAHs considered in the study [31].
Table 2.
Potency Equivalency Factors (PEFs) for PAHs considered in the study [31].
| CAS Number | PAH | PEF |
|---|---|---|
| 50-32-8 | Benzo(a)pyrene | 1 |
| 56-55-3 | Benzo(a)anthracene | 0.1 |
| 205-99-2 | Benzo(b)fluoranthene | 0.1 |
| 207-08-9 | Benzo(k)fluoranthene | 0.1 |
| 218-01-9 | Chrysene | 0.01 |
| 193-39-5 | Indeno(1,2,3-cd)pyrene | 0.1 |
| 53-70-3 | Dibenzo(a,h)anthracene | 2.4 |
Table 3.
Average percentage contribution of BaP to carcinogenic and respective percentage standard deviation; BaP equivalent concentration values (BEC) and percentage contribution of BaP to BEC (% BEC-BaP) at the Italian sites, over the entire monitoring campaign.
Table 3.
Average percentage contribution of BaP to carcinogenic and respective percentage standard deviation; BaP equivalent concentration values (BEC) and percentage contribution of BaP to BEC (% BEC-BaP) at the Italian sites, over the entire monitoring campaign.
| Site ID | % BaP in Carcinogenic PAHs | BEC (ng/m3) | (%) BEC-BaP (%) | ||
|---|---|---|---|---|---|
| average ± std dev | % std dev | average ± std dev | average ± std dev | % std dev | |
| PRD | 24 ± 3.0 | 13 | 1.0±0.86 | 62±12 | 19 |
| SND | 21 ± 4.1 | 20 | 2.2±2.1 | 60 ±12 | 20 |
| PAD | 25 ± 3.2 | 13 | 2.3±1.9 | 64 ± 9.7 | 15 |
| MI-SE | 21 ± 2.9 | 14 | 0.61 ± 0.57 | 56 ± 11 | 19 |
| MI-PA | 20 ± 4.8 | 24 | 0.75 ± 0.67 | 55 ± 17 | 30 |
| FLO | 24 ± 3.9 | 16 | 0.68 ± 0.59 | 63 ± 10.7 | 17 |
| RM-REL | 21 ± 4.6 | 22 | 0.65 ± 0.71 | 58.8 ± 12.7 | 22 |
| RM-ADA | 23 ± 2.6 | 11 | 0.66 ± 0.56 | 60 ± 8.6 | 14 |
| COS | 26 ± 2.8 | 11 | 0.58 ± 0.40 | 66 ± 7.5 | 11 |
| TAR | 19 ± 2.7 | 14 | 0.31 ± 0.14 | 51 ± 11 | 21 |
| average | 22 ± 2.2 | 10 | 1.0 ± 0.69 | 61 ± 4.4 | 7.3 |
Table 4.
BaP, cancerogenic PAHs concentrations, %BaP vs. cancerogenic, BaP equivalent concentration values (BEC) and percentage contribution of BaP to BEC (% BEC-BaP) in urban stations of 11 European countries in 2019 [35].
Table 4.
BaP, cancerogenic PAHs concentrations, %BaP vs. cancerogenic, BaP equivalent concentration values (BEC) and percentage contribution of BaP to BEC (% BEC-BaP) in urban stations of 11 European countries in 2019 [35].
| Country | n. sites | BaP (ng/m3) | Carcinogenic PAHs (ng/m3) | BaP (%) | BEC ng/m3 | % BEC-BaP |
|---|---|---|---|---|---|---|
| United Kingdom | 24 | 0.34 ±0.38 | 1.6 ±1.7 | 21 ±1.9 | 0.60±0.66 | 56±2.9 |
| France | 21 | 0.15 ± 0.07 | 0.83 ± 0.59 | 19±3.3 | 0.27±0.14 | 56±8.9 |
| Poland | 17 | 2.4 ± 1.3 | 10±5.1 | 23±3.4 | 4.5±2.6 | 57±15 |
| Germany | 13 | 0.29± 0.11 | 1.6 ± 0.62 | 18 ±1.8 | 0.55±0.21 | 53±4.0 |
| Spain | 6 | 0.35± 0.40 | 2.3 ±2.6 | 15±1.8 | 0.60± 0.64 | 33 ± 13 |
| Lithuania | 4 | 0.67± 0.28 | 3.0±1.1 | 22±0.88 | 1.1±0.40 | 63±1.2 |
| Latvia | 4 | 0.40± 0.07 | 2.1± 0.34 | 19±1.2 | 0.72±0.11 | 56±2.0 |
| Croatia | 3 | 1.5±0.29 | 6.7± 1.3 | 23±0.23 | 2.6±0.5 | 59±0.1 |
| Cyprus | 1 | 0.05 | 0.37 | 14 | 0.09 | 54 |
| Finland | 1 | 0.27 | 1.6 | 18 | 0.57 | 49 |
| Malta | 1 | 0.11 | 0.63 | 17 | 0.18 | 59 |
Disclaimer/Publisher’s Note: The statements, opinions and data contained in all publications are solely those of the individual author(s) and contributor(s) and not of MDPI and/or the editor(s). MDPI and/or the editor(s) disclaim responsibility for any injury to people or property resulting from any ideas, methods, instructions or products referred to in the content. |
© 2025 by the authors. Licensee MDPI, Basel, Switzerland. This article is an open access article distributed under the terms and conditions of the Creative Commons Attribution (CC BY) license (http://creativecommons.org/licenses/by/4.0/).
Copyright: This open access article is published under a Creative Commons CC BY 4.0 license, which permit the free download, distribution, and reuse, provided that the author and preprint are cited in any reuse.


