
Submitted:
22 December 2025
Posted:
24 December 2025
You are already at the latest version
Abstract
Chemical composition of aquatic habitats, including the concentration of chemical contaminants at the aquatic sediments is of great concern to the quality of aquatic environment. A study was carried out to assess variability in particle size distribution (PSD), concentrations of heavy metals (HM) and polycyclic aromatic hydrocarbons (PAHs) across major water bodies in Owerri Municipal. Stratified random sampling technic was employed; the two rivers put together were stratified into eight (8) sampling stations (SS) comprising of three (3) locations along Nworie River (SS1-3) and five (5) locations along Otamiri River (SS4-8). Samples were collected in triplicates. Samples were analyzed in a laboratory, and data generated were subjected to descriptive statistics and analysis of variance using SPSS version 23. Significant means were separated using Duncan Multiple Range Test at 5 % probability level. Results revealed that the sediments vary in PSD; the highest amount of sand (71.8 %), silt (77.6 %), and clay (62.7 %) were observed at SS1, SS4, and SS3, respectively, while the lowest percentage of sand (6.5 %) and clay (20.1 %) were observed at SS3 and (SS1 and 8), respectively. The concentrations of the HM and PAHs varied significantly (P≤0.05); the highest mean concentrations of As, Cd, Cr, Fe, Mn, Ni, Pb, Se, and PAHs were observed at SS4, SS1, SS3, SS1, SS3, SS6, SS1, SS8, and SS1, respectively. Among the various sampling stations, SS1 had the greatest ecological hazard potential to the aquatic ecosystem. Regular monitoring and pollution mitigation strategies are required to reduce pollution and safeguard the environment.
Keywords:
heavy metals
; polycyclic aromatic hydrocarbon
; sediment
; Nworie
; Otamiri
; river
Introduction
The surging concentrations of heavy metals in aquatic environments is a serious health and environmental issue, particularly in third-world countries where pollution is on the rise as a result of increased industrialization and production, intensified agricultural practices and inadequate waste control. Other activities, such as sand mining and dredging aggravate the problem by disturbing sediments and mobilizing previously sequestered contaminants Ma et al. (2024).
The findings of Wang et al. (2024) established that there are different levels of pollution and environmental hazards in aquatic sediments, which confirms that sediments are a sink, and are the major source of heavy metals in the aquatic environment. The results also revealed urbanization to be directly correlated with the degree of pollution. The study emphasized the need to monitor sediment pollution in urban river systems and manage it on a risk basis. Batapola et al. (2024) analyzed the heavy metal pollution patterns of freshwater lake sediments in an area that was relatively near to the Eppawala Phosphate Deposit (EPD) in Sri Lanka. The data showed that the concentration of contaminants in sediments upstream of the EPD was high and the most significant one was As, followed by Cr. As and Cd were both classified as moderate-high ecological hazards. Spatial patterning suggested that the EPD was not the main contributor of metal enrichment, but that atmospheric deposition of phosphate fertilizer dusts was the main contributor, since metal concentrations were directly related to P2O5 content. A study by Ma et al. (2024) explores the issue of heavy metal pollution and its historical trend in the sediments of the Pearl River Estuary (PRE) and demonstrates how anthropogenic activities affect the quality of the sediments over the years. Salas et al., (2025) noted that high levels of total suspended solids and total dissolved solids, which constitute aquatic sediments may impair the water clarity, alter physicochemical characteristics, and pose a threat to aquatic organisms by being toxic and shifting the habitat. These solids include inorganic precipitates, organic waste, silt, and clay, as well as plankton and dissolved ions including heavy metals, which may cause organisms gastrointestinal, cardiovascular, and genotoxic effects and increase ecological stress further (Pushpalatha et al., 2022).
Polycyclic Aromatic Hydrocarbon (PAH) is a recurring pollutant of ecotoxocological importance in rivers flowing through urban areas. PAH contamination in the aquatic ecosystem raises a lot of concern due to its known carcinogenic tendencies (Aiyesanmi et al., 2021). Its persistence in the aquatic environment could pose high risks to the health of humans and biota in the environment. The high molecular weight, carcinogenic PAH are more persistent due to their complexity and are more predominant in sediment prone to PAH exposures. The less complex PAH molecules are more easily absorbed into the environment. In southern western Nigeria, Aiyesanmi et al. (2021) carried out research to determine the effect of organochlorine pesticides (OCP) and PAH on the Onuku river in Okitipupa, Ondo. The study employed Gas chromatography to identify and quantify the various PAH compounds in the soil, in which only five (5) types of PAH were detected. The predominant PAH were the 6-ring ones which made up 75.6% of the total PAH composition. The toxic equivalency factors (TEF) and the equivalent concentrations revealed that the PAH had low potential for carcinogenicity. PAH levels detected were not beyond permissible levels, but the study recommended continuous monitoring. However, in a study carried out to investigate the ecological and the health risks of persistent PAH in the sediment of the River Benue, Arowojolu et al. (2021) collected samples from 6 locations along the river in Makurdi metropolis and subjected them to gas chromatography/ mass spectrometry for 14 PAH types. Results revealed that the concentration of the fourteen (14) PAHs in the samples ranged between 55 ± 3 to 382 ± 9 µg·kg−1. It was revealed that petrogenic combustion, combustion of coal, wood and vehicular emissions contributed 35%, 21%, and 17%, respectively to the PAH in the sediment. The study recommended that due to the findings that petrogenic sources were the major contributors of PAH in the river, there should be further investigations to confirm the presence of crude oil. In order to investigate the impact of continuous exposure of the River Nwaenebo to effluent from a nearby petroleum depot, Ugochukwu et al. (2022) collected 72 sediment samples from the River Nwaenebo in Enugu State where there was a nearby petroleum depot from which effluent was passed for over twenty years. The results revealed a dominance of 5-ring PAHs. The concentration of PAH downstream was significantly high compared to upstream which was not significantly polluted, which led to the conclusion that the PAHs contamination was from the petroleum depot. Ukachukwu et al., (2022) carried out a study on the carcinogenic and non-carcinogenic PAH in Owerri. They collected water and sediment samples from Nworie river and analysed them using Soxhlet extraction-gas chromatography-flame ionization detection (SE-GC-FID) method. In the study, thirteen (13) types of PAHs were detected in water and sediment samples, and five (5) of them were carcinogenic PAHs, which were within the range of 0.55±0.1 and 0.87± 0.11. Research findings have shown that there are significant relationships between solid particle sizes of sediments and concentration of sequestered chemical contaminants. Nwawuike et al (2024) noted that the texture of aquatic sediments influences the amount and type of heavy metal contents of the sediments. The study shows that fine particles have more ability to sequester chemical contaminants, such as heavy metals and PAHs, than the coarse particles. Consequently, aquatic sediments with increased content of fine particles would contain greater concentration of chemical contaminants relative to the coarse texture sediments. This study was therefore necessitated by the dearth of research-based documented information on the textural composition, heavy metals, and polycyclic aromatic hydrocarbon content of sediments across the major rivers in Owerri municipal. Thus, this study aims at assessing the particle size distribution, concentration of heavy metals and polycyclic aromatic hydrocarbons in the sediments of the major rivers in Owerri municipal.
Materials and Methods
- Location of study area
The research was carried out at Nworie and Otamiri Rivers, which are two ecologically and socio-economically important water bodies situated in Owerri city, Imo State, Southeastern Nigeria. The area lies within latitudes 50 4′ N and 60 3′ N and longitude 60 15′ E and 70 34′ E. The Nworie river has its source at Ohi in Mbaitoli L.G.A., flows through Owerri west L.G.A., Owerri municipal and empties into Otamiri river at Aba Road (Amangabara, 2015). Otanmiri River has its source from Egbu in Owerri North L.G.A. and flows through Owerri municipal where it meets the Nworie River and flows through parts of Owerri West L.G.A.to Ohaji Egbema L.G.A.
- Description of the study area
The area falls within the rainforest zone of Nigeria with an annual rainfall between 1700mm to 2500m which is concentrated almost entirely between the months of March and October. Relative humidity fluctuates between 55-85% across the dry and rainy seasons, respectively. Temperature in area has a maximum range of 280C to 350C and minimum range of 190C to 240C, while the hottest months across between January to March. The elevation is between 45m - 144m above sea level (Iro, 2025), and the slope in most places is gradually undulating (approximately 0° to 2.69°), while in some locations, it is above 4.22°, which makes many areas prone to flooding. Most of the bedrock of watershed of Nworie and Otanmiri rivers is mainly the Benin formation associated with the Coastal Plain Sands (Kwache et.al., 2017).
- Vegetation and Land use patterns
The area is characterized by collection of light and thick secondary rainforest vegetation (Udokporo et al., 2015), with extensive land use conversion. Some effects of this change in land use and land cover include siltation of the river, potential gully erosion, and catastrophic flooding. Within the last 10 years, there has been an acceleration in the rate of development which has affected a lot of farmland and vegetation that were converted to built-up areas. The rate of population growth, infrastructure and increased commercial activities in Owerri contributed to the high rate of contributed to conversion of farmland to built-up areas in the study location.
Meanwhile, the watersheds that feed the Nworie and Otanmiri rivers are subject to intensive anthropogenic and industrial activities which result in the discharge of a wide range of pollutants into the river. The course of Nworie River passes through Owerri city and joins the Otanmiri River, which flows through the city and other neighbouring towns such as Nekede, Ihiagwa, Obinze. Owerri houses 5 tertiary institutions,
- Experimental Design and data collection
The research employed a stratified random sampling technic in which the two rivers put together where stratified into eight (8) stations comprising of three (3) locations along Nworie River (S1, S2, S3) and five (5) locations along the Otamiri River (S4, S5, S6, S7, and S8). Three (3) replicates samples of water sediments were collected from each station by adhering to the standard procedures and instruments. The sampling stations were georeferenced as shown in Table 1, and the data collection exercise yielded a total of twenty four (24) observational units.
- Laboratory Analyses
The sediment samples were prepared and analyzed in a laboratory for particle size distribution, heavy metals concentration and polycyclic aromatic hydrocarbons.
Particle size distribution was determined by the methods of Bouyocous as described by Gee and or (2002) which involved dispersing the soil with sodium hexametaphosphate (Calgon) and then saturation and hydration of particles with sodium hydroxide. Temperature readings as well as hydrometer readings to determine the water content were taken at specific intervals. Textural classes were then obtained from the texture analysis and expressed as % clay, % silt and % sand.
Heavy Metals analysis was carried out using Atomic Absorption Spectrophotometer. Sample preparation was by acid digestion method described in Mulk et al. (2015), followed by filtration. Then aliquots of the filtrate were used to analyze various metals.
- Polycyclic aromatic hydrocarbons (PAHs) in Sediment
Each sediment sample was dried by mixing 10g of the Sediment sample with 10g anhydrous Na2SO4 and placed in an extraction thimble. Thereafter, 10 ml of 1:1 (v/v) mixture of analytical grade dichloromethane (DCM) and acetone was added, and the sample was extracted for 30 minutes. The sample was collected and filtered using glass wool plunged into a glass funnel with 1g anhydrous Na2SO4 into a 250 ml conical flask. The extraction was then repeated. Concentration of the extract was carried out using the rotary evaporator. The extract was made to undergo cleanup and fractionation using silica gel permeation chromatography. The final extract was packed in a 2 ml gas chromatogram (Agilent 6890 GC-MS) vial and analyzed for PAHs
- Data analysis
Data obtained from the laboratory analyses were subjected to descriptive statistics and analysis of variance (ANOVA) using SPSS version 23. Significant means were separated using Duncan multiple range test (DMRT) at 5 % probability level.
Results and Discussion
- Particle Size distribution (PSD) of sediments of rivers
The mean values of the primary mineral particles (sand, silt, and clay) of the sediments across the various stations of the rivers are presented in Table 2. It reveals that the particle size distribution of the sediments across the sampling stations differed, such that Sampling Station 1 (SS1) was predominantly sandy with a relatively low percentage of silt and clay. The implication is that the sediment would be characterized with coarse texture, low surface area with resultant reduced charged surfaces for adsorption and retention of chemical contaminants (Nwawuike et al., 2024). Station 2 had a balanced distribution with a significant proportion of clay, which by implication would contain finer sediment with higher water retention capacity and consequently a potential for greater nutrient and contaminant adsorption. Sediment in station 3 was predominantly clayey, suggesting high water retention.
The sediment at Station 4 was predominantly silty with negligible clay content. The sediment would likely have moderate water retention and less capacity for contaminant binding. Station 5 was made up of a mix of silt and clay with minimal sand content. This sediment would likely have good water retention moderate contaminant adsorption properties. The sediment at Station 6 was predominantly sandy, similar to Station 1. The low percentages of silt and clay suggest a coarse texture, which affects drainage.
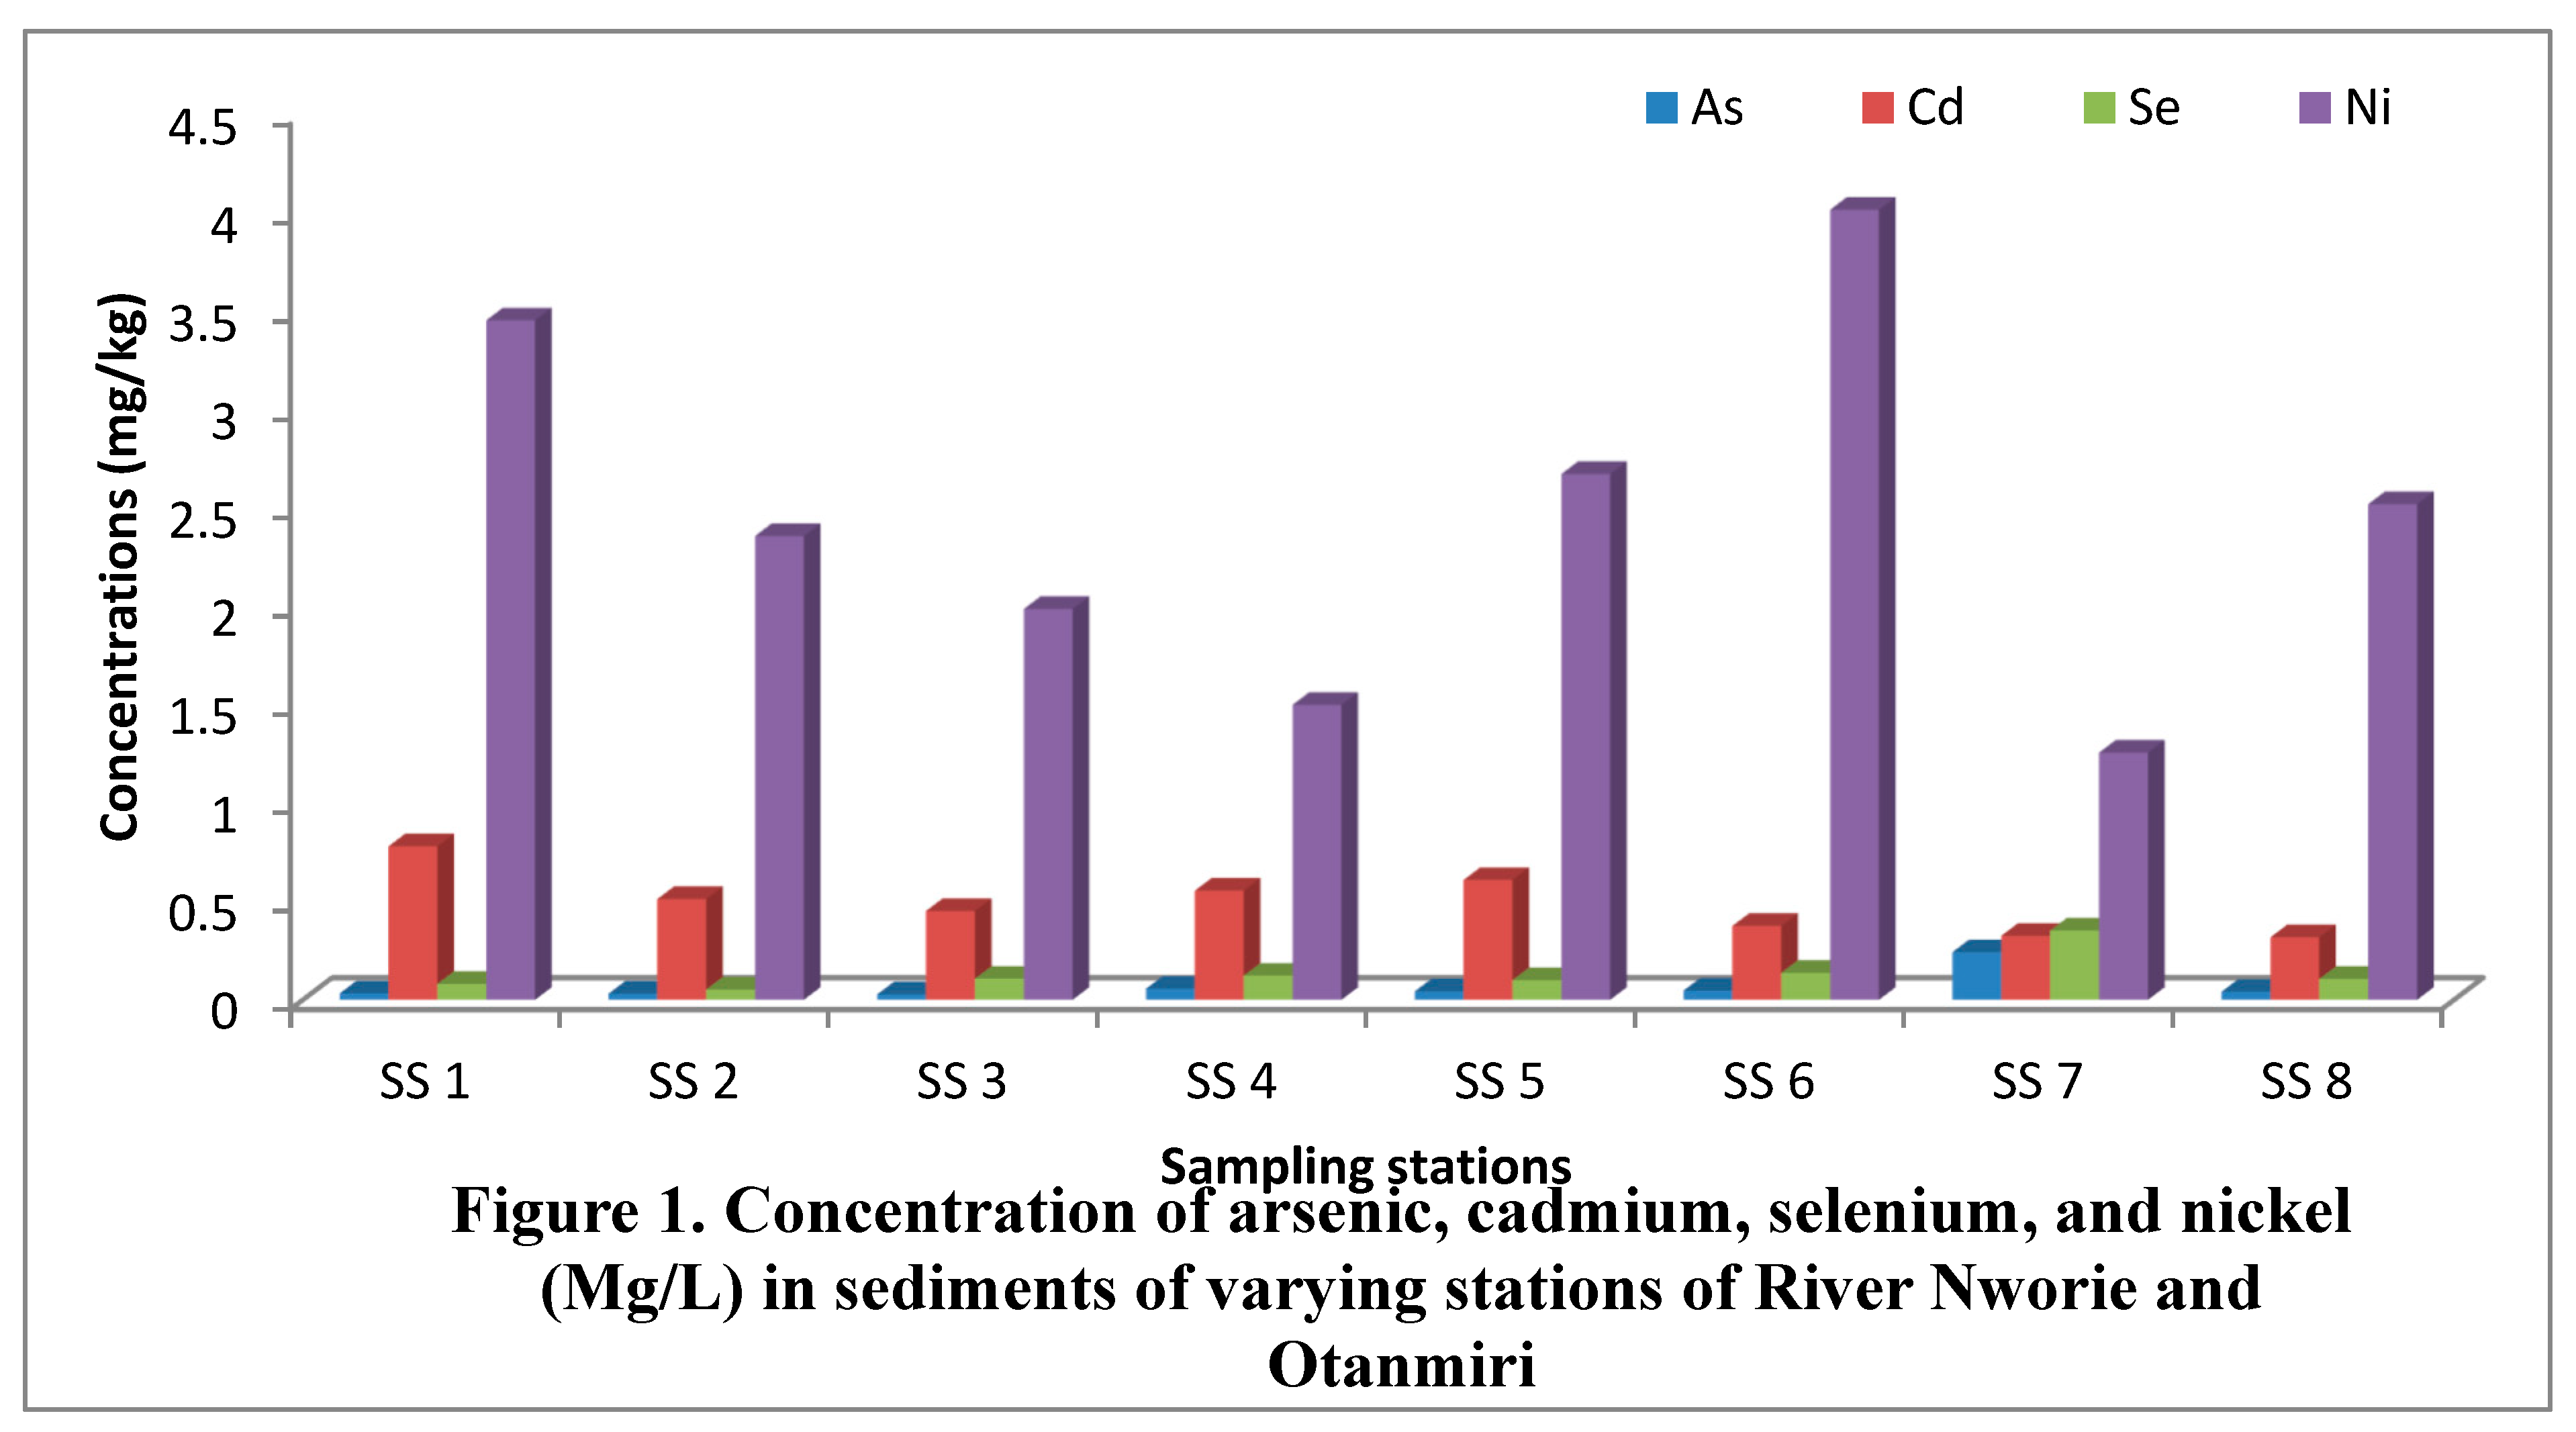
- Concentration of arsenic, cadmium, selenium, and nickel in sediments of the varying stations of River Nworie and Otanmiri.
Figure 1 shows a comparison of the concentrations of some heavy metals in sediment of the rivers across various locations. It revealed that the concentration of the heavy metals varied across the locations with the lowest mean concentration of 0.032, 0.031, 0.300, 0.057, 0.043, 0.047, 0.242, and 0.041 Mg/L observed on As at SS1, SS2, SS3, SS4, SS5, SS6, SS7, and SS8, respectively. Conversely, the highest mean concentrations observed among the heavy metals shown in Figure 1 were recorded on Ni as 3.453, 0.512, 1.986, 1.499, 2.671, 4.015, 1.256, and 2.519 Mg / L at SS1, SS2, SS3, SS4, SS5, SS6, SS7, and SS8, respectively. The reason for the dominance of Ni in the sediments across the stations may be associated with the geologic formation of the soils within the watersheds of the rivers from which the sediments are translocated to the waterbodies. Meanwhile, the variation of Ni concentration in the sediments across the sampling stations could be predicated on the variation in the particle size distribution of the sediments. It could be deduced that stations with increased sand content, particularly SS1 and SS6, were notable of increased concentration of Ni. The general variation in the concentration of the heavy metals across the stations is in the order of As > Cd > Se > Ni. Consequently, aquatic lives, especially those that live in sediments, would experience varying effects of heavy metals concentration across the stations. This effect may also bring about variations in the quality of water across the various stations of the rivers, which by implication affect the floating and swimming aquatic lives, including fishes. Besides, these will affect the drinkability of water at varying stations along the rivers, such that stations with increased concentration of the heavy metals will pose a threat to human health if the water is drunk.
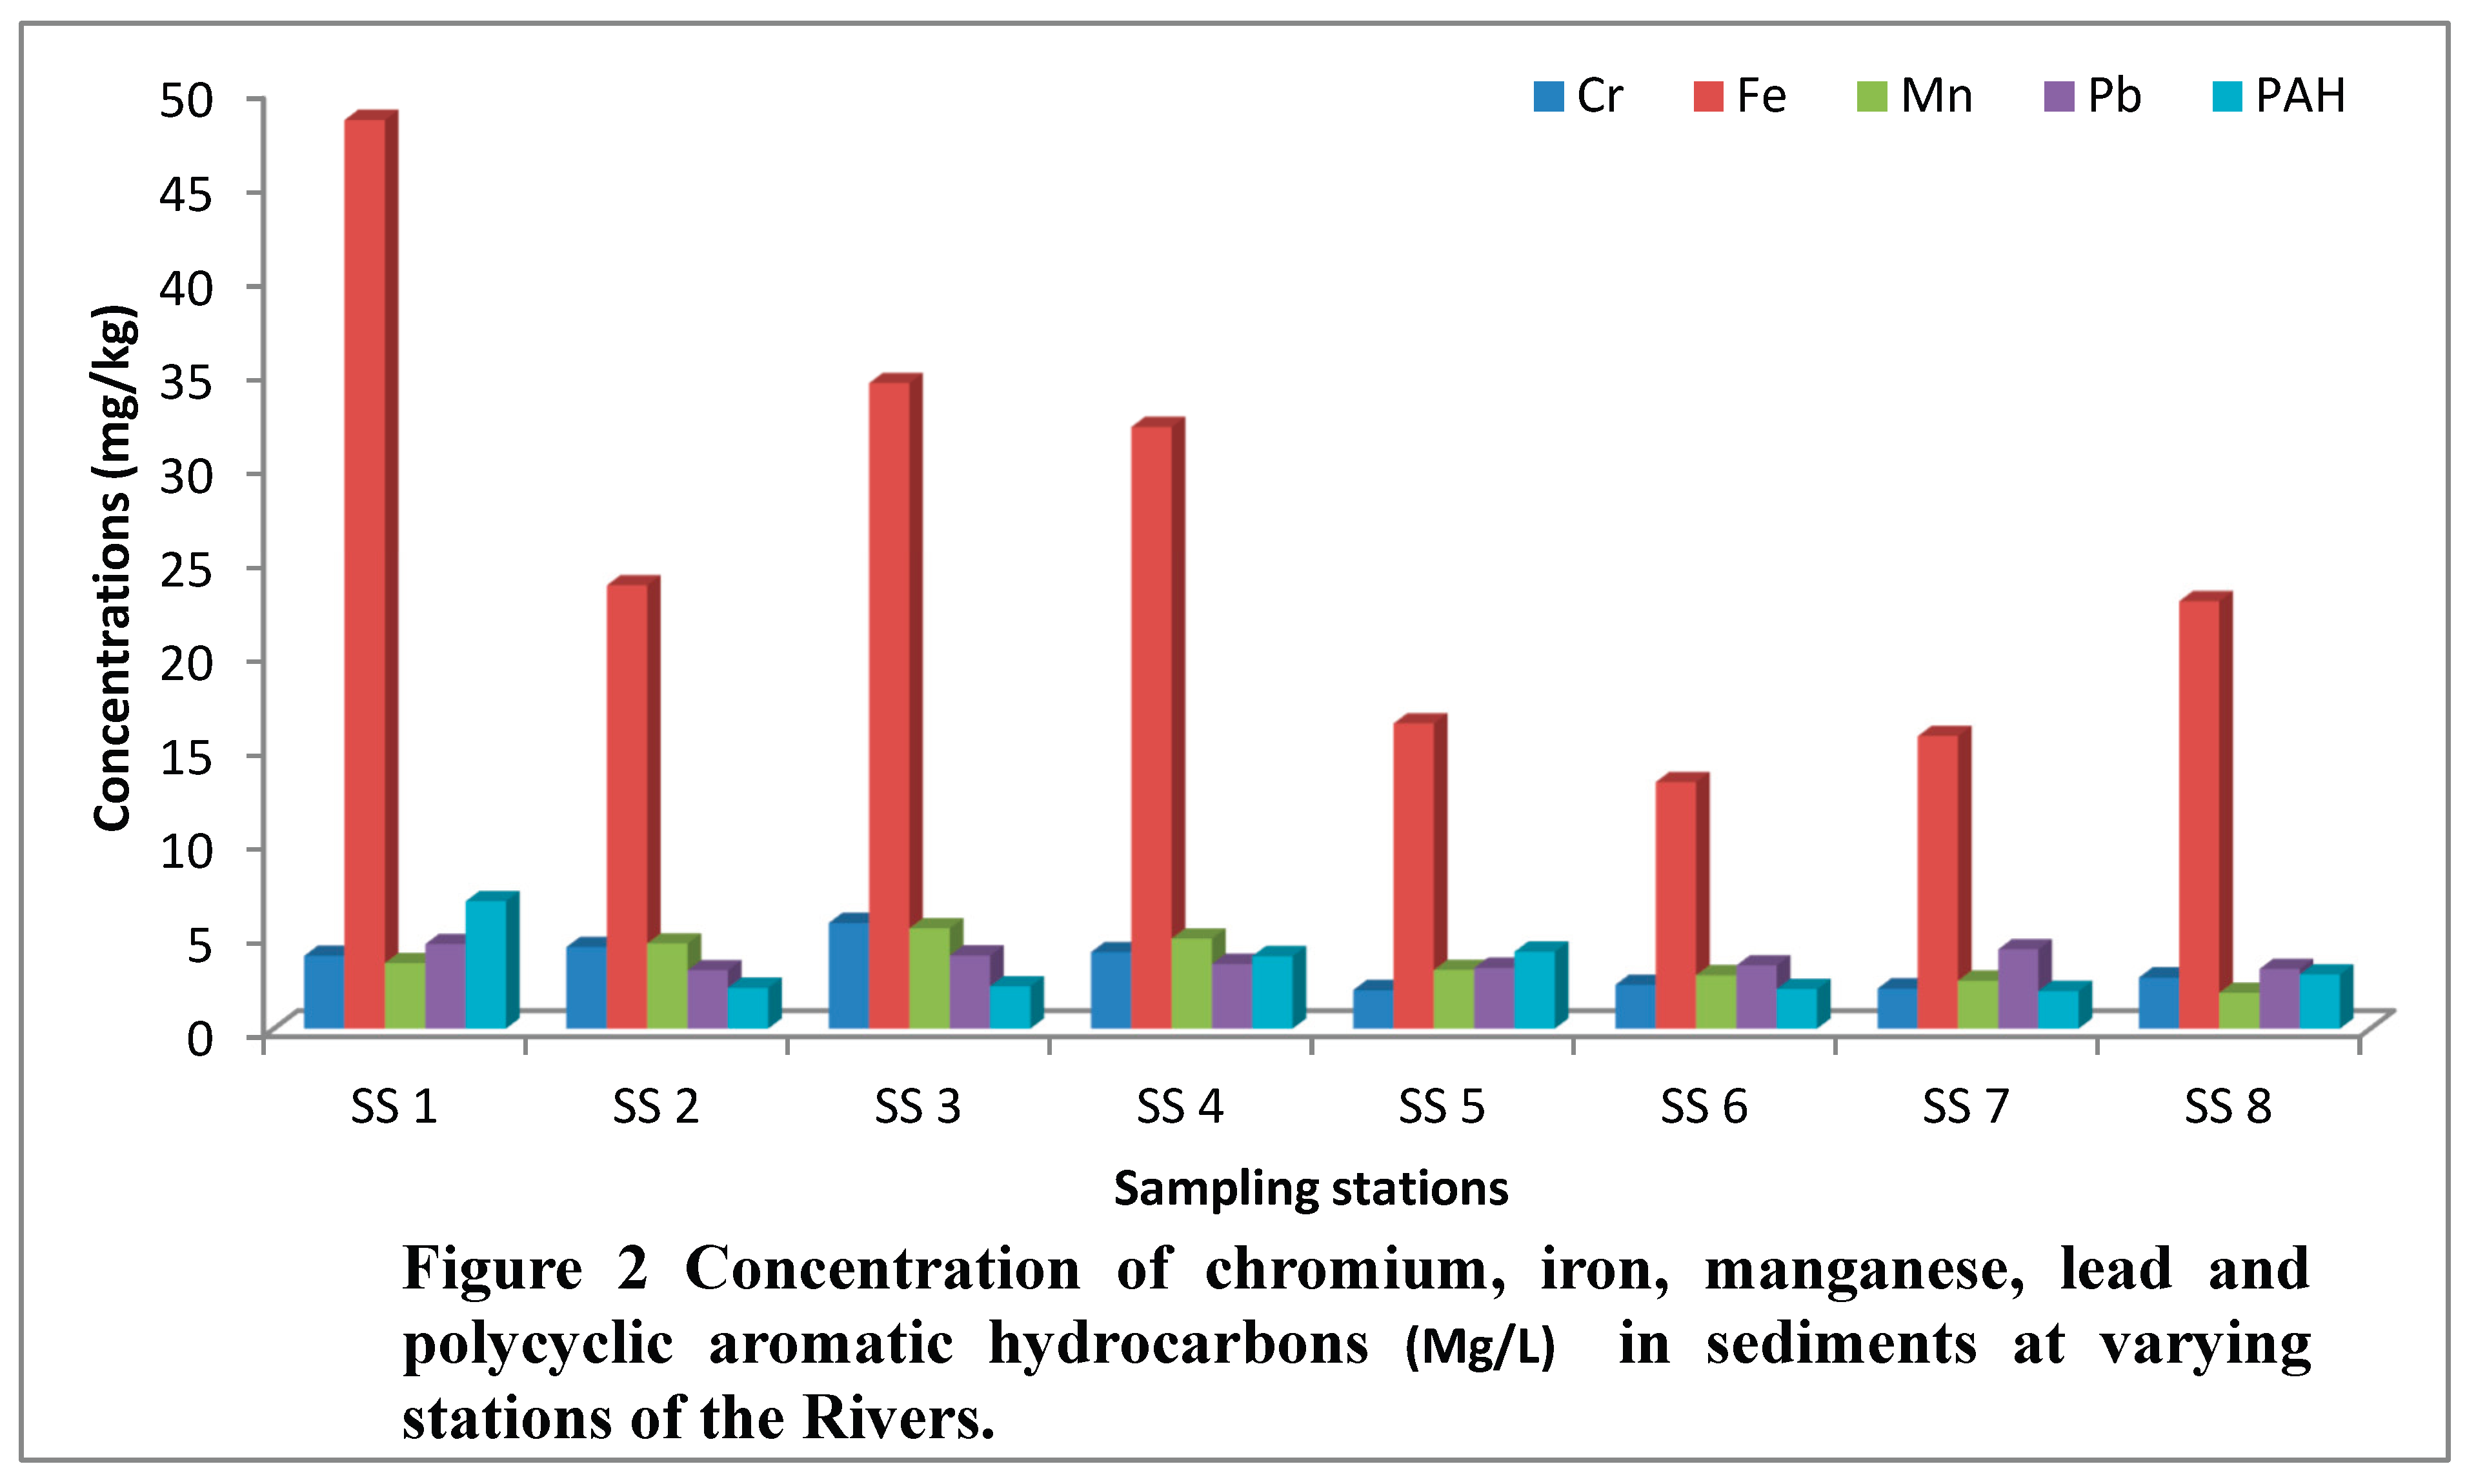
- Concentrations of chromium, iron, manganese, lead and polycyclic aromatic hydrocarbon in sediments at varying stations of River Nworie and Otanmiri.
The values of the concentrations of the heavy metals and polycyclic aromatic hydrocarbons (PAHs) in sediment of the rivers across various locations as shown in Figure 2 revealed that at SS1, among the heavy metals, Fe had the highest mean concentration of 48.43 Mg/l, followed by Pb (4.511 Mg/L), while Mn had the lowest mean concentration of 3.497 mg/l, but the PAH was 6.790 mg/l. In SS2 the mean concentrations for chromium, iron, manganese, lead, and PAHs were 4.356 mg/L, 23.631 Mg/L, 4.541 Mg/L, 3.112 Mg/L, and 2.178 Mg/L respectively. This result reveals that among the heavy metals under consideration at SS2, iron had the highest mean concentration, while the lowest was lead. Furthermore, at SS3, the respective mean concentrations for Cr, Fe, Mn, Pb and PAH were 5.634 Mg/L, 34.404 Mg/L, 5.347 Mg/L, 3.898 Mg/L, and 2.261 Mg/L, accordingly, as iron and lead maintained the highest and lowest mean concentration among the heavy metals, respectively. Also, at SS4, mean concentrations of the heavy metals were 4.078 Mg/L, 32.066 Mg/L, 4.803 Mg/L, and 3.451 Mg/L for chromium, iron, manganese, and lead, respectively, while the concentration of PAHs was 3.866 Mg/L. Hence, iron and lead had the highest and lowest mean concentration among the heavy metals. The results at SS5 show that the mean values for Cr was 2.059 Mg/L, Fe was 16.268 Mg/L, Mn was 3.129 Mg/L, Pb was 3.243 Mg/ L and PAH was 4.104 Mg/L, with the highest and lowest mean concentrations of the heavy metals observed at Fe and Cr, respectively. Moreover, at SS6 the mean concentrations were 2.340 Mg/L, 13.146 Mg/L, 2.849 Mg/L, 3.376 Mg/L and 2.113 Mg/L, for Cr, Fe, Mn, Pb, and PAHs, respectively. The mean concentrations of the HM and PAHs at Station SS7 were 2.142 Mg/L, 15.597 Mg/L, 2.555 Mg/L, 4.229 Mg/L and 2.006 Mg/L, respectively for Cr, Fe, Mn, Pb and PAH. Then at SS8, the same HM had mean concentrations of 2.729 Mg/L, 22.781 Mg/L, 1.916 Mg/L, and 3.184 Mg/L, respectively for Cr, Fe, Mn, and Pb, while PAHs had mean concentration of 2.888 mg/L.
Generally, among the heavy metals shown in Figure 1 and Figure 2, the mean concentration of Fe and Ni dominated across the sampled stations. This could be attributed to the possible nature of the parent materials from which the sediments originated. Also, considering the anthropogenic activities within the watersheds of the rivers, it could be inferred that the increased concentration of Fe and Ni at the varying locations of the rivers could be associated with the possible deposits of Nickel – Iron (NiFe) condemned batteries and related solid wastes such as metal scraps and electronic gadgets into these water bodies. This assertion corroborates the report of Ma et al (2024) that geological formation and anthropogenic effects are among the notable principal components of an environment which considerably influence the concentration of heavy metals and PAHs in sediments at water bodies.
- Spatial variations in concentrations of Heavy metals and PAH in sediments of the Rivers
Table 3 shows variation of the mean concentrations of heavy metals and polycyclic aromatic hydrocarbons (PAHs) in sediments across the sampling stations in the Nworie and Otanmiri Rivers. The results show that there was significant (P≤0.05) spatial variation in the concentrations of the heavy metals and PAHs across the sampling stations. The highest mean concentration of As (0.242 Mg/L) observed at SS7 varied significantly (P≤0.05) from its mean concentration at the other stations, but the lowest mean concentration of As (0.028 Mg/L) observed at SS3 was not significantly different (P≤0.05) from the mean values observed at the other stations except at SS7. There were significant variations in Cd concentrations, with Station 1 having the highest mean value (0.780 mg/L), which differed significantly from Stations 6, 7, and 8, while its lowest concentration (0.318 Mg/L) observed at SS8 was not significantly different from the other stations except SS1.
The mean concentrations of Cr were highest (5.634 Mg/L) at SS3, which differed significantly (P≤0.05) from sampling stations 5, 6, 7, and 8, while the lowest mean concentration of Cr observed at higher at SS5 (2.059 Mg/L) was not considerably differently (P≤0.05) from the other stations except at SS3. The highest mean concentration of Fe observed at SS1 (48.430 mg/L) was substantially different (P≤0.05) from mean concentrations recorded at the other sampling stations, while the lowest mean concentration of 13.146 Mg/L observed at SS6 did not vary significantly from the other stations except sampling stations 1, 3, and 4. The highest concentration of Mn recorded at SS3 (5.347 mg/L) did not vary considerably from its mean concentrations at the other sampling stations except SS8, which had the lowest (1.916 mg/L) mean concentration of Mn. Meanwhile, the lowest mean concentration of Mn at SS8 was not substantially different from the mean concentrations observed at the other sampling stations, except SS3. The highest mean concentration of Ni (4.015 Mg/L) was observed at SS6, which differed significantly from the other stations except SS4 (1.499 Mg/L) and SS7 (1.256 Mg/L) at P≤0.05, while its lowest concentration of 1.256 Mg/L observed at SS7 did not differ substantially from the mean concentrations observed at the other stations except at SS6. There was no significant variation (P≤0.05) in the concentrations of Pb across the sampling stations, however, the highest and lowest concentrations of Pb were observed at SS1 (4.511 Mg/L) and SS2 (3.112 Mg/L), respectively. The highest mean concentration of Se (0.352 Mg/L) observed in sediment at SS7 differed significantly from its mean concentrations recorded at the other stations. The concentration of PAH was highest at Station 1 (6.79 mg/L), but lowest at station 7 (2.01 Mg/L). The highest mean concentration of PAHs observed at SS1 was significantly different (P≤0.05) from the mean concentrations observed at the other stations, while its lowest mean concentration did not vary considerably from its mean values at the other stations except SS1.
The variation in the concentration of the various heavy metals and PAHs across the stations could be predicated on the possible differences in human activities, including use of agrochemicals in farming, presence of automobile workshops, mining activities, localization of waste disposal sites, etc. Also, the topography of the area along the rivers may have influenced the direction of water flow, and by implication conditioned the translocation and distribution of contents of the sediments, including the chemical solid wastes / contaminants. The report of Wang et al (2024) noted that anthropogenic processes arising from human activities and slope gradient were among the principal components of the aquatic ecosystem influencing the concentration of HM and PAHs. Consequently, the increased concentration of most HM and PAHs at the SS1 was possibly a result of increased deposit of sources of heavy metals and PAHs from contaminated sediments transported from the watersheds of the rivers as conditioned by topography and human activities (Iro, 2025).
Conclusion
Sediments of the various sampling locations varied in their particle size distribution. Also, the concentrations of the heavy metals and polycyclic aromatic hydrocarbons in the sediments across the various sampling stations differed considerably. Among the various sampling stations, SS1 had the greatest health hazard potential to the aquatic ecosystem; hence, caution must be taken in consuming water and products from that station, while efforts are made to curb the sources of the hazards. Regular monitoring and pollution mitigation measures are essential to reduce pollution and protect the ecosystem.
References
- Aiyesanmi, A. F.; Ademefun, A. E.; Ibigbami, O. A.; Adelodun, A. A. Polycyclic aromatic hydrocarbons and organochlorine pesticides in floodplain soils: A case study of Onuku River in Okitipupa, Nigeria. Environmental Challenges 2021, 5, 100351. [Google Scholar] [CrossRef]
- Amangabara, G. T. Drainage morphology of Imo Basin in the Anambra–Imo River Basin Area, of Imo State, Southern Nigeria. Journal of Geography, Environment and Earth Science International 2015, 3, 1–11. [Google Scholar] [CrossRef] [PubMed]
- Arowojolu, I. M.; Tongu, S. M.; Itodo, A. U.; Sodre, F. F.; Kyenge, B. A.; Nwankwo, R. C. Investigation of sources, ecological and health risks of sedimentary polycyclic aromatic hydrocarbons in River Benue, Nigeria. Environmental Technology & Innovation 2021, 22, 101457. [Google Scholar] [CrossRef]
- Batapola, N. M.; Dushyantha, N. P.; Ratnayake, N. P.; Premasiri, H. M. R.; Panagoda, H.; Jayawardena, C. L.; Ratnayake, R. M. P. Risk assessment of heavy metals in the freshwater lake sediments around Eppawala phosphate deposit, Sri Lanka. Journal of the National Science Foundation of Sri Lanka 2024, 51. [Google Scholar] [CrossRef]
- Gee, G. W; Or, W. Particle size analyses. In method of soil analysis (part 4, physical methods. Soil Sci. Soc Am Book services, No 5 ASA and SSSA Madison; Dane, J. A, Topp, G. C., Eds.; 2002; Vol. 1, pp. Pp. 255–259. [Google Scholar]
- Iro, S. I. Evaluating the impact of topography on flooding in Owerri North, Imo State, Nigeria using GIS and remote sensing techniques. American Journal of Environmental Sciences 2025, 21, 1–11. [Google Scholar] [CrossRef]
- Kwache, J. B.; Akaegbobi, I. M.; Olademeji, R. G.; Anumnu, J. Petrography and geochemical features of the coastal plain sands facies (Benin Formation) around Nekede and Azara Egbelu areas, Niger Delta Basin Southeast Nigeria. International Journal of Mineral Processing and Extractive Metallurgy 2017, 2, 87–91. [Google Scholar] [CrossRef]
- Ma, Y.; Ma, Y.; Zhang, W.; Zhang, H.; Li, T.; Kong, D.; Wang, D. The Spatiotemporal Variation and Historical Evolution of Heavy Metal Pollution in Sediments from the Pearl River Estuary, China. Water 2024, 16, 531. [Google Scholar] [CrossRef]
- Mulk, S.; Azizullah, A.; Korai, A. L.; Khattak, M. N. K. Impact of marble industry effluents on water and sediment quality of Barandu River in Buner District, Pakistan. Environmental Monitoring and Assessment 2015, 187, 59. [Google Scholar] [CrossRef] [PubMed]
- Nwawuike, N.; Nwosu, O. U.; Amanze, C. T.; Ukabiala, M. E. Ecological Risk assessment of Crude Oil Impacted Farmland Soils: A case study of Ohaji Egbema in Niger Delta, Nigeria. African Journal of Environment and Natural Sciences Research 2023, 6, 216–230. [Google Scholar] [CrossRef]
- Pushpalatha, N.; Sreeja, V.; Karthik, R.; Saravanan, G. Total dissolved solids and their removal techniques. International Journal 2022, 2, 13–20. [Google Scholar] [CrossRef]
- Salas, E. A. L.; Kumaran, S. S.; Bennett, R.; Partee, E. B.; Brownknight, J.; Schrack, K.; Willis, B. Integration of Google Earth Engine, Sentinel-2 images, and machine learning for temporal mapping of total dissolved solids in river systems. Scientific Reports 2025, 15, 27555. [Google Scholar] [CrossRef] [PubMed]
- Udokporo, E.; Anikwe, M. N.; Chukwu, K. E. Assessment and mapping of the vulnerability of soils in Imo State, Nigeria to erosion hazard using geographic information system. International Journal of Environmental Monitoring and Analysis 2015, 3, 245–254. [Google Scholar] [CrossRef]
- Ugochukwu, U. C.; Agu, C.; Jidere, C.; Kurumeh, L.; Ewoh, J. C.; Alika, H. Effect of petroleum products depot on Nwaenebo-Emene River sediments, Enugu, Nigeria: Contamination by PAHs and associated exposure risks to both humans and aquatic biota. International Journal of Environmental Analytical Chemistry 2022, 104, 1–19. [Google Scholar] [CrossRef]
- Ukachukwu, C. O.; Udebuani, A. C.; Ugwu, T. N. Screening of carcinogenic and non-carcinogenic polycyclic aromatic hydrocarbon in a typical urban city center, Owerri, Nigeria. Journal of Advances in Biology and Biotechnology 2022, 25, 14–21. [Google Scholar] [CrossRef]
- Wang, J.; Tao, L.; Ren, H.; Xue, X.; Yang, Z.; Jiang, Y.; Ren, J. Surface sediment properties and heavy metal contamination assessment in typical urban areas from middle and upper reaches of Yellow River. Researchsquare. 2024. [Google Scholar] [CrossRef]

Table 1.
Geographical information of the sampling stations.
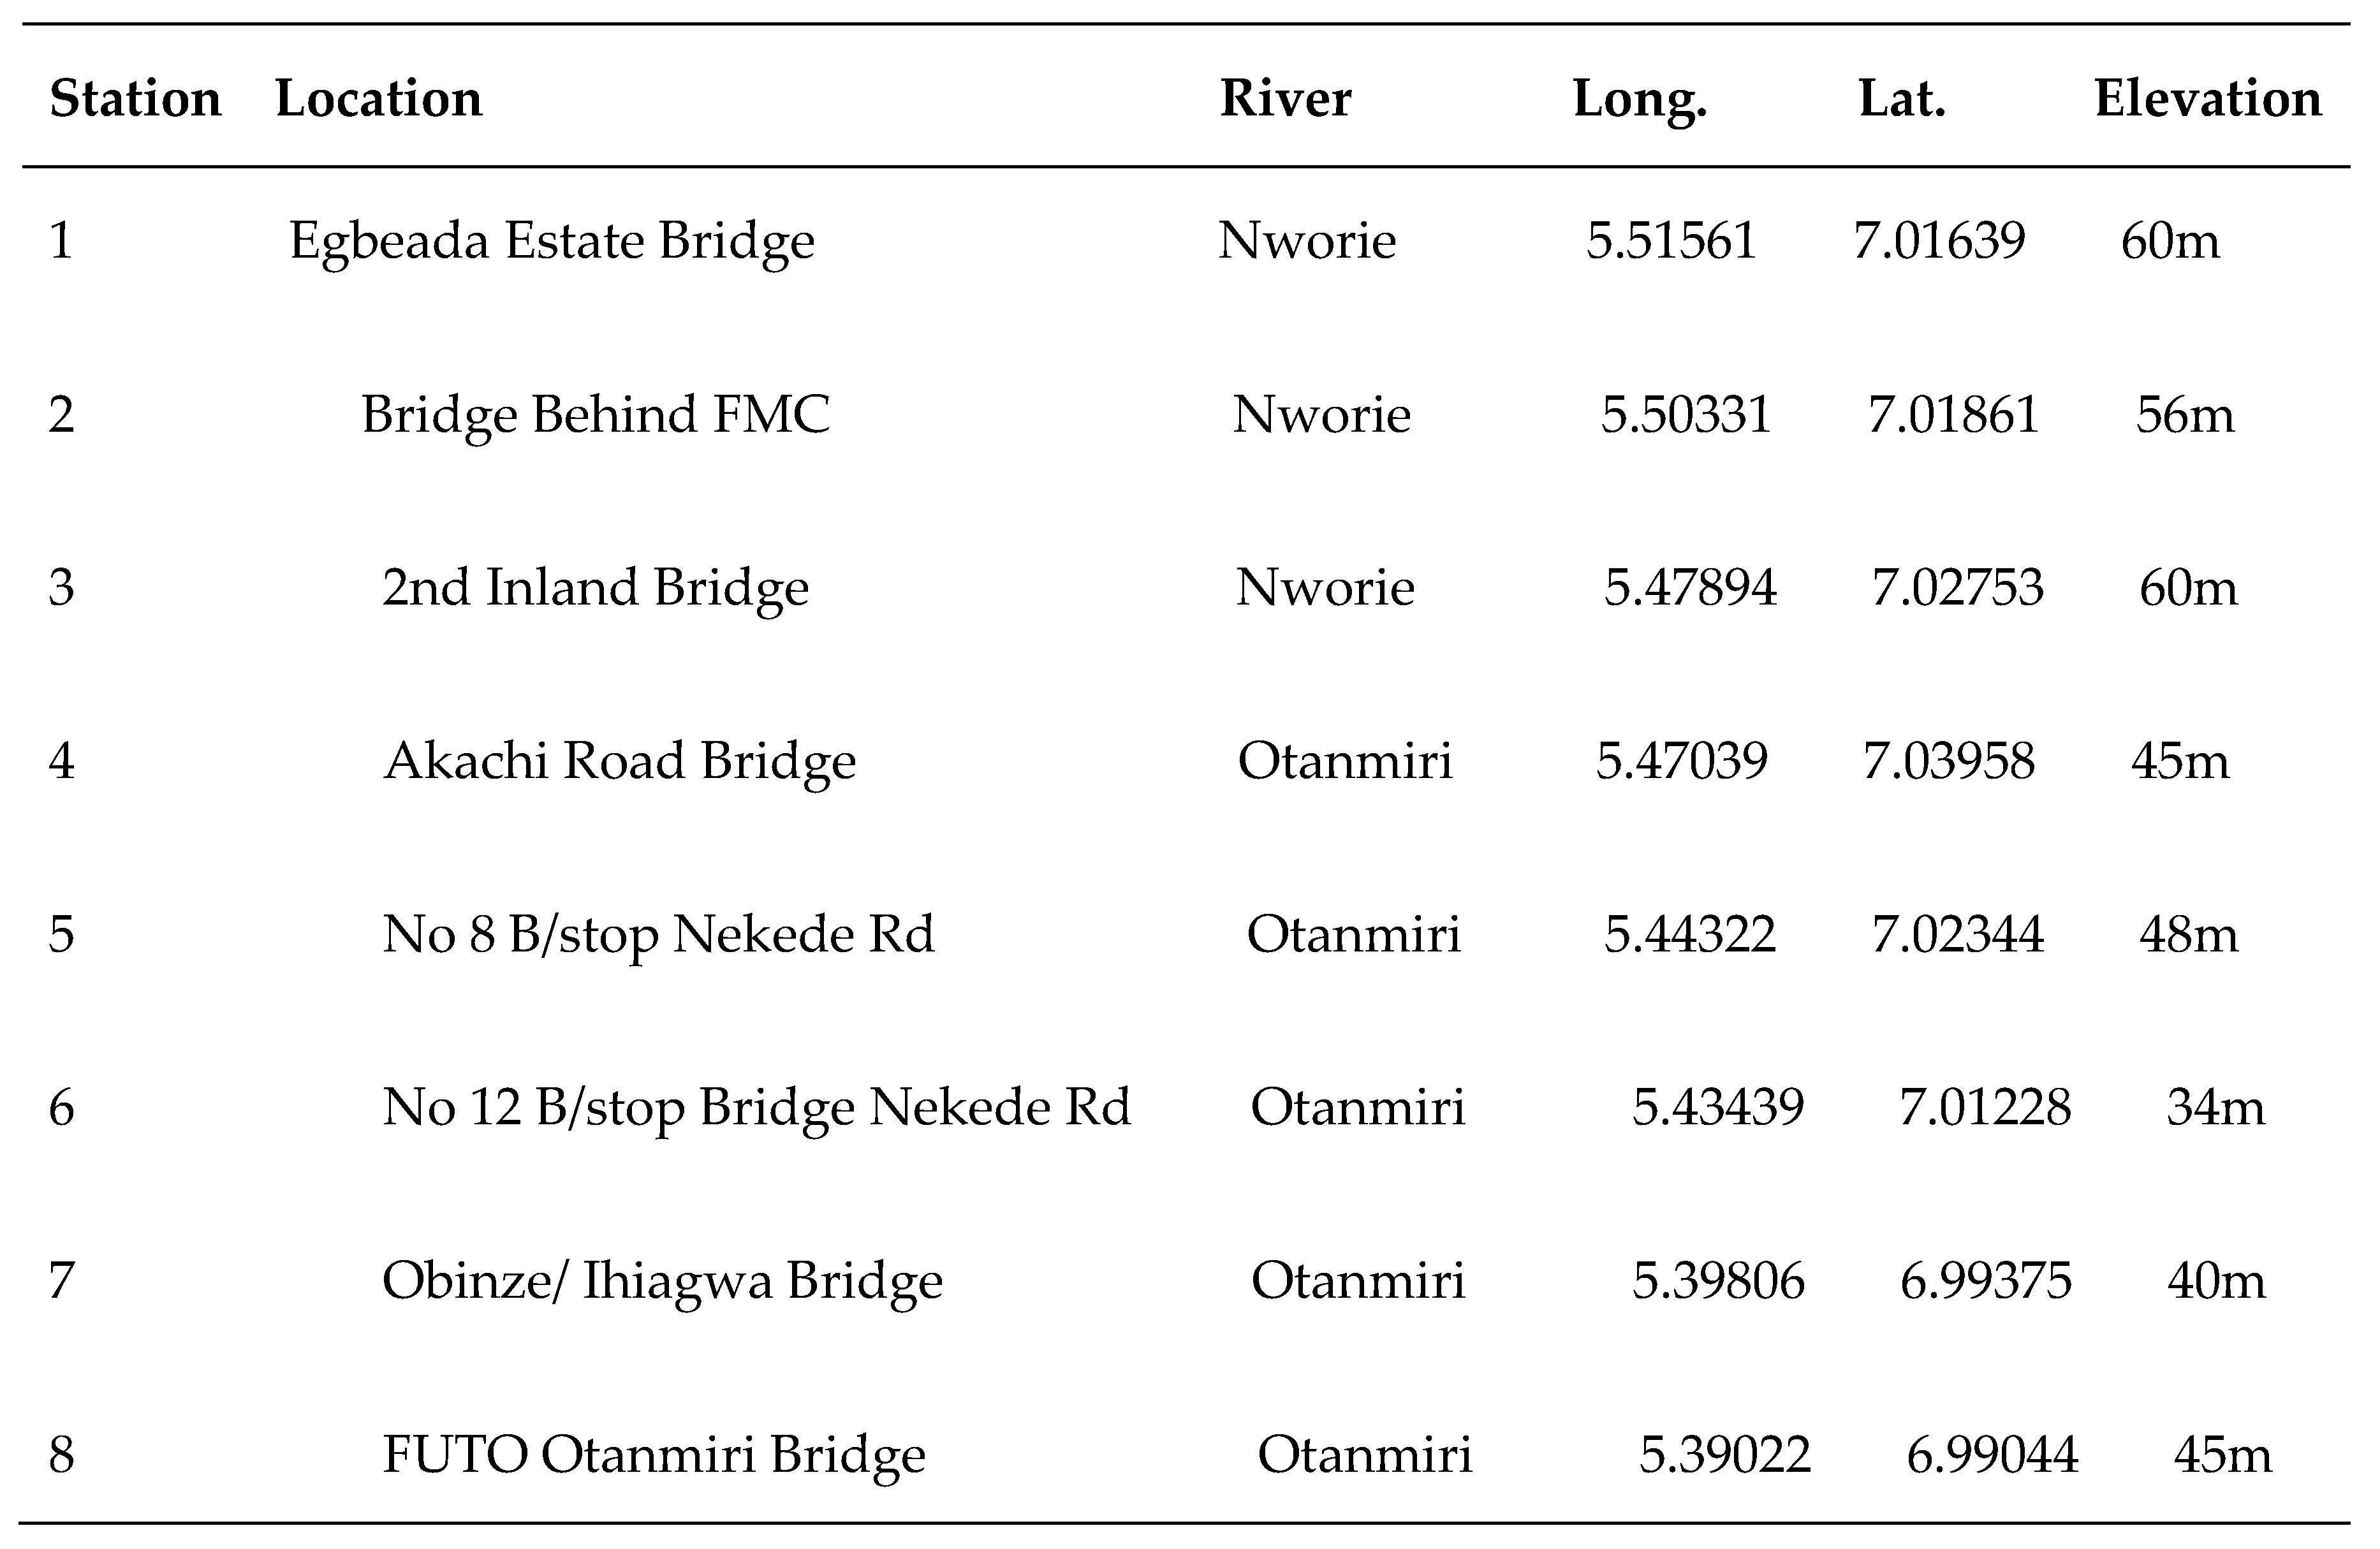 |
Table 2.
Mean values of Particle Size Distribution in the sediment of the rivers.
| Station | % Sand | % Silt | % Clay |
| 1 | 71.8 | 8.1 | 20.1 |
| 2 | 32.7 | 26.9 | 40.4 |
| 3 | 6.5 | 30.8 | 62.7 |
| 4 | 22.2 | 77.6 | 0.2 |
| 5 | 7.7 | 53.2 | 39.2 |
| 6 | 71.5 | 14.9 | 13.6 |
| 7 | 44.9 | 28.4 | 26.6 |
| 8 | 66.2 | 13.8 | 20.1 |
Table 3.
Variation of Heavy metals concentrations and polycyclic aromatic hydrocarbons in sediments at varying sampling stations of the Rivers.
Table 3.
Variation of Heavy metals concentrations and polycyclic aromatic hydrocarbons in sediments at varying sampling stations of the Rivers.
| Parameter | SS1 | SS2 | SS3 | SS4 | SS5 | SS6 | SS7 | SS8 |
| As (Mg/L) | 0.033a | 0.031a | 0.028a | 0.057a | 0.043a | 0.047a | 0.242b | 0.041a |
| Cd (Mg/L) | 0.780b | 0.512ab | 0.452ab | 0.555ab | 0.609ab | 0.376a | 0.325a | 0.318a |
| Cr (Mg/L) | 3.885ab | 4.356ab | 5.634b | 4.078ab | 2.059a | 2.340a | 2.142a | 2.729a |
| Fe (Mg/L) | 48.430c | 23.631ab | 34.404b | 32.066b | 16.268a | 13.146a | 15.597a | 22.781ab |
| Mn (Mg/L) | 3.497ab | 4.541ab | 5.347b | 4.803ab | 3.129ab | 2.849ab | 2.555ab | 1.916a |
| Ni (Mg/L) | 3.453ab | 2.357ab | 1.986ab | 1.499a | 2.672ab | 4.015b | 1.256a | 2.519ab |
| Pb (Mg/L) | 4.511a | 3.112a | 3.898a | 3.451a | 3.243a | 3.376a | 4.229a | 3.185a |
| Se (Mg/L) | 0.082a | 0.053a | 0.108a | 0.123a | 0.100a | 0.138a | 0.352b | 0.106a |
| PAH (Mg/L) | 6.79b | 2.18a | 2.26a | 3.87a | 4.10a | 2.11a | 2.01a | 2.89a |
Disclaimer/Publisher’s Note: The statements, opinions and data contained in all publications are solely those of the individual author(s) and contributor(s) and not of MDPI and/or the editor(s). MDPI and/or the editor(s) disclaim responsibility for any injury to people or property resulting from any ideas, methods, instructions or products referred to in the content. |
© 2025 by the authors. Licensee MDPI, Basel, Switzerland. This article is an open access article distributed under the terms and conditions of the Creative Commons Attribution (CC BY) license (http://creativecommons.org/licenses/by/4.0/).
Copyright: This open access article is published under a Creative Commons CC BY 4.0 license, which permit the free download, distribution, and reuse, provided that the author and preprint are cited in any reuse.


