Submitted:
23 December 2025
Posted:
24 December 2025
You are already at the latest version
Abstract
Phosphate (Pi) deficiency causes broad transcriptional changes that enhance Pi uptake and utilization. Because sucrose transport from shoot to root mediates long-distance Pi-deficiency signaling, we asked whether soybean can still respond to –P when sucrose supply is restricted. To limit sucrose availability, we exposed hydroponically grown soybean plants to +P or –P conditions for 30 h under light or darkness, with darkness suppressing photosynthetic carbon production. Root transcriptomes were profiled using Oxford Nanopore cDNA sequencing. Across four biological replicates per treatment, ~90 million reads were generated, with >90% mapping to ~25,300 expressed genes (~54% of annotated coding genes). Principal component analysis showed that light accounted for most of the variance, while Pi status contributed a smaller component. Under light, Pi deficiency activated a strong transcriptional program, including canonical phos-phate-starvation markers such as PHT1, PHO1 and PTEN2α. In darkness, however, only a small number of genes were induced, including a MYB-domain transcription factor, and none overlapped with the light-responsive set. Together, these findings suggest that light is required for broad transcriptional responses to Pi deficiency, whereas a local Pi-responsive program becomes detectable only when systemic sucrose signaling is suppressed.
Keywords:
carbon availability
; Glycine max
; local Pi signaling
; Nanopore sequencing
; phosphate starvation
; RNA-seq
; sucrose signaling
; systemic Pi signaling
; transcriptomics
1. Introduction
Phosphorus (P) is an essential macronutrient for all living organisms. As a component of nucleic acids, phospholipids, and ATP, P supports the structural and energetic foundations of life and plays key roles in energy transfer, membrane stability, and signaling in plant cells [1]. Most P is taken up as inorganic phosphate (Pi), but in many soils Pi is tightly bound to minerals or organic matter, limiting its availability for uptake [1]. To sustain crop productivity, large amounts of P fertilizers are applied, most of it mined from non-renewable geological deposits formed over millions of years. However, intensive mining and fertilizer use have led to declining global reserves and to environmental pollution through runoff and soil erosion [2,3,4].
Improving plant P acquisition and utilization is therefore critical for sustainable agriculture. Soybean (Glycine max), a major source of plant-based protein and oil [5], is particularly relevant because of its global importance and its strong dependence on P to sustain nitrogen fixation and yield. In soybean, progress toward improving P efficiency has come from quantitative trait loci (QTL) analyses [6] and molecular and transcriptomic studies [7,8,9]. These studies have revealed diverse responses to P deficiency, including changes in root architecture and exudation [10], altered leaf P-allocation, and improved P-use efficiency [8].
Under P deficiency, root system architecture changes, typically showing shorter primary roots and more lateral roots and root hairs, which increase the root surface area exposed to soil Pi [10,11]. Roots also secrete organic acids that dissolve Pi and release phosphatases and nucleases to free Pi from organic compounds [1,10,12]. At the cellular level, high-affinity Pi transporters are upregulated to improve uptake efficiency [13,14,15], while membrane lipid remodeling conserves P by shifting from phospholipids to Pi-free membrane lipids [16]. Central carbon metabolism also becomes more Pi-efficient by favoring PPi-dependent reactions that bypass ATP [17,18]. Although P deficiency is defined at the whole-plant level, its transcriptional and metabolic responses are mediated by changes in cellular Pi availability and Pi-dependent signaling pathways.
These metabolic responses are integrated with signaling networks that coordinate Pi perception and redistribution across the plant. SPX-domain proteins and PHR transcription factors form a core regulatory module [19]. Under Pi-sufficient conditions, SPX proteins bind inositol pyrophosphates and repress PHR activity; under Pi deficiency, this repression is relieved, allowing PHRs to activate Pi-responsive genes [20]. Soybean homologs such as GmPHR1, GmSPX1, and GmSPX3 modulate Pi uptake and homeostasis [21], while PHO1 family members export Pi into the xylem and contribute to whole-plant Pi distribution [22].
Long-distance communication between shoots and roots also plays a central role in coordinating P acquisition. Sucrose, the main product of photosynthesis, functions both as a carbon source and as a signal integrating plant carbon status with nutrient responses [23,24,25]. Under Pi deficiency, increased sucrose flow from leaves to roots stimulates the expression of Pi acquisition genes, including high-affinity transporters and acid phosphatases [26,27]. In soybean, sucrose can trigger rapid transcriptomic shifts within minutes, activating hormone, calcium, and ROS signaling before canonical Pi-starvation genes respond [28]. Other systemic signals, including auxin, ethylene, strigolactones, and microRNAs such as miR399 and miR827, further integrate carbon status with Pi allocation and root development [29,30,31,32]. However, the extent to which Pi-responsive transcription depends on photosynthetically derived sucrose, as opposed to sucrose-independent local Pi sensing, remains unclear.
In addition to systemic signaling, root tips and epidermal regions are also able to sense Pi status locally [33,34]. Because sucrose transport from shoots to roots depends on photosynthesis, comparing Pi-deficient plants grown in light versus darkness offers a practical way to probe the influence of carbon availability on Pi-responsive transcription. Darkness strongly reduces photosynthetic carbon production and sucrose transport from shoot to root but also induces broader metabolic and physiological changes. Thus, light–dark comparisons provide an imperfect but useful framework to explore how carbon availability shapes different components of the Pi-starvation response.
In this study, we used Oxford Nanopore cDNA sequencing to analyze root transcriptional responses to 30 hours of Pi deprivation under light and dark conditions in hydroponically grown soybean. Because sucrose transport from shoot to root depends on photosynthesis, comparing Pi-deficient plants grown in light versus darkness offers a practical way to probe the influence of carbon availability on Pi-responsive transcription. Consistent with this rationale, darkness restricts photosynthetic sucrose production and has been shown to reduce sucrose levels in roots [35], although additional metabolic and physiological effects of darkness are expected. Specifically, we sought to i) test sucrose’s regulatory role in coordinating the phosphate starvation response (PSR) in soybean and ii) identify sucrose-independent components of the Pi deficiency transcriptome.
2. Results
2.1. Overview of Experimental Design and Data Quality
Soybean plants were grown hydroponically for two weeks and then exposed for 30 h to light or darkness under phosphate-sufficient (+P) or phosphate-deficient (−P) conditions (Figure 1a). Darkness prevents photosynthesis and limits shoot-to-root sucrose transport. Each treatment was performed with four biological replicates to ensure reproducibility across experiments.
Oxford Nanopore cDNA sequencing generated 4.8–6.9 × 10⁶ passed reads per sample, with mean quality scores of Q10–11 and N50 values of ~800–1,000 bp (Table 1, see Table S1 for additional sequencing and mapping metrics). Across all samples, sequencing yielded ~90 million passed reads (mean 5.6 million per sample) with >90% mapping efficiency. After filtering out low-abundance genes (≥10 raw reads in ≥3 replicates), 25,348 genes were retained for downstream analyses. These represent ~54% of the 47,068 protein-coding genes annotated in the Glycine max v4.0 genome. Together, these results indicate that the sequencing depth and replicate consistency were adequate for capturing major transcriptional differences across light, dark, +P, and −P treatments.
2.2. RNA-Seq Reveals Major Effects of Light and Minor Effects of Pi Deficiency
Principal component analysis (PCA; Figure 1b) showed that light condition was the primary source of transcriptomic variation: PC1 explained 76% of the variance and separated all light-grown samples from dark-grown samples. Phosphate status contributed a smaller component of variation, captured along PC2 (7%). Under light, +P and −P samples separated clearly, whereas these groups overlapped more extensively in darkness, suggesting that transcriptomic responses to Pi deficiency were reduced or less distinct when plants were grown without light.
Treatment-specific differences were examined using UpSet plots (Figure 1c–d). Consistent with the PCA, the number of differentially expressed genes (DEGs) was substantially higher between light and dark conditions than between +P and −P conditions within either light or dark. However, despite the strong light–dark effect, a distinct set of >300 genes was upregulated under −P in light-grown roots. In contrast, only four genes passed significance thresholds for −P upregulation in darkness, with 13 emerging under relaxed criteria (see Section 3.2).
This sharp contrast indicates that Pi-deficiency transcriptional responses are markedly attenuated in darkness. Because darkness restricts photosynthetic carbon supply and also alters broader metabolic and hormonal processes, the reduced −P response likely reflects a combination of limited carbon availability and additional physiological changes associated with dark-grown roots.
2.3. Light Enables Genome-Wide Activation of the Phosphate Starvation Program
To visualize transcriptional responses to Pi deficiency under each light condition, we compared −P and +P samples using MA and volcano plots (Figure 2). MA plots show overall fold-change patterns across expression levels, while volcano plots emphasize genes with larger expression shifts and stronger statistical support. An exploratory threshold of adjusted p < 0.1 was used in MA plots to highlight subtle changes, whereas volcano plots apply a more stringent adjusted p < 0.05 cutoff.
Under light, −P treatment induced extensive transcriptional changes, with hundreds of genes significantly up- or downregulated across a wide dynamic range. This pattern is consistent with activation of the canonical phosphate starvation response (PSR) in roots under light conditions. In darkness, however, only a small number of genes passed significance thresholds, suggesting that transcriptomic responses to −P are markedly reduced under dark conditions.
Because darkness restricts photosynthetic sucrose production and alters broader aspects of root physiology, the attenuated −P response likely reflects a combination of reduced carbon supply and other dark-associated changes. Despite these factors, the strong contrast between light and dark conditions is clear: light-grown roots show robust −P-induced transcriptional reprogramming, whereas dark-grown roots display a much smaller response.
2.4. Canonical Phosphate Starvation Response Genes Are Induced Only in Light
To examine how transcriptional responses to Pi deficiency differ between light and dark conditions, we compared the genes most strongly affected by −P in each treatment (Figure 3 and Figure 4). Under light, roots showed clear activation of well-established phosphate-starvation markers. Among the top 50 upregulated genes were PHT1;14 (high-affinity Pi transporter) and two PTEN2α (phosphatidylinositol 3,4,5-trisphosphate 3-phosphatase) genes. Additional canonical markers were present within the broader set of ~300 upregulated −P genes, including PHO1, SAP (secreted acid phosphatase), and PIP5K (phosphatidylinositol 4-phosphate 5-kinase). Together, these patterns indicate a coordinated transcriptional response to Pi deficiency under light.
To assess whether the lack of −P induction in darkness reflected biological suppression or low expression, we examined normalized counts for select canonical PSR genes (Table 2). Canonical PSR markers such as PHT1, PHO1, and PTEN2α showed robust induction under −P under light, but only small or no changes under −P in darkness. Importantly, all canonical PSR genes examined in Table 2 exceeded the ≥10-read threshold in at least 3 replicates, including dark-grown roots. For example, PHO1 showed 24 normalized counts in +P dark roots and 32 under −P dark, while PHT1 showed 944 and 807 normalized counts, respectively. These values demonstrate that canonical PSR genes are expressed at substantial levels even in darkness.
Only four genes passed significance thresholds for upregulation in −P in the dark, including an L10-interacting MYB domain-containing transcription factor, while numerous metabolic and stress-associated genes were downregulated. This reduced response is consistent with a general attenuation of Pi-deficiency transcriptional changes in dark-grown roots.
2.5. Sensitivity Analysis Reveals a Small Set of Pi-Responsive Genes in Darkness
To ensure that the minimal Pi response observed in darkness was not an artifact of stringent statistical filtering, we reanalyzed the dark dataset using relaxed criteria (|log₂FC| > 0.5, adjusted p < 0.1). This analysis identified 13 upregulated genes (including the original four), among them PHR11, two L10-interacting MYB domain–containing transcription factors, and several genes related to sugar metabolism (Table 3). These subtle changes support the interpretation that local or basal sensing mechanisms remain active in darkness, whereas systemic activation of the phosphate-starvation program requires light-derived carbon.
2.6. Functional Enrichment Highlights Light-Dependent Transcriptional Reprogramming During Pi Deficiency
To characterize the biological processes underlying the observed transcriptional patterns, we performed functional enrichment analyses using KEGG annotations (Figure 5). As expected from the large number of −P-responsive genes under light conditions, multiple pathways were significantly enriched among genes upregulated under −P in the light (Figure 5a). These included signaling and regulatory categories such as MAPK and plant hormone signaling, as well as several lipid- and inositol-related processes. In contrast, enrichment among −P-upregulated genes in darkness was highly limited: only glycolysis/gluconeogenesis passed the threshold for significance (Figure 5b).
Among downregulated genes, −P in light showed enrichment in categories such as oxidative phosphorylation, ubiquitin-mediated proteolysis, and ATP-dependent chromatin remodeling (Figure 5c), consistent with downregulation of energetically demanding or housekeeping pathways during Pi stress. −P in dark displayed a different pattern, with downregulated genes enriched in flavonoid biosynthesis, plant hormone signal transduction, and plant–pathogen interaction (Figure 5d).
Analyses of the light–dark comparisons (Supplementary Figures S1–S2) revealed similar global trends: photosynthesis- and energy-related pathways were enriched under light but reduced under darkness, reinforcing the dominant effect of light on root transcriptome structure.
2.7. Protein–Protein Interaction Network Identifies Core Response Modules
To examine potential functional relationships among genes upregulated under −P in the light, we constructed a protein–protein interaction network using STRING (Figure 5e). The network showed significant enrichment for known interactions (p < 1 × 10⁻⁴ to p < 1 × 10⁻¹⁶), indicating that these genes form coordinated functional modules rather than independent responses.
Clustering using the Markov Cluster Algorithm (MCL) resolved several groups organized by annotated biological functions. The largest clusters were associated with chromatin remodeling and transcriptional regulation, containing multiple transcription factors and chromatin-associated proteins, features consistent with broad regulatory control of the Pi response. A second major cluster corresponded to carbon and nitrogen metabolism, encompassing enzymes from glycolytic and amino acid pathways, in line with the metabolic reprogramming revealed by KEGG enrichment. Additional clusters were linked to signaling processes, including salicylic acid, ethylene, and phosphatidylinositol signaling, as well as calmodulin binding, highlighting crosstalk between Pi signaling and hormonal or calcium-dependent regulation. Finally, a distinct Pi-metabolism cluster contained phosphate transporters and phosphatases, representing direct components of Pi uptake and turnover.
Overall, the protein–protein interaction network highlights that the −P-responsive genes induced under light form several coordinated functional groups spanning regulation, signaling, and metabolism.
2.8. qRT-PCR Assessment of Selected Pi-Responsive Genes
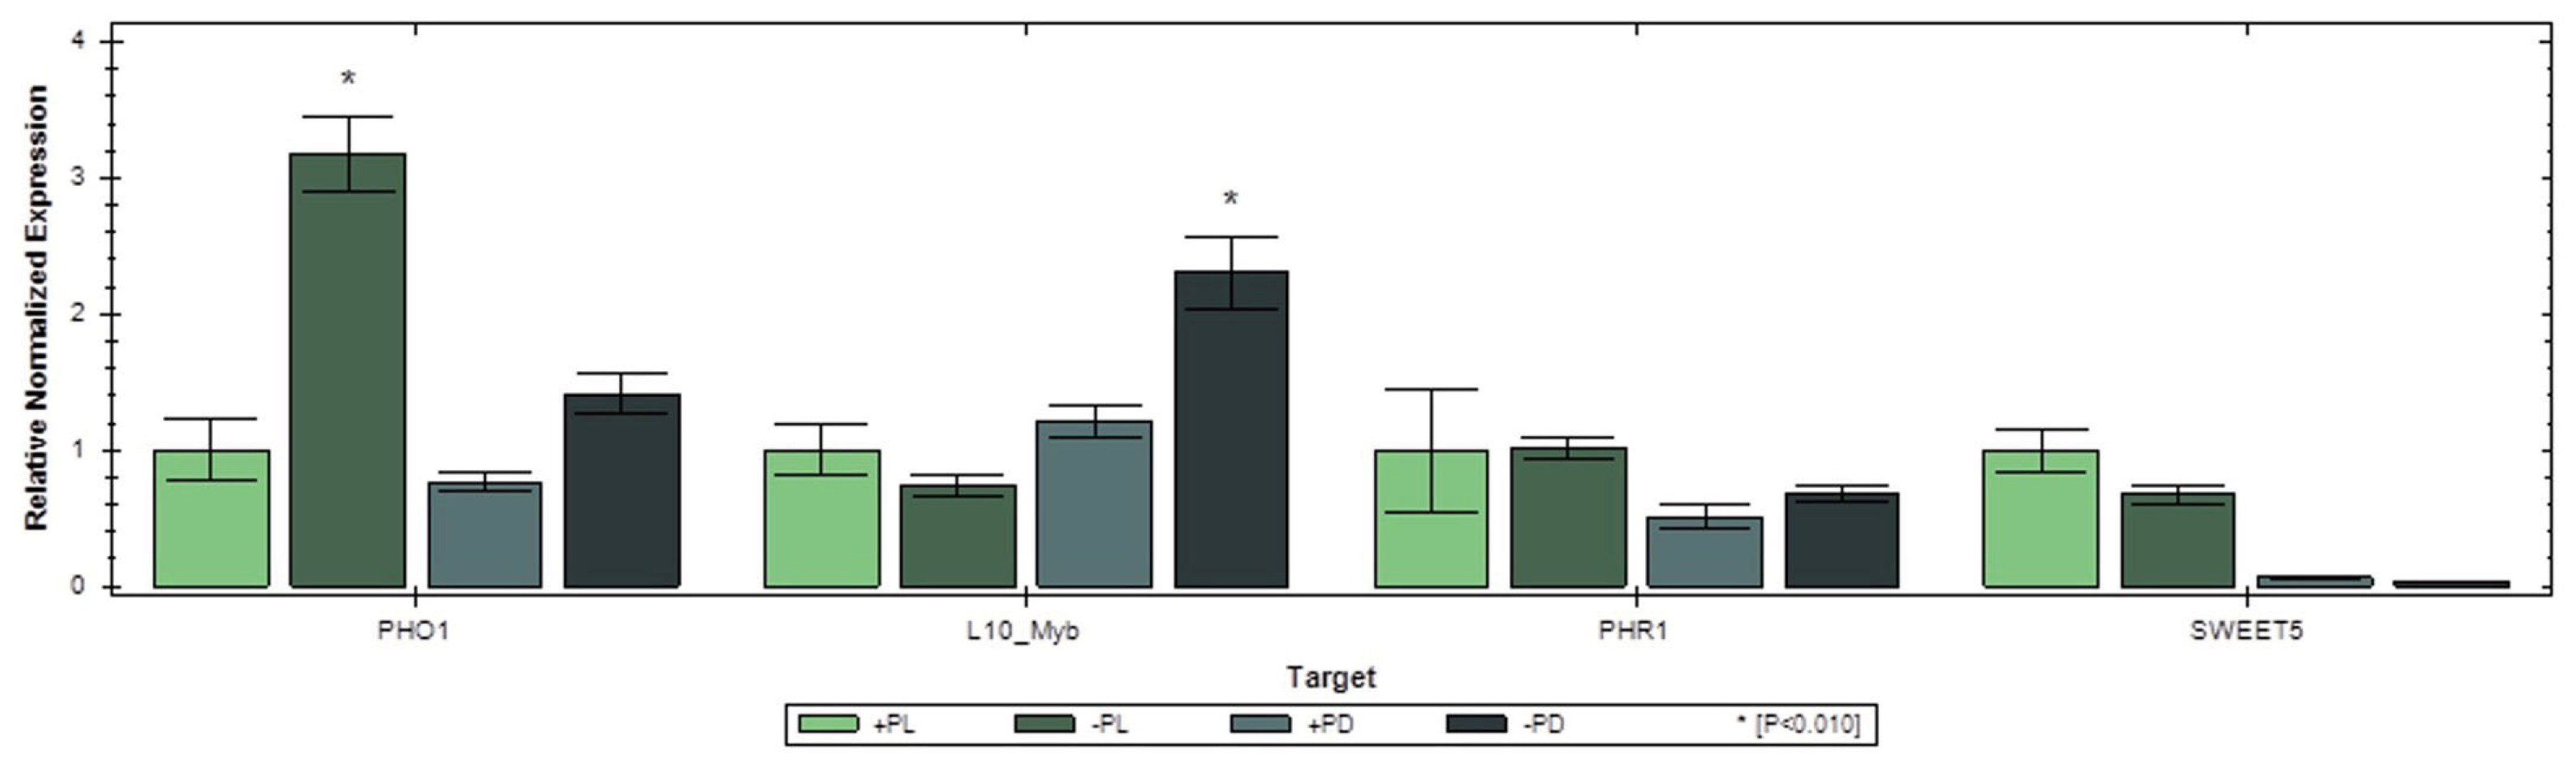
Expression patterns of selected genes were evaluated by qRT-PCR (quantitative Reverse-Transcription PCR), including one gene upregulated under −P in light-grown roots (PHO1), two genes showing −P-associated induction in darkness in the RNA-seq dataset (L10-interacting MYB and SWEET5), and PHR1, which showed a slight but non-significant increase under −P in darkness. qRT-PCR confirmed that PHO1 was significantly upregulated under −P in the light, whereas expression in darkness remained low, consistent with the RNA-seq results. The L10-interacting MYB gene also showed detectable induction under −P in darkness, but not in light.
For PHR1, qRT-PCR reproduced the small increase observed in the RNA-seq dataset, but this change was not statistically significant in either assay. Such low-amplitude shifts should be interpreted cautiously, as they may fall near the limit of detection for both methods. SWEET5 expression in darkness could not be reliably quantified (Ct > 32), preventing validation; this is consistent with its very low expression in the RNA-seq data and illustrates the challenge of validating genes with extremely low transcript abundance. Overall, qRT-PCR results were broadly consistent with the major expression patterns identified by RNA-seq.
Figure 6.
qRT-PCR assessment of selected Pi-responsive genes. Relative transcript levels of PHO1, L10-interacting MYB, PHR1, and SWEET5 were measured under phosphate-sufficient (+P) and phosphate-deficient (−P) conditions in light (L) and dark (D). Bars represent the mean ± SE of three technical replicates of a representative biological replicate. Expression values were normalized to a methyltransferase reference gene that showed stable expression across treatments in the RNA-seq dataset. Asterisks indicate significant differences between +P and −P within each light condition (p < 0.01). SWEET5 expression in darkness was near the detection limit (Ct > 32), and corresponding qRT-PCR values should be interpreted with caution.
3. Discussion
3.1. Systemic Pi Signaling Enabled by Light
Pi deficiency triggered a broad transcriptional response in soybean roots under light, consistent with activation of the canonical Phosphate Starvation Response (PSR). Genes encoding Pi transporters such as PHT1 and PHO1 were strongly induced, in agreement with their established roles in high-affinity uptake and xylem loading, and with the known relief of PHO2-mediated repression under Pi limitation [36]. The induction of PTEN2α, phospholipases, as well as KEGG enrichment for lipid metabolism, is consistent with the shift from phospholipids to P-free membrane lipids also characteristic of the PSR [21,37]. In total, 364 genes were upregulated under −P in light, spanning transport, signaling, transcriptional regulation, and metabolism. This broad transcriptional activation under light corresponds to the “canonical” component of the Pi starvation response illustrated in Figure 7.
While sucrose-mediated regulation of individual Pi-responsive genes has been well documented in multiple plant species, most extensively in Arabidopsis [23], our results highlight the extent to which sucrose availability enables genome-wide transcriptional reprogramming during Pi deficiency. Light-dependent sucrose production is likely a major contributor to this effect, as photosynthesis supports both carbon availability and long-distance sucrose signaling from shoot to root.
Dark treatment has been widely used as an experimental approach to reduce endogenous sucrose levels in studies investigating sucrose-mediated signaling in plants [24,35,38,39]. Consistent with this rationale, 24 hour dark treatment has been shown to significantly reduce sucrose levels in Arabidopsis roots [35]. Together with these prior observations, our results support the interpretation that reduced sucrose availability limits activation of the canonical PSR in the dark.
In Arabidopsis, sucrose accumulation has been shown to be required not only for Pi-deficiency signaling but also for activation of Fe-deficiency responses, with darkness suppressing FRO2 and IRT1 induction by limiting sucrose delivery to the root [35]. These studies established sucrose as a central systemic signal linking shoot carbon status to root nutrient responses. In soybean, sucrose-feeding experiments similarly demonstrate that exogenous sucrose enhances root growth and induces metabolic signatures resembling Pi starvation [40]. Together with our observations, these findings suggest that abundant shoot-derived sucrose under light enables engagement of the canonical PSR, supporting broad transcriptional activation across multiple functional categories in soybean roots.
3.2. Pi Signaling in Darkness: A Small Sucrose-Independent Response That Includes a MYB Transcription Factor
In contrast to the broad response seen under light, Pi-deficient roots in darkness showed very limited transcriptional activation, with only four genes passing standard significance thresholds. Notably, among this small set, an L10-interacting MYB-domain transcription factor met stringent differential expression criteria (|log₂FC| > 1; padj < 0.05), and its upregulation was independently confirmed by qRT-PCR.
When relaxing statistical stringency (|log₂FC| > 1; padj < 0.1), a total of 13 upregulated genes emerged, including two additional MYB-domain transcription factors: PHR11, a homolog of the central PSR regulator PHR1 [41], and another L10-interacting MYBs. L10-interacting MYB factors have been linked to nutrient and ribosomal stress [42], and their activation in darkness suggests they may participate in a sucrose-independent Pi deficiency response.
Conservative statistical thresholds using adjusted p-values (padj) can reduce the number of detected DEGs, but even relaxed criteria revealed only a small set of −P responsive genes in darkness. This indicates that the minimal PSR observed in dark-grown roots likely reflects true biological attenuation rather than an artifact of stringent statistical filtering.
Local Pi sensing is known to occur in the root apex, involving LPR1/LPR2-dependent Fe redox chemistry, auxin transport, ROS gradients, and ethylene or strigolactone signaling [36,43]. These mechanisms typically involve only small cell populations that would be diluted in bulk RNA-seq and thus may not have been detected in our study.
Additional insight comes from 11 genes consistently downregulated under −P in both light and dark. Because sucrose-dependent systemic signaling is largely inactive in darkness, these genes likely represent a carbon-independent component of the −P response. These include proteins associated with metabolism (e.g., RuBisCO-associated protein, phosphoglycerate mutase–like protein), signaling (TAXIMIN2, a VQ-motif protein), and secondary metabolism (dirigent protein 22).
Taken together, our data support a two-component view of the soybean Pi response. Light enables a broad, carbon-supported PSR, whereas darkness reveals a much smaller, sucrose-independent transcriptional subset (Figure 7).
3.3. Limitations and Future Directions
Although sucrose availability was not directly quantified, our experimental design relied on well-established effects of darkness on photosynthetic sucrose export. Dark treatment has been widely used to reduce endogenous sucrose levels in studies of sucrose-mediated signaling, and has been shown to significantly decrease sucrose concentrations in roots after extended periods of darkness [35]. Using darkness to suppress sucrose delivery therefore provides a tractable way to probe carbon dependencies, but it also introduces additional metabolic and hormonal changes. Future experiments that supplement sucrose under darkness, or selectively disrupt shoot–root carbon transport (e.g., by girdling), will help clarify the extent to which sucrose regulates the transcriptional response to Pi deficiency.
While Nanopore cDNA sequencing provided sufficient depth to capture robust genome-wide responses under light, additional weakly responsive genes may remain below detection thresholds, particularly if expressed at low levels or restricted to specific cell types. Approaches with increased sensitivity or spatial resolution, such as cell type-resolved or spatial transcriptomic methods, will be valuable to determine whether the sucrose-independent gene set marks discrete Pi-sensing domains within the root apex.
Despite these limitations, our study reveals a clear contrast between the extensive Pi-responsive transcriptome activated under light and the minimal sucrose-independent subset detectable in darkness. Understanding how carbon availability modulates Pi uptake, membrane remodeling, and stress acclimation has practical implications for improving Pi-use efficiency, particularly under field conditions where shading or environmental stress may restrict carbon allocation to the root system.
4. Materials and Methods
4.1. Overview
This study investigated transcriptomic responses of soybean (G. max) roots to phosphate (P) availability under light and dark conditions using Oxford Nanopore long-read sequencing. Plants were grown hydroponically under controlled conditions and exposed to P deficiency for 30 hours under light or dark treatments. Root RNA was extracted for full-length cDNA library preparation, sequencing was performed on MinION flow cells, and reads were processed through a reproducible bioinformatics workflow.
4.2. Plant Growth and Treatment
Glycine max cv. Williams 82 seeds (a friendly gift from John Harada and Julie Marie Pelletier, University of California, Davis) were germinated for 3–4 days and transferred to hydroponic containers containing 8 L of half-strength Hoagland solution. The nutrient solution was replenished every 3–4 days. Plants were grown in a temperature-controlled chamber maintained at 27 °C with a 12 h light/12 h dark photoperiod.
After 10 days, cotyledons were removed to deplete stored Pi reserves. At 14 days, plants were subjected to one of four conditions: phosphate-sufficient (+P) light, phosphate-deficient (−P) light, +P dark, and −P dark, each maintained for 30 h. Each treatment was independently regrown four times to generate biological replicates, with each replicate representing a separate hydroponic experiment performed on different days. At harvest, ~5 cm segments of the main root axes, including the root tip region, were excised, immediately flash-frozen in liquid nitrogen, and stored at –80 °C until RNA extraction.
4.3. RNA Isolation and Quality Assessment
Total RNA was isolated from frozen root tissue using the RNeasy Plant Mini Kit (Qiagen, Hilden, Germany) according to the manufacturer’s protocol for “Purification of Total RNA from Plant Cells and Tissues, and Filamentous Fungi.” RNA concentration and integrity were evaluated using a Qubit 4 Fluorometer (Thermo Fisher Scientific, Waltham, MA, USA) with the Qubit RNA High Sensitivity and RNA IQ assays. The RNA IQ assay measures the proportion of large or structured RNA relative to small RNA to assess sample integrity. Only samples with RNA IQ ≥ 7 were used for sequencing; most samples had RNA IQ > 8.
4.4. cDNA Library Preparation and Quantification
For each sample, 500 ng of total RNA was used to synthesize cDNA using the cDNA-PCR Sequencing Kit V14 with Barcoding (Oxford Nanopore Technologies, Oxford, UK), following the manufacturer’s instructions. cDNA library concentration and quality were verified with an Agilent TapeStation (Agilent Technologies, Santa Clara, CA, USA). For each biological replicate, four barcoded cDNA libraries were pooled to a final amount of 50 fmol.
4.5. Nanopore Sequencing
Sequencing was performed using the Oxford Nanopore Technologies cDNA-PCR Sequencing V14 – Barcoding (SQK-PCB114.24) protocol with R10.4.1 flow cells (FLO-MIN114). Flow cells were primed and loaded with pooled cDNA according to the manufacturer’s instructions. Each MinION sequencing run was conducted for 72 h.
4.6. Nanopore Sequencing Analysis
Raw reads were processed in MinKNOW, retaining only passed reads (Q > 7) and demultiplexed during sequencing. Dorado basecalling was tested for comparison, but MinKNOW produced higher read counts and was used for all downstream analyses. Sequencing data were transferred to the Expanse high-performance computing cluster (San Diego Supercomputer Center, USA).
Read orientation and trimming: Full-length cDNA reads were identified and oriented using Pychopper v2.7 (RRID:SCR_018966; https://github.com/epi2me-labs/pychopper) with the -m edlib setting.
Read alignment: Reads were aligned to the G. max reference genome (GCF_000004515.6 v4.0; downloaded 1 Oct 2025) using Minimap2 v2.30-r1287 [44]. Alignments were sorted and indexed with Samtools v1.20 [45].
Gene quantification: Gene counts were obtained using featureCounts v2.0.6 [46] in long-read mode (-L) with single-end, stranded settings (-s 1). The resulting count matrix and summary tables were exported for downstream analysis in R.
Quality control: Mapping statistics were evaluated using samtools flagstat and featureCounts summary reports.
4.7. Differential Expression Analysis
Differential expression analyses were performed in R (v4.4.0) within RStudio. Raw count matrices from featureCounts were imported into the DESeq2 (v1.42.0) package [47] for normalization and differential expression analysis. Before differential expression analysis, genes were prefiltered by requiring at least 10 raw counts in at least 3 biological replicates within any one of the four treatment groups. This removed low-abundance genes prior to DESeq2 dispersion estimation. Normalized counts were obtained using the variance-stabilizing transformation (VST) in DESeq2. Genes with adjusted p < 0.05 and |log₂ fold change| ≥ 1 were considered significantly differentially expressed. Genes used to exemplify read depth (Table 2) were selected based on their well-established functions in Pi uptake, transport, or transcriptional signaling, ensuring that representative and biologically relevant PSR components were included.
Principal component analysis (PCA) was performed on variance-stabilizing transformed (VST) counts using DESeq2. The PCA was calculated using the top 500 most variable genes, and the first two principal components were visualized with ggplot2. Replicate identifiers were added to the plot to assess clustering within and across treatments.
UpSet plots: Overlaps among DEG sets were visualized using UpSetR v1.4.0 [48] with separate plots for up- and downregulated genes.
Heatmaps: Expression patterns were visualized using ComplexHeatmap v2.20.0 [49], with per-gene z-score scaling of VST counts.
GO enrichment: Gene Ontology (GO) enrichment was performed with g:Profiler (organism = “gmax”) on up- and downregulated DEG sets (FDR < 0.05). The background set consisted of all expressed genes. Results were summarized by Biological Process terms with gentle term collapsing and flattened list columns before export.
KEGG enrichment: KEGG pathway analysis was performed using clusterProfiler v4.10.0 [50] mapping Glyma IDs to KEGG Orthology (KO) terms via KEGGREST. Enrichment was tested using DEGs as the query set and all expressed genes as background.
STRING network analysis: Protein–protein interaction (PPI) networks were analyzed using STRING v12.0 [51] with G. max as the reference organism. Upregulated genes under −P light were uploaded to identify functional clusters using the Markov Cluster Algorithm (MCL, default inflation). Significant network enrichment was defined by STRING-calculated p-values ranging from < 1 × 10⁻⁴ to < 1 × 10⁻¹⁶.
4.8. Validation by qRT-PCR
For each sample, 2000 ng of total RNA was treated with RNase-free DNase to remove genomic DNA, then reverse-transcribed using the iScript™ gDNA Clear cDNA Synthesis Kit (Bio-Rad, Hercules, CA, USA). A methyltransferase (LOC100819876) gene was selected as reference based on stable expression across all conditions. Primers were designed in Primer-BLAST, preferentially spanning exon junctions or framing introns, with amplicon sizes of 70–220 bp and minimal 3′ complementarity to prevent primer–dimer formation.
Primer sequences:
Methyltransferase 17 (LOC100819876): F TTGAGCCCTCACGAGGATTC;
R CTTATGTACACCCGGCGCA;
PHO1: F ACAGAGCCAGCTTATATGGACAT;
R CAATGCTGTGCTTGGTGAGA;
L10-interacting MYB-domain protein (LOC100820117): F TCTCAACTGAGCGGAAGTGC; R TCATTTTGCAACCTCCTGCG;
PHR11: F CCAGAATCAGATGACTGAAAGCTTG;
R GTTCAGCTTTTGCAAGTTCCATA;
SWEET5: F AGGACTACTACATCGCTCTACCA;
R TCCTCAATAGTTATCTCAGTCACAG
qPCR was performed using SYBR Green Supermix (Bio-Rad) on a CFX96 instrument under the following program: 95 °C for 30 s; 40 cycles of 95 °C for 15 s and 60 °C for 30 s. A melt curve analysis followed from 65 °C to 95 °C with 0.5 °C increments every 5 s. CFX Maestro Software (Bio-Rad) was used to obtain Cq values and calculate relative expression using the ΔΔCq method.
4.9. Statistical Analysis
All statistical analyses were conducted in R (v4.4.0). For RNA-seq data, differential expression was evaluated with the Wald test in DESeq2, using Benjamini–Hochberg FDR correction (padj < 0.05, |log₂FC| ≥ 1). Multivariate relationships among samples were examined by PCA. For enrichment analyses, overrepresentation of GO terms and KEGG pathways was assessed in clusterProfiler with adjusted p-value < 0.05 as the significance threshold.
5. Conclusions
Soybean roots require photosynthetically derived sucrose to mount the canonical phosphate starvation response (PSR). Under P deficiency in light, abundant sucrose transport from shoot to root supports coordinated induction of Pi transporters, signaling components, lipid-remodeling enzymes, and metabolic pathways. In contrast, darkness, which greatly reduces photosynthetic sucrose transport, suppresses these responses and reveals only a small, sucrose-independent subset that includes a MYB transcription factor and genes linked to sugar metabolism. Together, these findings highlight the importance of light in shaping early Pi-deficiency responses in soybean roots.
Supplementary Materials
The following supporting information can be downloaded at the website of this paper posted on Preprints.org. Table S1: Detailed Nanopore cDNA sequencing metrics for soybean roots under light and dark ±P conditions. Figure S1: GO enrichment of differentially expressed genes under phosphate deficiency (–P) and phosphate sufficiency (+P) in light and dark conditions.; Figure S2: KEGG enrichment of differentially expressed genes under phosphate-sufficient (+P) and phosphate-deficient (–P) conditions in light and dark.
Author Contributions
Conceptualization, all authors; methodology, all authors; software, not applicable; validation, all authors; formal analysis, C.U.-S.; investigation, all authors; resources, C.U.-S.; data curation, all authors; writing—original draft preparation, A.S., I.T., N.S., J.B., L.V., R.M., M.A., J.N., K.T., G.P., K.M., and T.C.; writing—review and editing, all authors; visualization, all authors; supervision, C.U.-S.; project administration, C.U.-S.; funding acquisition, C.U.-S. All authors have read and agreed to the published version of the manuscript.
Funding
This research was funded by an internal RSCA grant 2024–2025, California State University, East Bay and by the National Science Foundation Plant Genome Research Program (USA) under grant number 2329893. The use of supercomputers (San Diego Supercomputer Expanse) was supported by an ACCESS grant SEE210001 (2025-2026).
Institutional Review Board Statement
Not applicable.
Informed Consent Statement
Not applicable.
Data Availability Statement
Nanopore sequencing data has been deposited in the NCBI Gene Expression Omnibus (GEO) under accession number GSE312797. Additional data supporting this study are available from the corresponding author upon reasonable request.
Acknowledgments
The authors used ChatGPT (OpenAI, GPT-5.1) for language editing and technical guidance related to RNA-seq data processing on the Expanse supercomputer and figure preparation in R. All AI-generated output was reviewed and edited by the authors, who take full responsibility for the final content.
Conflicts of Interest
The authors declare no conflicts of interest.
Abbreviations
The following abbreviations are used in this manuscript:
| DEG | Differentially Expressed Genes |
| GO | Gene Ontology |
| KEGG | Kyoto Encyclopedia of Genes and Genomes |
| MA-plot | Mean–average plot (log₂ fold change vs mean expression) |
| padj | Adjusted p-value (Benjamini–Hochberg correction) |
| Pi | inorganic phosphate |
| PCA | Principal Component Analysis |
| PPi | Pyrophosphate |
| PSR | Phosphate starvation response |
| qRT-PCR | Quantitative reverse transcription PCR |
| RNA-seq | RNA sequencing |
References
- Vance, C.P.; Uhde-Stone, C.; Allan, D.L. Phosphorus acquisition and use: critical adaptations by plants for securing a nonrenewable resource. New Phytologist 2003, 157, 423–447. [Google Scholar] [CrossRef]
- Cordell, D.; Drangert, J.; White, S. The story of phosphorus: Global food security and food for thought. Global Environmental Change 2009, 19, 292–305. [Google Scholar] [CrossRef]
- Geissler, B.; Mew, M.C.; Matschullat, J.; Steiner, G. Innovation potential along the phosphorus supply chain: A micro and macro perspective on the mining phase. Sci Total Environ 2020, 714, 136701. [Google Scholar] [CrossRef] [PubMed]
- Alewell, C.; Ringeval, B.; Ballabio, C.; Robinson, D.A.; Panagos, P.; Borrelli, P. Global phosphorus shortage will be aggravated by soil erosion. Nature communications 2020, 11, 4546. [Google Scholar] [CrossRef] [PubMed]
- Volkova, E.; Smolyaninova, N. Analysis of world trends in soybean production. In Proceedings of the BIO Web of Conferences, 2024; p. 01026. [Google Scholar]
- Cai, Z.; Cheng, Y.; Xian, P.; Ma, Q.; Wen, K.; Xia, Q.; Zhang, G.; Nian, H. Acid phosphatase gene GmHAD1 linked to low phosphorus tolerance in soybean, through fine mapping. TAG. Theoretical and applied genetics. Theoretische und angewandte Genetik 2018, 131, 1715–1728. [Google Scholar] [CrossRef]
- O'Rourke, J.A.; Graham, M.A. Gene Expression Responses to Sequential Nutrient Deficiency Stresses in Soybean. International journal of molecular sciences 2021, 22. [Google Scholar] [CrossRef]
- Chen, G.; Ran, Q.-X.; Wang, C.; Pang, J.; Ren, M.-J.; Wang, Z.-Y.; He, J.; Lambers, H. Enhancing photosynthetic phosphorus use efficiency through coordination of leaf phosphorus fractions, allocation, and anatomy during soybean domestication. Journal of Experimental Botany 2025, 76, 1446–1457. [Google Scholar] [CrossRef]
- Fang, Y.; Lu, L.; Chen, K.; Wang, X. Tradeoffs among root functional traits for phosphorus acquisition in 13 soybean genotypes contrasting in mycorrhizal colonization. Annals of Botany 2024, 134, 179–190. [Google Scholar] [CrossRef]
- Tantriani; Cheng, W.; Oikawa, A.; Tawaraya, K. Phosphorus deficiency alters root length, acid phosphatase activity, organic acids, and metabolites in root exudates of soybean cultivars. Physiol Plant 2023, 175, e14107. [Google Scholar] [CrossRef]
- Péret, B.; Clément, M.; Nussaume, L.; Desnos, T. Root developmental adaptation to phosphate starvation: better safe than sorry. Trends in plant science 2011. [Google Scholar] [CrossRef]
- Xu, H.; Zhang, H.; Fan, Y.; Wang, R.; Cui, R.; Liu, X.; Chu, S.; Jiao, Y.; Zhang, X.; Zhang, D. The purple acid phosphatase GmPAP17 predominantly enhances phosphorus use efficiency in soybean. Plant Sci 2022, 320, 111283. [Google Scholar] [CrossRef]
- Li, F.; Mai, C.; Liu, Y.; Deng, Y.; Wu, L.; Zheng, X.; He, H.; Huang, Y.; Luo, Z.; Wang, J. Soybean PHR1-regulated low phosphorus-responsive GmRALF22 promotes phosphate uptake by stimulating the expression of GmPTs. Plant Sci 2024, 348, 112211. [Google Scholar] [CrossRef]
- Qin, L.; Guo, Y.; Chen, L.; Liang, R.; Gu, M.; Xu, G.; Zhao, J.; Walk, T.; Liao, H. Functional characterization of 14 Pht1 family genes in yeast and their expressions in response to nutrient starvation in soybean. PloS one 2012, 7, e47726. [Google Scholar] [CrossRef]
- Qin, L.; Zhao, J.; Tian, J.; Chen, L.; Sun, Z.; Guo, Y.; Lu, X.; Gu, M.; Xu, G.; Liao, H. The high-affinity phosphate transporter GmPT5 regulates phosphate transport to nodules and nodulation in soybean. Plant physiology 2012, 159, 1634–1643. [Google Scholar] [CrossRef]
- Miao, N.; Zhou, J.; Li, M.; Zhang, J.; Hu, Y.; Guo, J.; Zhang, T.; Shi, L. Remodeling and protecting the membrane system to resist phosphorus deficiency in wild soybean (Glycine soja) seedling leaves. Planta 2022, 255, 53. [Google Scholar] [CrossRef] [PubMed]
- Yao, Y.; Yuan, H.; Liu, D.; Cheng, L. Response of soybean root exudates and related metabolic pathways to low phosphorus stress. PloS one 2024, 19, e0314256. [Google Scholar] [CrossRef]
- Plaxton, W.C.; Tran, H.T. Metabolic adaptations of phosphate-starved plants. Plant physiology 2011, 156, 1006–1015. [Google Scholar] [CrossRef]
- Ried, M.K.; Wild, R.; Zhu, J.; Pipercevic, J.; Sturm, K.; Broger, L.; Harmel, R.K.; Abriata, L.A.; Hothorn, L.A.; Fiedler, D.; et al. Inositol pyrophosphates promote the interaction of SPX domains with the coiled-coil motif of PHR transcription factors to regulate plant phosphate homeostasis. Nature communications 2021, 12, 384. [Google Scholar] [CrossRef] [PubMed]
- Secco, D.; Wang, C.; Arpat, B.A.; Wang, Z.; Poirier, Y.; Tyerman, S.D.; Wu, P.; Shou, H.; Whelan, J. The emerging importance of the SPX domain-containing proteins in phosphate homeostasis. New Phytologist 2012, 193, 842–851. [Google Scholar] [CrossRef]
- Mo, X.; Liu, G.; Zhang, Z.; Lu, X.; Liang, C.; Tian, J. Mechanisms Underlying Soybean Response to Phosphorus Deficiency through Integration of Omics Analysis. International journal of molecular sciences 2022, 23. [Google Scholar] [CrossRef] [PubMed]
- Hamburger, D.; Rezzonico, E.; MacDonald-Comber Petetot, J.; Somerville, C.; Poirier, Y. Identification and characterization of the Arabidopsis PHO1 gene involved in phosphate loading to the xylem. The Plant cell 2002, 14, 889–902. [Google Scholar] [CrossRef] [PubMed]
- Hammond, J.; White, P. Sucrose transport in the phloem: integrating root responses to phosphorus starvation. J Exp Bot 2008, 59, 93–109. [Google Scholar] [CrossRef] [PubMed]
- Karthikeyan, A.S.; Varadarajan, D.K.; Jain, A.; Held, M.A.; Carpita, N.C.; Raghothama, K.G. Phosphate starvation responses are mediated by sugar signaling in Arabidopsis. Planta 2007, 225, 907–918. [Google Scholar] [CrossRef] [PubMed]
- Ruffel, S. Nutrient-Related Long-Distance Signals: Common Players and Possible Cross-Talk. Plant Cell Physiol 2018, 59, 1723–1732. [Google Scholar] [CrossRef]
- Hammond, J.P.; White, P.J. Sugar signaling in root responses to low phosphorus availability. Plant physiology 2011, 156, 1033–1040. [Google Scholar] [CrossRef]
- Lei, M.; Liu, Y.; Zhang, B.; Zhao, Y.; Wang, X.; Zhou, Y.; Raghothama, K.G.; Liu, D. Genetic and genomic evidence that sucrose is a global regulator of plant responses to phosphate starvation in Arabidopsis. Plant physiology 2011, 156, 1116–1130. [Google Scholar] [CrossRef] [PubMed]
- Nidumolu, L.C.M.; Lorilla, K.M.; Chakravarty, I.; Uhde-Stone, C. Soybean Root Transcriptomics: Insights into Sucrose Signaling at the Crossroads of Nutrient Deficiency and Biotic Stress Responses. Plants (Basel) 2023, 12. [Google Scholar] [CrossRef]
- Franco-Zorrilla, J.; González, E.; Bustos, R.; Linhares, F.; Leyva, A.; Paz-Ares, J. The transcriptional control of plant responses to phosphate limitation. J Exp Bot 2004, 55, 285–293. [Google Scholar] [CrossRef]
- Chien, P.S.; Chiang, C.P.; Leong, S.J.; Chiou, T.J. Sensing and Signaling of Phosphate Starvation - from Local to Long Distance. Plant Cell Physiol 2018. [Google Scholar] [CrossRef]
- Lin, W.-Y.; Huang, T.-K.; Leong, S.J.; Chiou, T.-J. Long-distance call from phosphate: systemic regulation of phosphate starvation responses. Journal of experimental botany 2014, 65, 1817–1827. [Google Scholar] [CrossRef]
- Marro, N.; Lidoy, J.; Chico, M.A.; Rial, C.; Garcia, J.; Varela, R.M.; Macias, F.A.; Pozo, M.J.; Janouskova, M.; Lopez-Raez, J.A. Strigolactones: New players in the nitrogen-phosphorus signalling interplay. Plant Cell Environ 2022, 45, 512–527. [Google Scholar] [CrossRef] [PubMed]
- Poirier, Y.; Jaskolowski, A.; Clua, J. Phosphate acquisition and metabolism in plants. Current biology: CB 2022, 32, R623–R629. [Google Scholar] [CrossRef]
- Rouached, H.; Arpat, A.B.; Poirier, Y. Regulation of phosphate starvation responses in plants: signaling players and cross-talks. Molecular plant 2010, 3, 288–299. [Google Scholar] [CrossRef]
- Lin, X.Y.; Ye, Y.Q.; Fan, S.K.; Jin, C.W.; Zheng, S.J. Increased Sucrose Accumulation Regulates Iron-Deficiency Responses by Promoting Auxin Signaling in Arabidopsis Plants. Plant physiology 2016, 170, 907–920. [Google Scholar] [CrossRef]
- Madison, I.; Gillan, L.; Peace, J.; Gabrieli, F.; Van den Broeck, L.; Jones, J.L.; Sozzani, R. Phosphate starvation: response mechanisms and solutions. J Exp Bot 2023, 74, 6417–6430. [Google Scholar] [CrossRef]
- Pribat, A.; Sormani, R.; Rousseau-Gueutin, M.; Julkowska, M.M.; Testerink, C.; Joubes, J.; Castroviejo, M.; Laguerre, M.; Meyer, C.; Germain, V.; et al. A novel class of PTEN protein in Arabidopsis displays unusual phosphoinositide phosphatase activity and efficiently binds phosphatidic acid. Biochem J 2012, 441, 161–171. [Google Scholar] [CrossRef]
- Price, J.; Laxmi, A.; St Martin, S.; Jang, J. Global transcription profiling reveals multiple sugar signal transduction mechanisms in Arabidopsis. The Plant cell 2004, 16, 2128–2150. [Google Scholar] [CrossRef] [PubMed]
- Liu, J.; Samac, D.; Bucciarelli, B.; Allan, D.; Vance, C. Signaling of phosphorus deficiency-induced gene expression in white lupin requires sugar and phloem transport. The Plant journal: for cell and molecular biology 2005, 41, 257–268. [Google Scholar] [CrossRef] [PubMed]
- Yang, A.; Kong, L.; Wang, H.; Yao, X.; Xie, F.; Wang, H.; Ao, X. Response of Soybean Root to Phosphorus Deficiency under Sucrose Feeding: Insight from Morphological and Metabolome Characterizations. BioMed research international 2020, 2020, 2148032. [Google Scholar] [CrossRef]
- Rubio, V.; Linhares, F.; Solano, R.; Martín, A.; Iglesias, J.; Leyva, A.; Paz-Ares, J. A conserved MYB transcription factor involved in phosphate starvation signaling both in vascular plants and in unicellular algae. Genes & development 2001, 15, 2122–2133. [Google Scholar] [CrossRef]
- Ferreira, M.A.; Teixeira, R.M.; Brustolini, O.J.B.; Saia, T.F.F.; Jean-Baptiste, J.; Ribeiro, N.G.A.; Breves, S.S.; Sampaio, F.R.; Santos, E.G.D.; Leon, B.A.; et al. The immune NIK1/RPL10/LIMYB signaling module regulates photosynthesis and translation under biotic and abiotic stresses. Nature communications 2025, 16, 4433. [Google Scholar] [CrossRef]
- Puga, M.I.; Poza-Carrion, C.; Martinez-Hevia, I.; Perez-Liens, L.; Paz-Ares, J. Recent advances in research on phosphate starvation signaling in plants. J Plant Res 2024, 137, 315–330. [Google Scholar] [CrossRef] [PubMed]
- Li, H. Minimap2: pairwise alignment for nucleotide sequences. Bioinformatics 2018, 34, 3094–3100. [Google Scholar] [CrossRef] [PubMed]
- Li, H.; Handsaker, B.; Wysoker, A.; Fennell, T.; Ruan, J.; Homer, N.; Marth, G.; Abecasis, G.; Durbin, R.; Genome Project Data Processing, S. The Sequence Alignment/Map format and SAMtools. Bioinformatics 2009, 25, 2078–2079. [Google Scholar] [CrossRef]
- Liao, Y.; Smyth, G.K.; Shi, W. featureCounts: an efficient general purpose program for assigning sequence reads to genomic features. Bioinformatics 2014, 30, 923–930. [Google Scholar] [CrossRef] [PubMed]
- Love, M.I.; Huber, W.; Anders, S. Moderated estimation of fold change and dispersion for RNA-seq data with DESeq2. Genome Biol 2014, 15, 550. [Google Scholar] [CrossRef]
- Conway, J.R.; Lex, A.; Gehlenborg, N. UpSetR: an R package for the visualization of intersecting sets and their properties. Bioinformatics 2017, 33, 2938–2940. [Google Scholar] [CrossRef]
- Gu, Z.; Hubschmann, D. Make Interactive Complex Heatmaps in R. Bioinformatics 2022, 38, 1460–1462. [Google Scholar] [CrossRef]
- Wu, T.; Hu, E.; Xu, S.; Chen, M.; Guo, P.; Dai, Z.; Feng, T.; Zhou, L.; Tang, W.; Zhan, L.; et al. clusterProfiler 4.0: A universal enrichment tool for interpreting omics data. Innovation (Camb) 2021, 2, 100141. [Google Scholar] [CrossRef]
- Szklarczyk, D.; Nastou, K.; Koutrouli, M.; Kirsch, R.; Mehryary, F.; Hachilif, R.; Hu, D.; Peluso, M.E.; Huang, Q.; Fang, T.; et al. The STRING database in 2025: protein networks with directionality of regulation. Nucleic acids research 2025, 53, D730–D737. [Google Scholar] [CrossRef]
Figure 1.
Experimental design and transcriptomic responses of soybean roots to 30 hours of phosphate deficiency (−P) under light and dark conditions. (a) Experimental setup. Fourteen-day-old hydroponically grown soybean plants were exposed for 30 h to light or darkness under phosphate-sufficient (+P) or phosphate-deficient (−P) conditions, with four independent biological replicates per treatment. (b) Principal component analysis (PCA) of variance-stabilized expression data. Samples separated strongly by light condition along PC1 (76% of variance), whereas Pi status contributed secondary variation along PC2 (7%). Each point represents one biological replicate, and replicate identifiers are shown to illustrate clustering within treatments. (c−d) UpSet plots showing differentially expressed genes (DEGs; adjusted p < 0.05, |log₂FC| > 1) that were upregulated (c) or downregulated (d) in the indicated contrasts. The majority of transcriptional differences occurred between light and dark treatments, while Pi availability produced clearer effects under light and only limited changes in darkness.
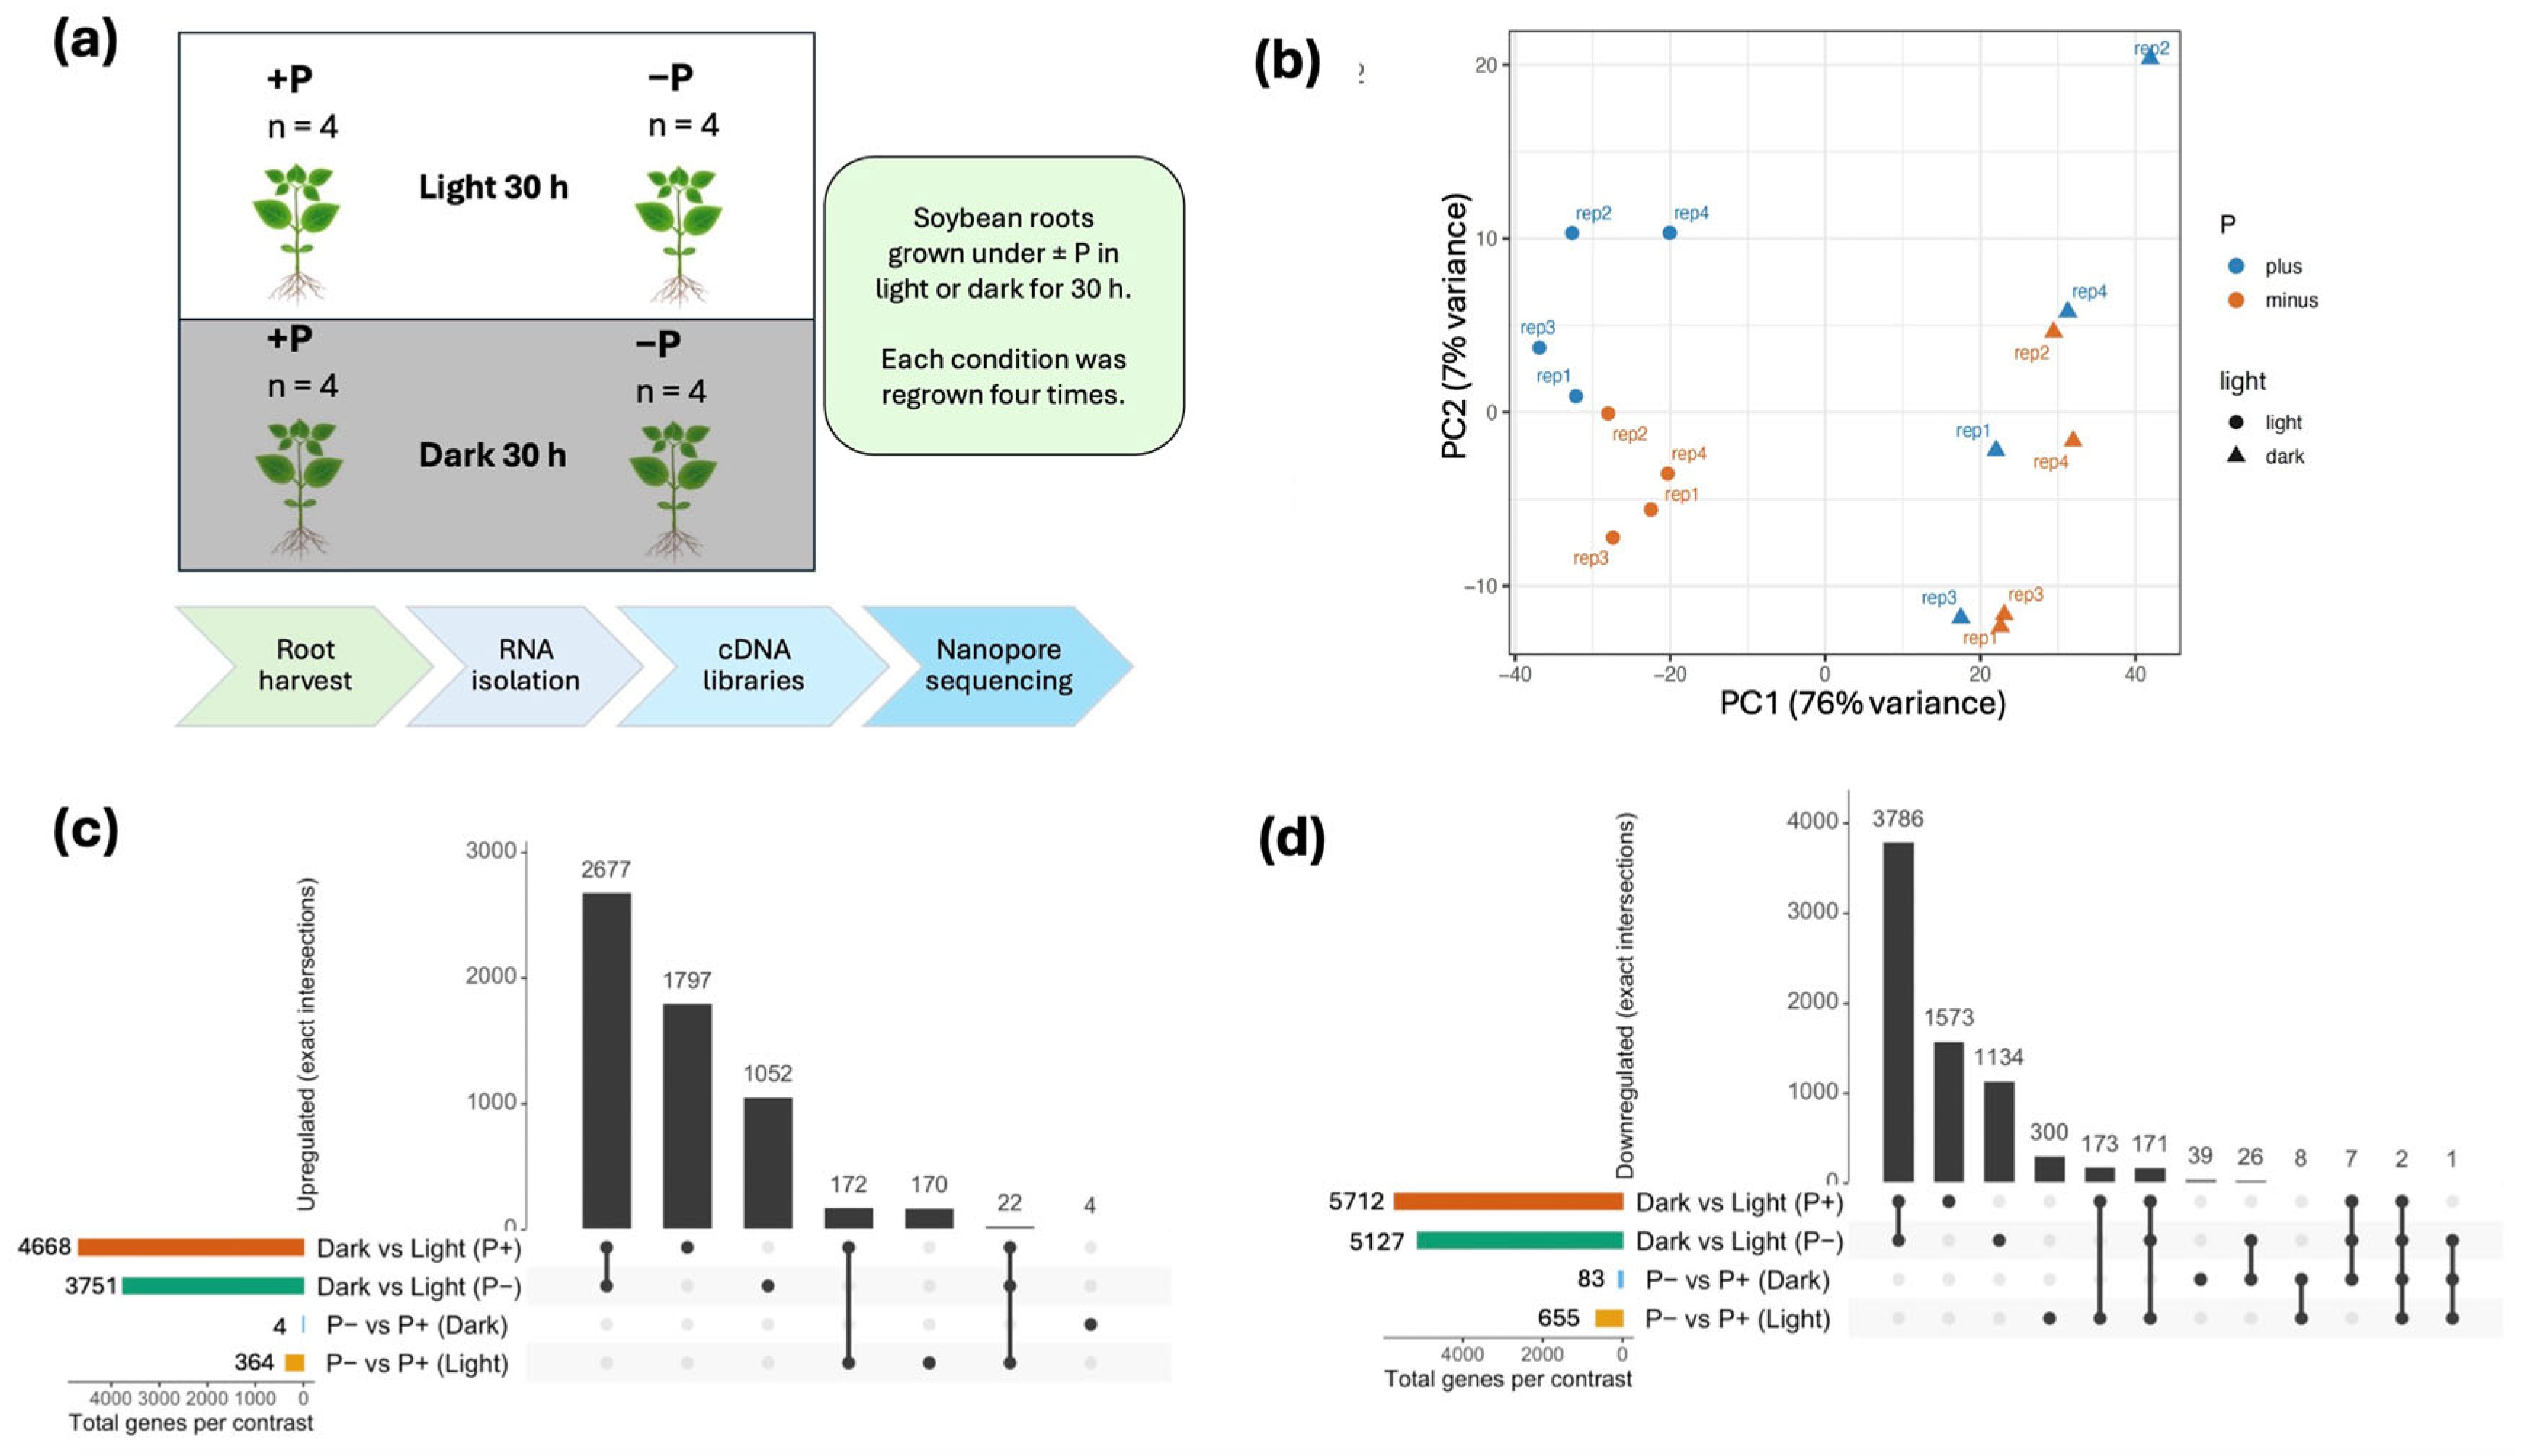
Figure 2.
MA and volcano plots illustrating transcriptional responses to Pi deficiency under light and dark conditions. (a–d) MA plots showing the relationship between mean normalized counts and log₂ fold change for each contrast. Blue points indicate differentially expressed genes (DEGs) using an exploratory threshold of adjusted p < 0.1 and |log₂FC| > 1. Contrasts shown are: (a) −P vs +P in light, (b) −P vs +P in darkness, (c) dark vs light under +P, and (d) dark vs light under −P conditions. These plots highlight broad transcriptional responses to −P under light and more limited changes in darkness. (e–h) Volcano plots depicting the magnitude and statistical support of expression changes for the same contrasts, using a more stringent criterion of adjusted p < 0.05 and |log₂FC| > 1. Red and blue points represent significantly up- and downregulated genes, respectively, and gray points indicate genes not passing significance thresholds. Together, the MA and volcano plots show strong −P-associated transcriptional changes in light-grown roots, whereas −P responses in dark-grown roots are fewer and generally lower in magnitude.
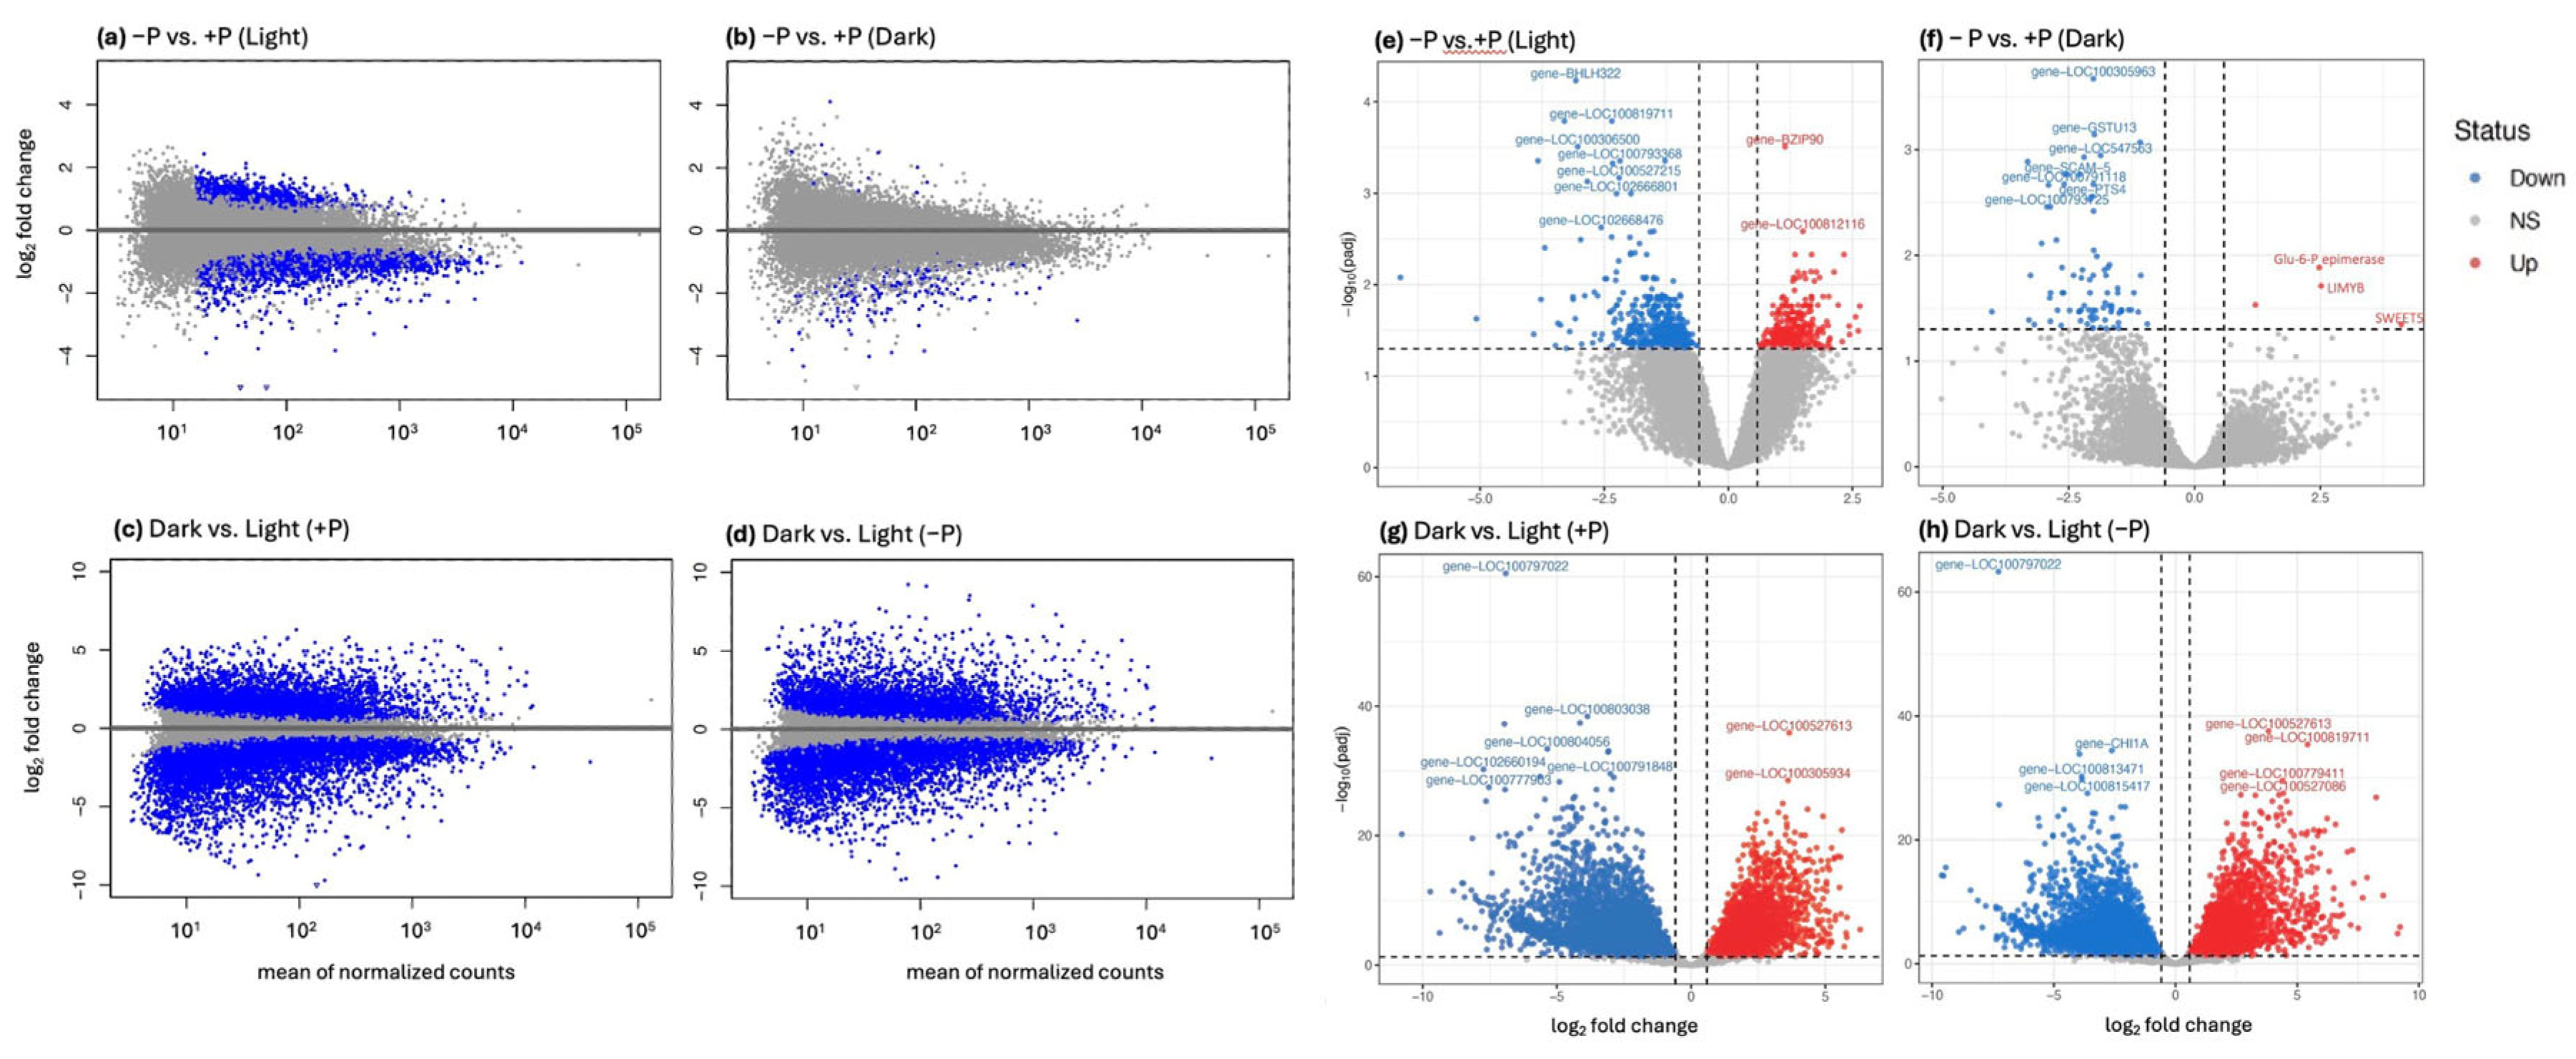
Figure 3.
Heatmap of genes differentially expressed under Pi deficiency in light and dark conditions. Heatmap showing genes differentially expressed (adjusted p < 0.05, |log₂FC| > 1) in comparisons of −P versus +P samples under light or dark conditions. Rows correspond to individual differentially expressed genes (DEGs), and columns correspond to individual biological replicates. Expression values were z-score normalized across samples, with blue and red indicating lower and higher relative expression, respectively. Column annotations indicate phosphate status (+P or −P) and light or dark treatments. The heatmap highlights extensive transcriptional reprogramming under −P in light-grown roots, whereas only a limited subset of DEGs is detected under −P in darkness.
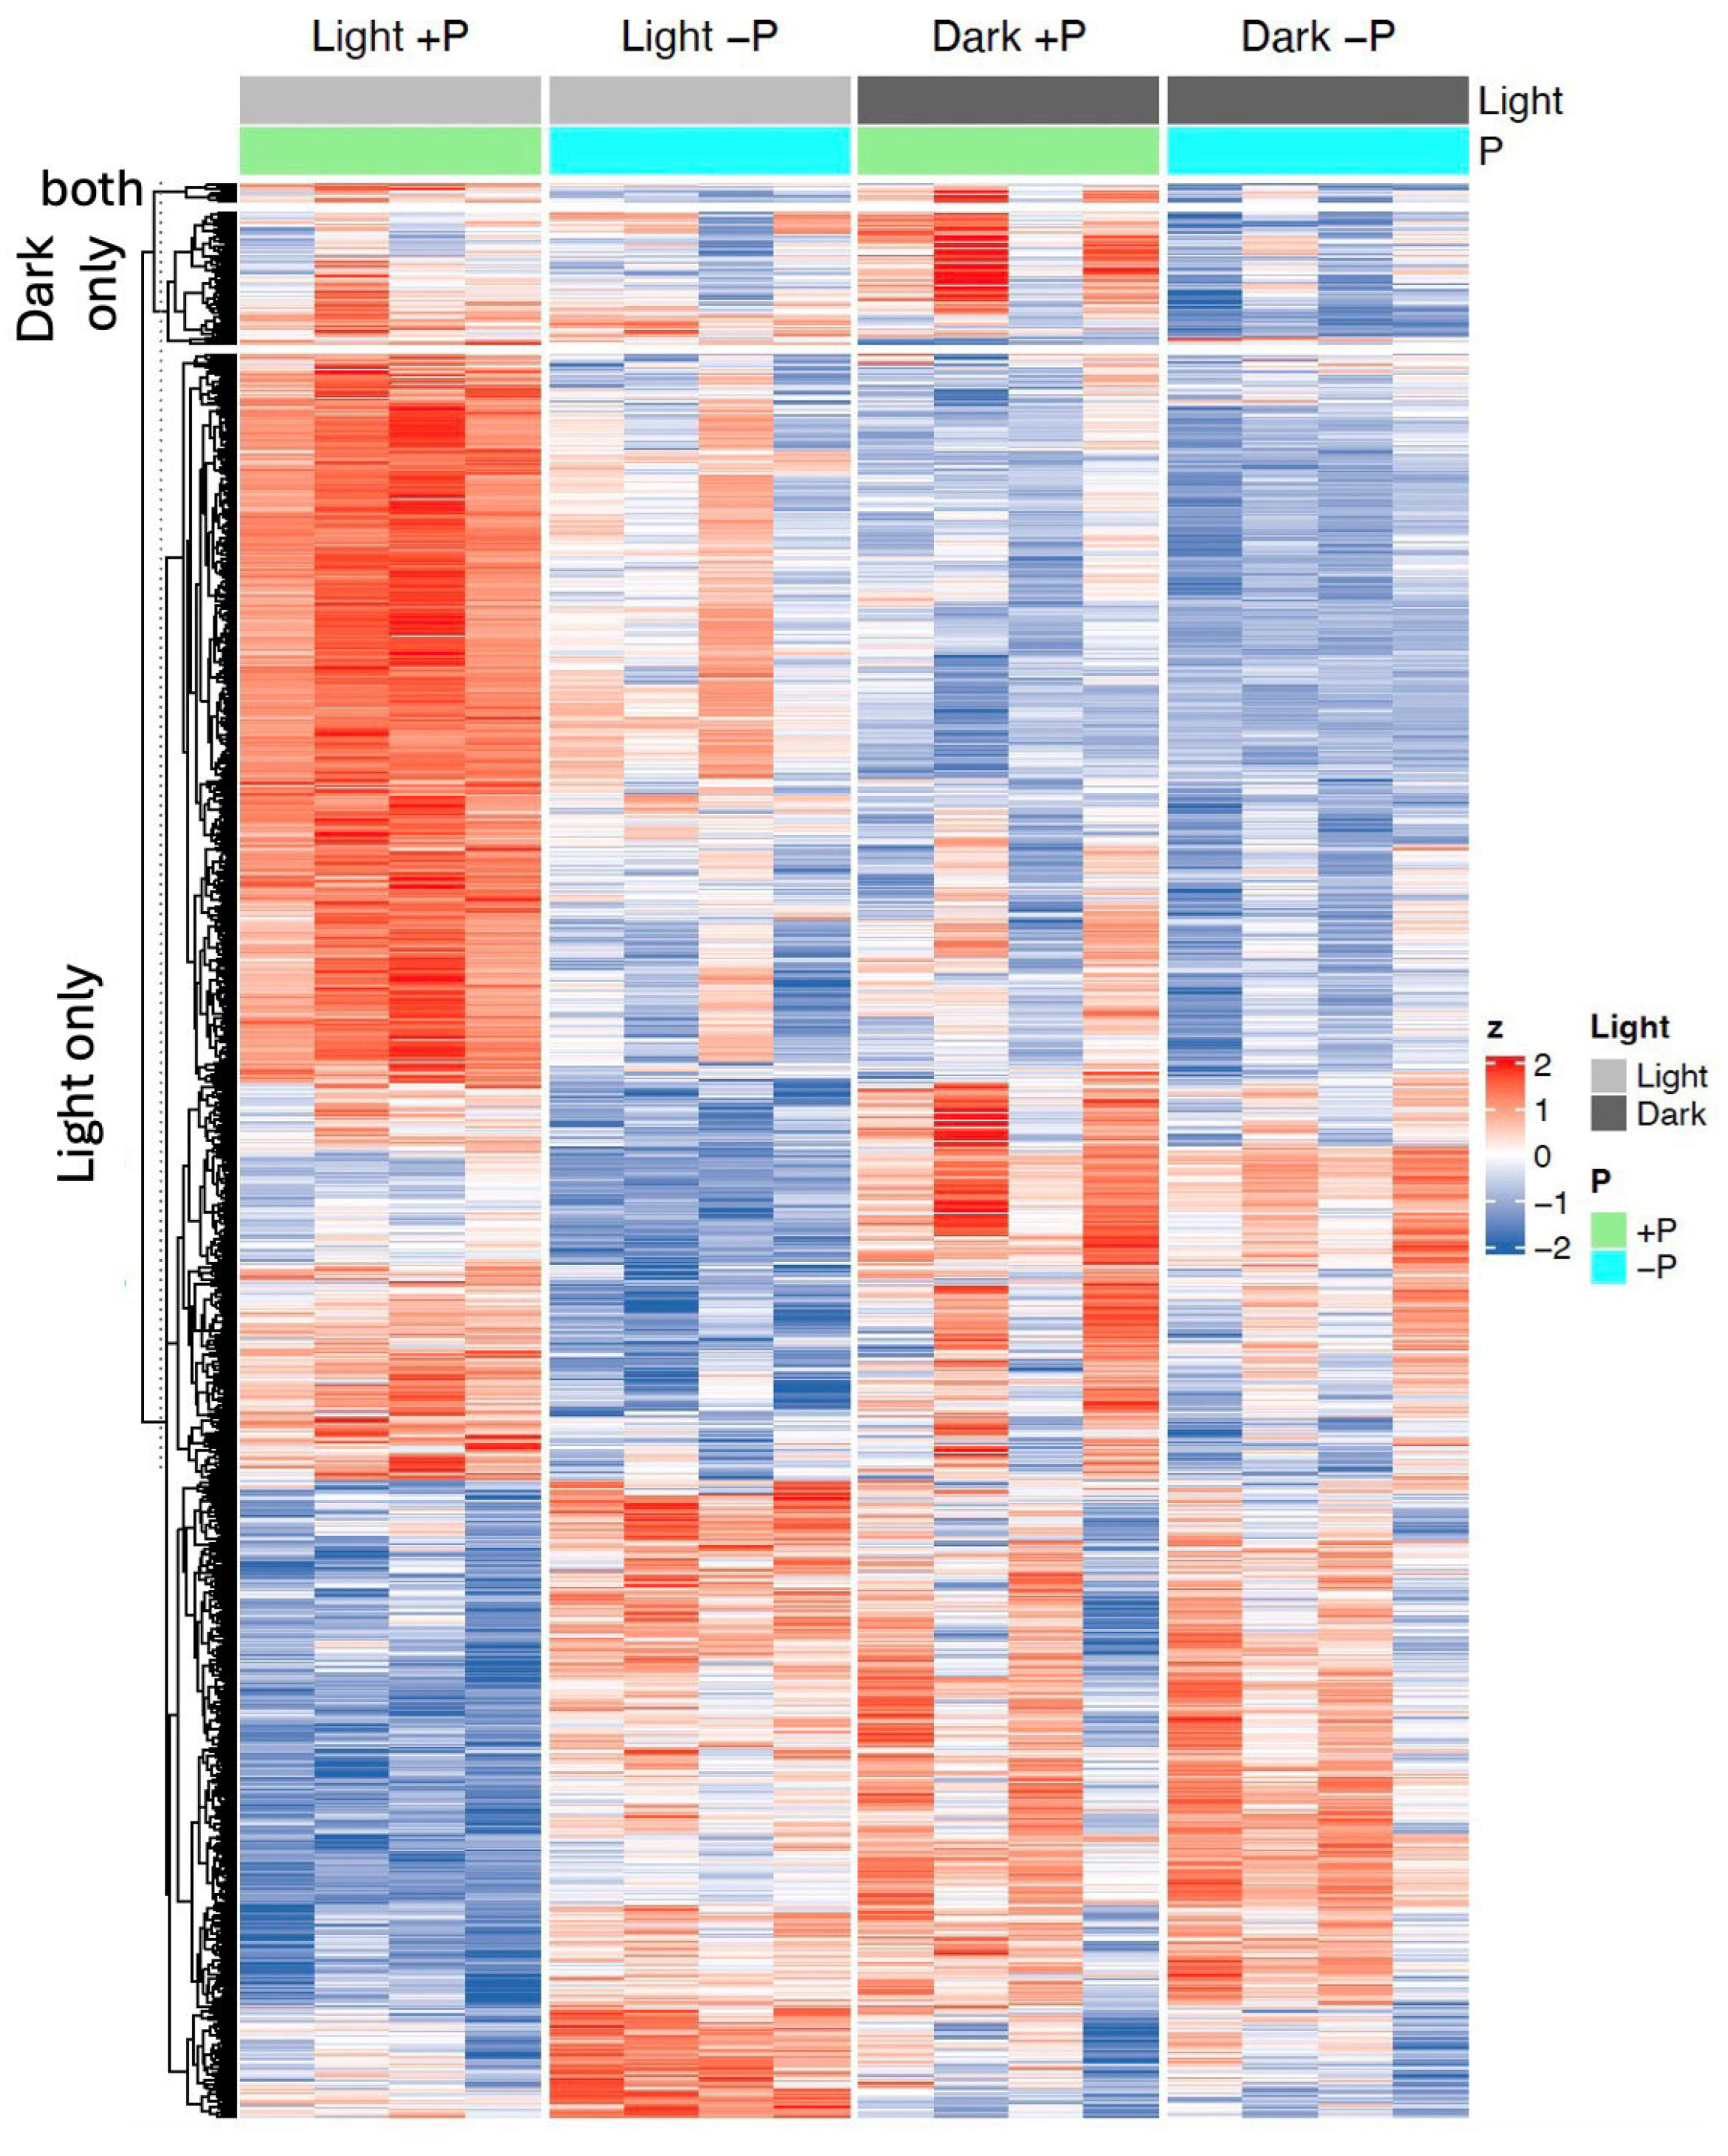
Figure 4.
Contrasting transcriptional responses to Pi deficiency under light and dark conditions. (a) Heatmap of the top upregulated genes identified in the −P/+P comparison under light conditions. Several well-characterized phosphate starvation response (PSR) genes are among the most strongly induced transcripts, including high-affinity Pi transporters and components associated with signaling and lipid remodeling. (b) Heatmap of the top differentially expressed genes identified in the −P/+P comparison under dark conditions. In contrast to light-grown plants, fewer genes exhibit strong induction or repression in darkness, consistent with the more limited −P-associated transcriptional responses observed under dark conditions. Rows represent individual genes and columns represent biological replicates. Expression values are shown as z-score–normalized counts (blue, lower relative expression; red, higher relative expression). Column annotations indicate phosphate status (+P or −P) and light or dark treatment.
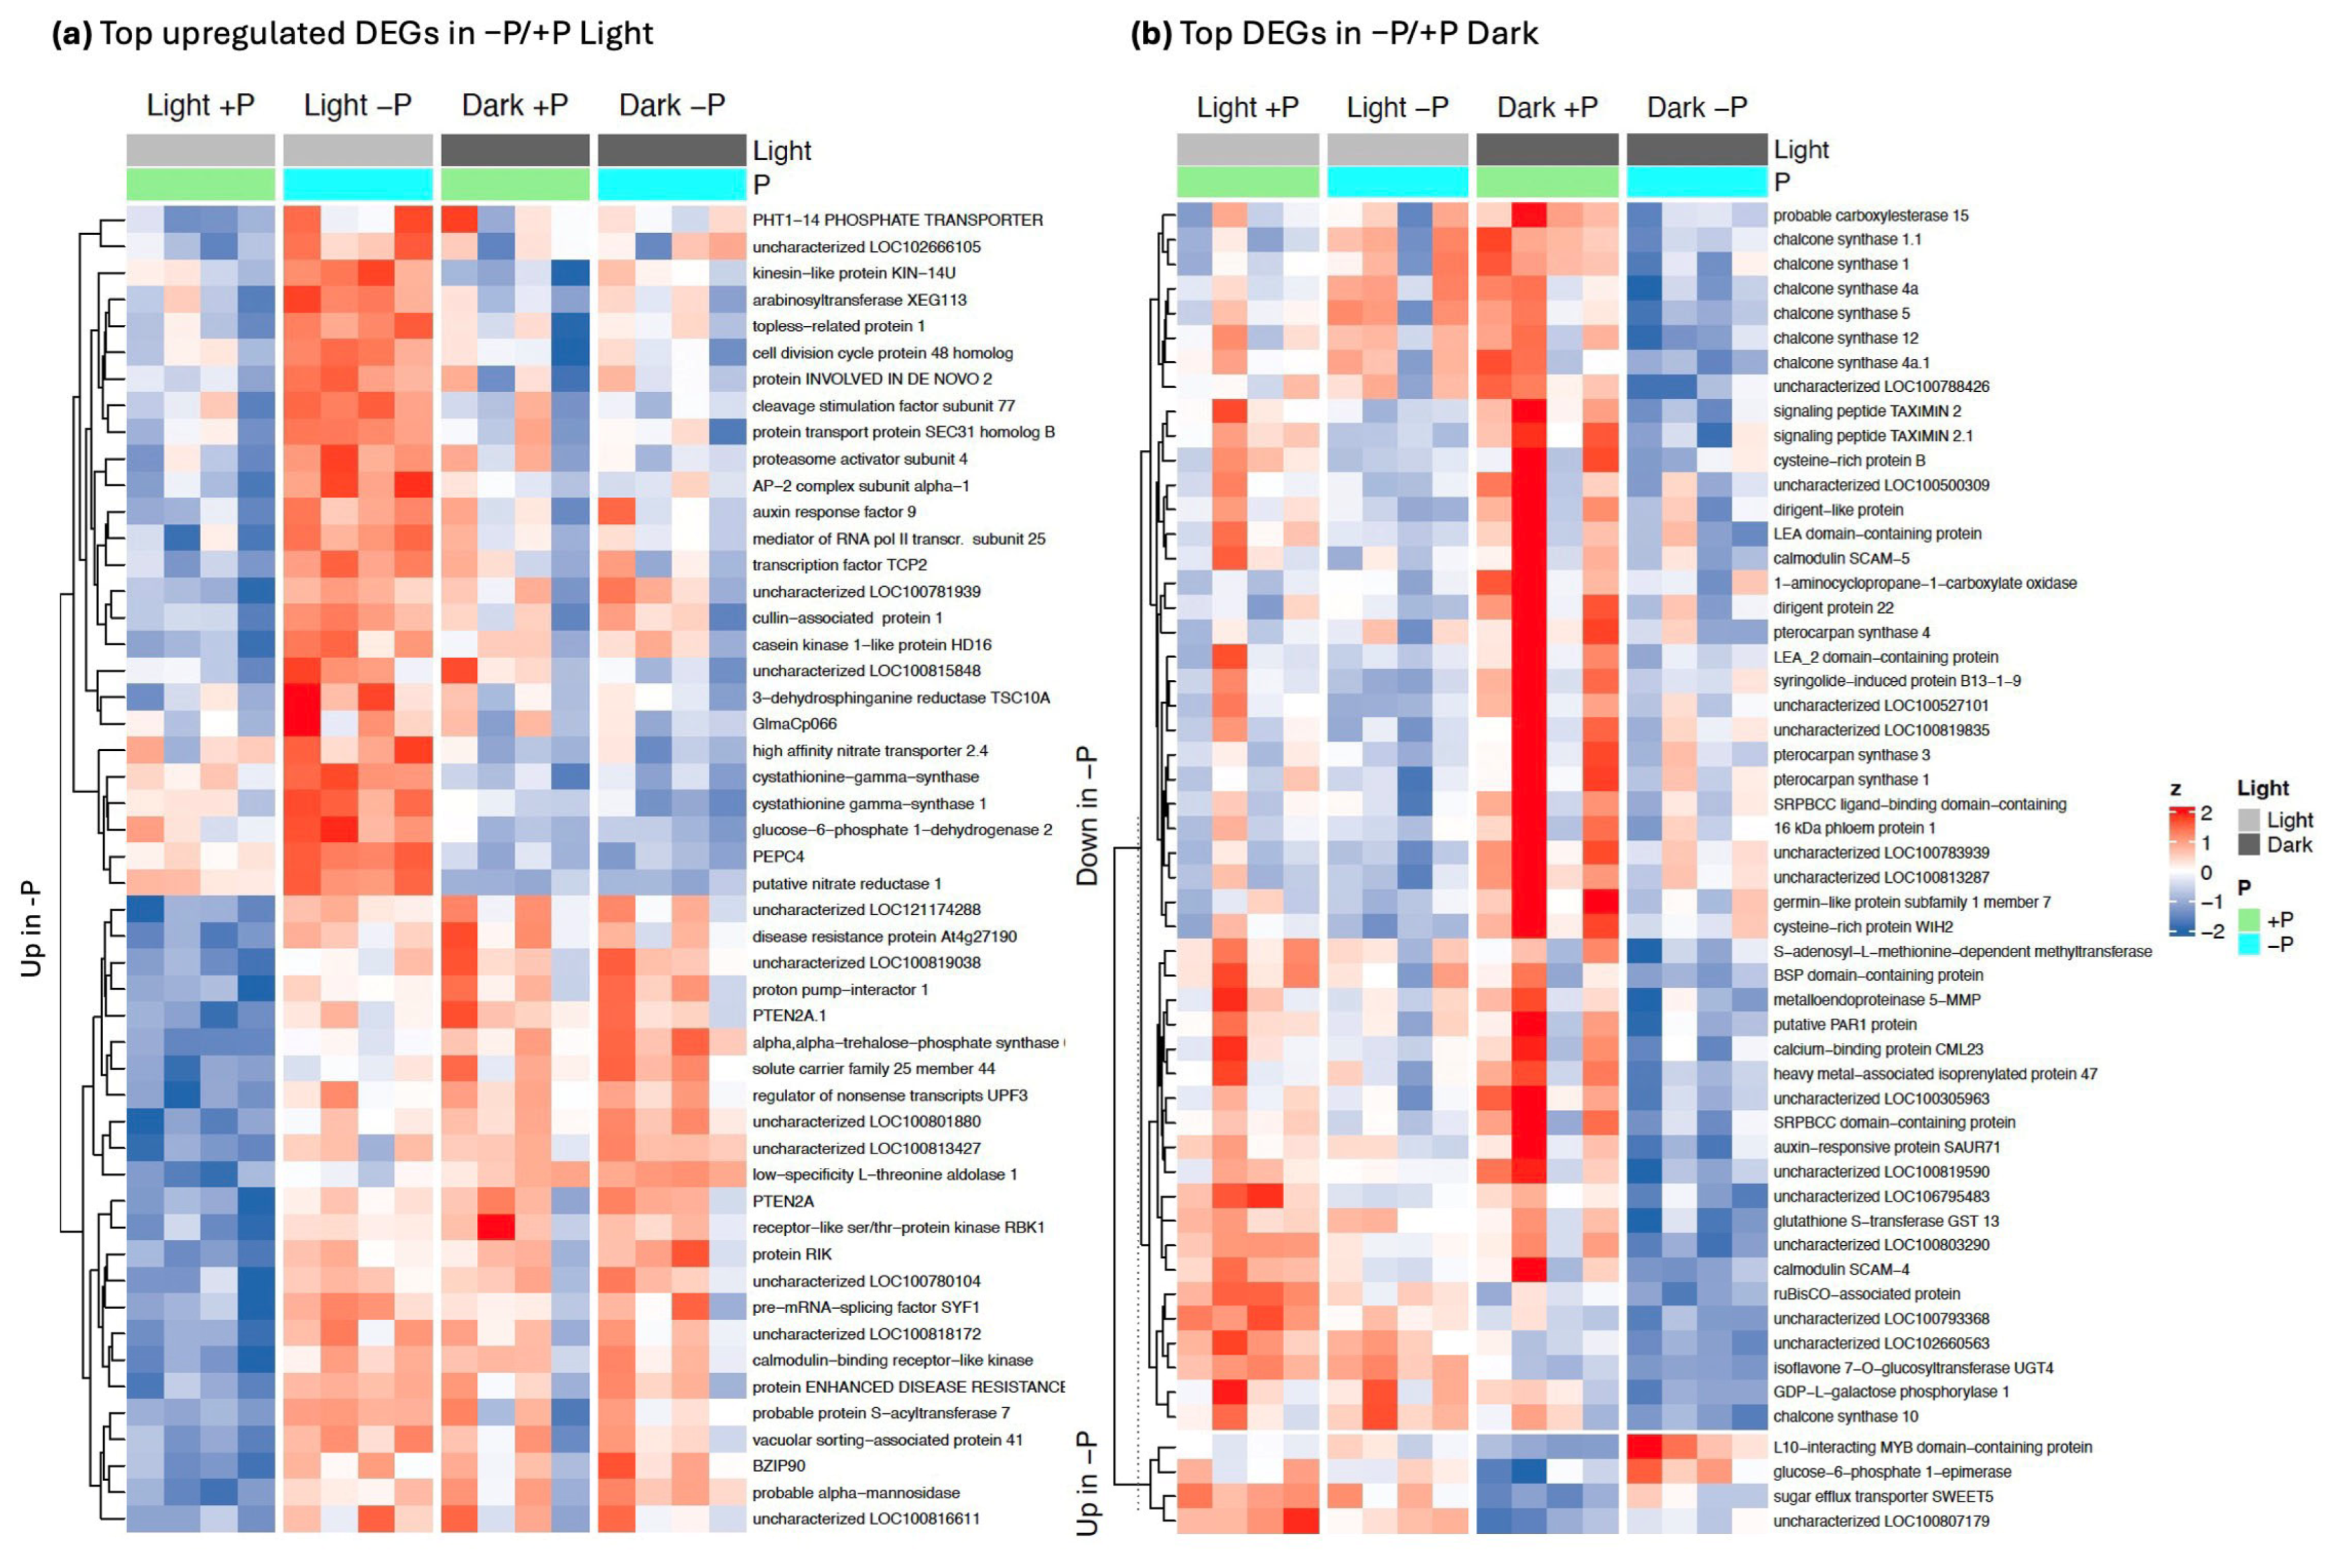
Figure 5.
KEGG enrichment and STRING network analysis of genes differentially expressed under phosphate deficiency (−P) in light and darkness. (a–d) KEGG pathway enrichment for genes differentially expressed between −P and +P roots under light and dark conditions. (a, b) Pathways enriched among genes upregulated under −P in light or darkness. (c, d) Pathways enriched among genes downregulated under the same contrasts. Under light, several signaling- and metabolism-related pathways were enriched among −P-responsive genes, although some categories contained relatively few genes. Under darkness, enrichment was highly limited, with glycolysis/gluconeogenesis as the only pathway passing padj (adjusted p-value) correction in the upregulated gene set (panel b). (e) STRING interaction network of genes upregulated under −P in light. Nodes are grouped into broad functional categories: Regulation (green), Signaling (blue), Carbon and Nitrogen Metabolism (brown), and Pi Metabolism (purple). STRING integrates predicted and experimentally supported interactions from multiple species; therefore, these clusters indicate general functional associations rather than confirmed physical interactions in soybean. All clusters shown correspond to significantly enriched interaction networks (p < 1 × 10⁻⁴ to p < 1 × 10⁻¹⁶).
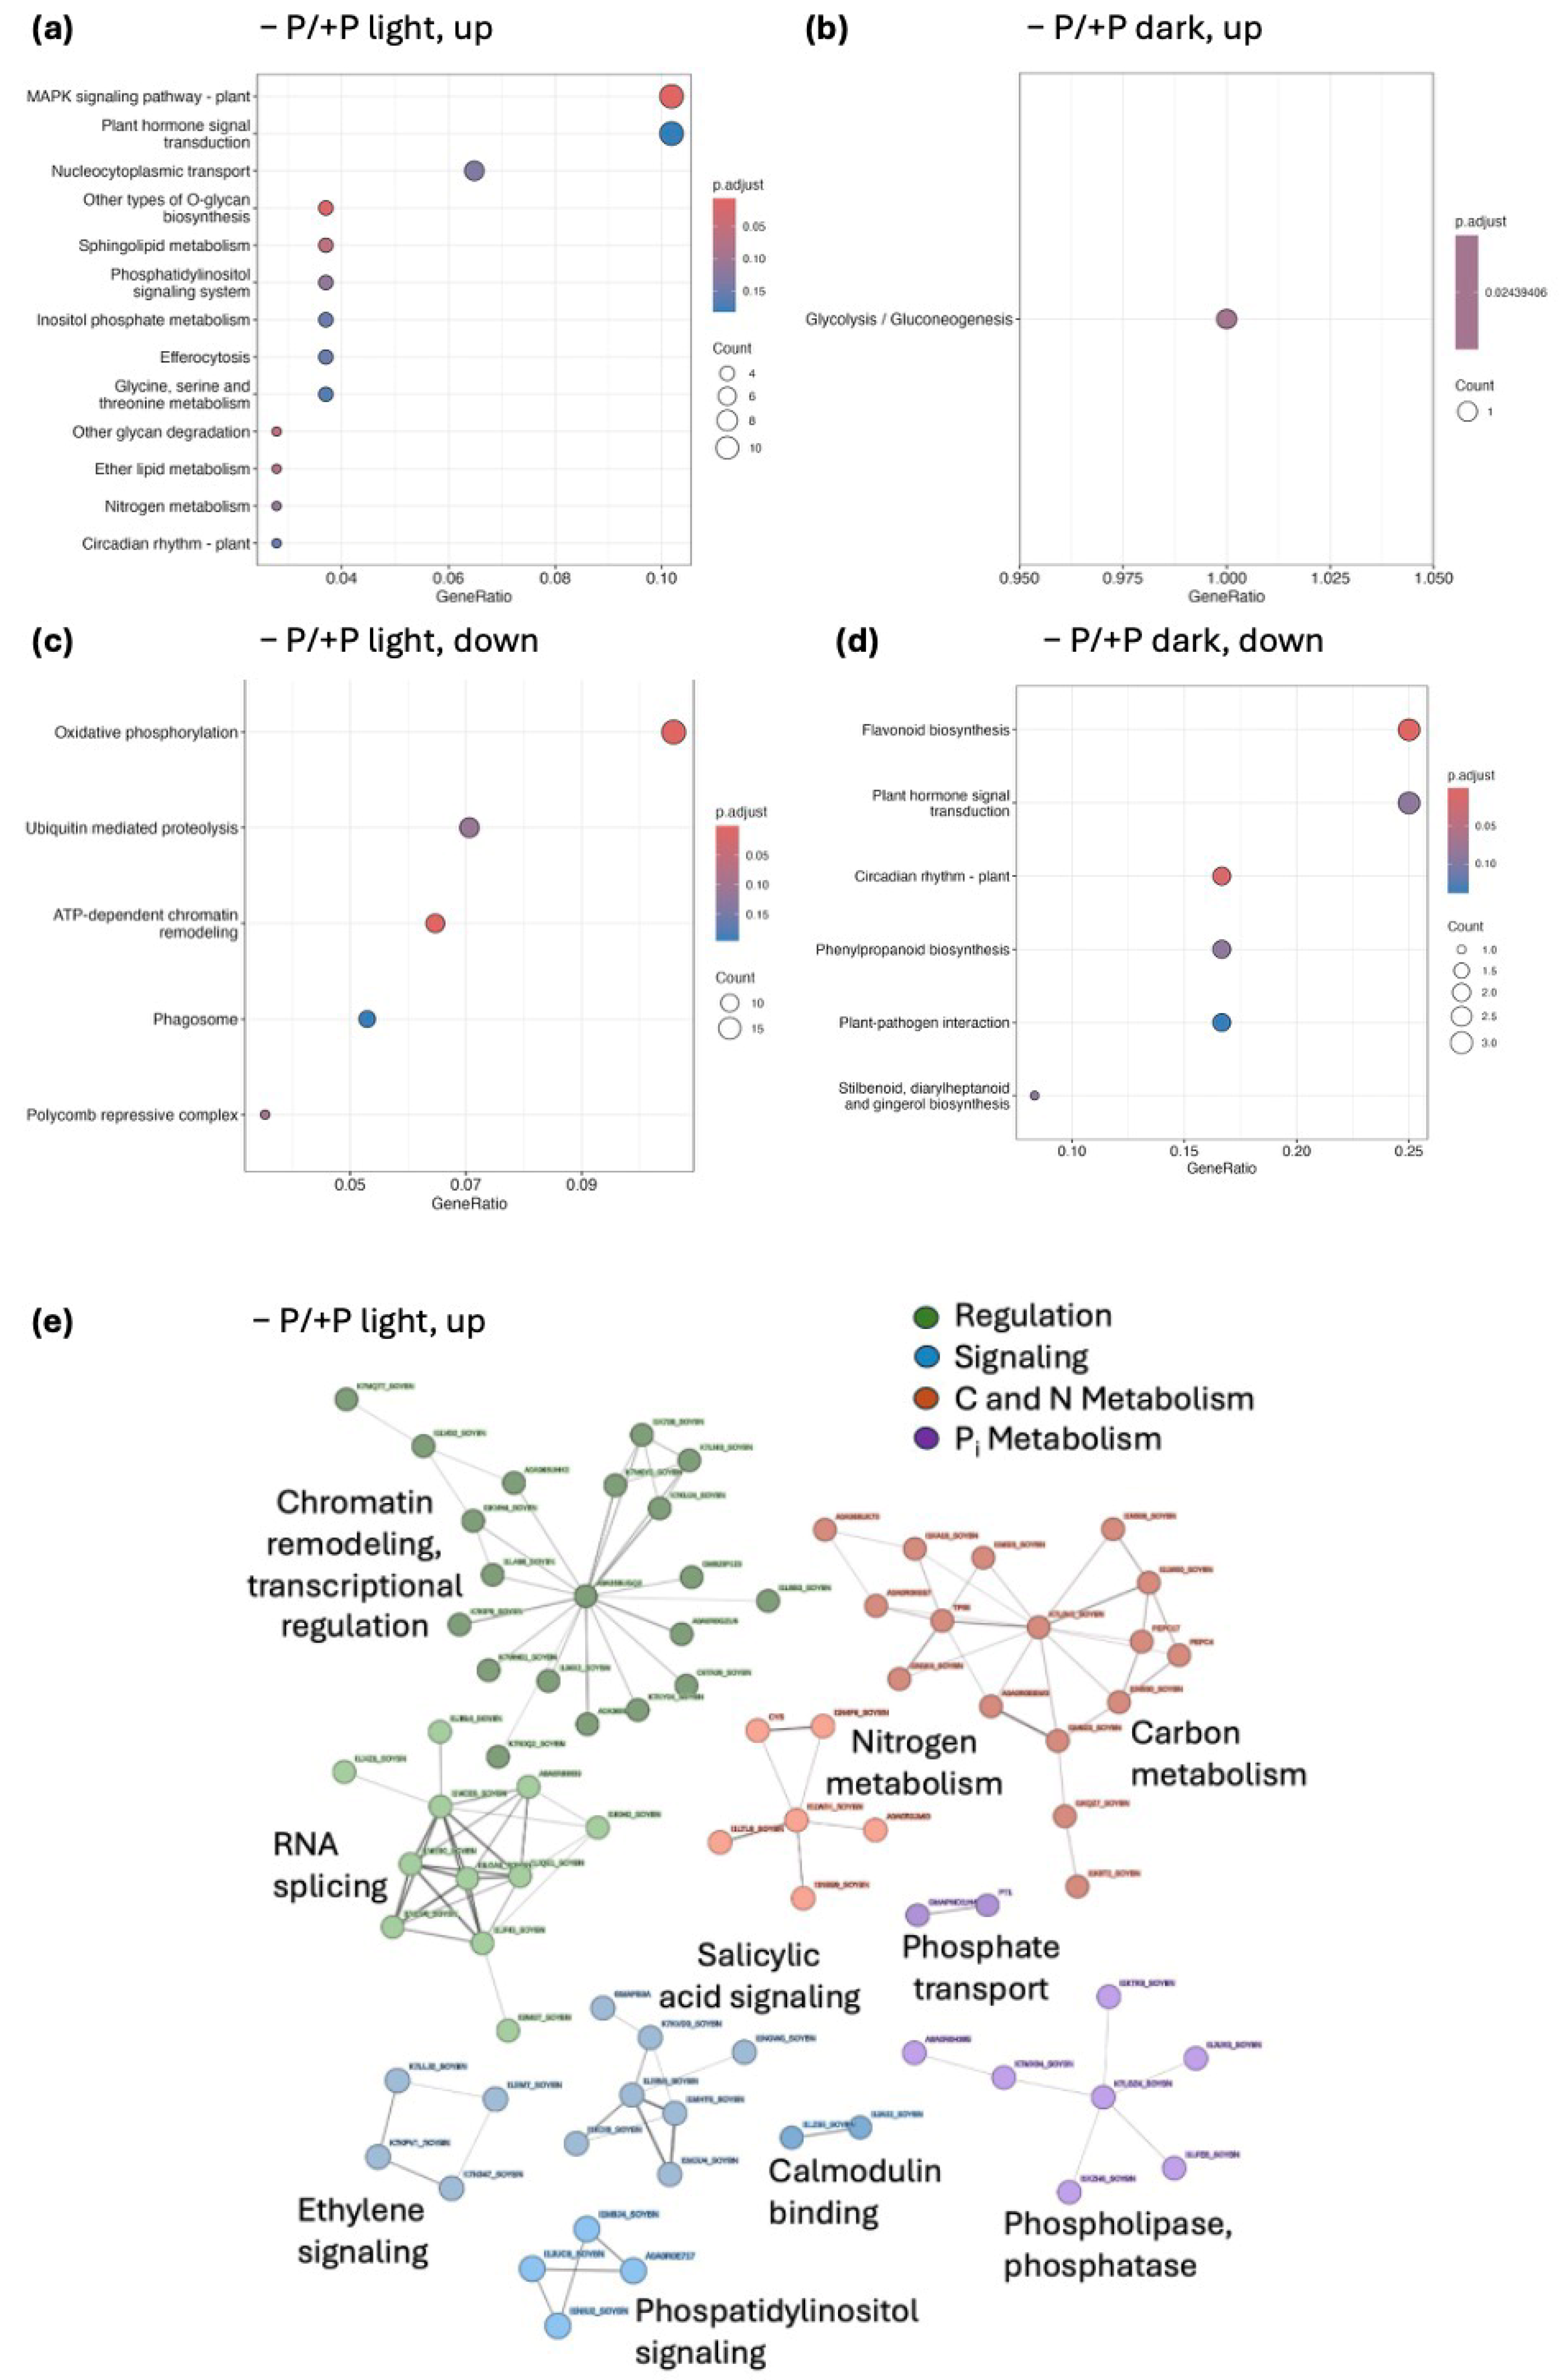
Figure 7.
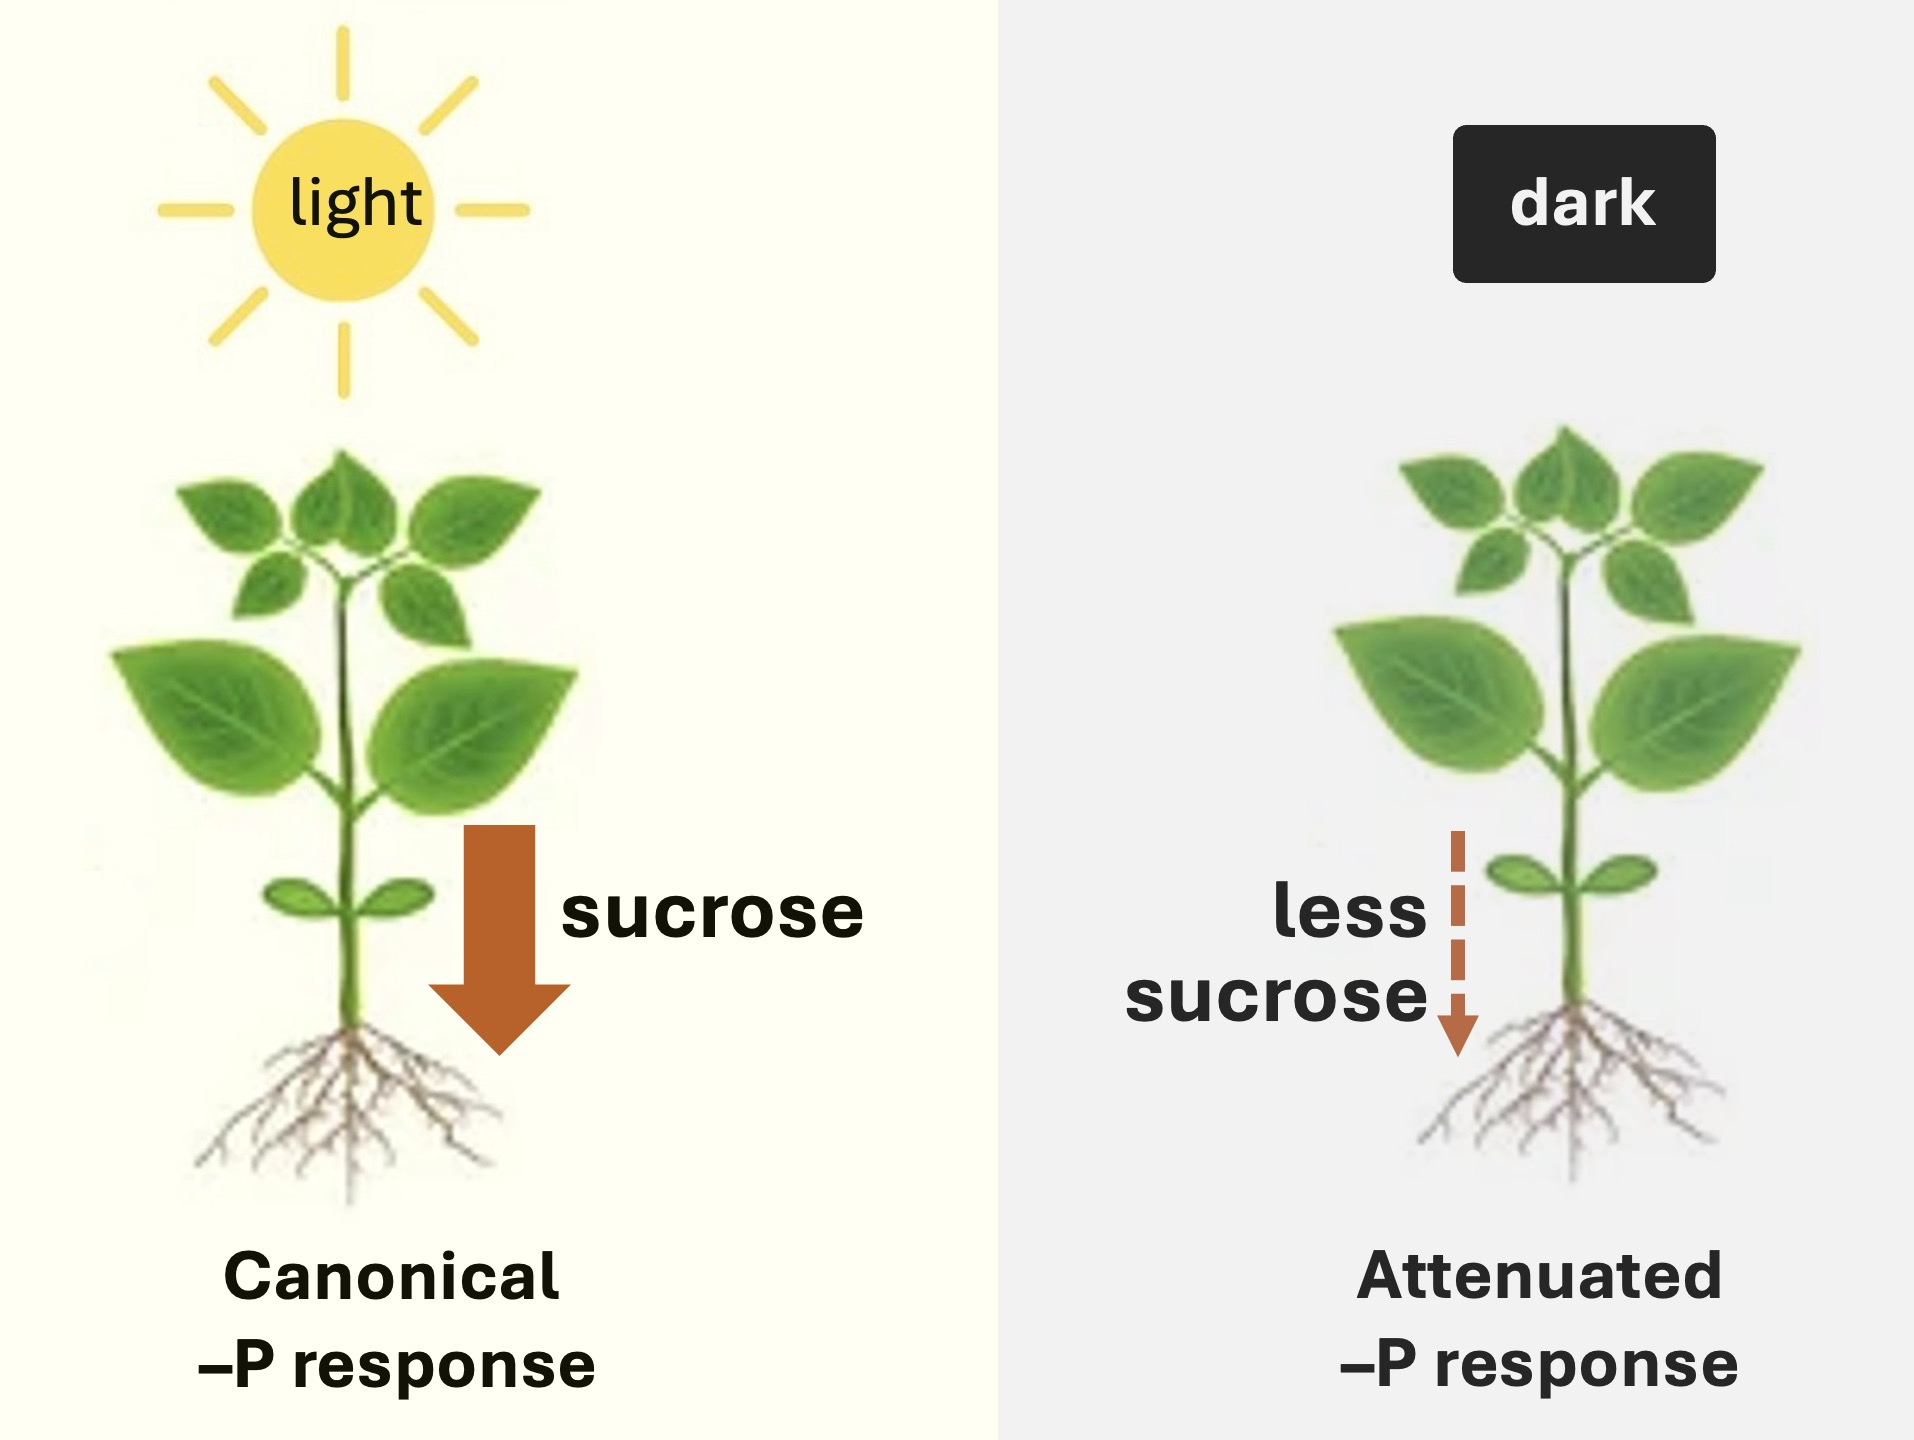
Light enables the canonical PSR, whereas darkness reveals an attenuated sucrose-independent response. Under light, sucrose transport from shoot to root supports activation of the canonical phosphate-starvation program, including strong induction of PHT1 and PHO1, lipid-remodeling enzymes, signaling components, and metabolic pathways. In total, 364 genes were upregulated under −P in light, spanning transcription factors, Pi transporters, lipid remodeling, signaling, and metabolism. In darkness, reduced sucrose flow limits transcriptional activation. Only four genes showed significant upregulation including an L10-interacting MYB transcription factor as well as a sugar transporter and sugar-metabolism genes. Targeted sucrose-feeding experiments under dark conditions will be an important next step to test whether restoration of sucrose supply is sufficient to re-activate the canonical phosphate starvation response in the absence of light.
Figure 7.
Light enables the canonical PSR, whereas darkness reveals an attenuated sucrose-independent response. Under light, sucrose transport from shoot to root supports activation of the canonical phosphate-starvation program, including strong induction of PHT1 and PHO1, lipid-remodeling enzymes, signaling components, and metabolic pathways. In total, 364 genes were upregulated under −P in light, spanning transcription factors, Pi transporters, lipid remodeling, signaling, and metabolism. In darkness, reduced sucrose flow limits transcriptional activation. Only four genes showed significant upregulation including an L10-interacting MYB transcription factor as well as a sugar transporter and sugar-metabolism genes. Targeted sucrose-feeding experiments under dark conditions will be an important next step to test whether restoration of sucrose supply is sufficient to re-activate the canonical phosphate starvation response in the absence of light.
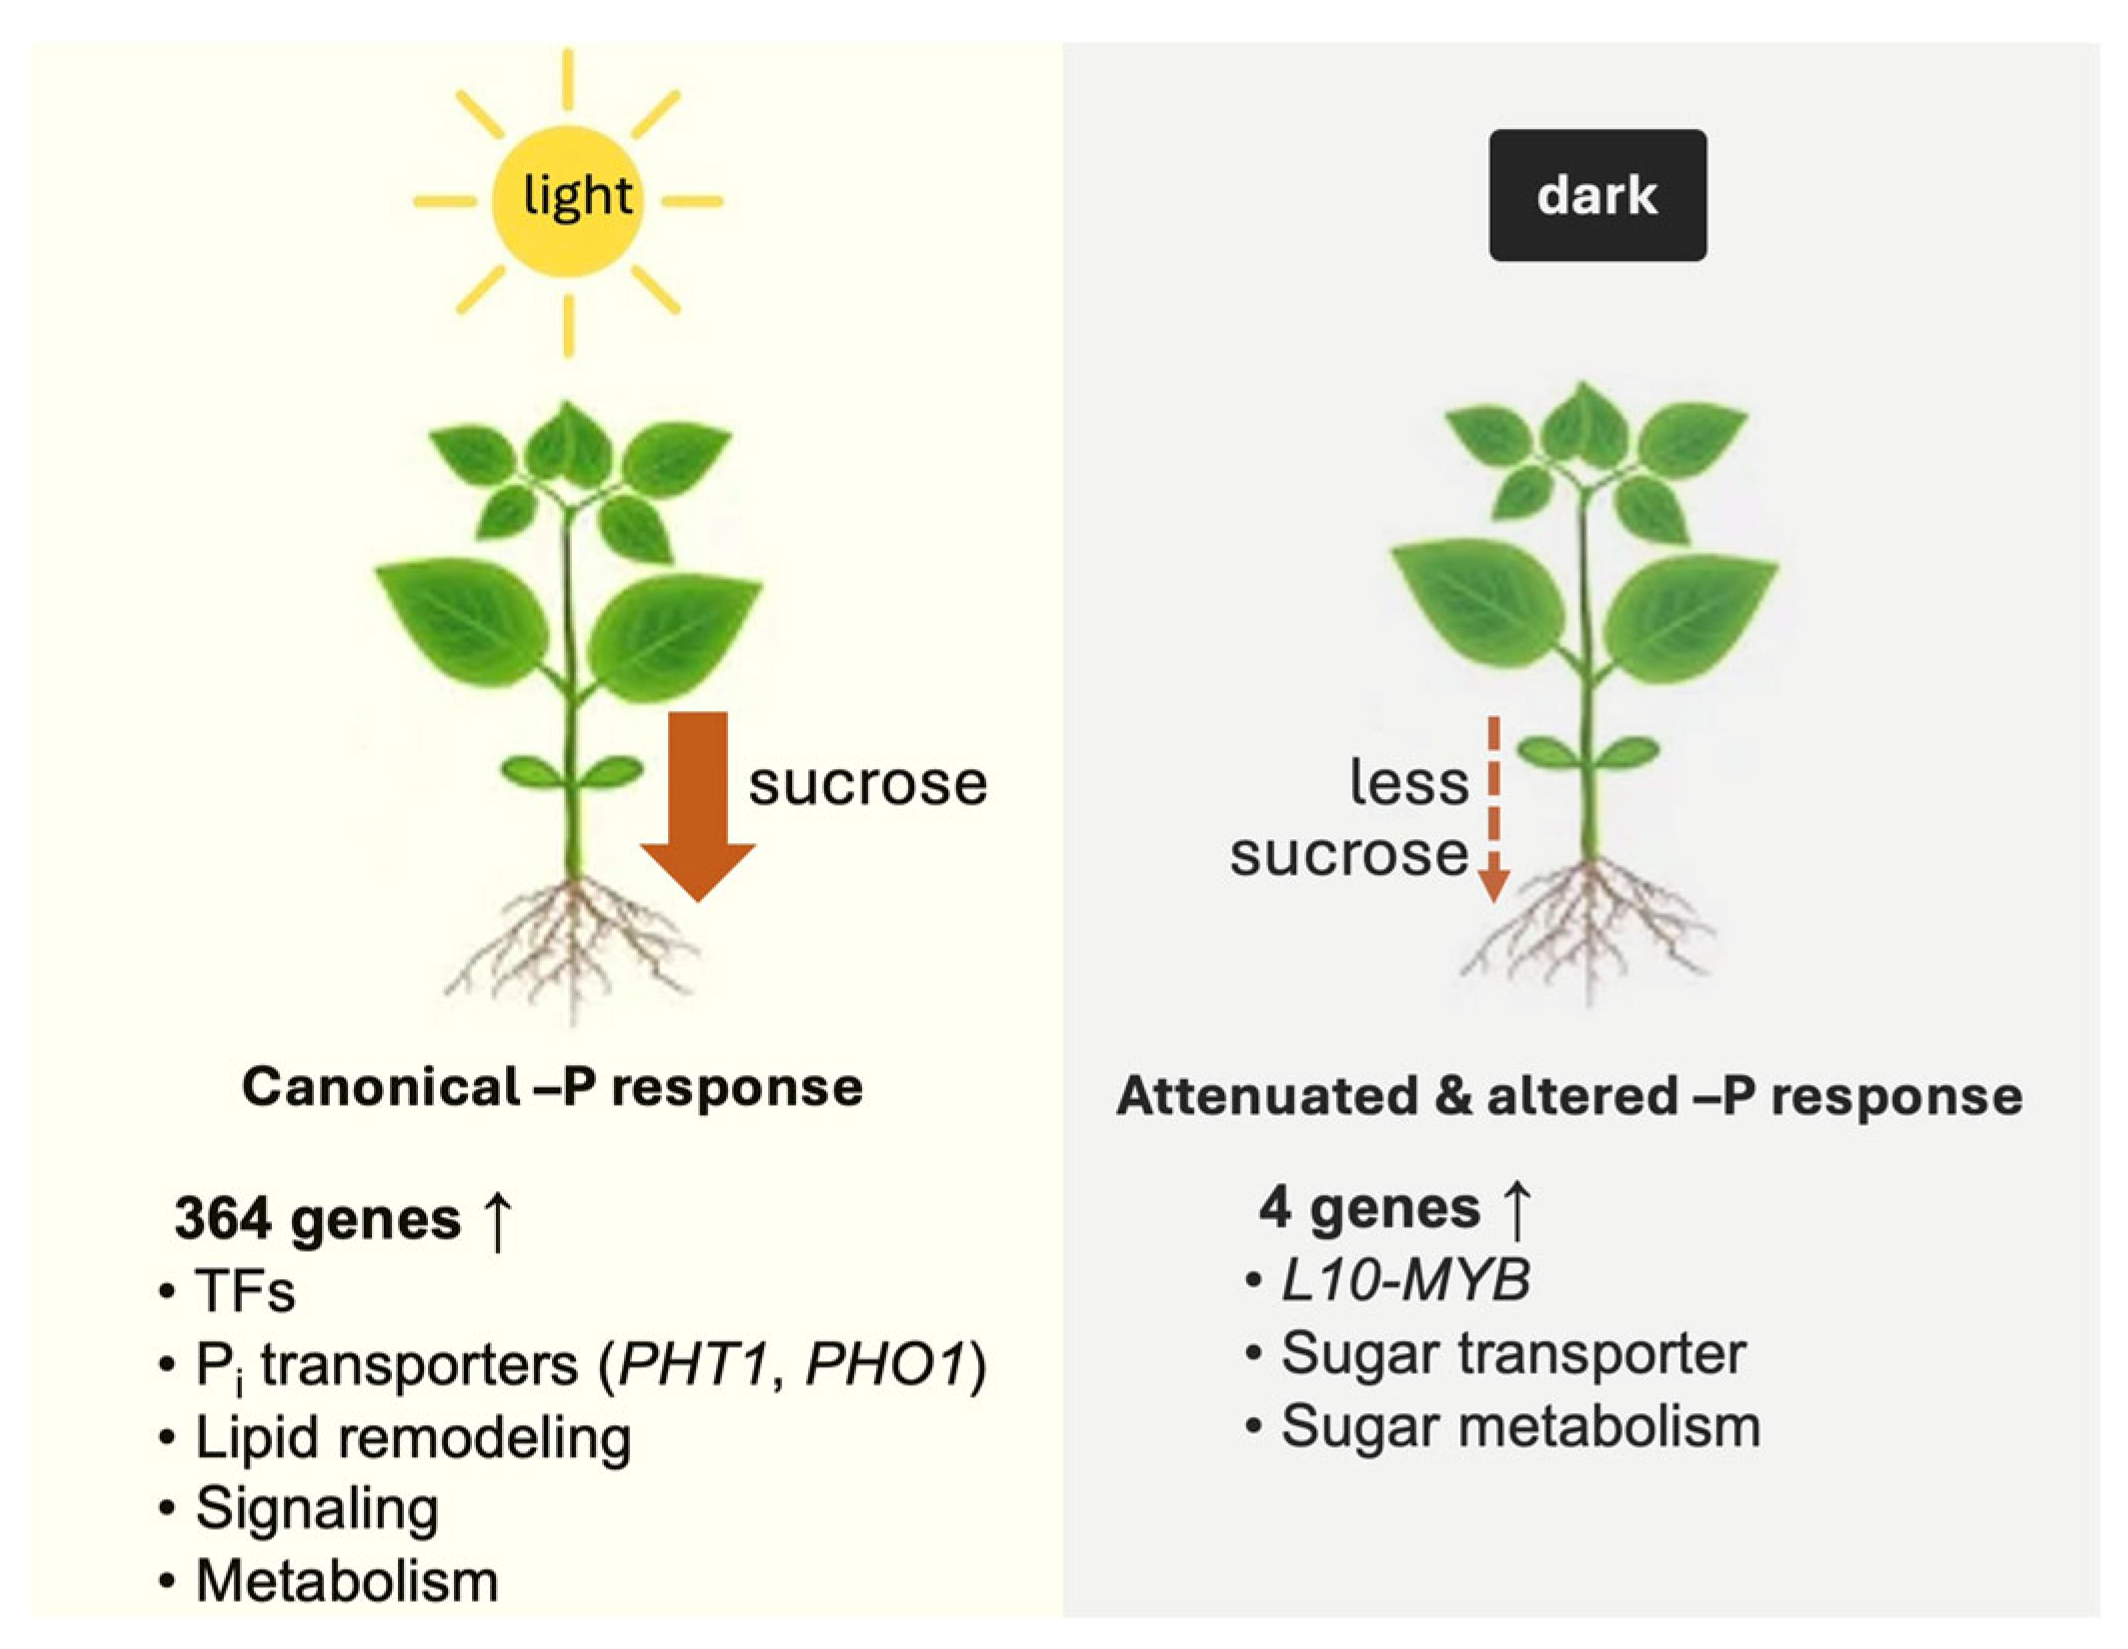

Table 1.
Summary of Oxford Nanopore cDNA sequencing and read-mapping metrics for soybean root transcriptomes across light and dark and phosphate treatments.
Table 1.
Summary of Oxford Nanopore cDNA sequencing and read-mapping metrics for soybean root transcriptomes across light and dark and phosphate treatments.
| Condition | Passed reads (×10⁶) | Avg. read Quality (Q) |
N50 (bp) |
Mapped reads (%) |
| +P Light (n = 4) | 6.9 ± 2.5 | 11 ± 0 | 1,034 ± 75 | 96.9 ± 0.5 |
| −P Light (n = 4) | 4.8 ± 1.9 | 10 ± 0 | 814 ± 96 | 93.4 ± 2.6 |
| +P Dark (n = 4) | 6.7 ± 2.2 | 10 ± 0 | 879 ± 113 | 95.6 ± 1.5 |
| −P Dark (n = 4) | 4.9 ± 1.1 | 11 ± 0 | 972 ± 103 | 96.8 ± 0.4 |
Table 2.
Normalized expression of canonical Pi-responsive genes under light and dark conditions. DESeq2-normalized counts (mean of four biological replicates) are shown for representative phosphate-starvation response (PSR) markers. Canonical PSR genes show strong induction under −P in the light but little or no induction under −P in the dark, despite moderate to high expression levels under all conditions.
|
Canonical PSR markers* |
Light (+P) | Light (-P) | Dark (+P) | Dark (-P) |
| PHO1 | 28.1 | 68.7 | 23.6 | 31.7 |
| PHT1 | 537.5 | 1111.0 | 943.6 | 806.5 |
| PTEN2α-1 | 38.6 | 84.0 | 111.8 | 97.5 |
| PTEN2α-2 | 76.9 | 155.0 | 172.2 | 184.9 |
| SAP | 8.9 | 24.3 | 53.9 | 71.4 |
*PHO1, phosphate transporter 1; PHT1, high-affinity phosphate transporter; PTEN2α-1 and PTEN2α-2, paralog phosphatidylinositol triphosphate phosphatases; SAP, secreted acid phosphatase.
Table 3.
Upregulated genes in the −P/+P comparison under darkness. Four genes passed standard significance criteria (log₂FC > 1, adjusted p < 0.05). Relaxed thresholds (log₂FC > 1, adjusted p < 0.1) identified nine additional candidate genes.
Table 3.
Upregulated genes in the −P/+P comparison under darkness. Four genes passed standard significance criteria (log₂FC > 1, adjusted p < 0.05). Relaxed thresholds (log₂FC > 1, adjusted p < 0.1) identified nine additional candidate genes.
| Gene_ID | Description |
−P/+P dark log2FC |
−P/+P dark padj |
−P/+P light log2FC |
−P/+P light padj |
| SWEET5 | sugar efflux transporter SWEET5 | 4.1 | 0.045 | -0.9 | 0.215 |
| LOC100787217 | glucose-6-phosphate 1-epimerase | 2.5 | 0.013 | -0.4 | 0.612 |
| LOC100820117 | L10-interacting MYB domain-containing protein | 2.5 | 0.019 | 0.1 | NA |
| LOC100807179 | uncharacterized LOC100807179 | 1.2 | 0.029 | -0.7 | 0.072 |
| LOC100818214 | WEB family protein | 2.7 | 0.061 | 0.6 | NA |
| LOC100776105 | arabinogalactan protein 9 |
2.0 | 0.091 | -0.7 | 0.351 |
| PHR11 | PSR 11 | 1.8 | 0.061 | -0.2 | 0.738 |
| LOC100775446 | aspartyl protease AED3 | 1.7 | 0.055 | -0.1 | 0.878 |
| LOC113000488 | L10-interacting MYB domain-containing protein | 1.5 | 0.077 | 0.6 | NA |
| LOC100808302 | cyclin-dependent kinase B2-2 |
1.5 | 0.078 | -0.6 | 0.352 |
| LOC100785581 | kinesin-like protein KIN-14U | 1.5 | 0.089 | 1.7 | 0.006 |
| LOC100804267 | uncharacterized | 1.5 | 0.091 | 0.2 | 0.766 |
| LOC100802287 | glucan endo-1,3-beta-glucosidase 7 | 1.3 | 0.077 | -0.3 | 0.588 |
Disclaimer/Publisher’s Note: The statements, opinions and data contained in all publications are solely those of the individual author(s) and contributor(s) and not of MDPI and/or the editor(s). MDPI and/or the editor(s) disclaim responsibility for any injury to people or property resulting from any ideas, methods, instructions or products referred to in the content. |
© 2025 by the authors. Licensee MDPI, Basel, Switzerland. This article is an open access article distributed under the terms and conditions of the Creative Commons Attribution (CC BY) license (http://creativecommons.org/licenses/by/4.0/).
Copyright: This open access article is published under a Creative Commons CC BY 4.0 license, which permit the free download, distribution, and reuse, provided that the author and preprint are cited in any reuse.


