
Submitted:
23 December 2025
Posted:
24 December 2025
You are already at the latest version
Abstract
Simulations of intermediate-mass black holes (IMBHs) in dwarf galaxies within 10 Mpc that host bright nuclear star clusters (NSCs), prime candidates for IMBH formation, using the High Angular Resolution Monolithic Optical and Near-infrared Integral (HARMONI) field spectrograph on the Extremely Large Telescope probes black hole formation in the early Universe. Our approach combines observed surface brightness profiles from the Hubble Space Telescope (HST), synthetic stellar population spectra, and Jeans Anisotropic Modeling (JAM) for stellar dynamics. Mock HARMONI observations were generated with the HSIM simulator and analyzed in a Bayesian framework to infer IMBH masses down to 0.5% of the NSC mass. In this work, we extend these simulations by constructing improved stellar-mass models using SimCADO to simulate imaging with the Multi-AO Imaging Camera for Deep Observations (MICADO). The MICADO data are jointly analyzed with HARMONI kinematics via JAM to reassess IMBH masses and uncertainties. This combined framework enables us to examine how variations in the NSC inner surface-brightness slope influence IMBH mass estimates, providing tighter constraints on low mass black holes and advancing models for IMBH detection in NSCs.
Keywords:
astrophysical black holes
; galaxy kinematics
; galaxy dynamics
; galaxy spectroscopy
; astronomy data modeling
; galaxy nuclei
1. Introduction
There is a fascinating, but elusive, population of intermediate-mass black holes (IMBHs, ) in low-mass galaxies [ ;][1,2,3,4,5,6], falling between the masses formed by single-massive stars today ( ) and the supermassive black holes [SMBHs, ;][7,8,9,10,11], which are often found at the centers of massive galaxies [ ;][12,13]. The compelling evidence of IMBHs was the LIGO/Virgo discovery of an IMBH formed from a collision of two smaller black holes [BHs, ;][14]. However, current ground-based gravitational wave interferometers are limited to detecting BHs with . For , the search must be done with integral field spectroscopic (IFS) observations in nearby stellar systems [][hereafter N25][15] for stellar dynamics with the 39-meter European Extremely Large Telescope (ELT) and its High Angular Resolution Monolithic Optical and Near-infrared Integral (HARMONI) field spectrograph instrument [16].
It is also not yet clear if there’s a full spectrum of IMBH masses [17]. Nonetheless, understanding the abundance/small or rarity/massive of IMBHs contributes significantly to our cosmic inventory [18], providing fundamental insights into the structure of our universe. Previous studies have profound implications for understanding how SMBHs formed in terms of IMBH seeds in the early universe through several competitive channels like the dead remnants of the first-star generation [19], the gravitational runaway of densest stellar clusters [20], or the direct collapse of pristine gas within the massive halos [21,22]. They shed light on the connections with nuclear star clusters [NSCs;][23], the behavior of BH–galaxy scaling relations at the low-mass regime [24,25], the origins of ultracompact dwarf galaxies as former galaxy nuclei [26,27], and the detection rate predictions of gravitational wave of the Laser Interferometer Space Antenna [LISA;][28], which can detect longer-wavelength radiation than ground-based ones [29].
Another hypothesis for the massive BH seeds was the absence of direct observations of IMBHs with masses between those of stellar-mass BHs and SMBHs [30,31], leading to the speculation that IMBHs might not exist. However, this rarity is now considered a potential sample selection bias [23,24]. The sphere of gravitational influence (SOI, , where G is the gravitational constant and is the central velocity dispersion of stars) around such IMBHs is typically too small to spatially resolve in most galaxies due to their further distance and small mass. For example, a IMBH with and within Mpc has , which is smaller than the diffraction limits of current state-of-the-art 8-10 meter class telescopes equipped with adaptive optics (AO) techniques, such as the Very Large Telescope (VLT) and Gemini (with a full width at half maximum (FWHM) of the point spread function (PSF), –), or Keck (≈).
However, there is now a growing number of IMBH candidates at the centers of dwarf galaxies, based on indirect estimates of their masses [32,33,34,35]. Chilingarian et al. [36] found 305 distant IMBH candidates with M⊙, ten of which were confirmed as active galactic nuclei (AGN) via coincident X-ray emission. Furthermore, a few IMBHs were directly detected in nearby dwarfs with bright NSCs [2,37,38,39,40,41,42,43,44,45] or in globular clusters [GCs;][46,47,48,49,50,51], although these detections are often at the limit of what 8-10 meter telescopes can achieve.
These observations are necessary the exploration of the relationships between and various galaxy properties, including the stellar mass [52], the luminosity [53], and the statistically velocity dispersion [54] of the central spherical bulge of stars. These properties, once measured in other galaxies, can serve as indicators of . Therefore, firm detections and measurements of these currently elusive IMBHs in the local universe are crucial for robustly constraining the BH–galaxy scaling correlations across the mass scale. These strongly suggest a close connection between the growth of SMBHs and the formation and evolution of their host galaxies [55].
Given such importance of IMBHs and the current active races in searching for their existence like The Measuring Black Holes in Below Milky Way mass galaxies Project [The MBHBM★;][44,56,57,58], N25 started a large survey for future searching for such IMBHs within NSCs within 10 Mpc by ultilising the unprecedented spatial and spectral resolutions and sensitivity of HARMONI. Later extended the sample to further distances up to the location of Virgo Cluster [ Mpc;][59] and Fornax Cluster [ Mpc;][60]. These works used the observed surface brightness (SB) from Hubble Space Telescope (HST) images, an assumed synthetic spectrum of their stellar population, Jeans Anisotropic Model [JAM1; 61,62] of the stellar dynamics, and the HARMONI simulator [HSIM2; 63] to create mock HARMONI observations. They analyzed the mock data cubes like real data, using JAM to infer the IMBH mass and its error in a Bayesian framework. While N25 simulations showed that the HARMONI instrument can clearly detect the existence of IMBH demographics in NSCs down to a mass range of within 10 Mpc, such similar findings at the distances of 20 Mpc required the IMBH mass must increase up to ≈ [60].
Nevertheless, when modeling the mock HARMONI observations, N25 utilized HST/Wide Field and Planetary Camera 2 (WFPC2) Planetary Camera (PC) imaging, which has a spatial resolution of , a factor of five coarser than their HARMONI IMBH survey spatial scale (10 milli-arcseconds, or mas). They used this data to model the galaxy stellar mass in JAM to predict the stellar movements under the influence of both the IMBH and the entire galaxy’s gravitational potentials. To achieve the required spatial scale for the stellar-mass model, they interpolated the one-dimensional (1D) SB to a scale of 11 times smaller, assuming the NSC component is well described by a core-Sérsic function with an inner power-law slope of . This assumption is weak because the current facilities cannot resolve the vicinity of IMBHs, so the actual light distribution of NSCs at this small scale is unknown but could be probed with the ELT. Thus, the assumption of may not be universal and could vary widely, thus biasing the IMBH mass determinations.
In this work, we improve the stellar-mass model for galaxies using SimCADO3 to simulate mock observations from the Multi-AO Imaging Camera for Deep Observations (MICADO) imager [64,65]. We will then use these new two-dimensional (2D) high-spatial-resolution images, combined with the mock HARMONI kinematics from N25, to re-estimate the mass of IMBHs at the centers of nearby NSCs. This approach not only re-examines the feasibility of discovering IMBH populations (N25) for the upcoming large HARMONI IFS and MICADO imaging surveys, but also validates accurate IMBH measurements by exploring the effect of variations in the inner part of SB of NSCs.
We outline the use of SimCADO and describe how we employed it to model the I-band images expected to be observed with the MICADO imager for NGC 300 and NGC 3115 dw01, varying the inner-power-law slope () of the core-Sérsic function used to represent the SB of these NSCs in Section 2 . Following this, we detail the mock kinematics measurements of these nuclei obtained from mock HARMONI IFS using HSIM from N25. We then explain the JAM, which we used to explore the effect of varying the inner SB of these NSCs on the IMBH mass measurements in Section 3 . Finally, we discuss and summarize our findings in Section 4 .
2. New Stellar Mass Model
2.1. MICADO Imager
MICADO is the first-generation ELT imager, designed to produce diffraction-limited imaging and long-slit spectroscopy at near-infrared (NIR) wavelengths. It operates with both a multi-conjugate laser guide star adaptive optics (MCAO) and a single-conjugate natural guide star adaptive optics (SCAO). MICADO can achieve a sensitivity comparable to that of the James Webb Space Telescope (JWST) and offers a resolution improved by a factor of six. The instrument can produce images covering a field-of-view (FoV) of at 0.82–2.45 in wide-field mode, using an array of nine -pixel detectors with a plate scale of . In zoom mode, with a FoV of , MICADO provides a plate scale of in high-contrast imaging mode. The instrument can perform astrometry with precision for brighter sources and enables coronagraphy using focal and pupil plane coronagraphs. Additionally, its observation modes include a long-slit spectrograph with a spectral resolution of , covering two spectral ranges of 0.82–1.55 and 1.49–2.45 .
MICADO can address a broad range of modern astrophysics. Its science drivers focus on themes such as galaxy evolution through observations of high-redshift galaxies and relic populations in local galaxies, the formation and evolution of galaxies in the early universe, and the dynamics of dense stellar systems. Additionally, it aims to explore the full mass spectrum of BHs in extragalactic galaxies and at the center of the Milky Way, including SMBHs in galaxy nuclei and IMBHs in dense stellar clusters (e.g., NSCs and GCs). Other key areas include studying the star formation history of galaxies through resolved stellar populations, characterizing exoplanets, observing planet formation and circumnuclear disks at small angular scales, and investigating various aspects of the Solar System.
2.2. SimCADO Package
SimCADO is a data simulation package [66] designed to generate realistic mock detector plane array read-out files for MICADO. This Python 3 routine models the incoming light’s optical path, representing elements in the optical train by taking into account the effects of the atmosphere, telescope, instrument, and detector [67]. It can simulate the MICADO imaging with 4 mas and 1.5 mas per pixel in the wavelength range of 0.7–2.5 and provide the users with raw data sets that will be similar to what MICADO will produce during a typical observing run.
SimCADO is also highly configurable in simulating various observational scenarios equipped with SCAO and MCAO and integrated with subsystem effects along the optical train (the performance of the derotator or atmospheric dispersion corrector). While the former effects are referred to spectral (1D of wavelength ) and spatial (2D of () spatial position). The latter include the shifts, rotations, convolutions, and distortions, or the cross effect of both the spatial and spectral nature of the PSF for the incoming photons. Additionally, SimCADO includes some additionally realistic features for simulating mock imagery for the MICADO detector array like the world coordinate system, variable sky background, PSF variability over the FoV, instrumental distortion map, missing segments due to the mirror surface’s re-coat, and extra-terrestrial optical path elements because of Zodiacal light, galactic extinction, atmospheric extinction, and scattered moonlight.
In practice, SimCADO accepts inputs in FITS or ASCII formats, and outputs all data as standard FITS files, allowing flexibly with other programs already in use within the astronomical community.
2.3. Inner-Surface Brightness Profile Variation
2.3.1. Mock MICADO Image Simulations
We used SimCADO to simulate the I-band images for NGC 300 and NGC 3115 dw01 observed with MICADO in the wide-field mode. Here, we used the best-fit parameters of their NSCs’ SB constrained from the HST/WFPC2 F814W images as discussed in section 5 and summarised in table 4 of N25.
N25 adopt a combination of a core-Sérsic and a Sérsic model to fit the NSC and the extended component of these galaxies, respectively. The core-Sérsic model [68,69] parametrizes the projected SB of NSCs, rather than their intrinsic density, as follows:
where
In this function, the Sérsic index () and the power-law slope () control the shapes of the outer Sérsic part and the inner power-law regime, while the sharpness parameter () determines the transition between these two regions. is the break radius at which the transition is happened, and thus is the intensity at (converted to SB in the legends of Figure 1 and Figure 2). Outside , the profile follows a Sersic [70] profile with a projected half-light radius , but it gradually transitions to a power-law SB at smaller radii . Finally, the parameter is given as [71].
On the other hand, the Sersic [70] model used to describe the extended disk of these galaxies has a form:
where represents the Sérsic index, distinguishing it from of the core-Sérsic profile in eq. 1, and it relates to the coefficient . Here, is the effective radius of the profile, and is the intensity at , which is converted to SB , as shown in the legends of Figure 1 and Figure 2.
The cusp in the inner slope () of the core-Sérsic profile reflects our current lack of knowledge about the profiles of NSCs at small radii. These regions are inaccessible with current facilities but will become observable with the ELT. N25 adopted a power-law index of in their extrapolated SB and simulations at these radii. In this work, we modelled the I-band MICADO images based on the best-fit parameters of these galaxies’ SB obtained from N25, but allowed to vary: for NGC 300 and for NGC 3115 dw01.
We clarify the choice of for both galaxies. The simulations with serve to validate predictions where the inner SB approaches a constant value, and the velocity dispersion profile asymptotically becomes a constant positive value, rather than declining toward zero—even in the absence of an IMBH, as demonstrated in earlier numerical [72] and simulation work (N25). Simulations with are to assess the consistency of the galaxy mass models generated from the mock MICADO I-band images in this study with those interpolated into the 4 mas regime, derived from the HST/WFPC2 F814W images. For , we explore how variation affects the determination of IMBH mass through stellar dynamics when using MICADO data.
We enhanced the SimCADO package by adding a 2D core-Sérsic function (eq. 1), complementing the existing 2D Sérsic function (eq. 2). During our simulations, we first generated emission curves based on the internal spectral energy distribution (SED) for an elliptical galaxy (NGC 3115 dw01) and a spiral galaxy (NGC 300) in the I-band filter. We then adjusted the spectral dimension to longer wavelengths, corresponding to the redshifts of NGC 300 () and NGC 3115 dw01 (), as reported on the NASA/IPAC Extragalactic Database (NED4). Although these redshifts are negligible, this step was included for accuracy.
For each galaxy, we created 2D models using the core-Sérsic profile for the NSC () and the Sérsic profile for the extended-disk component ( for NGC 300 and elliptical with for NGC 3311 dw01), then combined these models into a single source. We also fixed certain observational parameters to mimic the realistic observations, including obs_dit = 900s (observing time per exposure) and n_dit = 4 (number of exposures).
2.3.2. PSF Determination from MICADO Point Source Images
Accurate characterization of the PSF is essential for deconvolving galaxy light distributions and performing reliable photometric and structural analyses. For MICADO, the PSF is expected to be complex and sensitive to both AO performance and observing conditions.
To model the PSF, we simulate MICADO observations of point sources (i.e., stars) using SimCADO, adopting the same instrumental setup and conditions as those used for the galaxy simulations. The resulting stellar images are analyzed with the Multi-Gaussian Expansion (MGE) method, implemented through the mge.fit_sectors routine from the MgeFit Python package5 [73]. The mge.fit_sectors algorithm models the 2D light distribution of each simulated star as a sum of co-axial Gaussian components. This simulated-MGE PSF is subsequently incorporated into the analysis of mock MICADO galaxy images to accurately account for instrumental and atmospheric broadening effects.
2.4. Brightness Profiles from MICADO Galaxy Images
We showed in Figure 1 for NGC 300 and Figure 2 for NGC 3115 dw01 the I-band MICADO images with varying the inner-power-law slope of the core-Sérsic, as well as their 1D SB extracted from the Image Reduction and Analysis Facility (IRAF) ellipse task [74]. The ellipse routine systematically integrated the flux of stars within concentric annuli, allowing for variations in position angles and ellipticities along the galaxy’s semi-major axis and deconvolving with the simulated PSF image (subsubsection 2.3.2). Subsequently, we converted the average flux within each annulus (measured in counts/s) into SB expressed in mag.arcsec−2. The photometric zero point for the I band is zero_pointI = 29.492 mag obtained from the photometric zero point function within the SimCADO framework, which simulated the light from a point source (i.e., a stars) and calculated as zero_pointI = 2.5log10(counts/t_exp) + input_mag; here, t_exp = 1s and input_mag = 10 mag.
To highlight the effects of varying of the core-Sérsic profile on the SB at radii probed only by the ELT, we overlaid the HST/WFPC2 F184W IRAF elipse profiles and their best-fit core-Sérsic + Sérsic functions from N25 in the same figure for each galaxy. It is evident that at these unexplored radii, larger significantly increase the light distribution of stars within the NSC towards its center. This change will indeed impact the determination of the IMBH mass (subsection 3.3). To validate our simulations, we compared the previous profile with fitted by N25 and found these profiles consistent to each other in both galaxies. This consistency is also evident in the case of , where our simulations produced flat profiles toward the galaxy centers, as demonstrated in previous numerical work by Tremaine et al. [72] and simulations (fig. 4 and section 4.2 of N25).
We converted these MICADO I-band images to MGE models using the Python version of the MgeFit with the mge_fit_sectors_regularized routine. During the fits, we also convolved the images with the MICADO I-band PSF. We saved these MGE-light models of the two galaxies varying with the inner-power-law slope () in Table 1 and illustrated in Figure 3. This Figure shows the agreement/disagreement between the data and the model as 2D contours at equivalent radii and contour levels for the mock MICADO simulations with five simulated for each galaxy. These MGE models can be analytically de-projected with a specified axis ratio and inclination to reconstruct the three-dimensional (3D) distribution of the entire galaxy.
3. Dynamical Model
3.1. Jeans Anisotropic Model (JAM)
We utilize the JAM model based on the solution of the Jeans equations, assuming axisymmetry with a cylindrical alignment of the velocity ellipsoi, which is axially symmetric around the vertical direction (). This JAM-predicted LOSVD is calculated in combination with the new mass model simulated by SimCADO ( Section 2 ), is then compared with the mock kinematics generated by N25 through a Bayesian framework to infer the IMBH mass and its error.
This choice of cylindrical aligned JAM is to ensures consistency with the mock kinematics generated by N25, where they used the same model for their HARMONI IMBH sample of dwarf galaxies hosting bright NSCs with significant rotational characteristics. We implemented this by setting align=‘cyl’ in the jam_axi_proj procedure of the JamPy package [62].
3.2. Mock Stellar Kinematics
This work used the stellar kinematics measured from the mock data cubes produced from HSIM. The detailed descriptions of how these mock observations were produced in various spectral gratings of medium (; J, H, K) and high (; H-high, K-short, K-long) spectral resolution have presented in sections 6.2 and 6.3 of N25.
N25 showed these stellar kinematic measurements from their mock HARMONI datacubes simulated for three different : = 0%, = 0.5%, and = 1%, in their figs 6 and 7 for the nuclei of NGC 300 and NGC 3115 dw01, respectively. These LOSVD maps include the rotation (V), velocity dispersion (), and root-mean-squared velocity (). We note that NGC 300 and NGC 3115 dw01 host at their centres an NSC with a mass of and , respectively.
These stellar kinematic maps (i.e., with an assumed ) show distinct properties of the presence or absence of an IMBH, exhibiting a distinctive central drops in and (if nuclei are less rotating) maps when either no BH ( ) is present or when the are insufficient (e.g., for NGC 300 and for NGC 3115 dw01; or = 0.5%). This central- drop is a common feature in the predicted stellar kinematics of galaxies when no or very small IMBHs are assumed, and it holds true for a range of assumed anisotropic profiles and density profiles with regardless of the Sérsic index (Tremaine et al. [72]; N25). This well-established feature of realistic galaxy models initially appeared to contradict early observations [77]. However, the apparent discrepancy was resolved when it was discovered that all massive galaxies contain SMBHs. Conversely, models featuring relatively large IMBHs generate centrally rising peaks in the map at several central spaxels in the Keplerian maner (for ) irrespective of the profile slope and Sérsic index, which correspond to the BH’s SOI, showing a clearly upturned trending as increases. This observation aligns with the general expectation that central should increase in a Keplerian manner within a tiny region near the central IMBH, where its gravitational potential dominates over all others.
Given the highly consistent among N25’s mock stellar kinematics measurements across six spectral gratings and two spectral resolutions and the purpose of reducing the calculations, we adopt the stellar kinematics produced from the H-high grating to test the variation effect of the inner SB of NSCs simulated with MICADO on IMBH mass measurements only.
3.3. Improve IMBH Mass Measurements with MICADO
We performed fitting of the JAM to mock H-high kinematics (), aimed at testing the variation effect of the inner-power law’s slope () of the core-Sérsic function of NSCs simulated with MICADO on IMBH mass determinations and at constraining the model’s dynamical parameters. Here, we replaced the interpolated HST mass model toward the central 4-mas region produced by N25 by the 2D MICADO images simulated from the SimCADO with varying a range value of (subsection 2.3).
The JAM is characterized with a central IMBH mass (), the stellar orbitals represented by the anisotropy (), the galaxy morphological inclination angle (i), and the constant stellar-mass-scaling factor (I). We adopted a logarithmic scale for to ensure a more Gaussian sampling across multiple orders of magnitude, while other three parameters are sampled in linear scales. During the fitting process, JAM generated kinematic models that could be compared to their corresponding simulated values () while accounting for the HARMONI LTAO PSF with a mas.
To obtain the best-fit JAM, we utilized a Markov chain Monte Carlo (MCMC) simulation to explore the parameter space of , I, , and i, fitting the mock kinematic data and determining the best-fit parameters and uncertainties (statistic and kinematic measurement), using the adaptive Metropolis algorithm [78] within the Bayesian framework [adamet6; 79]. Our MCMC chains comprised of iterations, with the initial 20% of iterations excluded as a burn-in phase. The full probability distribution function (PDF) was constructed from the remaining 80% of calculations. The best-fit parameters are the highest likelihood of the PDF, while the uncertainties for all four parameters were determined at 1 and 3 confidence levels, representing the ranges (16–84)% and (0.14–99.86)% of the PDF, respectively. We fixed the search ranges for four model parameters as follows:
• ): from 0 to 6 (or : from 0 to )
• I: from 0.1 to 3 (/)
• : from −1.0 to 0.99
• i: from 5° to 90°
Initial guesses for the JAM parameters were fixed with (I, , i) = (0.6, 0, 42) for NGC 300, while those = (1.4, 0, 42) for NGC 3115 dw01. The initial guesses for as those used in the simulated data cubes with for NGC 300 and for NGC 3115 dw01.
In Figure 4 for NGC 300 and Figure 5 for NGC 3115d w01, the best-fit JAM parameters and their associated uncertainties are shown. These parameters describe the derived stellar kinematics for three different and five inner power-law slopes . The figures feature 2D scatter plots for each parameter, with colored points indicating their likelihood. White represents the maximum likelihood, while black signifies a confidence level smaller than 3. Additionally, histograms are provided to display the 1D distributions for each parameter. These 1D distributions were used to determine the best-fit values and their corresponding uncertainties, which are listed in Table 2 for NGC 300 and Table 3 for NGC 3115 dw01. The insert plots at the top-right corner of each PDF directly compare the best-fit JAM model and the mock on the same velocity scale.
One notable feature of the stellar velocity dispersion produced by the best-fit JAM is clearly illustrated in Figure 4 for NGC 300, in the case with no BH. However, this pattern is less evident in the corresponding models for NGC 3115 dw01, as shown in Figure 5. As the value increases, the central velocity dispersion drop becomes more pronounced, with a larger extent and greater depth, requiring a larger for JAM to reproduce the mock . An increase in also raises the central stellar mass density, and JAM utilizes the parameter to account for the degeneracy between stellar mass density and . We explore these complexities to explain our results in detail below.
For the tests with (flat core; see the top-row panels of Figure 4 for NGC 300 and Figure 5 for NGC 3115 dw01), JAM cannot replicate the central drop in velocity dispersion (and subsequently in the maps) for cases with input . This is because the projected dispersion predicted by JAM remains flat towards the centers when , e.g., see fig. 4 of N25 and Tremaine et al. [72], leading to biased lower estimates and resulting in an upper limit (NGC 300) or lower estimate (NGC 3115 dw01) for the mock kinematic cases with input or . In these scenarios, there is no cusp in the SB, which is dominated by stars with radii around the break radius, and the density follows . Consequently, when there is no BH, the depth of the central potential well is finite, and the projected dispersion remains asymptotically constant as , dominated by stars inside the break radius. If a BH is present, the projected dispersion increases at a rate between and .
In all tests with the weak cusp models (), we successfully reproduced the results from N25 with , achieving uncertainties within 30% for I and 10% for . This outcome was expected, as the MICADO images were modeled using the HST SB constrained in N25. Additionally, we validated the numerical prediction for in NGC 300, as reported by N25, by replicating it with our mock MICADO simulations. This further confirms the accuracy of same simulations for NGC 3115 dw01 in this work.
However, in the case of NGC 300, there is an opposite trend in I and compared to their trends in N25. Specifically, our JAM with the MICADO mass models provided lower but higher I than those in N25 for the same mock kinematics. This discrepancy is due to the MICADO images providing more light (and thus stellar mass) in the radius range of 0–0 than the best-fit surface brightness profiles constrained from HST images, as seen in Figure 1. In the case of NGC 3115 dw01, the trend of I and is entirely consistent with the findings from N25, due to the consistency between its MICADO and HST images (see Figure 2). Here, the dynamical model compensates for the central velocity dispersion drop primarily through the negative covariance between and I. The increase in central stellar mass density remains either lower than or comparable to the , thus having a negligible impact on determinations. Specifically, for NGC 300, the difference in central stellar mass is , and for NGC 3115 dw01, it is .
The 2D PDFs show the 3 confidence level “banana shape” of the negative covariance between and I. This covariance occurs due to the interplay between the gravitational potentials of central BHs and their host galaxies probed by both MICADO and HARMONI, where larger correspond to smaller I, and vice versa.
For the immediate cusp models (), we considered for NGC 300 and for NGC 3115 dw01. In these cases, the stellar mass density difference between these profiles and the profile with becomes comparable to, or even exceeds, the BH mass within of the core-Sérsic profile of the NSCs. Specifically, for NGC 300 (Figure 1) and for NGC 3115 dw01 (Figure 2), leading JAM predicts lower or fail to detect it (see Figure 4 and Figure 5).
For the strong cusp models (). Here, we considered for both NGC 300 and NGC 3115 dw01. In these models, the central stellar mass density of the NSC significantly surpasses the . For NGC 300, the increase in stellar mass is (Figure 1), and for NGC 3115 dw01, it is (Figure 2). As a result, the is completely diminished.
In addition, it should also be noted that the variation of does not impact the constraints on the inclination (i), which remains weakly constrained in our dynamical models due to the round shape of NSCs. Similarly, the orbital anisotropy () is only slightly negative for NGC 300 and positive for NGC 3115 dw01 but close to zero, the assumed value in the N25 HSIM simulations, indicating minimal effect.
4. Conclusions
We have presented ELT/MICADO simulations for novel galaxy stellar model for measuring IMBH mass measurements using N25’s mock HARMONI kinematics. We summarize our conclusions as follows:
(i) We enhanced the SimCADO software, used for simulating MICADO images on the ELT, by incorporating a core-Sérsic function to model the SB of NSCs.
(ii) Our mock MICADO I-band images for NGC 300 and NGC 3115 dw01, assuming an inner power-law slope of for the core-Sérsic profile, are fully consistent with the constraints from N25. This holds true at both the larger scales observed with HST and the interpolated 4 mas scale. Given this consistency for , we used it as a reference for further simulations with slopes of for NGC 300, and for NGC 3115 dw01.
(iii) These mock MICADO images (4-mas pixel size) for both galaxies can be achieved with a one-hour on-source exposure time. Since their SB remain consistent with the existing HST observational scale at large radii, increasing the exposure time to four hours did not result in significant image quality improvement. Therefore, we set one hour as the maximum on-source exposure time for MICADO observations in the HARMONI IMBH sample.
(iv) We used mock MICADO images to reconstruct the stellar mass models for both galaxies. These models, combined with mock HARMONI kinematics from N25, served as inputs for JAM to re-estimate the masses of their central IMBHs and measurement uncertainties. The best-fit recovered JAM, based on the assumed mass profile (e.g., flat core models) regardless of Sérsic index, showed a constant positive value in the velocity dispersion toward the galaxy centers, rather than the expected central drop for cases with zero or small IMBHs, as predicted by Tremaine et al. [72] and N25, leading to an underestimation of the IMBH mass.
(v) Our same tests with assumed mass profiles, and increasing for the NSCs, exaggerate the central drop in both the size and depth of the velocity dispersion at a few central spaxels, where the stellar kinematics are dominated by the gravitational potential of the IMBH. This feature was also shown in fig. 4 and discussed in section 4.2 of N25, though based on numerical predictions. Here, we confirmed the -dependence of stellar kinematics by simulating realistic photometric observations using MICADO, in combination with mock HSIM IFS HARMONI kinematics and JAM. While increasing causes significant drops in central velocity dispersion, it also raises the stellar mass density in that region (within ) compared to that of the flat core models, which is accounted for and balanced in the dynamical models.
• Weak cusp (): while the central stellar mass density increases, it remains lower than or comparable to the . Thus, JAM compensates for the drop in central velocity dispersion primarily through the negative covariance between and .
• Immediate cusp (): the central stellar mass density increases significantly and even surpasses the . JAM thus tend to underestimate the IMBH mass or none detection.
• Strong cusp (): the central stellar mass density becomes dominant over the . As a result, the BH is entirely suppressed in JAM.
Software:
Acknowledgments
The authors would like to thank the anonymous referee for their careful reading and useful comments, that helped to improve the paper greatly.
| 1 |
jampy v7.2.0 https://pypi.org/project/jampy/
|
| 2 | |
| 3 | Available from https://github.com/astronomyk/SimCADO
|
| 4 | |
| 5 | |
| 6 | v2.0.9 available from https://pypi.org/project/adamet/
|
References
- Ahn, C.P.; Seth, A.C.; Cappellari, M.; Krajnović, D.; Strader, J.; Voggel, K.T.; Walsh, J.L.; Bahramian, A.; Baumgardt, H.; Brodie, J.; et al. The Black Hole in the Most Massive Ultracompact Dwarf Galaxy M59-UCD3. ApJ 2018, 858, 102. [Google Scholar] [CrossRef]
- Nguyen, D.D. Improved dynamical constraints on the mass of the central black hole in NGC 404. arXiv e-prints 2017, p. arXiv:1712.02470. [Google Scholar] [CrossRef]
- Nguyen, D.D. Uncovering the Census of Black Holes in sub-Milky Way Mass Galaxies. In Proceedings of the ALMA2019: Science Results and Cross-Facility Synergies, December 2019, p. 106. [CrossRef]
- Thater, S.; Krajnović, D.; Weilbacher, P.M.; Nguyen, D.D.; Bureau, M.; Cappellari, M.; Davis, T.A.; Iguchi, S.; McDermid, R.; Onishi, K.; et al. Cross-checking SMBH mass estimates in NGC 6958 - I. Stellar dynamics from adaptive optics-assisted MUSE observations. MNRAS 2022, 509, 5416–5436. [Google Scholar] [CrossRef]
- Thater, S.; Lyubenova, M.; Fahrion, K.; Martín-Navarro, I.; Jethwa, P.; Nguyen, D.D.; van de Ven, G. Effect of the initial mass function on the dynamical SMBH mass estimate in the nucleated early-type galaxy FCC 47. A&A 2023, 675, A18. [Google Scholar] [CrossRef]
- Zou, F.; Gallo, E.; Seth, A.C.; Hodges-Kluck, E.; Ohlson, D.; Treu, T.; Baldassare, V.F.; Brandt, W.N.; Greene, J.E.; Madau, P.; et al. Central Massive Black Holes Are Not Ubiquitous in Local Low-mass Galaxies. ApJ 2025, 992, 176. [Google Scholar] [CrossRef]
- van den Bosch, R.C.E. Unification of the fundamental plane and Super Massive Black Hole Masses. ApJ 2016, 831, 134. [Google Scholar] [CrossRef]
- Nguyen, D.D.; Cappellari, M.; Pereira-Santaella, M. Simulating supermassive black hole mass measurements for a sample of ultramassive galaxies using ELT/HARMONI high-spatial-resolution integral-field stellar kinematics. MNRAS 2023, 526, 3548–3569. [Google Scholar] [CrossRef]
- Nguyen, D.D.; Ngo, H.N.; Le, T.Q.T.; Graham, A.W.; Soria, R.; Chilingarian, I.V.; Thatte, N.; Phuong, N.T.; Hoang, T.; Pereira-Santaella, M.; et al. Supermassive black hole mass measurement in the spiral galaxy NGC 4736 using JWST/NIRSpec stellar kinematics. A&A 2025, 698, L9. [Google Scholar] [CrossRef]
- Nguyen, D.D.; Ngo, H.N.; Cappellari, M.; Le, T.Q.T.; Ho, T.H.T.; Le, T.N.; Gallo, E.; Thatte, N.; Zou, F.; Perna, M.; et al. Measuring the Central Dark Mass in NGC 4258 with JWST/NIRSpec Stellar Kinematics. arXiv e-prints 2025, arXiv:2509.20519. [Google Scholar]
- Nguyen, D.D.; Cappellari, M.; Le, T.Q.T.; Ngo, H.N.; Gallo, E.; Thatte, N.; Zou, F.; Ho, T.H.T.; Le, T.N.; Tong, H.G.; et al. Extending the Frontier of Spatially-Resolved Supermassive Black Hole Mass Measurements to at 1≲z≲2: Simulations with ELT/MICADO High-Resolution Mass Models and HARMONI Integral-Field Stellar Kinematics. arXiv e-prints 2025, arXiv:2511.10427. [Google Scholar]
- McConnell, N.J.; Ma, C.P. Revisiting the Scaling Relations of Black Hole Masses and Host Galaxy Properties. ApJ 2013, 764, 184. [Google Scholar] [CrossRef]
- Saglia, R.P.; Opitsch, M.; Erwin, P.; Thomas, J.; Beifiori, A.; Fabricius, M.; Mazzalay, X.; Nowak, N.; Rusli, S.P.; Bender, R. The SINFONI Black Hole Survey: The Black Hole Fundamental Plane Revisited and the Paths of (Co)evolution of Supermassive Black Holes and Bulges. ApJ 2016, 818, 47. [Google Scholar] [CrossRef]
- Abbott, R.; Abbott, T.D.; Abraham, S.; Acernese, F.; Ackley, K.; Adams, C.; Adhikari, R.X.; Adya, V.B.; Affeldt, C.; Agathos, M.; et al. GW190521: A Binary Black Hole Merger with a Total Mass of 150 M⊙. Phys. Rev. Lett. 2020, 125, 101102. [Google Scholar] [CrossRef]
- Nguyen, D.D.; Cappellari, M.; Ngo, H.N.; Le, T.Q.T.; Le, T.N.; Ho, K.N.H.; Nguyen, A.K.; On, P.T.; Tong, H.G.; Thatte, N.; et al. Simulating Intermediate Black Hole Mass Measurements for a Sample of Galaxies with Nuclear Star Clusters Using ELT/HARMONI High Spatial Resolution Integral-field Stellar Kinematics. AJ 2025, 170, 124. [Google Scholar] [CrossRef]
- Thatte, N. Harmoni. In Proceedings of the EAS2024, July 2024, p. 2682.
- Mezcua, M. Observational evidence for intermediate-mass black holes. International Journal of Modern Physics D 2017, 26, 1730021. [Google Scholar] [CrossRef]
- Fukugita, M.; Peebles, P.J.E. The Cosmic Energy Inventory. ApJ 2004, 616, 643–668. [Google Scholar] [CrossRef]
- van Wassenhove, S.; Volonteri, M.; Walker, M.G.; Gair, J.R. Massive black holes lurking in Milky Way satellites. MNRAS 2010, 408, 1139–1146. [Google Scholar] [CrossRef]
- Giersz, M.; Leigh, N.; Hypki, A.; Lützgendorf, N.; Askar, A. MOCCA code for star cluster simulations - IV. A new scenario for intermediate mass black hole formation in globular clusters. MNRAS 2015, 454, 3150–3165. [Google Scholar] [CrossRef]
- Volonteri, M. The Formation and Evolution of Massive Black Holes. Science 2012, 337, 544. [Google Scholar] [CrossRef]
- Bonoli, S.; Mayer, L.; Callegari, S. Massive black hole seeds born via direct gas collapse in galaxy mergers: their properties, statistics and environment. MNRAS 2014, 437, 1576–1592. [Google Scholar] [CrossRef]
- Neumayer, N.; Seth, A.; Böker, T. Nuclear star clusters. A&ARv 2020, 28, 4. [Google Scholar] [CrossRef]
- Greene, J.E.; Strader, J.; Ho, L.C. Intermediate-Mass Black Holes. ARA&A 2020, 58, 257–312. [Google Scholar] [CrossRef]
- Inayoshi, K.; Visbal, E.; Haiman, Z. The Assembly of the First Massive Black Holes. ARA&A 2020, 58, 27–97. [Google Scholar] [CrossRef]
- Seth, A.C.; van den Bosch, R.; Mieske, S.; Baumgardt, H.; Brok, M.D.; Strader, J.; Neumayer, N.; Chilingarian, I.; Hilker, M.; McDermid, R.; et al. A supermassive black hole in an ultra-compact dwarf galaxy. Nature 2014, 513, 398–400. [Google Scholar] [CrossRef] [PubMed]
- Voggel, K.T.; Seth, A.C.; Neumayer, N.; Mieske, S.; Chilingarian, I.; Ahn, C.; Baumgardt, H.; Hilker, M.; Nguyen, D.D.; Romanowsky, A.J.; et al. Upper Limits on the Presence of Central Massive Black Holes in Two Ultra-compact Dwarf Galaxies in Centaurus A. ApJ 2018, 858, 20. [Google Scholar] [CrossRef]
- Amaro-Seoane, P.; Andrews, J.; Arca Sedda, M.; Askar, A.; Baghi, Q.; Balasov, R.; Bartos, I.; Bavera, S.S.; Bellovary, J.; Berry, C.P.L.; et al. Astrophysics with the Laser Interferometer Space Antenna. Living Reviews in Relativity 2023, 26, 2. [Google Scholar] [CrossRef]
- Arca Sedda, M.; Amaro Seoane, P.; Chen, X. Merging stellar and intermediate-mass black holes in dense clusters: implications for LIGO, LISA, and the next generation of gravitational wave detectors. A&A 2021, 652, A54. [Google Scholar] [CrossRef]
- Valluri, M.; Ferrarese, L.; Merritt, D.; Joseph, C.L. The Low End of the Supermassive Black Hole Mass Function: Constraining the Mass of a Nuclear Black Hole in NGC 205 via Stellar Kinematics. ApJ 2005, 628, 137–152. [Google Scholar] [CrossRef]
- Tremou, E.; Strader, J.; Chomiuk, L.; Shishkovsky, L.; Maccarone, T.J.; Miller-Jones, J.C.A.; Tudor, V.; Heinke, C.O.; Sivakoff, G.R.; Seth, A.C.; et al. The MAVERIC Survey: Still No Evidence for Accreting Intermediate-mass Black Holes in Globular Clusters. ApJ 2018, 862, 16. [Google Scholar] [CrossRef]
- Reines, A.E.; Greene, J.E.; Geha, M. Dwarf Galaxies with Optical Signatures of ACTIVE Massive Black Holes. ApJ 2013, 775, 116. [Google Scholar] [CrossRef]
- Baldassare, V.F.; Reines, A.E.; Gallo, E.; Greene, J.E. A 50,000 M⊙ Solar Mass Black Hole in the Nucleus of RGG 118. ApJL 2015, 809, L14, [1506.07531. [Google Scholar] [CrossRef]
- Zaw, I.; Rosenthal, M.J.; Katkov, I.Y.; Gelfand, J.D.; Chen, Y.P.; Greenhill, L.J.; Brisken, W.; Noori, H.A. An Accreting, Anomalously Low-mass Black Hole at the Center of Low-mass Galaxy IC 750. ApJ 2020, 897, 111. [Google Scholar] [CrossRef]
- Davis, B.L.; Graham, A.W. Refining the mass estimate for the intermediate-mass black hole candidate in NGC 3319. PASA 2021, 38, e030. [Google Scholar] [CrossRef]
- Chilingarian, I.V.; Katkov, I.Y.; Zolotukhin, I.Y.; Grishin, K.A.; Beletsky, Y.; Boutsia, K.; Osip, D.J. A Population of Bona Fide Intermediate-mass Black Holes Identified as Low-luminosity Active Galactic Nuclei. ApJ 2018, 863, 1. [Google Scholar] [CrossRef]
- Barth, A.J.; Ho, L.C.; Rutledge, R.E.; Sargent, W.L.W. POX 52: A Dwarf Seyfert 1 Galaxy with an Intermediate-Mass Black Hole. ApJ 2004, 607, 90–102. [Google Scholar] [CrossRef]
- Thornton, C.E.; Barth, A.J.; Ho, L.C.; Rutledge, R.E.; Greene, J.E. The Host Galaxy and Central Engine of the Dwarf Active Galactic Nucleus POX 52. ApJ 2008, 686, 892–910, [0807.1535. [Google Scholar] [CrossRef]
- den Brok, M.; Seth, A.C.; Barth, A.J.; Carson, D.J.; Neumayer, N.; Cappellari, M.; Debattista, V.P.; Ho, L.C.; Hood, C.E.; McDermid, R.M. Measuring the Mass of the Central Black Hole in the Bulgeless Galaxy NGC 4395 from Gas Dynamical Modeling. ApJ 2015, 809, 101. [Google Scholar] [CrossRef]
- Nguyen, D.D.; Seth, A.C.; Reines, A.E.; den Brok, M.; Sand, D.; McLeod, B. Extended Structure and Fate of the Nucleus in Henize 2-10. ApJ 2014, 794(34), 1408.4446. [Google Scholar] [CrossRef]
- Nguyen, D.D.; Seth, A.C.; den Brok, M.; Neumayer, N.; Cappellari, M.; Barth, A.J.; Caldwell, N.; Williams, B.F.; Binder, B. Improved Dynamical Constraints on the Mass of the Central Black Hole in NGC 404. ApJ 2017, 836, 237. [Google Scholar] [CrossRef]
- Nguyen, D.D.; Seth, A.C.; Neumayer, N.; Kamann, S.; Voggel, K.T.; Cappellari, M.; Picotti, A.; Nguyen, P.M.; Böker, T.; Debattista, V.; et al. Nearby Early-type Galactic Nuclei at High Resolution: Dynamical Black Hole and Nuclear Star Cluster Mass Measurements. ApJ 2018, 858, 118. [Google Scholar] [CrossRef]
- Nguyen, D.D.; Seth, A.C.; Neumayer, N.; Iguchi, S.; Cappellari, M.; Strader, J.; Chomiuk, L.; Tremou, E.; Pacucci, F.; Nakanishi, K.; et al. Improved Dynamical Constraints on the Masses of the Central Black Holes in Nearby Low-mass Early-type Galactic Nuclei and the First Black Hole Determination for NGC 205. ApJ 2019, 872, 104. [Google Scholar] [CrossRef]
- Nguyen, D.D.; Bureau, M.; Thater, S.; Nyland, K.; den Brok, M.; Cappellari, M.; Davis, T.A.; Greene, J.E.; Neumayer, N.; Imanishi, M.; et al. The MBHBM★ Project - II. Molecular gas kinematics in the lenticular galaxy NGC 3593 reveal a supermassive black hole. MNRAS 2022, 509, 2920–2939. [Google Scholar] [CrossRef]
- Davis, T.A.; Nguyen, D.D.; Seth, A.C.; Greene, J.E.; Nyland, K.; Barth, A.J.; Bureau, M.; Cappellari, M.; den Brok, M.; Iguchi, S.; et al. Revealing the intermediate-mass black hole at the heart of the dwarf galaxy NGC 404 with sub-parsec resolution ALMA observations. MNRAS 2020, 496, 4061–4078. [Google Scholar] [CrossRef]
- Noyola, E.; Gebhardt, K.; Bergmann, M. Gemini and Hubble Space Telescope Evidence for an Intermediate-Mass Black Hole in ω Centauri. ApJ 2008, 676, 1008–1015. [Google Scholar] [CrossRef]
- Noyola, E.; Gebhardt, K.; Kissler-Patig, M.; Lützgendorf, N.; Jalali, B.; de Zeeuw, P.T.; Baumgardt, H. Very Large Telescope Kinematics for Omega Centauri: Further Support for a Central Black Hole. ApJL 2010, 719, L60–L64. [Google Scholar] [CrossRef]
- Feldmeier, A.; Lützgendorf, N.; Neumayer, N.; Kissler-Patig, M.; Gebhardt, K.; Baumgardt, H.; Noyola, E.; de Zeeuw, P.T.; Jalali, B. Indication for an intermediate-mass black hole in the globular cluster NGC 5286 from kinematics. A&A 2013, 554, A63. [Google Scholar] [CrossRef]
- Kızıltan, B.; Baumgardt, H.; Loeb, A. An intermediate-mass black hole in the centre of the globular cluster 47 Tucanae. Nature 2017, 542, 203–205. [Google Scholar] [CrossRef]
- Pechetti, R.; Seth, A.; Kamann, S.; Caldwell, N.; Strader, J.; den Brok, M.; Luetzgendorf, N.; Neumayer, N.; Voggel, K. Detection of a 100,000 M ⊙ black hole in M31’s Most Massive Globular Cluster: A Tidally Stripped Nucleus. ApJ 2022, 924, 48. [Google Scholar] [CrossRef]
- Häberle, M.; Neumayer, N.; Seth, A.; Bellini, A.; Libralato, M.; Baumgardt, H.; Whitaker, M.; Dumont, A.; Alfaro Cuello, M.; Anderson, J.; et al. Fast-moving stars around an intermediate-mass black hole in Omega Centauri. arXiv e-prints 2024, arXiv:2405.06015. [Google Scholar] [CrossRef]
- Magorrian, J.; Tremaine, S.; Richstone, D.; Bender, R.; Bower, G.; Dressler, A.; Faber, S.M.; Gebhardt, K.; Green, R.; Grillmair, C.; et al. The Demography of Massive Dark Objects in Galaxy Centers. AJ 1998, 115, 2285–2305. [Google Scholar] [CrossRef]
- Kormendy, J.; Richstone, D. Inward Bound—The Search For Supermassive Black Holes In Galactic Nuclei. ARA&A 1995, 33, 581. [Google Scholar] [CrossRef]
- Ferrarese, L.; Merritt, D. A Fundamental Relation between Supermassive Black Holes and Their Host Galaxies. ApJL 2000, 539, L9–L12. [Google Scholar] [CrossRef]
- Krajnović, D.; Cappellari, M.; McDermid, R.M. Two channels of supermassive black hole growth as seen on the galaxies mass-size plane. MNRAS 2018, 473, 5237–5247. [Google Scholar] [CrossRef]
- Nguyen, D.D.; den Brok, M.; Seth, A.C.; Davis, T.A.; Greene, J.E.; Cappellari, M.; Jensen, J.B.; Thater, S.; Iguchi, S.; Imanishi, M.; et al. The MBHBM★ Project. I. Measurement of the Central Black Hole Mass in Spiral Galaxy NGC 3504 Using Molecular Gas Kinematics. ApJ 2020, 892, 68. [Google Scholar] [CrossRef]
- Nguyen, D.D.; Izumi, T.; Thater, S.; Imanishi, M.; Kawamuro, T.; Baba, S.; Nakano, S.; Turner, J.L.; Kohno, K.; Matsushita, S.; et al. Black hole mass measurement using ALMA observations of [CI] and CO emissions in the Seyfert 1 galaxy NGC 7469. MNRAS 2021, 504, 4123–4142. [Google Scholar] [CrossRef]
- Ngo, H.N.; Nguyen, D.D.; Le, T.Q.T.; Ho, K.N.H.; Ho, T.H.T.; Gallo, E.; Nyland, K.; Imanishi, M.; Nakanishi, K.; Le, Q.T.; et al. Revisiting the Supermassive Black Hole Mass of NGC 7052 Using High Spatial Resolution Molecular Gas Observed with ALMA. ApJ 2025, 992, 211. [Google Scholar] [CrossRef]
- Ngo, H.N.; Nguyen, D.D.; Nguyen, T.N.; Dang, T.H.; Ho, T.H.T. Extending the simulations of intermediate-mass black hole mass measurements to Virgo Cluster using ELT/HARMONI high resolution integral-field stellar kinematics. arXiv e-prints 2025, arXiv:2509.03364. [Google Scholar] [CrossRef]
- Ngo, H.N.; Nguyen, D.D.; Le, T.T.Q.; Ho, T.H.T.; Nguyen, T.N.; Dang, T.H. Detecting Intermediate-Mass Black Holes out to 20 Mpc with ELT/HARMONI: The Case of FCC 119. Universe 2025, 11. [Google Scholar] [CrossRef]
- Cappellari, M. Measuring the inclination and mass-to-light ratio of axisymmetric galaxies via anisotropic Jeans models of stellar kinematics. MNRAS 2008, 390, 71–86, [0806.0042. [Google Scholar] [CrossRef]
- Cappellari, M. Efficient solution of the anisotropic spherically aligned axisymmetric Jeans equations of stellar hydrodynamics for galactic dynamics. MNRAS 2020, 494, 4819–4837. [Google Scholar] [CrossRef]
- Zieleniewski, S.; Thatte, N.; Kendrew, S.; Houghton, R.C.W.; Swinbank, A.M.; Tecza, M.; Clarke, F.; Fusco, T. HSIM: a simulation pipeline for the HARMONI integral field spectrograph on the European ELT. MNRAS 2015, 453, 3754–3765. [Google Scholar] [CrossRef]
- Davies, R.; Ageorges, N.; Barl, L.; Bedin, L.R.; Bender, R.; Bernardi, P.; Chapron, F.; Clenet, Y.; Deep, A.; Deul, E.; et al. MICADO: the E-ELT adaptive optics imaging camera. In Proceedings of the Ground-based and Airborne Instrumentation for Astronomy III; McLean, I.S.; Ramsay, S.K.; Takami, H., Eds., July 2010, Vol. 7735, Society of Photo-Optical Instrumentation Engineers (SPIE) Conference Series, p. 77352A. July. [CrossRef]
- Davies, R.; Hörmann, V.; Rabien, S.; Sturm, E.; Alves, J.; Clénet, Y.; Kotilainen, J.; Lang-Bardl, F.; Nicklas, H.; Pott, J.U.; et al. MICADO: The Multi-Adaptive Optics Camera for Deep Observations. The Messenger 2021, 182, 17–21. [Google Scholar] [CrossRef]
- Davies, R.; Schubert, J.; Hartl, M.; Alves, J.; Clénet, Y.; Lang-Bardl, F.; Nicklas, H.; Pott, J.U.; Ragazzoni, R.; Tolstoy, E.; et al. MICADO: first light imager for the E-ELT. In Proceedings of the Ground-based and Airborne Instrumentation for Astronomy VI; Evans, C.J.; Simard, L.; Takami, H., Eds., August 2016, Vol. 9908, Society of Photo-Optical Instrumentation Engineers (SPIE) Conference Series, p. 99081Z. August. [CrossRef]
- Leschinski, K.; Czoske, O.; Köhler, R.; Mach, M.; Zeilinger, W.; Verdoes Kleijn, G.; Alves, J.; Kausch, W.; Przybilla, N. SimCADO: an instrument data simulator package for MICADO at the E-ELT. In Proceedings of the Modeling, Systems Engineering, and Project Management for Astronomy VI; Angeli, G.Z.; Dierickx, P., Eds., August 2016, Vol. 9911, Society of Photo-Optical Instrumentation Engineers (SPIE) Conference Series, p. 991124. August. [CrossRef]
- Graham, A.W.; Erwin, P.; Trujillo, I.; Asensio Ramos, A. A New Empirical Model for the Structural Analysis of Early-Type Galaxies, and A Critical Review of the Nuker Model. AJ 2003, 125, 2951–2963. [Google Scholar] [CrossRef]
- Trujillo, I.; Erwin, P.; Asensio Ramos, A.; Graham, A.W. Evidence for a New Elliptical-Galaxy Paradigm: Sérsic and Core Galaxies. AJ 2004, 127, 1917–1942. [Google Scholar] [CrossRef]
- Sersic, J.L. Atlas de galaxias australes; Obs. Astron. Univ. Nacional de Córdoba: Córdoba, 1968.
- Ciotti, L.; Bertin, G. Analytical properties of the R1/m law. A&A 1999, 352, 447–451. [Google Scholar] [CrossRef]
- Tremaine, S.; Richstone, D.O.; Byun, Y.I.; Dressler, A.; Faber, S.M.; Grillmair, C.; Kormendy, J.; Lauer, T.R. A family of models for spherical stellar systems. AJ 1994, 107, 634–644. [Google Scholar] [CrossRef]
- Cappellari, M. Efficient multi-Gaussian expansion of galaxies. MNRAS 2002, 333, 400–410. [Google Scholar] [CrossRef]
- Jedrzejewski, R.I. CCD surface photometry of elliptical galaxies - I. Observations, reduction and results. MNRAS 1987, 226, 747–768. [Google Scholar] [CrossRef]
- Neumayer, N.; Walcher, C.J. Are Nuclear Star Clusters the Precursors of Massive Black Holes? Advances in Astronomy 2012, 2012, 709038. [Google Scholar] [CrossRef]
- Pechetti, R.; Seth, A.; Neumayer, N.; Georgiev, I.; Kacharov, N.; den Brok, M. Luminosity Models and Density Profiles for Nuclear Star Clusters for a Nearby Volume-limited Sample of 29 Galaxies. ApJ 2020, 900, 32. [Google Scholar] [CrossRef]
- Binney, J. The radius-dependence of velocity dispersion in elliptical galaxies. MNRAS 1980, 190, 873–880. [Google Scholar] [CrossRef]
- Haario, H.; Saksman, E.; Tamminen, J. An adaptive Metropolis algorithm. Bernoulli 2001, 7, 223–242. [Google Scholar] [CrossRef]
- Cappellari, M.; Scott, N.; Alatalo, K.; Blitz, L.; Bois, M.; Bournaud, F.; Bureau, M.; Crocker, A.F.; Davies, R.L.; Davis, T.A.; et al. The ATLAS3D project - XV. Benchmark for early-type galaxies scaling relations from 260 dynamical models: mass-to-light ratio, dark matter, Fundamental Plane and Mass Plane. MNRAS 2013, 432, 1709–1741. [Google Scholar] [CrossRef]
- Van Rossum, G.; Drake, F.L. Python 3 Reference Manual; CreateSpace: Scotts Valley, CA, 2009.
- Hunter, J.D. Matplotlib: A 2D graphics environment. Computing In Science & Engineering 2007, 9, 90–95. [Google Scholar] [CrossRef]
- Harris, C.R.; Millman, K.J.; van der Walt, S.J.; Gommers, R.; Virtanen, P.; Cournapeau, D.; Wieser, E.; Taylor, J.; Berg, S.; Smith, N.J.; et al. Array programming with NumPy. Nature 2020, 585, 357–362. [Google Scholar] [CrossRef]
- Virtanen, P.; Gommers, R.; Oliphant, T.E.; Haberland, M.; Reddy, T.; Cournapeau, D.; Burovski, E.; Peterson, P.; Weckesser, W.; Bright, J.; et al. SciPy 1.0: fundamental algorithms for scientific computing in Python. Nature Methods 2020, 17, 261–272. [Google Scholar] [CrossRef]
- Bradley, L.; Sipocz, B.; Robitaille, T.; Tollerud, E.; Vinícius, Z.; Deil, C.; Barbary, K.; Wilson, T.J.; Busko, I.; Donath, A.; et al. astropy/photutils: 2.0.2, 2024. [CrossRef]
- Astropy Collaboration.; Price-Whelan, A.M.; Lim, P.L.; Earl, N.; Starkman, N.; Bradley, L.; Shupe, D.L.; Patil, A.A.; Corrales, L.; Brasseur, C.E.; et al. The Astropy Project: Sustaining and Growing a Community-oriented Open-source Project and the Latest Major Release (v5.0) of the Core Package. ApJ 2022, 935, 167. [CrossRef]
Figure 1.
1D profiles: of the HST/WFPC2 F814W and MPG/ESO 2.2-m R SB of NGC 300, constructed directly from IRAF ellipse (blue dots), taken from N25. The best-fit core-Sérsic + Sérsic SB extrapolated to the 4 mas scale are plotted as thick purple solid lines, with their best-fitting parameters shown in the legend. The core-Sérsic profile is represented by a red dotted line, and the Sérsic profile is shown by a red dashed line. We overlaid the MICADO I-band images with different inner-power law slopes 0 (green), 0.1 (cyan), 0.2 (olive), 0.5, (black), and 0.7 (gray). In subsequent panels, we display the differences (data - model) between the IRAF ellipse SB and the corresponding MICADO I-band images with different inner-power law slopes in the associated colors to demonstrate their radial agreements/disagreements. Imaging maps: The MICADO I-band images with different inner-power law slopes in the same color-bar scale.
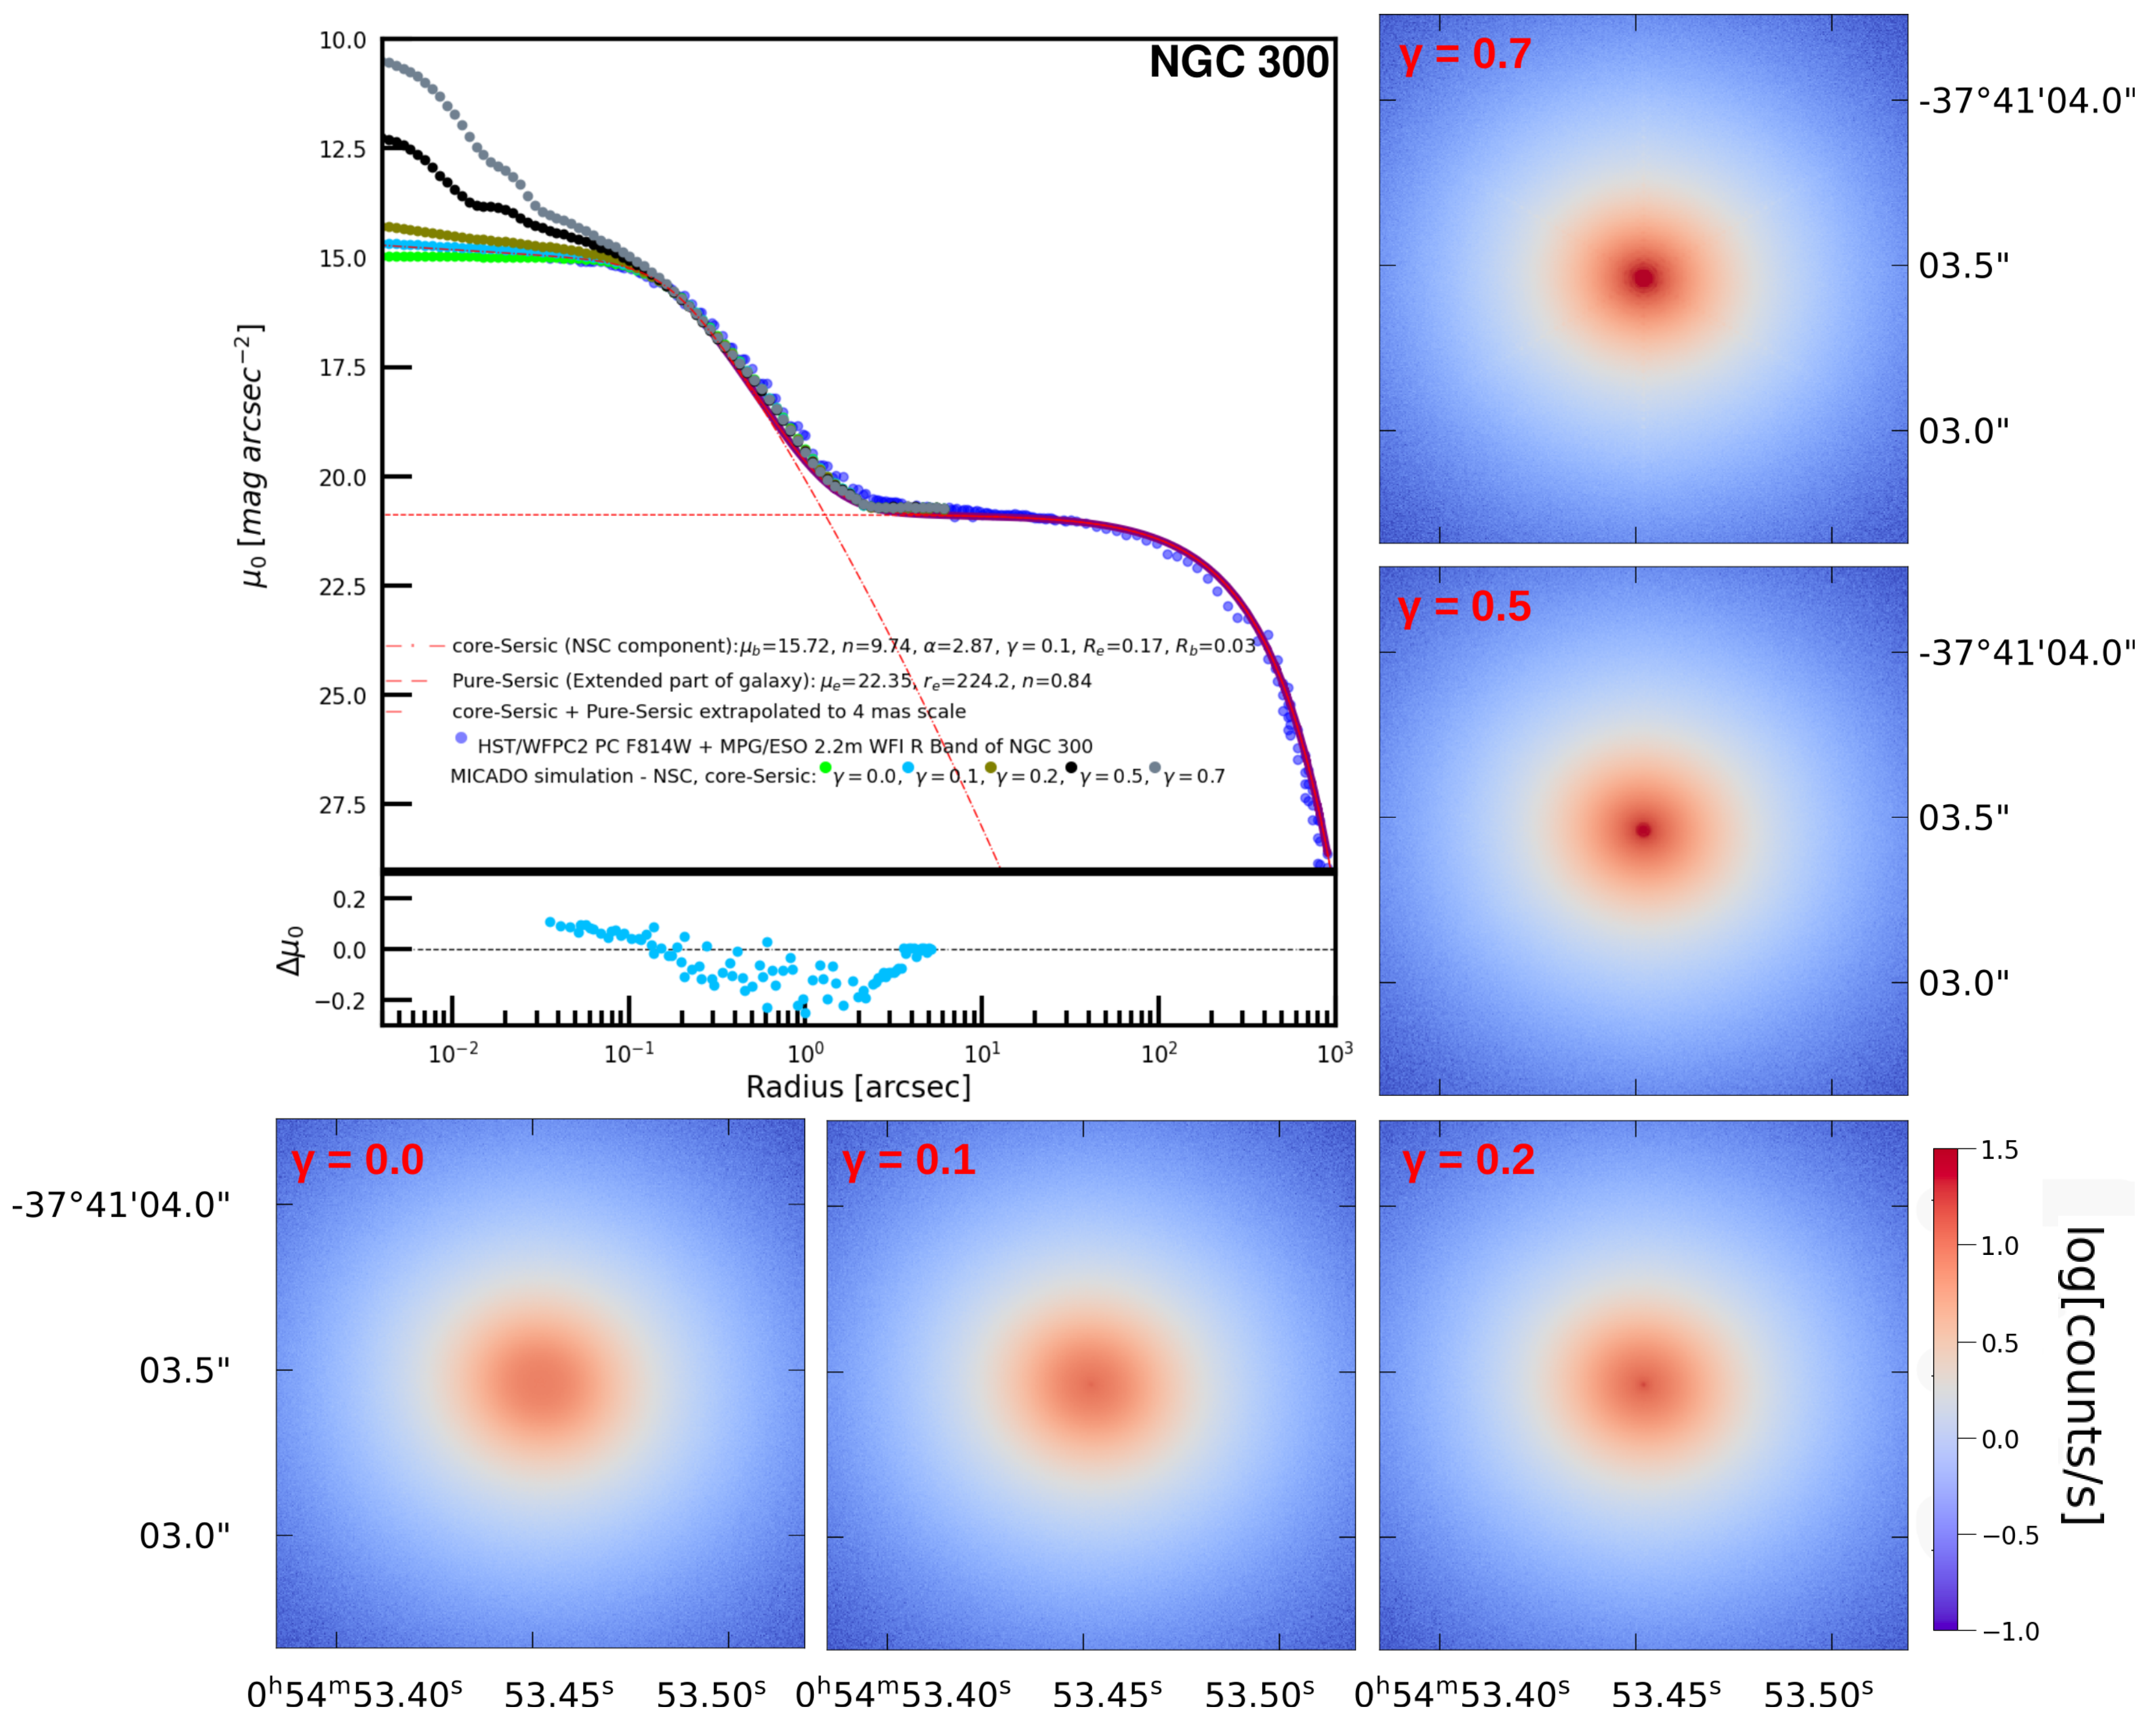
Figure 2.
Same as Figure 1 with the HST/WFPC2 F814W SB constructed directly from IRAF ellipse for NGC 3115 dw01 taken from N25. The Figure also shows the MICADO I-band images and their 1D SB with different inner-power law slopes in the same color-bar scale.
Figure 2.
Same as Figure 1 with the HST/WFPC2 F814W SB constructed directly from IRAF ellipse for NGC 3115 dw01 taken from N25. The Figure also shows the MICADO I-band images and their 1D SB with different inner-power law slopes in the same color-bar scale.
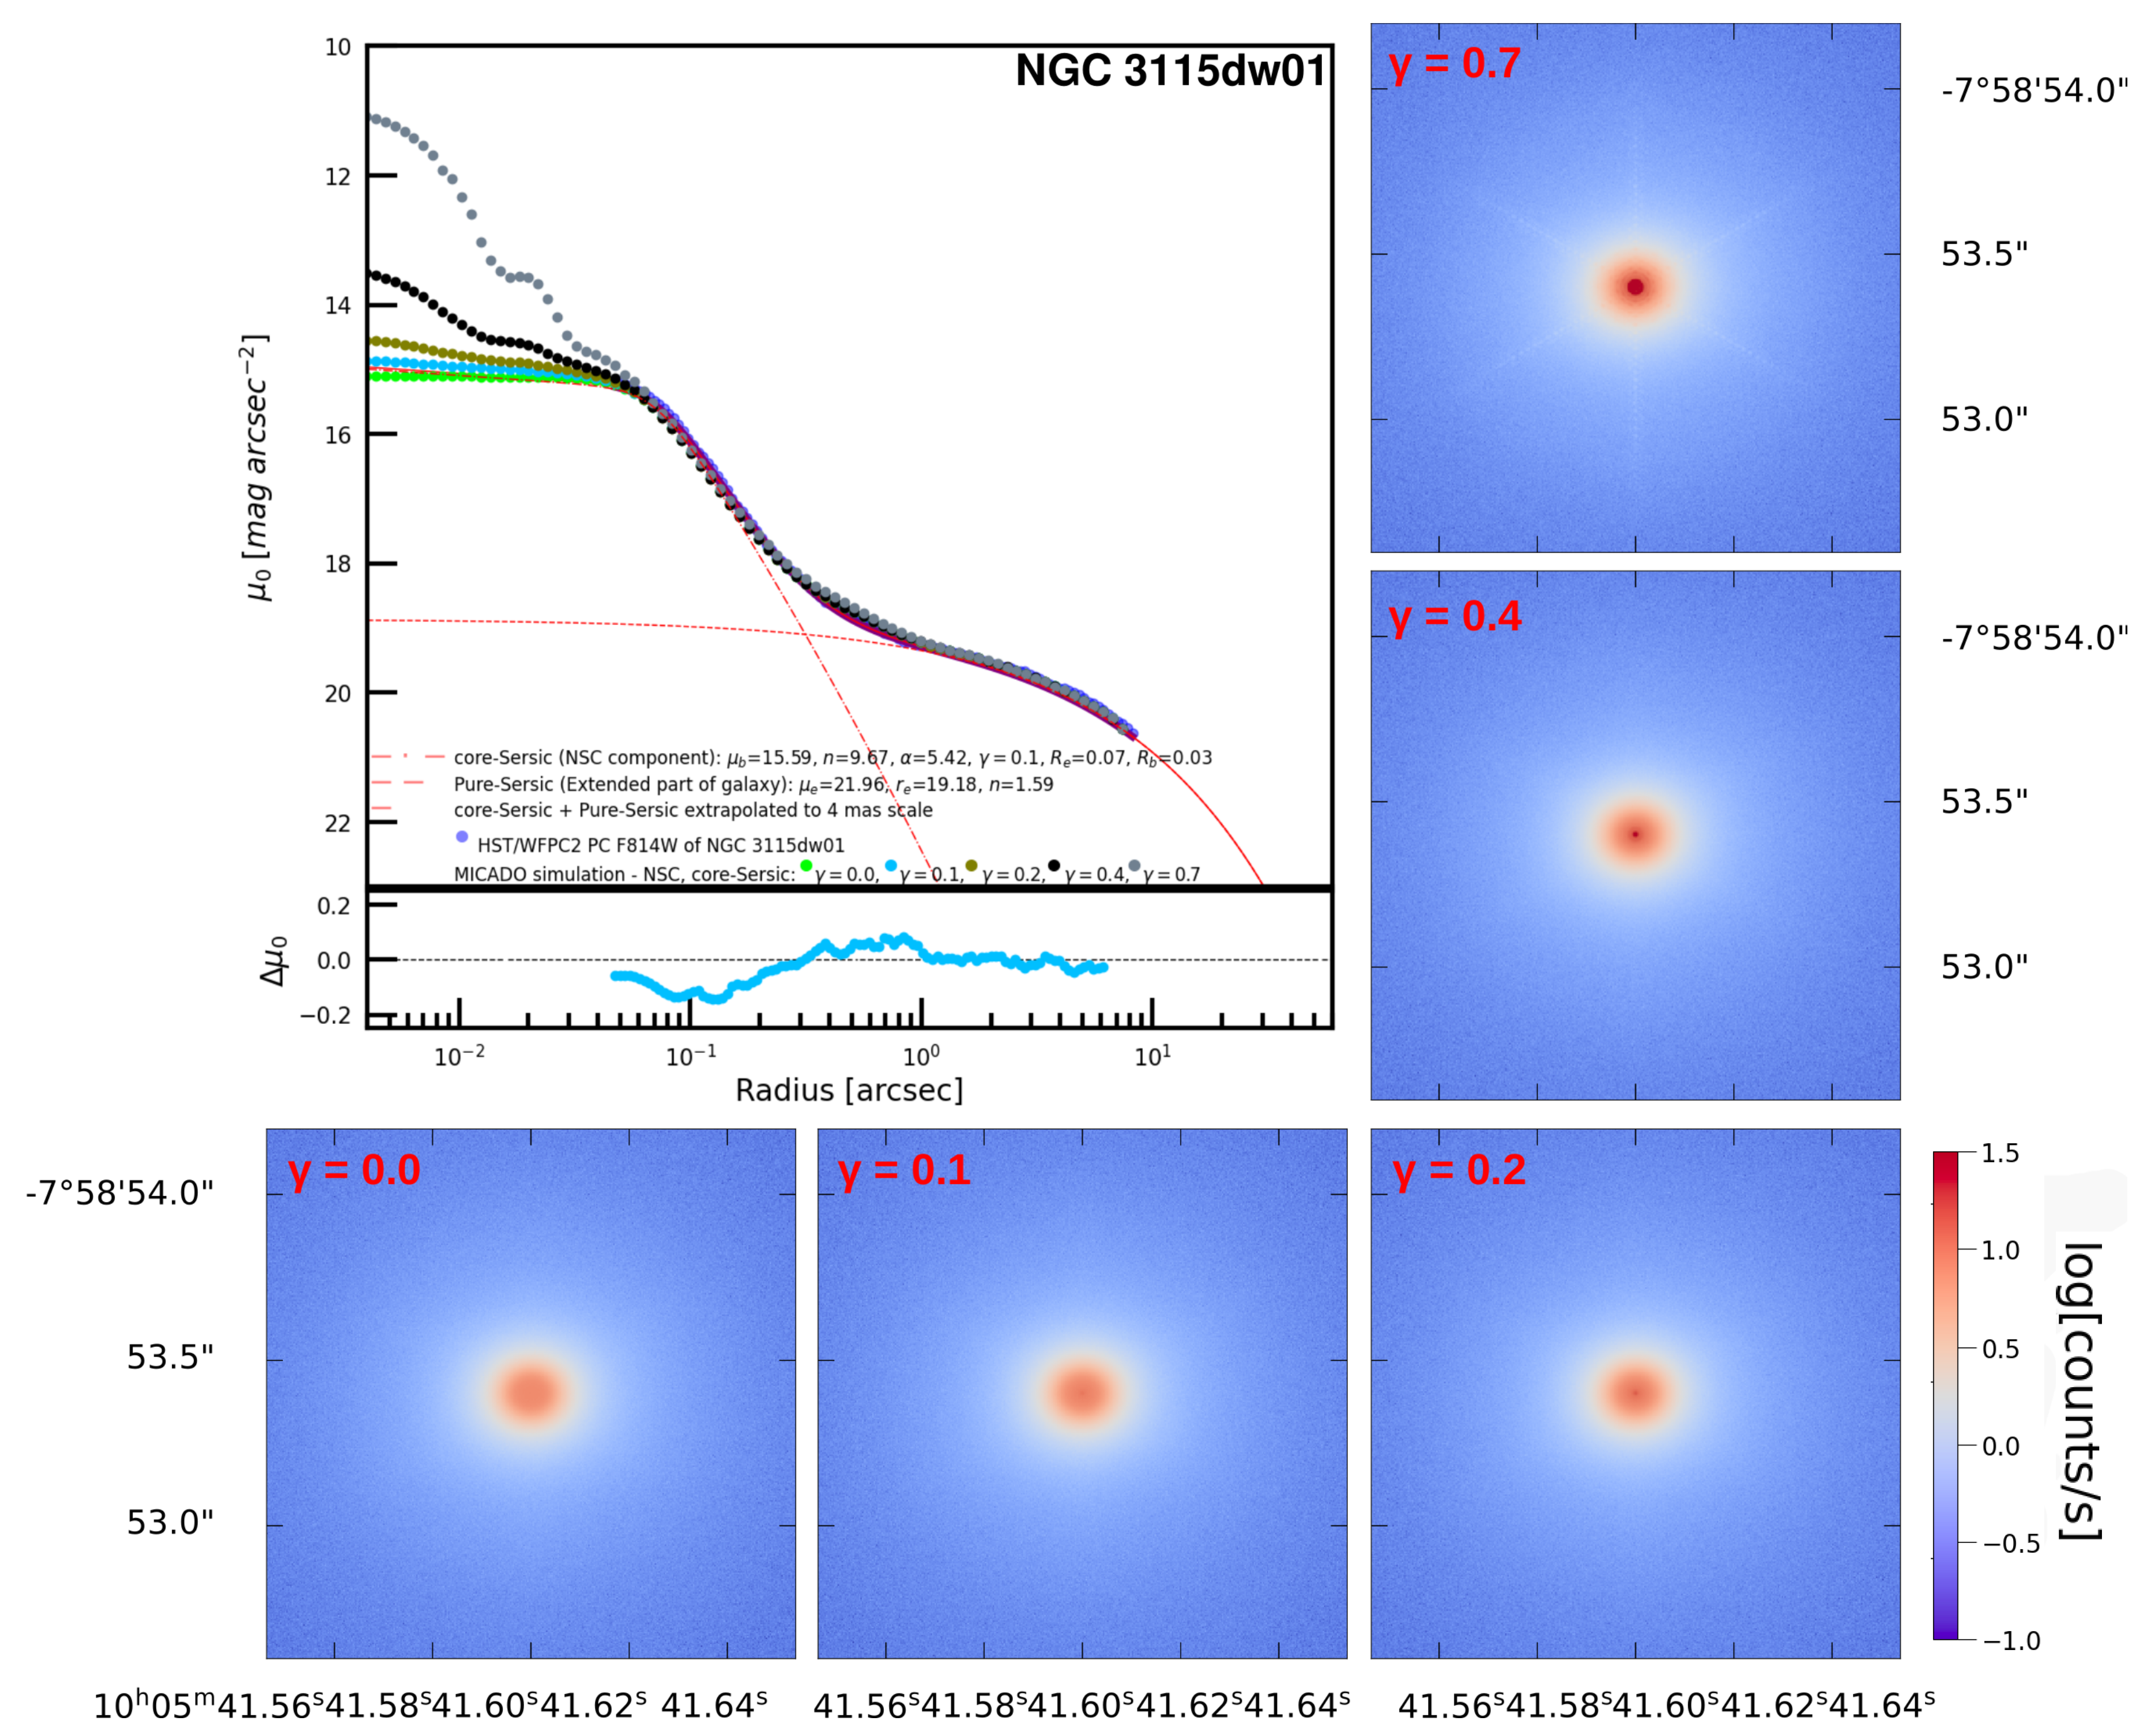
Figure 3.
Comparisons between the MICADO I-band images produced by SimCADO and their best-fit MGE models for NGC 300 (left) and NGC 3115 dw01 (right) with various inner power-law indices is presented in terms of 2D SB density. Black data points represent the mock data, while red contours depict the model, illustrating the alignment between data and model at corresponding radii and contour levels.
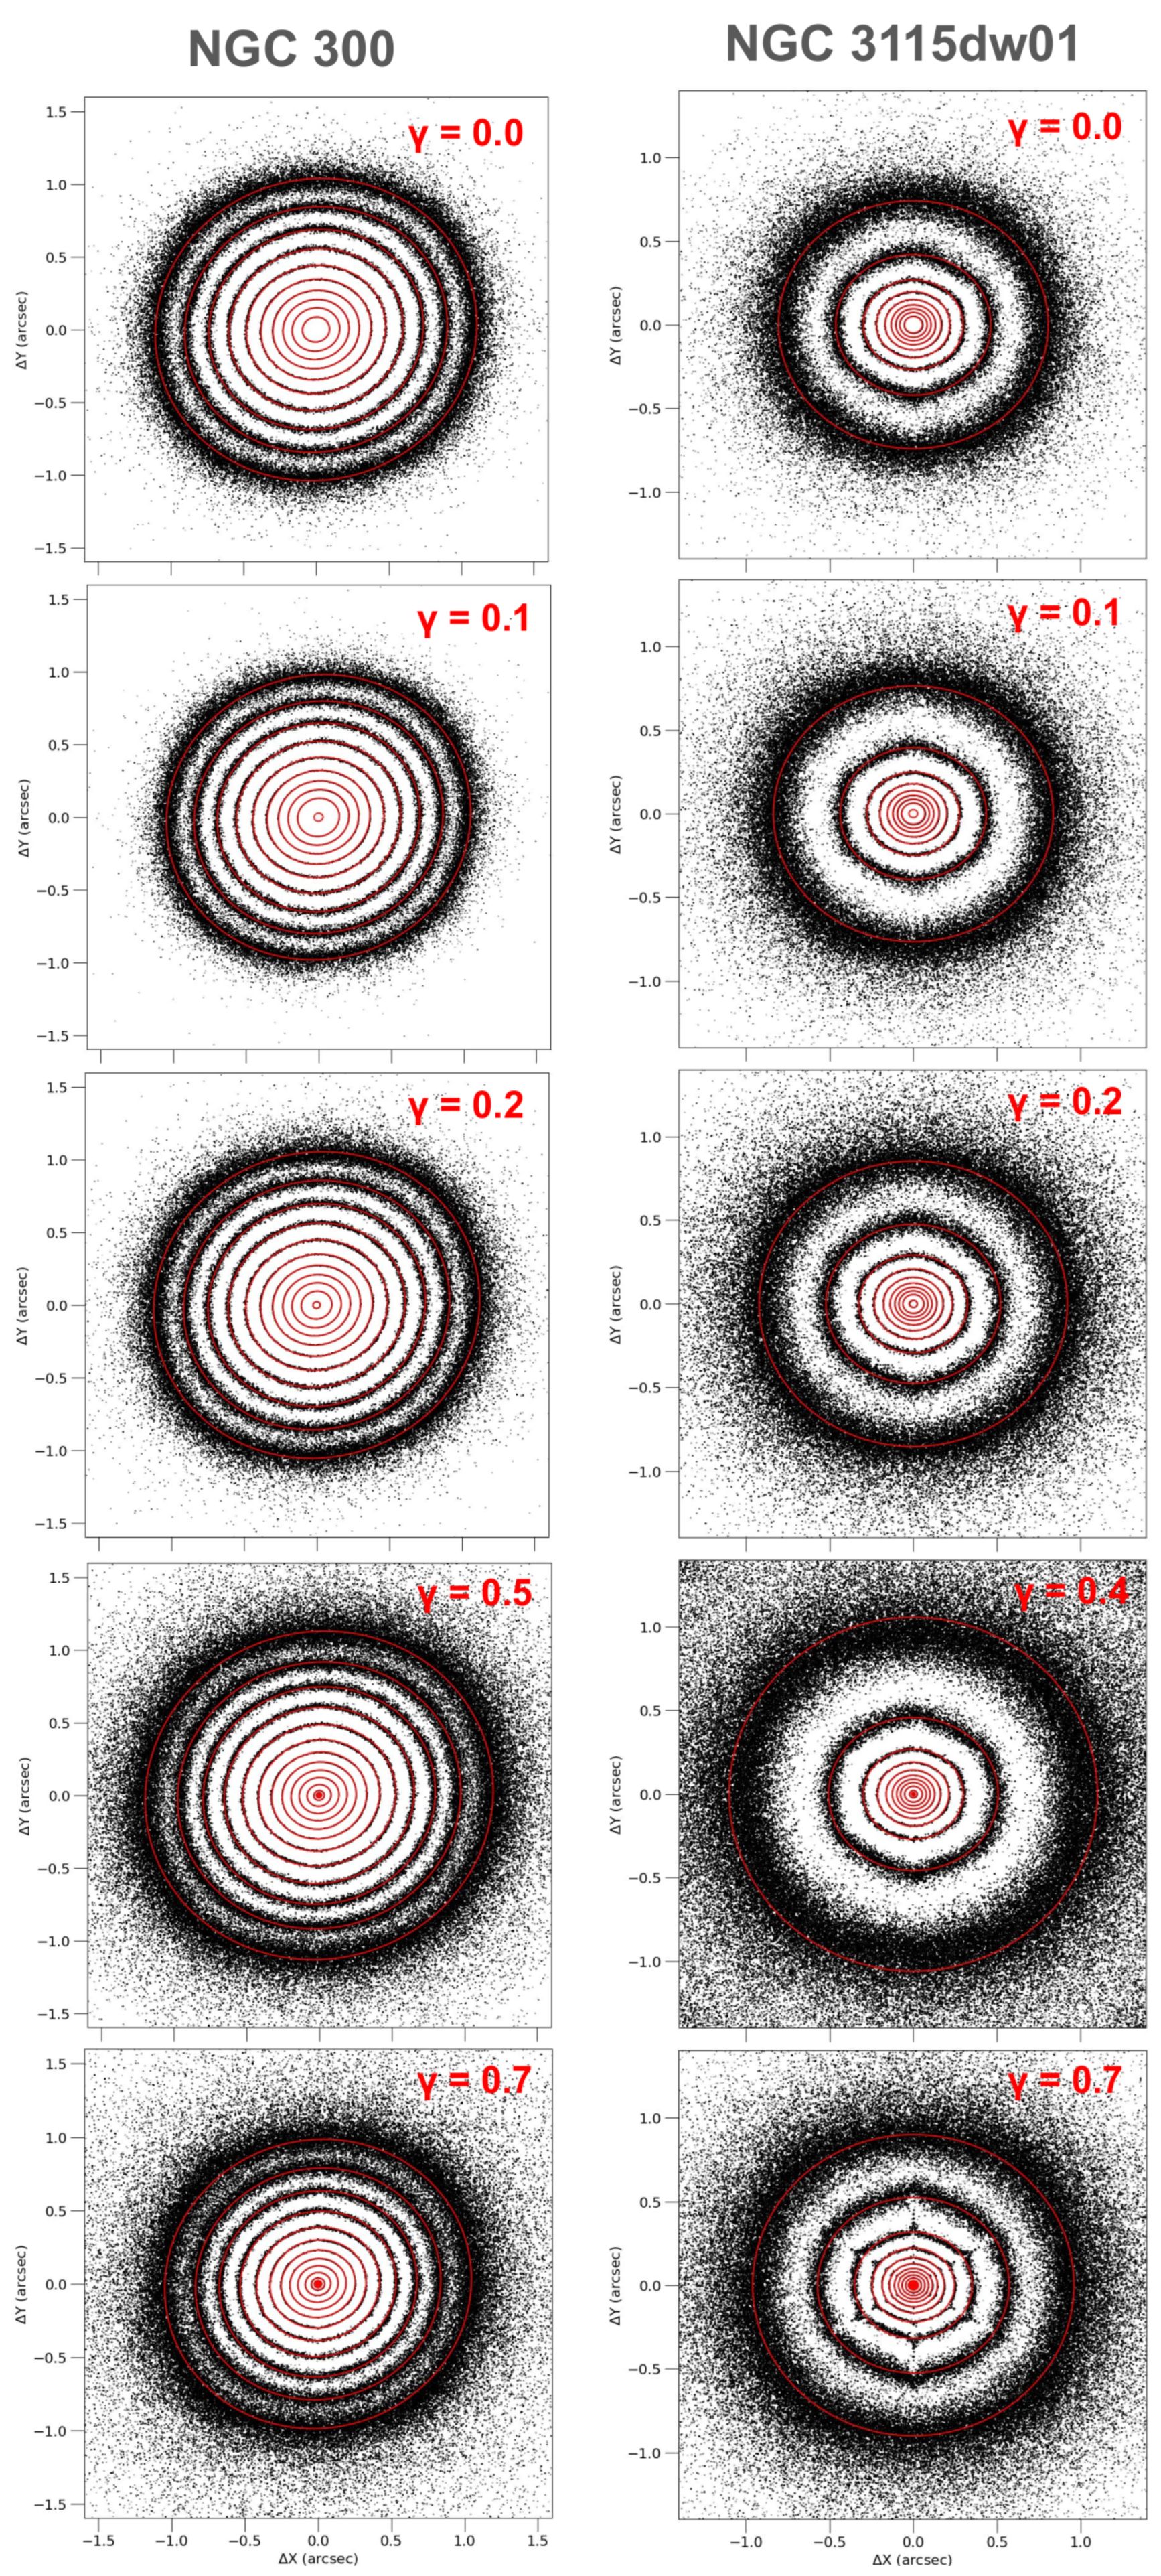
Figure 4.
The PDF obtained from the adamet MCMC optimization processes for the JAM models applied to the HSIM H-high kinematics and MICADO I-band images of NGC 300. These simulations were featured three (left column), (middle column), (right column), and four inner-power-law slopes: . Four constrained parameters are depicted as scatter plots illustrating their projected 2D PDF and histograms displaying their projected 1D PDF. There are the inset maps that depict the mock taken from N25, while the bottom maps represent the kinematic maps recovered/produced from JAM.
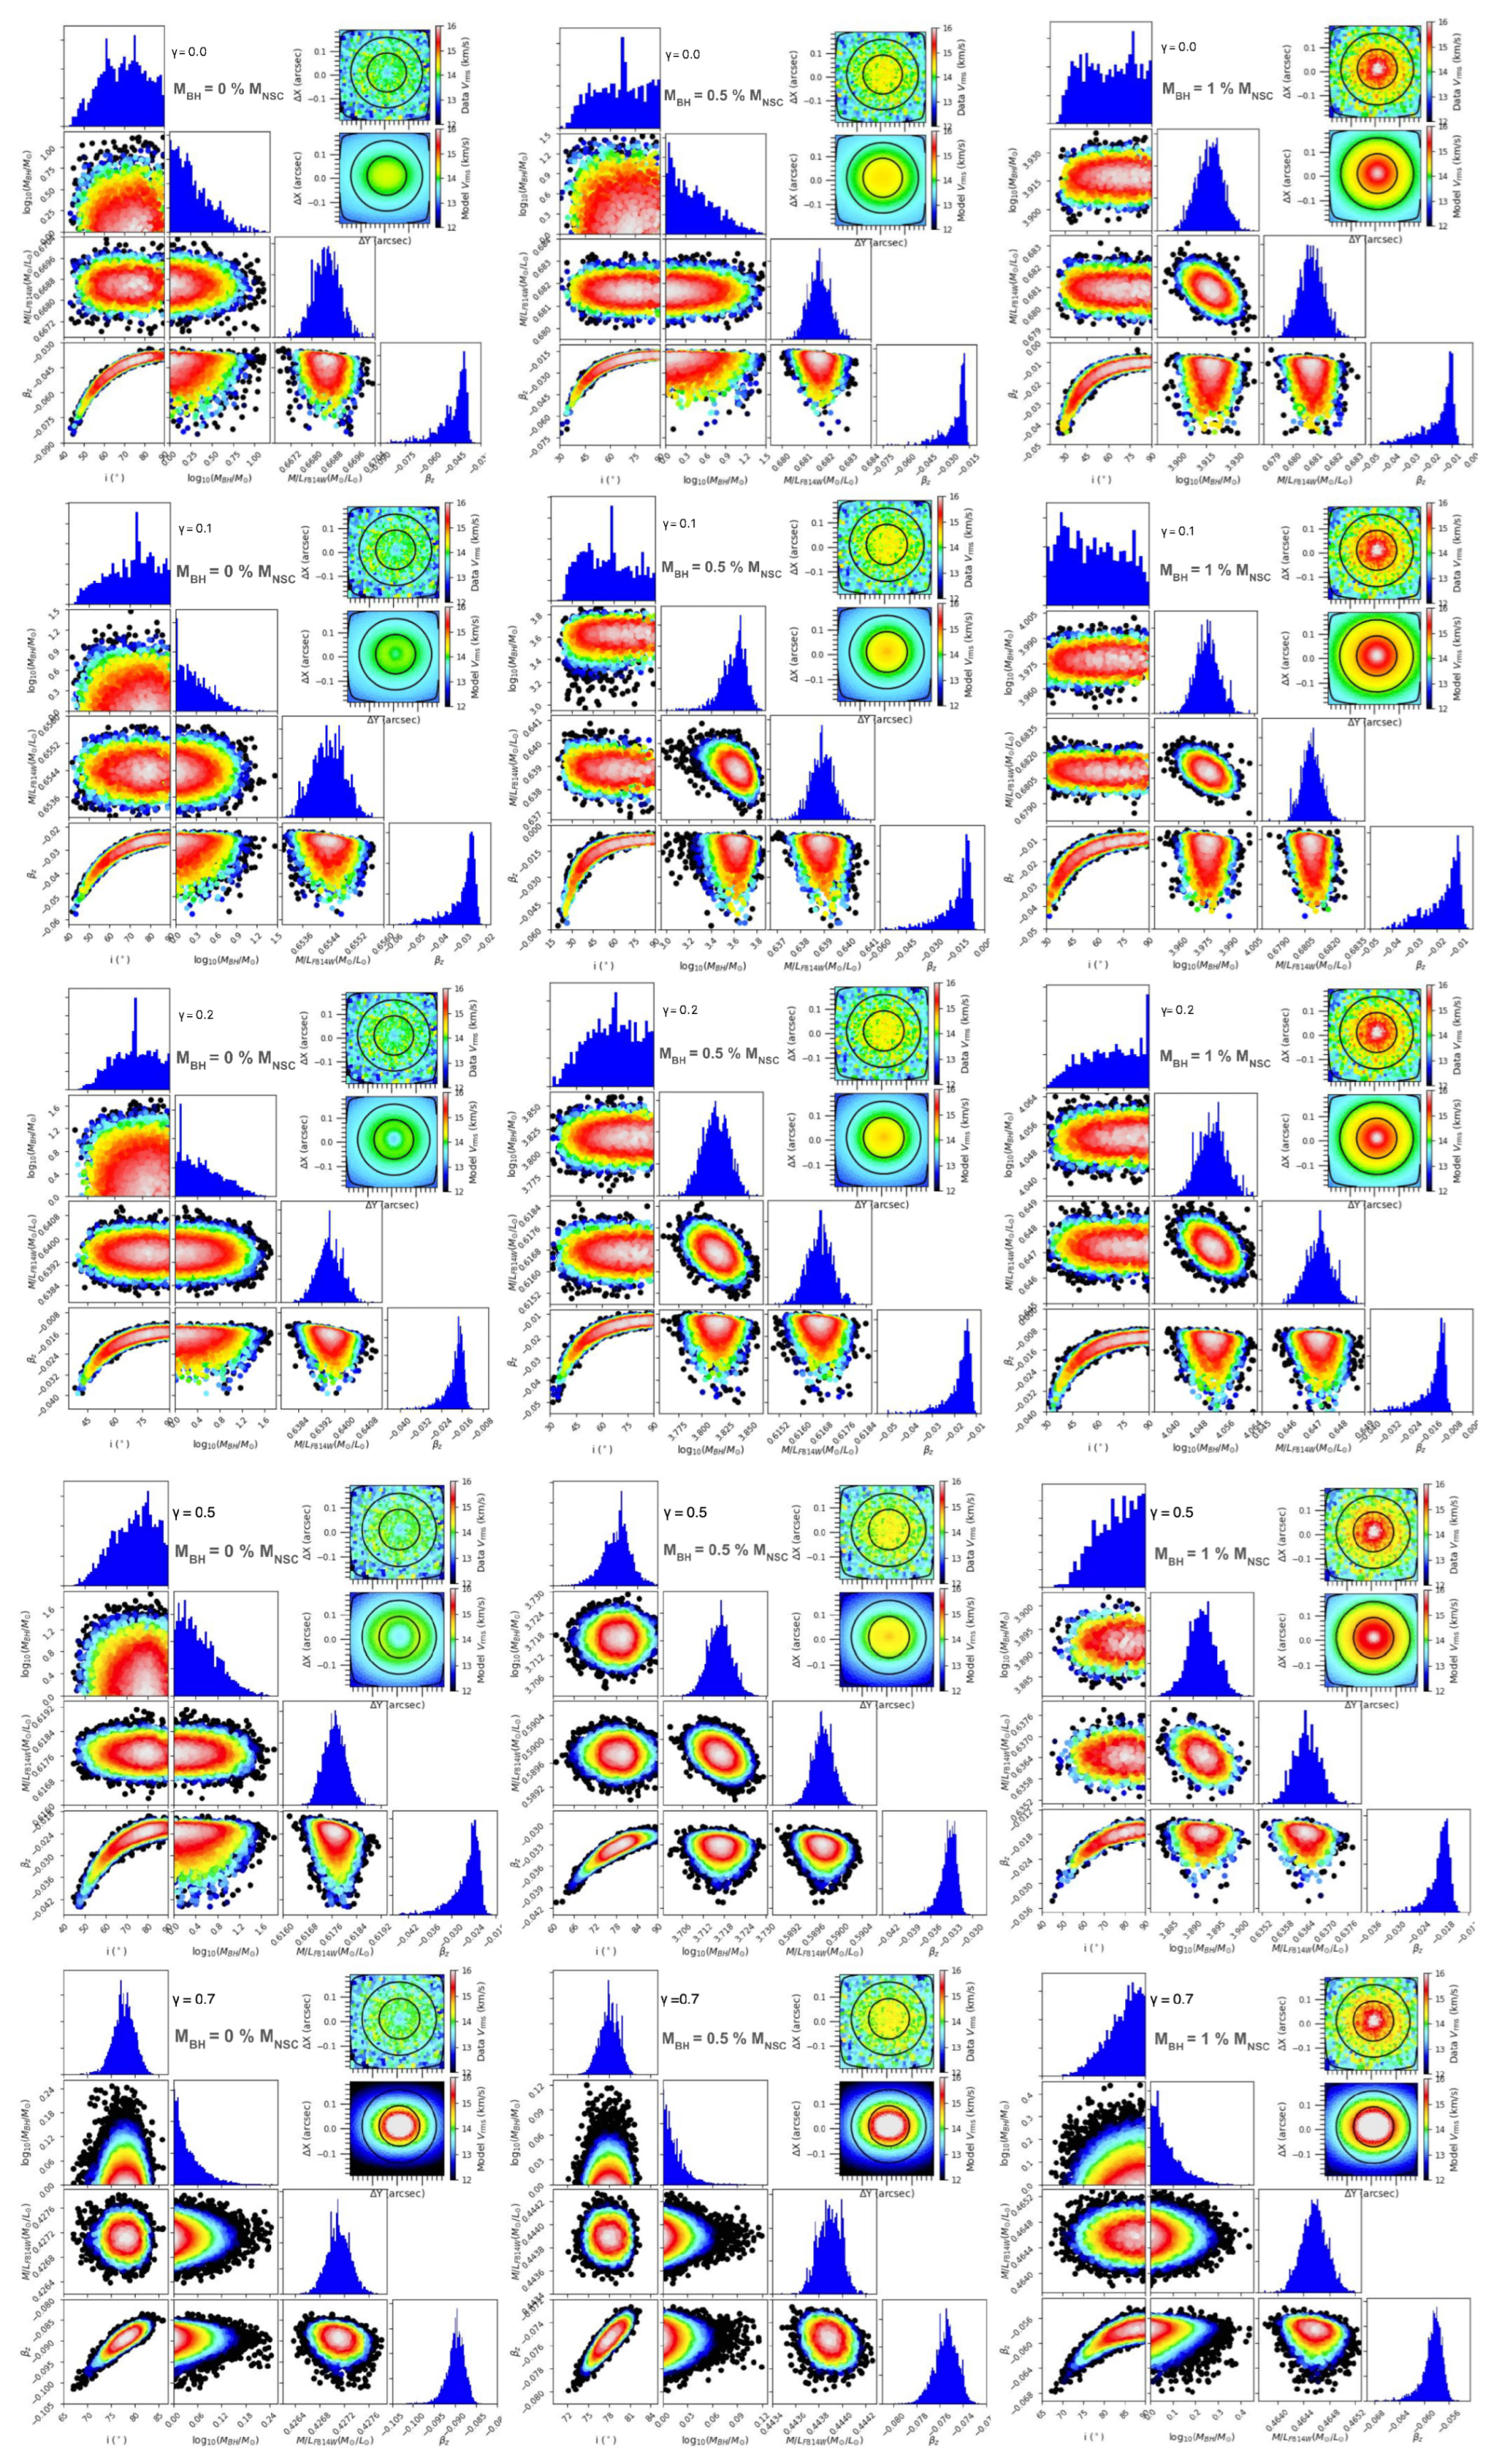
Figure 5.
Same as Figure 4 but for NGC 3115 dw01. These simulations were featured three (left column), (middle column), (right column), and four inner-power-law slopes: .
Figure 5.
Same as Figure 4 but for NGC 3115 dw01. These simulations were featured three (left column), (middle column), (right column), and four inner-power-law slopes: .
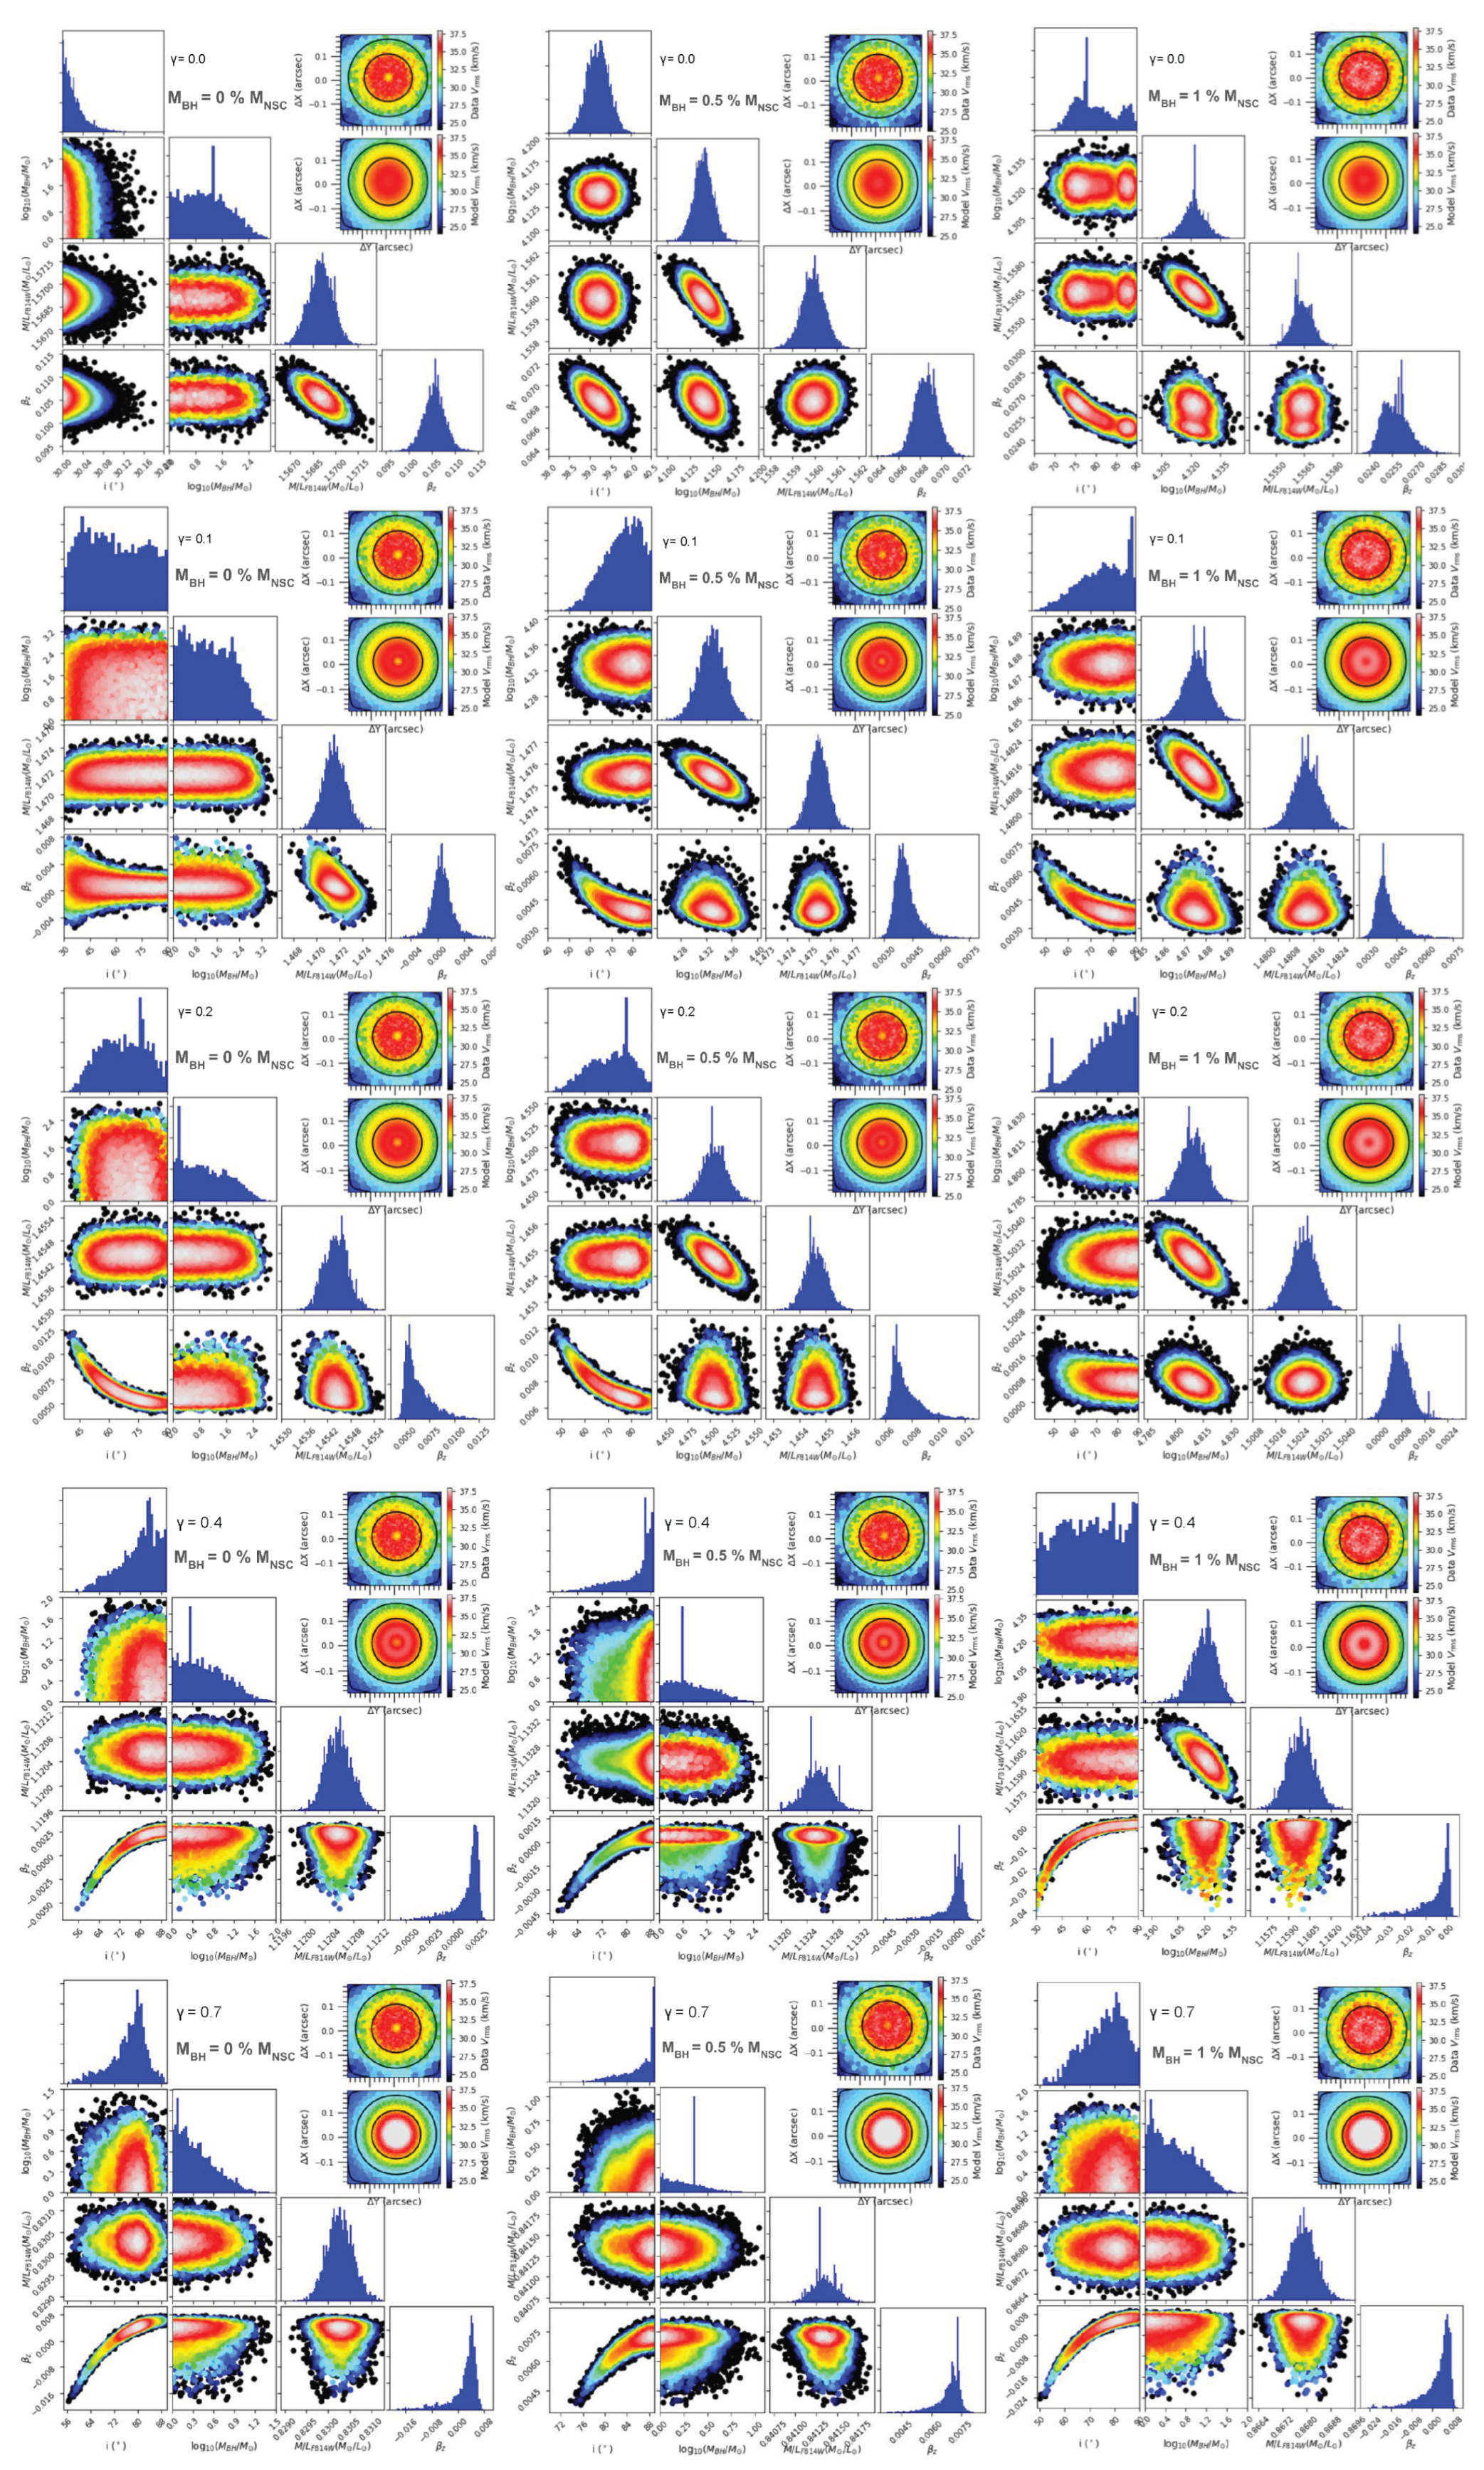

Table 1.
MGE models of NGC 300 and NGC 3115 dw01 modelled from SimCADO for mock MICADO I-band images
Table 1.
MGE models of NGC 300 and NGC 3115 dw01 modelled from SimCADO for mock MICADO I-band images
| (″) | (″) | |||||
|---|---|---|---|---|---|---|
| (1) | (2) | (3) | (4) | (5) | (6) | (7) |
| j | NGC 300 | NGC 300 | NGC 300 | NGC 3115 dw01 | NGC 3115 dw01 | NGC 3115 dw01 |
| – | ||||||
| 1 | 4.344 | 0.122 | 0.999 | 4.343 | 0.134 | 0.999 |
| 2 | 3.469 | 0.126 | 0.999 | 3.469 | 0.286 | 0.999 |
| 3 | 1.902 | 0.238 | 0.999 | 1.902 | 0.719 | 0.999 |
| 4 | 1.048 | 0.249 | 0.999 | 1.048 | 0.830 | 0.90 |
| 5 | 1.072 | 0.562 | 0.999 | 1.072 | 1.626 | 0.90 |
| 6 | – | – | – | −0.021 | 2.318 | 0.90 |
| 7 | – | – | – | 0.172 | 3.909 | 0.90 |
| 8 | – | – | – | 0.213 | 6.944 | 0.90 |
| 9 | – | – | – | −0.096 | 11.015 | 0.90 |
| – | ||||||
| 1 | 3.648 | 0.005 | 0.999 | 4.177 | 0.006 | 0.999 |
| 2 | 3.351 | 0.017 | 0.999 | 3.313 | 0.113 | 0.999 |
| 3 | 2.841 | 0.027 | 0.999 | 2.911 | 0.108 | 0.999 |
| 4 | 4.247 | 0.036 | 0.999 | 4.362 | 0.125 | 0.999 |
| 5 | 4.081 | 0.088 | 0.999 | 2.958 | 0.273 | 0.999 |
| 6 | 2.623 | 0.110 | 0.999 | 2.315 | 0.732 | 0.90 |
| 7 | 3.565 | 0.177 | 0.999 | 1.048 | 0.830 | 0.90 |
| 8 | 3.330 | 0.503 | 0.999 | 1.072 | 1.626 | 0.90 |
| 9 | – | – | – | −0.021 | 2.318 | 0.90 |
| 10 | – | – | – | 0.172 | 3.909 | 0.90 |
| 11 | – | – | – | 0.213 | 6.944 | 0.90 |
| 12 | – | – | – | −0.096 | 11.015 | 0.90 |
| (1) | (2) | (3) | (4) | (5) | (6) | (7) |
| j | NGC 300 | NGC 300 | NGC 300 | NGC 3115 dw01 | NGC 3115 dw01 | NGC 3115 dw01 |
| – | ||||||
| 1 | 4.218 | 0.005 | 0.999 | 3.954 | 0.004 | 0.999 |
| 2 | 3.848 | 0.017 | 0.999 | 3.890 | 0.012 | 0.999 |
| 3 | 3.443 | 0.035 | 0.999 | 4.374 | 0.111 | 0.999 |
| 4 | 3.927 | 0.080 | 0.999 | 3.517 | 0.231 | 0.999 |
| 5 | 3.921 | 0.101 | 0.999 | 2.315 | 0.732 | 0.90 |
| 6 | 3.876 | 0.128 | 0.999 | 1.048 | 0.830 | 0.90 |
| 7 | 2.829 | 0.135 | 0.999 | 1.072 | 1.626 | 0.90 |
| 8 | 3.850 | 0.176 | 0.999 | −0.021 | 2.318 | 0.90 |
| 9 | 3.600 | 0.285 | 0.999 | 0.172 | 3.909 | 0.90 |
| 10 | 3.341 | 0.562 | 0.999 | 0.213 | 6.944 | 0.90 |
| 11 | – | – | – | −0.096 | 11.015 | 0.90 |
| – | ||||||
| 1 | 5.574 | 0.005 | 0.999 | 4.823 | 0.005 | 0.999 |
| 2 | 4.664 | 0.017 | 0.999 | 4.425 | 0.017 | 0.999 |
| 3 | 4.116 | 0.046 | 0.999 | 4.281 | 0.073 | 0.999 |
| 4 | 3.179 | 0.059 | 0.999 | 4.408 | 0.101 | 0.999 |
| 5 | 4.193 | 0.089 | 0.999 | 2.456 | 0.103 | 0.999 |
| 6 | 3.804 | 0.117 | 0.999 | 3.468 | 0.250 | 0.999 |
| 7 | 3.993 | 0.167 | 0.999 | 2.315 | 0.732 | 0.90 |
| 8 | 2.077 | 0.332 | 0.999 | 1.048 | 0.830 | 0.90 |
Notes: MGE models with different inner-power-law slopes of the core-Sérsic function of NSCs. Each model has a specific number of Gaussian as shown in Column 1. Columns 2–4: The light-SB density, the Gaussian width along the galaxy major axis, and the ratio between the semi-minor and semi-major axes for NGC 300. Columns 5–7: Similarities of Columns 2–4 but for NGC 3115 dw01.
Table 2.
Best-fit JAM parameters and their uncertainties for three mock--IFS simulations and five inner-power-law slopes of NGC 300
Table 2.
Best-fit JAM parameters and their uncertainties for three mock--IFS simulations and five inner-power-law slopes of NGC 300
| Slope | Parameters | input M⊙ | input M⊙ | input M⊙ | ||||||
|---|---|---|---|---|---|---|---|---|---|---|
| (inner | (JAM) | Best-fit | 1 error | 3 error | Best-fit | 1 error | 3 error | Best-fit | 1 error | 3 error |
| power law) | model | (16–84%) | (0.14–99.86%) | model | (0.14–99.86%) | (16–84%) | model | (16–84%) | (0.14–99.86%) | |
| (1) | (2) | (3) | (4) | (5) | (6) | (7) | (8) | (9) | (10) | (11) |
| lg(/) | 0.007 | 0.056 | 3.916 | |||||||
| I (/) | 0.667 | 0.682 | 0.681 | |||||||
| 85.35 | 71.89 | 80.0 | ||||||||
| −0.039 | −0.020 | −0.010 | ||||||||
| lg(/) | 0.01 | 3.639 | 3.978 | |||||||
| I (/) | 0.654 | 0.639 | 0.681 | |||||||
| 79.34 | 84.87 | 74.61 | ||||||||
| −0.026 | −0.028 | −0.011 | ||||||||
| lg(/) | 0.009 | 3.816 | 4.052 | |||||||
| I (/) | 0.640 | 0.617 | 0.647 | |||||||
| 78.36 | 84.5 | 88.73 | ||||||||
| −0.016 | −0.013 | −0.011 | ||||||||
| lg(/) | 0.017 | 3.717 | 3.892 | |||||||
| I (/) | 0.618 | 0.560 | 0.636 | |||||||
| 80.43 | 79.98 | 80.1 | ||||||||
| −0.024 | −0.03 | −0.017 | ||||||||
| lg(/) | 0.001 | 0.001 | 0.005 | |||||||
| I (/) | 0.427 | 0.444 | 0.465 | |||||||
| 77.28 | 77.78 | 88.04 | ||||||||
| −0.090 | −0.076 | −0.058 | ||||||||
Notes: Column 1: The inner-power-law slopes of the core-Sérsic function of NSC. Column 2: The JAM’s parameters. Columns 3–5: The best-fit parameters associated with the case of no BH (MBH = 0 M⊙), 1σ (or 16–84%), and 3σ (or 0.14–99.86%) uncertainties provided by the adamet MCMC with JAM, respectively. Columns 6–8: Similarities of Columns 3–5 but for the case of input MBH = 5 × 10³ M⊙. Columns 9–11: Similarities of Columns 3–5 but for the case of input MBH = 104 M⊙. Modeling summary in this Table is associated with Figure 4.
Table 3.
Best-fit JAM parameters and their uncertainties for three mock--IFS simulations and five inner-power-law slopes of NGC 3115 dw01
Table 3.
Best-fit JAM parameters and their uncertainties for three mock--IFS simulations and five inner-power-law slopes of NGC 3115 dw01
| Slope | Parameters | input M⊙ | input M⊙ | input M⊙ | ||||||
|---|---|---|---|---|---|---|---|---|---|---|
| (inner | (JAM) | Best-fit | 1 error | 3 error | Best-fit | 1 error | 3 error | Best-fit | 1 error | 3 error |
| power law) | model | (16–84%) | (0.14–99.86%) | model | (0.14–99.86%) | (16–84%) | model | (16–84%) | (0.14–99.86%) | |
| (1) | (2) | (3) | (4) | (5) | (6) | (7) | (8) | (9) | (10) | (11) |
| lg(/) | 0.181 | 4.14 | 4.321 | |||||||
| I (/) | 1.569 | 1.56 | 1.556 | |||||||
| 30 | 39.25 | 76.05 | ||||||||
| −0.1 | −0.068 | −0.026 | ||||||||
| lg(/) | 0.393 | 4.331 | 4.875 | |||||||
| I (/) | 1.472 | 1.475 | 1.481 | |||||||
| 87.35 | 81.01 | 79.99 | ||||||||
| −0.001 | −0.004 | −0.004 | ||||||||
| lg(/) | 0.374 | 4.506 | 4.81 | |||||||
| I (/) | 1.454 | 1.455 | 1.503 | |||||||
| 74.87 | 77.68 | 87.94 | ||||||||
| −0.005 | −0.007 | −0.0006 | ||||||||
| lg(/) | 0.08 | 0.127 | 4.208 | |||||||
| I (/) | 1.121 | 1.133 | 1.16 | |||||||
| 82.77 | 88.81 | 86.43 | ||||||||
| −0.002 | −0.001 | −0.001 | ||||||||
| lg(/) | 0.042 | 0.026 | 0.135 | |||||||
| I (/) | 0.830 | 0.841 | 0.868 | |||||||
| 79.98 | 88.33 | 80.81 | ||||||||
| −0.004 | −0.007 | −0.006 | ||||||||
Disclaimer/Publisher’s Note: The statements, opinions and data contained in all publications are solely those of the individual author(s) and contributor(s) and not of MDPI and/or the editor(s). MDPI and/or the editor(s) disclaim responsibility for any injury to people or property resulting from any ideas, methods, instructions or products referred to in the content. |
© 2025 by the authors. Licensee MDPI, Basel, Switzerland. This article is an open access article distributed under the terms and conditions of the Creative Commons Attribution (CC BY) license (http://creativecommons.org/licenses/by/4.0/).
Copyright: This open access article is published under a Creative Commons CC BY 4.0 license, which permit the free download, distribution, and reuse, provided that the author and preprint are cited in any reuse.


