
Submitted:
22 December 2025
Posted:
26 December 2025
You are already at the latest version
Abstract
Augmented reality (AR)-based systems offer novel opportunities for digital support in physiotherapy and rehabilitation. This is especially relevant in the context of an aging population and the growing shortage of healthcare professionals.
This study employed a user-centered design with iterative prototype refinement and investigated the perceived usability and user acceptance of a prototype AR-based exercise therapy system (“STAR”) from the perspectives of patients and healthcare professionals across one iteration cycle.
Participants interacted with the system at two time points (T1, T2) using an AR headset. Usability was measured using the System Usability Scale (SUS), user acceptance via the Technology Usage Inventory (TUI).
A total of 15 participants (10 patients, 5 therapists) completed both testing sessions. The average SUS score improved from 54.5 (SD = 17.2) to 71.2 (SD = 16.1), reflecting a small but statistically significant increase in perceived usability (p < .001). The usability rating improved from “ok” to “good” according to the established SUS interpretation scale. On average there were improvements in scores for all scales of the TUI questionnaire.
The findings suggest that a user-centered development process can substantially enhance the perceived usability of AR systems, particularly among target populations with limited prior exposure to digital technologies.
Keywords:
augmented reality
; usability
; system usability scale
; rehabilitation
; sports therapy
; user-centered design
1. Introduction
Sports therapy is important for managing common orthopedic conditions in older adults, including chronic low back pain [1,2,3], osteoarthritis of the lower extremities [4,5,6]), articular cartilage damage [7], chronic neck pain [8,9], and subacromial pain syndrome and rotator cuff injuries [10,11]. However, the shortage of physiotherapy and sports therapy specialists in the European Union (EU) poses a substantial burden on national healthcare systems across the EU. According to Palm et al. [12] long waiting times due to limited physiotherapy coverage, physical distance and difficulties to reach the facilities and low perceived quality of treatments present burdens which affect elderly people – particularly in rural areas – to the greatest extent. The lack of access to therapy services leads not only to a perceived but to a measurable decline in care quality and reduced patient satisfaction, for example due to frequent therapist turnover [12,13].
This trend is occurring within the broader context of demographic change in the EU. The mean age of the population is 41.9 in the EU compared to 29.2 in the rest of the world leading to an increasing old age dependency ratio (people aged 65 or older compared to people between 15 and 64) [14]. Furthermore, healthcare coverage for the older population has been shown to be dependent on the economic status and margin of healthcare expenditures [15]. The present study was conducted as part of a digital health research and development project in a region in Germany that is strongly affected by demographic change with a predicted population decline by 13% over the next 12 years, alongside a significant increase in the proportion of elderly individuals underscoring the urgent need for innovative, digitalized healthcare solutions [16].
The significant potential of digital healthcare is increasingly acknowledged in scientific discourse [17].However, a holistic, patient-centered and scalable approach is lacking; according to the literature, there are also unanswered questions regarding design, architecture and use [18]. Current implementations remain largely limited to virtualizing therapist–patient communication, leaving many aspects of digital care, particularly gamification and individualized progression measurements and the possibility to apply therapy at any time and location, untapped. To date, musculoskeletal conditions represent the primary area of application for digital remote therapy in physiotherapy, which has been one of the first implementations of digital applications in the health sector [19].
Besides the teletherapy approach, traditional app-based home exercise programs are already in use and demonstrate that patients are generally receptive to digital therapy offerings and appreciate the perceived enhanced motivation through this new technology [20]. Mixed reality (augmented and virtual reality) applications have shown early evidence of improved physiological function and motivation – both critical for enhancing compliance in therapy in accordance with the Technology Acceptance Model [21] and achieving long-term health outcomes [22]. Augmented reality (AR) is particularly suited to adapt digital training programs to individual symptoms, physical capacity, and therapeutical context. Initial results in highly specialized AR health applications show promising outcomes, such as improved balance and reduced fall risk among geriatric patients [23] as well as short-term reductions of pain [21]. Therefore, AR health technology shows promising potential to extend the therapeutic options regarding active therapy, which forms an important part of prevention and rehabilitation of musculoskeletal conditions [24,25].
Although the end goal of the development is to enhance therapeutic effectiveness and patients’ health, the foundation of a successful AR-based health application is its usability and user acceptance. These, in turn, strongly dependent on how users perceive this new technology. The Technology Acceptance Model (TAM), originally developed by Davis et al. [26], provides a robust theoretical framework for understanding and predicting technology adoption in various domains, including healthcare. TAM posits that two core perceptions – perceived usefulness (the degree to which a person believes that using a particular system will enhance their performance) and perceived ease of use (the degree to which a person believes that using the system will be free of effort) – directly influence users’ attitudes and intentions to use new technologies. Since its original formulation (TAM 1), which focused on perceived usefulness and perceived ease of use as primary determinants of technology adoption, the model has been expanded and refined. TAM 2 [27] incorporates additional social influence processes (such as subjective norm, voluntariness, and image) and cognitive instrumental processes (including job relevance, output quality, and result demonstrability), offering a more comprehensive view of organizational and professional contexts. TAM 3 [28] further integrates factors influencing perceived ease of use, such as computer self-efficacy, perceptions of external control, computer anxiety, and perceived enjoyment. Understanding and addressing these determinants during early development stages is critical for ensuring that potential users – both patients and therapists – are willing and able to use such a system. Currently, evidence on how the early development process of AR health applications is shaped by the TAM factors is sparse. Therefore, this study guided and monitored the early development of an AR-based sports therapy application focusing on factors that can improve user experience and user acceptance and should thus be central to the later stages of the development.
The present study is part of the interdisciplinary research project (“STAR” – Sports Therapy with Augmented Reality) which aims to enable the use of digital exercise programs in physiotherapeutic care through the application of AR technology. The study is grounded in the theoretical framework of the TAM and took place during the initial phases of the development process. The focus was on the development of the technical background, software and artificial intelligence model, hence focusing on the improvement of usability and user acceptance during an iterative development cycle.
With the STAR system, patients can perform sports therapy exercise programs under the guidance of a virtual therapist. To support this, comprehensive exercise catalogs are being developed for orthopedic conditions based on the latest findings in sports medicine. These catalogs are designed for the general population – regardless of age or physical condition – and are particularly relevant for the aging population (e.g., knee osteoarthritis). Therefore, a central focus of the development process is ensuring intuitive usability without requiring prior technical knowledge.
The STAR system utilizes state-of-the-art motion capture technology to evaluate patient movements and exercise performance in real time. An AI-supported system will be implemented and is intended to identify faulty or potentially harmful movement patterns, track progress, and, over time, independently integrate individualized exercise progressions or regressions into the program, approximating the therapeutic quality of one-on-one care. Both the exercises and the corresponding corrective feedback are delivered via a three-dimensional avatar (virtual therapist). One major advantage of AR technology over virtual reality (VR) is that 3D animations are projected into the user's real environment, allowing patients to remain aware of their surroundings and use training equipment if needed. This feature facilitates a smooth transition from supervised therapy sessions to independent, AR-assisted home training, effectively bridging the gap between initial therapy and ongoing independent exercise.
The development process follows a user-centered approach according to Farao et al. [29], with the aim of maximizing benefit for both healthcare professionals and patients. The central research questions of this study stem from this objective:
First, the study investigates whether perceived system usability improves across the first two development cycles, measured using the System Usability Scale (SUS). Second, it examines changes in user acceptance based on the Technology Usage Inventory (TUI). The findings are intended to inform the target group–oriented development and optimization of the STAR system.
2. Materials and Methods
2.1. Study Design
The study employs a user-centered, exploratory design featuring iterative development and evaluation. Its methodological foundation integrates elements from the Information Systems Research Framework [30] and the Design Thinking approach [31], as recommended by Farao et al. [29] for health-related technologies.
The whole STAR project is designed as a monocentric investigation and includes four data collection points (T0–T3) which are visualized in figure 1. The present study evaluated the results from the first three phases (T0, T1 and T2), which corresponded to one successive iteration of the STAR prototype, featuring functional enhancements. Data collection and analysis were guided by the principles of user-centered design as outlined in DIN EN ISO 9241-210 [32] and included two different quantitative instruments (System Usability Scale [SUS] published by Brooke [33] and Technology Usage Inventory [TUI] published by Kothgassner et al. [34]).
In order to enhance the rigor and transparency of the reporting methods and results of the interview, the Consolidated Criteria for Reporting Qualitative Research (COREQ) Checklist [35] was adhered to.
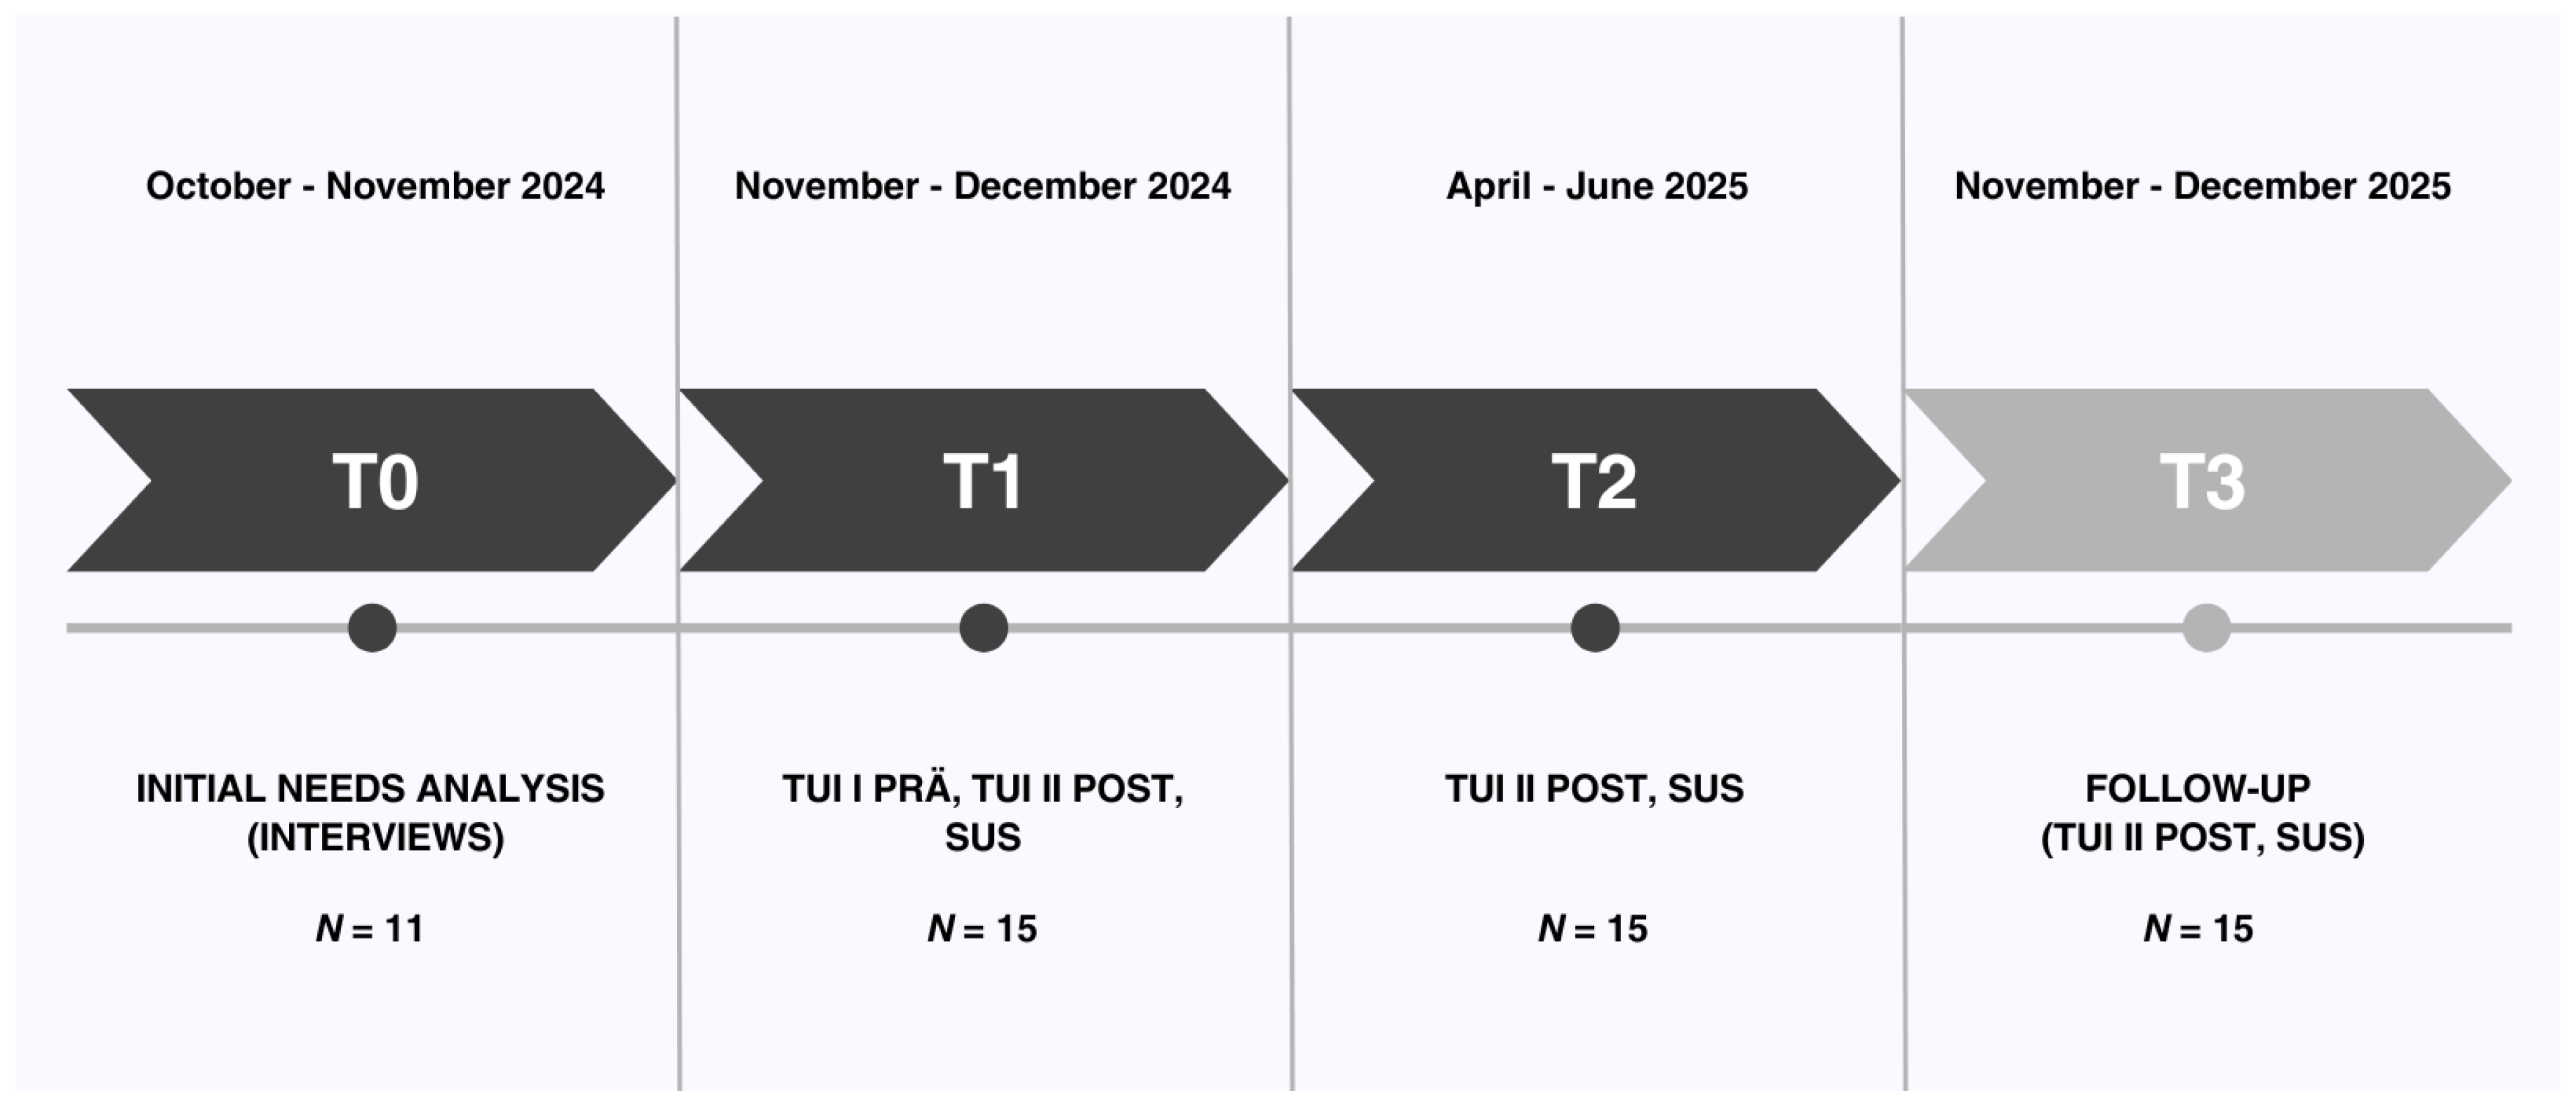
Figure 1.
Timeline for the two iteration cycles. The current study took place at T0, T1 and T2.
2.2. Participants
For prior need analysis (T0), participants were recruited via purposive sampling: MB invited patients (aged ≥ 50 years, currently receiving treatment for chronic back pain) and physiotherapists (any age, minimum two years’ clinical experience). In total, seven patients and four physiotherapists completed interviews. No participants dropped out.
For iteration loops, participants were chosen to represent potential user groups. A total of 15 individuals from two predefined target groups were recruited by NK and JB for the study: patients (n = 10), defined by being currently enrolled in some form of physiotherapy or exercise therapy, and sports/physiotherapists (n = 5). No participants dropped out throughout the study. Since the study was exclusively about usability and user acceptance, did not include any practical exercise program and hence no measures of therapeutic quality, patients were not required to be classified within a predefined category of musculoskeletal problems. However, they needed to be enrolled in an active exercise or physiotherapy program either at a healthcare facility, at a gym or at home. Recruitment was conducted through cooperating healthcare facilities. Eligibility criteria included a minimum age of 18 years and willingness to test the system on two separate dates and complete two subsequent questionnaires. No prior digital experience or knowledge of augmented reality was required for participation. Dividing participants into two groups allowed for the comparison of professional and experience-based differences in perceived usability and user acceptance. All participants provided written informed consent. The study was reviewed and approved by the responsible ethics committee at Martin Luther University Halle-Wittenberg (protocol code: 2024-085; date of approval: 16.07.2024).
2.3. Intervention
The intervention under evaluation involves the development – with focus on the technical aspects of the system – of the STAR system with its hardware platform, the Microsoft HoloLens 2, an optical see-through AR headset that overlays digital content onto the real-world environment. The system’s core component is a virtual 3D therapist that demonstrates movement exercises and provides audiovisual support as users perform them. Although the artificial intelligence real-time feedback will only be part of the future development process of the system, an interactive pain scale is already incorporated: users are regularly prompted to report their current pain intensity. If a pain level greater than 3 (on a scale from 0 to 10) is reported, the system automatically activates a feedback algorithm that offers a simplified version of the exercise or a modified regression program with less strenuous movement variations. This allows for personalized training adaptation based on both physical capacity and the subjective perception of pain.
2.4. Testing Procedure
All tests took place in the healthcare facilities (physio therapy or sports therapy practices) in individual settings with one project employee (NK or JB) and one study participant each, so that individual support was guaranteed. Information about the testing procedure, including a written declaration of consent, was provided in advance.
First, to inform the development of the (AR)–based sports therapy system, an exploratory needs analysis (T0) was conducted prior to the formal usability study. Although this analysis did not adhere to rigorous scientific standards, it provided valuable insights on user expectations that can be integrated into the development process of the system.
A qualitative, semi-structured interview approach was selected to capture the perspectives of both end users (patients) and clinicians (physiotherapists). In October and November 2024, interviews (30–45 min each) were conducted either in person or via video conference. Participants first viewed a brief demonstration of a conceptual AR exercise module (static screenshots and narrated walkthrough), then responded to open-ended questions. The interviews were recorded for subsequent transcription.
Second, two iteration loops were conducted to test and evaluate technical functions of the STAR system (T1 and T2) separately for patients and sports/physiotherapists. Before the T1 test, the pre-version of the TUI questionnaire (TUI I) was completed. This was no longer necessary at T2. In the first test iteration (T1), the focus was on basic functionalities such as navigation, control (via hand and voice commands), and the initial display of movement exercises. At the beginning, the functionality of the application and the operation of the AR glasses were explained. The participants then put on the glasses and received verbal instructions from the project employee (e.g. “Please click on the top menu item.”) to make it easier to get started with the application. After selecting a sample exercise, the test subjects viewed the displayed exercise and tried out the various functions in parallel, such as rotating the avatar or selecting the pain scale using voice commands. After the first iteration loop, the STAR system was adapted according to user feedback. In the second iteration (T2), the system was expanded to include an interactive tutorial, improved display of the exercises including edited voiceover explanations, and had undergone further technical improvements. The procedure at T2 was therefore identical to T1 with the exception that the participants started by viewing and interacting with the tutorial first before viewing the exercises. After the second feedback of participants, the system was once again adapted.
During the two tests T1 and T2, the test subjects did not yet perform any exercises themselves, but were in an observer role in order to evaluate the technical functionality of the system. The test subjects were given sufficient time to test the application and to view all menu items and various exercise instructions. Verbal feedback that was given during the testing was noted by the project employees. At the end of the test, the participants first had the chance to give additional feedback that arised after finishing the testing. Such feedback was also noted by the project employees. Furthermore, they completed the post version of the TUI questionnaire (TUI II) and the SUS questionnaire.
2.5. Measures
2.5.1. Prior Needs Analysis
The interview guidelines (in German language) were developed through a structured, multi-stage process combining theoretical groundwork and iterative refinement. The aim was to establish a tool that enabled systematic and comparable data collection while accounting for both patient and professional perspectives.
First, a focused review of the literature and existing interview instruments in the field of chronic back pain was conducted to identify relevant thematic domains and established question formats. Building on this, the project team generated additional items during a structured brainstorming phase, with emphasis on personal challenges, expectations regarding digital health applications, and potential facilitators and barriers to AR-based therapy.
The resulting pool of questions was consolidated to remove redundancies and prioritize content. Two guideline versions were then created: one for patients, focusing on therapy experiences, self-management, and openness toward digital interventions, and one for physiotherapists, concentrating on feasibility, clinical integration, and requirements for digital support. To ensure comprehensibility, technical terms were simplified and scenario-based prompts (e.g., real-time feedback during exercises) were included.
Draft versions of the guidelines were iteratively refined via structured team feedback. Adjustments concerned the order, clarity and thematic focus of questions to ensure alignment with broader project objectives.
2.5.2. System Usability Score (SUS)
The SUS captures users’ subjective assessments of a system’s usability. It is designed to be technology-agnostic, making it applicable across a broad spectrum of systems and technological contexts. The SUS comprises ten items, evenly divided into five positively worded and five negatively worded statements, each rated on a five-point Likert scale. Responses are used to derive individual item scores, which are subsequently converted into an overall SUS score ranging from 0 to 100.
The scoring procedure involves adjusting responses based on item orientation: for positively worded (odd-numbered) items, one is subtracted from the raw score, whereas for negatively worded (even-numbered) items, the raw score is subtracted from five. For instance, a response of 4 to item 1 results in a score of 3 (4 − 1), while a response of 2 to item 2 yields a score of 3 (5 − 2). The adjusted scores are then summed and multiplied by 2.5 to obtain the final SUS score.
A score of 68 or higher is generally interpreted as indicative of acceptable usability. To facilitate interpretation, previous research has introduced an adjective rating scale that qualitatively classifies SUS scores [36]. This scale ranges from "outstanding" (90–100) to "very poor" (0–34), thereby offering a more intuitive understanding of usability outcomes.
2.5.3. Technology Usage Inventory (TUI)
The TUI is designed to evaluate an individual's intention to use a specific technology and is grounded in the Technology Acceptance Model (TAM). Intention to use is conceptualized as a multifaceted construct influenced by a range of explanatory variables. In alignment with TAM 2 and TAM 3, the TUI incorporates both technology-specific and psychological factors. Accordingly, it expands upon the core acceptance constructs of TAM 1—such as perceived usability, usefulness, immersion, and accessibility—by including additional psychological dimensions such as technology anxiety, curiosity, interest, and skepticism.
With the exception of the technology anxiety and interest scales, all items are tailored to the specific technology under evaluation. Each scale comprises three to four items, rated using a 7-point Likert scale. Additionally, a separate ninth scale captures intention to use through three items, each rated via a 100 mm visual analog scale. Altogether, the TUI comprises 33 items and is modular in structure, allowing for the exclusion of individual scales or adaptation of item wording (e.g., incorporating the name of a specific technology).
In the present study, all scales were utilized. For each scale, item responses are summed to yield a total score, with possible values ranging from 1 (lowest expression of the construct) to 21 (for 3-item scales) or 28 (for 4-item scales). For the intention to use scale, the response position on each visual analog line is measured as the distance (in millimeters) from the right endpoint (representing complete rejection) to the middle of the cross. These three distances are then summed to generate a maximum possible score of 300.
2.6. Data Analyses
2.6.1. Qualitative Analysis
For the initial needs analysis (T0), interview recordings were transcribed verbatim, anonymized, and checked for accuracy. The analysis followed the structured coding approach described by Gioia et al. [37]. First, the research team systematically reviewed the transcripts to identify relevant statements and insights. These excerpts were transferred as direct quotes into a shared Excel matrix, accompanied by the corresponding interview number and line reference to ensure traceability (first-order concepts). In a next step, related first-order concepts were grouped into broader categories (second-order themes), which were then further consolidated into overarching aggregate dimensions. To capture the salience of each theme, the frequency of participants mentioning a given category was documented.
Qualitative feedback at T1 and T2 was documented during and after both testing sessions. Participants were encouraged to comment spontaneously while interacting with the STAR prototype as well as to share their impressions in a brief discussion following each session. All feedback was noted in written form by project staff to ensure comprehensive capture of user perspectives.
Subsequently, the documented comments were organized thematically according to recurring areas of concern and suggestion (safety, content, technological aspects). This allowed the research team to identify central patterns across participants rather than focusing on isolated statements.
2.6.2. Quantitative Analysis
In the first step, all questionnaires were manually analyzed according to the official manuals [38,34]. For each participant the according questionnaire was manually scanned and all data was transferred into an excel sheet. For the SUS score, this included the scores for each of the 10 items. For the TUI it included the scores for every item and a linear scale for the items of the subscale intention to use for which a ruler was used to measure the distance from the right end of the line to the middle of the cross that the participant had marked on the line. The resulting data set was analyzed with the statistical programme SPSS statistics (version 30; IBM corp.). To answer the question whether TUI and SUS factors differ between the two testing points, paired-sample t-tests were performed. For the TUI scores Cohen's d was calculated as a measure of effect size.
However, the sample size was small meaning that statistical analyses should be viewed with caution and it should be taken into account that the interpretation is therefore limited. Thus, an additional descriptive analysis was conducted to describe improvements in the acceptance levels of the TUI and SUS scores.
3. Results
The participant sample for the initial needs analysis consisted of patient group that was homogenous in age (M= 64.3; SD= 3.58) and a more heterogenous physiotherapist group (M= 37.5; SD= 16.88)
The participant sample for the iteration loop (T1 and T2) was heterogeneous in terms of age (M= 46.6; SD= 19.42 years) and included patients and physio therapists or sport therapists both with and without regular use of digital technologies.

Table 1.
Demographic data of the participants that took part in the initial needs analysis.
| Mean Age (SD) | % male | % female | |
| Patients (n = 7) | 64.3 (SD = 3.58) | 43 | 57 |
| Therapists (n = 4) | 37.5 (SD = 16.88) | 75 | 25 |
Table 2.
Demographic data of the participants that took part in the iteration loop.
| Mean Age (SD) | % male | % female | |
| Patients (n = 10) | 54.1 (SD = 19.32) | 40 | 60 |
| Therapists (n = 5) | 31.6 (SD = 7.67) | 60 | 40 |
3.1. Qualitative Results
As key findings four principal dimensions emerged from these interviews which are presented in Table 3.
The findings from these interviews, which confirmed most of the ideas that were already planned to be implemented, served as part of the foundation for the first prototype which was presented to the participants of the iteration loop at T1. The participants reported preferring hand gestures and voice commands over complex menus which was in line with the planned control for the prototype. They highlighted the importance of a visually appearing avatar for increased engagement. Thus, improving the optics of the avatar is a central element throughout the whole development process of the prototype. Engagement could further be enhanced by implementing tracking metrics such as interactive session summaries, which was feedback that could not directly be realized but is planned for the next stages of the prototype development. Conversely, the desired option to pause exercises and get a modified version in response to reporting discomfort was already partially integrated throughout the iteration loop via the pain scale with its according regression algorithm. In line with the feedback of the patients at T1 and T2 the live feedback and according adjustments of the exercise based on real-time motion data was seen as a central element and will be part of the future development of the prototype.
3.1.1. Initial User Feedback After T1
As part of the first testing at T1, feedback was collected from participants following their use of the first version of the system. Based on this feedback and the results of the SUS and TUI, the system was further developed and optimized by T2, with the goal of enhancing usability and user acceptance.
The feedback by patients and therapists that has served as the foundation of the adaptations between T1 and T2 is summarized in Table 4.
The qualitative feedback given by the participants was documented and revealed two main areas of criticism. First, most users had technical difficulties controlling the application, especially applying the gesture control. Several technical bugs (e.g. avatar stuck in one corner of the room) occurred which decreased the user experience. Therapists had less problems on the technical side than patients and were better able to control the application but still agreed that this was an area with major need for improvement. Therapists warned that the currently used hardware is too uncomfortable and could have negative effects on therapeutic quality due to the limitations in peripheral vision by the big AR glasses. Patients reported feeling lost and needed more guidance for the general control and navigation of the application as well as from a therapeutic side. The exercise demonstrations were reported to start too abrupt and to be too quick to follow. Therapists emphasized the need for the live feedback to correct potential movement errors. Taken together, both groups reported that more guidance was needed and that the technological quality and reliability needed to be significantly improved.
On the other hand, both groups reported seeing great potential in the system, particularly after implementation of the AI-feedback and after switching to a more convenient hardware. Therapists highlighted that the system could help bridge the gap between the traditional physio or sports therapy sessions and long-term adherence to an independent exercise program. Patients highlighted the potential for a motivational training experience through interactions with the avatar which would be a major progress from traditional app-based therapy which often lacks interactive and gamified elements.
3.1.2. Adaptations Throughout the Iteration Cycle from T1 to T2
The adaptations based on the initial feedback included the integration of a multi-part tutorial in which the basic controls were explained through short interactive video segments using gesture and voice input. In addition, the exercise animations were extensively revised and largely re-recorded to eliminate display errors, and the accompanying voiceover explanations were improved for greater clarity. The voice control functionality was significantly expanded, including the option to rotate the virtual therapist within space to allow exercises to be viewed from different angles. Technical bugs were addressed to create a smoother user experience. The optics of the avatar were improved to achieve a more realistic and human-like experience (see figure 2). From a content perspective, three exercises were combined into a separate demo program, which simplified the testing process and enabled the project team to focus on implementing the aforementioned improvements with an emphasis on quality over quantity in the selected exercises. This was done with the objective of increasing usability and user acceptance through the implemented modifications.
3.1.3. User Feedback after T2
The cycle was centered around technical improvements which reflected in the feedback given by the users at T2. Both groups reported a higher user experience due to a reduction in technical bugs and the implementation of an interactive tutorial which helped in getting used to the novel gesture and voice control. The redesigned exercise animations were reported to be easier to follow which led to a perceived increase in safety due to a feeling of better guidance by the avatar. The revised looks of the avatar were received as more human-like and therefore received positive feedback.
In accordance to the goals of the first iteration cycle no fundamental changes like a complete hardware change or the implementation of the AI-feedback were made which explains that some initial points of criticism did not change from T1 to T2. The feedback after T2 is summarized in Table 5.
3.1.4. Adaptations Throughout the Iteration Cycle from T2 to T3
Before the next testing point (T3) is set to take place in November/December 2025 the avatar will further be modified. Figure 2 shows the first concept for the new version.
Furthermore, new motion capturing animations will be recorded to achieve a more fluent user experience by guiding the user through the full program. This will include short intermediate sequences in which the avatar presents personalized feedback and explains the next steps. This will enhance the immersion and the identification with the avatar and the application and allow for a more fluent user experience compared to the current state of the application in which there is a relatively abrupt switch between one exercise to the other.
Several aspects from the initial feedback could not be applied into practice before T2 but are scheduled before T3. This includes a major hardware change from the relatively big and uncomfortable glasses used at T1 to a more recent model that matches the dimensions of regular glasses, which is expected to further increase the user experience. This hardware switch was not possible during the first two iteration cycles because the new glasses have not been published before T2.
The implementation of a fully functional artificial intelligence feedback unit was not part of the project goals in the first stage from 2024 to 2025 but is planned for the next stage of the project from 2026 to 2028. It is the central element for the prototype and usability and user acceptance can be expected to increase significantly after its implementation. All participants agreed that the live feedback is the main feature of the prototype that is critical for its functionality. Without it, there would be no reason to prefer it over standard care or currently available digital health and therapy applications.
The legal disclaimers – important feedback by the therapists – will also be integrated into this new version in the second project stage. Until now it was not needed because the prototype was exclusively tested outside of therapeutic use.
After T1 one therapist suggested to replace the pain scale with a rating of perceived exertion to avoid introducing the concept of pain to patients during exercise program; however a decision was made against this change by the project team because validated pain scales are needed to quantify clear cut-off points for the artificial intelligence feedback (e.g. a number higher than 4 triggers a reaction by the system to prevent harm to the patient).
3.2. Quantitative Results
3.2.1. SUS Score
The aim of the analysis was to evaluate changes in perceived system usability over time using the SUS. Fifteen participants (10 patients and five therapists) completed the SUS questionnaire after interacting with the system at two different time points, enabling a within-subject comparison.
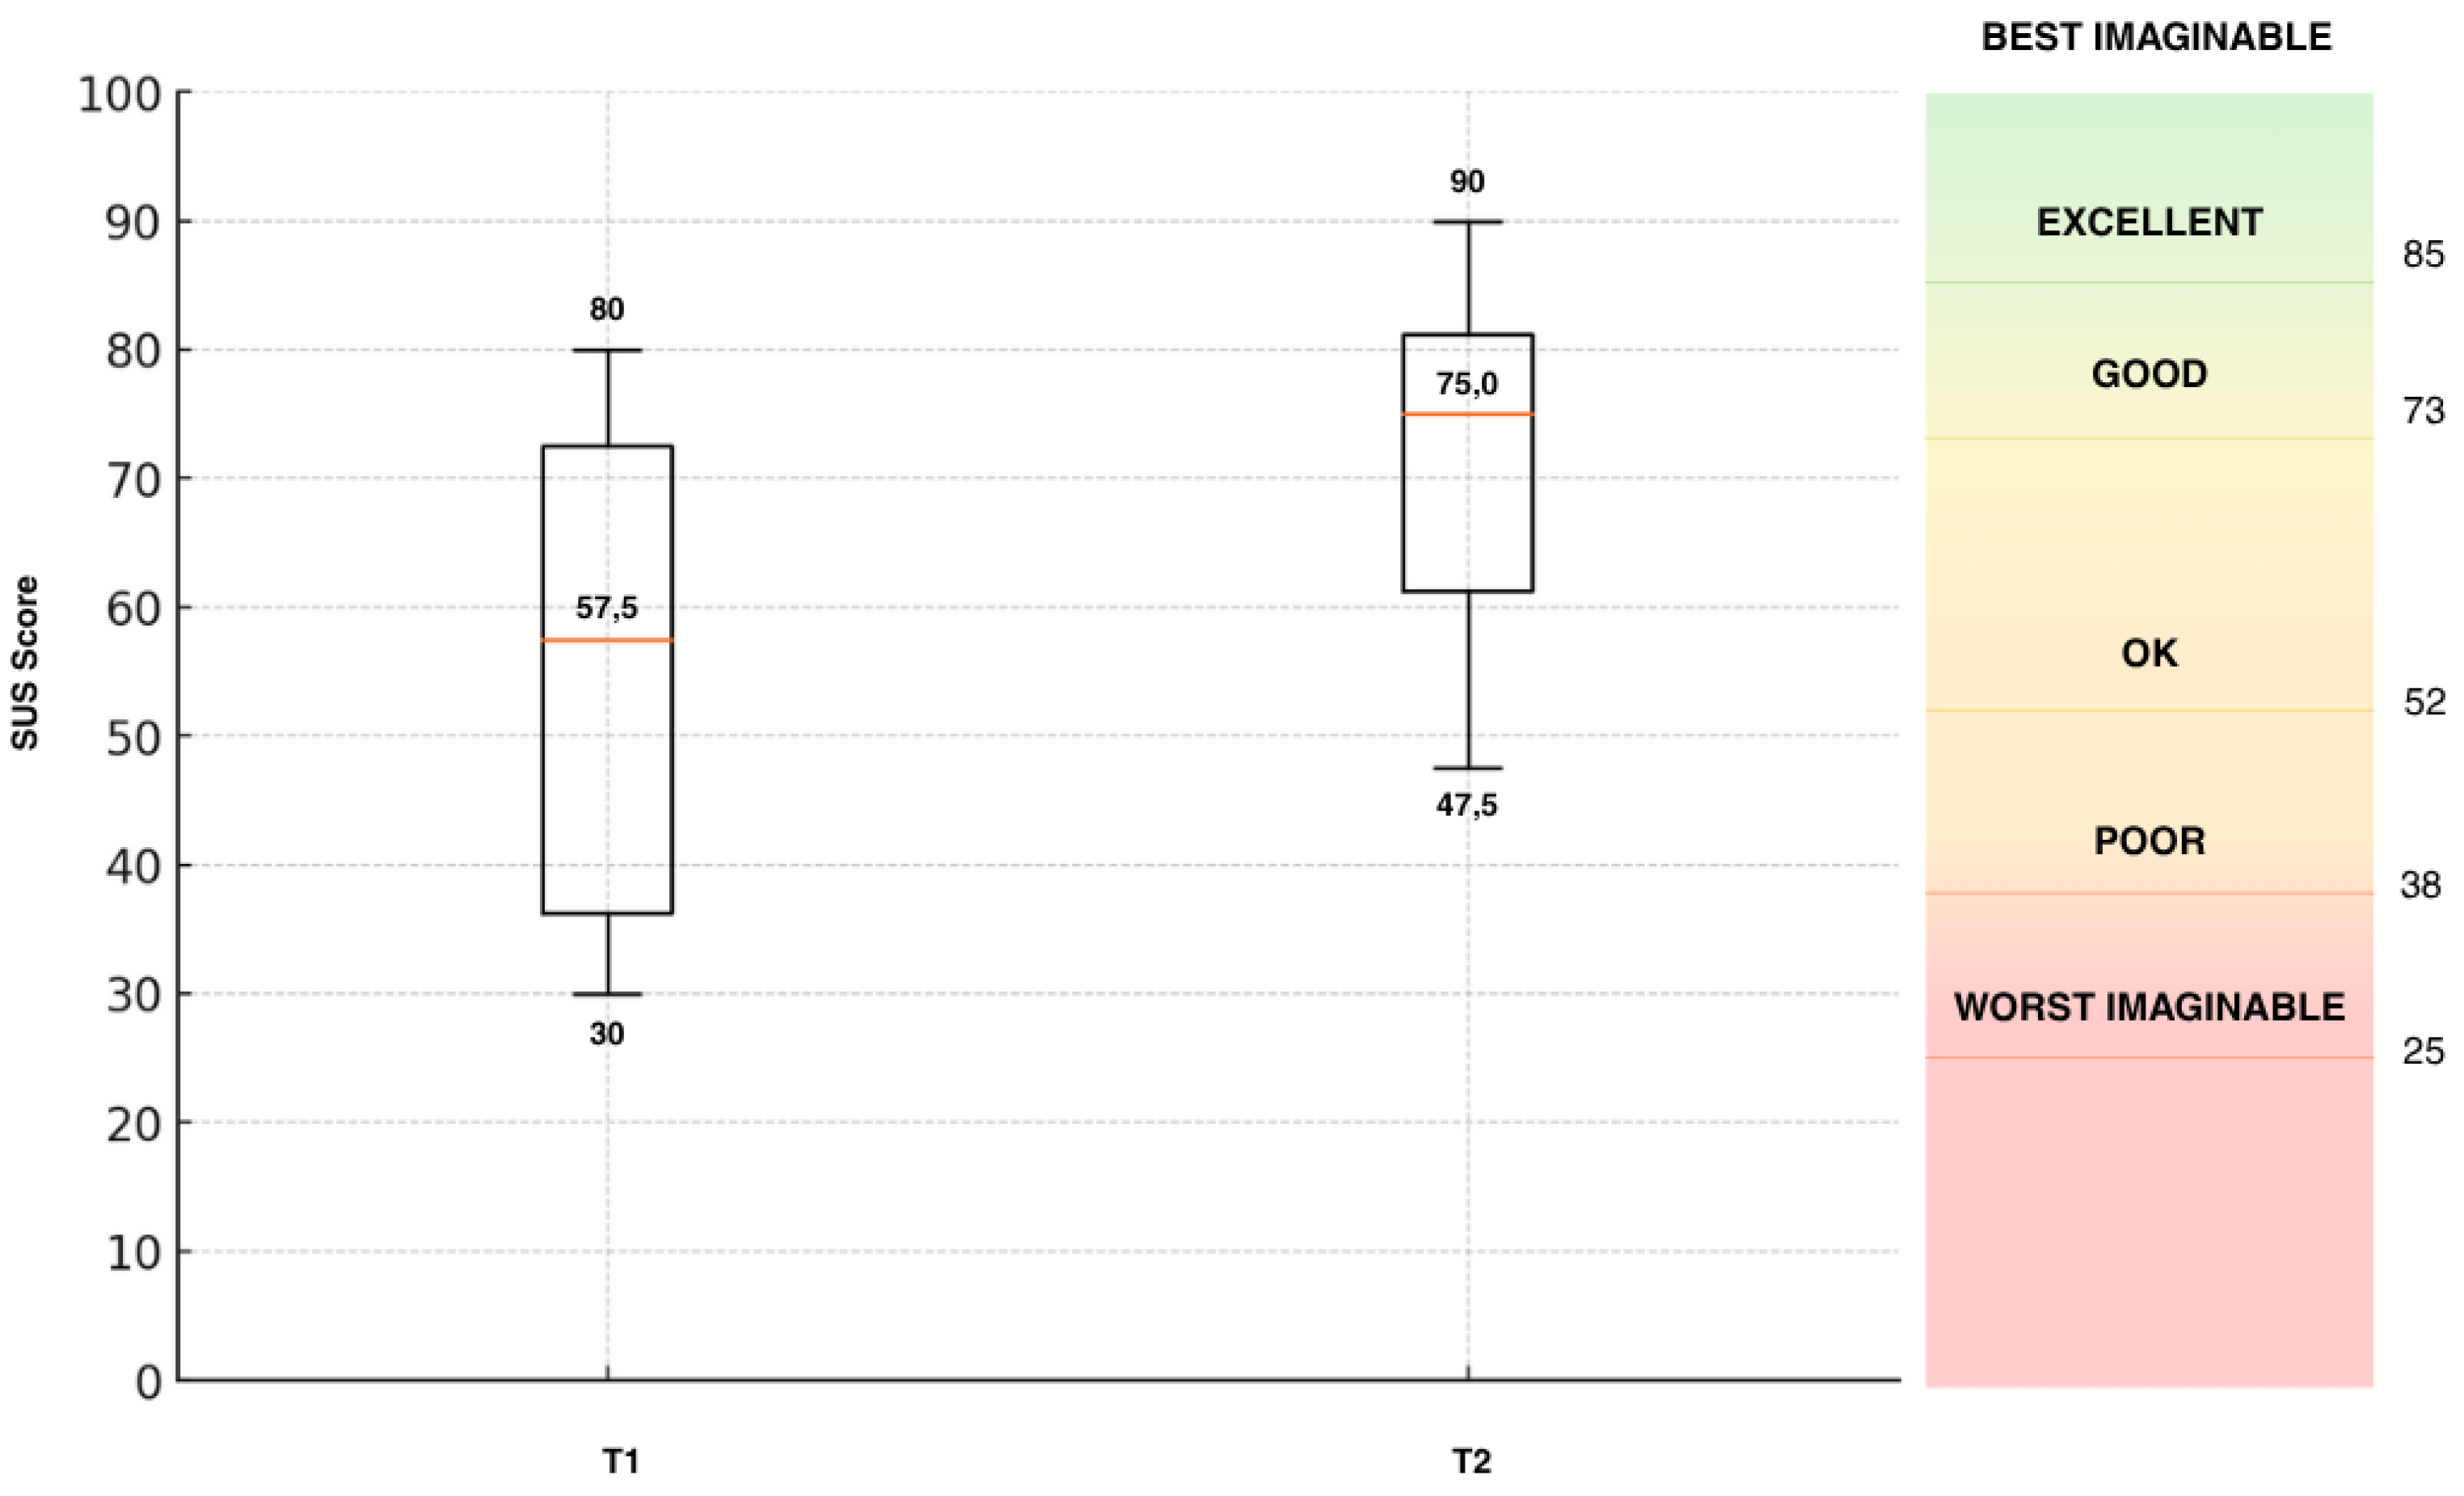
Figure 3.
System Usability Scale (SUS) scores at T1 and T2 (t14=-5.08; p=.000), ranked according to Bangor et al. [36].
Figure 3.
System Usability Scale (SUS) scores at T1 and T2 (t14=-5.08; p=.000), ranked according to Bangor et al. [36].
The mean SUS score increased from T1 (54.5, SD = 18.8) to T2 (71.2, SD = 13.1) over all participants (patients and therapists), reflecting an average improvement of 16.7 points. According to the interpretation framework by Bangor et al. [36], this shift indicates a transition from acceptable usability ("OK") to a good usability („GOOD“).
Results of t-tests indicated a significant improvement from T1 to T2 (t14=5.08 p=.001). Confidence intervals for the mean SUS scores were 49.7–59.3 (T1) and 67.8–74.5 (T2), showing no overlap and reinforcing the statistical and practical significance of the observed change. Additionally, the reduced standard deviation at T2 suggests increased agreement among participants regarding the system’s improved usability. No outliers were detected at either time point.
Among patients (n = 10), the mean SUS score significantly rose from 48.5 (SD = 16.8) to 67.75 (SD = 14.55), an average increase of 19.25 points (t9= 4.82; p=.001), with individual improvements ranging from +7.5 to +42.5, from T1 to T2.
Therapists (n = 5) began with a higher initial SUS score of 66.5 (SD = 18.17) and improved to 78.0 (SD = 6.22) by T2, representing an average gain of 11.5 points (t4= 2.07; p= .108). Although statistical testing in this small group is exploratory, the direction and consistency of the changes suggest a meaningful usability improvement. The variability in individual scores (range: +2.5 to +32.5) may reflect differing expectations or perceived use cases, but all participants reported a positive trend.
3.2.2. TUI Score
Like the SUS questionnaire all fifteen participants completed the TUI questionnaire after interacting with the system at two different time points, enabling a within-subject comparison.
Table 6.
TUI scores at T1 and T2.
| T1 | T1 Median | T2 | T2 Median | Mean Δ (T2 - T1) | Cohen's d | p | ||
|---|---|---|---|---|---|---|---|---|
| Psychological factors [(mean, (SD) 95 % CI]) | ||||||||
| Interest | 20.67 (3.35) [18.81, 22.53] | 21 | 22.53 (3.07) [20.83, 24.23] | 23 | +1.86 | -0.66 | .024 | |
| Skepticism | 11.40 (3.72) [9.34, 13,46] |
12 | 8.07 (3.15) [6.32, 9.81] |
8 | -3.33 | 1.01 | .002 | |
| Technology-specific factors [(mean, (SD) 95 % CI]) | ||||||||
| Usefulness | 17.60 (4.48) [15.12, 20.08] | 17 | 21.07 (3.84) [18.94, 23.20] | 21 | +3.47 | -0.69 | .019 | |
| Immersion | 14.07 (4.7) [11.47, 16.67] |
13 | 16.87 (6.35) [13.35 , 20.38] | 15 | +2.8 | -0.74 | .012 | |
| Usability | 14.73 (4.76) [12.10, 17.37] | 15 | 17.73 (2.46) [16.37, 19.10] | 18 | +3 | -0.84 | .006 | |
| Accessibility | 11.27 (2.77) [9.77, 12.77] |
12 | 13.33 (2.94) [11.70, 14.96] | 13 | -2.06 | -0.79 | .009 | |
| Intention to Use | 149.47 (73.09) [108.99, 189.94] | 166 | 171.73 (59.42) [138.83, 204.64] | 167 | +22.26 | -0.43 | .121 | |
M = mean; SD = standard deviation; CI = 95% confidence interval. Positive mean differences indicate higher values at T2. Negative values of Cohen’s d reflect an increase from T1 to T2. Cohen’s d values of 0.2, 0.5, and 0.8 are interpreted as small, medium, and large effect sizes, respectively [39].
To examine changes across two measurement points (T1 and T2), paired-sample t-tests were conducted for all psychological and technology-specific scales. The results revealed statistically significant improvements in several psychological factors: interest increased (t14 = 2.54, p = .024, d = –0.66), and skepticism significantly decreased (t14 = –3.91, p = .002, d = 1.01), indicating more positive psychological engagement over time. Similarly, technology-related perceptions improved significantly: usefulness (t14 = 3.18, p = .007, d = –0.69), usability (t14 = 3.55, p = .003, d = –0.84), immersion (t14 = 2.87, p = .012, d = –0.74) and accessibility (t14 = 2.98, p = .009, d = –0.79) all showed meaningful increases, each with medium to large effect sizes. Although intention to use the system showed a numerical increase (Δ = +22.26), this difference did not reach statistical significance (t14 = 1.67, p = .121, d = –0.43), suggesting that motivational intentions may require more time or additional interventions to shift substantially. All scales demonstrated acceptable to excellent internal consistency (α = .70–.89), which supports the reliability of the observed effects. The 95% confidence intervals for group means were generally narrow, indicating sufficient measurement precision to interpret changes over time.
Since the primary aim of the first STAR iteration cycle (T1) – and hence this analysis – was to evaluate changes in perceived usability over time, these values are presented in a separate whisker box plot (Figure 4). At T1, the average usability score across both target groups (patients and therapists) was 14.33 (SD = 4.81, 95% CI [11.67, 16.99]). At T2, the average usability score across both groups was 17.73 (SD = 2.46, 95% CI [16.37, 19.10]).
The results of t-tests showed a higher rating on usability from T1 to T2 (t14=-3.98; p=.001). Confidence intervals for the mean usability scores were 11.67–16.99 (T1) and 16.37–19.10 (T2), showing minimal overlap and reinforcing the statistical and practical significance of the observed change. Additionally, the reduced standard deviation at T2 suggests increased agreement among participants. No outliers were detected at either time point.
Among patients (n = 10), the mean score rose from 13.8 to 18.0, an average increase of 4.2 points, with individual improvements ranging from +1 to +9.
Therapists (n = 5) began with a higher initial score of 16.6 and improved to 17.2 by T2, representing an average gain of 1.8 points with individual changes ranging from -2 to +5. Due to the small number of participants, no statement on statistical analysis was performed. However, the average change from T1 to T2 was smaller compared to the patient group.
4. Discussion
This study aimed to evaluate the usability and user acceptance of a novel AR therapy system prototype in musculoskeletal rehabilitation. Through an iterative, user-centered development cycle involving patients and therapists, the goal was to improve the system’s usability and user acceptance, as measured by the System Usability Scale (SUS) and the Technology Usage Inventory (TUI). The decision to use two different questionnaires was made to not only capture how usability changed throughout the first iteration loop but to examine psychological factors regarding user acceptance such as skepticism and curiosity. For example, Fink et al. [40] conducted a study on factors for user acceptance of a drone-based medication delivery system and found that user acceptance is influenced by the psychological factors curiosity and skepticism. This study showed that combining the SUS and the TUI leads to more in-depth insights on the relationship between usability, user acceptance and psychological factors.
The results indicate that the aim of improving the system’s usability and user acceptance was successful: usability ratings increased over the design iteration, and final SUS scores exceeded the 68-point benchmark of average usability, approaching the “good” usability range identified in prior studies using the same hardware [41]. Likewise, participants’ TUI responses reflected an increased user acceptance in both patient and clinician groups.
These findings align with the study aims and resonate with trends in the current literature. Recent reviews emphasize that demonstrating solid usability and acceptability is a crucial preliminary step before evaluating therapeutic effectiveness of digital and mixed reality interventions [42,43,44]. Most studies done on AR in rehabilitation generally report positive user feedback, underscoring the potential of AR in rehabilitation when it is designed with the user in mind [44]. The higher SUS and TUI scores at T2 are consistent with these patterns. For instance, Gsaxner et al. [41] found that early medical AR applications typically achieved above-average SUS scores in the low-to-mid 70s, indicating good usability yet room for improvement. The SUS outcomes for the STAR system are in line with those values, suggesting that iterative design can indeed push usability toward the upper tiers observed in comparable AR systems. High usability is not merely a nicety; it directly supports technology acceptance. As Xu et al. [45] demonstrated in the context of virtual reality exergames for older adults, perceived ease of use and perceived usefulness are significant predictors of users’ willingness to adopt a new rehabilitation technology.
The STAR study addressed both factors: iterative enhancements made the interface more intuitive (boosting ease of use) while also starting to tailor features to patient and therapist needs and thereby slightly enhancing perceived usefulness although this is the aspect with the most room for improvement.
When comparing the findings with similar studies on AR usability in healthcare and other digital rehabilitation tools, both commonalities and differences emerge. On the whole, the positive usability results echo those reported by Luciani et al. [46], who tested a AR-based upper-limb rehab system based on the same AR glasses: clinicians in their study rated the system’s usability as “okay” (mean SUS ≈ 68) and expressed a high willingness to use it (4.4 out of 5 on a TAM-based willingness-to-use scale). Likewise, studies of other rehabilitation technologies, such as virtual reality exergames, have found older patient groups to be surprisingly open to using novel systems when the design is appropriately tailored. Stamm et al. [47] reported that hypertensive seniors gave high usability ratings to VR exercise games and had intention-to-use scores comparable to those of tech-savvy reference groups. These parallels indicate that whether AR or VR, a well-designed interactive rehabilitation tool can achieve good usability and user acceptance across diverse user populations.
However, there are also notable differences and unique challenges highlighted in the literature. One concerns the hardware and interaction constraints of AR headsets. The participants in this study, like those in Blomqvist et al.’s [48] pilot with older adults, initially experienced issues such as the device feeling heavy, difficulties with hand gesture controls, and time-consuming calibration. These factors can detract from user experience – for example, Blomqvist and colleagues observed that despite enjoying the AR training’s motivational feedback, users found the interface physically and technically challenging without further improvements. In the STAR study, these same pain points were targeted during the iterative design cycles: interface adjustments were made to simplify menu navigation and gesture control, and a tutorial was provided to mitigate setup friction. The improved SUS scores post-iteration suggest that many usability barriers due to AR’s form factor or interaction style can be overcome by responsive design changes. Nonetheless, some inherent limitations of current AR technology remain; a narrow field of view, occasional technical flaws and user fatigue are recurrent themes in AR rehabilitation research. While users generally have a positive attitude towards AR in healthcare, achieving seamless integration into therapy will require addressing these ergonomic and technical issues. Unlike screen-based or mobile rehab apps, head-mounted AR brings immersion and encumbrance, so future work should continue refining device comfort and reliability to support long-term use. This was shown by the – only non-significant – improvements in the intention to use scale showing that there is still a gap to fill before the system can be purposefully implemented in a broader pilot study on therapeutic effectiveness. Bridging this gap by foundational technical improvements will be part of the next phase of the STAR development process.
An important part of such development processes is the involvement of all potential user groups. Indeed, the literature shows that clinician buy-in is just as important as patient buy-in for new rehab technologies [49]. Therapists must feel that a system is not only easy to use but also enhances their workflow and does not threaten patient safety or quality of care [49]. By engaging therapists throughout development, this study addressed this need – although the sample was small – and found that both therapists and patients were positive towards features like real-time feedback which are set to be integrated soon. As stated in recent literature clinicians particularly prioritize applications that are easy to use and can be efficiently integrated into existing daily workflow processes and provide added value through increased patient engagement [50]. Furthermore, they should provide reliable and up-to-date information that can help inform clinical decision making. The latter also includes seamless integration into the existing clinical systems such as electronic health records. Patients in turn value features that encourage sustained engagement, provide a meaningful health benefit and have minimal technical barriers hence increasing ease of use and accessibility [51,52].
The user-centered approach of this study helped bridge a gap noted in earlier studies: researchers have pointed out that many prototype systems stay in lab stages without clinical adoption because they lack real-world usability or fail to integrate clinician perspectives [41,49]. This study contributes to closing that gap, demonstrating that involving both patients and clinicians in the design loop can yield an AR application that is acceptable to all stakeholders in the rehabilitation process.
4.1. Limitations
A potential modulating factor in the changes from T1 to T2 is the experience that the participants had at the time of the second testing. All participants reported that they had never worn an augmented reality device before at T1. Therefore, at T1 not only the application but the whole hardware-software combination of the AR technology was new to the participants making it naturally hard to immediately use the system smoothly. Since users typically get used quickly to the handling of the device there is a steep learning curve that could have influenced the results at T2. This means that the improvements in usability might be partially attributed to the learning effect that already occurred during the first testing. For T3 an ad-hoc group will be implemented to mitigate the effects of experience with the new technology. Implementing an ad-hoc group has been proven to be an effective way to control the effect of familiarization throughout the iteration loops [40].
Regarding future research it is necessary to recruit a higher number of participants, particularly more therapists. Furthermore, other health care providers like physicians and occupational therapists should be included to broaden the viewpoint and receive more comprehensive feedback from other target groups.
5. Conclusions
This study demonstrated that a user-centered, iterative development process can significantly enhance the usability and user acceptance of a wearable augmented reality system for musculoskeletal rehabilitation. Successive design refinements based on feedback from both patients and therapists led to marked improvements in SUS and TUI scores, indicating increased perceived usability and user acceptance. These findings align with current literature emphasizing the importance of human factors in technology adoption and provide empirical support for integrating TAM-based evaluations into rehabilitation technology design. The study contributes to the foundations of research which are needed for future work on the clinical effectiveness and long-term integration of AR tools in therapeutic practice.
Supplementary Materials
The following supporting information can be downloaded at the website of this paper posted on Preprints.org. Appendix 1: Interview guidelines for the patients; Appendix 2: Interview guidelines for the therapists; Appendix 3: COREQ checklist.
Author Contributions
NK and JB contributed to conceptualization, formal analysis, investigation, methodology and writing of the original draft. FF contributed to supervision and writing of the original draft (review and editing). AL, KS, MC and SJ contributed to writing of the original draft (review and editing). MB and FK contributed to investigation, formal analysis and visualization. PJ contributed to conceptualization, supervision and writing of the original draft (reviewing and editing). All authors have read and agreed to the published version of the manuscript.
Funding
This research received no external funding.
Institutional Review Board Statement
The study was conducted in accordance with the Declaration of Helsinki and approved by the responsible ethics committee at Martin Luther University Halle-Wittenberg (protocol code: 2024-085; date of approval: 16.07.2024).
Informed Consent Statement
Informed consent was obtained from all subjects involved in the study.
Data Availability Statement
The original data presented in the study are openly available in zenodo at https://doi.org/10.5281/zenodo.17883318.
Conflicts of Interest
The authors declare no conflicts of interest.
Abbreviations
The following abbreviations are used in this manuscript:
| STAR | Augmented Reality-Based Sports Therapy System |
| SUS | System Usability Scale |
| TUI | Technology Usage Inventory |
References
- van Middelkoop, M.; Rubinstein, S.M.; Verhagen, A.P.; Ostelo, R.W.; Koes, B.W.; van Tulder, M.W. Exercise therapy for chronic nonspecific low-back pain. Best Pract. Res. Clin. Rheumatol. 2010, 24, 193–204. [Google Scholar] [CrossRef] [PubMed]
- Steffens, D.; Maher, C.G.; Pereira, L.S.M.; Stevens, M.L.; Oliveira, V.C.; Chapple, M.; et al. Prevention of low back pain: A systematic review and meta-analysis. JAMA Intern. Med. 2016, 176, 199–208. [Google Scholar] [CrossRef] [PubMed]
- Liu, Y.; Lü, Y.; Hou, L.; Zhang, X.; Zhao, H.; Yan, C.H.; et al. Exercise intervention for patients with chronic low back pain: A systematic review and network meta-analysis. Front. Public Health 2023, 11, 1155225. [Google Scholar] [CrossRef]
- Rosedale, R.; Rastogi, R.; May, S.; Chesworth, B.M.; Filice, F.; Willis, S.; et al. Efficacy of exercise intervention as determined by the McKenzie System of Mechanical Diagnosis and Therapy for knee osteoarthritis: A randomized controlled trial. J. Orthop. Sports Phys. Ther. 2014, 44, 173–181. [Google Scholar] [CrossRef]
- Nejati, P.; Farzinmehr, A.; Moradi-Lakeh, M. The effect of exercise therapy on knee osteoarthritis: A randomized clinical trial. Med. J. Islam. Repub. Iran 2015, 29, 186. [Google Scholar]
- Zampogna, B.; Papalia, R.; Papalia, G.F.; Campi, S.; Vasta, S.; Vorini, F.; Fossati, C.; Torre, G.; Denaro, V. The role of physical activity as conservative treatment for hip and knee osteoarthritis in older people: A systematic review and meta-analysis. J. Clin. Med. 2020, 9, 1167. [Google Scholar] [CrossRef]
- Algar, L.; Valdes, K. Using smartphone applications as hand therapy interventions. J. Hand Ther. 2014, 27, 254–256. [Google Scholar] [CrossRef]
- Ylinen, J.; Häkkinen, A.; Nykänen, M.; Kautiainen, H.; Takala, E.P. Neck muscle training in the treatment of chronic neck pain: A three-year follow-up study. Eura Medicophys. 2007, 43, 161–169. [Google Scholar] [PubMed]
- Cheng, C.H.; Su, H.T.; Yen, L.W.; Liu, W.Y.; Cheng, H.Y.K. Long-term effects of therapeutic exercise on nonspecific chronic neck pain: A literature review. J. Phys. Ther. Sci. 2015, 27, 1271–1276. [Google Scholar] [CrossRef]
- Littlewood, C.; Ashton, J.; Chance-Larsen, K.; May, S.; Sturrock, B. Exercise for rotator cuff tendinopathy: A systematic review. Physiotherapy 2012, 98, 101–109. [Google Scholar] [CrossRef] [PubMed]
- Dejaco, B.; Habets, B.; van Loon, C.; van Grinsven, S.; van Cingel, R. Eccentric versus conventional exercise therapy in patients with rotator cuff tendinopathy: A randomized, single-blinded clinical trial. Knee Surg. Sports Traumatol. Arthrosc. 2017, 25, 2051–2059. [Google Scholar] [CrossRef]
- Palm, W.; Webb, E.; Hernández-Quevedo, C.; Scarpetti, G.; Lessof, S.; Siciliani, L.; et al. Gaps in coverage and access in the European Union. Health Policy 2021, 125, 341–350. [Google Scholar] [CrossRef]
- Trompetter, E. Bäumchen wechsel nicht – Hanne Guttau-Leimenstoll. Physiopraxis 2015, 13, 24–25. [Google Scholar] [CrossRef]
- England, K.; Azzopardi-Muscat, N. Demographic trends and public health in Europe. Eur. J. Public Health 2017, 27 Suppl. 4, 9–13. [Google Scholar] [CrossRef] [PubMed]
- Iuga, I.C.; Nerişanu, R.A.; Iuga, H. The impact of healthcare system quality and economic factors on the older adult population: A health economics perspective. Front. Public Health 2024, 12, 1454699. [Google Scholar] [CrossRef]
- Ministry for Infrastructure and Digital Affairs of Saxony-Anhalt. Where Is Saxony-Anhalt Heading? Ministry for Infrastructure and Digital Affairs of Saxony-Anhalt: Magdeburg, Germany; n.d. Available online: https://demografie.sachsen-anhalt.de/fileadmin/.../2022-05-11-bevoelkerungsentwicklung-sachsen-anhalt.pdf (accessed on 14 August 2025).
- Pförringer, D.; Back, D.; Matusiewicz, D. Digitale Chancen für Medizin und Physiotherapie. Sportphysio 2021, 9, 59–64. [Google Scholar] [CrossRef]
- Rus-Calafell, M.; Ehrbar, N.; Teismann, T.; Schneider, S.; Tas, E.; Schuster, S.; et al. Using virtual reality social environments to promote outcomes’ generalization of AVATAR therapy for distressing voices: A case study. J. Clin. Psychol. 2025, 81, 516–525. [Google Scholar] [CrossRef] [PubMed]
- Baur, H. Digitale Physiotherapie – Ein Zukunftsmodell in der Schweiz. In frequenz 2022, (2). [Google Scholar] [CrossRef]
- Schäfer, A.; Löffler-Idel, I.; Adelt, E.; Fiedler, C.; Reinhardt, A.; Wilhelm, N.; et al. Evaluation eines mHealth unterstützten Heimübungsprogramms für Menschen mit Kniearthrose (mhexos) – Bedienbarkeit, Erfahrungen von Nutzer*innen und Outcome. Physiosci 2022, 18, 117–127. [Google Scholar] [CrossRef]
- Matthie, N.S.; Giordano, N.A.; Jenerette, C.M.; Magwood, G.S.; Leslie, S.L.; Northey, E.E.; et al. Use and efficacy of virtual, augmented, or mixed reality technology for chronic pain: A systematic review. Pain Manag. 2022, 12, 859–878. [Google Scholar] [CrossRef]
- Pisters, M.F.; Veenhof, C.; van Meeteren, N.L.U.; Ostelo, R.W.; de Bakker, D.H.; Schellevis, F.G.; et al. Long-term effectiveness of exercise therapy in patients with osteoarthritis of the hip or knee: A systematic review. Arthritis Rheum. 2007, 57, 1245–1253. [Google Scholar] [CrossRef] [PubMed]
- Vinolo Gil, M.J.; Gonzalez-Medina, G.; Lucena-Anton, D.; Perez-Cabezas, V.; Del Ruiz-Molinero, M.C.; et al. Augmented reality in physical therapy: Systematic review and meta-analysis. JMIR Serious Games 2021, 9, e30985. [Google Scholar] [CrossRef] [PubMed]
- Pacheco-Da-Costa, S.; Soto-Vidal, C.; Calvo-Fuente, V.; Yuste-Sánchez, M.; Sánchez-Sánchez, B.; Asúnsolo-Del-Barco, Á. Evaluation of physical therapy interventions for improving musculoskeletal pain and quality of life in older adults. Int. J. Environ. Res. Public Health 2022, 19, 127038. [Google Scholar] [CrossRef]
- Whittaker, J.L.; Roos, E.M. A pragmatic approach to prevent post-traumatic osteoarthritis after sport or exercise-related joint injury. Best Pract. Res. Clin. Rheumatol. 2019, 33, 158–171. [Google Scholar] [CrossRef] [PubMed]
- Davis, F.D.; Bagozzi, R.P.; Warshaw, P.R. User acceptance of computer technology: A comparison of two theoretical models. Manag. Sci. 1989, 35, 982–1003. [Google Scholar] [CrossRef]
- Venkatesh, V.; Davis, F.D. A theoretical extension of the technology acceptance model: Four longitudinal field studies. Manag. Sci. 2000, 46, 186–204. [Google Scholar] [CrossRef]
- Venkatesh, V.; Bala, H. Technology acceptance model 3 and a research agenda on interventions. Decis. Sci. 2008, 39, 273–315. [Google Scholar] [CrossRef]
- Farao, J.; Malila, B.; Conrad, N.; Mutsvangwa, T.; Rangaka, M.X.; Douglas, T.S. A user-centred design framework for mHealth. PLoS ONE 2020, 15, e0237910. [Google Scholar] [CrossRef]
- Hevner, A.R.; March, S.T.; Park, J.; Ram, S. Design science in information systems research. MIS Q. 2004, 28, 75–105. [Google Scholar] [CrossRef]
- Plattner, H.; Meinel, C.; Leifer, L. Design Thinking: Understand–Improve–Apply; Springer: Berlin/Heidelberg, Germany, 2010; Available online: https://link.springer.com/book/10.1007/978-3-642-13757-0.
- German Institute for Standardization. DIN EN ISO 9241-220: Ergonomics of Human-System Interaction – Part 220; Beuth Verlag: Berlin, Germany, 2019; Available online: https://www.din.de/de/mitwirken/normenausschuesse/naerg/veroeffentlichungen/wdc-beuth:din21:289443385 (accessed on 15 August 2025).
- Brooke, J. SUS: A Quick and Dirty Usability Scale. In Usability Evaluation in Industry; Jordan, P.W., Thomas, B., Weerdmeester, B.A., McClelland, I.L., Eds.; Taylor & Francis: London, UK, 1996; pp. 189–194. [Google Scholar]
- Kothgassner, O.; Felnhofer, A.; Hauk, N.; Kastenhofer, E.; Gomm, J.; Ryspin-Exner, I. TUI: Technology Usage Inventory Manual; ICARUS: Vienna, Austria, 2012; Available online: https://ucrisportal.univie.ac.at/en/publications/tui-technology-usage-inventory-manual/.
- Tong, A.; Sainsbury, P.; Craig, J. Consolidated criteria for reporting qualitative research (COREQ): A 32-item checklist for interviews and focus groups. Int. J. Qual. Health Care 2007, 19, 349–357. [Google Scholar] [CrossRef]
- Bangor, A.; Kortum, P.; Miller, J. Determining what individual SUS scores mean: Adding an adjective rating scale. J. Usability Stud. 2009, 4, 114–123. Available online: https://uxpajournal.org/determining-what-individual-sus-scores-mean-adding-an-adjective-rating-scale/.
- Gioia, D.A.; Corley, K.G.; Hamilton, A.L. Seeking qualitative rigor in inductive research: Notes on the Gioia methodology. Organ. Res. Methods 2013, 16, 15–31. [Google Scholar] [CrossRef]
- Brooke, J. SUS: A Retrospective. J. Usability Stud. 2013, 8, 29–40. [Google Scholar]
- Cohen, J. Statistical Power Analysis for the Behavioral Sciences, 2nd ed.; Lawrence Erlbaum Associates: Hillsdale, NJ, USA, 1988. [Google Scholar]
- Fink, F.; Kalter, I.; Steindorff, J.V.; Helmbold, H.K.; Paulicke, D.; Jahn, P. Identifying factors of user acceptance of a drone-based medication delivery: User-centered design approach. JMIR Hum. Factors 2024, 11, e51587. [Google Scholar] [CrossRef]
- Gsaxner, C.; Li, J.; Pepe, A.; Jin, Y.; Kleesiek, J.; Schmalstieg, D.; et al. The HoloLens in medicine: A systematic review and taxonomy. Med. Image Anal. 2023, 85, 102757. [Google Scholar] [CrossRef] [PubMed]
- Brunzini, A.; Papetti, A.; Messi, D.; Germani, M. A comprehensive method to design and assess mixed reality simulations. Virtual Real. 2022, 26, 1257–1275. [Google Scholar] [CrossRef]
- Nwosu, A.; Boardman, S.; Husain, M.M.; Doraiswamy, P.M. Digital therapeutics for mental health: Is attrition the Achilles heel? Front. Psychiatry 2022, 13, 900615. [Google Scholar] [CrossRef] [PubMed]
- Farsi, A.; Cerone, G.L.; Falla, D.; Gazzoni, M. Emerging applications of augmented and mixed reality technologies in motor rehabilitation: A scoping review. Sensors 2025, 25, 2042. [Google Scholar] [CrossRef]
- Xu, W.; Liang, H.N.; Yu, K.; Wen, S.; Baghaei, N.; Tu, H. Acceptance of virtual reality exergames among Chinese older adults. Int. J. Hum.-Comput. Interact. 2023, 39, 1134–1148. [Google Scholar] [CrossRef]
- Luciani, B.; Pedrocchi, A.; Tropea, P.; Seregni, A.; Braghin, F.; Gandolla, M. Augmented reality for upper limb rehabilitation: Real-time kinematic feedback with HoloLens 2. Virtual Real. 2025, 29, 57. [Google Scholar] [CrossRef]
- Stamm, O.; Vorwerg, S.; Haink, M.; Hildebrand, K.; Buchem, I. Usability and acceptance of exergames using different types of training among older hypertensive patients in a simulated mixed reality. Appl. Sci. 2022, 12, 11424. [Google Scholar] [CrossRef]
- Blomqvist, S.; Seipel, S.; Engström, M. Using augmented reality technology for balance training in older adults: A feasibility pilot study. BMC Geriatr. 2021, 21, 144. [Google Scholar] [CrossRef] [PubMed]
- Ríos-Hernández, M.; Jacinto-Villegas, J.M.; Portillo-Rodríguez, O.; Vilchis-González, A.H. User-centered design and evaluation of an upper limb rehabilitation system with a virtual environment. Appl. Sci. 2021, 11, 9500. [Google Scholar] [CrossRef]
- Azad-Khaneghah, P.; Neubauer, N.; Miguel Cruz, A.; Liu, L. Mobile health app usability and quality rating scales: A systematic review. Disabil. Rehabil. Assist. Technol. 2021, 16, 712–721. [Google Scholar] [CrossRef]
- Maramba, I.; Chatterjee, A.; Newman, C. Methods of usability testing in the development of eHealth applications: A scoping review. Int. J. Med. Inform. 2019, 126, 95–104. [Google Scholar] [CrossRef]
- Rossetto, F.; Borgnis, F.; Isernia, S.; Foglia, E.; Garagiola, E.; Realdon, O.; et al. System integrated digital empowering and teleRehabilitation to promote patient activation and well-being in chronic disabilities: A usability and acceptability study. Front. Public Health 2023, 11, 1154481. [Google Scholar] [CrossRef] [PubMed]
Figure 2.
Changes in the avatar from T1 to T2 and the latest version for the upcoming testing (T3).
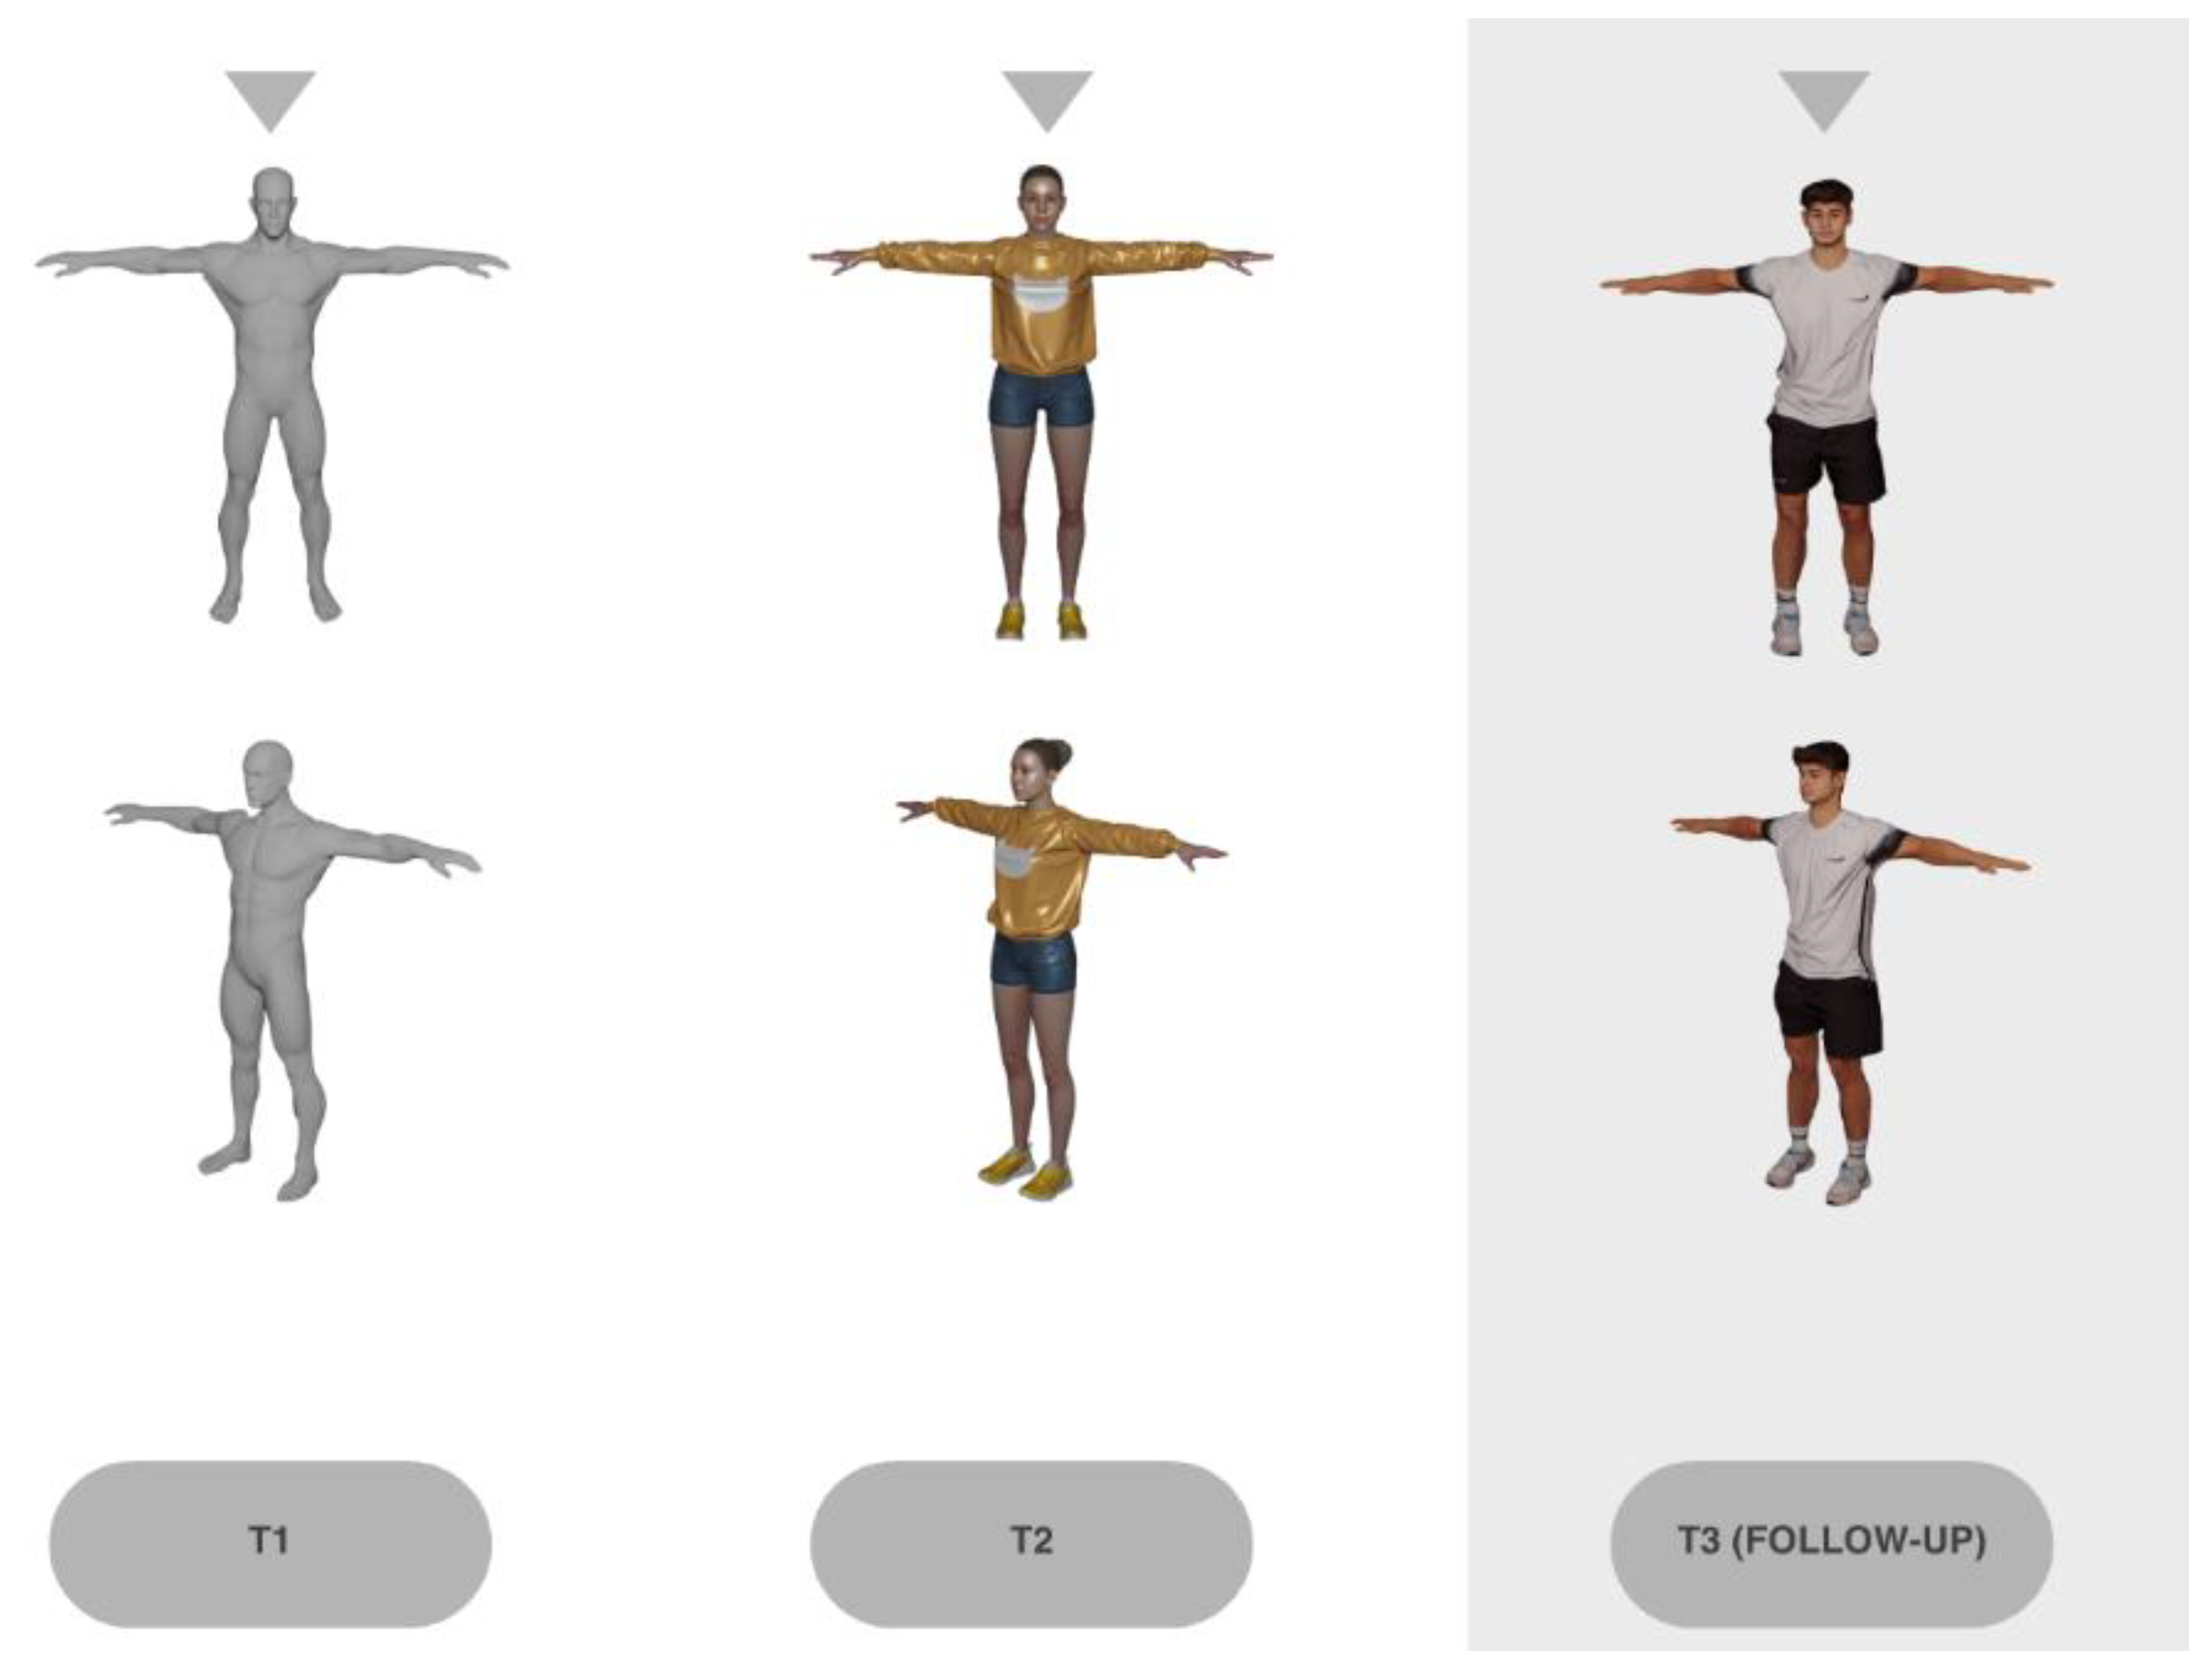
Figure 4.
Technology Usage Inventory (TUI) scores of the subscale usability at T1 and T2. The results of the paired t-test showed a significant change in usability between the two time points (t14=-3.98, p=.001) over all participants. This indicates that usability was significantly higher at the second measurement point than at the first.
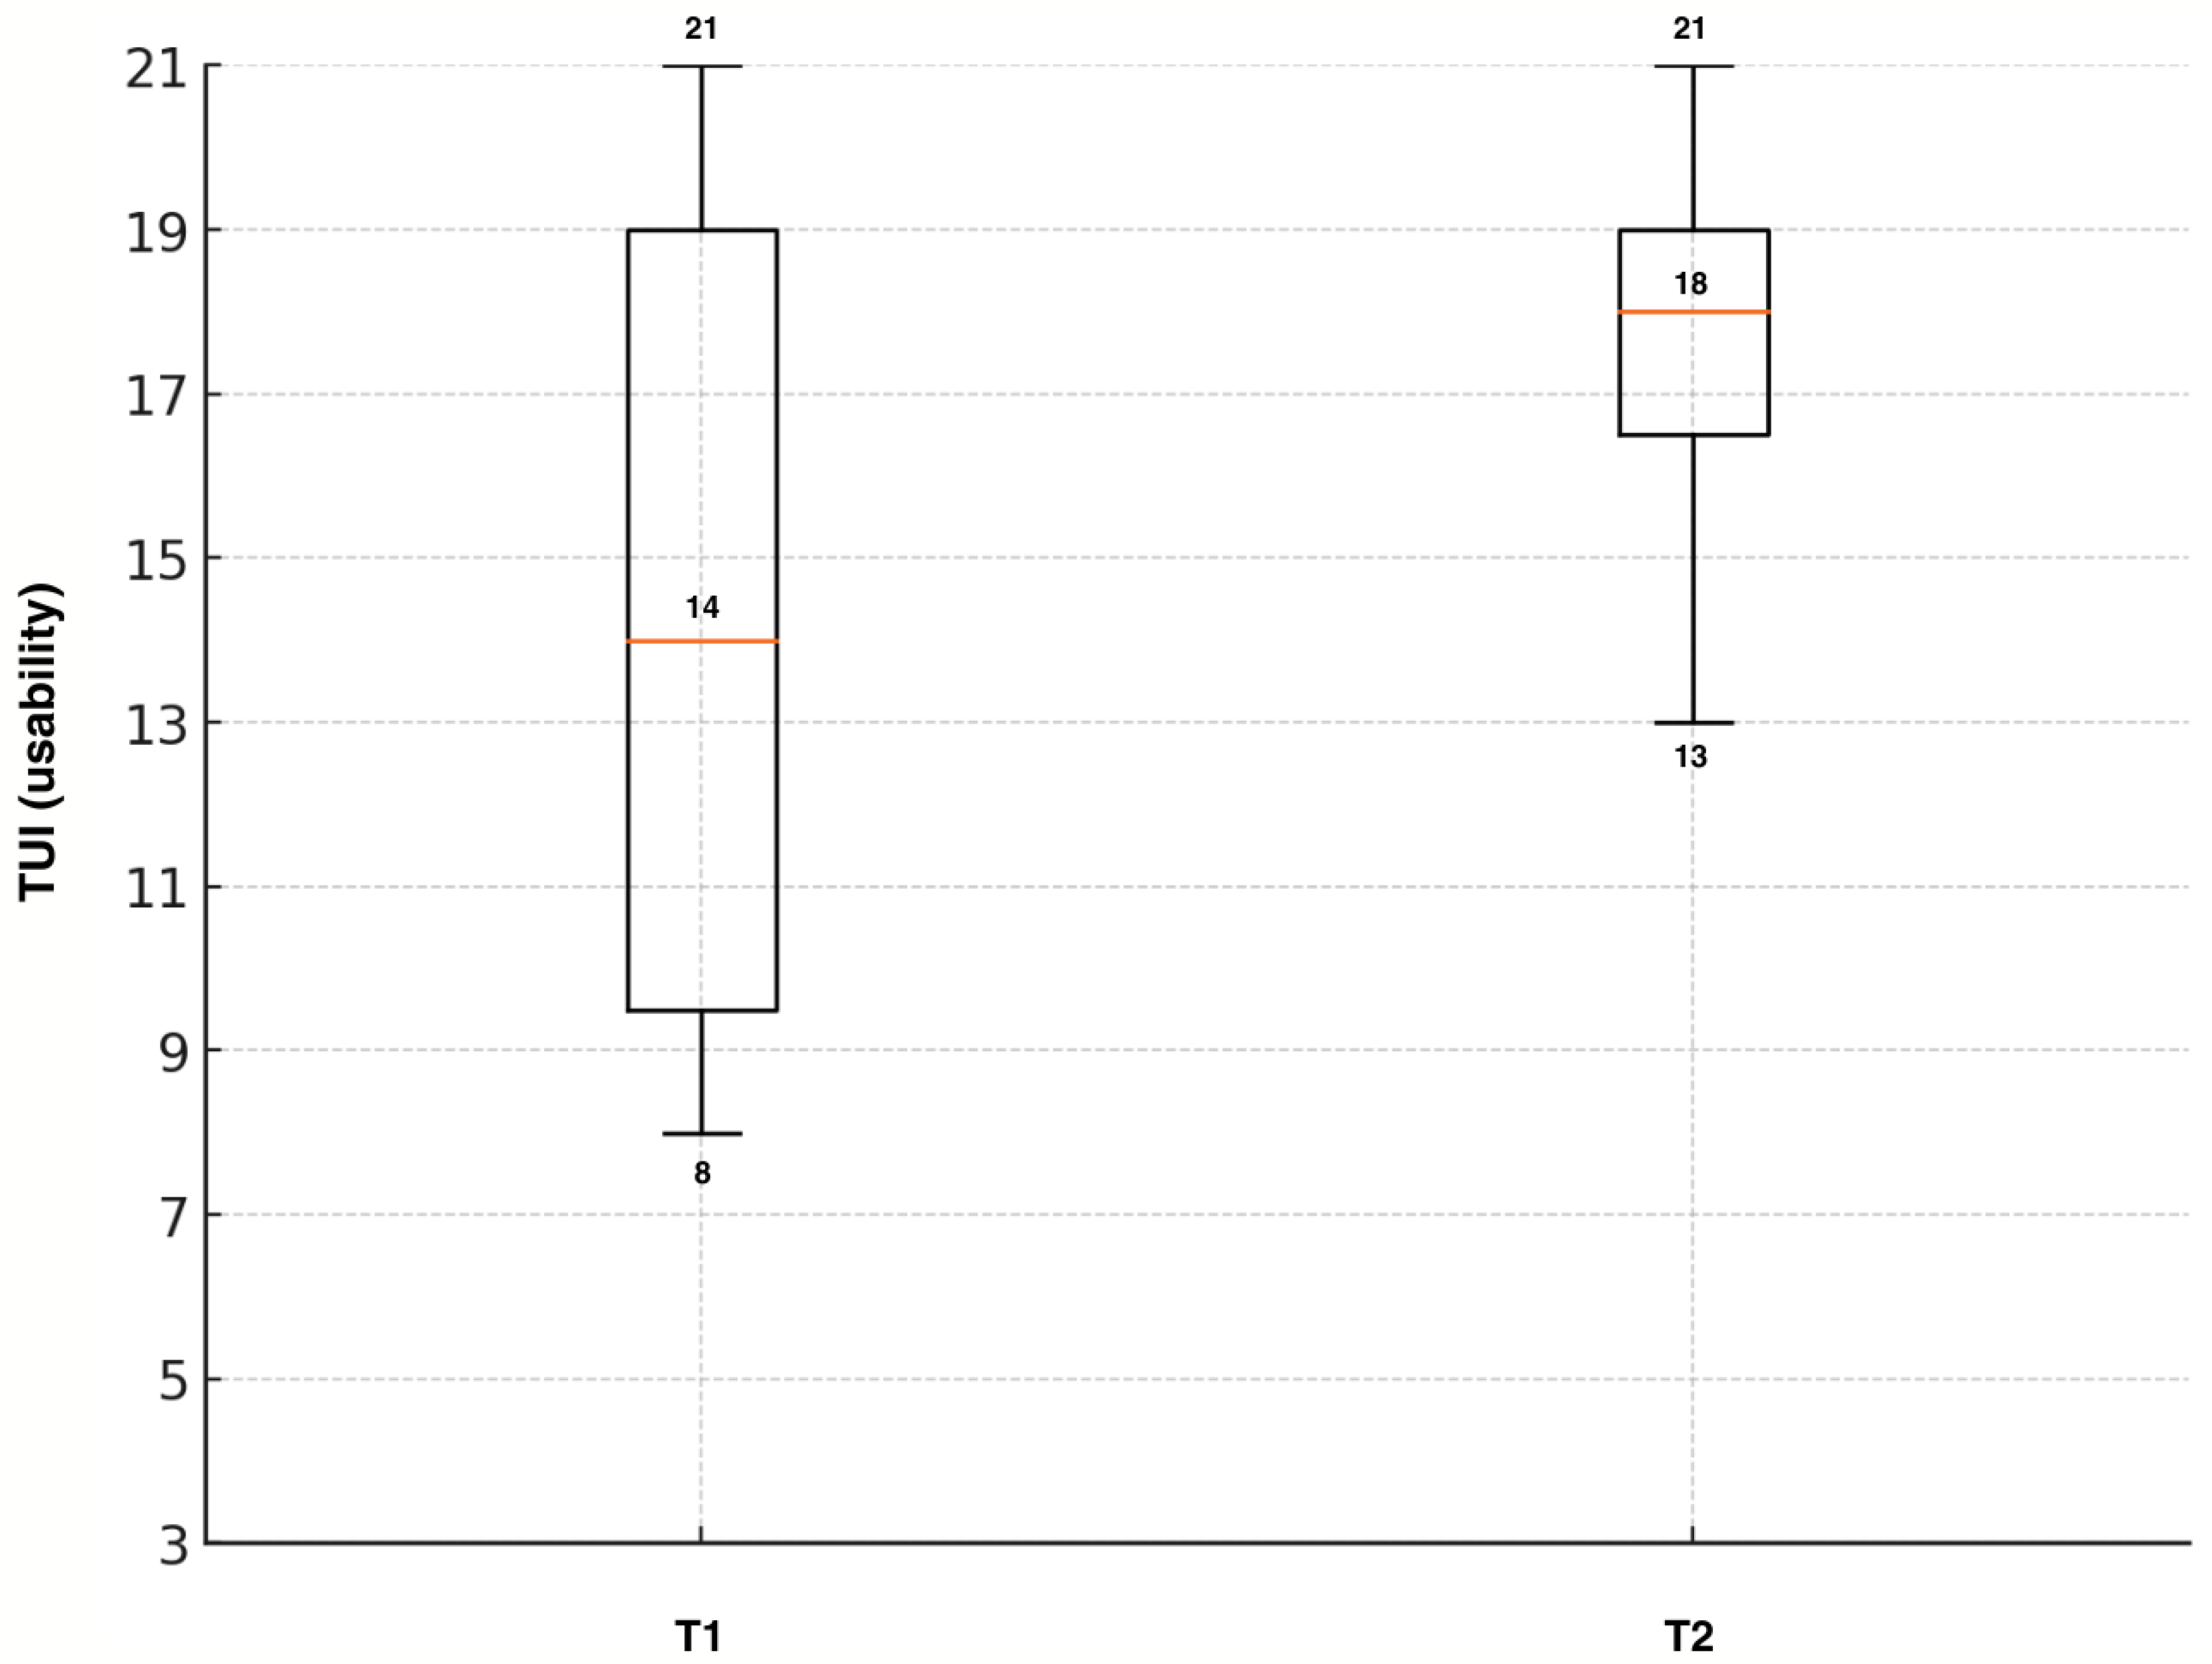
Table 3.
Key findings of the initial needs analysis categorized into four main dimensions.
| Dimension | Key Findings |
| Hardware and Interaction Preferences |
|
| Feedback and Guidance |
|
| Personalization and Adaptivity |
|
| Motivation and Clinical Integration |
|
Table 4.
Patient and therapist feedback after T1.
| Dimension | Patients | Therapists |
|---|---|---|
| Safety |
|
|
| Content |
|
|
| Technology |
|
|
Table 5.
Patient and therapist feedback after T2.
| Dimension | Patients | Therapists |
|---|---|---|
| Safety |
|
|
| Content |
|
|
| Technology |
|
|
Disclaimer/Publisher’s Note: The statements, opinions and data contained in all publications are solely those of the individual author(s) and contributor(s) and not of MDPI and/or the editor(s). MDPI and/or the editor(s) disclaim responsibility for any injury to people or property resulting from any ideas, methods, instructions or products referred to in the content. |
© 2025 by the authors. Licensee MDPI, Basel, Switzerland. This article is an open access article distributed under the terms and conditions of the Creative Commons Attribution (CC BY) license (http://creativecommons.org/licenses/by/4.0/).
Copyright: This open access article is published under a Creative Commons CC BY 4.0 license, which permit the free download, distribution, and reuse, provided that the author and preprint are cited in any reuse.


