1. Introduction
In modern transportation, energy, and infrastructure projects, tunnels are widely employed to ensure continuity between cities, support water supply and wastewater management, and facilitate safe energy transmission. Since these structures are often constructed under complex geotechnical conditions, their design, construction, and operation demand high technical expertise, meticulous planning, and advanced safety measures. Tunnel Boring Machines (TBMs) represent one of the most tangible manifestations of this multidisciplinary system in the field. Accurate prediction of TBM performance relies on the combined knowledge of civil engineering, geology, mechanical engineering, data science, and project management. Numerous parameters, such as rate of penetration (ROP), advance rate (AR), and ground–support interactions, directly influence TBM efficiency and safety. Reliable estimation of these parameters is critical not only for occupational safety but also for cost and schedule management. Consequently, successful TBM projects necessitate effective communication and strong teamwork among geologists, geotechnical engineers, mechanical engineers, data analysts, and field crews, highlighting the practical importance of interdisciplinary approaches and coordination in engineering education and practice.
Early studies on TBM penetration rate prediction primarily employed simple empirical models based on rock hardness [
1]. Subsequent research examined penetration behavior in sedimentary rock formations [
2] and employed statistical regression models [
3,
4], contributing significantly to the understanding of fundamental relationships between rock parameters and ROP. Advanced regression analyses yielded high correlation values (r = 0.82) and developed empirical equations suitable for practical applications [
3]. However, these early approaches largely relied on linear assumptions, limiting their ability to fully represent complex geotechnical interactions and machine–ground behavior.
To evaluate TBM performance more realistically, heuristic optimization algorithms have become increasingly popular. A notable example is the Particle Swarm Optimization (PSO)–based model proposed by Yağiz and Karahan [
5], which aimed to minimize the discrepancy between measured and predicted ROP values. Subsequent studies expanded the methodological diversity by incorporating Harmony Search (HS), Differential Evolution (DE), and Grey Wolf Optimizer (GWO) algorithms [
6]. Similarly, Khoshzaher et al. [
7] demonstrated that TBM penetration rate is influenced by both machine and geological factors, showing that the Firefly algorithm outperformed PSO in their optimization results.
Expressing all relationships in complex geotechnical and mechanical systems like TBMs through a single formula is extremely challenging. This limitation constrains the predictive accuracy of parametric models, typically resulting in R² values around 0.70. To overcome this, recent years have seen the application of Artificial Neural Networks (ANNs) [
8,
9,
10,
11], Support Vector Machines (SVMs) [
12,
13,
14,
15,
16,
17], fuzzy logic [
18,
19,
20,
21], and hybrid soft computing approaches [
22,
23,
24,
25], which, thanks to their ability to represent nonlinear relationships and manage uncertainties, achieve high accuracy in TBM performance prediction.
These methods can predict penetration rates with high precision under multivariate and complex geotechnical conditions, effectively capturing nonlinear interactions among parameters. However, despite high predictive accuracy (R² ≈ 0.90–0.95), interpreting the influence of model inputs and determining their relative importance remains limited, posing a significant drawback for engineering applications.
In this study, six parametric approaches were employed for predicting TBM penetration rate (ROP): three linear, exponential, and nonlinear models, and three hybrid models. All model parameters were optimized using the Differential Evolution (DE) algorithm [
26,
27], and the effects of input variables on output were analyzed through the Jacobian matrix.
The analyses were conducted under two scenarios. In Scenario I, model inputs were used in their original form, while in Scenario II, inputs were standardized using the z-score method. In both scenarios, the relative importance of model inputs was determined and results were compared.
Additionally, variable importance was calculated for Random Forest (RF) [
28,
29], Bagged Trees (BT) [
30,
31], Support Vector Machine (SVM) [
32,
33], and Generalized Additive Models (GAM) [
34,
35], and compared with parametric models. For reliable TBM penetration rate prediction, high accuracy alone is insufficient; model decision-making processes must also be transparent and interpretable.
To this end, Partial Dependence Plot (PDP) and Accumulated Local Effects (ALE) analyses were applied to examine the effects of variables on ROP within these machine learning models. For tree-based models, numerical derivative methods were used, similar to parametric models where analytical derivatives are not feasible. These analyses reveal both global and local effects of variables, enhancing model interpretability and providing a reliable impact assessment for ROP prediction.
2. Materials and Methods
2.1. Data Used in the Study
The dataset employed in this study is derived from field and laboratory measurements obtained from a tunnel project located in the Queens area of southwestern New York [
3]. This dataset, widely used in the literature for evaluating TBM performance [
3,
4,
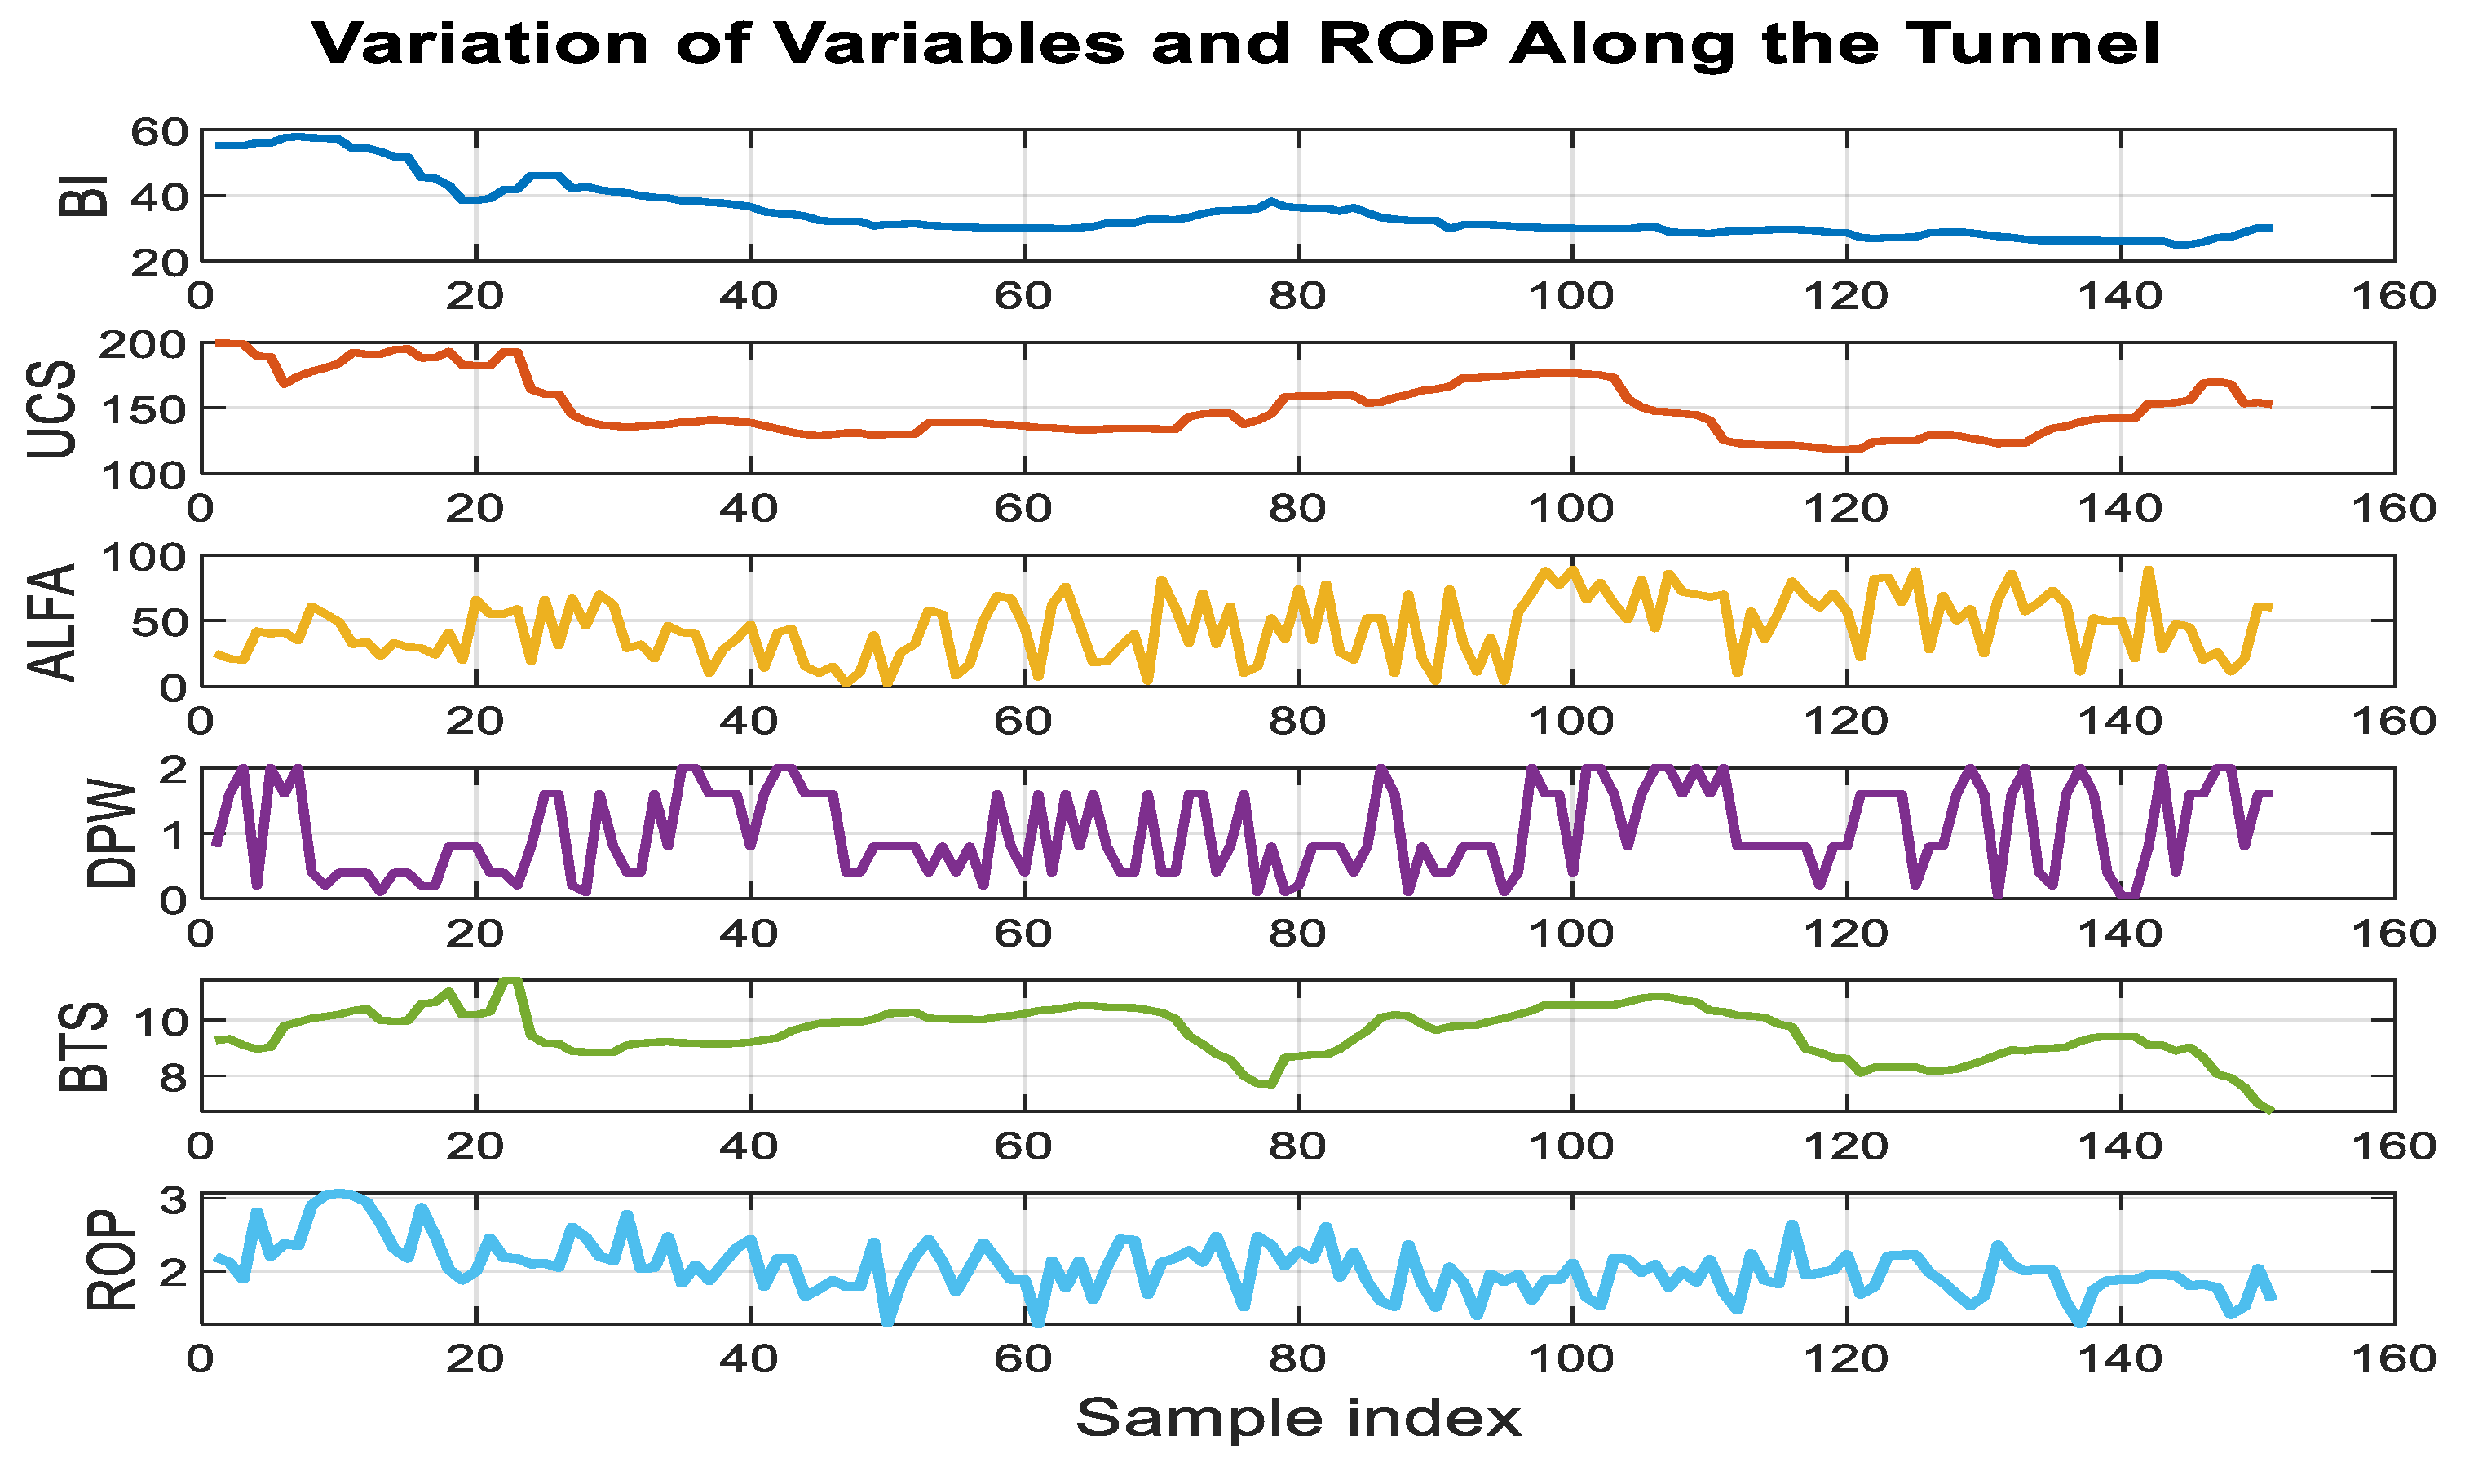
5], includes key variables that enable the prediction of the tunnel boring machine’s rate of penetration (ROP). The measured parameters encompass both geotechnical and geometric variables, including uniaxial compressive strength (UCS), Brazilian tensile strength (BTS), rock hardness index (BI), excavation depth (DPW), and joint angle (α). These variables are critical for modeling TBM performance and reliably predicting ROP.
Variations in these parameters along the tunnel alignment are presented in
Figure 1, while the basic statistical characteristics of the dataset are summarized in
Table 1. As evident in
Figure 1, the relationship between the input variables in the first five columns and the observed ROP values in the last column exhibits a highly complex structure. This complexity underscores the difficulty of explaining penetration rate through a single simple relationship. Therefore, in this study, mathematical models with different functional forms were developed, and the parameters of these models were optimized. The resulting model outputs were then analyzed and compared using various error evaluation metrics.
2.2. Analysis of Model Inputs
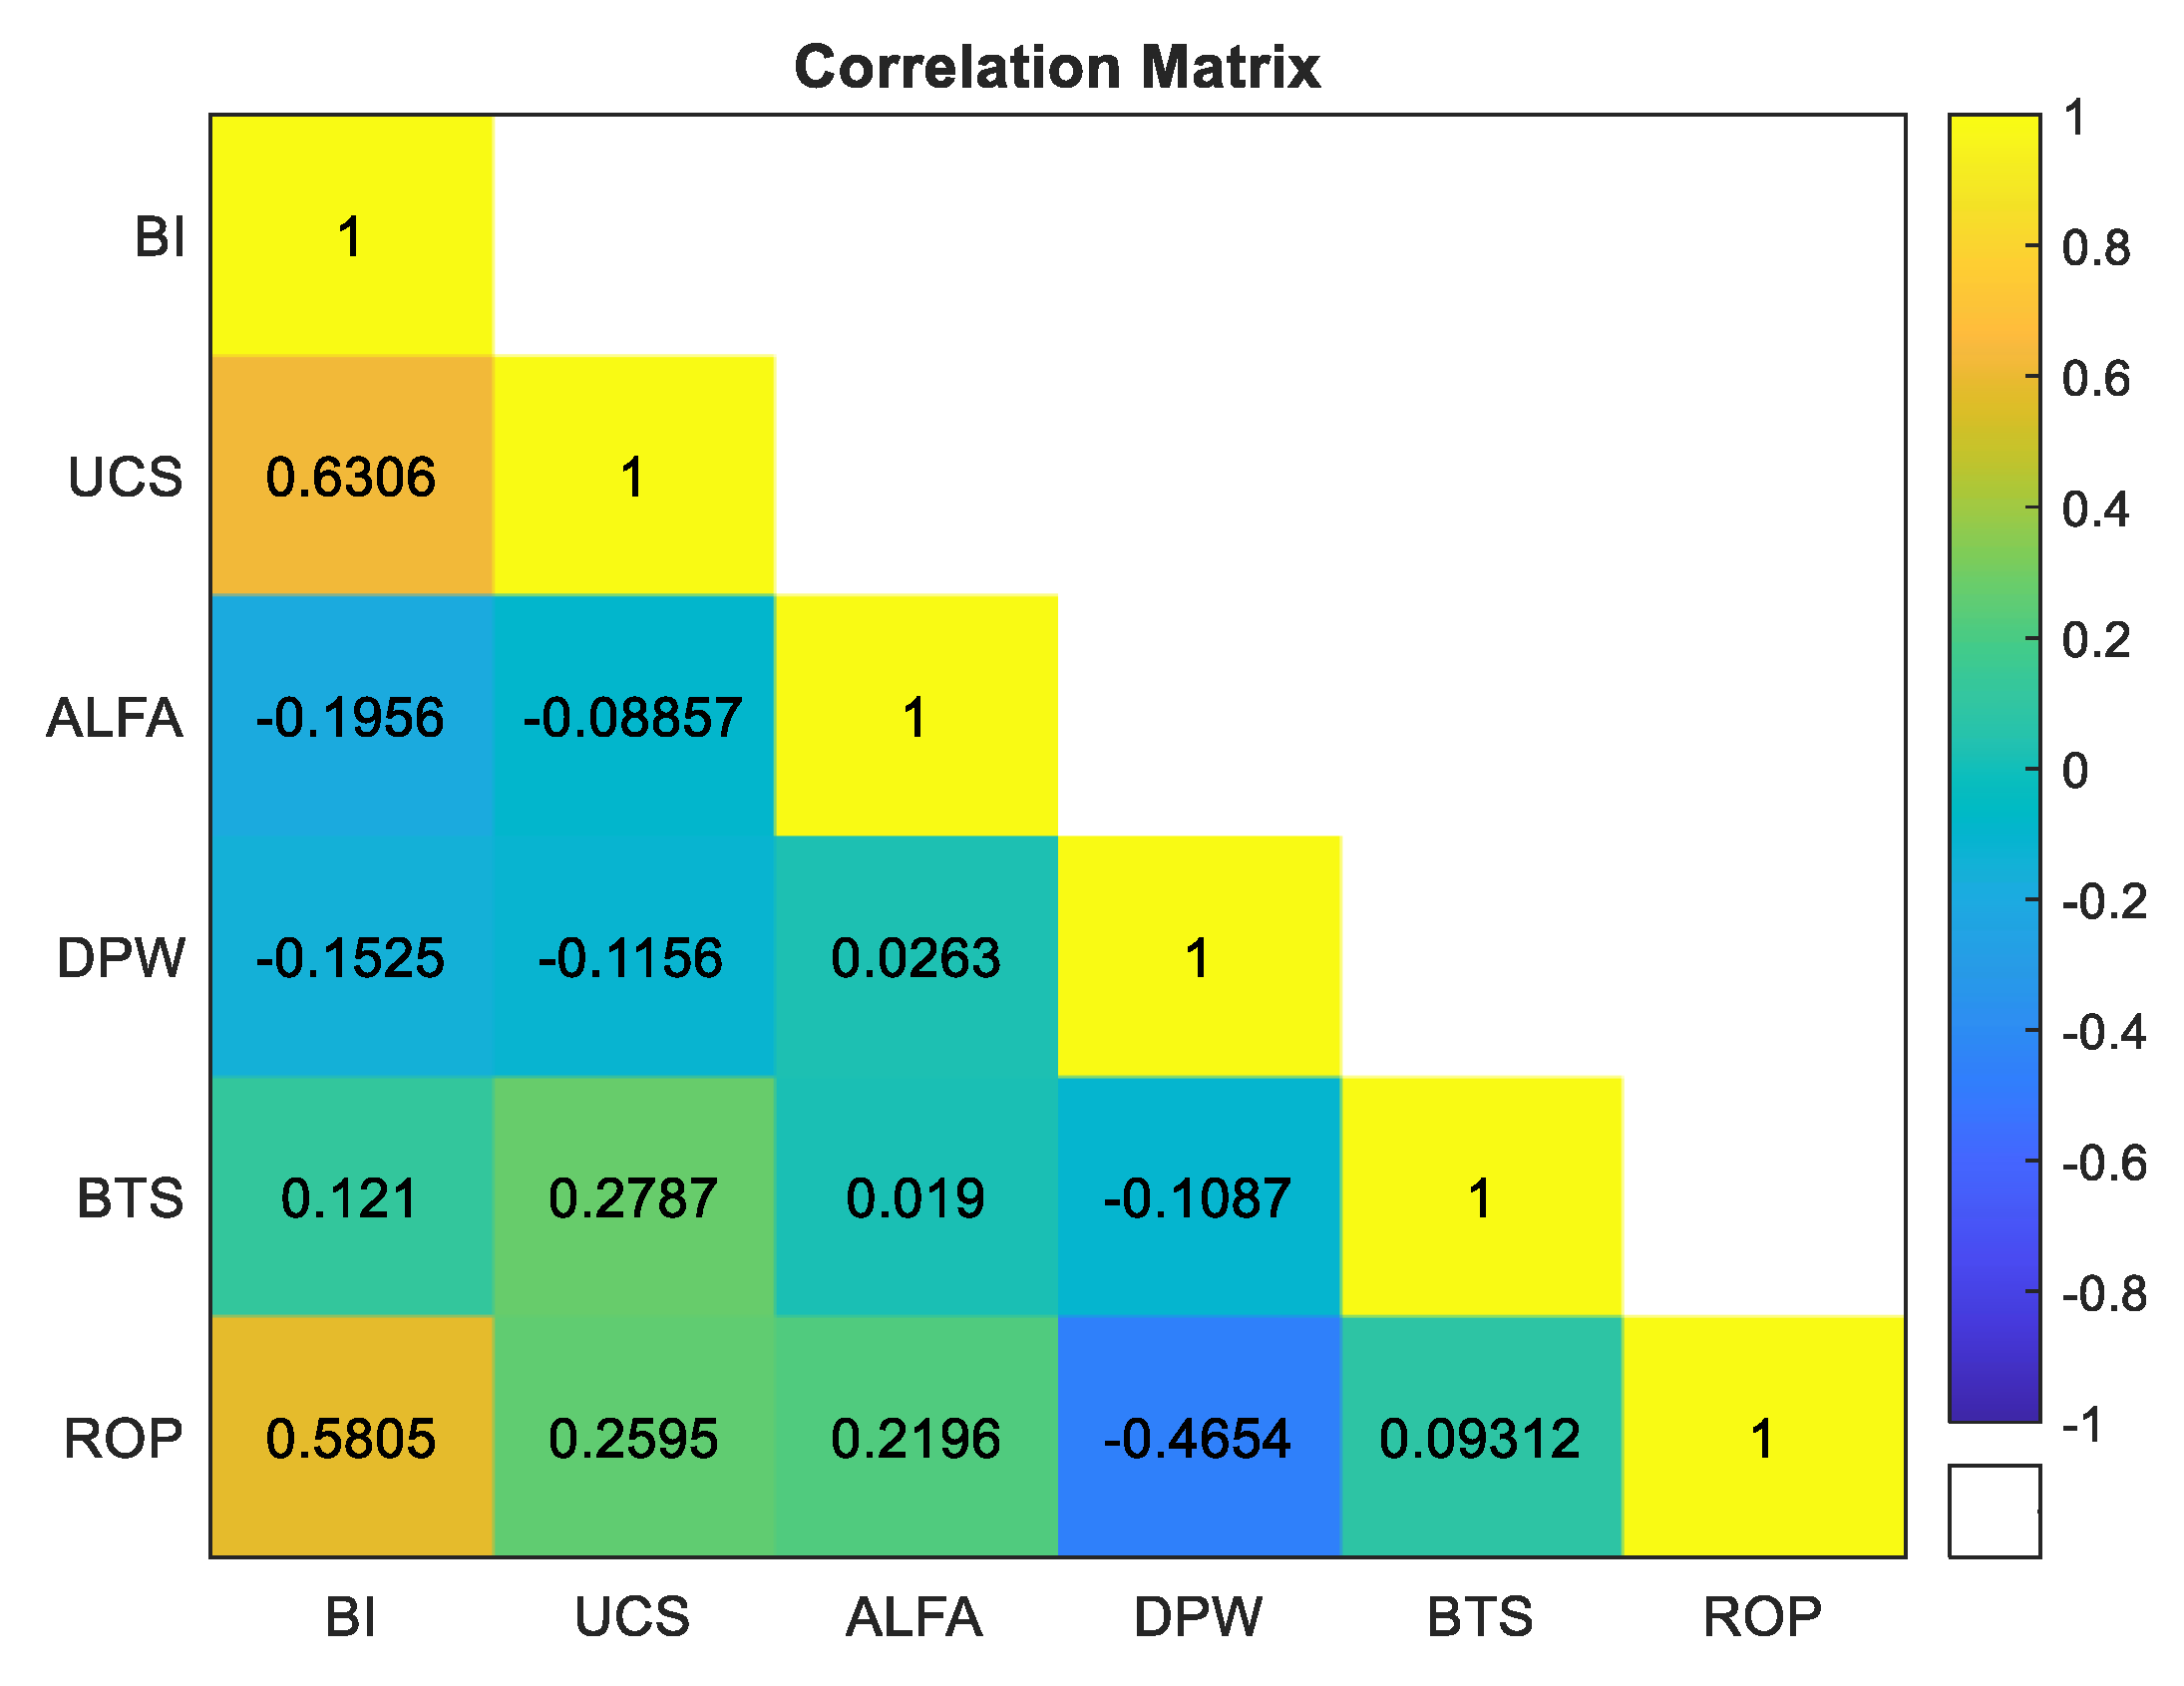
Examination of
Figure 2 indicates that the strongest positive correlation with penetration rate (ROP) is observed for the rock hardness index (BI) (r = 0.5805). Uniaxial compressive strength (UCS) exhibits a moderate positive correlation with ROP (r = 0.2595), whereas the influence of joint angle (α) is relatively lower (r = 0.2196). In contrast, excavation depth (DPW) shows a notable negative correlation with ROP (r = –0.4654), indicating an inverse effect on penetration rate. Brazilian tensile strength (BTS) demonstrates a very weak positive correlation with ROP (r = 0.0931). Although BTS is often neglected in previous studies, preliminary analyses conducted in this work revealed that including BTS contributes, albeit modestly, to improved model performance. Therefore, BTS was retained in the model formulations. Overall, BI appears as the most dominant factor affecting ROP, while UCS and α also provide meaningful contributions to penetration rate prediction.
2.3. Models Used in the Study
To predict the penetration rate of tunnel boring machines (ROP), five core model approaches with varying levels of complexity were evaluated. The selection and inclusion order of independent variables in these models were determined based on the correlation matrix presented in
Figure 1, following a stepwise progression from simple mathematical expressions to more complex structures.
First, a linear regression model was implemented, focusing on the linear relationships between dependent and independent variables within the classical multiple linear regression framework [
36,
37]. This approach aims to reveal the direct and proportional effects of the input variables on ROP.
To extend beyond the linear assumption, an exponential regression model was developed, wherein the linear combination of independent variables is expressed through an exponential function. This allows nonlinear effects to be incorporated into the model [
36].
Additionally, the multiplicative nonlinear model represents ROP as the product of independent variables raised to different powers. This structure enables estimation of parameters using nonlinear regression techniques, thereby flexibly representing the relative effects of variables on ROP [
37,
38,
39,
40,
41,
42,
43].
More advanced hybrid nonlinear models integrate linear terms with power functions, logarithmic transformations, and interactions among variables. Parameters for these models were determined using heuristic optimization techniques such as Genetic Algorithm (GA), Particle Swarm Optimization (PSO), Firefly Algorithm (FA), and Symbiotic Organisms Search (SOS). The hybrid approach combines the strengths of empirical modeling and machine learning–based methods, providing greater flexibility and higher representational capacity for ROP prediction [
5,
6,
7].
All these mathematical models, developed to better capture the complex and nonlinear relationships between ROP and independent variables observed in
Figure 1, are summarized in
Table 2. In this context, Equation (1) defines variable effects within a linear structure, while Equation (2) transforms the same relationships into a nonlinear form via exponential functions. Equation (3) represents variable effects using power terms, whereas Equations (4) and (5) correspond to hybrid models incorporating both linear and nonlinear components. The most comprehensive model, Equation (6), includes interaction terms such as BI × DPW, enhancing model explanatory power. Parameters for the first three models were determined using classical regression techniques, while more complex structures relied on heuristic optimization algorithms [
5,
7].
2.4. Determination of Model Parameters
2.4.1. Parameter Estimation Strategies
The methods used to estimate model parameters vary depending on the mathematical structure and complexity of the model. For linear models, parameter estimation is typically performed using Ordinary Least Squares (OLS) [
41]. In cases involving multicollinearity or overfitting, regularized regression techniques such as Ridge and Lasso are employed. For exponential or log-transformed models, appropriate mathematical transformations can linearize the problem, allowing classical linear regression methods to be applied.
In contrast, nonlinear models—particularly those containing numerous parameters—pose a more complex estimation problem. While nonlinear least squares and derivative-based optimization methods are commonly used, strong interactions among variables and complex error surfaces often lead these approaches to become trapped in local minima, preventing convergence to the global optimum [
37,
38,
39,
40,
41,
42,
43].
To overcome these challenges, metaheuristic optimization algorithms are widely employed in the literature. These algorithms explore the solution space through stochastic and guided search mechanisms, reducing the risk of local minima and improving the likelihood of obtaining near-global optimal solutions. Genetic Algorithm (GA) [
44,
45], Particle Swarm Optimization (PSO) [
46,
47], and Firefly Algorithm (FA) [
48,
49] are frequently applied in TBM performance modeling for this purpose.
In the present study, all parametric model coefficients were determined using the Differential Evolution (DE) algorithm [
26,
27]. DE is a population-based evolutionary optimization method that is particularly effective for continuous and nonlinear problems, offering high convergence reliability and robustness. The algorithm iteratively applies mutation, crossover, and selection operations on an initially randomly generated solution population, aiming to identify the parameter set that minimizes the objective function. Key advantages of DE include its derivative-free operation, relatively simple parameter tuning, and high potential to reach global optima even on complex error surfaces [
6,
50]. These characteristics make DE a reliable and efficient tool for parameter estimation in problems involving multiple variables and strong nonlinear relationships, such as TBM penetration rate prediction.
2.4.2. Model Performance Evaluation
To quantitatively assess model performance, various statistical indicators were employed to evaluate the agreement between predicted and observed values. The most commonly used metrics include the coefficient of determination (R²), root mean square error (RMSE), mean absolute error (MAE), and mean absolute percentage error (MAPE) [
51,
52,
53,
54].
The R² coefficient reflects the model’s explanatory power, while RMSE is sensitive to large errors. MAE provides the average deviation of predictions, and MAPE expresses errors as percentages, enhancing interpretability [
51].
For machine learning–based models, datasets are typically split into training and testing subsets to evaluate generalization capability [
53,
54]. In cases of limited data, noise can be added to improve model robustness [
55]. In this study, the dataset was randomly divided into 80% training and 20% testing sets, and the models’ ability to generalize to unseen data was analyzed.
The aforementioned performance metrics were applied to both classical regression models and nonlinear models supported by metaheuristic optimization. The resulting outcomes were then compared with machine learning–based methods, providing a comprehensive assessment of model interpretability, error performance, and generalization capability.
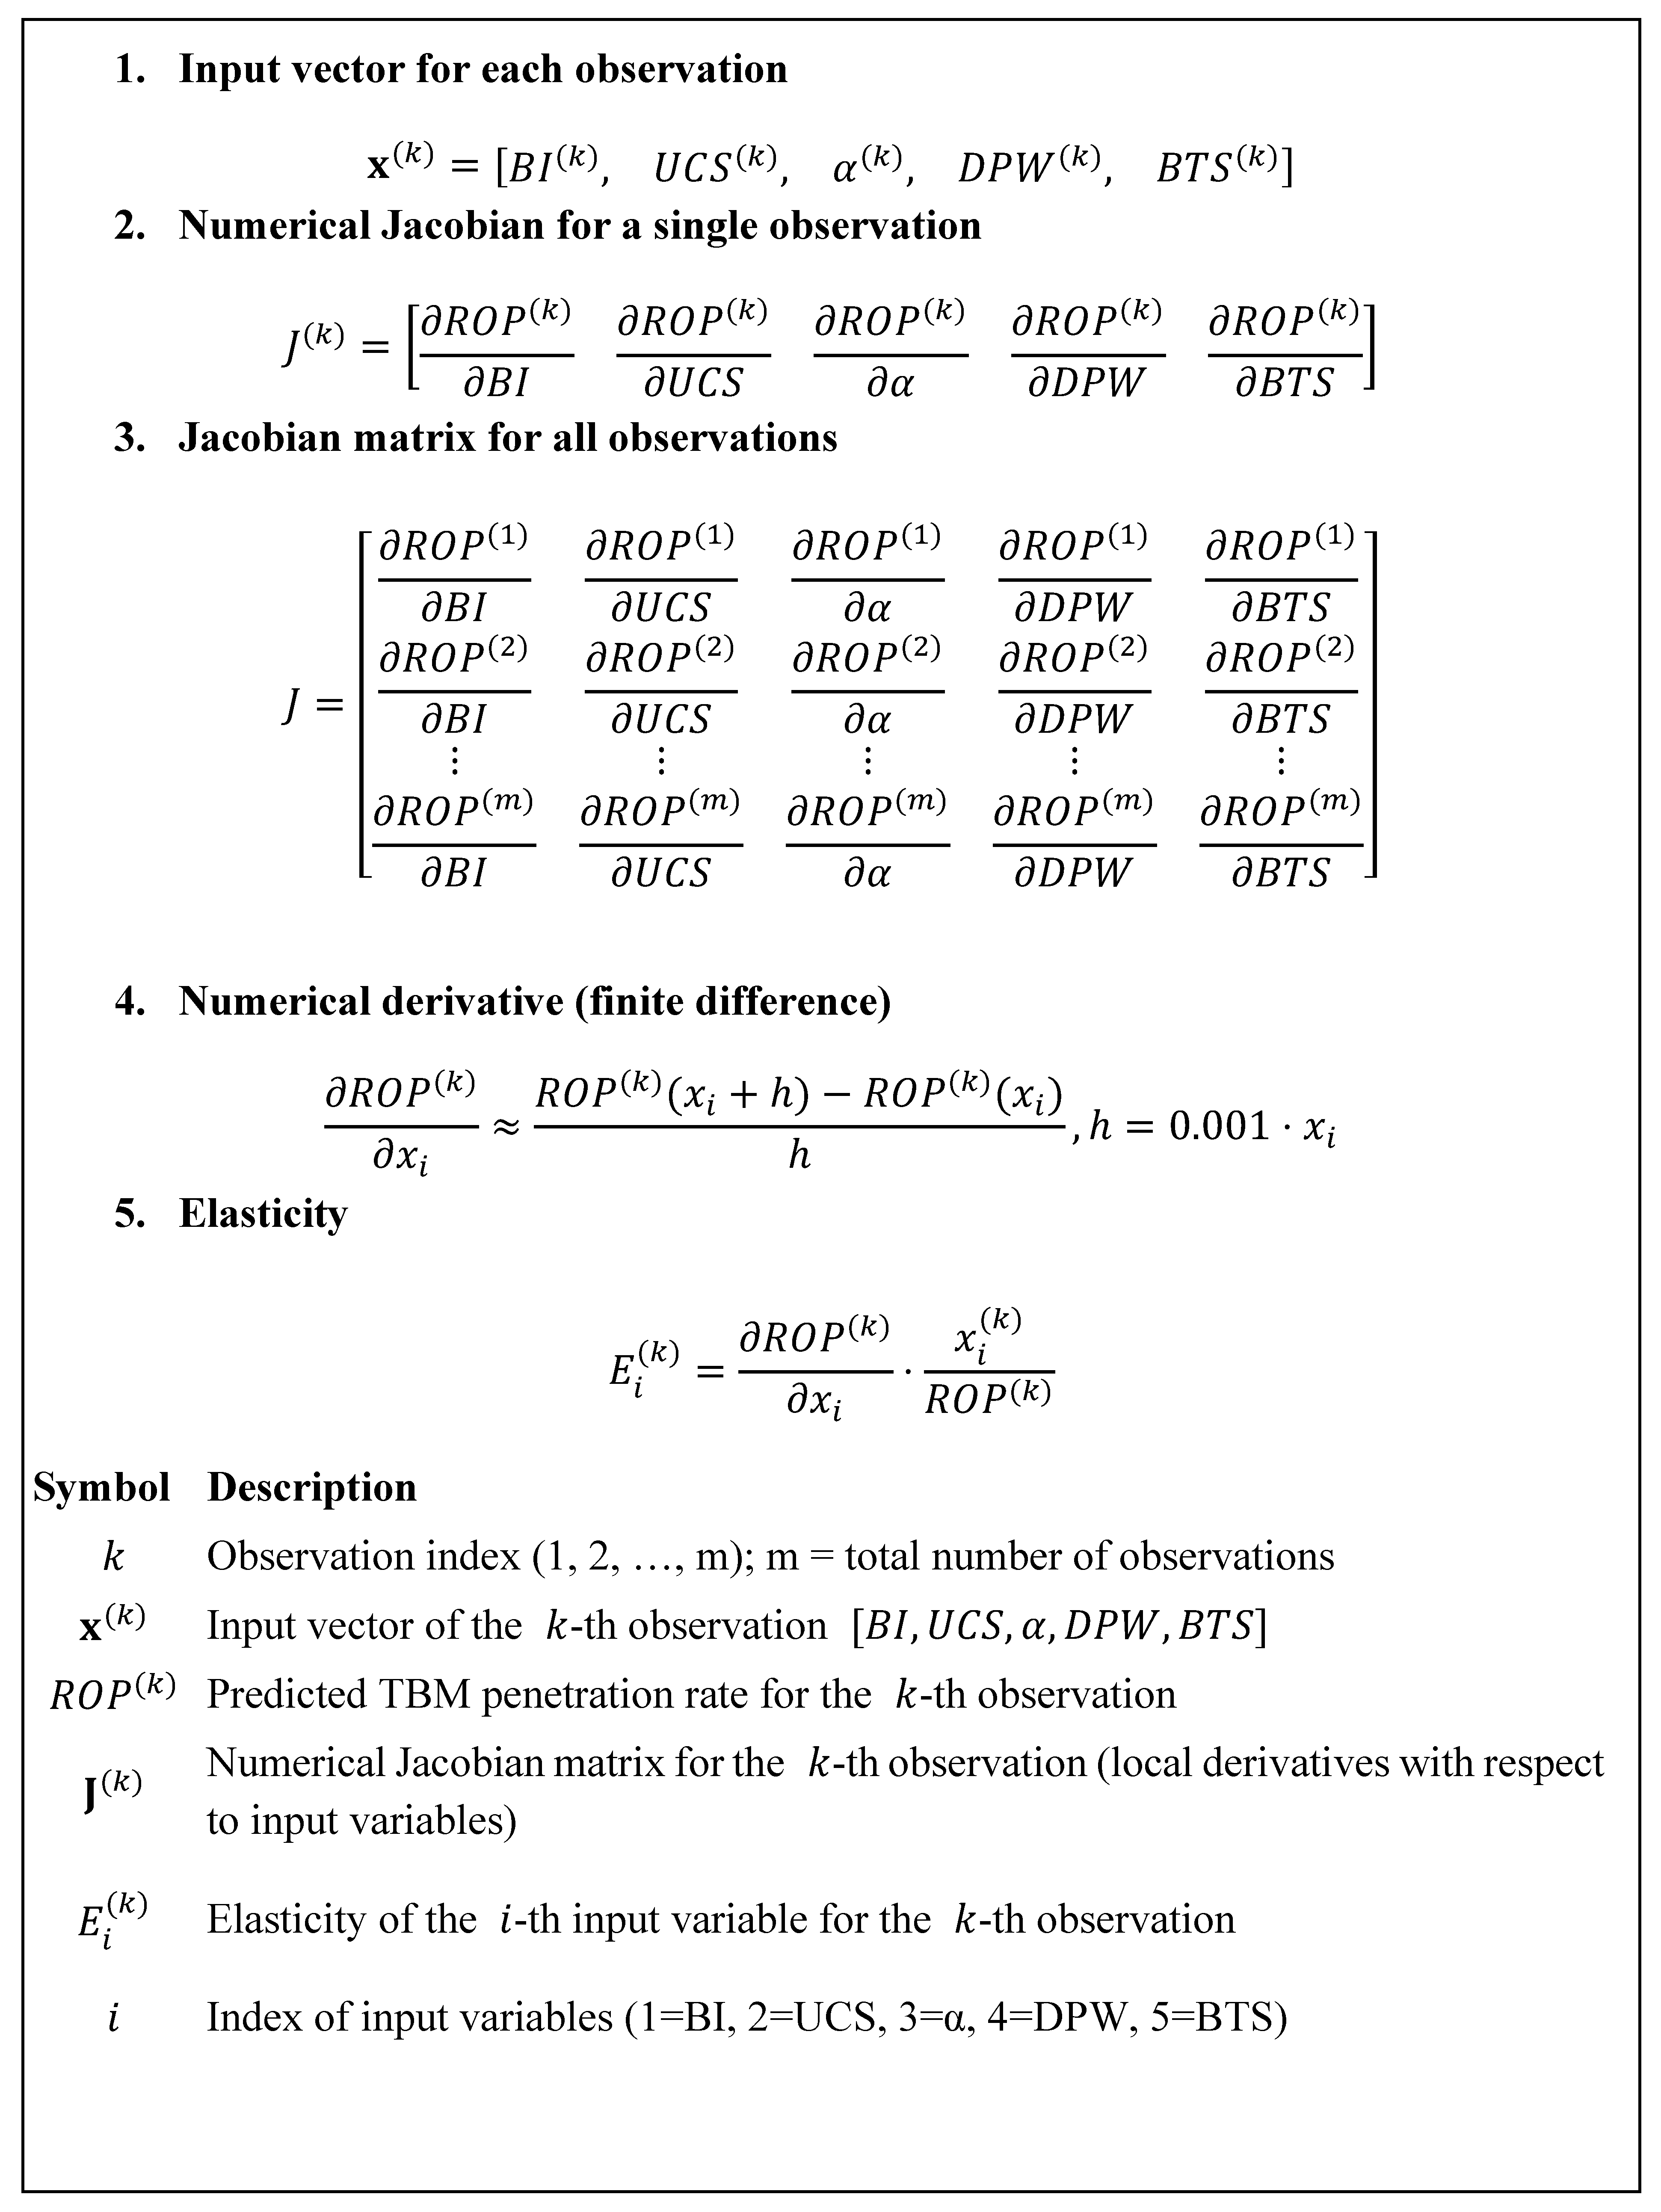
2.5. Jacobian-Based Elasticity Analysis
In this study, a Jacobian-based elasticity approach was employed to evaluate the sensitivity of the TBM penetration rate prediction model with respect to its input variables [
56]. For a single-output model:
And
representing the vector of input variables.
For each observation in the dataset, local derivatives of the model with respect to the input variables are computed, providing a detailed depiction of the model’s sensitivity structure. By aggregating the derivatives across all observations, a Jacobian matrix is constructed with dimensions
, where
is the number of observations and
is the number of input variables:
Here,
represents the model’s predicted value for the
-th observation. Each row corresponds to the local sensitivity vector at the respective observation point [
57,
58].
To assess the relative influence of each variable, the elasticity measure is used. Elasticity is a dimensionless quantity that expresses the proportional effect of a proportional change in an input variable on the output. Following the classical econometric definition, it is given by:
This expression provides a general definition of elasticity for any model, indicating the proportional impact on
of a 1% change in
. Computing elasticity for all observations yields an elasticity matrix
[
58], with each element calculated as:
In vector form, the elasticity matrix can be expressed as:
where
is the observation matrix (
),
is the predicted output vector (
), and
denotes element-wise multiplication. The notation
indicates that each
value is divided by the corresponding
value. For clarity, the
matrix comprises the column vectors of the model variables BI, UCS, α, DPW, and BTS, while
consists of the ROP column vector.
This approach enables quantitative analysis of the model’s sensitivity to each input variable, both at the individual observation level and across the model as a whole. Moreover, for nonlinear and “black-box” models such as SVM, GAM, or other machine learning approaches, this method facilitates local-level interpretability, providing a clearer insight into the decision-making mechanism of the model.
For parametric models, derivatives are obtained analytically, whereas for black-box machine learning models, the Jacobian can be computed numerically. This allows the approach to be applied consistently across all model types. Parametric model Jacobians and elasticities are detailed in
Appendix A.1, and the interpretability and sensitivity analyses of black-box models are presented in
Appendix A.2.
3. Model Application and Results
3.1. Implementation of Parametric Models (M1–M6)
This section presents the implementation process of the parametric models (M1–M6) developed for predicting the TBM penetration rate (ROP). Both classical regression approaches—including linear, exponential, and multiplicative nonlinear models—and hybrid nonlinear models supported by heuristic optimization techniques were evaluated in this study.
Parameters for the models defined in Equations (1)–(3) were estimated using conventional methods. Specifically, the linear model was fitted using Ordinary Least Squares (OLS) [
36,
37], while the exponential and multiplicative nonlinear models were estimated via Nonlinear Least Squares (NLS) [
38,
39,
40,
41].
For the hybrid models expressed in Equations (4)–(6), parameter optimization was performed using the Differential Evolution (DE) algorithm [
26,
27], which is capable of accommodating nonlinear and complex data relationships more effectively.
The optimized model parameters are presented in
Table 3, while the performance evaluations of the models based on various error metrics are provided comparatively in
Table 4.
An examination of the results presented in
Table 4 reveals a consistent increase in the correlation coefficient (R) and the coefficient of determination (R²) from M1 to M6, accompanied by a pronounced decrease in RMSE and MAE values. This trend reflects an improved representation of inter-variable relationships as model structures evolve from linear and relatively simple forms to more complex nonlinear formulations.
While the initial models express independent variables through linear or limited logarithmic and exponential transformations, subsequent models incorporate exponential, logarithmic, and interaction terms, resulting in a substantial improvement in prediction accuracy. Among these, the M6 model—applied for the first time in this study and explicitly accounting for inter-variable interactions—achieves the highest goodness-of-fit metrics and the lowest error values in TBM performance prediction.
In particular, the Brazilian tensile strength (BTS) variable, which has often been neglected in previous studies, was found to make no significant contribution in Equations (1)–(3). However, when interaction terms were introduced in Equations (4)–(6), BTS led to a marked improvement in model performance. In this context, the M6 model emerges as the most successful among the examined parametric models, yielding the highest R² value (0.69) and the lowest RMSE (0.20).
Furthermore, the superior test performance obtained in this study, compared with commonly referenced parametric models in the literature [
4,
5,
6], demonstrates that the proposed model offers a robust and reliable alternative for TBM penetration rate prediction. In engineering applications, understanding the relative contributions of input variables is as critical as achieving high predictive accuracy. Accordingly, this study not only focuses on improving model performance but also explicitly quantifies the relative effects of model inputs. This dual emphasis represents one of the most significant contributions of the present work to TBM performance modeling.
3.2. Feature Importance Analysis for Parametric Models
As shown in
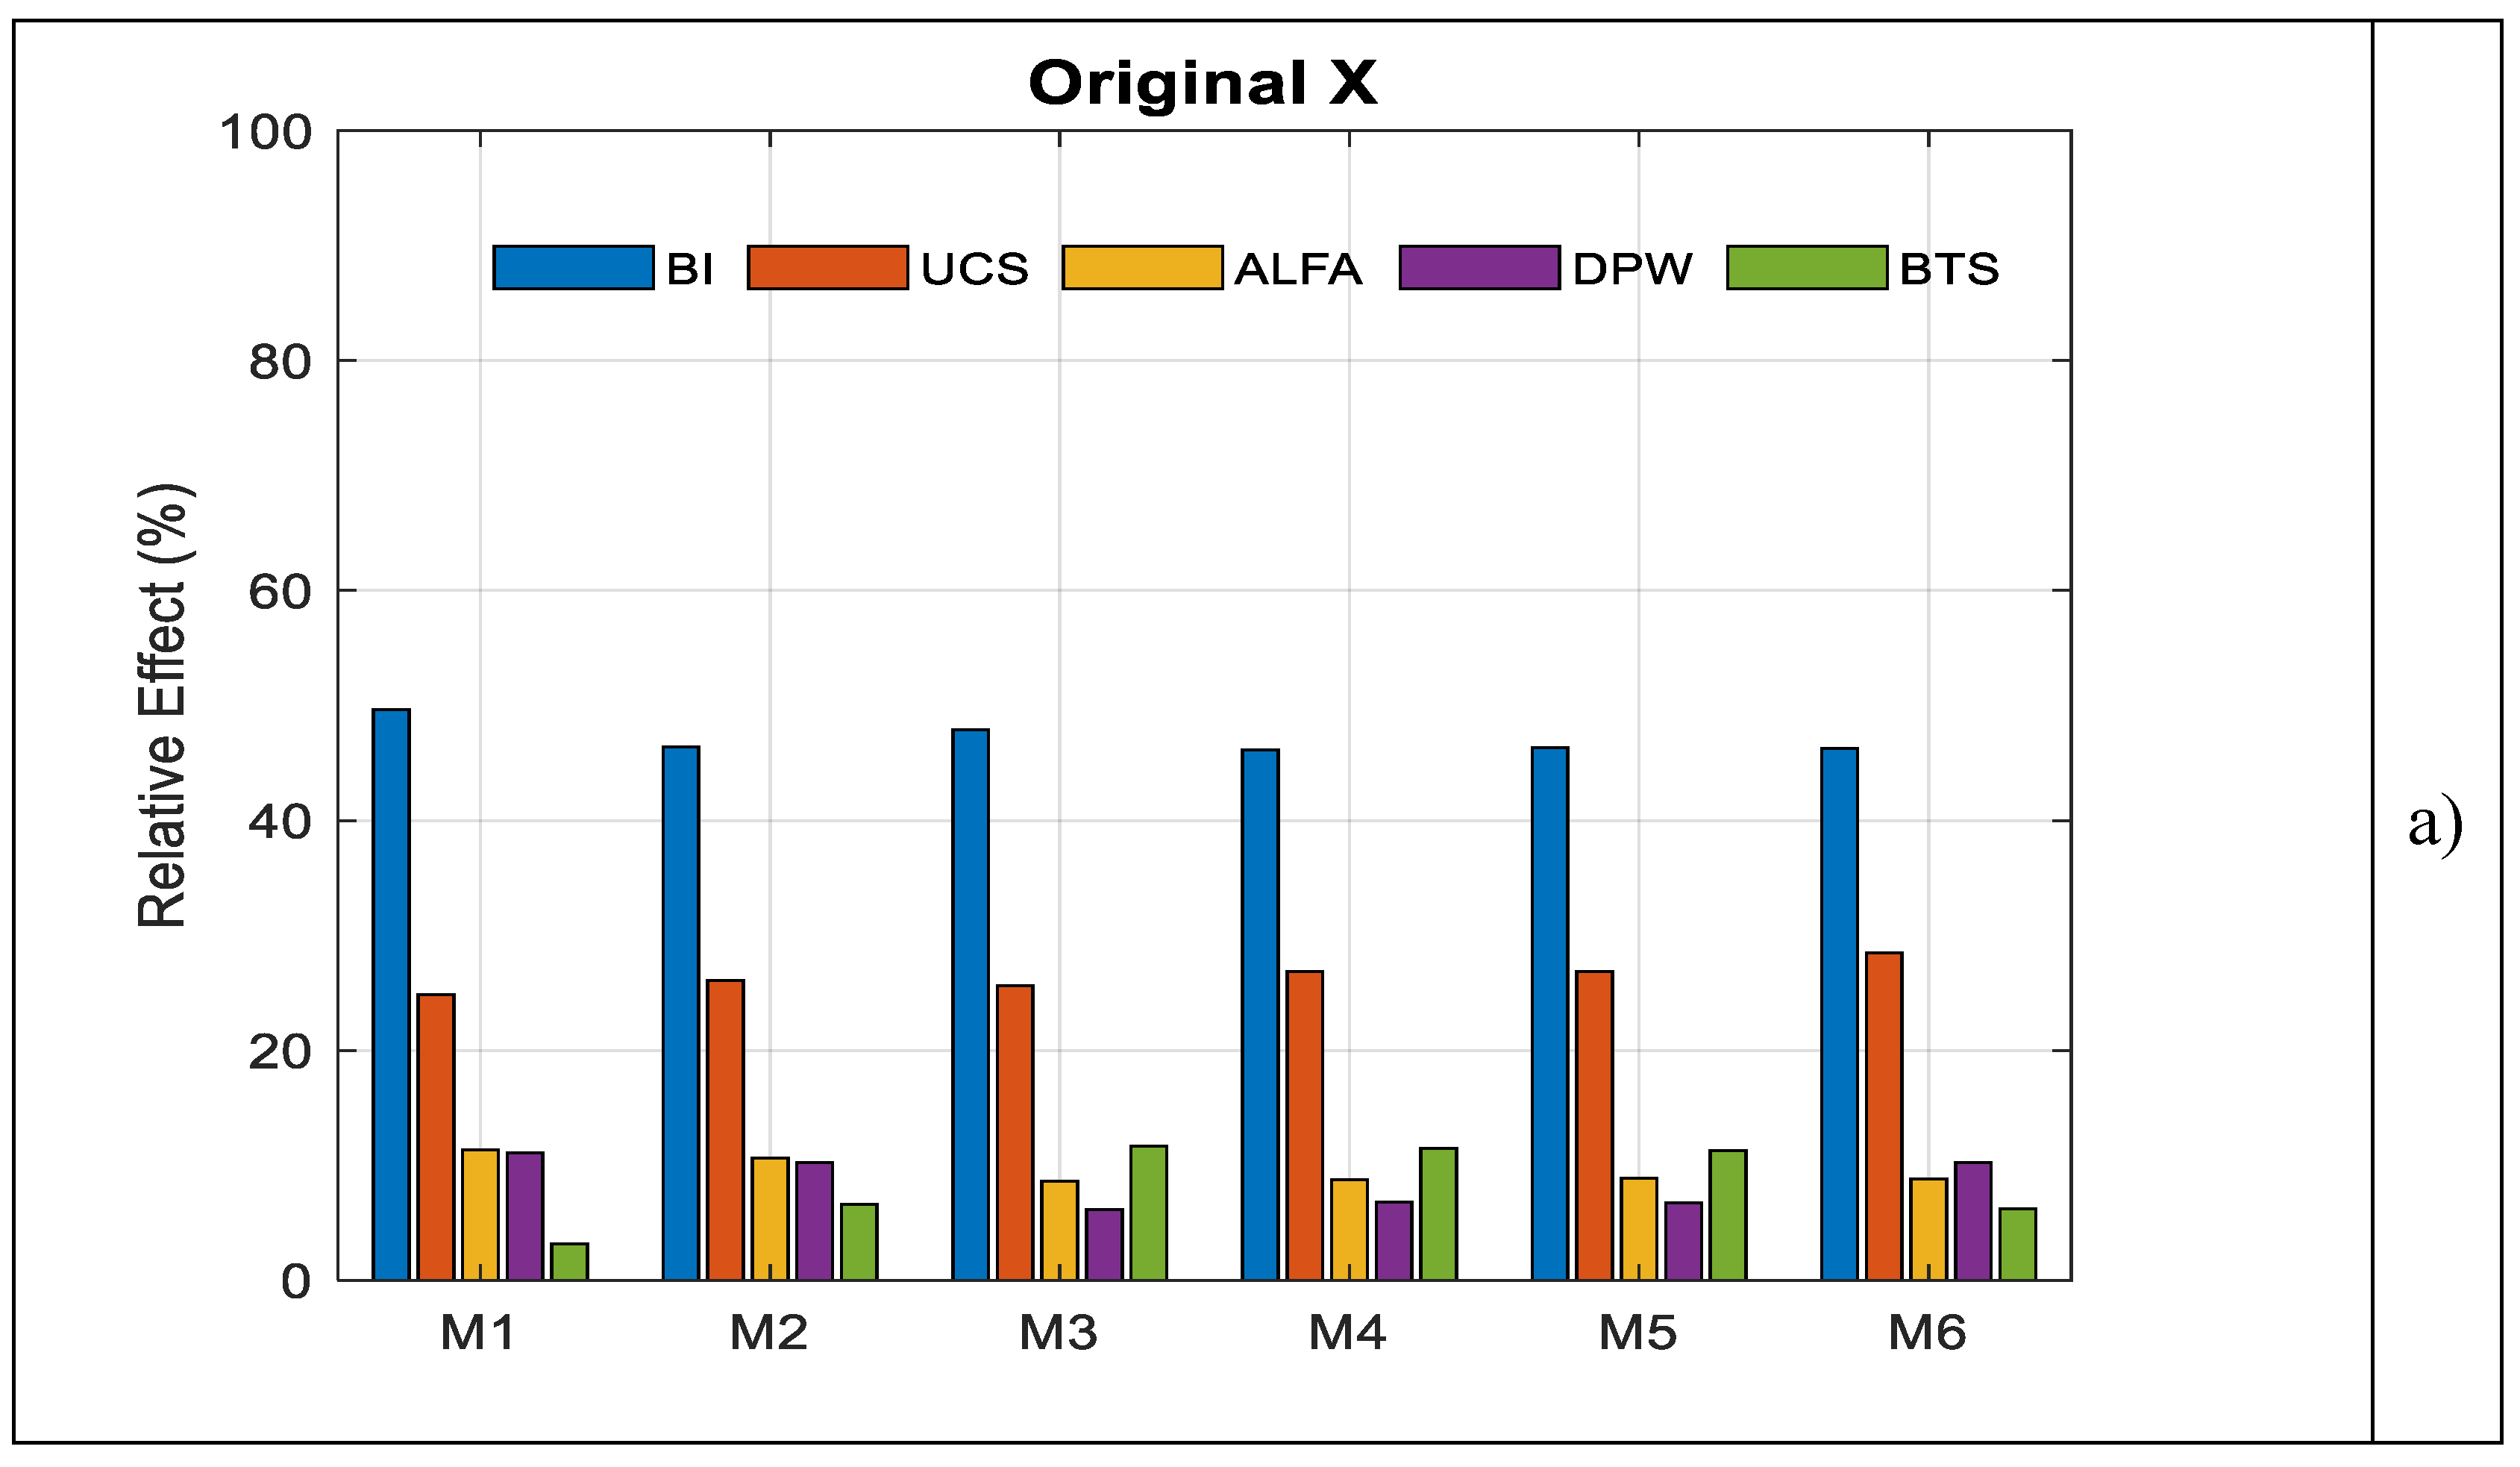
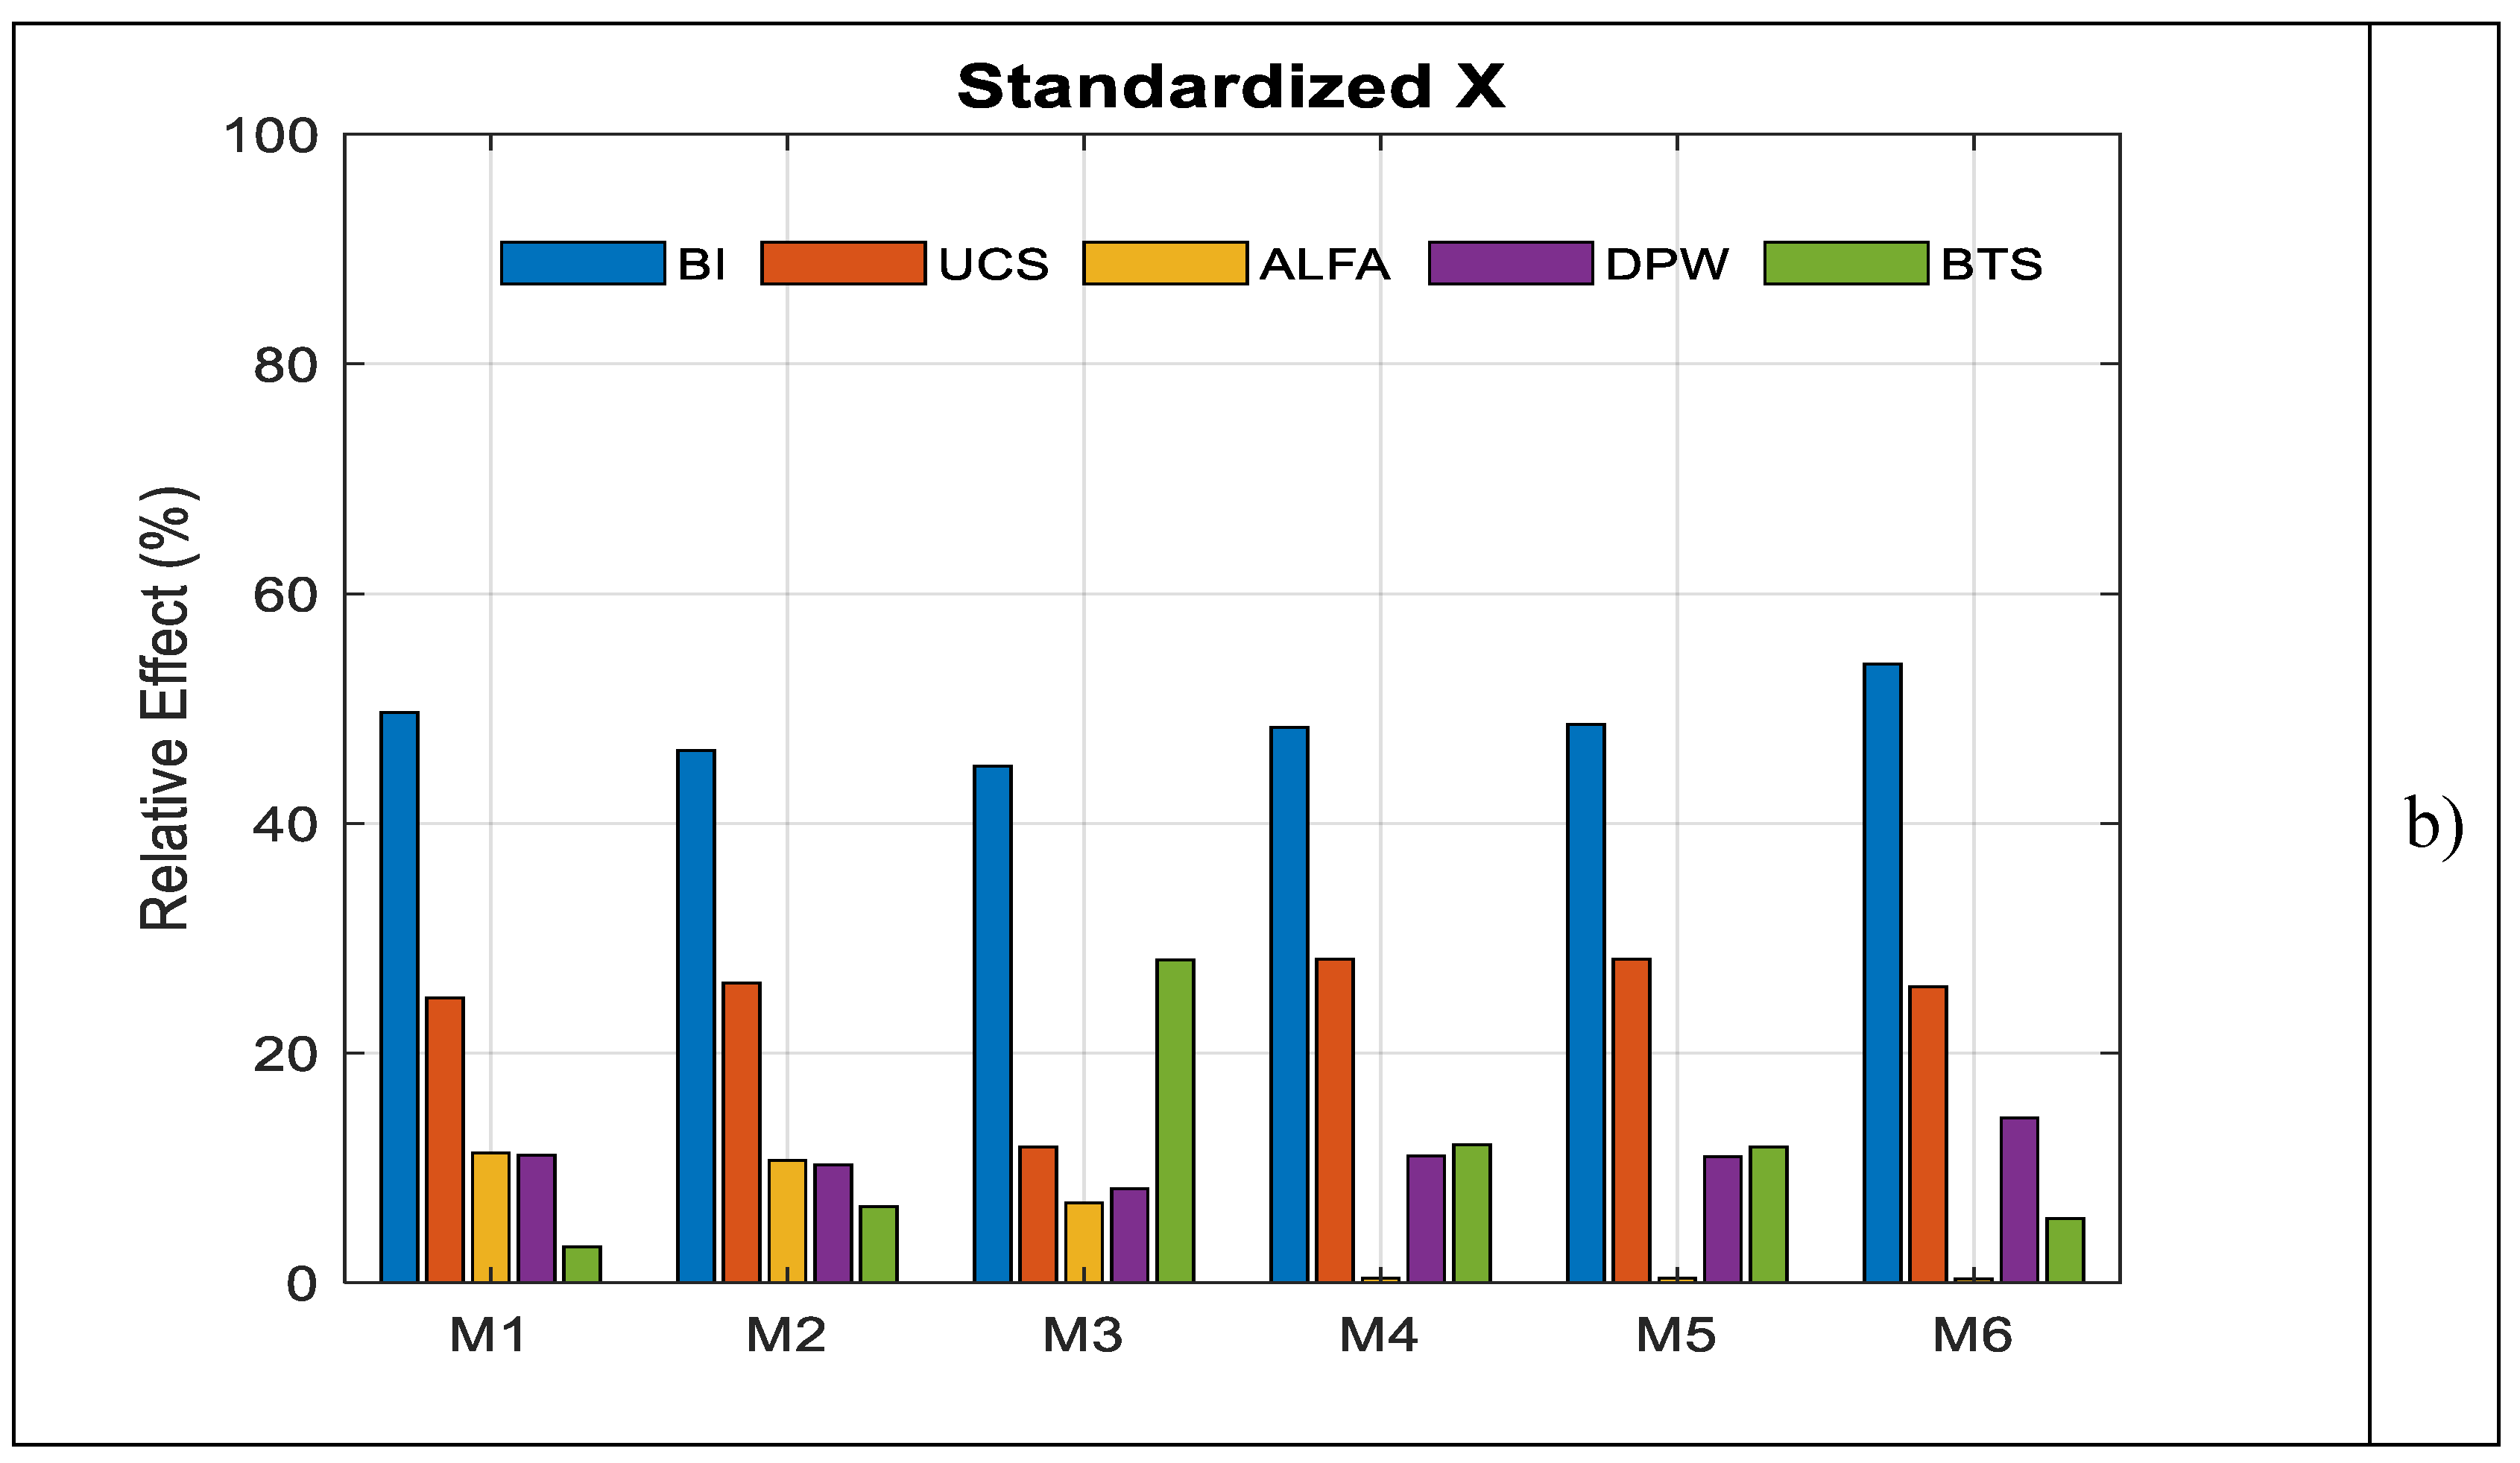
Table 1, the model variables exhibit substantially different mean values and scales; for instance, UCS is on the order of 150, whereas DPW is approximately 1. These scale differences necessitated the application of the Jacobian-based elasticity analysis under two distinct scenarios in order to reliably assess the relative influence of the model variables:
In both scenarios, the relative weights of the model inputs were computed, and the results are presented comparatively in
Figure 3.
The strongest positive relationship with the penetration rate (ROP) is observed for the rock brittleness index (BI) (r = 0.5805), followed by the uniaxial compressive strength (UCS) (r = 0.2595).
Figure 3 further indicates that the effects of BI and UCS on the model outputs remain consistently high across all models, both for the original and standardized datasets.
These findings are consistent with the correlation matrix of the variables, confirming that the models successfully capture the relationships between ROP and the input parameters. A more detailed examination shows that the influence of the joint angle (α) is relatively weak (r = 0.2196). In contrast, a pronounced negative relationship is observed between penetration depth per revolution (DPW) and ROP (r = −0.4654), indicating that an increase in DPW leads to a decrease in penetration rate, and thus DPW adversely affects ROP.
3.3. Feature Importance Analysis for Machine Learning Models
Feature importance analysis is a fundamental explainability approach that reveals which input variables a machine learning model relies on—and to what extent—when predicting the target variable. This analysis is critical not only for evaluating predictive performance but also for understanding the mechanisms through which that performance is achieved. It is particularly effective in tree-based methods (e.g., Random Forest and Gradient Boosting), where it serves as a powerful tool for interpreting the model’s decision-making process [
28,
29,
30].
The primary objective of feature importance analysis is to quantify the relative contributions of variables within the dataset, thereby enhancing model transparency. By identifying the inputs that contribute most significantly to prediction accuracy, the “black-box” nature of machine learning models can be substantially reduced [
59].
In addition, feature importance analysis offers notable advantages in terms of dimensionality reduction and model simplification. Removing variables with low contribution or high collinearity enables the development of more parsimonious and interpretable models, reduces training time and computational cost, and often improves generalization performance [
44]. Moreover, this approach allows for a comparative evaluation of variable priorities across different model types, providing clearer insights into the sensitivity of the model to specific input parameters.
Within the scope of this study, the effects of the input variables used for modeling TBM penetration rate (ROP) were systematically analyzed using four machine learning methods—Random Forest, Bagged Trees, Support Vector Machines (SVM), and Generalized Additive Models (GAM). Model performances under both original and standardized data scenarios were evaluated and comparatively summarized by method in
Table 5.
As shown in
Table 5, the GAM model consistently outperforms the other machine learning methods in both scenarios by achieving the highest correlation coefficient (R) and coefficient of determination (R²), along with the lowest error values (RMSE and MAE). In particular, in Scenario I, the GAM model attains an R² value of 0.906 and an RMSE of 0.110, indicating its strong capability to accurately capture the nonlinear relationships governing TBM penetration rate.
Overall, the use of original or standardized data leads to only marginal changes in the performance metrics of the Random Forest, Bagged Trees, and SVM models. This suggests that these methods exhibit relatively stable behavior with respect to data scaling choices. In contrast, the use of standardized data in the GAM model (Scenario II) results in a noticeable decline in performance, characterized by a reduction in R² and increases in RMSE and MAE values. Nevertheless, despite this decrease, the GAM model continues to outperform all other methods across all performance criteria in both scenarios. This finding indicates that, while GAM possesses a high representational capacity, it may be more sensitive to the original scale and distribution of input variables.
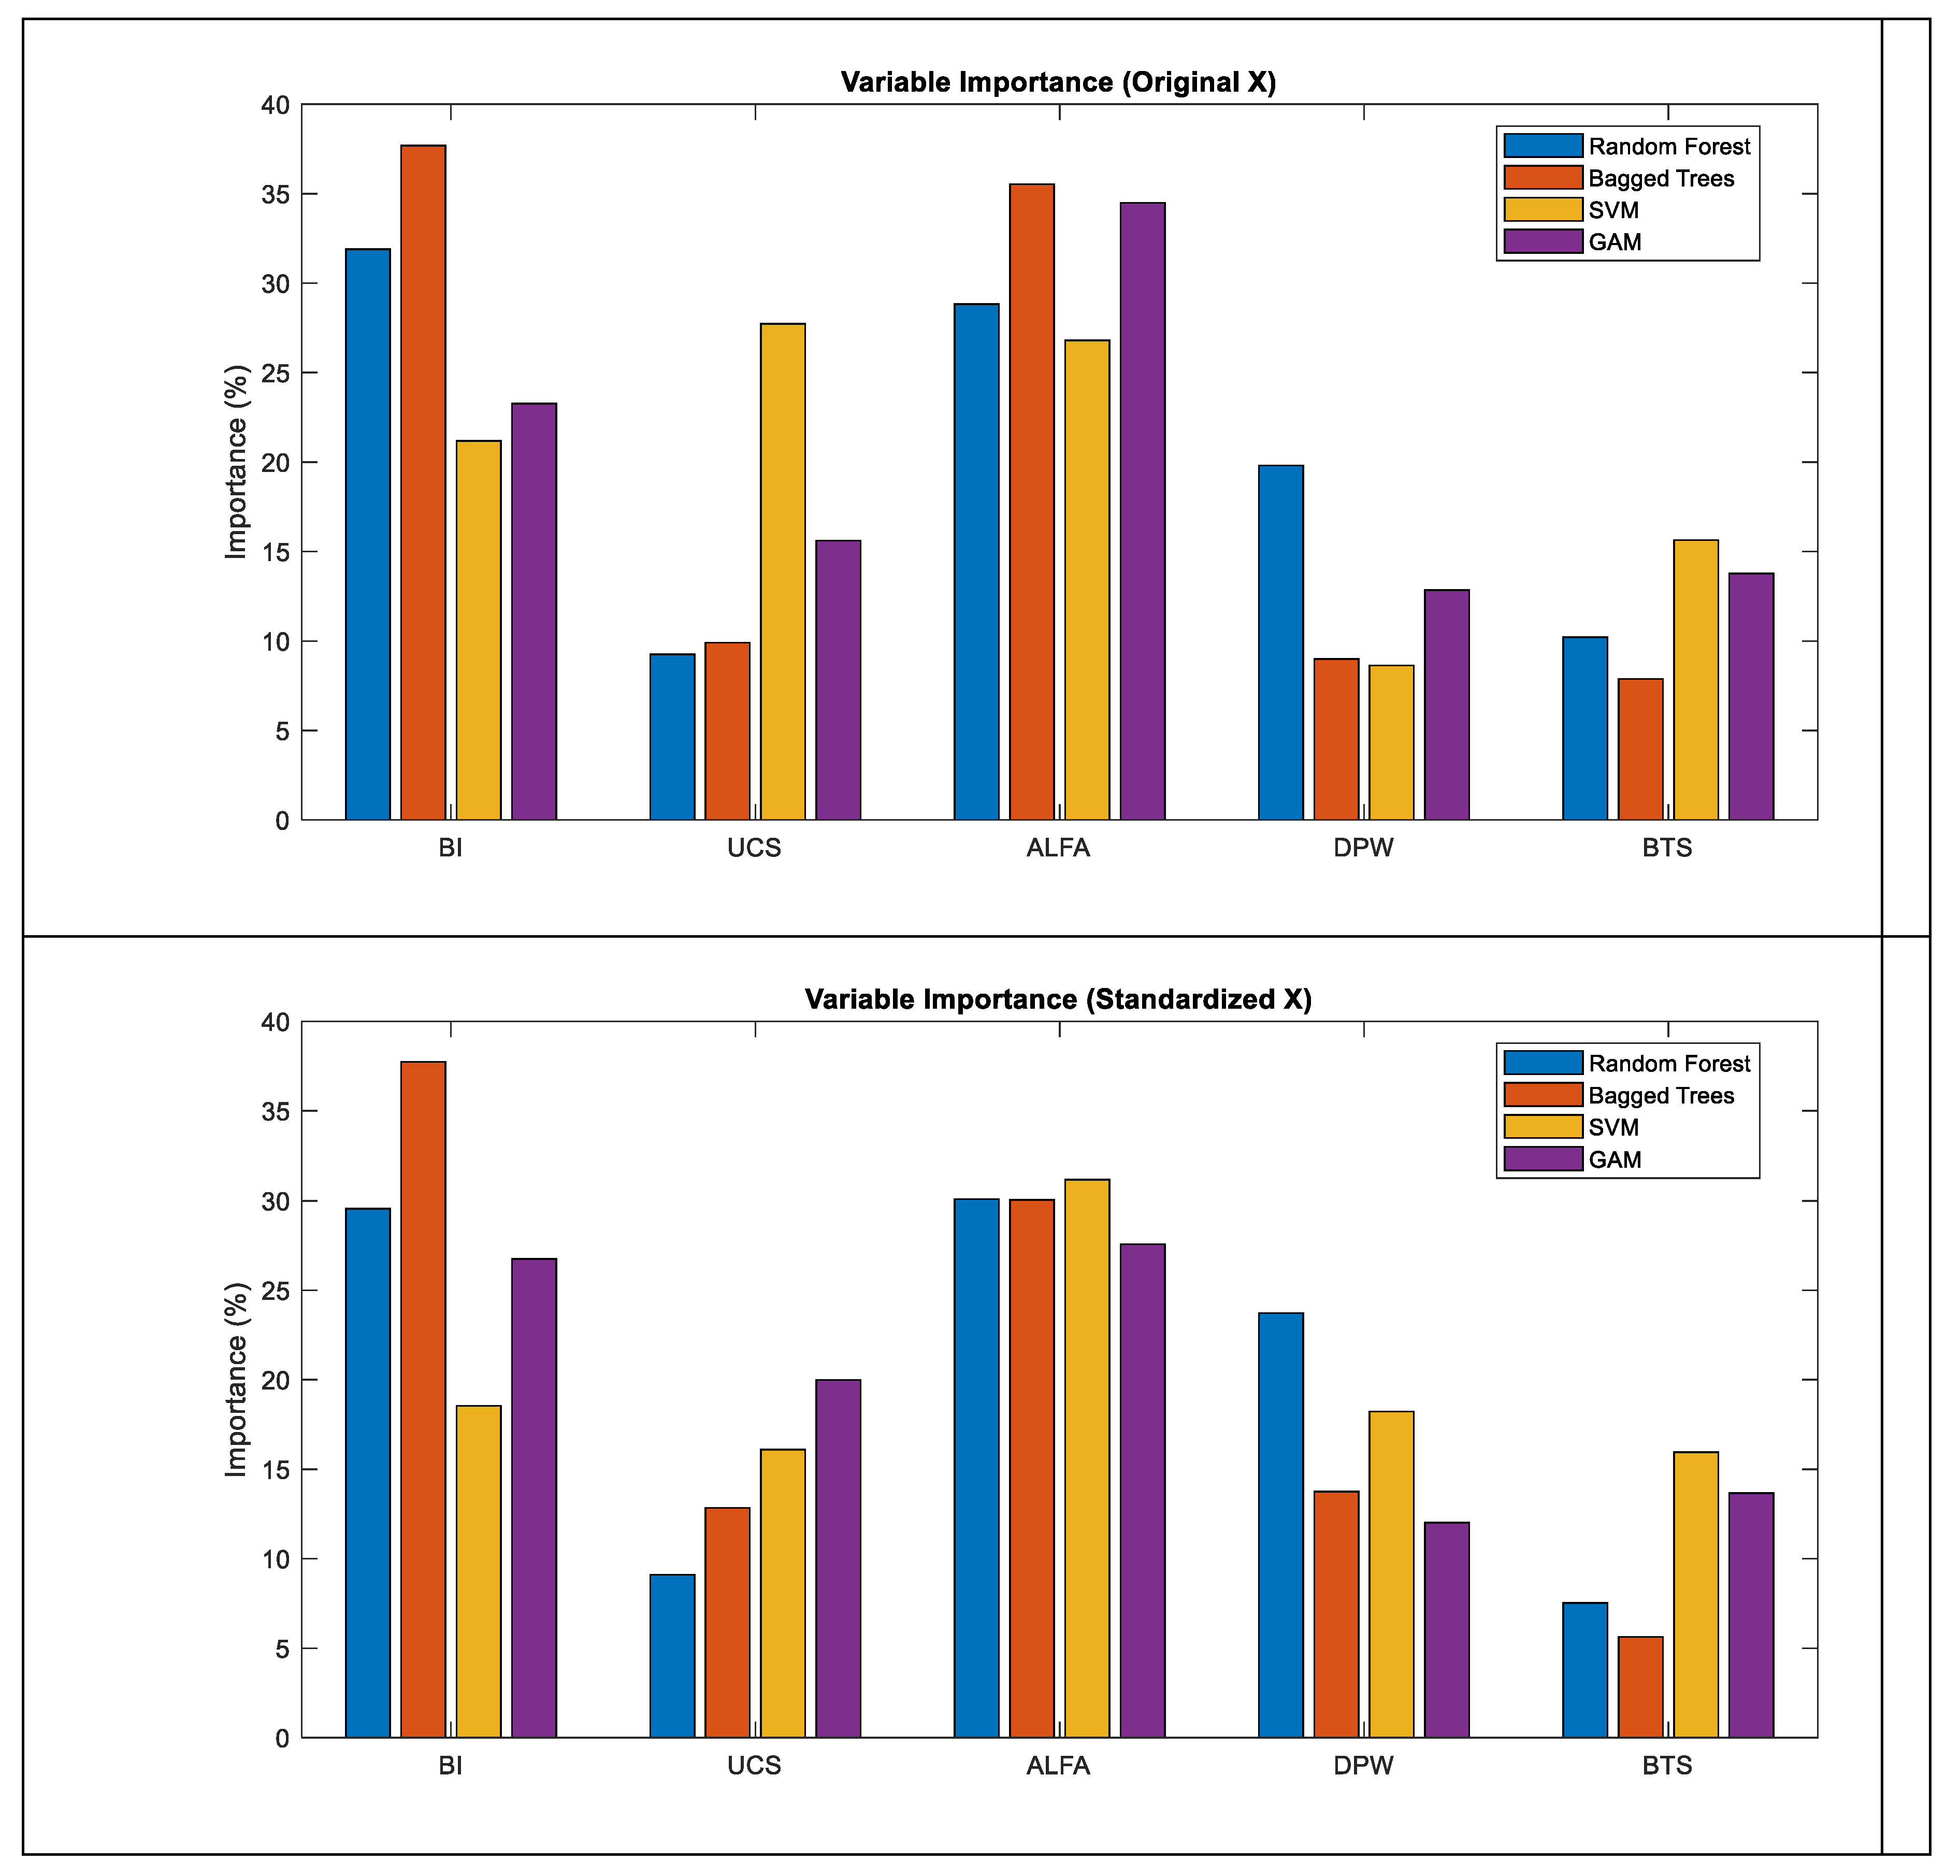
Following the scenario- and method-based evaluation of model performances, a feature importance analysis was conducted to identify which input variables primarily contribute to the achieved prediction accuracy. Accordingly, the analysis focuses not only on how well the models perform, but also on the extent to which individual variables drive this performance. The variable importance results for the machine learning models are presented in
Table 6.
Table 6 presents the relative variable importance values obtained for the Random Forest (RF), Bagged Trees (BT), Support Vector Machine (SVM), and Generalized Additive Model (GAM) methods under Scenario I (original variables) and Scenario II (standardized variables). The results indicate that the machine learning approaches yield largely consistent outcomes across both scenarios, exhibiting similar learning dynamics and overall behavior.
As illustrated in Figure 5, the joint angle (α) and the brittleness index (BI) emerge as the dominant input variables across all models in both scenarios, attaining the highest importance scores and highlighting their critical role in TBM penetration rate prediction.
Nevertheless, in Scenario II, particularly for the SVM and GAM models, the distribution of variable importance becomes more balanced, with noticeable increases observed in the relative importance of uniaxial compressive strength (UCS) and depth of penetration per wheel (DPW). In contrast, for tree-based models such as RF and BT, inter-scenario differences remain limited, and the ranking of variables is largely preserved. This behavior suggests that tree-based methods are comparatively less sensitive to variable scaling.
The differences observed between machine learning (ML) and parametric models indicate that the manner in which variable contributions are reflected in model outcomes is strongly dependent on model structure. The fact that the joint angle (α), which exhibits a relatively limited influence in parametric models, assumes a dominant role across all ML approaches highlights a clear divergence between the two modeling paradigms in terms of learning mechanisms and their capacity to capture nonlinear relationships.
Similarly, the Brazilian tensile strength (BTS), which has been treated as a secondary variable in many previous parametric studies and some ML applications, was found to contribute positively to model performance in both nonlinear parametric models and ML-based approaches. This finding suggests that BTS plays a complementary yet meaningful role in explaining TBM performance.
Overall, the results demonstrate that variable importance analyses yield robust and consistent outcomes across different scaling scenarios and model classes, and that ML approaches possess a strong potential to represent the complex interactions influencing TBM penetration rate in a more effective and interpretable manner.
4. Discussion
Feature importance analyses conducted using both parametric and machine learning (ML) models provide a multidimensional perspective for evaluating the roles of variables affecting tunnel boring machine (TBM) penetration rate (ROP). Since input variables in parametric models exhibit markedly different scales (e.g., UCS ≈ 150, DPW ≈ 1), direct comparison of variable effects becomes challenging. Therefore, Jacobian-based elasticity analysis was performed under two different scenarios: original-scale variables (Scenario I) and standardized variables (Scenario II). The relative variable weights obtained under both scenarios are comparatively presented in
Figure 3, and the influence of scaling on the results is systematically evaluated.
All coefficients of the six parametric models (M1–M6) used in this analysis were optimized using the Differential Evolution (DE) algorithm. Consequently, the feature importance assessments were not based on fixed or literature-derived coefficients, but rather on parameter sets that were optimal in terms of predictive performance for each model. This strategy enabled a more reliable interpretation of variable effects that is consistent with model accuracy, thereby enhancing the robustness of the parametric analyses.
The parametric results indicate that the strongest positive relationship with ROP is associated with the brittleness index (BI, r = 0.5805), followed by uniaxial compressive strength (UCS, r = 0.2595). The joint angle (α) exhibits a relatively weaker influence (r = 0.2196), whereas a pronounced negative relationship is observed between penetration rate and depth of penetration per wheel (DPW, r = –0.4654). The dominant effects of BI and UCS are consistently preserved across all parametric models under both original and standardized scenarios, in agreement with the correlation matrix results. Differences between scenarios do not reflect changes in the physical influence of variables, but rather indicate how elasticity calculations redistribute relative contributions depending on the reference scale.
Compared to other parametric models, the proposed M6 formulation yields a more balanced and physically meaningful distribution of variable contributions. Elasticity analysis based on DE-optimized M6 coefficients not only confirms the dominant roles of BI and UCS but also reveals the indirect and interaction-based contributions of DPW and BTS more clearly. This outcome demonstrates that the interaction and logarithmic terms included in M6 provide a more realistic representation of TBM–rock interaction processes. Accordingly, the M6 model achieves superior predictive performance relative to all previously reported parametric correlations in the literature.
Feature importance analyses performed for machine learning models (Random Forest, Bagged Trees, SVM, and GAM) also produce largely consistent results across both scenarios (
Figure 4 and
Table 6). Nevertheless, clear differences emerge between parametric and ML models regarding how variable contributions are represented. The joint angle (α), which plays a relatively limited role in parametric models, attains high importance values across all ML approaches. This contrast reflects the ability of ML models to more effectively capture nonlinear and data-driven interactions, highlighting fundamental differences in learning dynamics between the two modeling paradigms.
Furthermore, the BTS variable—often treated as secondary in earlier parametric studies and some ML applications—was found to contribute positively to model performance in both nonlinear parametric and ML-based models. In particular, the relative importance of BTS reaching approximately 14–15% in the GAM model clearly indicates that this variable should not be neglected in ROP prediction. Similarly, the visibility of BTS’s indirect contribution in the M6 model further supports the notion that this formulation provides a more comprehensive physical representation of the underlying process.
Overall, the combined use of parametric and ML-based analyses enables a detailed assessment of variable effects on ROP through both linear and nonlinear components. Parametric models—especially the DE-optimized M6 formulation—offer enhanced interpretability and physical consistency, while ML models successfully capture complex patterns and interactions inherent in the data. Together, these complementary approaches provide a balanced and robust modeling framework that improves both predictive accuracy and interpretability in TBM performance prediction.
6. Conclusions
In this study, the coefficients of six different parametric models (M1–M6) developed for TBM penetration rate (ROP) prediction were optimized using the Differential Evolution (DE) algorithm. The predictive performances of the optimized models were compared, followed by Jacobian-based elasticity-driven feature importance analyses conducted under original (Scenario I) and standardized (Scenario II) variable conditions. This comprehensive framework enabled a holistic evaluation of variable effects in terms of both predictive accuracy and scale sensitivity.
The parametric modeling results clearly demonstrate that the proposed M6 formulation outperforms all commonly used parametric models reported in the literature. The M6 model exhibits superior performance in terms of error metrics (RMSE and MAE) as well as goodness-of-fit measures (R²). This improvement primarily stems from the inclusion of interaction terms and logarithmic expressions that allow a more realistic representation of TBM–rock interaction mechanisms.
Elasticity analyses based on the optimized M6 coefficients confirm the dominant influence of the brittleness index (BI) and uniaxial compressive strength (UCS) on ROP, while consistently revealing the negative contribution of depth of penetration per wheel (DPW). The strong similarity between Scenario I and Scenario II results indicates that scaling does not alter the physical influence of variables but merely redistributes their relative contributions. Moreover, the interaction terms embedded in M6 enable a more effective representation of complex inter-variable relationships compared to linear formulations, underscoring both the statistical and physical robustness of the model.
Feature importance analyses conducted using machine learning methods (Random Forest, Bagged Trees, SVM, and GAM) produce results that are largely consistent with those obtained from parametric models. ML approaches confirm the dominant roles of BI and UCS while revealing a more pronounced importance of the joint angle (α), which appears less influential in parametric models. This discrepancy arises from the nonlinear and data-driven nature of ML models, which allows them to capture complex interactions more sensitively.
Additionally, the BTS variable—often considered secondary in parametric modeling—was found to enhance ROP prediction performance, particularly in ML models and nonlinear parametric structures. This finding clearly indicates that BTS is an important input parameter that should not be overlooked in TBM performance prediction.
In conclusion, the results of this study demonstrate that the DE-optimized M6 parametric model provides superior predictive accuracy and a more balanced representation of variable contributions compared to existing correlations in the literature. The joint evaluation of parametric and ML-based feature importance analyses reveals that variable effects on ROP are generally consistent, while different model structures offer complementary insights. Parametric models provide greater physical interpretability, whereas ML methods more effectively capture nonlinear and complex relationships. Therefore, a hybrid modeling framework that integrates both parametric and machine learning approaches offers a powerful and practical solution for achieving reliable and interpretable TBM penetration rate prediction.
Appendix A
A.1. Jacobian Components and Elasticities of Parametric Models
| Model |
Jacobian (∂ROP/∂xi) |
Elasticities (Ei) |
Model 1
(Linear)
|
∂ROP/∂BI = p2
∂ROP/∂UCS = p3
∂ROP/∂α = p4
∂ROP/∂DPW = p5
∂ROP/∂BTS = p6 |
E_BI = p2·BI/ROP
E_UCS = p3·UCS/ROP
E_α = p4·α/ROP
E_DPW = p5·DPW/ROP
E_BTS = p6·BTS/ROP |
Model 2
(Exponential)
|
∂ROP/∂BI = p2·ROP
∂ROP/∂UCS = p3·ROP
∂ROP/∂α = p4·ROP
∂ROP/∂DPW = p5 ROP
∂ROP/∂BTS = p6·ROP |
E_BI = p2·BI
E_UCS = p3·
UCS E_α = p4·α
E_DPW = p5·DPW
E_BTS = p6·BTS |
Model 3
(Power)
|
∂ROP/∂BI = p2·ROP/BI
∂ROP/∂UCS = p3·ROP/UCS
∂ROP/∂α = p4·ROP/α
∂ROP/∂DPW = p5·ROP/DPW
∂ROP/∂BTS = p6·ROP/BTS |
E_BI = p2
E_UCS = p3
E_α = p4
E_DPW = p5
E_BTS = p6 |
Model 4
(Mixed Log–Power)
|
∂ROP/∂BI = p2
∂ROP/∂UCS = p3
∂ROP/∂α = p4/α
∂ROP/∂DPW =p5·p6·DPW^(p6-1)
∂ROP/∂BTS = p7 |
E_BI = p2·BI/ROP
E_UCS = p3·UCS/ROP
E_α = p4/ROP
E_DPW = p5·p6·DPW^p6/ROP
E_BTS = p7·BTS/ROP |
Model 5
(Generalized Power)
|
∂ROP/∂BI = p2
∂ROP/∂UCS = p3
∂ROP/∂α = p4·p5·α^(p5-1)
∂ROP/∂DPW = p6·p7·DPW^(p7-1)
∂ROP/∂BTS = p8 |
E_BI = p2·BI/ROP
E_UCS = p3·UCS/ROP
E_α = p4·p5·α^p5/ROP
E_DPW = p6·p7·DPW^p7/ROP
E_BTS = p8·BTS/ROP |
Model 6
(Interaction Term)
|
∂ROP/∂BI = p2 + p6·DPW
∂ROP/∂UCS = p3
∂ROP/∂α = p4/α
∂ROP/∂DPW = p5 + p6·BI
∂ROP/∂BTS = p7 |
E_BI = (p2 + p6·DPW)·BI/ROP
E_UCS = p3·UCS/ROP
E_α = p4/ROP
E_DPW = (p5 + p6·BI)·DPW/ROP
E_BTS = p7·BTS/ROP |
A.2 Interpretability and Sensitivity Analyses of Black-Box Models
References
- Tarkoy, P.J. (1975). Rock Hardness Index Properties and Geotechnical Parameters for Predicting Tunnel Boring Machine Performance. University of Illinois at Urbana-Champaign.
- Nelson, P. (1983). Tunnel Boring Machine Performance in Sedimentary Rocks. Cornell University.
- Kahraman, S. (2002). Correlation of TBM and drilling machine performances with rock brittleness. Engineering Geology, 65(4), 269-283. [CrossRef]
- Yağız, S. (2008). Utilizing Rock Mass Properties to Predict TBM Performance in Hard Rock Conditions. Tunnelling and Underground Space Technology, 23(3), 326-339. [CrossRef]
- Yağız, S., & Karahan, H. (2011). Prediction of Hard Rock TBM Penetration Rate Using Particle Swarm Optimization. International Journal of Rock Mechanics and Mining Sciences, 48(3), 427-433. [CrossRef]
- Yağız, S., & Karahan, H. (2015). Application of Various Optimization Techniques to Predict TBM Penetration Rate in Rock Mass and Comparison of Their Performance. International Journal of Rock Mechanics and Mining Sciences, 80, 308-315.
- Khoshzaher, E., Chakeri, H., Bazargan, S., & Mousapour, H. (2023). The prediction of EPB-TBM performance using firefly algorithms and particle swarm optimization. Rudarsko-geološko-naftni Zbornik, 38(5), 79-86. [CrossRef]
- Benardos, A. G., & Kaliampakos, D. C. (2004). Modelling TBM performance with artificial neural networks. Tunnelling and Underground Space Technology, 19(6), 597-605. [CrossRef]
- Benardos, A. (2008). Artificial intelligence in underground development: a study of TBM performance. Underground Spaces, 121.
- Javad, G., & Narges, T. (2010). Application of artificial neural networks to the prediction of tunnel boring machine penetration rate. Mining Science and Technology (China), 20(5), 727-733. [CrossRef]
- Torabi, S. R., Shirazi, H., Hajali, H., & Monjezi, M. (2013). Study of the influence of geotechnical parameters on the TBM performance in Tehran–Shomal highway project using ANN and SPSS. Arabian Journal of Geosciences, 6(4), 1215-1227. [CrossRef]
- Fattahi, H., & Babanouri, N. (2017). Applying optimized support vector regression models for prediction of tunnel boring machine performance. Geotechnical and Geological Engineering, 35(5), 2205-2217. [CrossRef]
- La, Y. S., Kim, M. I., & Kim, B. (2019). Prediction of replacement period of shield TBM disc cutter using SVM. Journal of Korean Tunnelling and Underground Space Association, 21(5), 641-656.
- Liu, B., Wang, R., Guan, Z., Li, J., Xu, Z., Guo, X., & Wang, Y. (2019). Improved support vector regression models for predicting rock mass parameters using tunnel boring machine driving data. Tunnelling and underground space technology, 91, 102958. [CrossRef]
- Koopialipoor, M., Fahimifar, A., Ghaleini, E. N., Momenzadeh, M., & Armaghani, D. J. (2020). Development of a new hybrid ANN for solving a geotechnical problem related to tunnel boring machine performance. Engineering with Computers, 36(1), 345-357. [CrossRef]
- AFRADI, A., EBRAHIMABADI, A., & HALLAJIAN, T. (2020). Prediction of TBM penetration rate using support vector machine. GEOSABERES: Revista de Estudos Geoeducacionais, 11, 467-479. [CrossRef]
- Hu, M., Li, B., Zhang, B., Wang, R., & Chen, L. (2021). Improved SVR method for predicting the cutting force of a TBM cutter using linear cutting machine test data. KSCE Journal of Civil Engineering, 25(11), 4425-4442. [CrossRef]
- Yazdani-Chamzini, A., & Yakhchali, S. H. (2012). Tunnel Boring Machine (TBM) selection using fuzzy multicriteria decision making methods. Tunnelling and Underground Space Technology, 30, 194-204. [CrossRef]
- Ghasemi, E., Yagiz, S., & Ataei, M. (2014). Predicting penetration rate of hard rock tunnel boring machine using fuzzy logic. Bulletin of Engineering Geology and the Environment, 73(1), 23-35. [CrossRef]
- Minh, V. T., Katushin, D., Antonov, M., & Veinthal, R. (2017). Regression models and fuzzy logic prediction of TBM penetration rate. Open Engineering, 7(1), 60-68. [CrossRef]
- Afradi, A., Ebrahimabadi, A., & Hallajian, T. (2022). Prediction of TBM penetration rate using fuzzy logic, particle swarm optimization and harmony search algorithm. Geotechnical and Geological Engineering, 40(3), 1513-1536. [CrossRef]
- Armaghani, D. J., Mohamad, E. T., Narayanasamy, M. S., Narita, N., & Yagiz, S. (2017). Development of hybrid intelligent models for predicting TBM penetration rate in hard rock condition. Tunnelling and Underground Space Technology, 63, 29-43. [CrossRef]
- Wang, K., Wu, X., Zhang, L., & Song, X. (2023). Data-driven multi-step robust prediction of TBM attitude using a hybrid deep learning approach. Advanced Engineering Informatics, 55, 101854. [CrossRef]
- Yu, S., Zhang, Z., Wang, S., Huang, X., & Lei, Q. (2024). A performance-based hybrid deep learning model for predicting TBM advance rate using attention-ResNet-LSTM. Journal of Rock Mechanics and Geotechnical Engineering, 16(1), 65-80. [CrossRef]
- Yao, M., Li, X., Pang, Y. E., & Wang, Y. (2025). Prediction model of TBM response parameters based on a hybrid drive of knowledge and data. Tunnelling and Underground Space Technology, 161, 106598. [CrossRef]
- Price, K. V. (1996). Differential evolution: a fast and simple numerical optimizer. In Proceedings of North American fuzzy information processing (pp. 524-527). IEEE.
- Storn, R., & Price, K. (1997). Differential evolution–a simple and efficient heuristic for global optimization over continuous spaces. Journal of global optimization, 11(4), 341-359. [CrossRef]
- Breiman, L. (2001). Random forests. Machine learning, 45(1), 5-32.
- Liaw, A., & Wiener, M. (2002). Classification and regression by randomForest. R news, 2(3), 18-22.
- Breiman, L. (1996). Bagging predictors. Machine learning, 24(2), 123-140. [CrossRef]
- Hastie, T. (2009). The elements of statistical learning: data mining, inference, and prediction.
- Cortes, C., & Vapnik, V. (1995). Support-vector networks. Machine learning, 20(3), 273-297. [CrossRef]
- Vapnik, V. (1998). Statistical learning theory wiley-interscience. New York.
- Hastie, T., & Tibshirani, R. (1986). Generalized additive models. Statistical science, 1(3), 297-310. [CrossRef]
- Wood, S. N. (2017). Generalized additive models: an introduction with R. chapman and hall/CRC.
- Montgomery, D. C., Peck, E. A., & Vining, G. G. (2021). Introduction to linear regression analysis. John Wiley & Sons.
- Kutner, M. (1996). Applied linear regression models.
- Hoerl, A. E., & Kennard, R. W. (1970). Ridge regression: Biased estimation for nonorthogonal problems. Technometrics, 12(1), 55-67. [CrossRef]
- Hastie, T., Tibshirani, R., & Friedman, J. (2009). The elements of statistical learning.
- Jamshidi, A. (2018). Prediction of TBM penetration rate from brittleness indexes using multiple regression analysis. Modeling Earth Systems and Environment, 4(1), 383-394. [CrossRef]
- Seber, G. A., Wild, C. J., Stanford, J. L., & Vardeman, S. B. (1994). 9 least squares. In Statistical methods for physical science (Vol. 28, pp. 245-281). Academic Press.
- Salimi, A., & Esmaeili, M. (2013). Utilising of linear and non-linear prediction tools for evaluation of penetration rate of tunnel boring machine in hard rock condition. International Journal of Mining and Mineral Engineering, 4(3), 249-264. [CrossRef]
- Salimi, A., Rostami, J., Moormann, C., & Delisio, A. (2016). Application of non-linear regression analysis and artificial intelligence algorithms for performance prediction of hard rock TBMs. Tunnelling and Underground Space Technology, 58, 236-246. [CrossRef]
- Arbor, A., & Holland, J. H. (1975). Adaptation in natural and artificial systems.
- Goldberg, D. E., Korb, B., & Deb, K. (1989). Messy genetic algorithms: Motivation, analysis, and first results. Complex systems, 3(5), 493-530.
- Kennedy, J., & Eberhart, R. (1995, November). Particle swarm optimization. In Proceedings of ICNN’95-international conference on neural networks (Vol. 4, pp. 1942-1948). ieee.
- Eberhart, R. C., & Shi, Y. (1998, March). Comparison between genetic algorithms and particle swarm optimization. In International conference on evolutionary programming (pp. 611-616). Berlin, Heidelberg: Springer Berlin Heidelberg.
- Yang, X. S. (2008). Nature-inspired metaheuristic algorithms. Luniver press.
- Yang, X. S. (2009, October). Firefly algorithms for multimodal optimization. In International symposium on stochastic algorithms (pp. 169-178). Berlin, Heidelberg: Springer Berlin Heidelberg.
- Yagiz, S., Yazitova, A., & Karahan, H. (2020). Application of differential evolution algorithm and comparing its performance with literature to predict rock brittleness for excavatability. International Journal of Mining, Reclamation and Environment, 34(9), 672-685. [CrossRef]
- Hyndman, R. J., & Athanasopoulos, G. (2018). Forecasting: principles and practice. OTexts.
- Willmott, C. J., & Matsuura, K. (2005). Advantages of the mean absolute error (MAE) over the root mean square error (RMSE) in assessing average model performance. Climate research, 30(1), 79-82. [CrossRef]
- Karahan, H., & Erkan Can, M. (2025). A Novel Method to Forecast Nitrate Concentration Levels in Irrigation Areas for Sustainable Agriculture. Agriculture, 15(2), 161. [CrossRef]
- Karahan, H., Cetin, M., Can, M. E., & Alsenjar, O. (2024). Developing a new ANN model to estimate daily actual evapotranspiration using limited climatic data and remote sensing techniques for sustainable water management. Sustainability, 16(6), 2481. [CrossRef]
- Karahan, H., Iplikci, S., Yasar, M., & Gurarslan, G. (2014). River flow estimation from upstream flow records using support vector machines. Journal of Applied Mathematics, 2014(1), 714213. [CrossRef]
- Kincaid, D., & Cheney, W. (1991). Numerical analysis, brooks. Cole Publishing Company, 20, 10-13.
- Bien, Z., Jang, W., & Park, J. (1993). Characterization and use of feature-jacobian matrix for visual servoing. Visual servoing, 7, 317-363.
- Karahan, H. (2001). Numerical modelling of shallow water using an iterative solution algorithm. WIT Transactions on The Built Environment, 58.
- Karahan, H., Alkaya, D. (2025). Optimizing SVM Parameters for TBM Penetration Rate Prediction: Comparative Impact of Different Techniques on Model Performance.
|
Disclaimer/Publisher’s Note: The statements, opinions and data contained in all publications are solely those of the individual author(s) and contributor(s) and not of MDPI and/or the editor(s). MDPI and/or the editor(s) disclaim responsibility for any injury to people or property resulting from any ideas, methods, instructions or products referred to in the content. |
© 2025 by the authors. Licensee MDPI, Basel, Switzerland. This article is an open access article distributed under the terms and conditions of the Creative Commons Attribution (CC BY) license (http://creativecommons.org/licenses/by/4.0/).