
Submitted:
11 December 2025
Posted:
23 December 2025
You are already at the latest version
Abstract
This research implemented management indicators to increase produc-tivity at the ice plant, seeking to align with SDG 9 through the construc-tion of resilient infrastructure, promoting sustainability and innovation. The overall objective was to improve plant productivity through the ap-plication of management indicators. The research was applied, with a quantitative approach and a pre-experimental design, analyzing produc-tion records. Results showed a 52.49% increase in production and a 107.65% increase in gross profit, with 52.50% of production capacity be-ing utilized. These improvements were attributed to the implementation of a balanced scorecard, standardization, the Kanban board, enhanced maintenance management, and staff training. Additionally, raw material productivity increased by 7.66%, labor productivity by 130.02%, and total productivity by 53.37%. These improvements were demonstrated through inferential testing, yielding a p-value of 0.006 (p < 0.05), thus confirming the hypothesis. In conclusion, the establishment of management indica-tors enabled the implementation of significant improvement actions within the organization.
Keywords:
indicators
; productivity
; production
1. Introduction
Currently, ice production industries have established a crucial role in processes requiring product preservation. Furthermore, meeting the demand for ice blocks has become a challenge for organizations in the sector, which seek not only to increase productivity but also to guarantee a product that meets the required specifications [1]. Within this context, promoting SDG 9 through the identification and application of management indicators is relevant, aiming to optimize production processes, strengthen the industry’s competitiveness, and promote innovative practices.
Globally, organizations sought to align their indicators with strategic management, which led to overexertion, operational deviations, and a misconception of success or failure . This was the case in European companies, where 66% reported lacking clear indicators to align their organizational performance [2]. 62% of leaders were overwhelmed by the large amount of data generated, hindering their ability to analyze their performance, and only 23% had a real-time system for robust data analysis [3].
At the national level, public investment projects have reflected a lack of alignment between management indicators and project objectives, as the investment level was only 62.1%, demonstrating a lack of planning and delays in monitoring progress [4]. Similarly, the productivity rate of companies in Peru decreased by 11.12% in 2020, due to the impact of the global health crisis on organizations and government entities [5].
This research was conducted at an industrial ice production plant that supplies the fishing, agro-industrial, and food industries. Currently, the ice plant is experiencing low productivity in its operations. Among the causes are a lack of measurement, control, and analysis of its performance, resulting in unplanned decisions based on experience, which in turn leads to poor production planning. Another cause is the bottlenecks identified in the process due to failures in one of the plant’s three compressors, caused by a lack of preventive maintenance. This has resulted in reduced production capacity, increased costs, overtime, and delays in order delivery to customers. Delays and errors in order delivery have also been identified as contributing factors, as there is no standardized process for fulfilling orders. This leads to delays in locating orders and allowing vehicle access to the plant. Likewise, it has been identified that there is no defined production plan establishing monthly goals in relation to projected demand and operational capacity, leading to disorganization and a backlog of shipments until late at night. It should also be noted that the use of electricity and water is constant, but because consumption rates are not monitored, hidden costs are being incurred that impact the company’s profitability. Furthermore, production objectives are not defined, nor is there any comparative monitoring of production against demand, resulting in low staff commitment and reduced organizational performance.
The research question was formulated as follows: How does the application of key performance indicators (KPIs) increase the productivity of an ice plant? Similarly, the general objective was established as: To determine how KPIs increase the productivity of an ice plant, and specifically: To diagnose the current state of the ice plant; To evaluate the current state of productivity of the ice plant; To design and implement improvements in the ice plant ; and To analyze productivity after the implemented improvements. The hypothesis was established as: The application of KPIs increases the productivity of an ice plant.
2. Materials and Methods
The research was applied, as it sought to generate change or influence variables through the application of improvement tools and/or methods [6]. Regarding the approach, this study was considered quantitative since the resulting information was handled through statistical analysis [7]. The research design was pre-experimental, as the application of improvement methods to the selected group allowed for a comparison of their results [8]. It also had an explanatory scope, as actions were developed to understand how events occur at the ice plant.
Management indicators are tools that enable the deployment of organizational objectives and strategies aimed at demonstrating results, fostering a leadership culture to achieve greater impact and planned success [9]. Operationally, they are grouped through strategic indices for organizations, providing a corporate vision and mission [10]. The dimensions defined are diagnosis, implementation, control, and improvement.
Productivity reflects performance by referencing the interaction between inputs and outputs in production processes. It is also noted that calculating productivity in the service sector is more complex due to its variability and diverse characteristics across sectors [11]. Operationally, it expresses the quality of processes by making appropriate use of resources [12]. Its dimensions include raw material productivity, labor productivity, productive and unproductive activities, and total productivity.
The population selected for analysis consisted of weekly productivity records from 2025. This included records from that year and the weeks in which production processes took place. The sample comprised records from six weeks within the months of May and June for the pretest, six weeks from September and October for the posttest, and the improvement implementation was carried out during the six weeks of July and August, using non-probability convenience sampling.
The techniques and instruments used in this study included direct observation, which was used to analyze the causes of the problem using instruments such as diagrams, flowcharts, and checklists for the management indicators variable; while for the productivity variable, the documentary analysis technique was applied using instruments such as a productivity registration form and a management indicators registration form.
Following data collection, the collected information was analyzed to obtain the results. The data were entered into tables for refinement and to generate graphs that would provide a clear view of the research findings. Programs such as Microsoft Excel and later SPSS version 29 were used to obtain the frequency distributions necessary for the descriptive analysis.
Regarding ethical considerations, participants in the research were informed and provided their voluntary consent, with the assurance that data confidentiality would be maintained and that it would not be disclosed to third parties. Similarly, the documentation and citation of sources were properly supported to ensure transparency and ethical conduct throughout the research process.
3. Results
3.1. Diagnosis of the Current State of the Ice Plant
As shown in Figure 1, the block ice production process has 18 operating activities, 4 transportation activities, 2 inspection activities, and one delay activity, with a total of 25 activities covering the process.
The survey results revealed the difficulties the company faces in measuring its performance and taking action, as the use of KPIs has not been established in its core processes. While some areas do have consumption metrics, these are not tracked regularly, are only performed at management’s request, and are not aligned with organizational objectives.
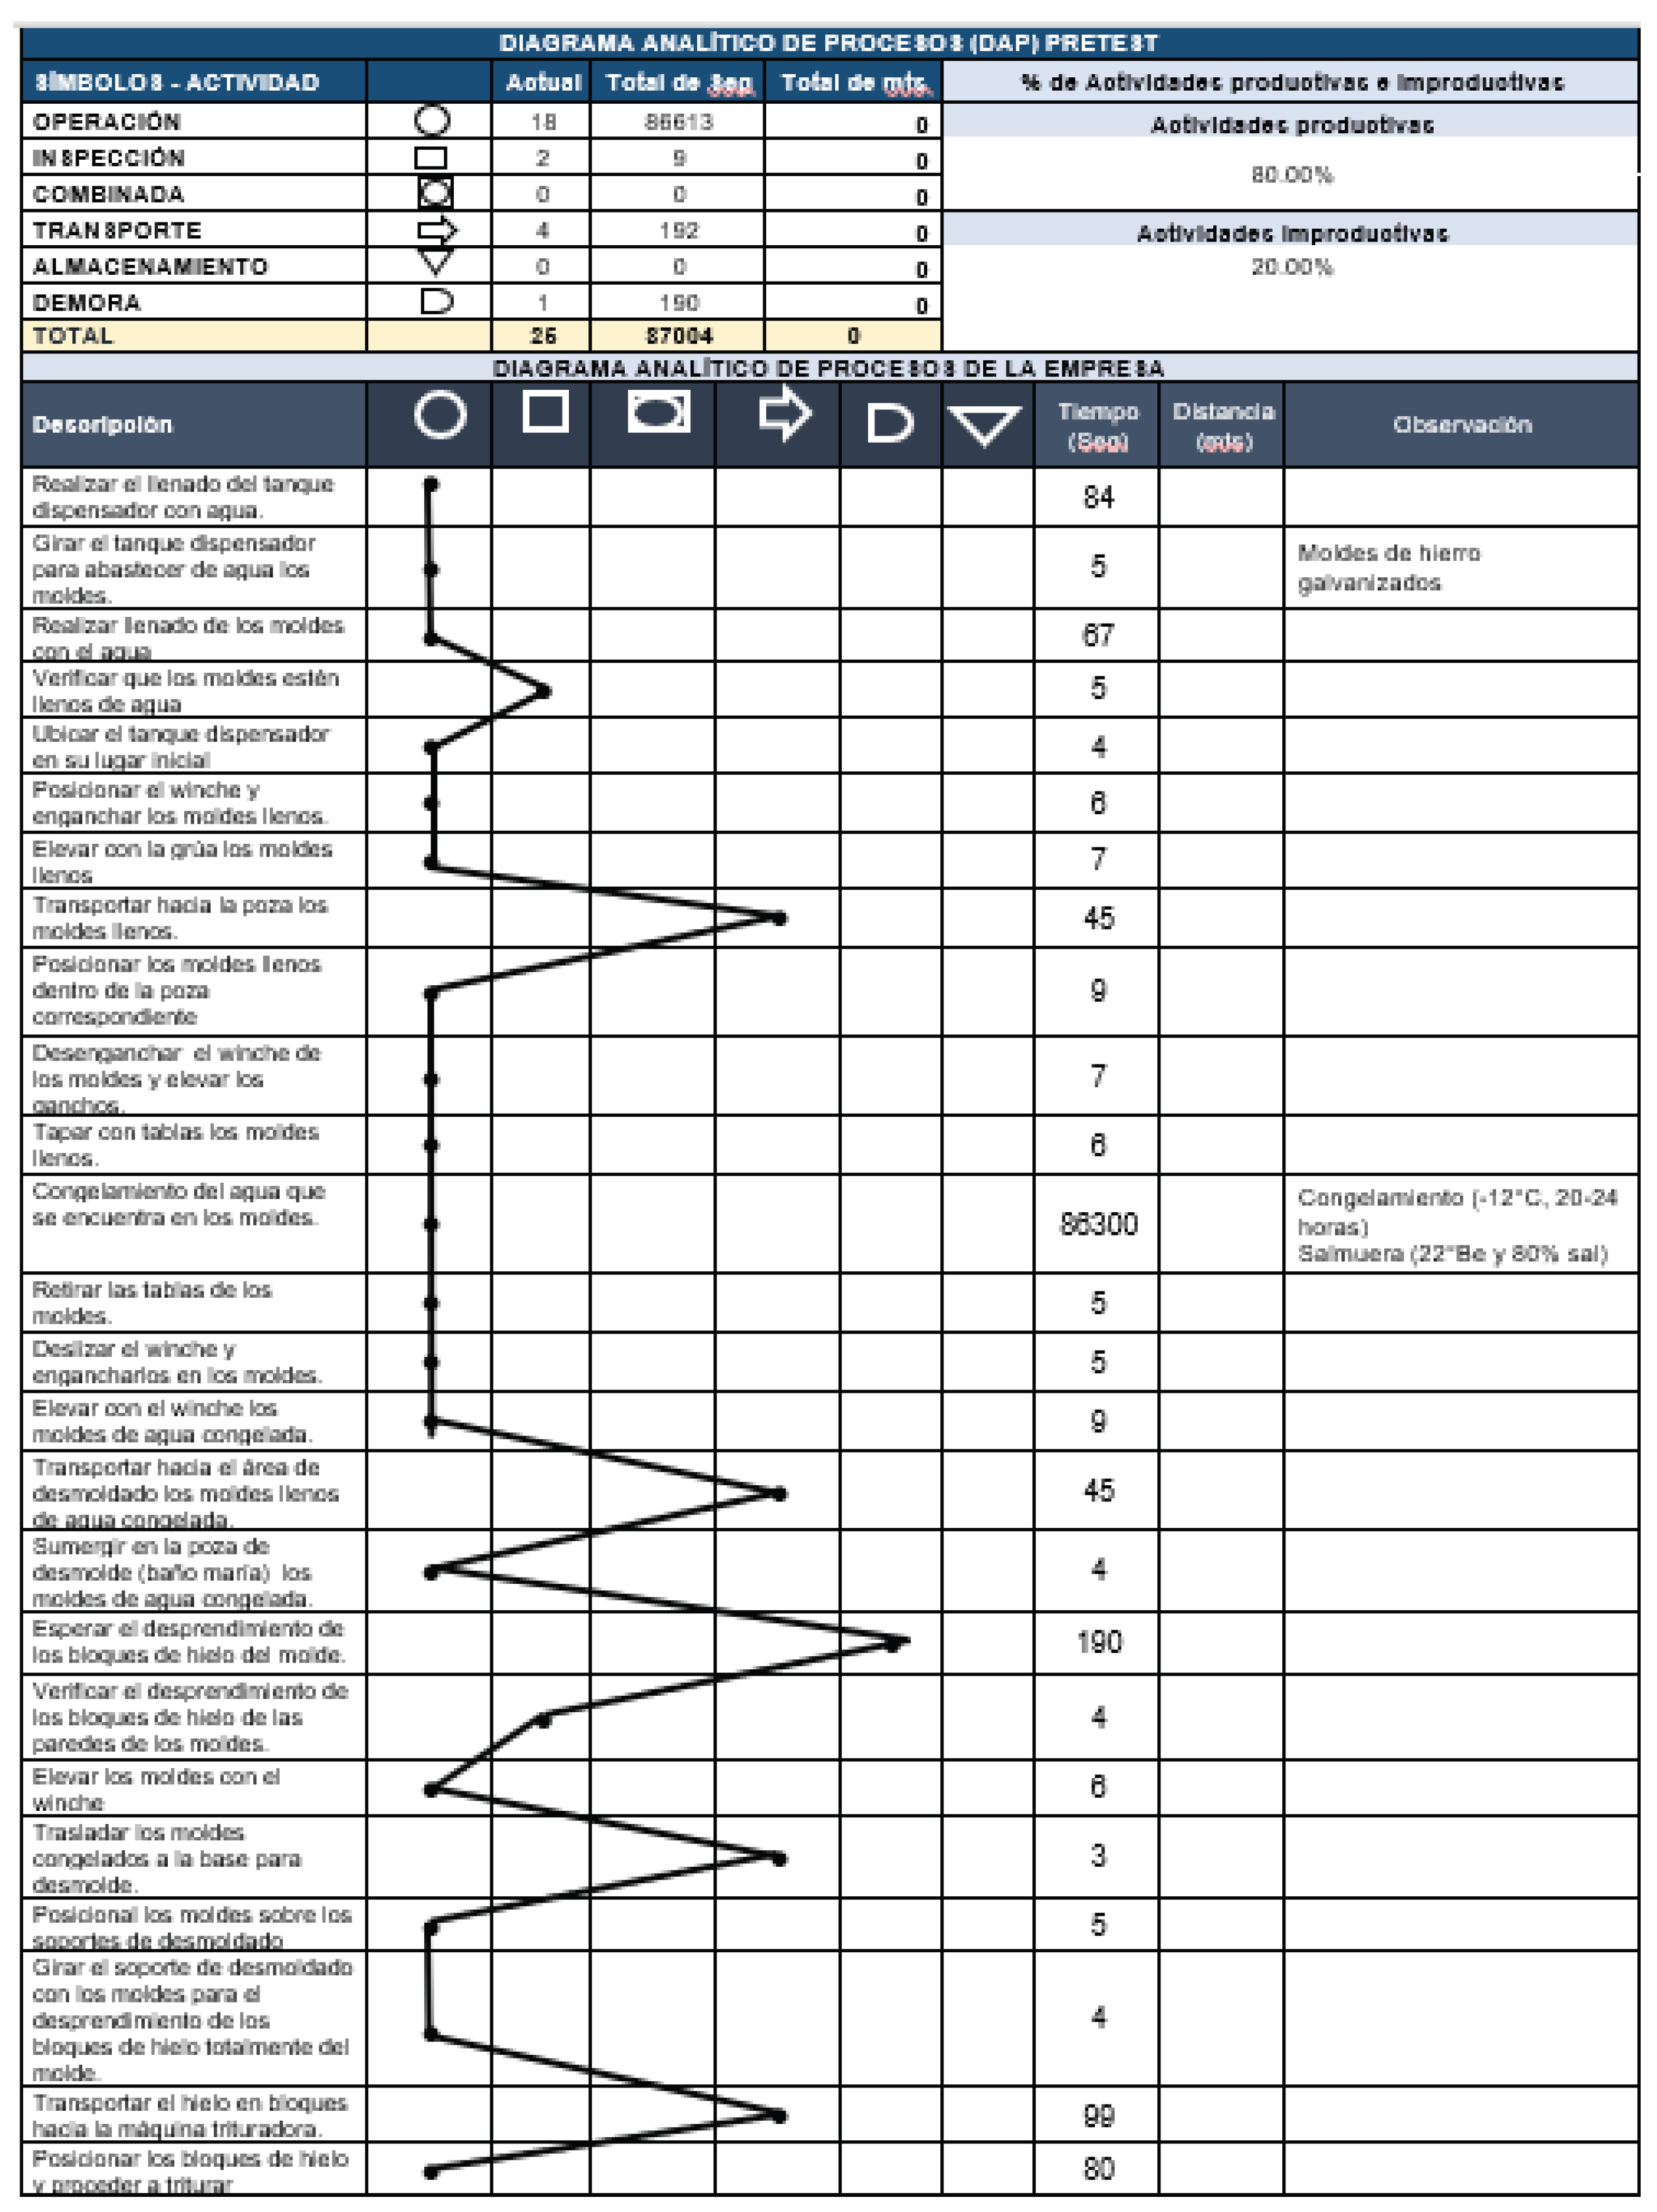
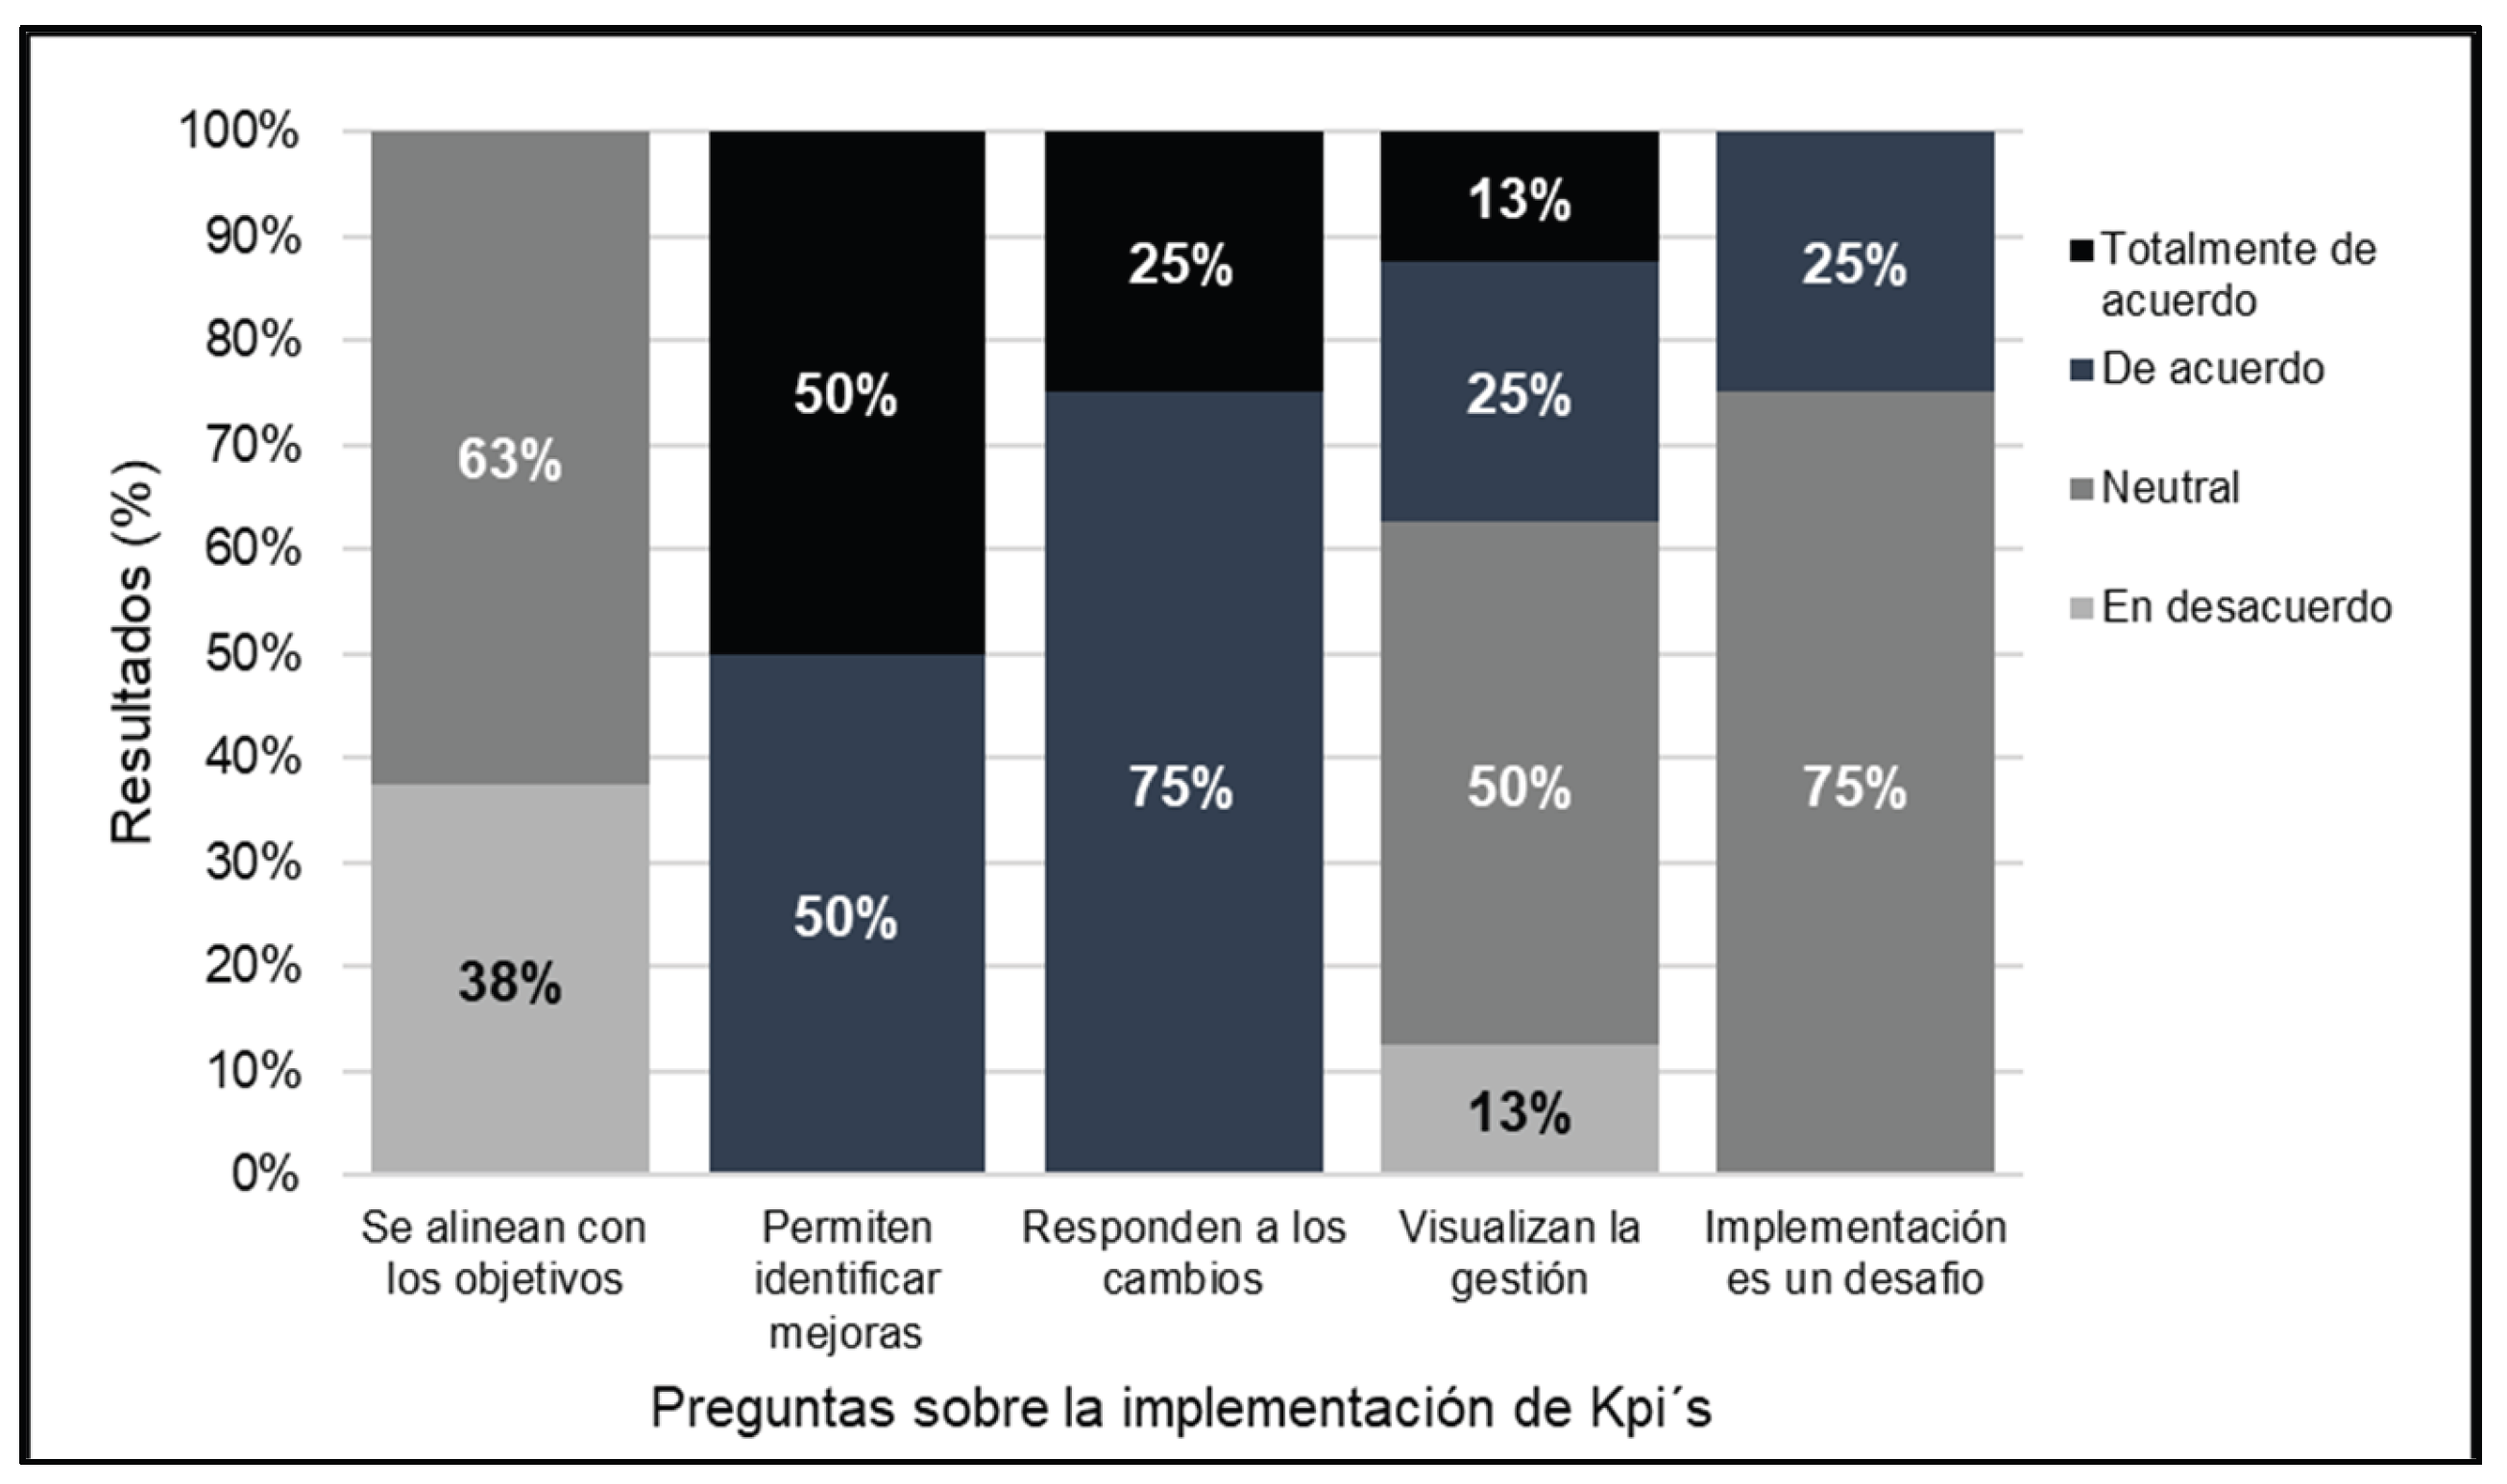
Figure 1.
Process analysis diagram.
Figure 2.
Results of the interview conducted with the leaders.
The details of all the causes were visually elaborated by placing them in the Pareto diagram (Figure 3) where the impact of the problem is represented based on 80/20, within which there are 04 main causes, which are: the lack of performance measurement, the lack of monitoring of consumption indices, the existence of processes that are not standardized, and the lack of action in preventive maintenance.
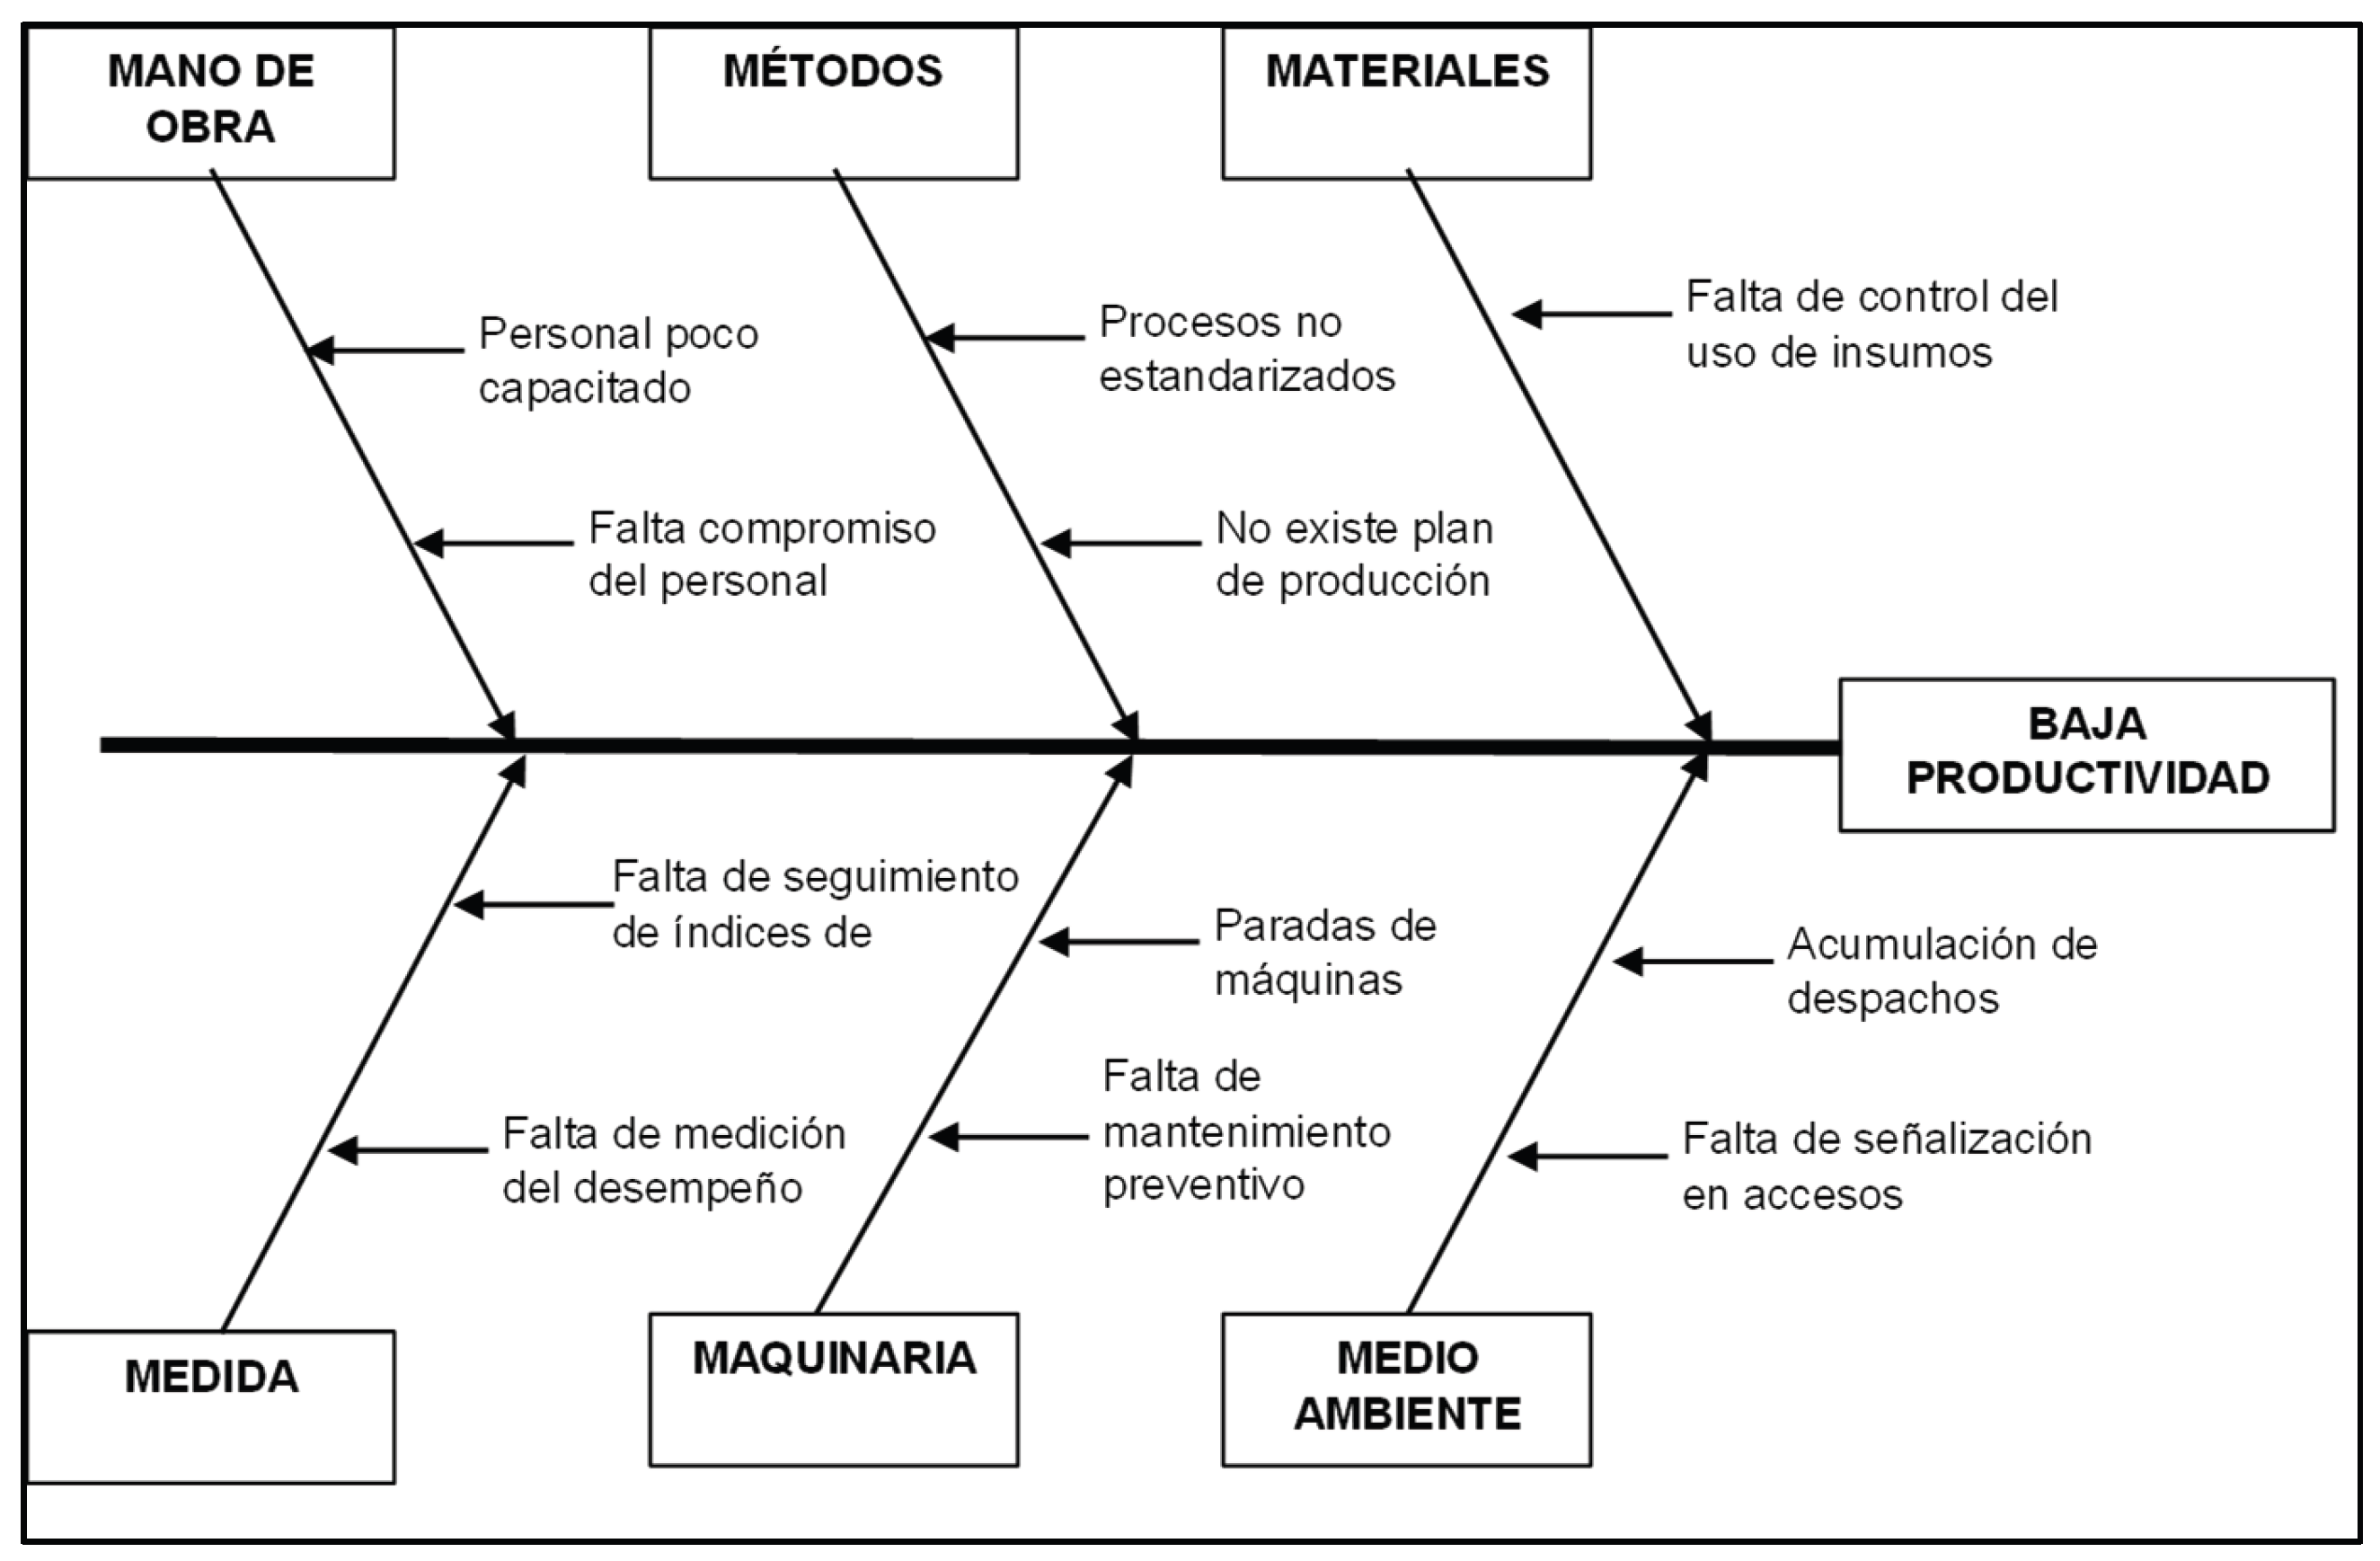
Figure 3.
Identification of causes using the Ishikawa diagram.
A total of 38 complaints were received during the six weeks evaluated, resulting in an average customer satisfaction rate of 87.26%. The complaints primarily stemmed from delays in service and shipping errors. Furthermore, the third week of May and the fourth week of June saw the highest number of complaints from customers.
As shown in Figure 5, in the pre-test period it can be seen that the capacity used has been 3808 tons of ice, considering that the company established a total capacity of 6300 tons of ice in the evaluated period and that only 60.44% of the total is being used on average.
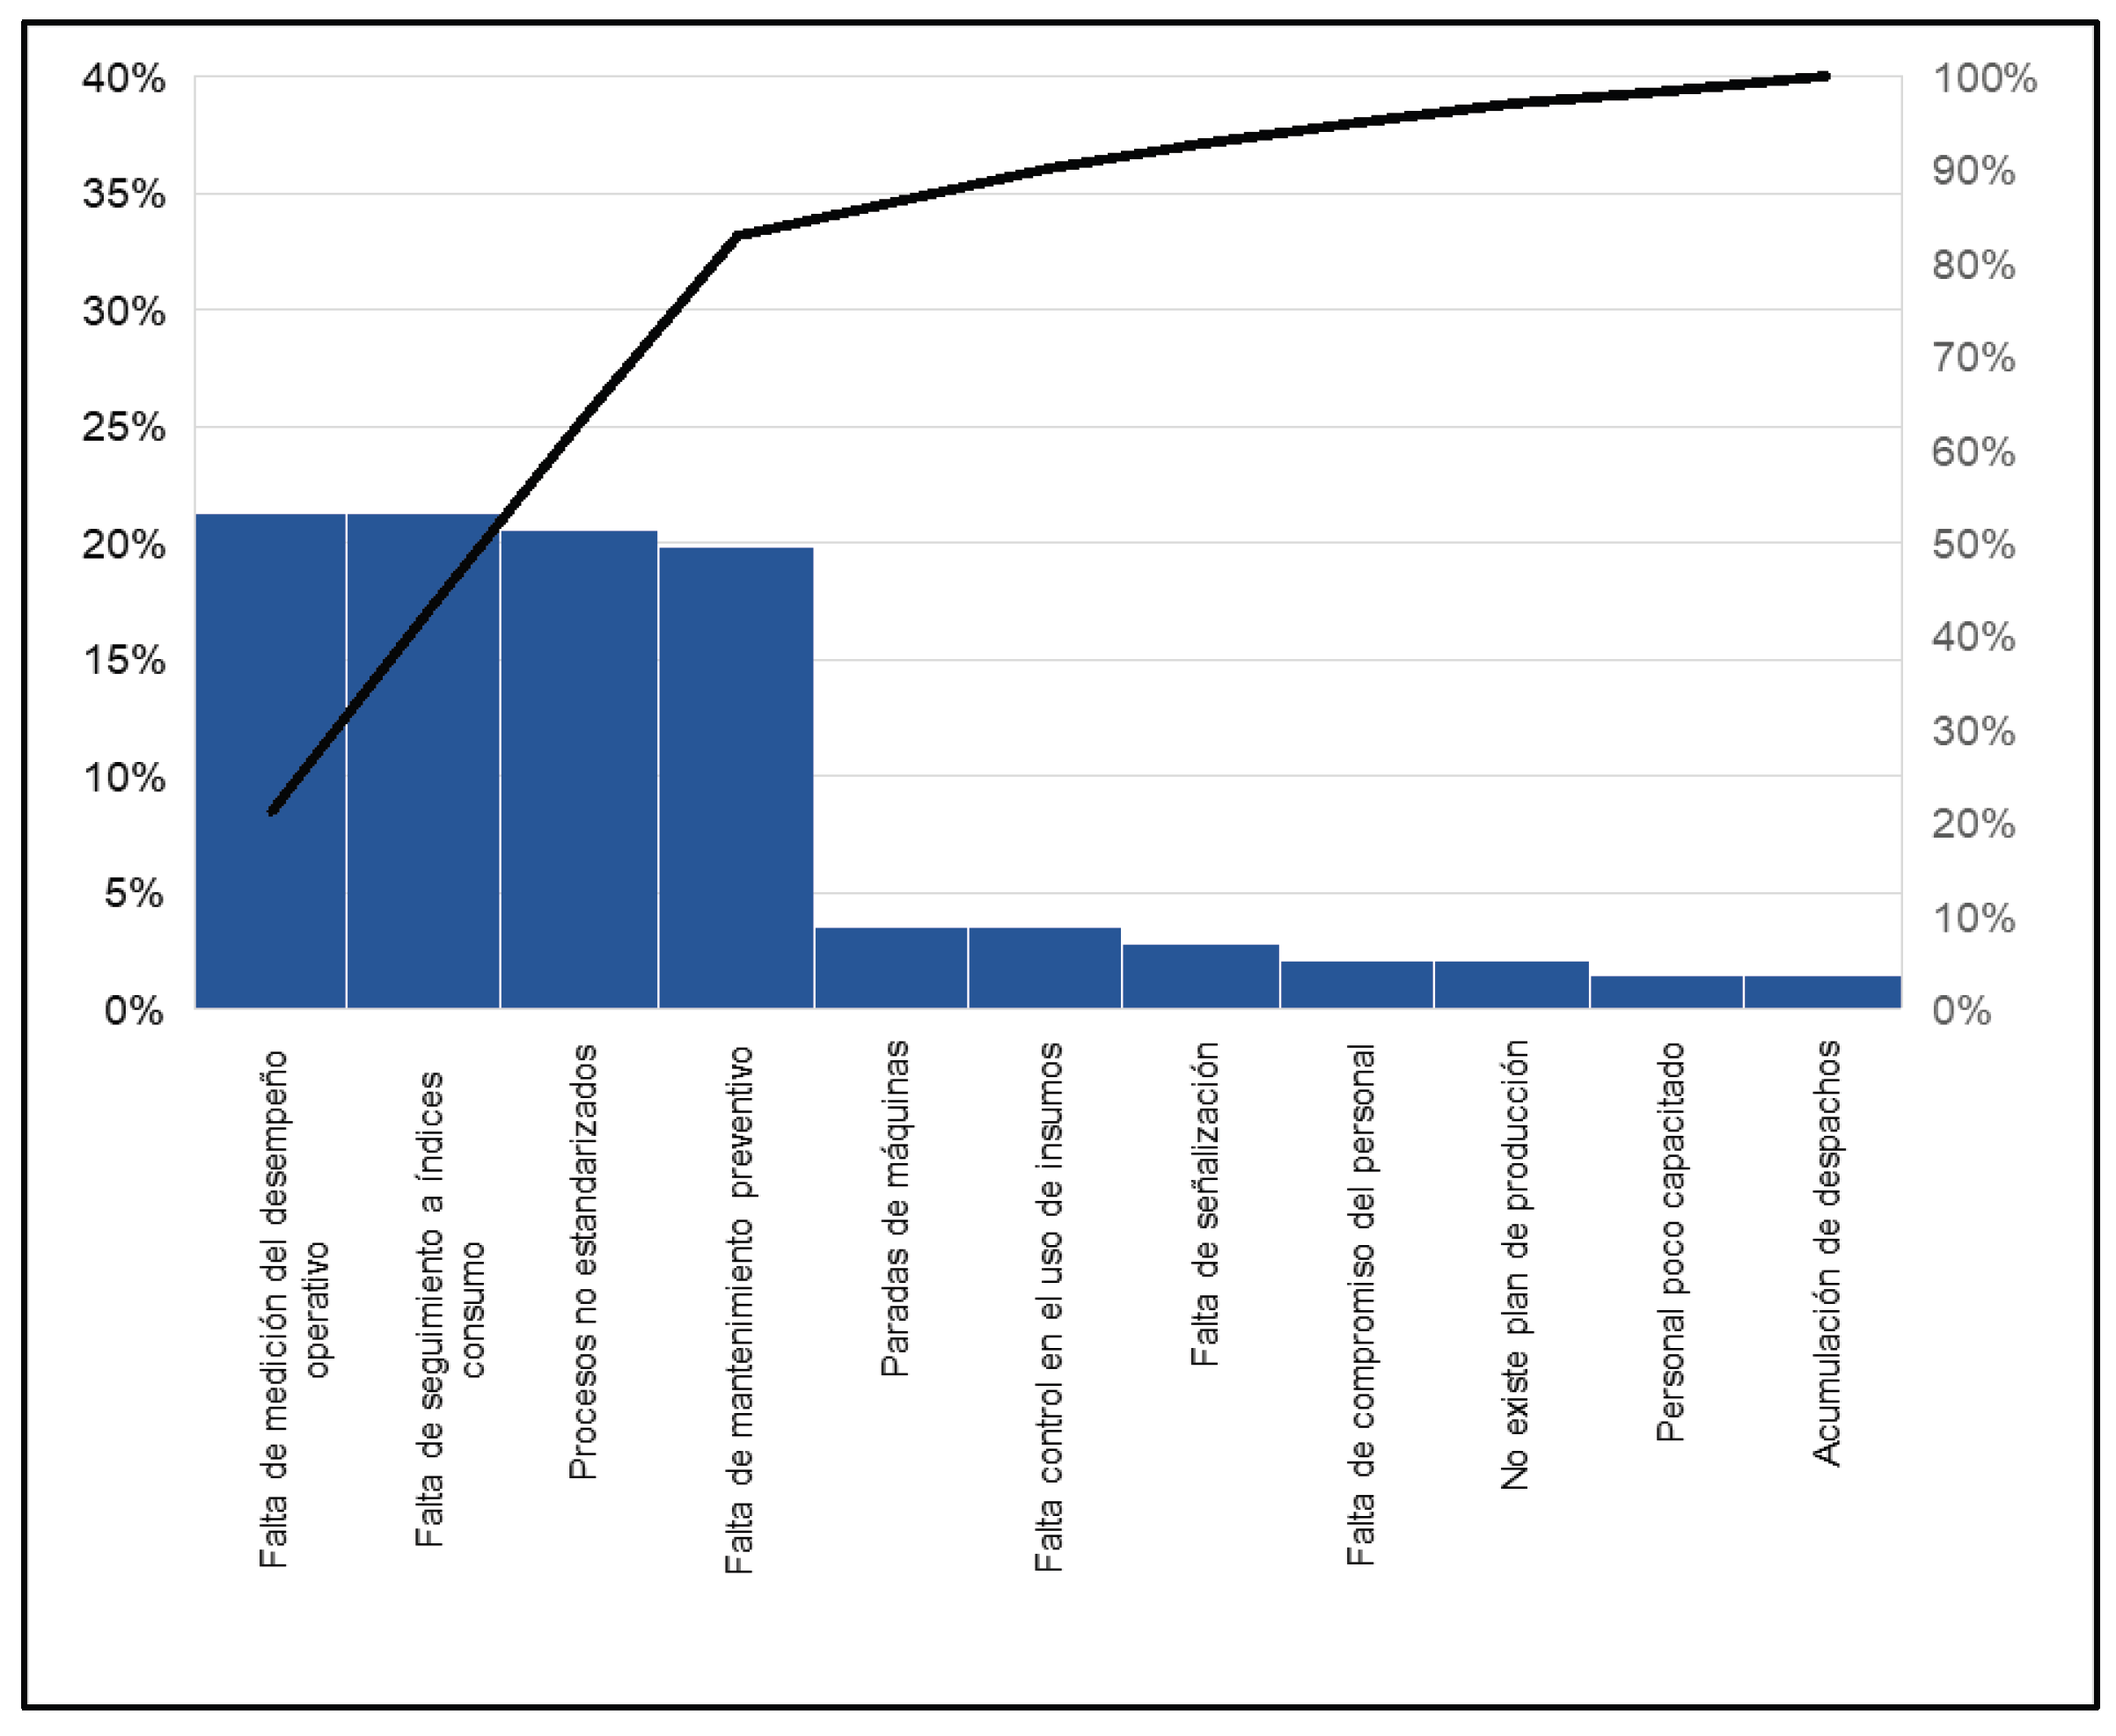
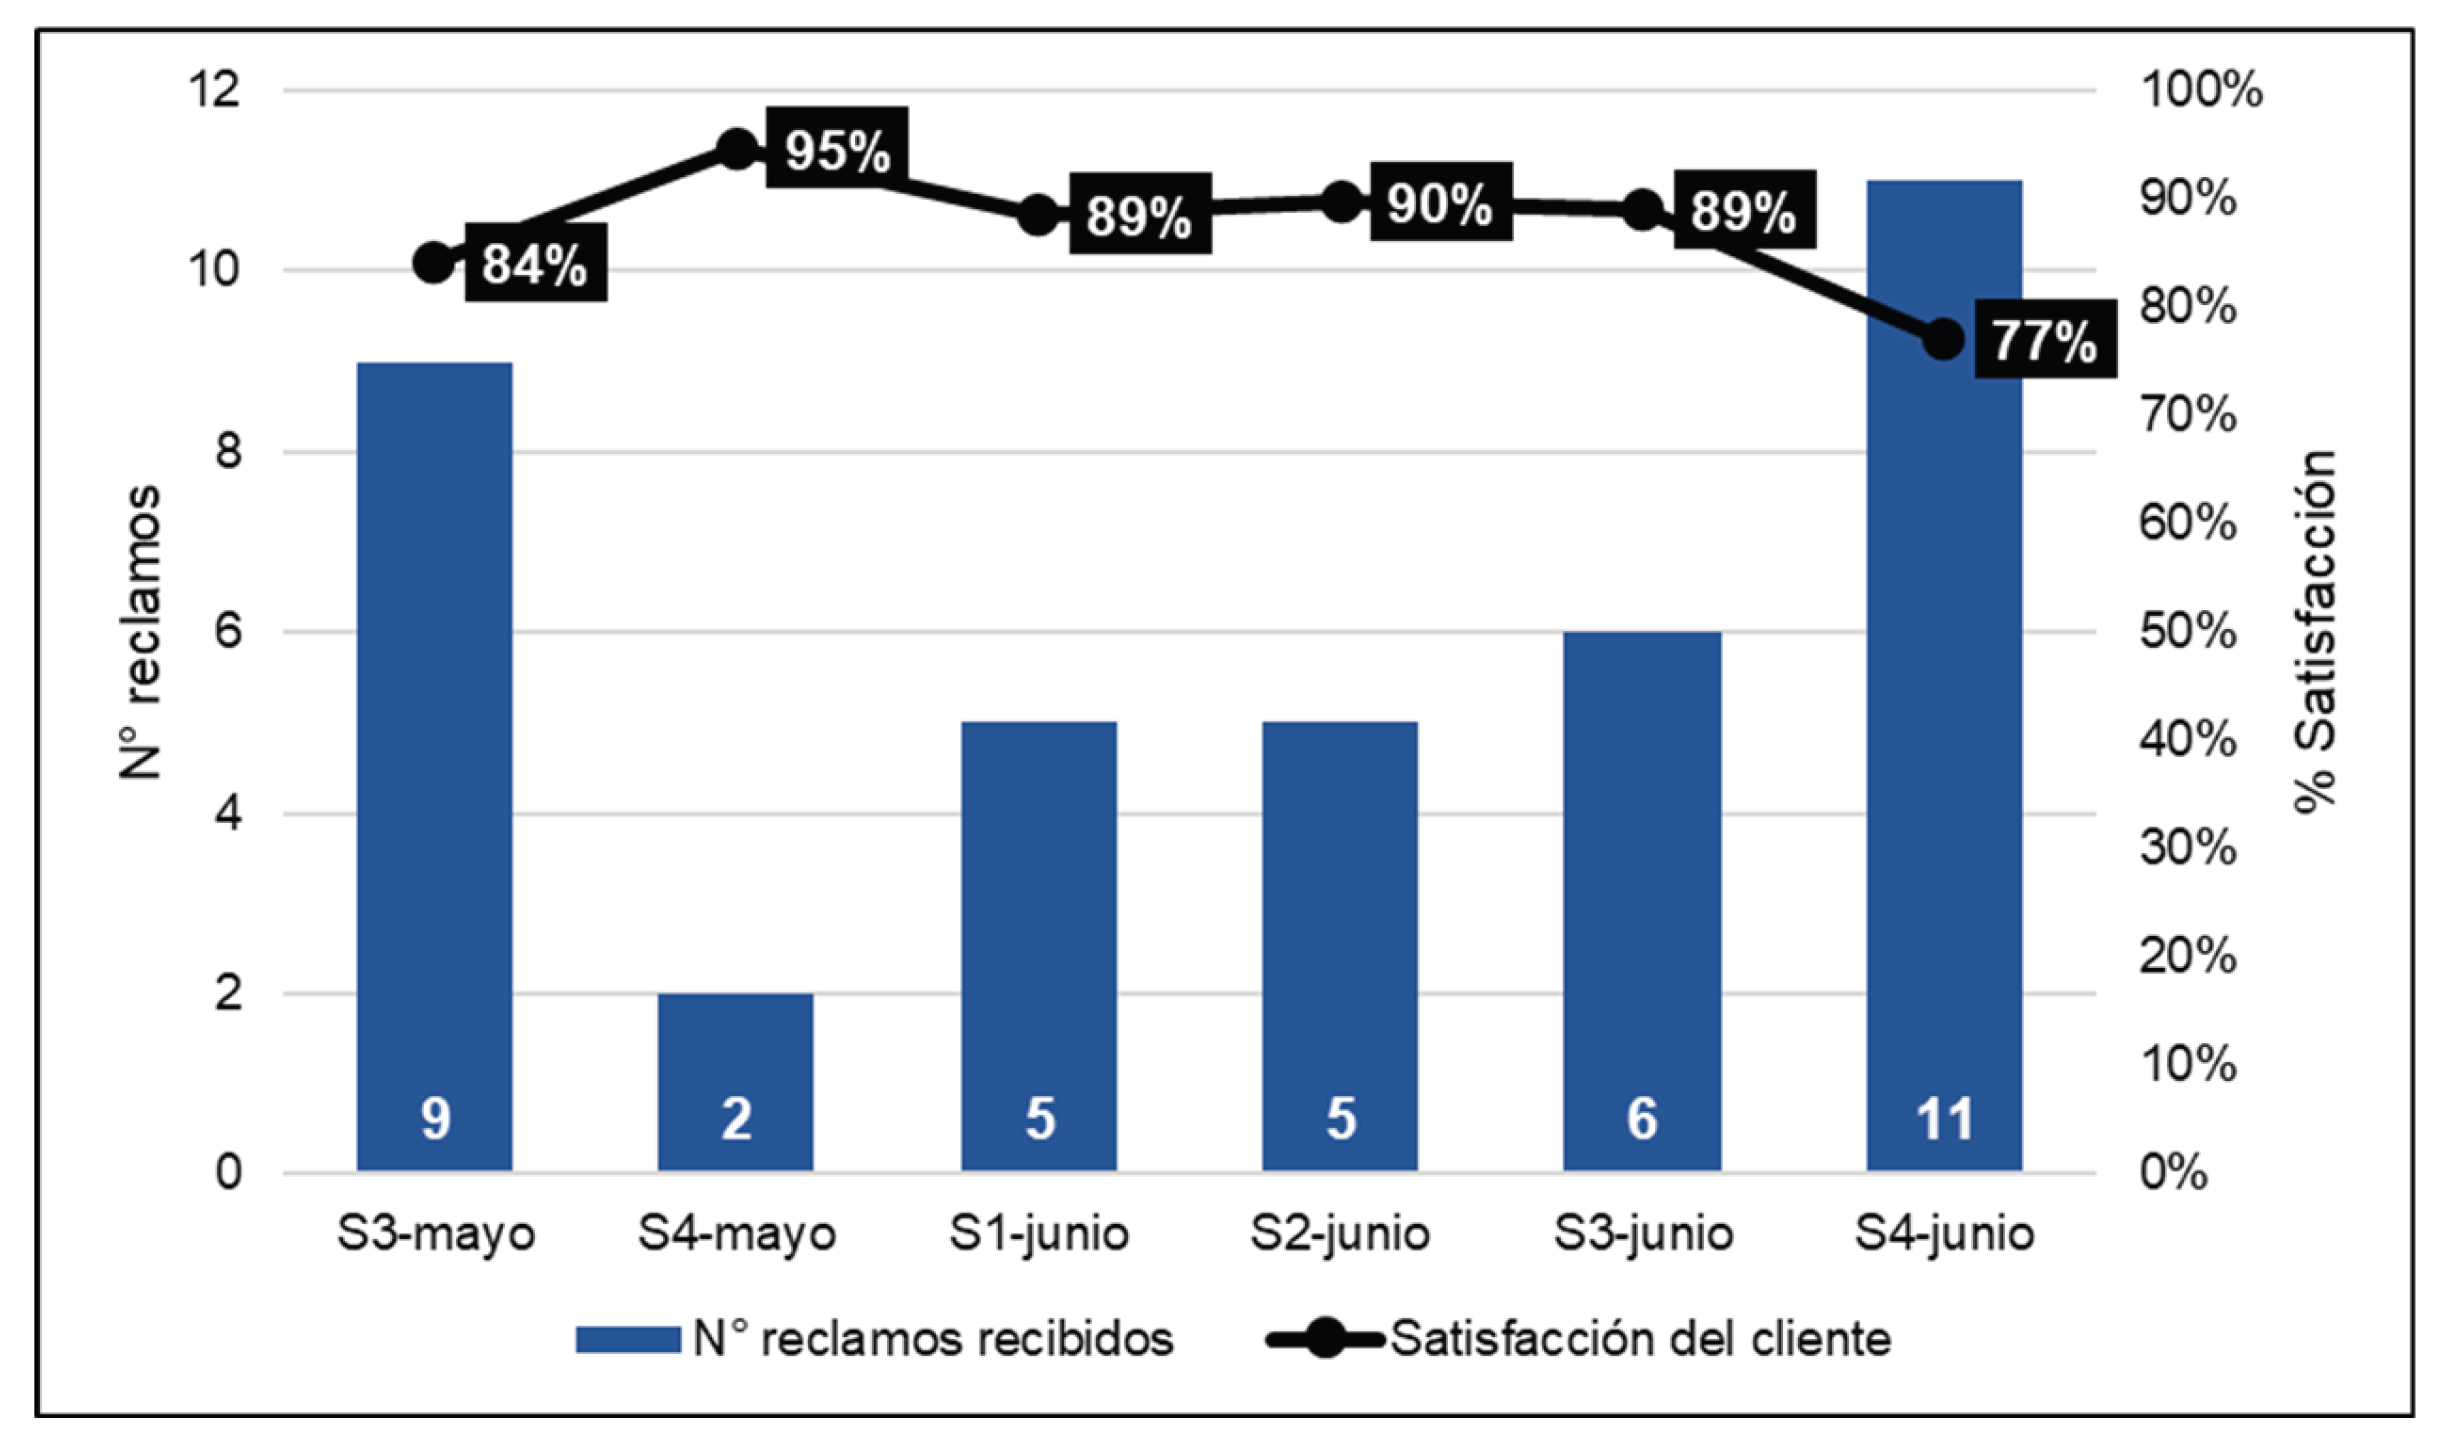
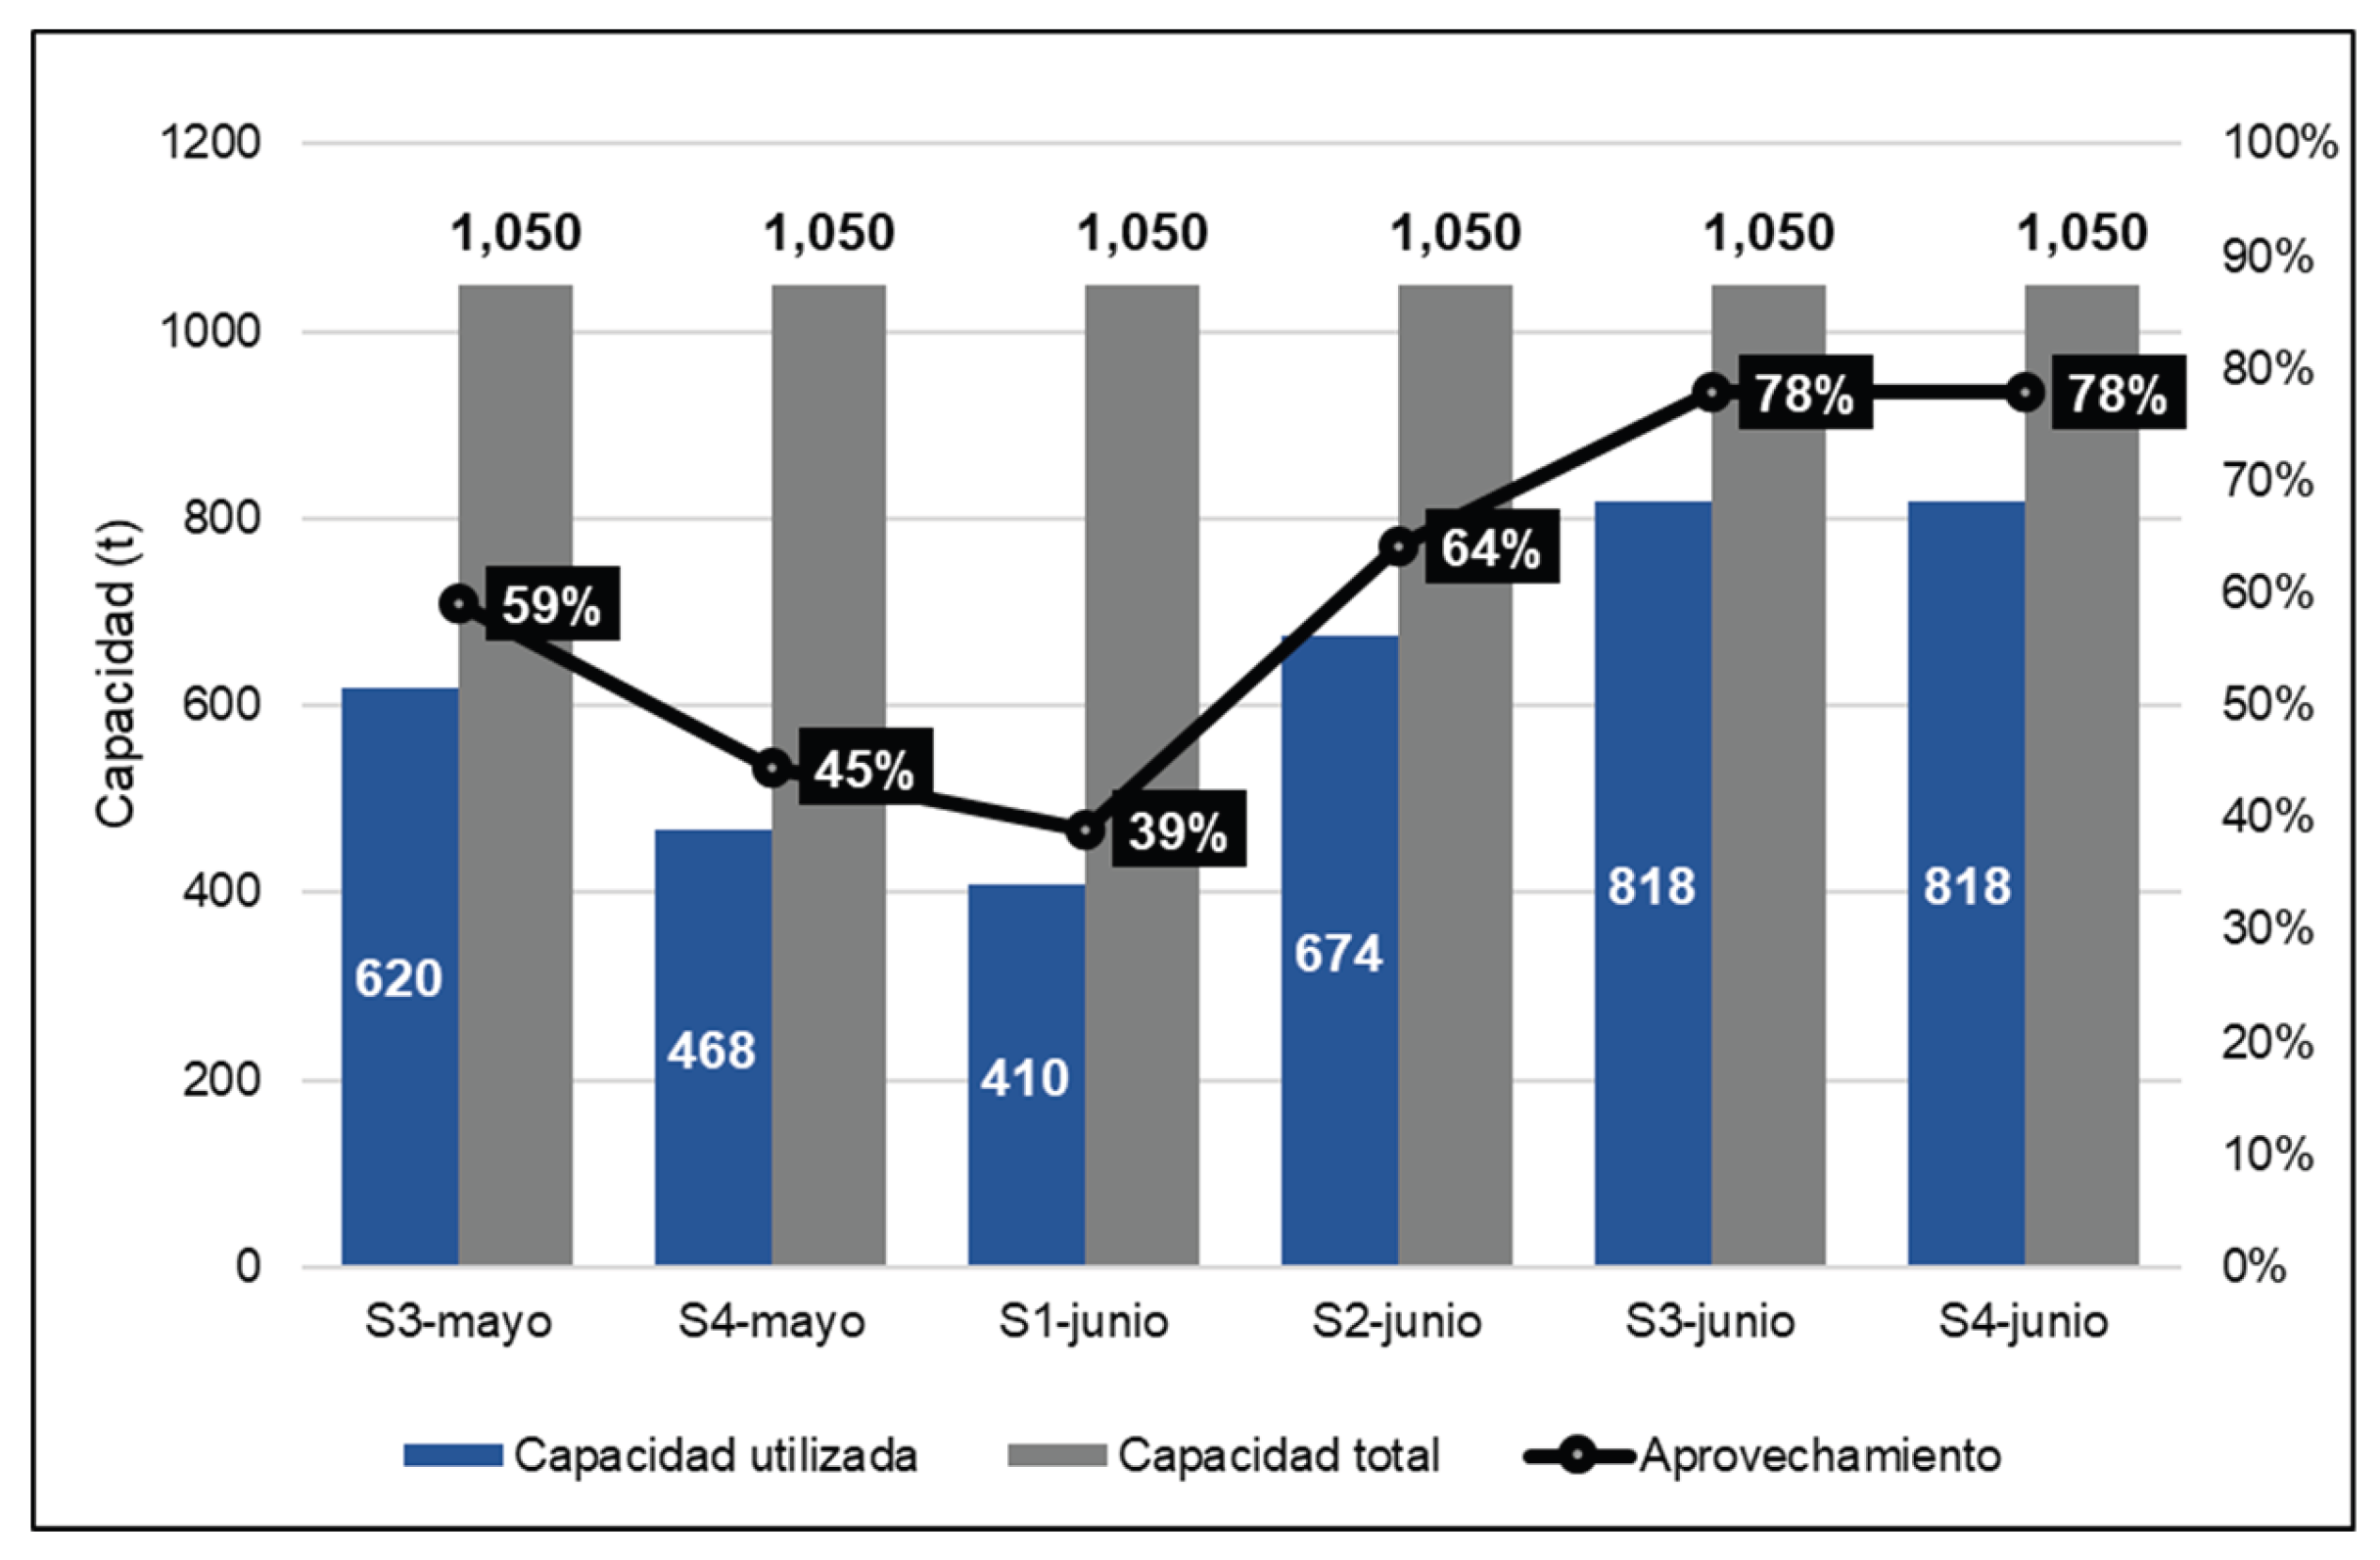
Figure 3.
Pareto Diagram.
Figure 4.
Level of satisfaction of customers served by the company (pre-test).
Figure 5.
Level of utilization of production capacity (pre-test).
3.2. Evaluation of Initial Productivity
With the development of the registration forms, it was possible to consolidate the initial productivity within the six weeks investigated, thus determining the productivity of the raw materials and labor of the company.

Table 1.
Pre-test determination of raw material productivity.
| Week | Month | Production (t) | Quantity of raw material used ( m3 ) | Productivity Raw Material (t/m 3 ) |
|---|---|---|---|---|
| 3 | May | 620.00 | 868.00 | 0.714 |
| 4 | May | 468.00 | 558.00 | 0.839 |
| 1 | June | 410.00 | 372.00 | 1.102 |
| 2 | June | 674.00 | 744.00 | 0.906 |
| 3 | June | 818.00 | 868.00 | 0.942 |
| 4 | June | 818.00 | 1116.00 | 0.733 |
| Average | 0.873 | |||
The productivity of the raw material reached an average of 0.873 tons per cubic meter of raw material used for the production of ice blocks. This result indicates a productivity below the company’s expected target of 1.48 tons per cubic meter of raw material used.
Table 2.
Pre-test determination of labor productivity.
| Week | Month | Production (t) | man-hours (HH) |
Productivity Labor (T /HH) |
|---|---|---|---|---|
| 3 | May | 620.00 | 455 | 1.36 |
| 4 | May | 468.00 | 420 | 1.11 |
| 1 | June | 410.00 | 350 | 1.17 |
| 2 | June | 674.00 | 420 | 1.60 |
| 3 | June | 818.00 | 490 | 1.67 |
| 4 | June | 818.00 | 525 | 1.56 |
| Average | 1.41 | |||
Labor-related productivity averaged 1.41 tons produced per man-hour, a low level for the organization. This result fell short of senior management’s target of 3.87 tons per man-hour.
Table 3.
Pre-test determination of total pre-test productivity.
| Week | Month | Production value (S/) | Energy cost (S/) | Cost of material (S/) | Labor cost (S/) | Other costs (S/) | Productivity Total (S/) |
|---|---|---|---|---|---|---|---|
| 3 | May | 65,100.00 | 17,832.97 | 3,160.13 | 5,052.50 | 8,405.76 | 1.89 |
| 4 | May | 49,140.00 | 17,832.97 | 3,160.13 | 5,052.50 | 8,405.76 | 1.43 |
| 1 | June | 43,050.00 | 12,631.94 | 3,903.25 | 6,372.38 | 8,226.13 | 1.38 |
| 2 | June | 70,770.00 | 12,631.94 | 3,903.25 | 6,372.38 | 8,226.13 | 2.27 |
| 3 | June | 85,890.00 | 12,631.94 | 3,903.25 | 6,372.38 | 8,226.13 | 2.76 |
| 4 | June | 85,890.00 | 12,631.94 | 3,903.25 | 6,372.38 | 8,226.13 | 2.76 |
| Average | 2.08 | ||||||
The pre-test of total productivity over the eight weeks evaluated showed that for every sol invested by the plant, it generated S/ 2.08 in production. The first week of June showed the lowest total productivity, while the last three weeks of June showed the highest.
3.3. Design and Implementation of the Improvement
A schedule of activities was established that allowed the organization to monitor the stages planned for this investigation:
The implementation of the balanced scorecard was developed with management support to identify the objectives the company has set for improving its processes. These objectives are grouped according to their financial perspective, customer-related aspects, processes, and the learning and growth of their employees.
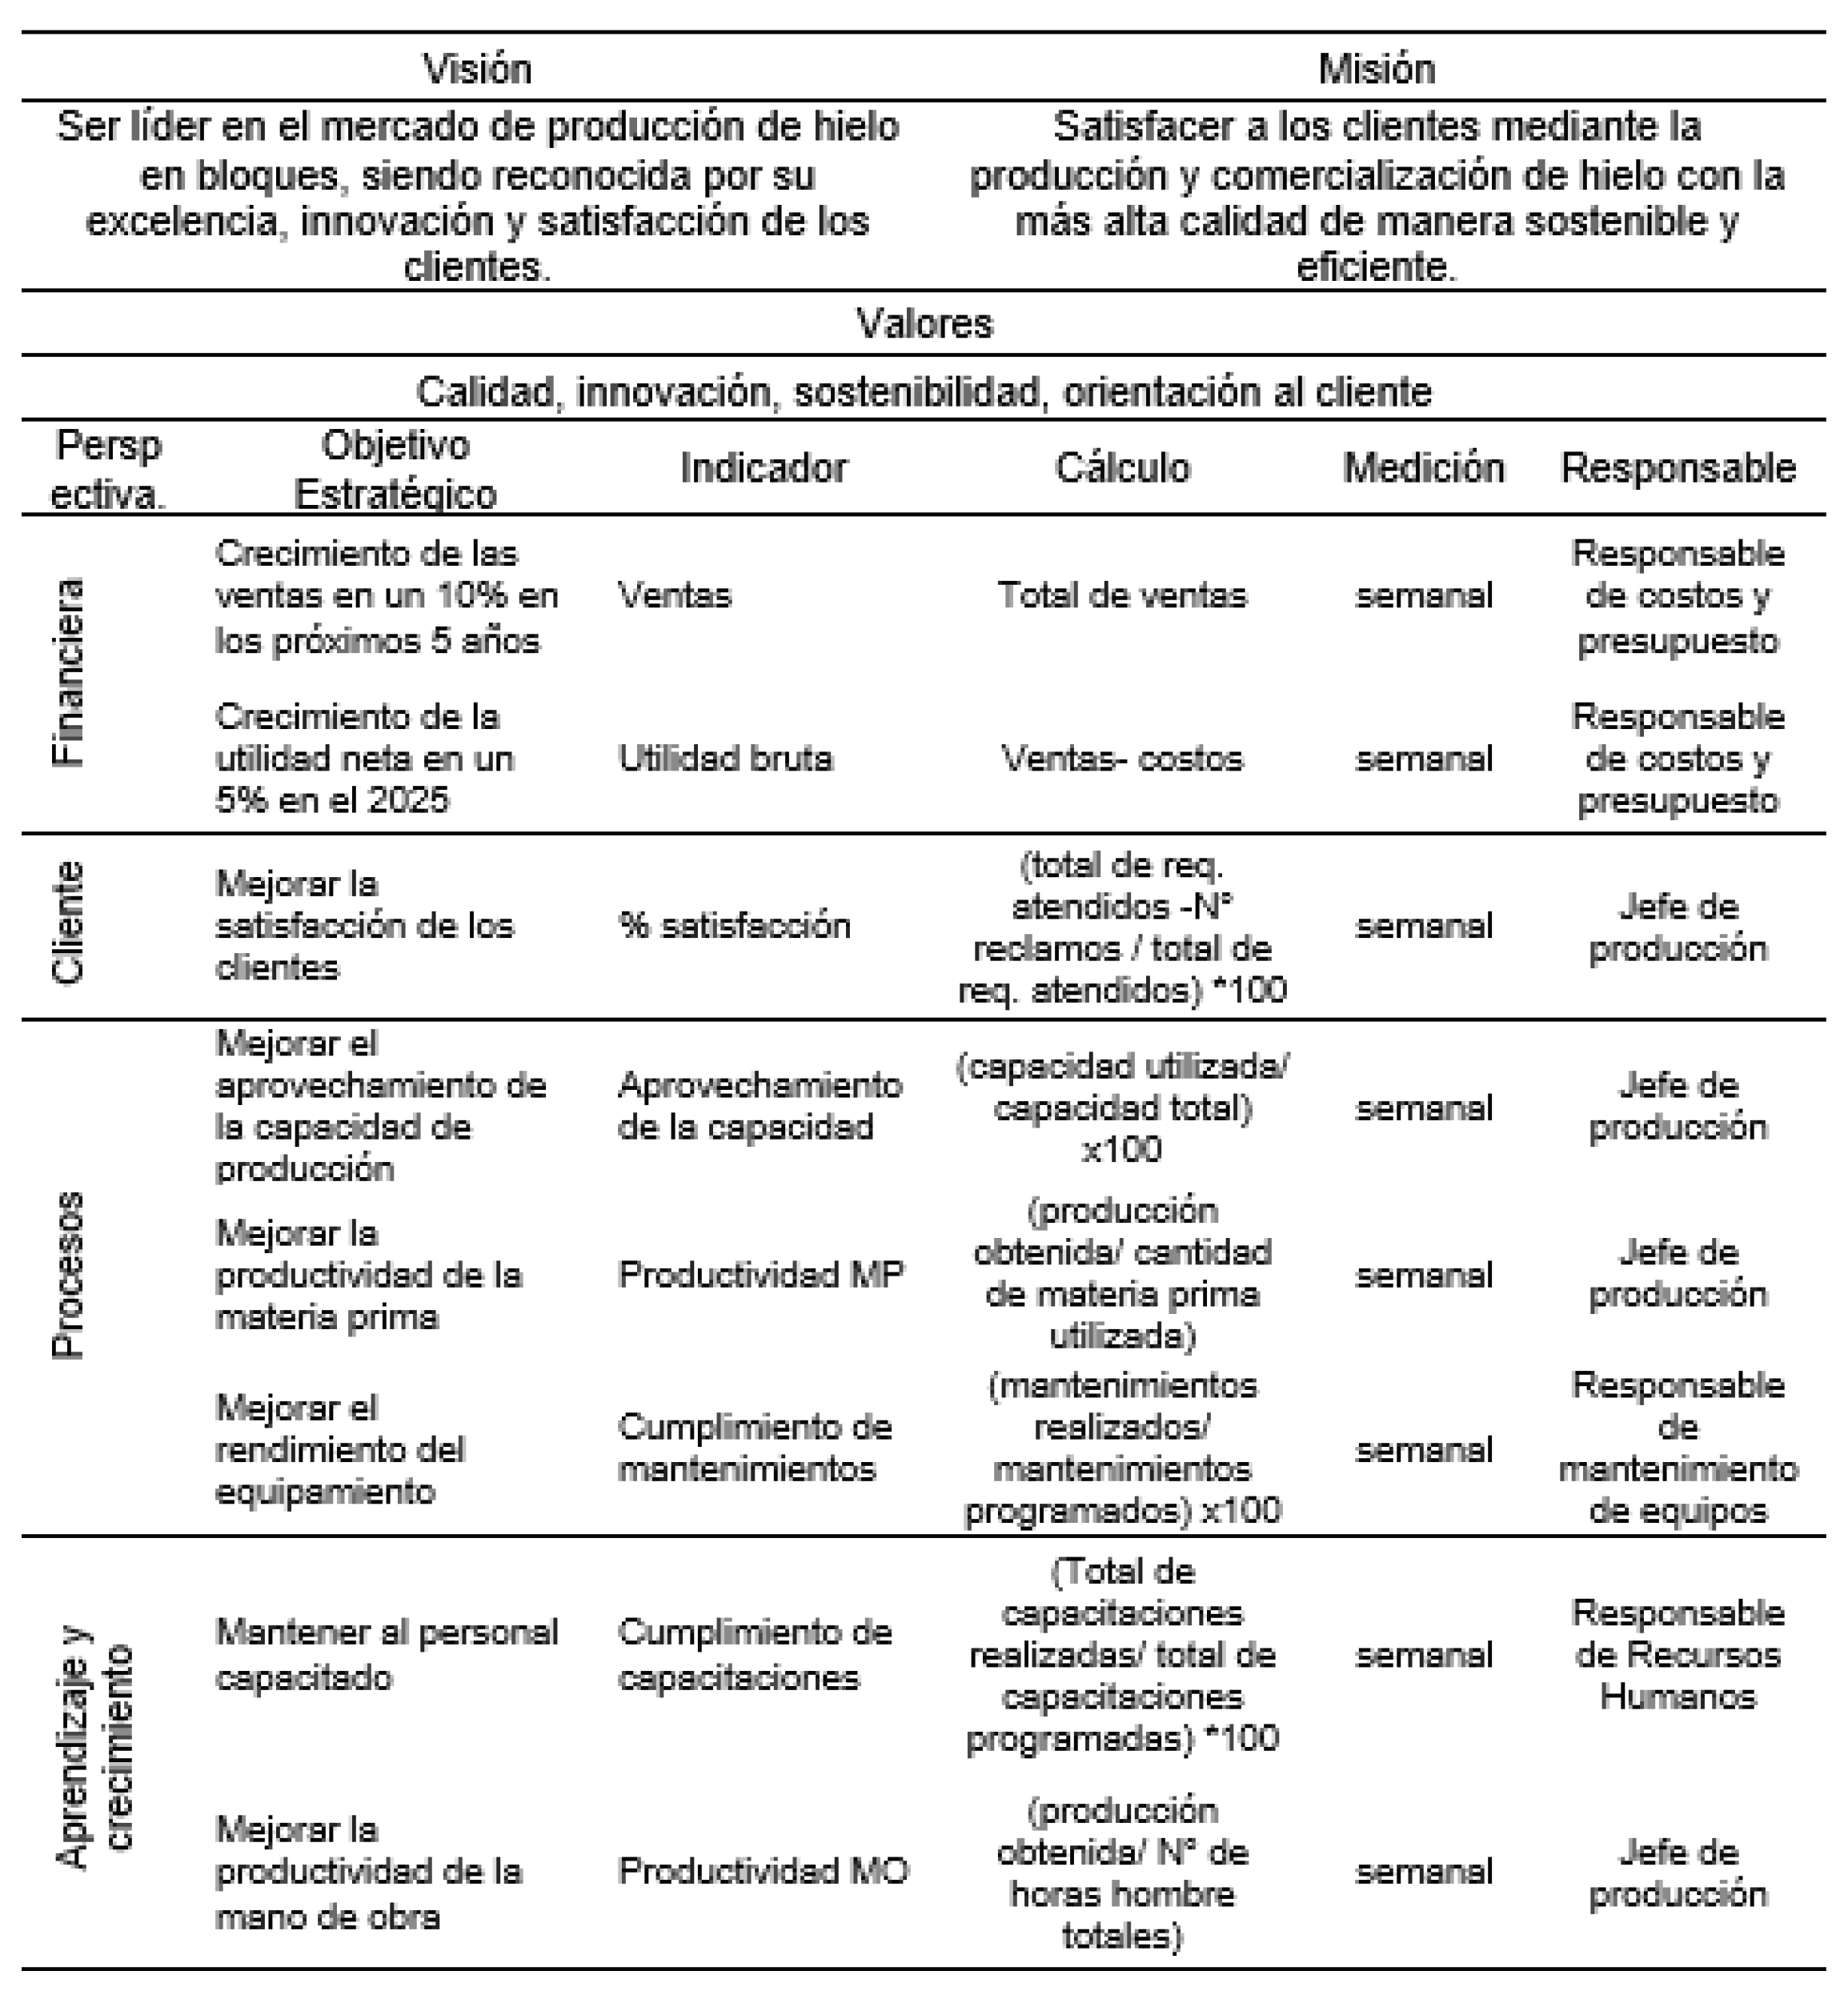
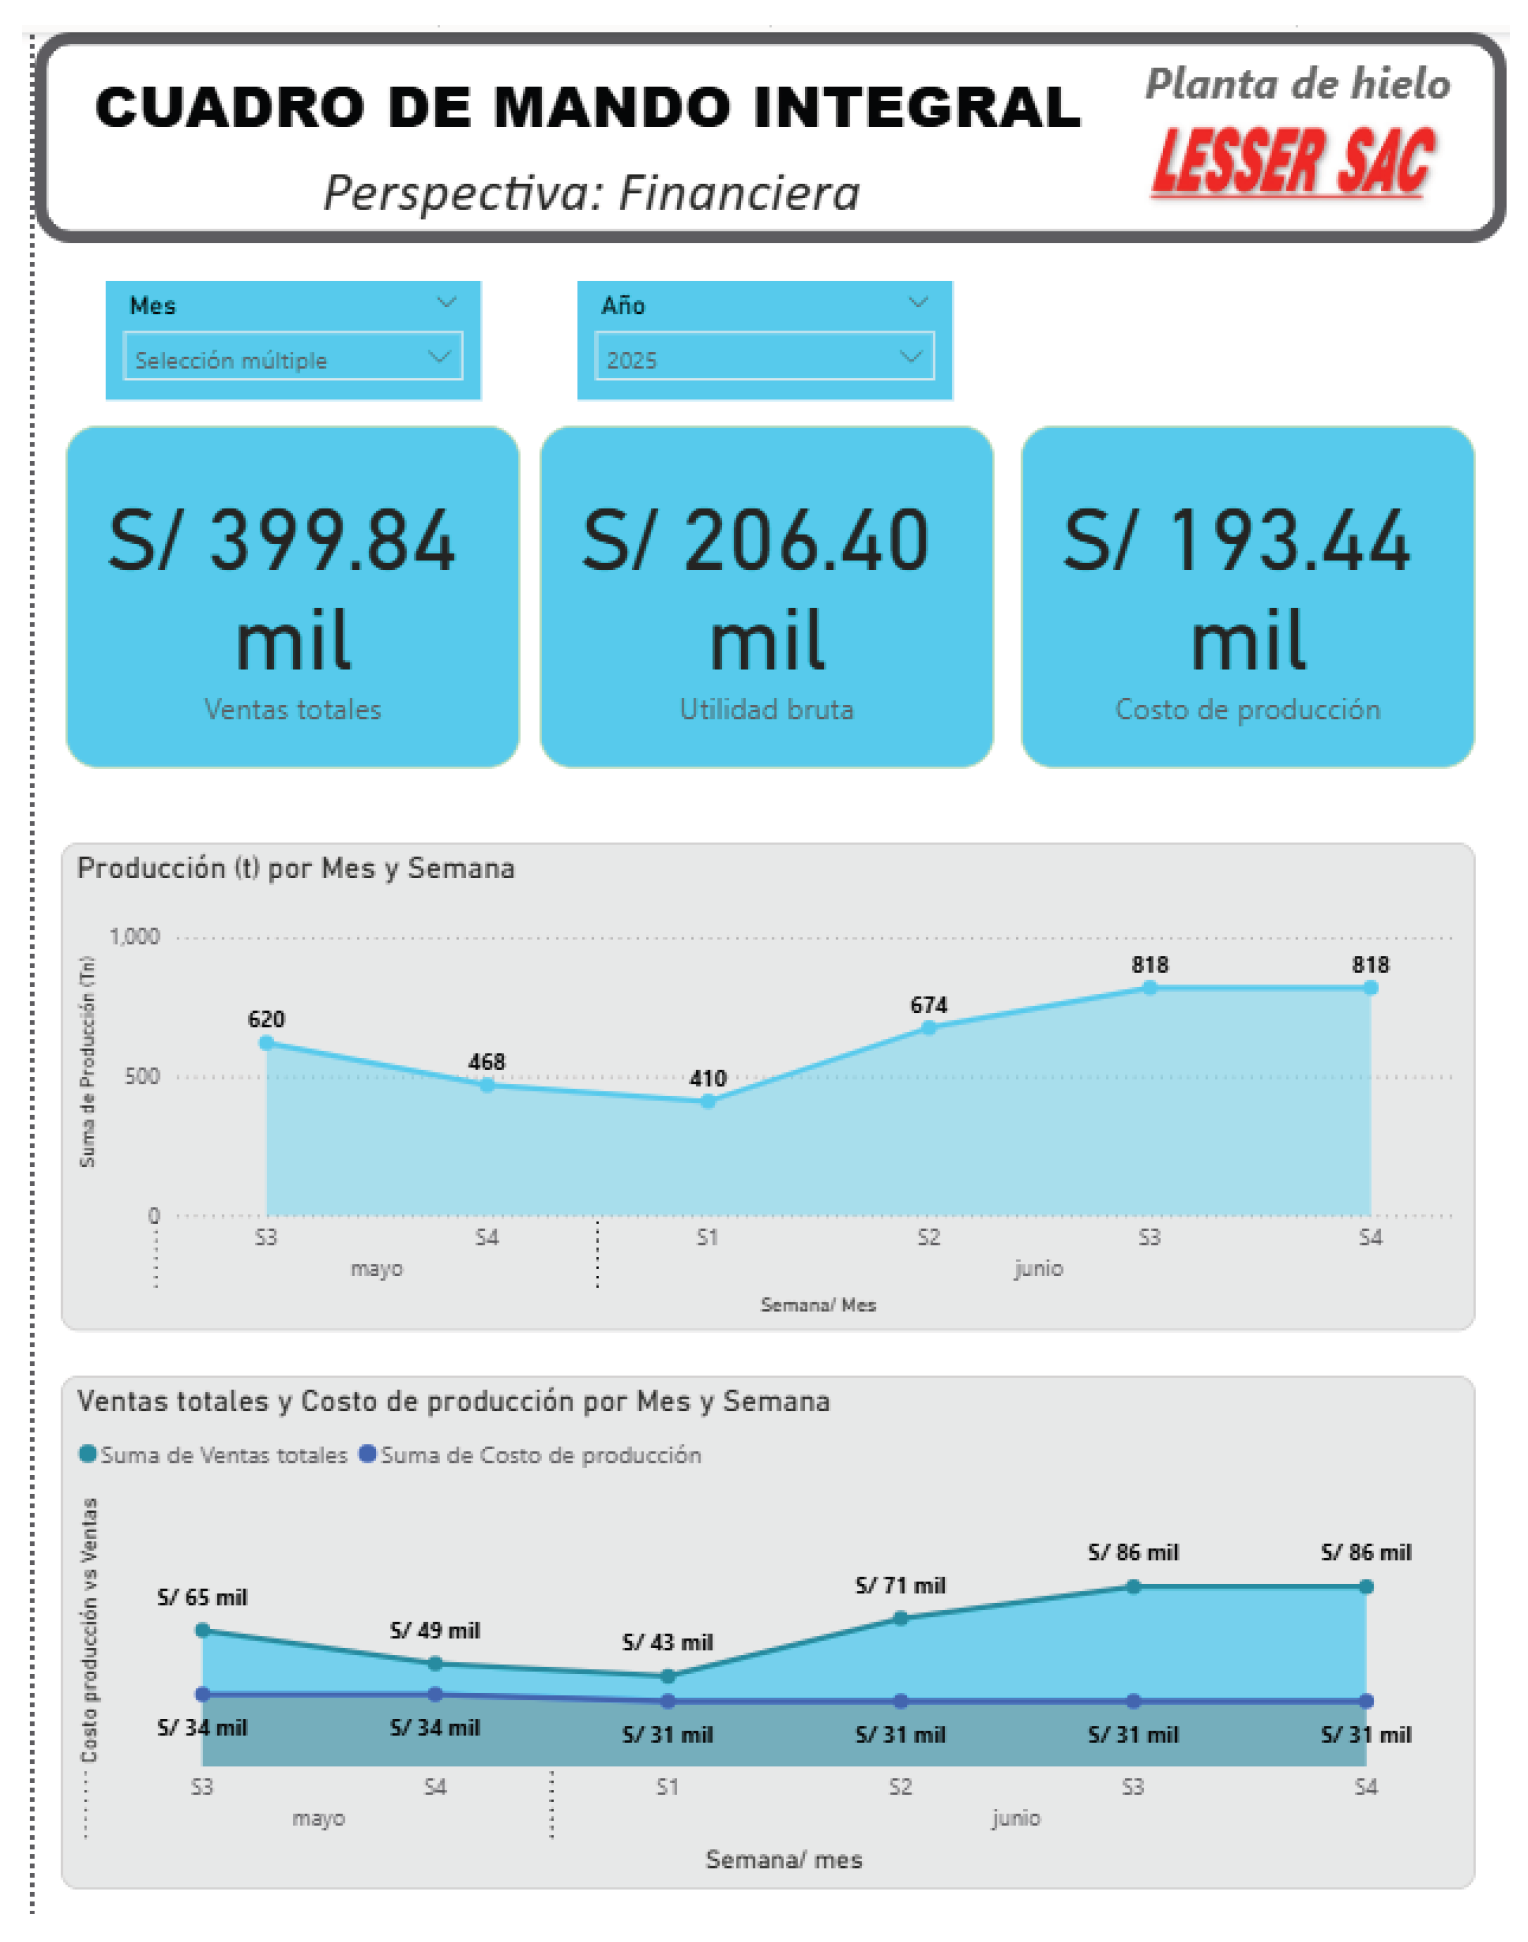
Figure 6.
Integrated dashboard design.
Figure 7.
Financial outlook of the ice plant.
The financial outlook for the ice plant’s dashboard for 2025, as of May and June, shows that total sales in the pre-test period reached S/399,840,000, with a gross profit of S/206,400,000, resulting in a positive margin for the organization. Production costs represented 36% of sales, indicating efficient cost management. The design of these indicators demonstrates that the plant maintains controlled costs during this period.
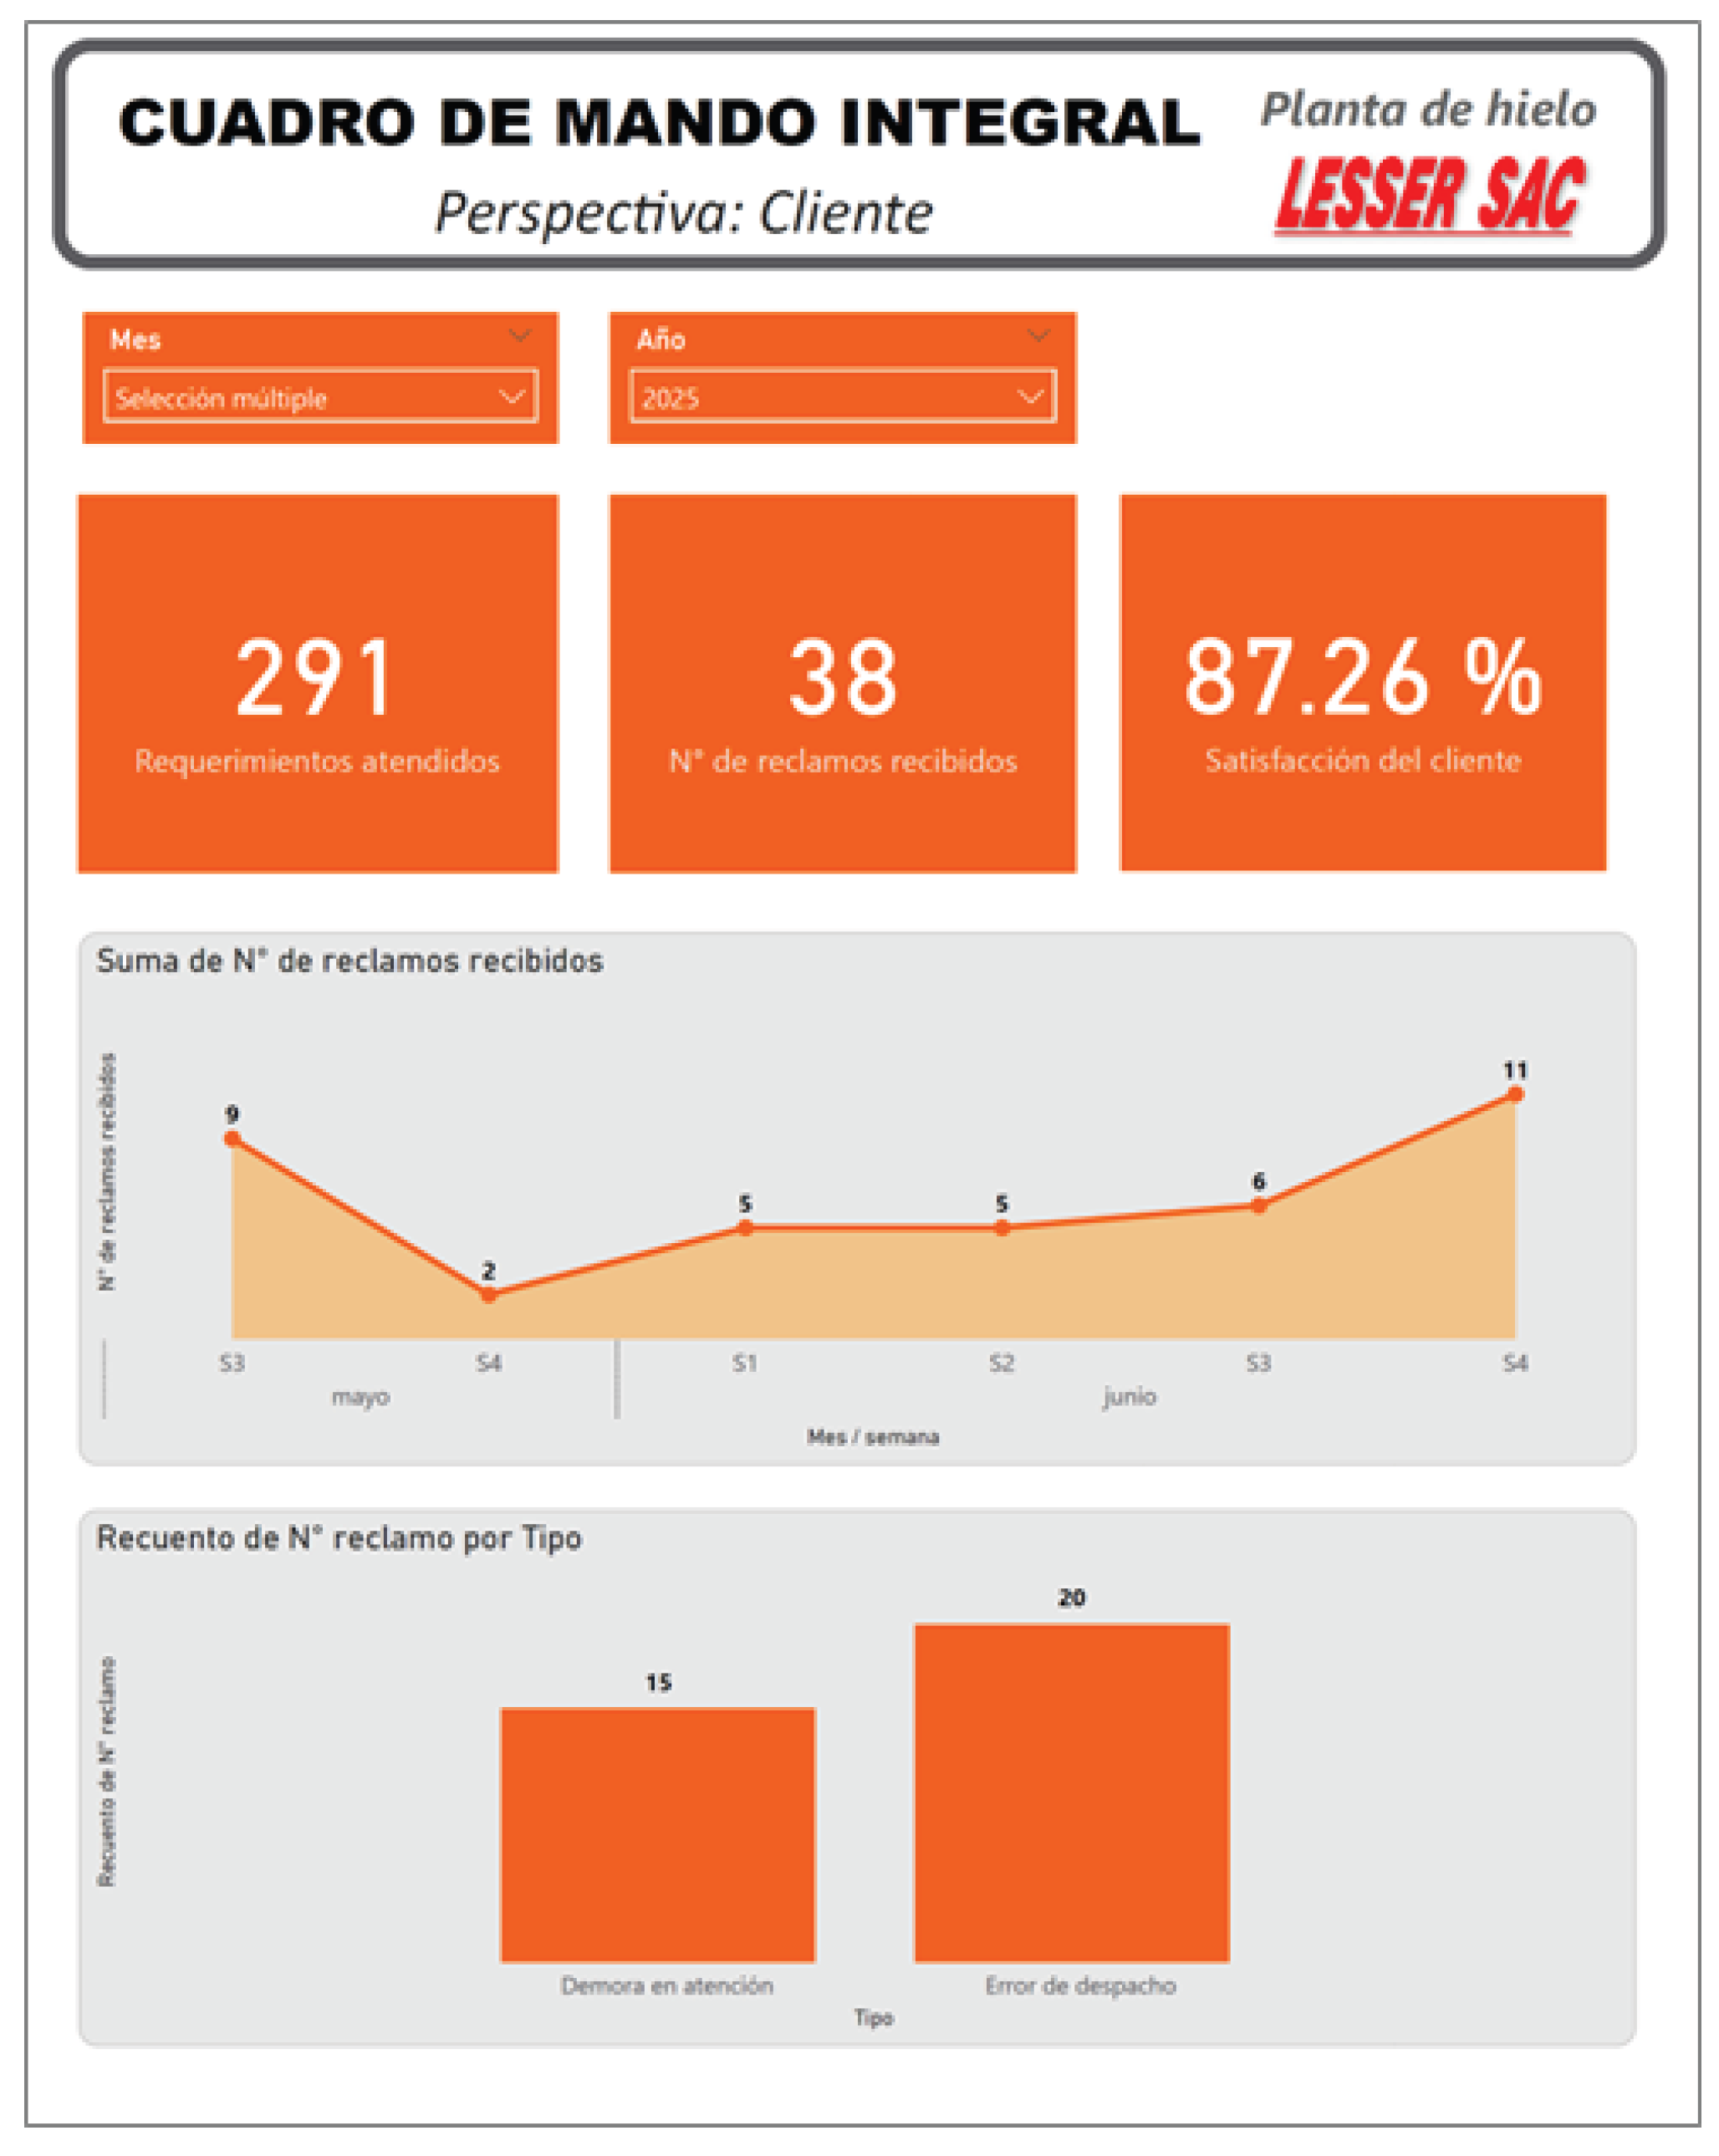
Figure 8.
Customer perspective of the ice plant.
The customer perspective of the ice plant’s dashboard for the year 2025 in the months of May and June, highlighting the level of service satisfaction of 87.26%, within the complaints it was evident that dispatch errors are predominant, followed by delays in service, this showed problems in fulfilling the deliveries of orders to customers.
The performance dashboard for the ice plant in May and June of 2025 showed that plant utilization reached only 60.44%, with a raw material productivity of 0.87 tons per cubic meter. This indicated that while the plant has adequate installed capacity, its low utilization level limited its ability to reach maximum overall productivity. Furthermore, the dashboard revealed areas for improvement in maintenance activities to ensure the efficient use of resources.
Figure 10 shows the learning and growth perspective of the staff in the ice plant’s dashboard for 2025, specifically for the months of May and June. During the pre-test, labor productivity reached 1.41 tons per man-hour, and no training had been conducted or scheduled during that period. While the plant has managed to maintain labor productivity, the lack of training presented an opportunity to strengthen skills and ensure process productivity.
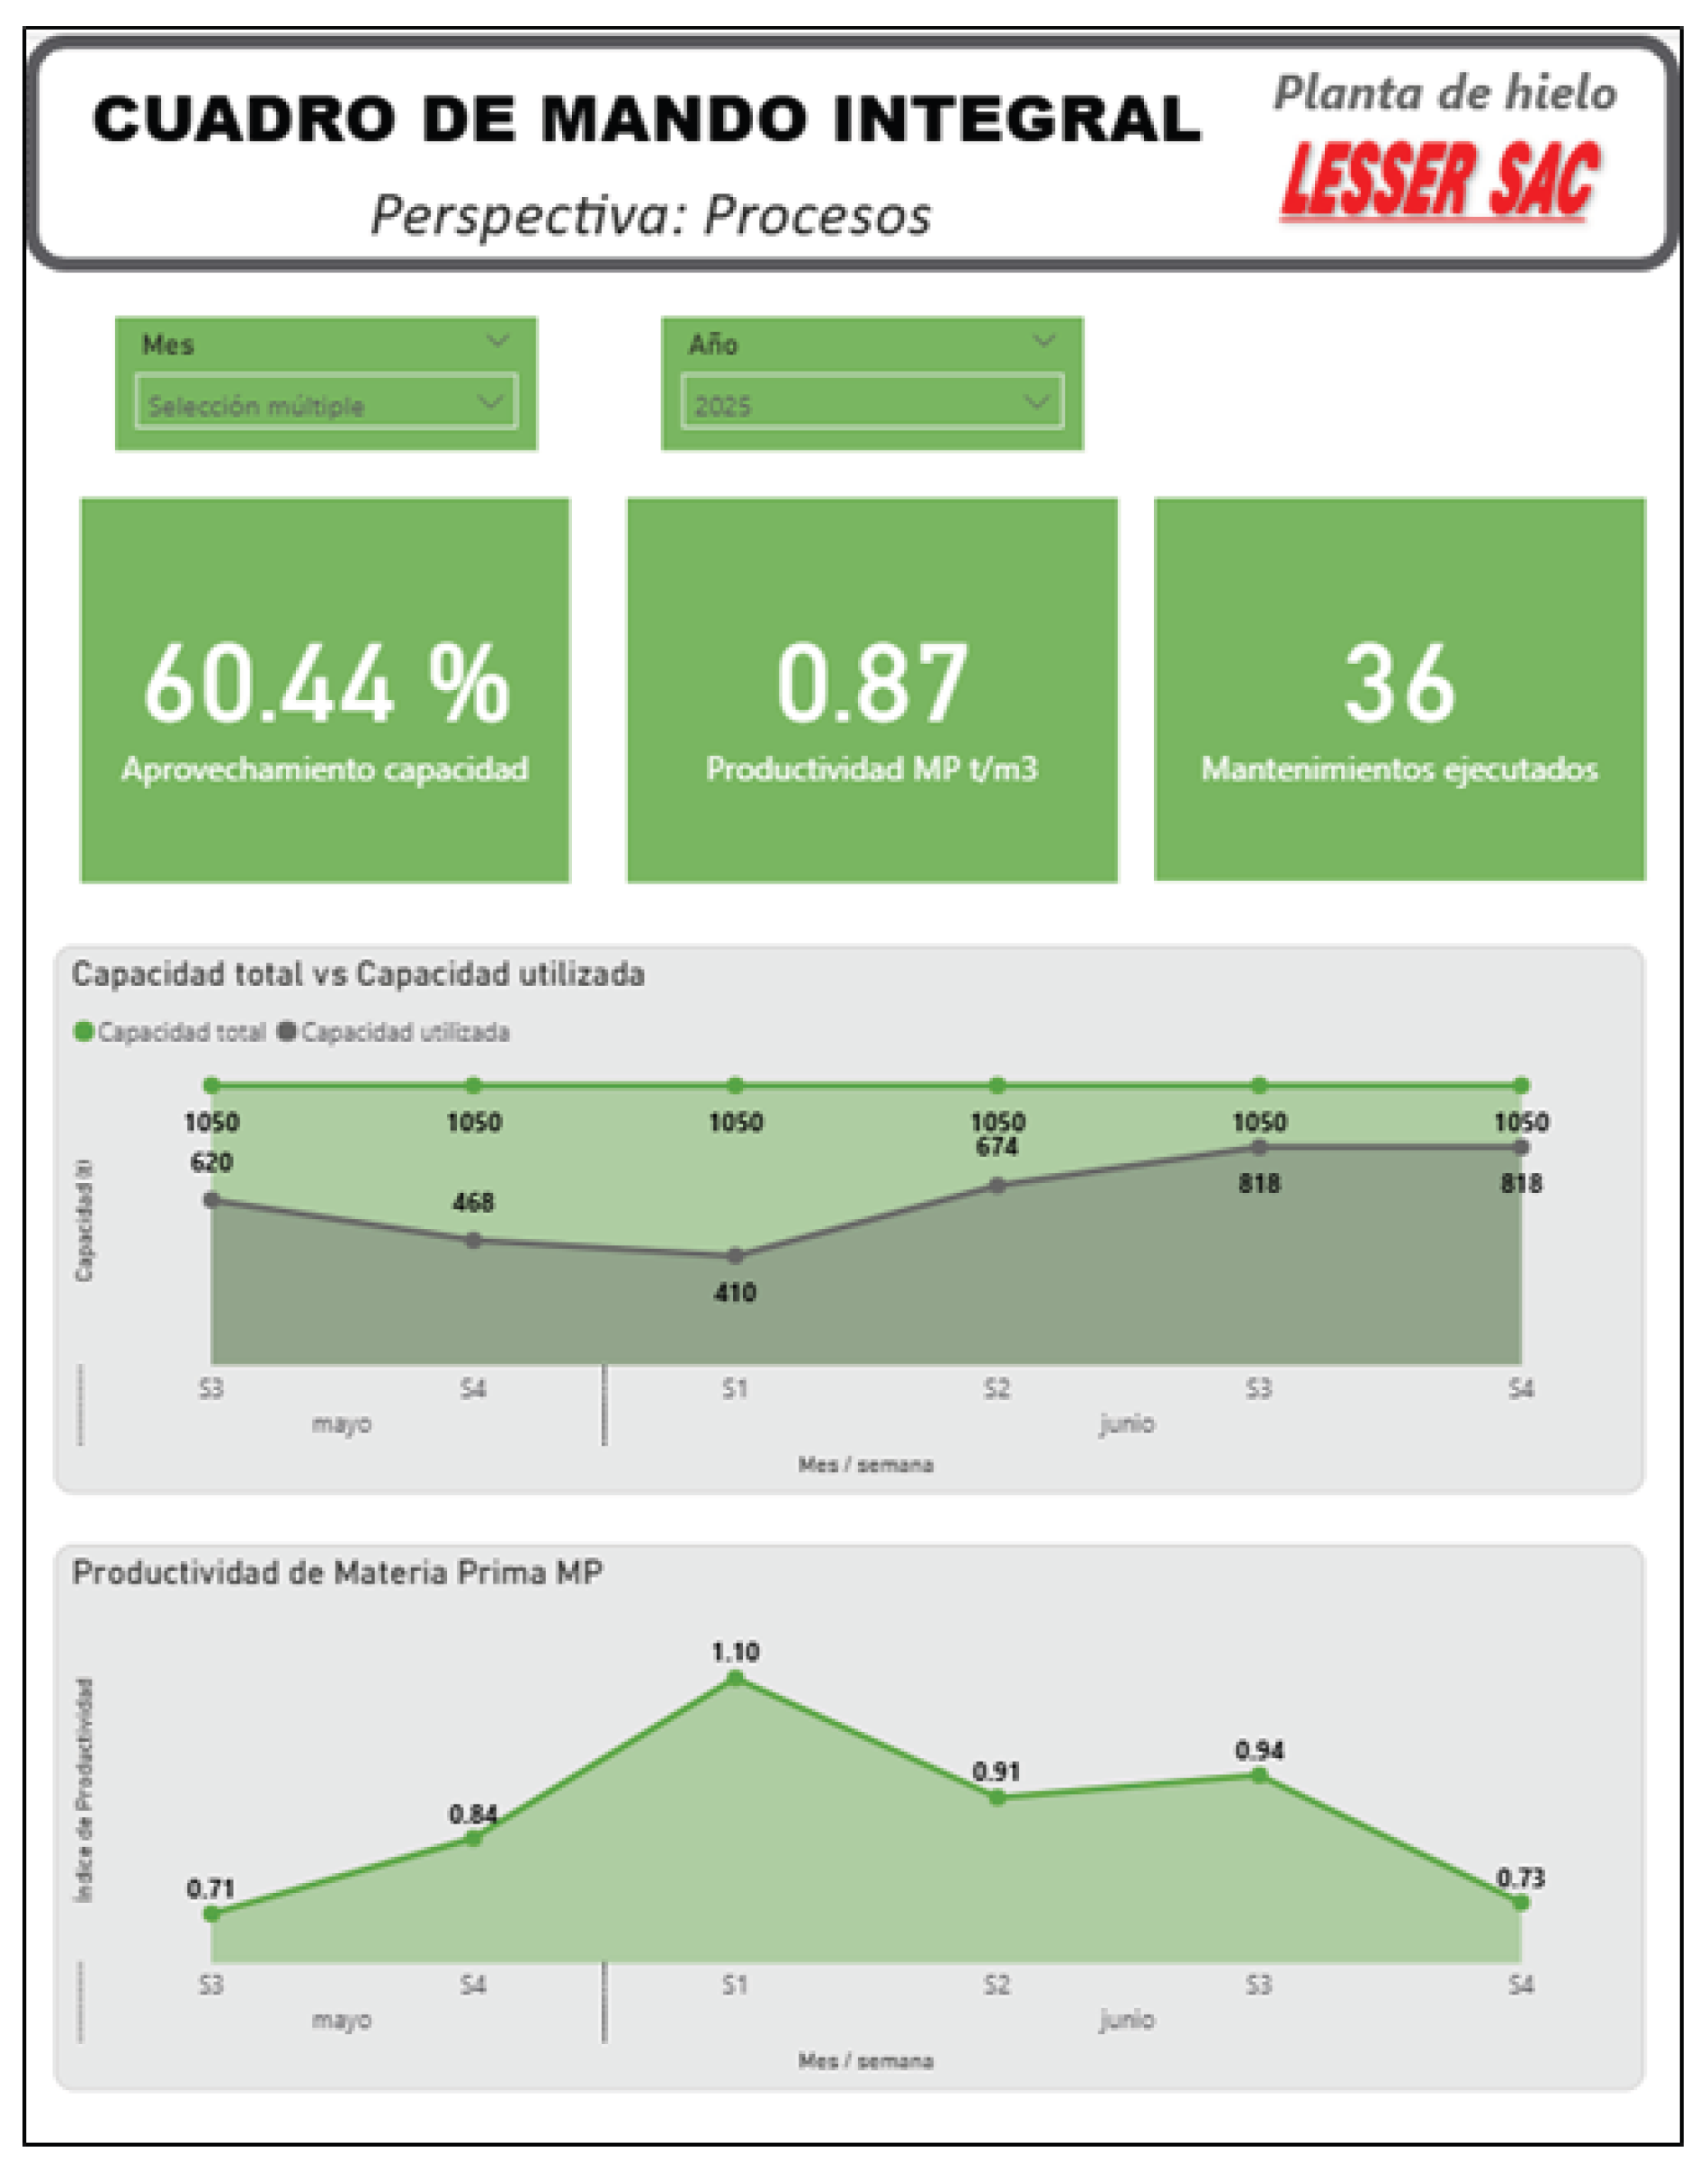
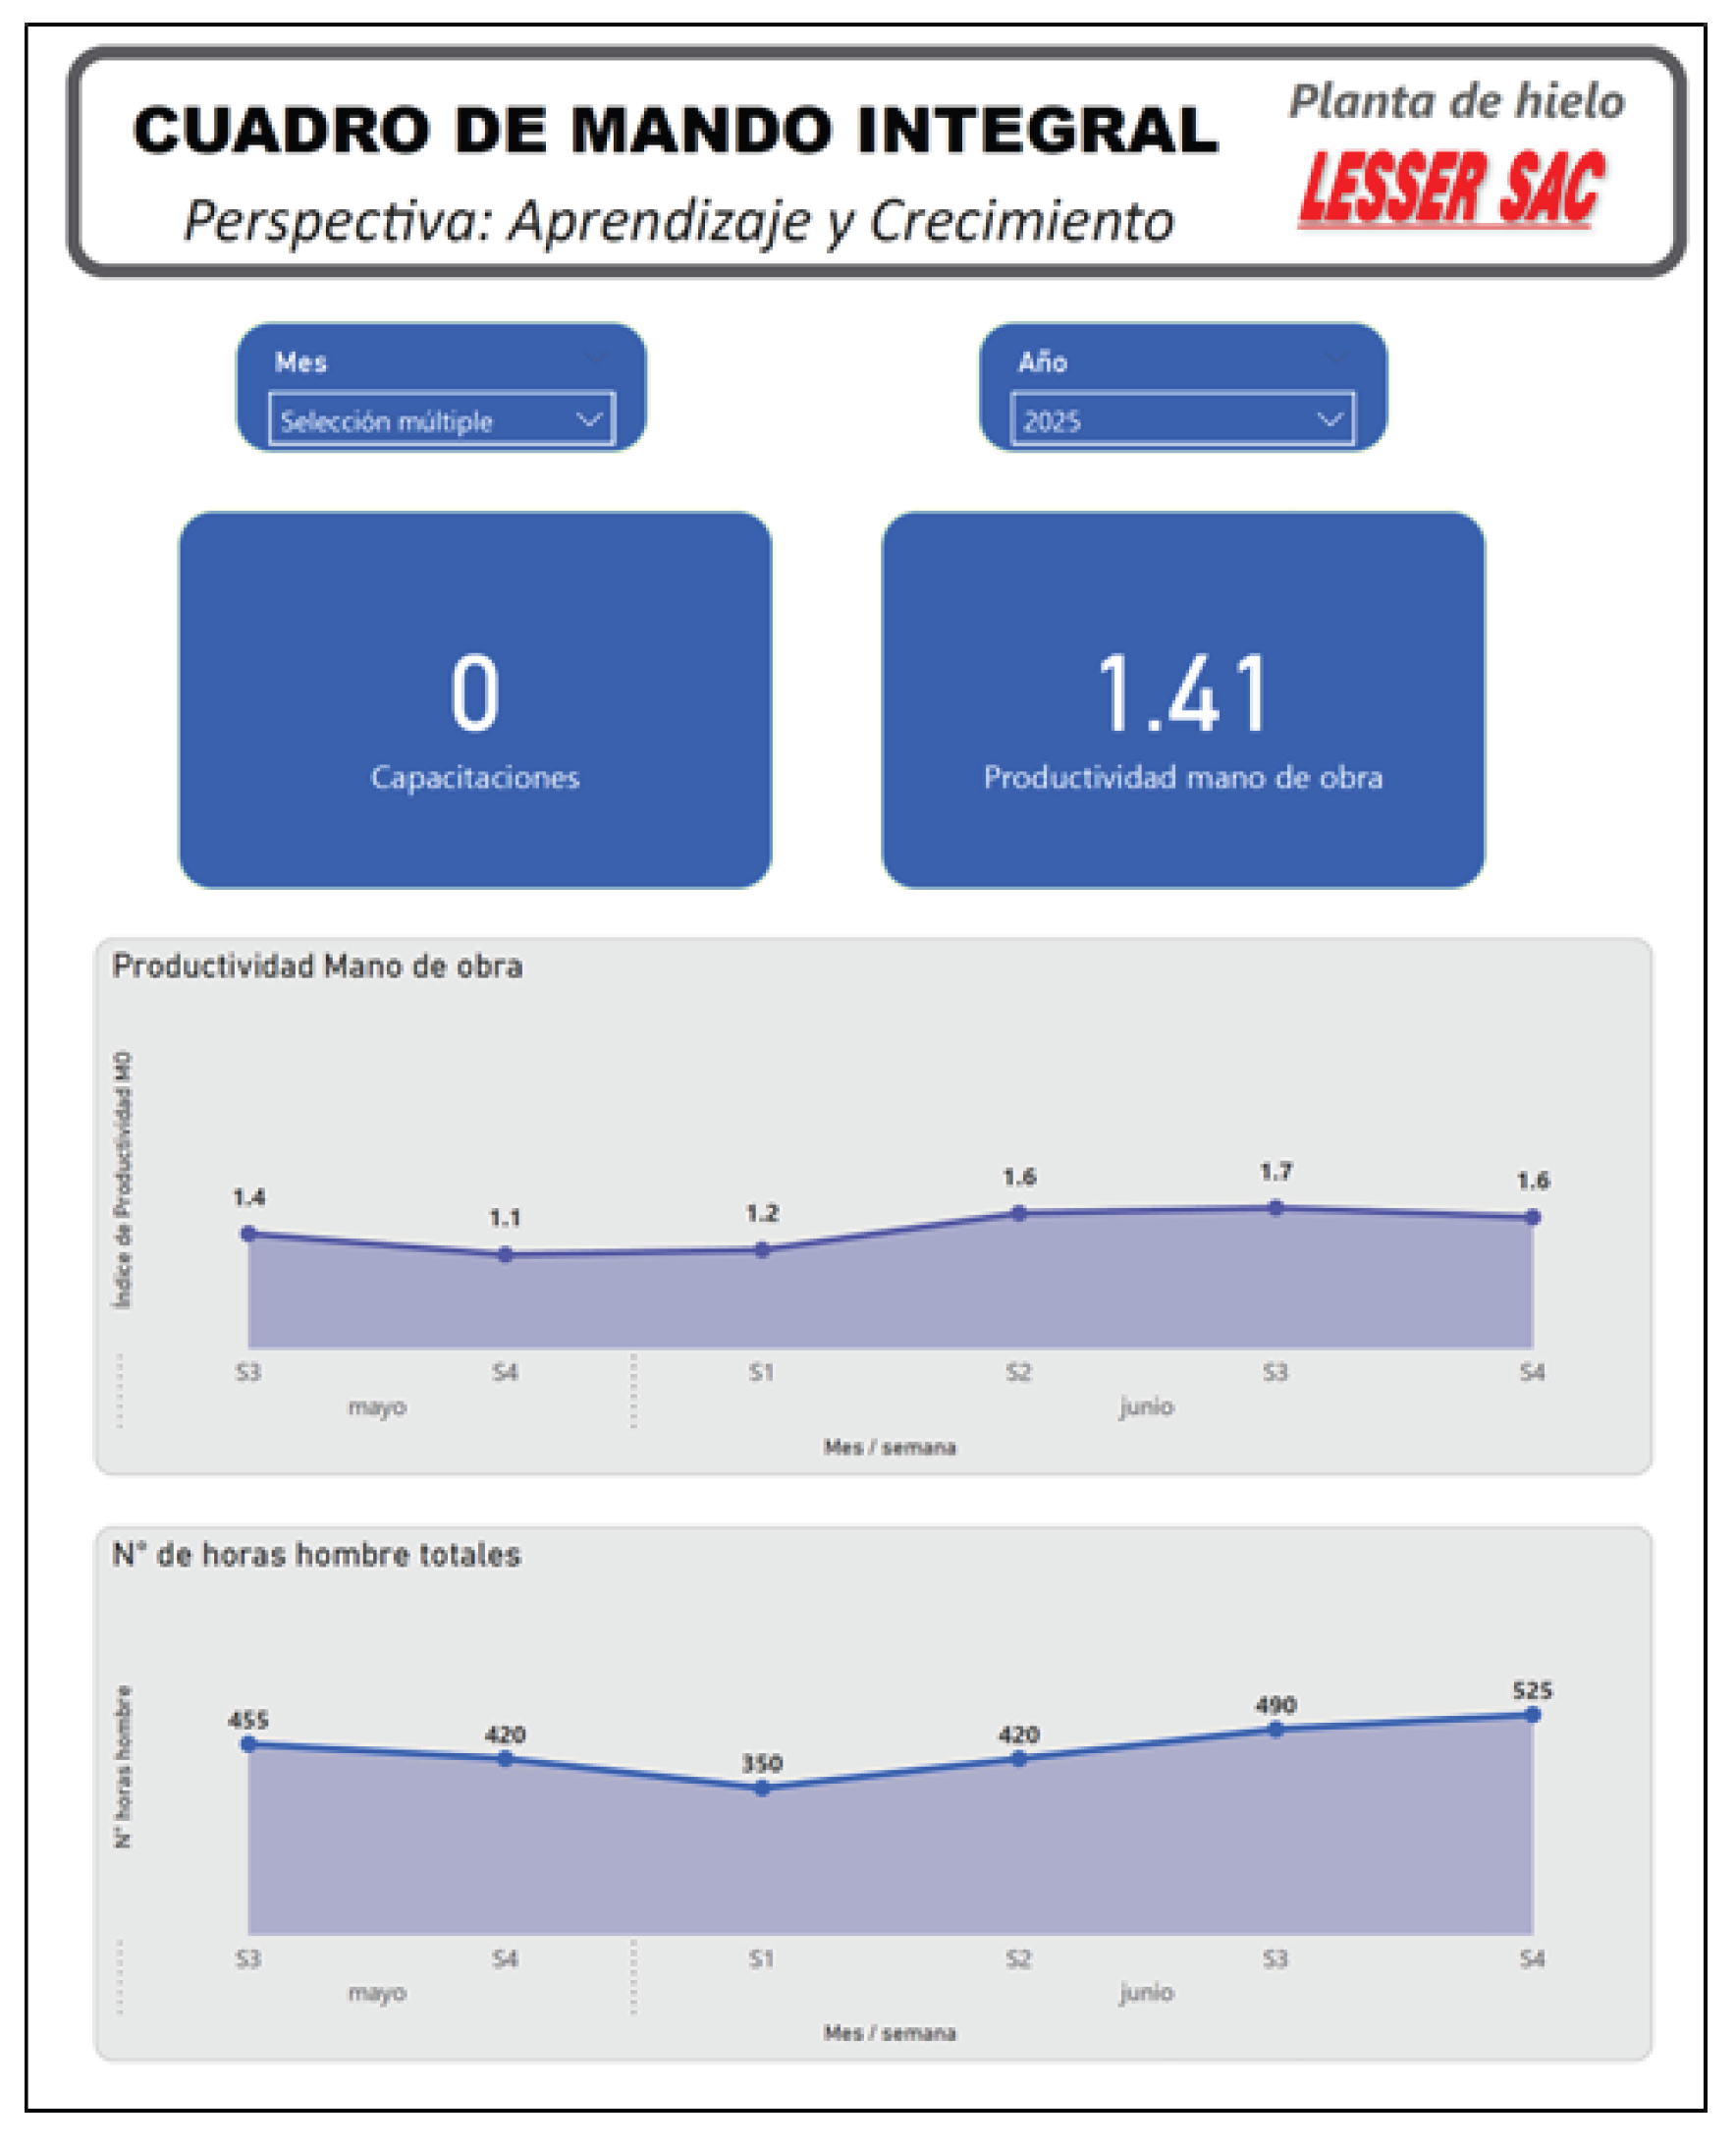
Figure 9.
Perspective view of the ice plant process.
Figure 10.
Learning and knowledge perspective of collaborators.
As part of the standardization stage, it was identified that the company currently does not have documented processes, so the operational processes were identified where there is a need to be able to prepare documents that allow the organization to standardize the way of carrying out operational work.
A flowchart was developed for the raw material receiving process, including the verification of received supplies and the steps to ensure they meet quality requirements. Similarly, a flowchart for ice production was created, describing the operational steps performed in the production tanks. Finally, a flowchart for the dispatch of finished products was developed, outlining the steps for delivering the products to the end customers.
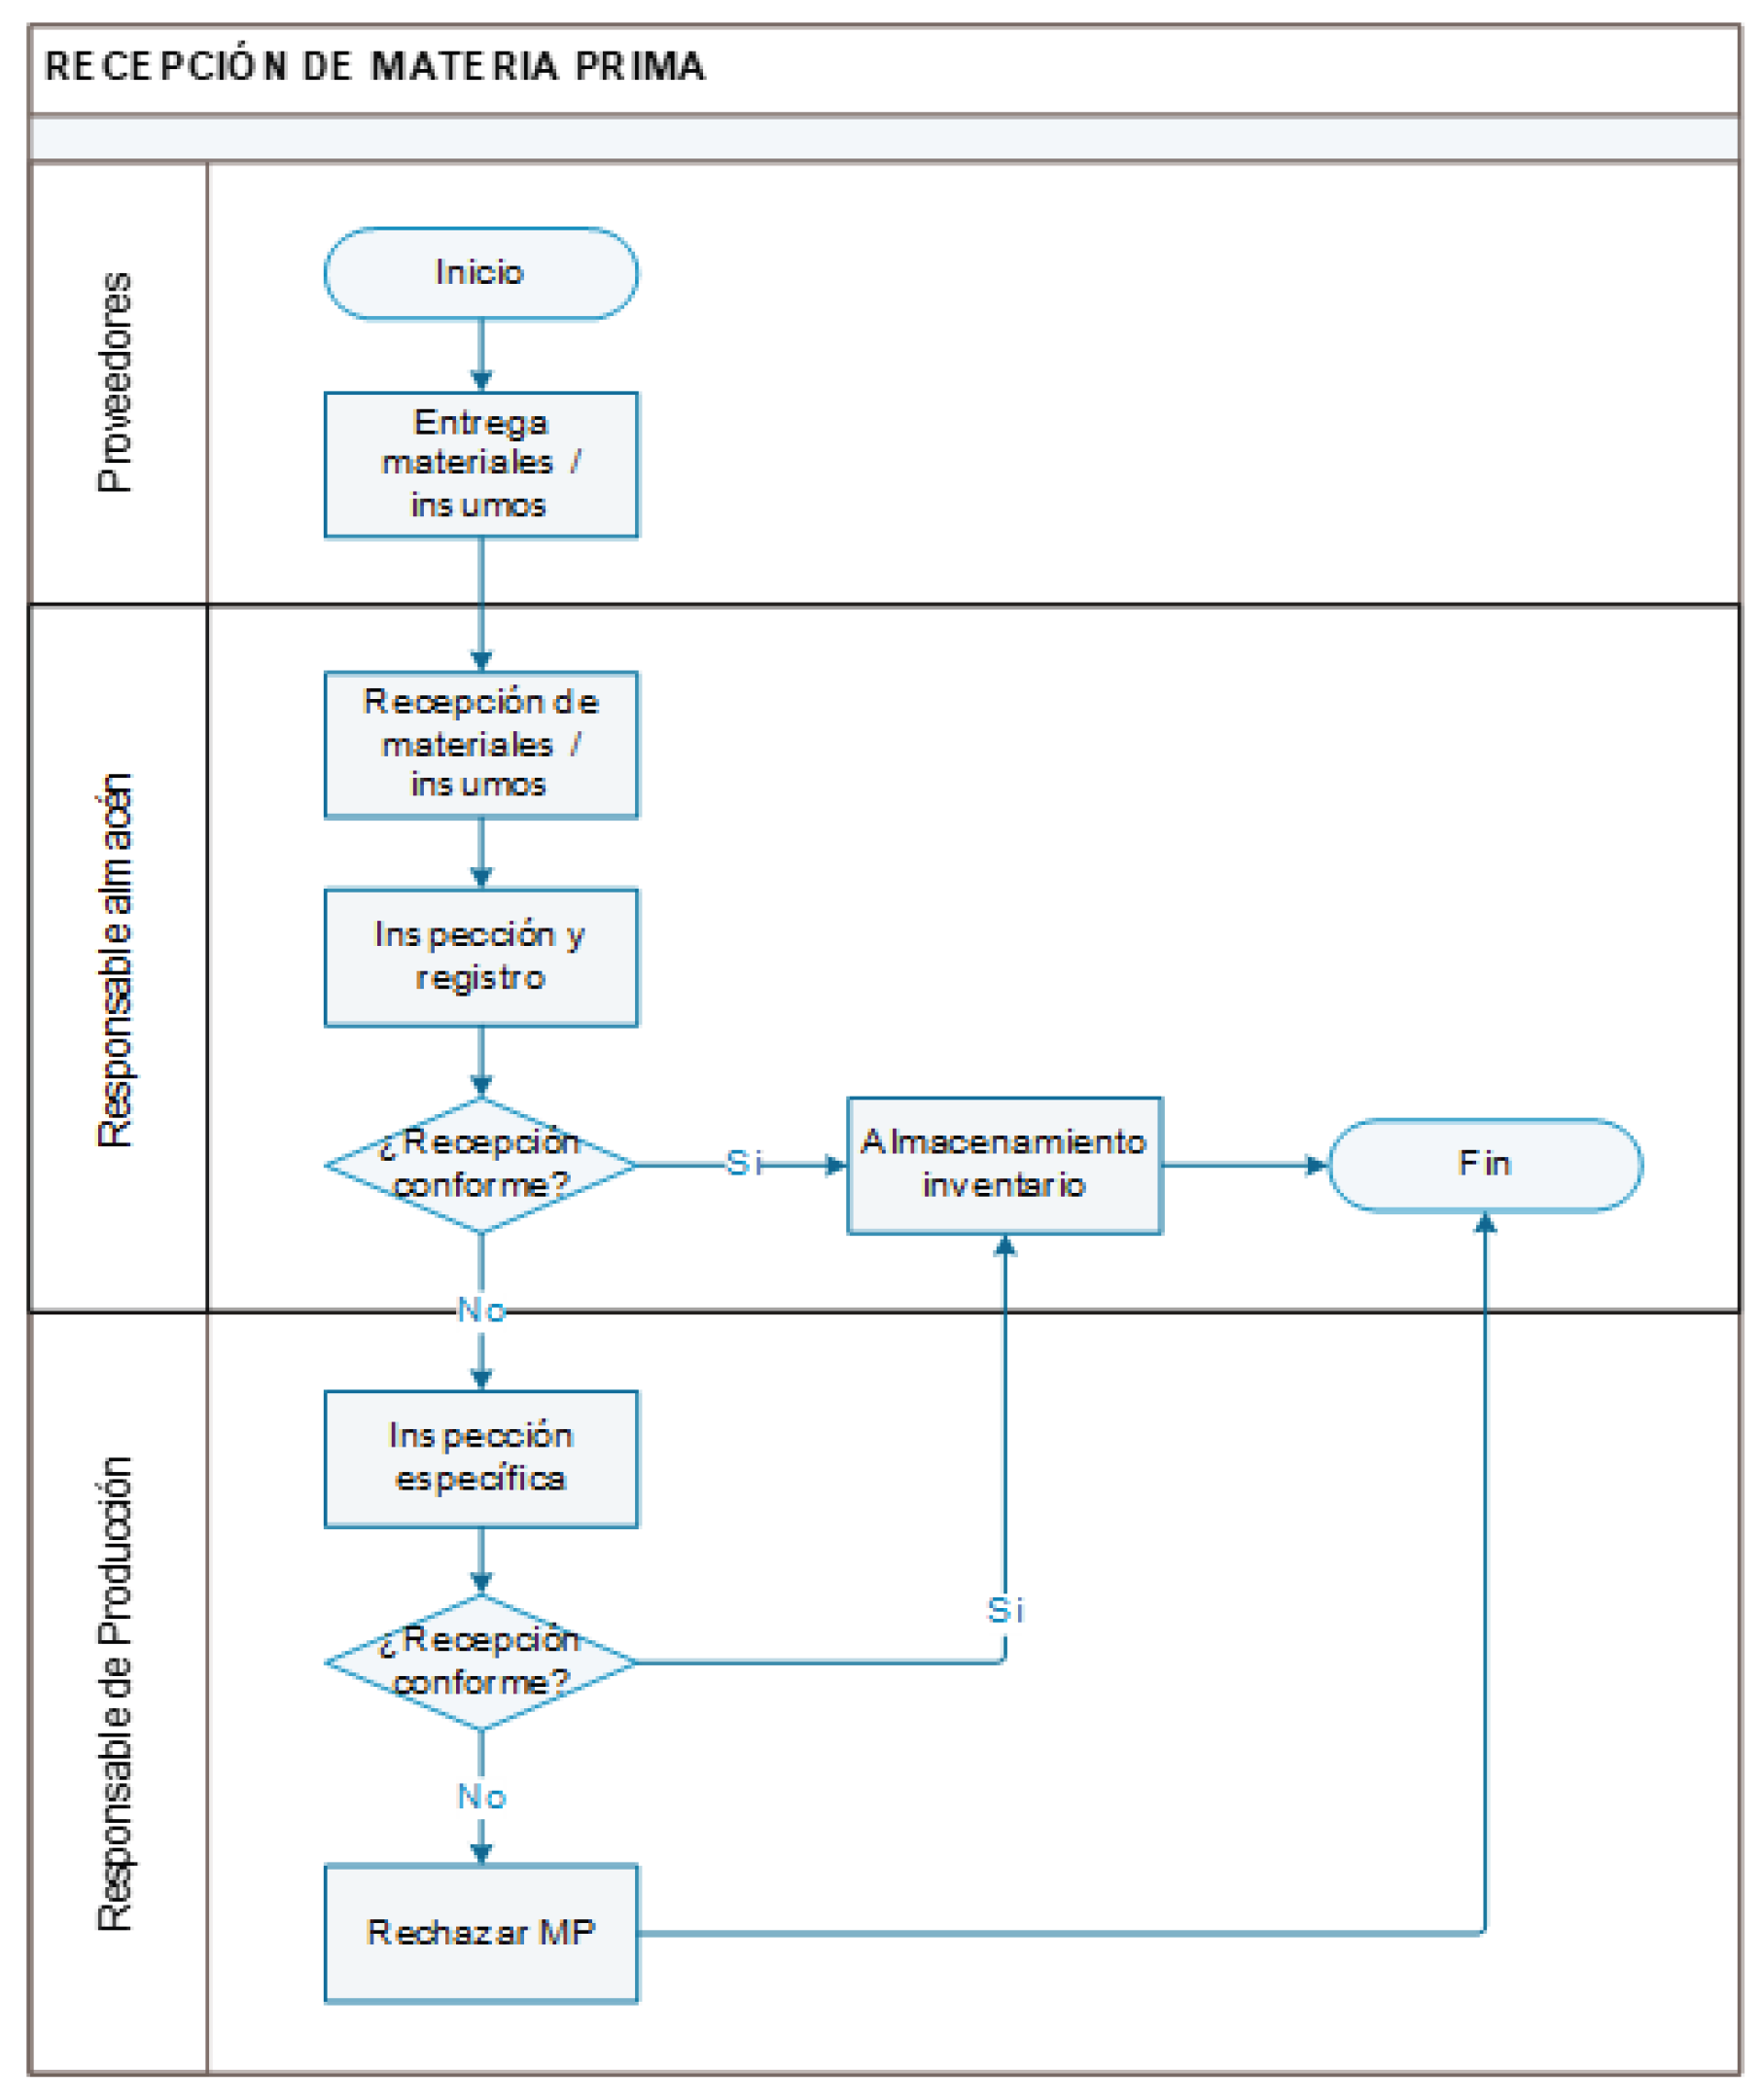
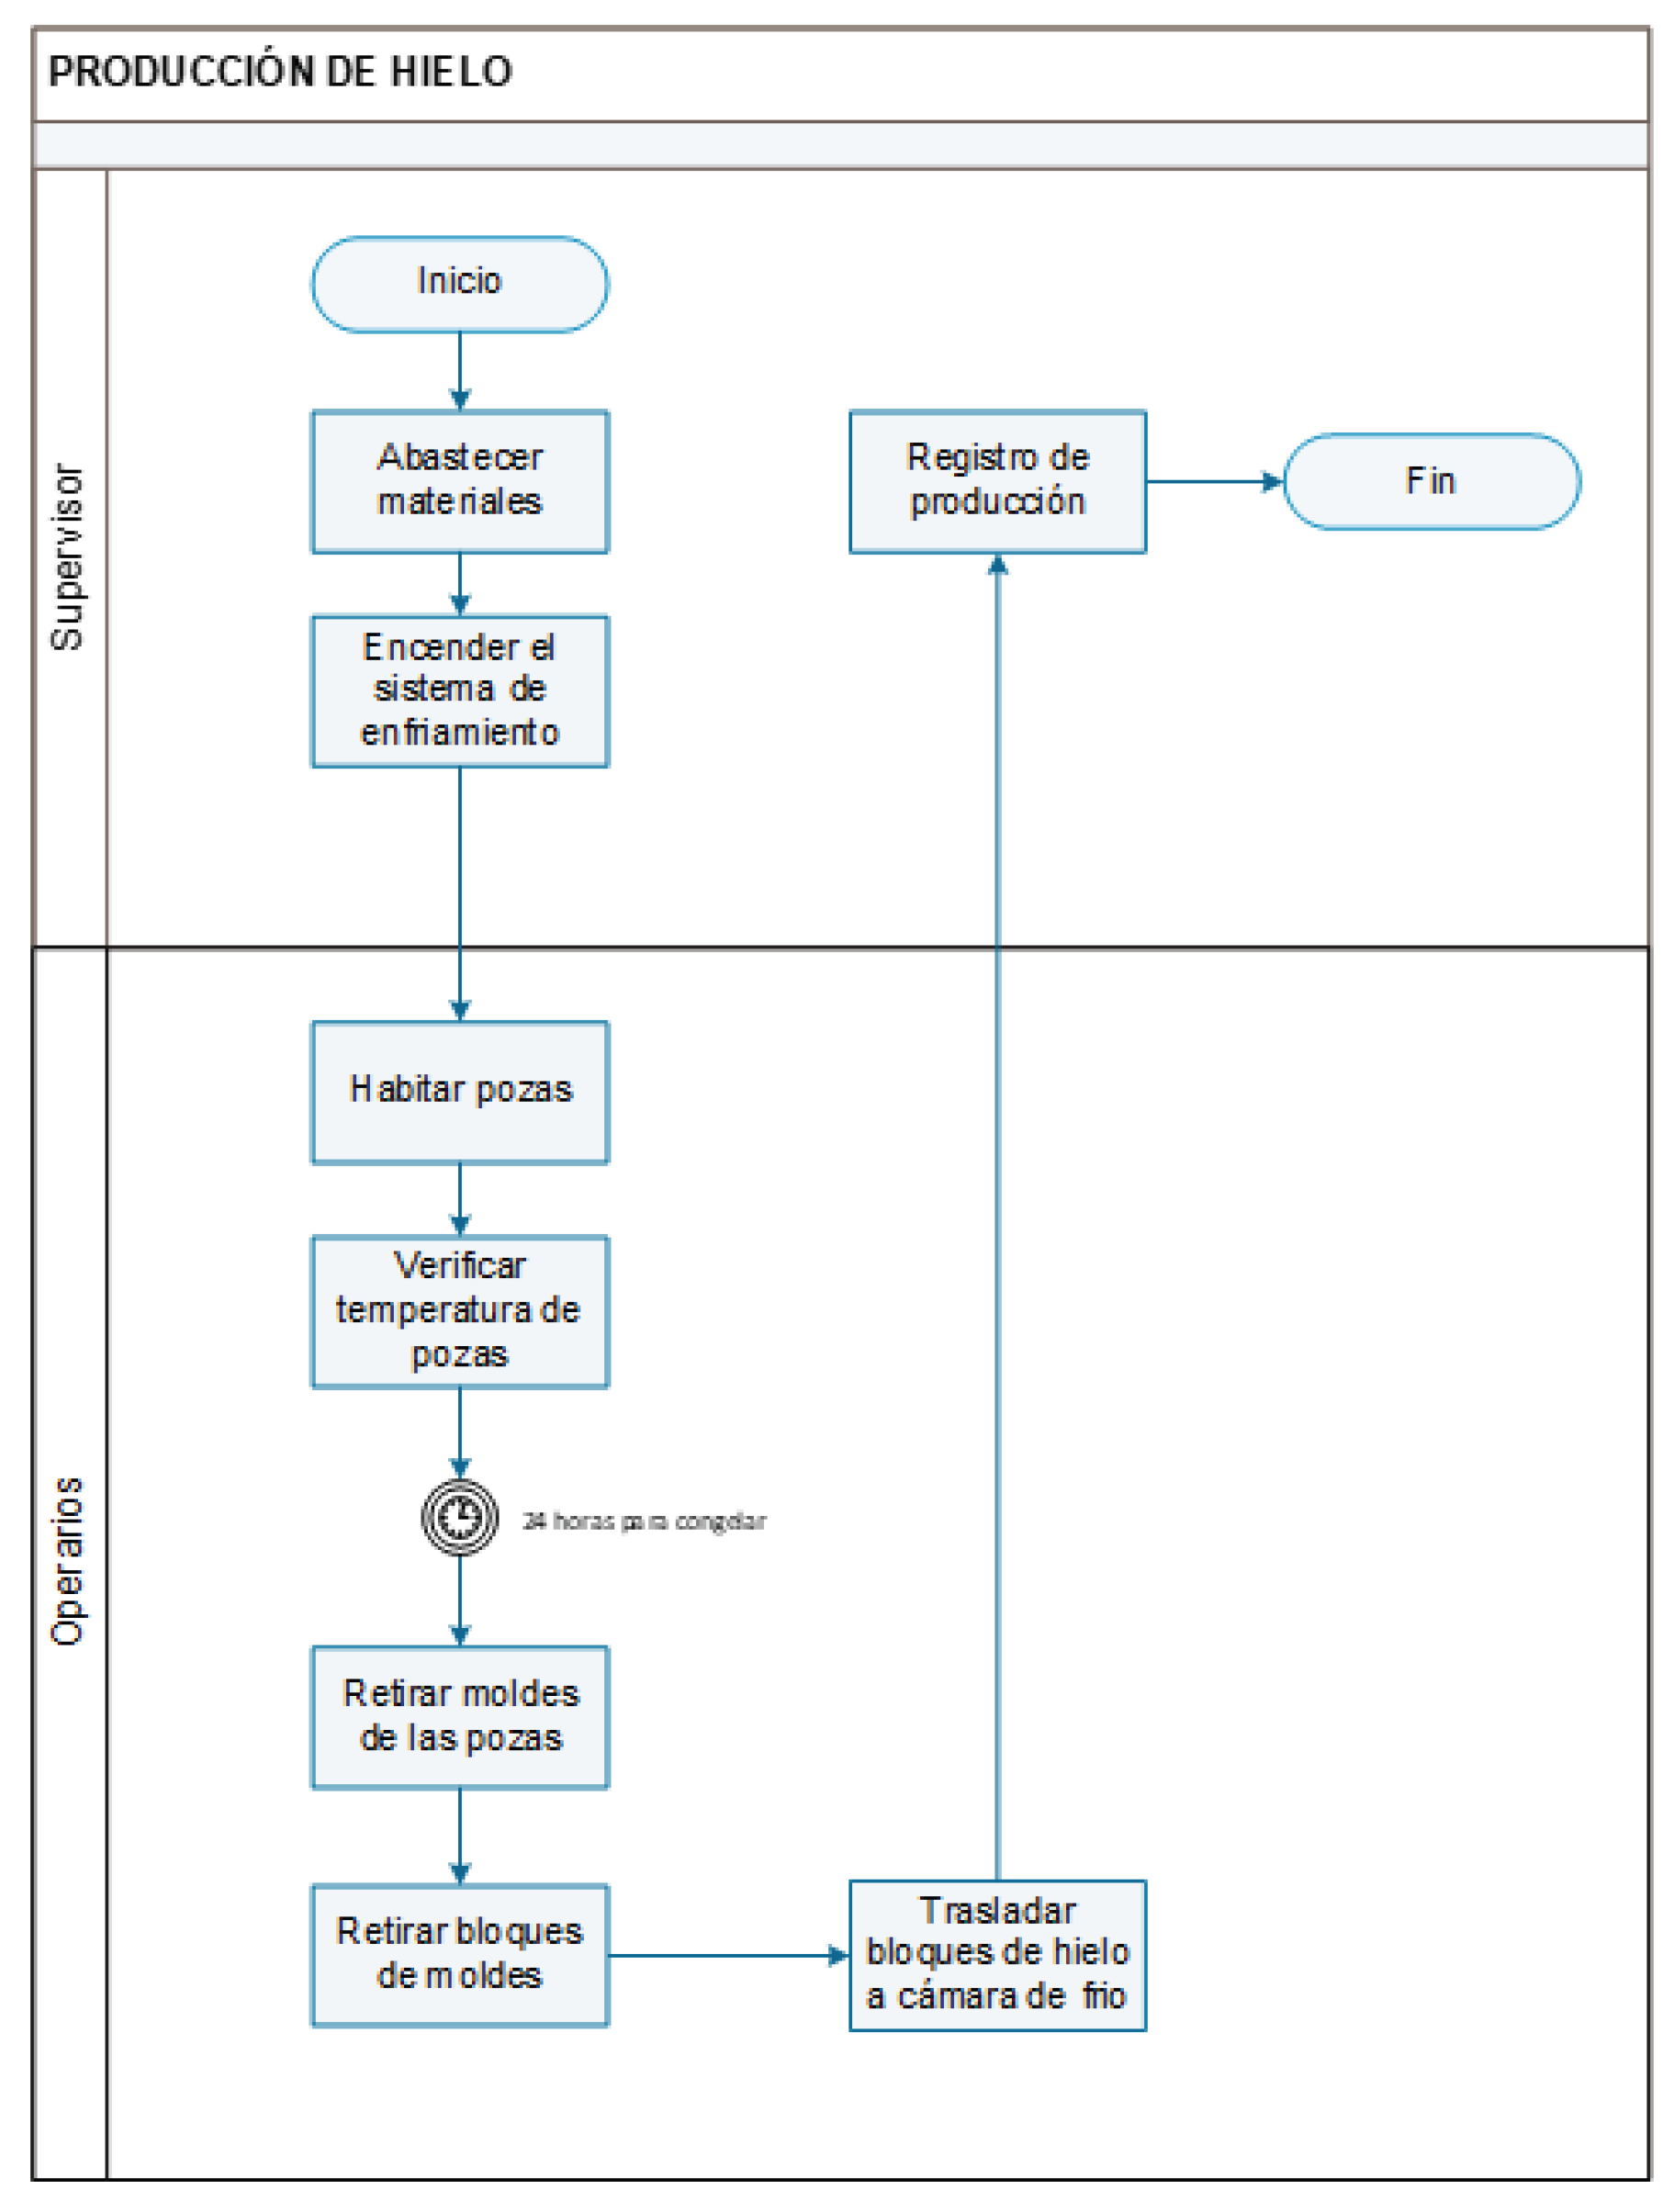
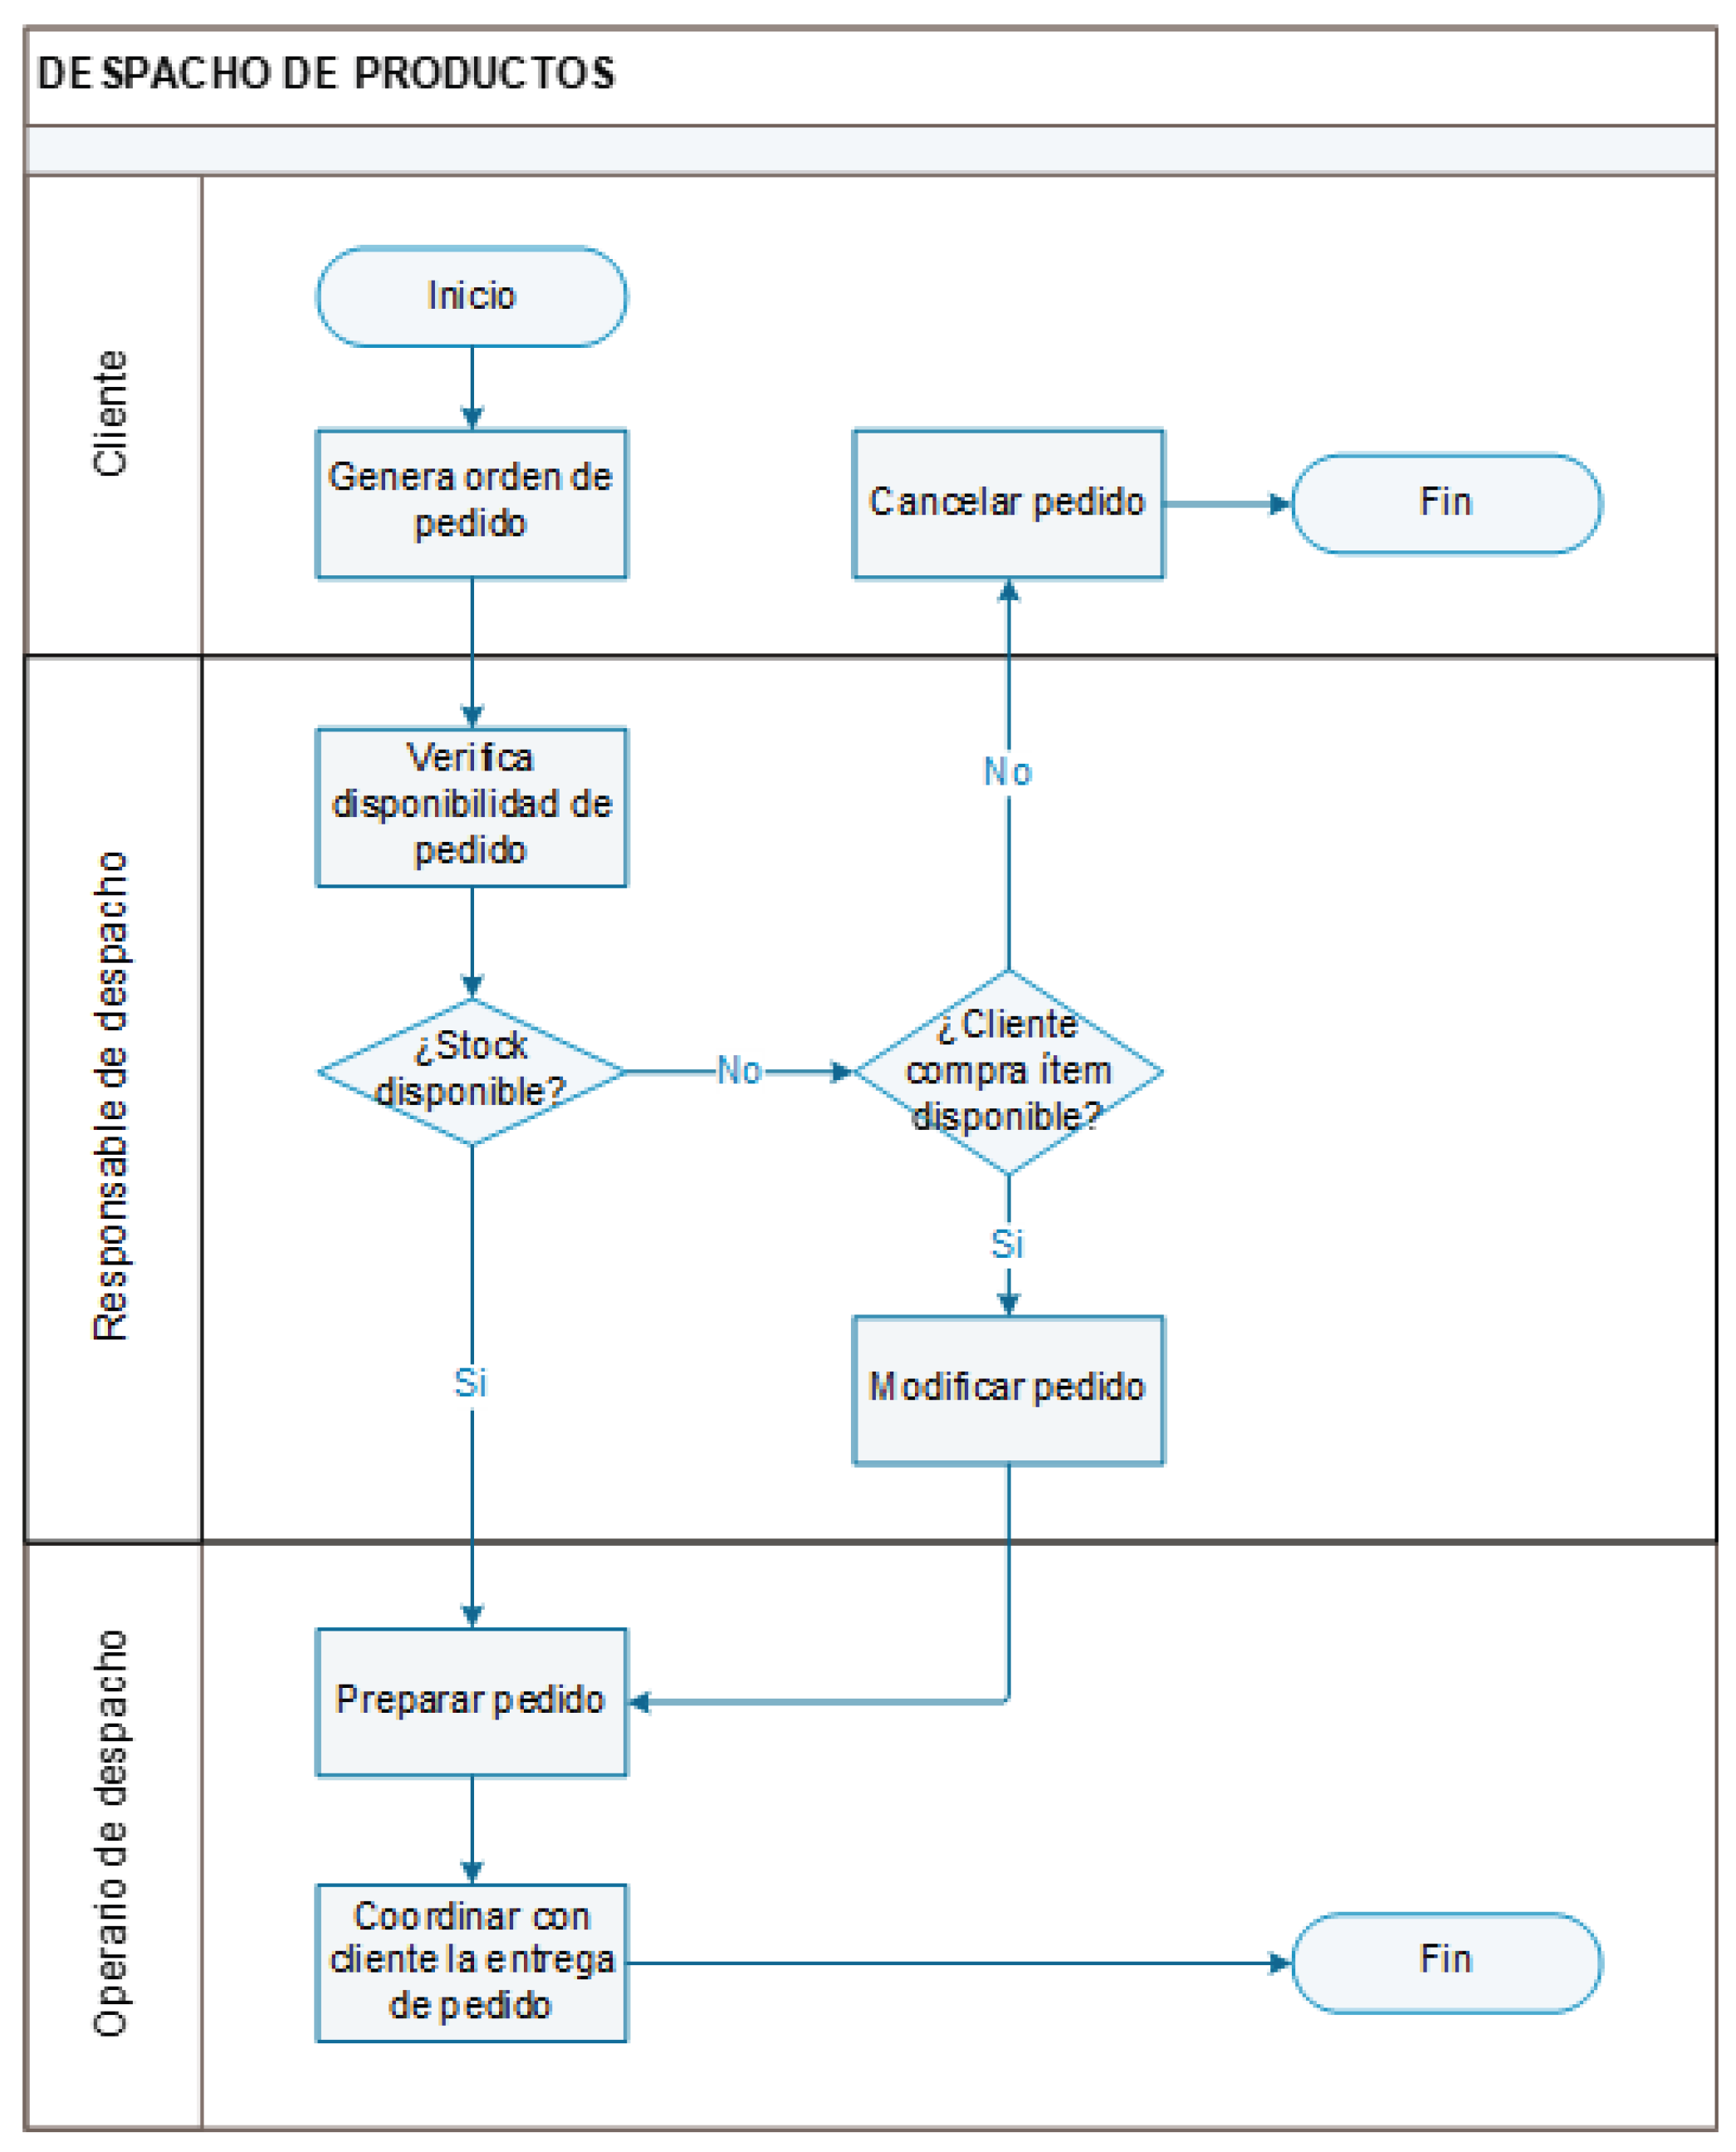
Figure 11.
Flowchart of the raw material reception process.
Figure 12.
Flowchart of the industrial ice production process.
Figure 13.
Flowchart of the product dispatch process.
To organize the tasks performed in the ice plant’s production process, the Kanban board was implemented as a visual management tool to organize and control operational activities. This tool aimed to improve coordination among operators, facilitating the assignment of responsibilities and the monitoring of daily tasks.
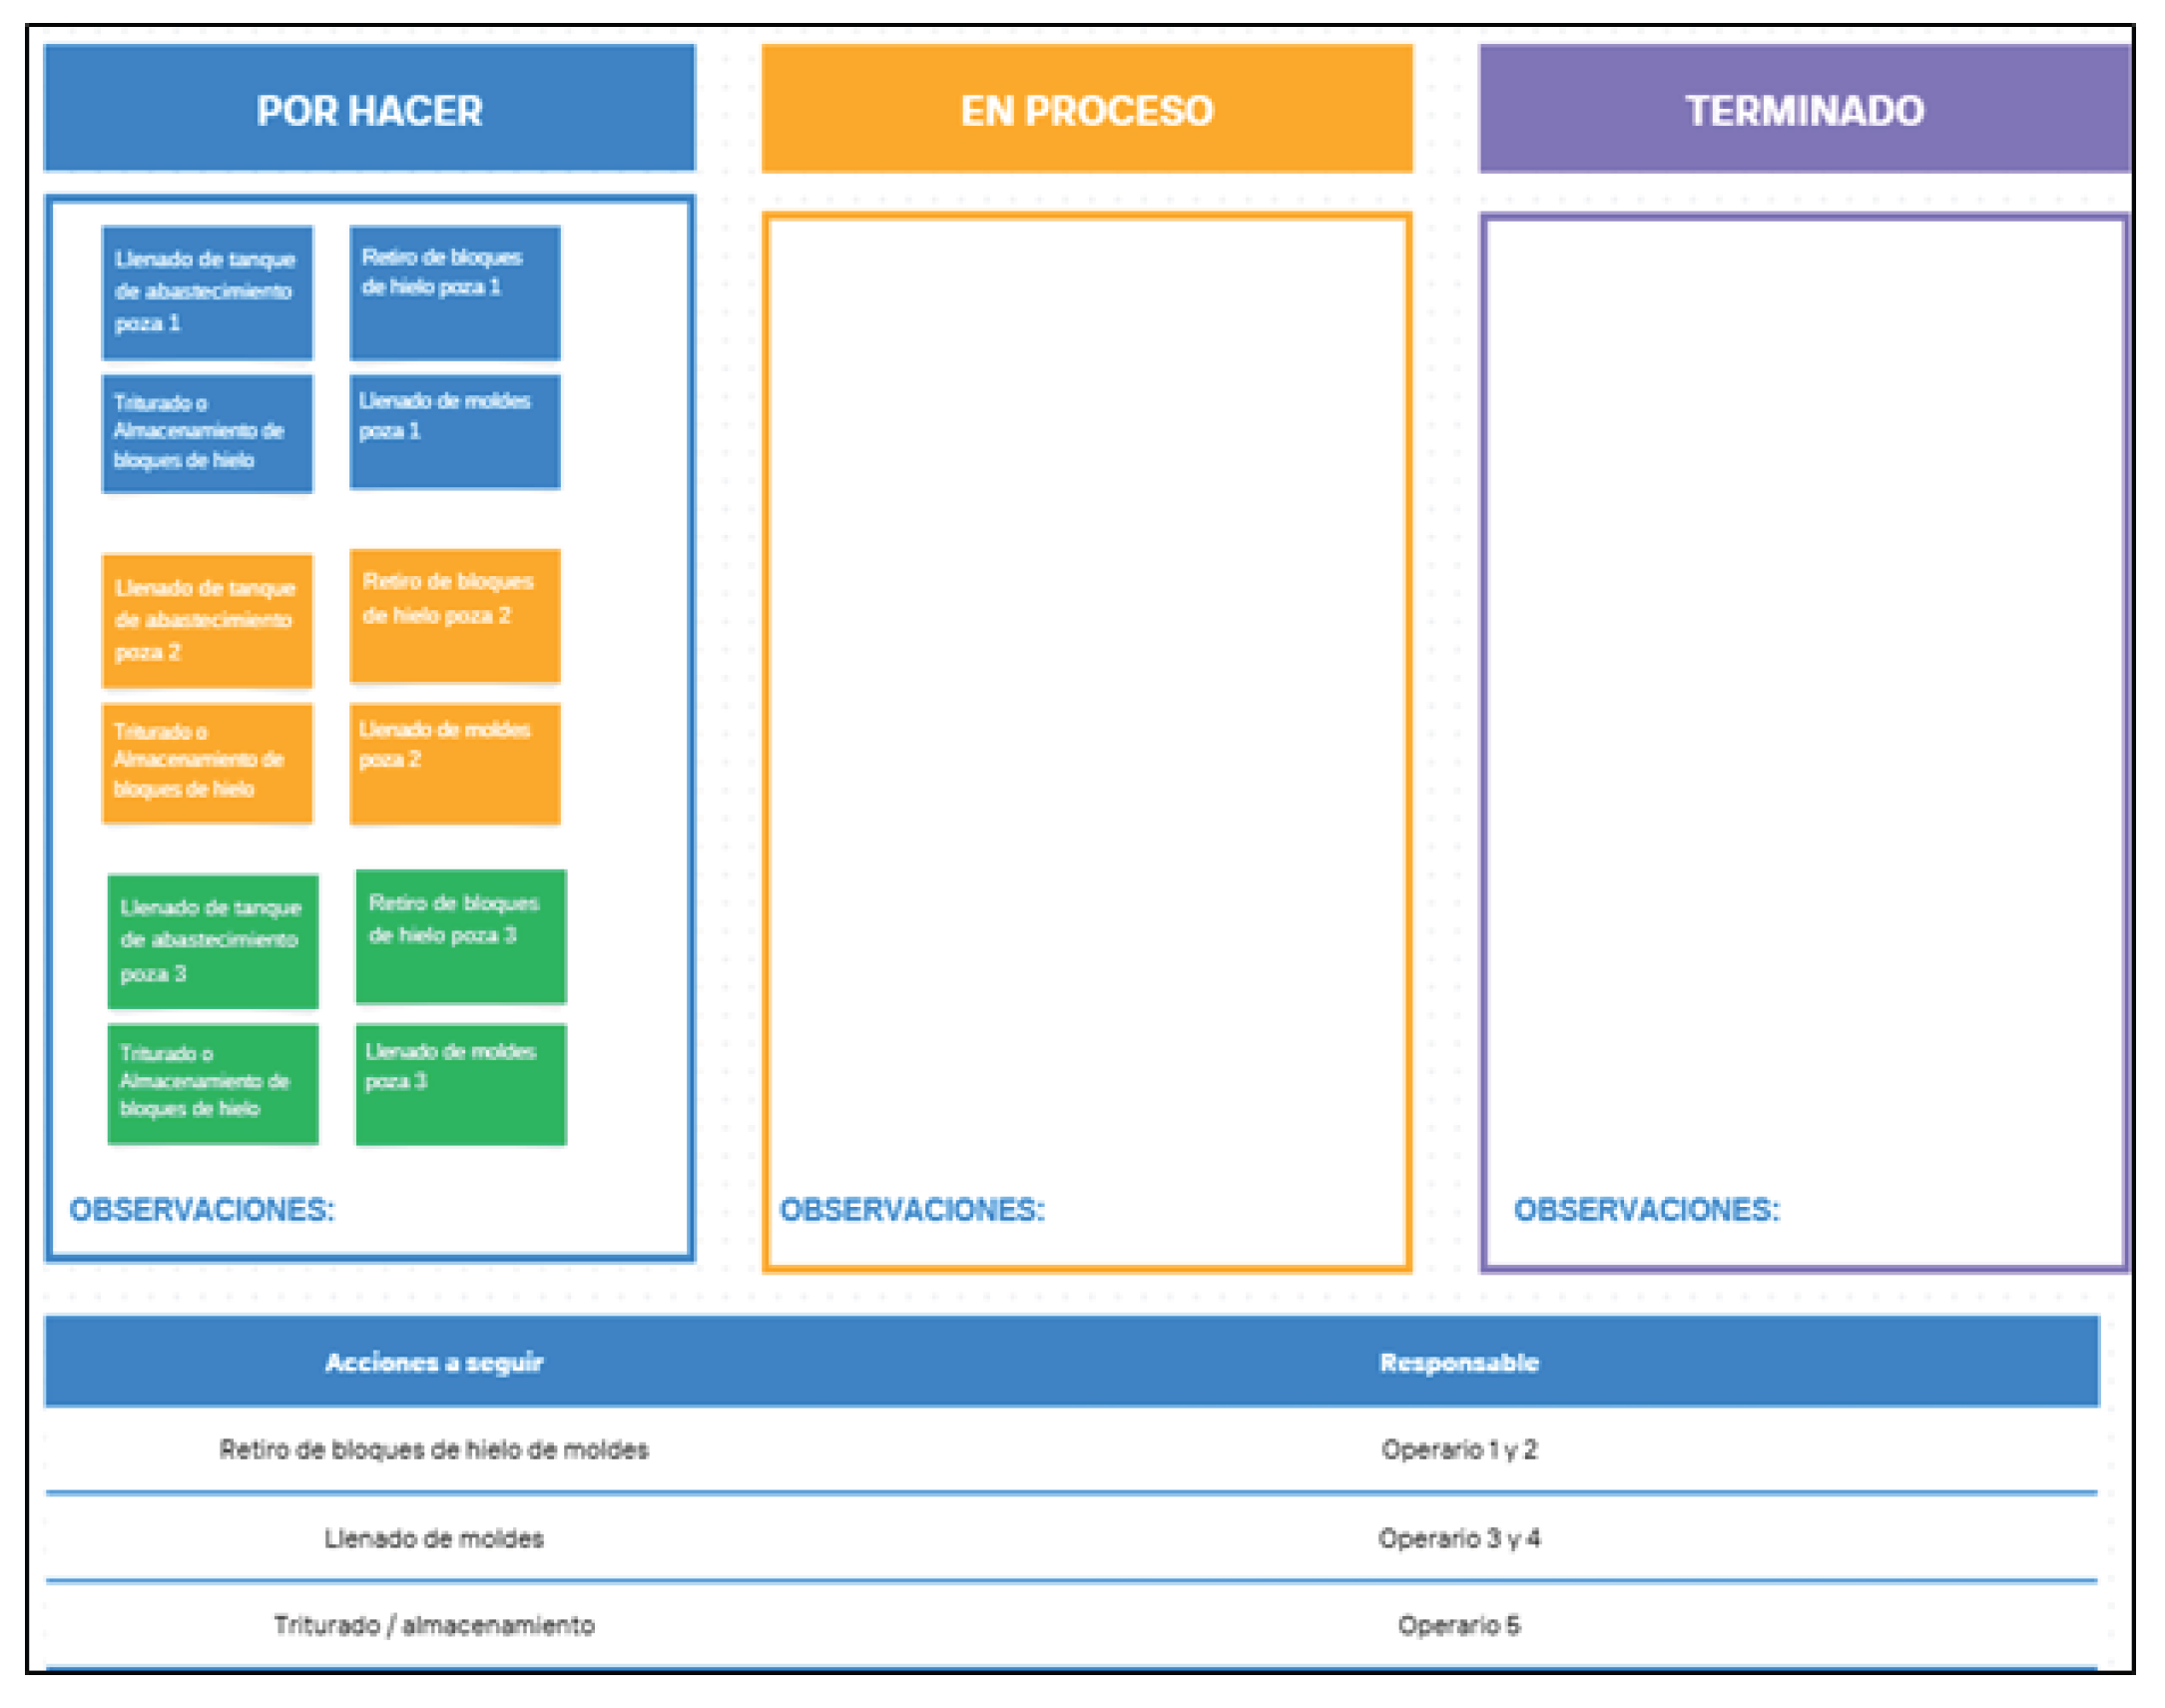
Figure 14.
Establishment of the Kanban board.
The implementation of the dashboard has also enabled more effective integration of management indicators such as task cycle time, adherence to activity schedules, availability and optimal utilization of human resources, and analysis of rescheduled or interrupted tasks. Monitoring these indicators alongside Kanban created a stronger, more reliable foundation for decision-making. This allowed the Production Manager to more precisely supervise tasks, allocate resources according to process needs, and ensure operational continuity. This implementation not only improved organization within the ice plant but also fostered communication and collaboration among operators.
Currently, the ice plant lacks a preventative maintenance program to ensure the proper functioning of the equipment, which is a vital part of the production process. Therefore, a failure analysis was conducted on the equipment comprising the three ice plant tanks.
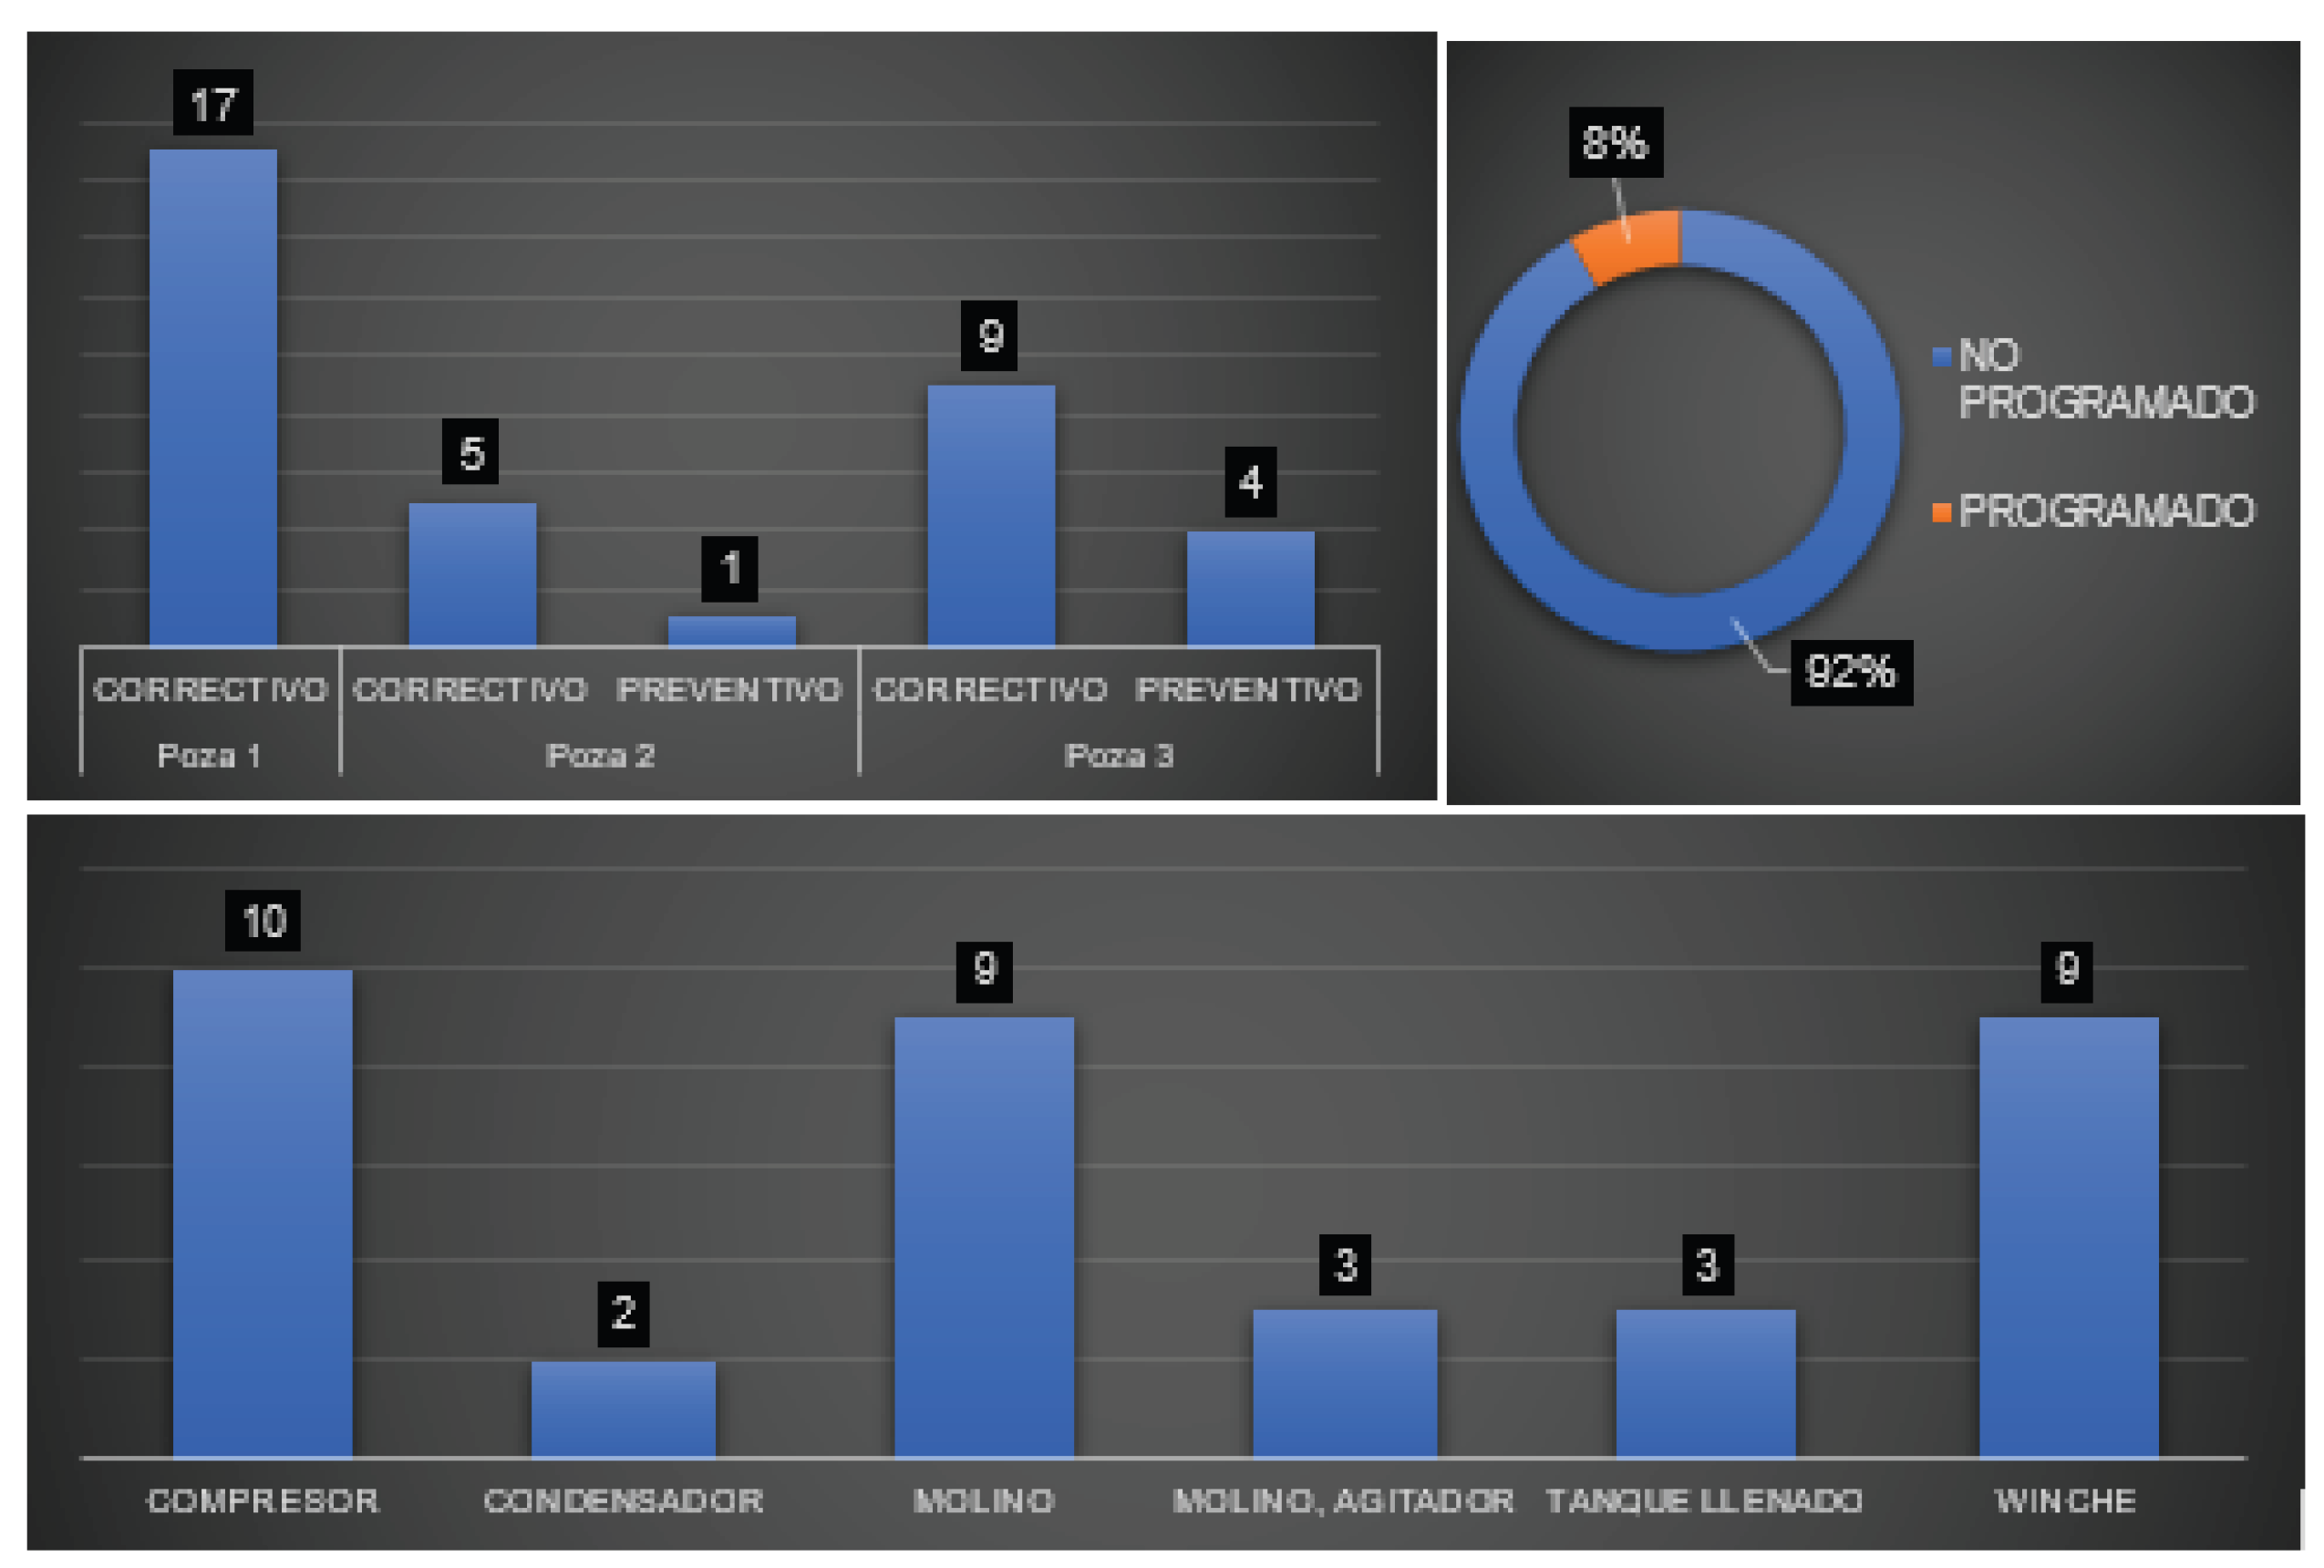
Figure 15.
Summary of maintenance performed on plant equipment.
During the evaluation period, a total of 36 maintenance activities were performed. Seventeen maintenance activities were carried out in pond 1, six in pond 2, and thirteen in pond 3. Of these, 92% were unscheduled, and only 8% were scheduled. The equipment with the highest failure rate was the compressor with 10 incidents, followed by the mill and the winch with nine incidents each. Therefore, it is necessary to establish a maintenance program to monitor and control planned activities in order to guarantee the proper functioning of the assets.
Next, the criticality of the ice plant’s assets was analyzed using the following matrix, which values the frequency of failures and the consequences they may cause in order to determine the level of criticality.
Table 4.
Criticality analysis of the ice plant equipment.
| Pool | Teams | Frequency of failures | Impact on operations | Operational flexibility | Maintenance cost | SST+MA | Consequence | Criticality |
|---|---|---|---|---|---|---|---|---|
| 1 | Compressor P1 | 3 | 10 | 4 | 4 | 4 | 48 | 144 |
| Receiving tank P1 | 1 | 1 | 1 | 1 | 0 | 2 | 2 | |
| Evaporator P1 | 1 | 10 | 4 | 2 | 6 | 48 | 48 | |
| Capacitor P1 | 1 | 10 | 4 | 2 | 6 | 48 | 48 | |
| P1 Lifting Winch | 1 | 4 | 2 | 2 | 0 | 10 | 10 | |
| Ice Mill P1 | 1 | 1 | 1 | 1 | 0 | 2 | 2 | |
| 2 | P2 Compressor | 3 | 10 | 4 | 4 | 4 | 48 | 144 |
| Receiving tank P2 | 1 | 1 | 1 | 1 | 0 | 2 | 2 | |
| Evaporator P2 | 1 | 10 | 4 | 2 | 6 | 48 | 48 | |
| Capacitor P2 | 1 | 7 | 4 | 2 | 6 | 36 | 36 | |
| P2 Lifting Winch | 1 | 4 | 2 | 2 | 0 | 10 | 10 | |
| Ice Mill P2 | 1 | 1 | 1 | 1 | 0 | 2 | 2 | |
| 3 | P3 Compressor | 3 | 10 | 4 | 4 | 6 | 50 | 150 |
| Receiving tank P3 | 1 | 1 | 1 | 1 | 0 | 2 | 2 | |
| Evaporator P3 | 1 | 7 | 4 | 2 | 6 | 36 | 36 | |
| Capacitor P3 | 1 | 10 | 4 | 2 | 6 | 48 | 48 | |
| P3 Lifting Winch | 1 | 4 | 2 | 2 | 0 | 10 | 10 | |
| Ice Mill P3 | 1 | 1 | 1 | 1 | 0 | 2 | 2 |
By analyzing the criticality of the equipment, it was possible to identify those pieces of equipment that, due to their importance within the process, must be kept available for operation. In tank 1, compressor P1 had a rating of 144, indicating a high level of criticality, followed by evaporator P1 and condenser P1, which reached a medium level of criticality with a rating of 48 points for both pieces of equipment. In tank 2, condenser P2 shows a rating of 144 points, followed by evaporator P2. In tank 3, the compressor is the piece of equipment with the highest rating at 150 points, indicating a critical level, followed by condenser P3 with 48 points, indicating a moderately critical level.
With the identification of the critical equipment in each of the pools, the failure analysis was carried out using FMEA for each of the 03 compressors identified as critical equipment for the block ice production process.
As shown in Table 5, the FMEA has made it possible to identify the most critical components that make up the compressor system, such as the head with a high risk index (504 points), followed by the piston with high risk (567 points) and the electrical panel with a high risk level of failure occurrence (567 points); followed by the oil pump (441 points) and the safety valve (168 points) with a medium risk level.
As shown in Table 6, the FMEA has made it possible to identify the most critical components that make up the compressor system 2, such as the crankcase with a high risk index (504 points), followed by the crankshaft with high risk (576 points); followed by the cylinder head (336 points), the piston (315 points), the oil pump (448 points) and the safety valve (486 points) with a medium risk level.
As shown in Table 7, the FMEA has made it possible to identify the most critical components that make up the compressor system 3, such as the head with a high risk index (504 points), followed by the oil pump with high risk (504 points); and the components with a medium level of criticality are the piston (160 points), the crankcase (126 points), the crankshaft (192 points) and the electrical panel (180 points).
The maintenance program in Table 8 has been structured according to the components of each of the compressors that work in the ice plant, considering the preventive activities to be carried out, as well as the frequency and responsibility in each activity, also including the necessary resources, the method of execution and the acceptance criteria for the execution of each preventive maintenance.
Following the implementation of improvements in maintenance management, the following indicators were established, allowing for the analysis of the performance of the equipment that makes up the plant.
Table 9.
Analysis of maintenance indicators.
| Type of indicator | Indicator | Pretest | Posttest |
|---|---|---|---|
| Equipment failures | Total number of failures | 36 | 26 |
| Distribution by Maintenance Type | Preventive (%) | 13.89 | 84.62 |
| Corrective (%) | 86.11 | 15.38 | |
| Maintenance scheduling | Scheduled (%) | 8.33 | 84.62 |
| Not scheduled (%) | 91.67 | 15.38 | |
| Cost of maintenance | Total cost (S/) | 29591.87 | 2469.16 |
| Average cost (S/) | 822.00 | 94.97 |
Likewise, in order to reinforce the knowledge of the staff, a training schedule was established with topics aimed at understanding the dashboard, the indicators and the production process.
Table 10.
Training Program.
| Issue | Addressed | Duration | August | |||
|---|---|---|---|---|---|---|
| s1 | s2 | s3 | s4 | |||
| Management indicators | Administrative staff | 1 hour | X | |||
| Productivity control and monitoring | Administrative staff | 1 hour | X | |||
| Operating procedures | Operational staff | 1 hour | X | |||
| Preventive maintenance | Technical staff | 1 hour | X | |||
| Order and Cleanliness | Operational staff | 1 hour | X | |||
| Concepts of occupational risks | Operational staff | 1 hour | X | |||
| Use of power machines | Operational staff | 1 hour | X | |||
The post-test DAP (Data Analysis Process) was developed considering the application of the improvements, where a reduction in process time can be observed, decreasing from 87,004 seconds to 86,840 seconds, a reduction of 164 seconds. Among the activities that saw improved times are: filling the dispenser tank, for which a responsible operator was assigned to ensure the correct execution of the task, reducing the time by 4 seconds (from 84 to 80 seconds); also, in filling the molds with water, the time reduction is due to assigning responsibility to an operator according to a schedule for controlling the filling, which allowed a reduction of 6 seconds (from 68 to 61 seconds); in transporting the molds for demolding, responsibility is assigned to two operators for carrying out the task, reducing the time by 2 seconds (from 45 to 43 seconds). Regarding the detachment of the blocks, this activity transitioned from a waiting activity to an operational one, as the staff performs the detachment of the blocks in the post-test using a metal fork tool that allows them to remove the block from the molds, with a reduction of 70 seconds (from 190 to 120 seconds), thus eliminating the waiting activity for detachment; finally, in the transport of the ice blocks to the crushing machine, the time has been reduced by 2 seconds (from 99 to 97 seconds). This reduction is supported by the organization of tasks through the adoption of Kanban, where specific tasks were assigned to the operational staff, with one being responsible for the transport to the crushing machine for delivery to the client or to storage in the cold room.
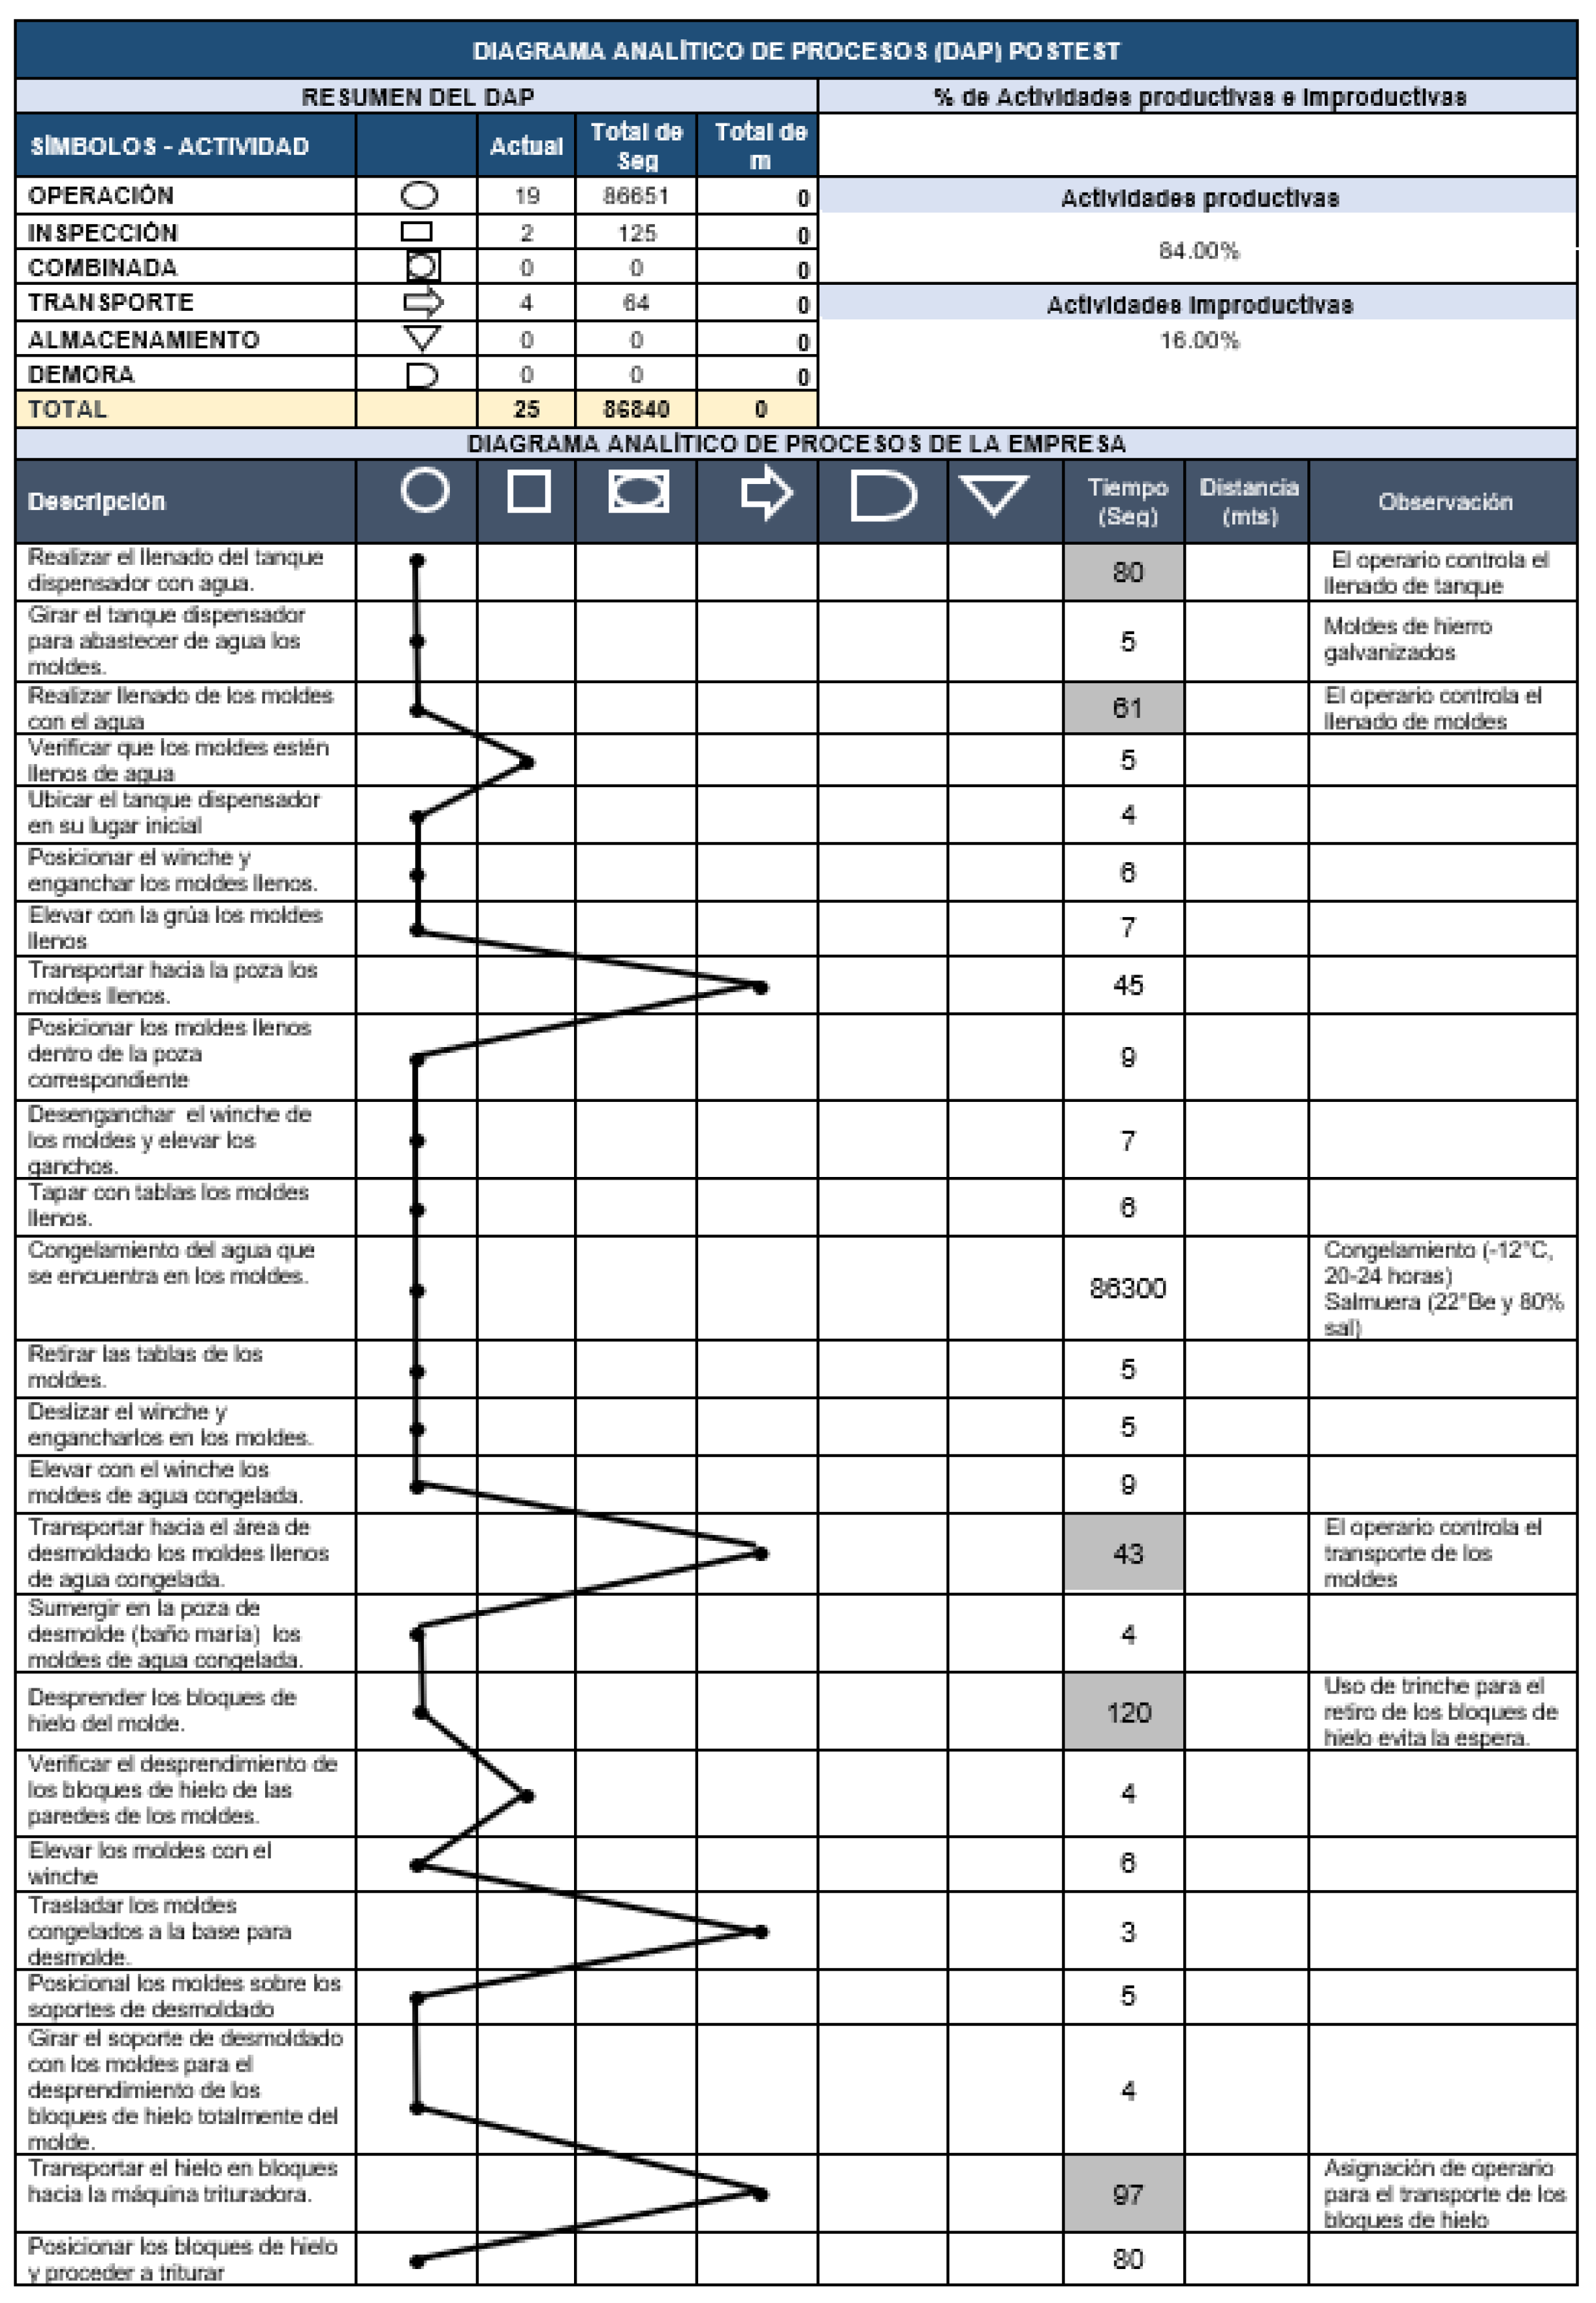
Figure 16.
Process analysis diagram.
3.4. Productivity Analysis After the Implemented Improvement
During the six-week post-test period between September and October 2025, raw material productivity averaged 0.94 tons of ice per cubic meter of raw material used. Production in September ranged from 924 to 1028 tons of ice, while in October it increased to 978 tons. This reflects a positive trend in raw material productivity in line with the increase in production. This improvement is attributed to a reduction in process errors and waste, as well as improved operational efficiency of the ice pits thanks to preventive maintenance.
Table 11.
Post-test determination of raw material productivity.
| Week | Month | Production (t) | Quantity of raw material used ( m3 ) | Productivity Raw Material (t/m 3 ) |
|---|---|---|---|---|
| 1 | September | 1028.00 | 1075.00 | 0.96 |
| 2 | September | 928.00 | 971.00 | 0.96 |
| 3 | September | 924.00 | 966.00 | 0.96 |
| 4 | September | 978.00 | 1023.00 | 0.96 |
| 1 | October | 978.00 | 1075.00 | 0.91 |
| 2 | October | 971.00 | 1075.00 | 0.90 |
| Average | 0.94 | |||
Table 12.
Post-test determination of labor productivity.
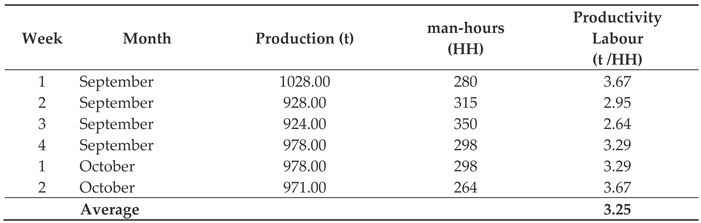 |
During the six-week post-test period between September and October 2025, labor productivity averaged 3.25 tons per man-hour worked at the plant, attributed to greater optimization of human resources. Man-hours fluctuated between 264 and 350, with a reduction observed in October.
Table 13.
Pre -test determination of total post-test productivity.
| Week | Month | Value of production (S/) | Energy cost (S/) | Cost of material (S/) | Labor cost (S/) | Other costs (S/) | Total Productivity (S/) |
|---|---|---|---|---|---|---|---|
| 1 | September | 107,940.00 | 24,257.30 | 2,266.68 | 4,022.50 | 1,667.81 | 3.35 |
| 2 | September | 97,440.00 | 24,257.30 | 2,266.68 | 4,022.50 | 1,667.81 | 3.02 |
| 3 | September | 101,640.00 | 24,257.30 | 2,266.68 | 4,022.50 | 1,667.81 | 3.16 |
| 4 | September | 102,690.00 | 24,257.30 | 2,266.68 | 4,022.50 | 1,667.81 | 3.19 |
| 1 | October | 102,690.00 | 24,849.28 | 2,051.95 | 3,871.75 | 2,530.71 | 3.08 |
| 2 | October | 111,665.00 | 24,849.28 | 2,051.95 | 3,871.75 | 2,530.71 | 3.35 |
| Average | 3.19 | ||||||
The post-test of total productivity over the eight weeks evaluated showed that for every sol invested by the plant, S/ 3.19 in production was generated, representing a significant improvement compared to the pre-test. An increase was evident after the implementation of the improvement. A consistent trend was observed, fluctuating between S/ 3.02 and S/ 3.35 for every sol invested by the organization.
The implementation of management indicators has made it possible to show information on the main processes, whose pre-test and post-test data allowed the organization to control and monitor management. Table 18 shows the implemented indicators and their results in the evaluated period.
Table 14.
Summary of the results of the management indicators.
| Guy | Indicator | Pretest | Posttest | Variation |
|---|---|---|---|---|
| Financial | Total sales (S/) | 399840.00 | 624065.00 | ▲ 56.08% |
| Gross profit (S/) | 206402.50 | 428600.45 | ▲ 107.65% | |
| Production (t) | 3808.00 | 5807.00 | ▲ 52.49% | |
| Production costs (S/) | 193437.50 | 195464.55 | ▲ 1.05% | |
| Customer | % satisfaction | 0.87 | 0.98 | ▲ 12.21% |
| Number of complaints received | 38.00 | 5.00 | ▼ -86.84% | |
| Processes | Capacity utilization (%) | 60.44 | 92.17 | ▲ 52.50% |
| Productive activities (%) | 80.00 | 84.00 | ▲ 5.00% | |
| Unproductive activities (%) | 20.00 | 16.00 | ▼ -20.00% | |
| Raw Material Productivity (t/m3) | 0.87 | 0.94 | ▲ 7.66% | |
| Total productivity (Soles/ for each sol invested) | 2.08 | 3.19 | ▲ 53.37% | |
| Learning and growth | Training completion (%) | -- | 100.00 | -- |
| Labor Productivity (production/HH) | 1.41 | 3.25 | ▲ 130.50% | |
| Equipment maintenance | Total number of equipment failures | 36.00 | 26.00 | ▼ |
| Preventive maintenance (%) | 13.89 | 84.62 | ▲ | |
| Corrective Maintenance (%) | 86.11 | 15.38 | ▼ | |
| Scheduled maintenance (%) | 8.33 | 84.62 | ▲ | |
| Unscheduled Maintenance (%) | 91.67 | 15.38 | ▼ | |
| Total maintenance cost (S/) | 29591.87 | 2469.16 | ▼ | |
| Average maintenance cost (S/) | 822.00 | 94.97 | ▼ | |
| Implementation | % standardized processes | -- | 100.00 | -- |
| % completion of implementation activities | -- | 100.00 | -- |
Overall, the results show that the implementation of management indicators has significantly contributed to the plant’s productivity, optimizing the use of resources, improving the quality of care, and strengthening operational efficiency.
3.5. Determine how key management indicators increase productivity
Development of the normality test for hypothesis testing . For this test, Shappiro-Wilk was selected because the resulting data amount was 6 weeks, considering an error index of 0.05 to assume normal distributions.
Table 15.
Comparison of total productivities.
| Period | Total pre-test productivity (S/) |
Total productivity Post-test (S/) |
|---|---|---|
| 1 | 1.89 | 3.35 |
| 2 | 1.43 | 3.02 |
| 3 | 1.38 | 3.16 |
| 4 | 2.27 | 3.19 |
| 5 | 2.76 | 3.08 |
| 6 | 2.76 | 3.35 |
Table 16.
Normality test.
| Shapiro-Wilk | |||
|---|---|---|---|
| Statistical | gl | Next. | |
| Total Productivity _PRETEST | ,877 | 6 | ,256 |
| Total Productivity _POSTEST | ,907 | 6 | ,419 |
The resulting normality value was 0.256 in pre-test and 0.419 in post-test, both indices exceed the error value , so it can be confirmed that there is a normal distribution among the data, because the selected hypothesis test was Student’s T.
According to the results shown in Table 17, the significance index was 0.006, which is less than the established value of 0.05. Therefore, there is sufficient evidence to reject the null hypothesis and accept the alternative hypothesis, which is: the application of key management indicators increases the productivity of an ice plant.
4. Discussion
Regarding the first specific objective, diagnosing the initial situation of the ice plant, observation techniques and analysis of historical documents were used to identify the root causes of the problem, as well as to calculate the satisfaction level and the level of utilization of productive capacity. The results determined the need for a mechanism to measure the performance of the ice plant and to take action to improve its processes. The problem analysis identified 11 causes of the low productivity levels. Furthermore, the analytical process diagram identified 25 activities that comprise the industrial ice production process, resulting in a process time of 24.17 hours for the manufacture of 1 ton of ice. The initial satisfaction level reached 87.26%, with a total of 38 complaints during the pre-test period. The utilization capacity achieved reached 60.44% of the total production established by the organization. The data are consistent with the findings of [13], who, through a diagnosis of production problems, determined a low compliance rate with the maintenance program, reaching only 61.15%. Failures were analyzed to determine a new program tailored to the equipment’s needs. Similarly, the data coincide with the findings of [14], who, through a diagnostic process to establish better KPIs for the process, obtained a customer satisfaction index of 81.40%, providing relevant information for implementing organizational improvements.
Regarding the second specific objective, the current state of productivity at the ice plant was determined by calculating labor and raw material productivity. This was based on production theory [15], which focuses on the productive factors of organizations and their efficient combination for the generation of goods and services, seeking optimization in production and maximizing profits. The results showed that the organization achieved an initial raw material productivity of 0.873 tons produced per cubic meter of raw material, while initial labor productivity reached 1.41 tons per man-hour worked, and total productivity averaged S/ 2.08 for every sol invested in production. These results coincide with those found by [16], who achieved an initial raw material productivity of 58% and a labor productivity of 69%, figures considered below the organization’s expectations. The data also coincide with what was studied by [17] who identified an initial productivity of the raw material of 31% due to the generation of waste in the processes.
For the third specific objective, improvements were designed and implemented at the ice plant, based on the establishment of indicators for organizational management. This was theoretically supported by [18] and systems theory, which emphasizes the importance of identifying systems to understand their complexity through the measurement of processes that must be conceived in an integrated manner within the organization, adapting to its environment. As a result of the improvement implementation, activities were established for implementing quality tools, such as creating a dashboard tailored to the organization’s context. The financial perspective consisted of sales and gross profit indicators; the customer perspective was based on the satisfaction index; the process perspective was comprised of indicators for capacity utilization, raw material productivity, and maintenance compliance; and finally, the learning and growth perspective was comprised of training completion and labor productivity. Similarly, standardization was developed through process documentation, implementing procedures for receiving raw materials, ice production, and dispatching finished products. In addition, the ice plant’s organizational chart was updated. Regarding compliance with the equipment maintenance program, it was identified that the organization performs unscheduled maintenance 92% of the time. The equipment with the highest failure rate was the compressor (28%), followed by the winch and mill (25%). Criticality analysis determined that the three compressors have high criticality compared to the other components. A maintenance program was also developed for the eight components that make up the compressors. Finally, a training program was implemented for administrative and operational personnel, covering topics related to management indicators, productivity, operational guidelines, and production procedures. Based on the above, we can conclude that the applied methods address the root causes of the problem and help improve productivity levels. These results align with the findings of [19], who, in their diagnostic assessment, identified the need for implementing indicators, defining 29 KPIs for their processes and monitoring productivity, staff efficiency, and machine performance. Similarly, the results are similar to those of [16], who identified problems in process control and monitoring, such as lack of supervision, equipment failures, and service delays, highlighting the need to develop a dashboard for productivity and maintenance execution.
For the fourth specific objective, productivity was analyzed after the implemented improvements at the ice plant. Raw material and labor productivity were determined after the improvements were applied. This analysis was supported by [20], who presents Edwin Locke’s goal-setting theory, which focuses on establishing specific and defined goals to improve motivation, efficiency, and productivity, emphasizing the importance of understanding and continuous monitoring. The results showed a post-test raw material productivity index of 0.94 tons of ice produced per cubic meter of raw material; labor productivity reached an index of 3.25 tons per man-hour; and overall productivity showed that for every sol invested, S/ 3.19 soles in production was generated. These results align with the findings of [21], who, through the development of indicators in their management system, achieved a 33.4% increase in staff productivity by establishing a KPI dashboard, standardizing their documentation, and implementing controls for their ISO system. The data also agree with the findings of [22], who, by monitoring their operations through a dashboard, achieved an 87.5% increase in productivity, demonstrating an improvement for the organization.
Finally, the overall objective was to determine how key management indicators increase the productivity of an ice plant. This was supported by [23], who states that Theory Z is based on employee stability and trust in leaders to achieve business objectives such as productivity. In this theory, the value of employees becomes a pillar for the organization, and a corporate culture is developed. The results obtained through the normality test determined that the data had a normal distribution. The Student’s t-test was applied, and the resulting significance level (0.006 < 0.050) was lower than the established threshold, thus accepting the alternative hypothesis that the application of key management indicators increases the productivity of an ice plant. Regarding the increase in raw material productivity, it reached 7.66%, while labor productivity increased by 130%, and finally, total productivity increased by 53.19%. The results are consistent with those found by [19], who established 29 production indicators and, through various improvement strategies, achieved a 10% increase in productivity in operational areas. The results also align with those found by [24], who established indicators using a dashboard, lean service, and Kanban to achieve a 12.88% increase in raw material productivity.
5. Conclusions
Management indicators were established at the ice plant with the aim of increasing productivity. The improvement was evaluated inferentially using the Student’s t-test, where the significance reached a level of 0.006, which is less than 0.05, thus confirming the alternative hypothesis: the application of key management indicators increases the productivity of an ice plant—Chimbote, 2025; likewise, there was a 7.66% increase in raw material productivity, a 130.50% increase in labor productivity, and finally, total productivity increased by 53.37%.
A diagnostic assessment of the current state of the ice plant was conducted, revealing an average customer satisfaction rate of 87.26%, while only 60.44% of the plant’s total production capacity was being utilized. Furthermore, management indicated that KPIs would enable them to implement improvement measures to mitigate risks and facilitate production monitoring.
It was determined that the initial productivity of the raw material reached an average of 0.873 tons per cubic meter of raw material and the labor productivity reached an initial level of 1.41 tons produced per man-hour of the personnel, whose rates were found to be below the standard established by the company.
The improvement was designed and implemented by establishing a dashboard comprised of a total of 22 indicators, for the financial, customer, process, and staff learning and growth perspectives; the standardization of processes implemented three flowcharts of the activities of: receiving raw materials, ice production, and dispatch of finished products, in addition to updating the organizational chart; a failure analysis of the equipment and a maintenance program were also developed to address the components that make up the freezing system of the ice plant, and finally, a training program was developed to reinforce the knowledge of the administrative and operational staff.
Productivity was analyzed after the implementation of the improvement, where a raw material productivity of 0.94 tons produced per cubic meter of raw material was obtained; in relation to labor productivity it reached an index of 3.25 tons per man-hour worked and with respect to total productivity it was found that for every sol invested S/ 3.19 was generated in production
Author Contributions
Conceptualization, CB and JH; methodology, JF; validation, CB, JH and JF; formal analysis, CB and JH; investigation, CB and JH; resources, CB and JH; writing—original draft preparation, CB and JH; writing—review and editing, JF; supervision, JF All authors have read and agreed to the published version of the manuscript.
Funding
This research received no external funding.
Institutional Review Board Statement
Not applicable.
Informed Consent Statement
Not applicable.
Data Availability Statement
Suggested Data Availability Statements are available in section “MDPI Research Data Policies” at https://www.mdpi.com/ethics.
Conflicts of Interest
The authors declare no conflicts of interest.
Abbreviations
| INEI | National Institute of Statistics and Research |
| SDGs | Sustainable Development Goal |
References
- CHAVES, J.; ACOSTA, O. Isochoric freezing: advantages and research opportunities in the food industry. Agron. Mesoam 2023, 34. [Google Scholar] [CrossRef]
- CASTILLO, S.; WONG, H.; CALVANAPÓN, F. Proposal of Indicators for the Logistics Management at Multiservicios Yanasara SAC. Company 2022. [Google Scholar] [CrossRef]
- MCKINSEY. Global Report 2021: The State of New Business Creation. McKinsey & Company. 2021. Available online: https://www.mckinsey.com/featured-insights/destacados/informe-global-2021-el-estado-de-la-creacion-de-nuevas-empresas/es.
- HERNÁNDEZ, M. Regional Public Management Index—December 2020 , Peru Competes. 2025. Available online: https://www.compite.pe/publicacion/indice-regional-de-gestion-publica-diciembre-2020/.
- INEI. National production decreased by 11.12% during 2020. National Institute of Statistics and Informatics. 2021. Available online: https://www.inei.gob.pe/media/MenuRecursivo/boletines/02-informe-tecnico-produccion-nacional-dic-2020.pdf.
- HADI, M.; MARTEL, C.; HUAYTA, F.; ROJAS, R.; ARIAS, J. Research Methodology: A Guide for the Thesis Project. University Institute of Innovation, Science and Technology Inudi Peru 2023. [Google Scholar] [CrossRef]
- HARO, A.; CHISAG, E.; RUIZ, J.; CAICEDO, J. Types and classification of investigations. LATAM 2024, 5, 2. Available online: https://latam.redilat.org/index.php/lt/article/view/1927.
- VIZCAÍNO, P.; CEDEÑO, R.; MALDONADO, I. Methodology of scientific research: a practical guide. Ciencia Latina Multidisciplinary Scientific Journal 2023, 7, 4. Available online: https://ciencialatina.org/index.php/cienciala/article/view/7658.
- VILLAGRA, J. Management indicators: a practical approach. Top Publications 2022, 1. Available online: https://ptp.pe/wp-content/uploads/2022/08/IndicadoresdeGestion_Muestra.pdf.
- ACEVEDO, D. How to Lie with KPIs. Brasilia: Diofante Acevedo Gamboa, Brasilia, 2022. Available online: https://www.google.com.pe/books/edition/C%C3%B3mo_MENTIR_con_KPIs/g8aUEAAAQBAJ?hl=es&gbpv=1&dq=libro:+indicadores+de+gestion+kpi&pg=PA50&printsec=frontcover.
- SABRY, F. Productive Efficiency. One Billion Knowledges 2024, 1. Available online: https://www.google.com.pe/books/edition/Eficiencia_productiva/KKLyEAAAQBAJ?hl=es&gbpv=0.
- NAVAS, W.; CATOTA, V.; RAMÍREZ, S. Total Quality: A Tool for Creating Value. Ecuador: Religación CICSH-AL. Center for Research in Social Sciences and Humanities from Latin America 2023, 1. [Google Scholar] [CrossRef]
- MENDOZA, J.; GARCÍA, H.; ARMAS, R.; CRUZ, L. Application of the balanced scorecard in the strategic management process of the company EIR.L/PROTEK, Peru. Revista Impulso 2024, 4, 7. Available online: http://www.scielo.org.bo/scielo.php?script=sci_arttext&pid=S2959-90402024000200033.
- VILLAVICENCIO, J.; VALDIVIA, A.; COLLAO, M.; CHAVEZ, R. Service Model under the Lean Service and Machine Learning Approach to Increase External User Satisfaction: A case study in the health sector SMEs in Peru. ACM International Conference Proceeding Series 2022. [Google Scholar] [CrossRef]
- RAMÍREZ, G.; MAGAÑA, D.; OJEDA, R. Productivity, aspects that benefit the organization. Systematic review of scientific production. Trascender, contabilidad y gestión 2022, 7, 20. [Google Scholar] [CrossRef]
- AITHAL, P.; AITHAL, Shubhrajyotsna. Key Performance Indicators (KPI) for Researchers at Different Levels & Strategies: SSRN. International Journal of Management, Technology, and Social Sciences. 2023. Available online: https://papers.ssrn.com/sol3/papers.cfm?abstract_id=4715312.
- CAMPOS, J. Balanced Scorecard: strategic tool applied in a Venezuelan advisory and consulting company. Uniandes Episteme 2024, 11. [Google Scholar] [CrossRef]
- PÉREZ, E. Systems theory: From Ludwig von Bertalanffy to Niklas Luhmann. Miradas 2023, 18, 1. [Google Scholar] [CrossRef]
- EYNG, M.; LOUISE, A.; SUNDAY, E.; LEITE, L. Exploring Organizational Resilience Through Key Performance Indicators. Journal of Industrial and Production Engineering 38, 1. [CrossRef]
- FERRANDO, E. Motivation in second language teaching: a theoretical-practical approach within the CLIL integrated approach. Language and Society 2023, 22, 1. [Google Scholar] [CrossRef]
- CONTRERAS, R.; ALARCON, K.; VILCAHUAMAN, R.; GARAY, J.; RÚA, S.; IPINCE, D.; BENITES, M. Improving Productivity through the design of a quality management system based on the ISO 22000:2018 standard. LACCEI International Multi-Conference for Engineering, Education, and Technology 2024. [Google Scholar] [CrossRef]
- ESCUDERO, V.; GUISADO, A.; SANTOS, B.; HERANZ, A. Development and consensus of a dashboard model to evaluate research activity in Spanish Hospital Pharmacy Services. Hospital Pharmacy 2024, 48. [Google Scholar] [CrossRef]
- OLIVEIRA, J. Teorias Administrativas e Gestão Da Educac ̧ ão. Brasilia: Appris Editora 2023. Available online: https://www.google.com.pe/books/edition/Teorias_Administrativas_e_Gest%C3%A3o_da_Edu/o0_cEAAAQBAJ?hl=es&gbpv=0.
- BUSTILLOS, A.; ROJAS, M.; QUIROZ, J. Integrated Lean-BPM Service Model to Reduce Lead Time of Incorporation of New Employees in an SME of HR Services. LACCEI international Multi-conference for Engineering, Education and Technology 2022, 01. [Google Scholar] [CrossRef]
Table 5.
Failure Mode and Effects Analysis of Compressor Pool 1.
| Component | Failure mode | Effect | Severity | Causes | Probability | Detection | Risk index (SxPxD) |
|---|---|---|---|---|---|---|---|
| Head | Worn valves | The refrigerant is not compressed. | 9 | The equipment is not working. | 8 | 7 | 504 |
| Discharge pressures | increase in load | 5 | Temperature increase in the printhead | 6 | 5 | 150 | |
| Piston | Worn rings | Working time or lack of lubrication | 6 | Uncompressed refrigerant | 7 | 7 | 294 |
| Worn connecting rods | Absence of movement | 9 | Uncompressed refrigerant | 9 | 7 | 567 | |
| Sump | High oil pressure | Cracked oil pan | 9 | Rupture due to overheating | 3 | 4 | 108 |
| Presence of frost | Boiling of the oil | 8 | Compressor shutdown | 4 | 5 | 160 | |
| Crankshaft | Worn crankshaft | Piston without movement | 6 | Broken pistons | 3 | 5 | 90 |
| Oil pump | Worn sprockets | It’s not pumping oil. | 7 | Oil and coolant mixture | 9 | 7 | 441 |
| Safety valve | Broken springs | Presence of fatigue in springs | 7 | Refrigerant leak | 6 | 4 | 168 |
| Oil cooler | Limescale of pipes | Soot accumulation | 4 | It doesn’t cool the oil | 4 | 3 | 48 |
| Electrical panel | Sulfated contacts and connectors | Melted contacts | 9 | Compressor shutdown | 9 | 7 | 567 |
Table 6.
Failure modes and effects analysis of compressor pool 2.
| Component | Failure mode | Effect | Severity | Causes | Probability | Detection | Risk index (SxPxD) |
|---|---|---|---|---|---|---|---|
| Head | Leaks, cracks, faulty welds | Refrigerant loss, low performance | 7 | Fatigue, impact, poor welding | 6 | 8 | 336 |
| Piston | Wear, breakage, damaged seals | Loss of pressure, compression failures | 9 | Excessive friction, inadequate lubrication | 5 | 7 | 315 |
| Sump | Cracks, wall wear | Oil leaks, structural failure | 9 | Material fatigue, overpressure | 8 | 7 | 504 |
| Crankshaft | Wear, fatigue, breakage | Engine failure, catastrophic damage | 9 | Excessive load, insufficient lubrication | 8 | 8 | 576 |
| Oil pump | Blockage, wear, electrical failure | Damage to components, overheating | 8 | Lack of lubrication, overheating | 8 | 7 | 448 |
| Safety valve | Obstruction, mechanical or electrical failure | Risk of accident, damage to equipment | 9 | Overpressure, risk of explosion | 6 | 9 | 486 |
| Oil cooler | Obstructions, loss of efficiency | Oil damage, reduced efficiency | 8 | Overheating, oil failure | 5 | 3 | 120 |
| Electrical panel | Overload, short circuit | Total control failure, electrical hazards | 8 | Unplanned shutdowns, system damage | 6 | 2 | 96 |
Table 7.
Failure Mode and Effects Analysis of Compressor Pool 3.
| Component | Failure mode | Effect | Severity | Causes | Probability | Detection | Risk index (SxPxD) |
|---|---|---|---|---|---|---|---|
| Head | Structural crack | Ammonia leaks | 9 | Pressure fatigue | 8 | 7 | 504 |
| Piston | Excessive wear | Loss of compression | 8 | Poor lubrication | 5 | 4 | 160 |
| Sump | Oil leaks | Contamination and loss of lubrication | 7 | Defective seals | 6 | 3 | 126 |
| Crankshaft | Misalignment | Vibrations and mechanical damage | 8 | Incorrect assembly | 6 | 4 | 192 |
| Oil pump | Pumping failure | Overheating and internal damage | 9 | Obstruction or wear | 7 | 8 | 504 |
| Safety valve | No opening | Excessive pressure, risk of explosion | 10 | Obstruction or mechanical failure | 5 | 2 | 100 |
| Oil cooler | Obstruction | System overheating | 8 | Accumulated dirt | 5 | 3 | 120 |
| Electrical panel | Control failure | System shutdown | 9 | Overload or humidity | 4 | 5 | 180 |
Table 8.
Maintenance program for compressors.
| No. | Component | Preventive Activity | Frequency | Responsible | Resources Needed | Execution Method | Acceptance Criteria | Observations |
|---|---|---|---|---|---|---|---|---|
| 1 | Head | Crack inspection and screw tightening | Monthly | Mechanical Technician | Torque wrench, flashlight | Visual inspection and torque verification | Seamless, torque within specification | Record in logbook |
| 2 | Piston | Checking wear and lubrication | Quarterly | Mechanical Technician | Micrometer, lubricant | Clearance measurement and lubricant application | Clearance within tolerance, adequate lubrication | Replace if there is excessive wear |
| 3 | Sump | Check seals and oil level | Monthly | Maintenance Operator | Seals, level gauge | Visual inspection and measurement | No leaks, correct level | Record oil consumption |
| 4 | Crankshaft | Alignment and wear inspection | Biannual | Specialized Technician | Alignment tools, caliper | Verification with caliper and aligner | Within alignment tolerance | Requires scheduled stop |
| 5 | Oil pump | Function and pressure test | Monthly | Mechanical Technician | Pressure gauge, multimeter | Pressure and current measurement | Pressure within range, normal power consumption | Replace if there are any abnormalities |
| 6 | Safety valve | Opening test and calibration | Quarterly | Security Supervisor | Test bench, pressure gauge | Overpressure simulation | Opening within nominal pressure | Record test results |
| 7 | Oil cooler | Cleaning and flow verification | Monthly | Maintenance Operator | Brush, pressurized water | Physical cleaning and flow testing | Adequate flow, without obstructions | Record measured flow rate |
| 8 | Electrical panel | Verification of connections and protections | Monthly | Electrician | Multimeter, screwdriver | Voltage measurement and protection check | No loose connections, operational protections | Label cables correctly |
Table 17.
Student’s t-test.
| Paired samples test | ||||||||
|---|---|---|---|---|---|---|---|---|
| Paired differences | t | gl | Sign (bilateral) | |||||
| Average | Dev. Deviation | Average Error Deviation | 95% confidence interval of the difference | |||||
| Lower | Superior | |||||||
| Productivity PRE Productivity POST |
-1,11000 | ,58863 | ,24031 | -1.72772 | -,49228 | -4,619 | 5 | ,006 |
Disclaimer/Publisher’s Note: The statements, opinions and data contained in all publications are solely those of the individual author(s) and contributor(s) and not of MDPI and/or the editor(s). MDPI and/or the editor(s) disclaim responsibility for any injury to people or property resulting from any ideas, methods, instructions or products referred to in the content. |
© 2025 by the authors. Licensee MDPI, Basel, Switzerland. This article is an open access article distributed under the terms and conditions of the Creative Commons Attribution (CC BY) license (http://creativecommons.org/licenses/by/4.0/).
Copyright: This open access article is published under a Creative Commons CC BY 4.0 license, which permit the free download, distribution, and reuse, provided that the author and preprint are cited in any reuse.


