2.4.2. Evaluation of Sunscreen Gel Formulations
Organoleptic testing was conducted to assess the physical characteristics of sunscreen gel formulations, including shape, color, and odor. Observations were made using human sensory perception.
Table 8.
Organoleptic test results.
Table 8.
Organoleptic test results.
| Formulation |
Shape |
Color |
Odor |
| Blank |
Thick |
Colorless |
Characteristic |
| F I (Extract) |
Thick |
Light yellow |
Characteristic |
| F II (Extract) |
Thick |
Pale yellow |
Characteristic |
| F III (Extract) |
Thick |
Yellow |
Characteristic |
| F I (Nano) |
Thick |
Pale yellow |
Characteristic |
| F II (Nano) |
Thick |
Turbid |
Characteristic |
| F III (Nano) |
Thick |
Turbid |
Characteristic |
All formulations exhibited a thick consistency, attributed to the standardized preparation method involving stirring at 100 rpm for 30 min. This speed was sufficient to homogenize the gel without causing phase separation or excessive air entrapment, ensuring uniform particle dispersion and preventing sedimentation [
50]. The odor across all samples remained consistent, described as “characteristic,” indicating that the base ingredients and active compounds did not introduce undesirable odors during formulation.
Color differences were more pronounced. The blank gel appeared colorless, reflecting the absence of extract pigments. F I (Extract) displayed a light-yellow hue, F II (Extract) was pale yellow, and F III (Extract) showed a more intense yellow coloration. These variations are attributable to the natural pigments of the plant extract dissolved in propylene glycol. In contrast, the nanoformulations demonstrated altered visual properties: F I (Nano) retained a pale-yellow appearance, whereas F II (Nano) and F III (Nano) appeared turbid. The turbidity in these samples may be linked to incomplete particle dispersion or higher extract loading, which could exceed the stabilizing capacity of the gelatin matrix [
51].
Overall, these findings emphasize that nanoencapsulation influences the visual aesthetics of sunscreen gels. Gelatin, used as a stabilizer, improved gel clarity and particle dispersion, contributing to a more uniform appearance. While consistency and odor remained stable across formulations, the turbid appearance in some nanoformulations suggests a need for further optimization of particle size distribution and stabilizer concentration to enhance uniformity and consumer acceptability.
Homogeneity testing was performed to ensure that all components within the sunscreen gel formulations were evenly distributed, with no visible undissolved particles. This parameter is critical for guaranteeing consistent active ingredient concentration in each administered dose. The test was conducted by placing the gel samples onto a watch glass and observing them visually for any signs of phase separation or particulate residue.
Table 9.
Homogeneity test results.
Table 9.
Homogeneity test results.
| Formulation |
(Trial 1) |
Trial 2 |
Trial 3 |
| Blank |
Homogeneous |
Homogeneous |
Homogeneous |
| F I (Extract) |
Homogeneous |
Homogeneous |
Homogeneous |
| F II (Extract) |
Homogeneous |
Homogeneous |
Homogeneous |
| F III (Extract) |
Homogeneous |
Homogeneous |
Homogeneous |
| F I (Nano) |
Homogeneous |
Homogeneous |
Homogeneous |
| F II (Nano) |
Homogeneous |
Homogeneous |
Homogeneous |
| F III (Nano) |
Homogeneous |
Homogeneous |
Homogeneous |
All tested formulations demonstrated complete homogeneity across three replicates, indicating that the active compounds and excipients were uniformly dispersed within the gel matrix. The absence of visible coarse particles or phase separation confirms that the mixing process—conducted at 100 rpm for 30 minutes—was sufficient to achieve a stable and well-integrated system [
50].
This result is particularly important for nanoformulations, where particle dispersion can be challenging due to potential agglomeration. The consistent homogeneity observed in both extract-based and nano-based gels suggests that the formulation strategy, including the use of gelatin as a stabilizer, effectively supported uniform distribution of active ingredients [
51].
Maintaining homogeneity is essential not only for product stability but also for ensuring reproducible therapeutic or protective effects in topical applications. These findings support the robustness of the preparation method and the compatibility of the selected excipients with both extract and nanoparticle systems.
The pH of the sunscreen gel formulations was measured by diluting 1 g of gel with 10 mL of distilled water, followed by immersion of the electrode into the sample. This test was conducted to ensure compatibility with the physiological pH range of human skin.
Table 10.
pH test results of sunscreen gel formulations.
Table 10.
pH test results of sunscreen gel formulations.
| Formulation |
Mean ± SD |
| Blank |
4.49 ± 0.02 |
| F I (Extract) |
4.54 ± 0.02 |
| F II (Extract) |
4.71 ± 0.01 |
| F III (Extract) |
4.55 ± 0.01 |
| F I (Nano) |
4.88 ± 0.03 |
| F II (Nano) |
4.84 ± 0.01 |
| F III (Nano) |
4.85 ± 0.01 |
All formulations exhibited pH values within the acceptable skin compatibility range of 4.0–7.5 [
52]. The blank formulation showed a mean pH of 4.49 ± 0.02, while extract-based formulations ranged from 4.54 ± 0.02 to 4.71 ± 0.01. Nanoformulations demonstrated slightly higher pH values, ranging from 4.84 ± 0.01 to 4.88 ± 0.03.
The lower pH observed in extract-based gels may be attributed to the presence of acidic phytochemicals. In contrast, the slightly elevated pH in nanoformulations is likely due to the buffering effect of gelatin and other polymers, which can interact with acidic compounds via hydrogen bonding or ionic interactions, thereby reducing overall acidity [
51].
Maintaining pH within the physiological range is essential to prevent skin irritation, dryness, and disruption of the stratum corneum barrier. These results confirm that all tested formulations are suitable for topical application and meet dermatological safety standards.
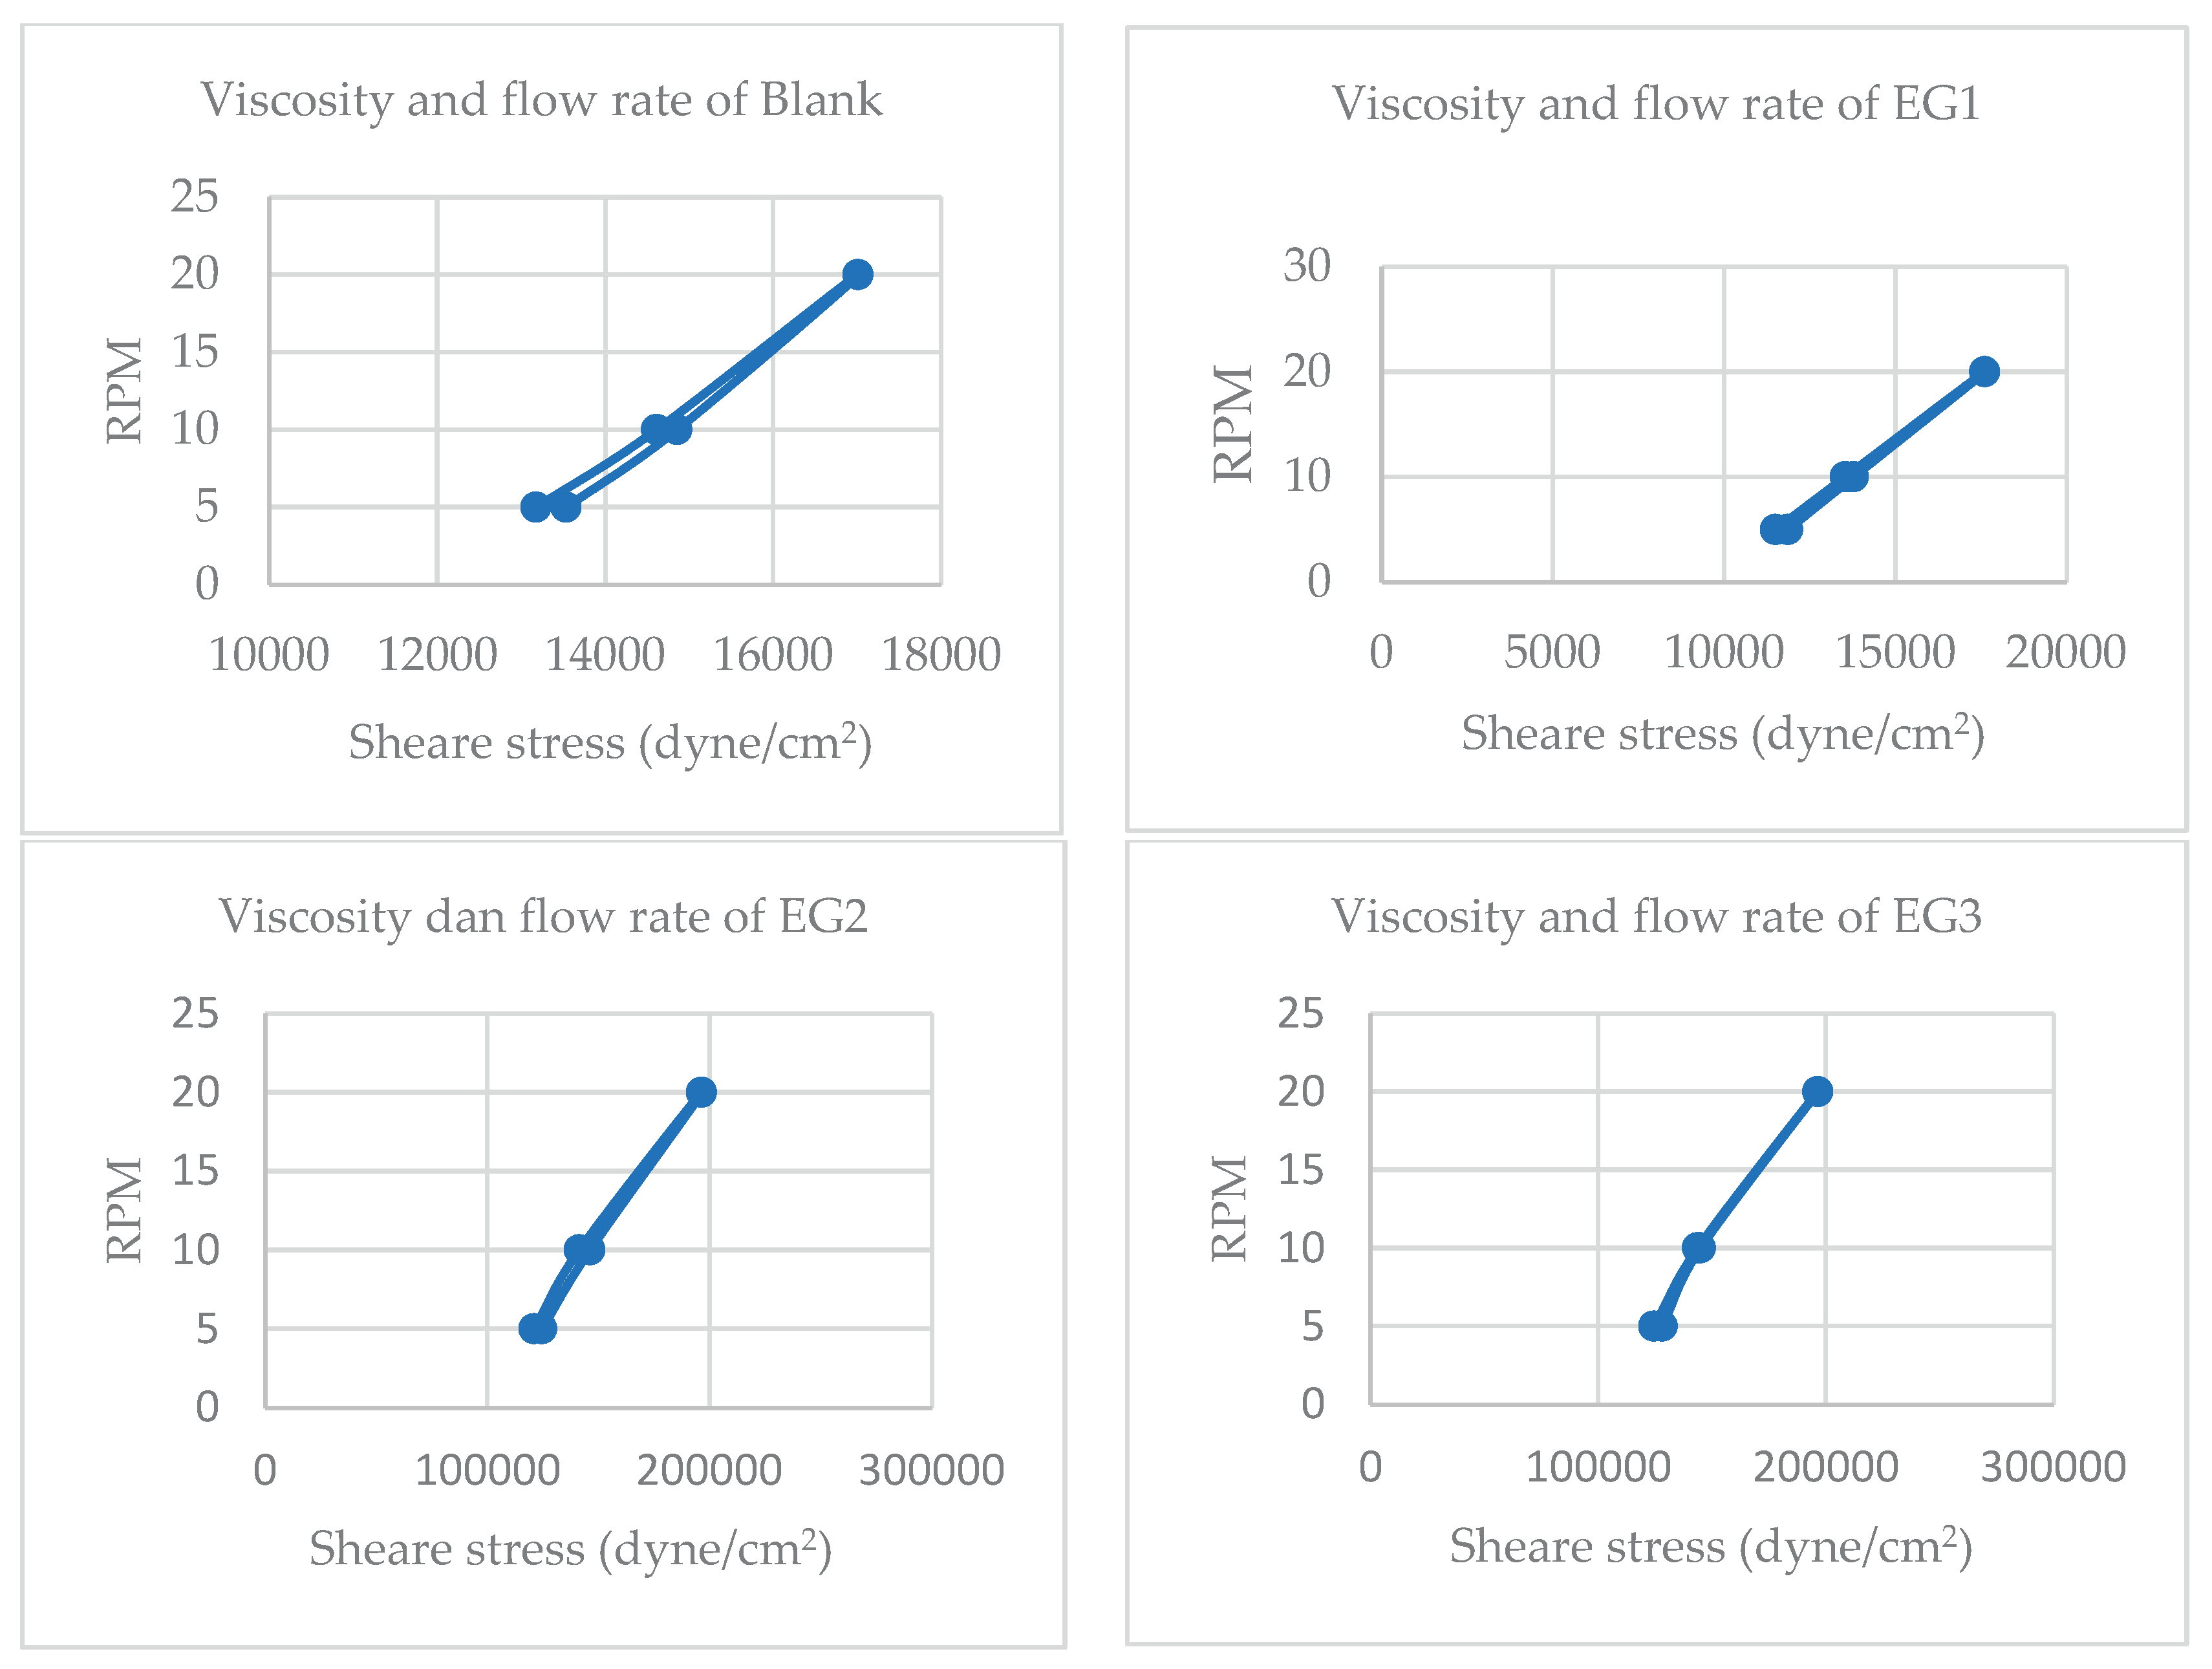
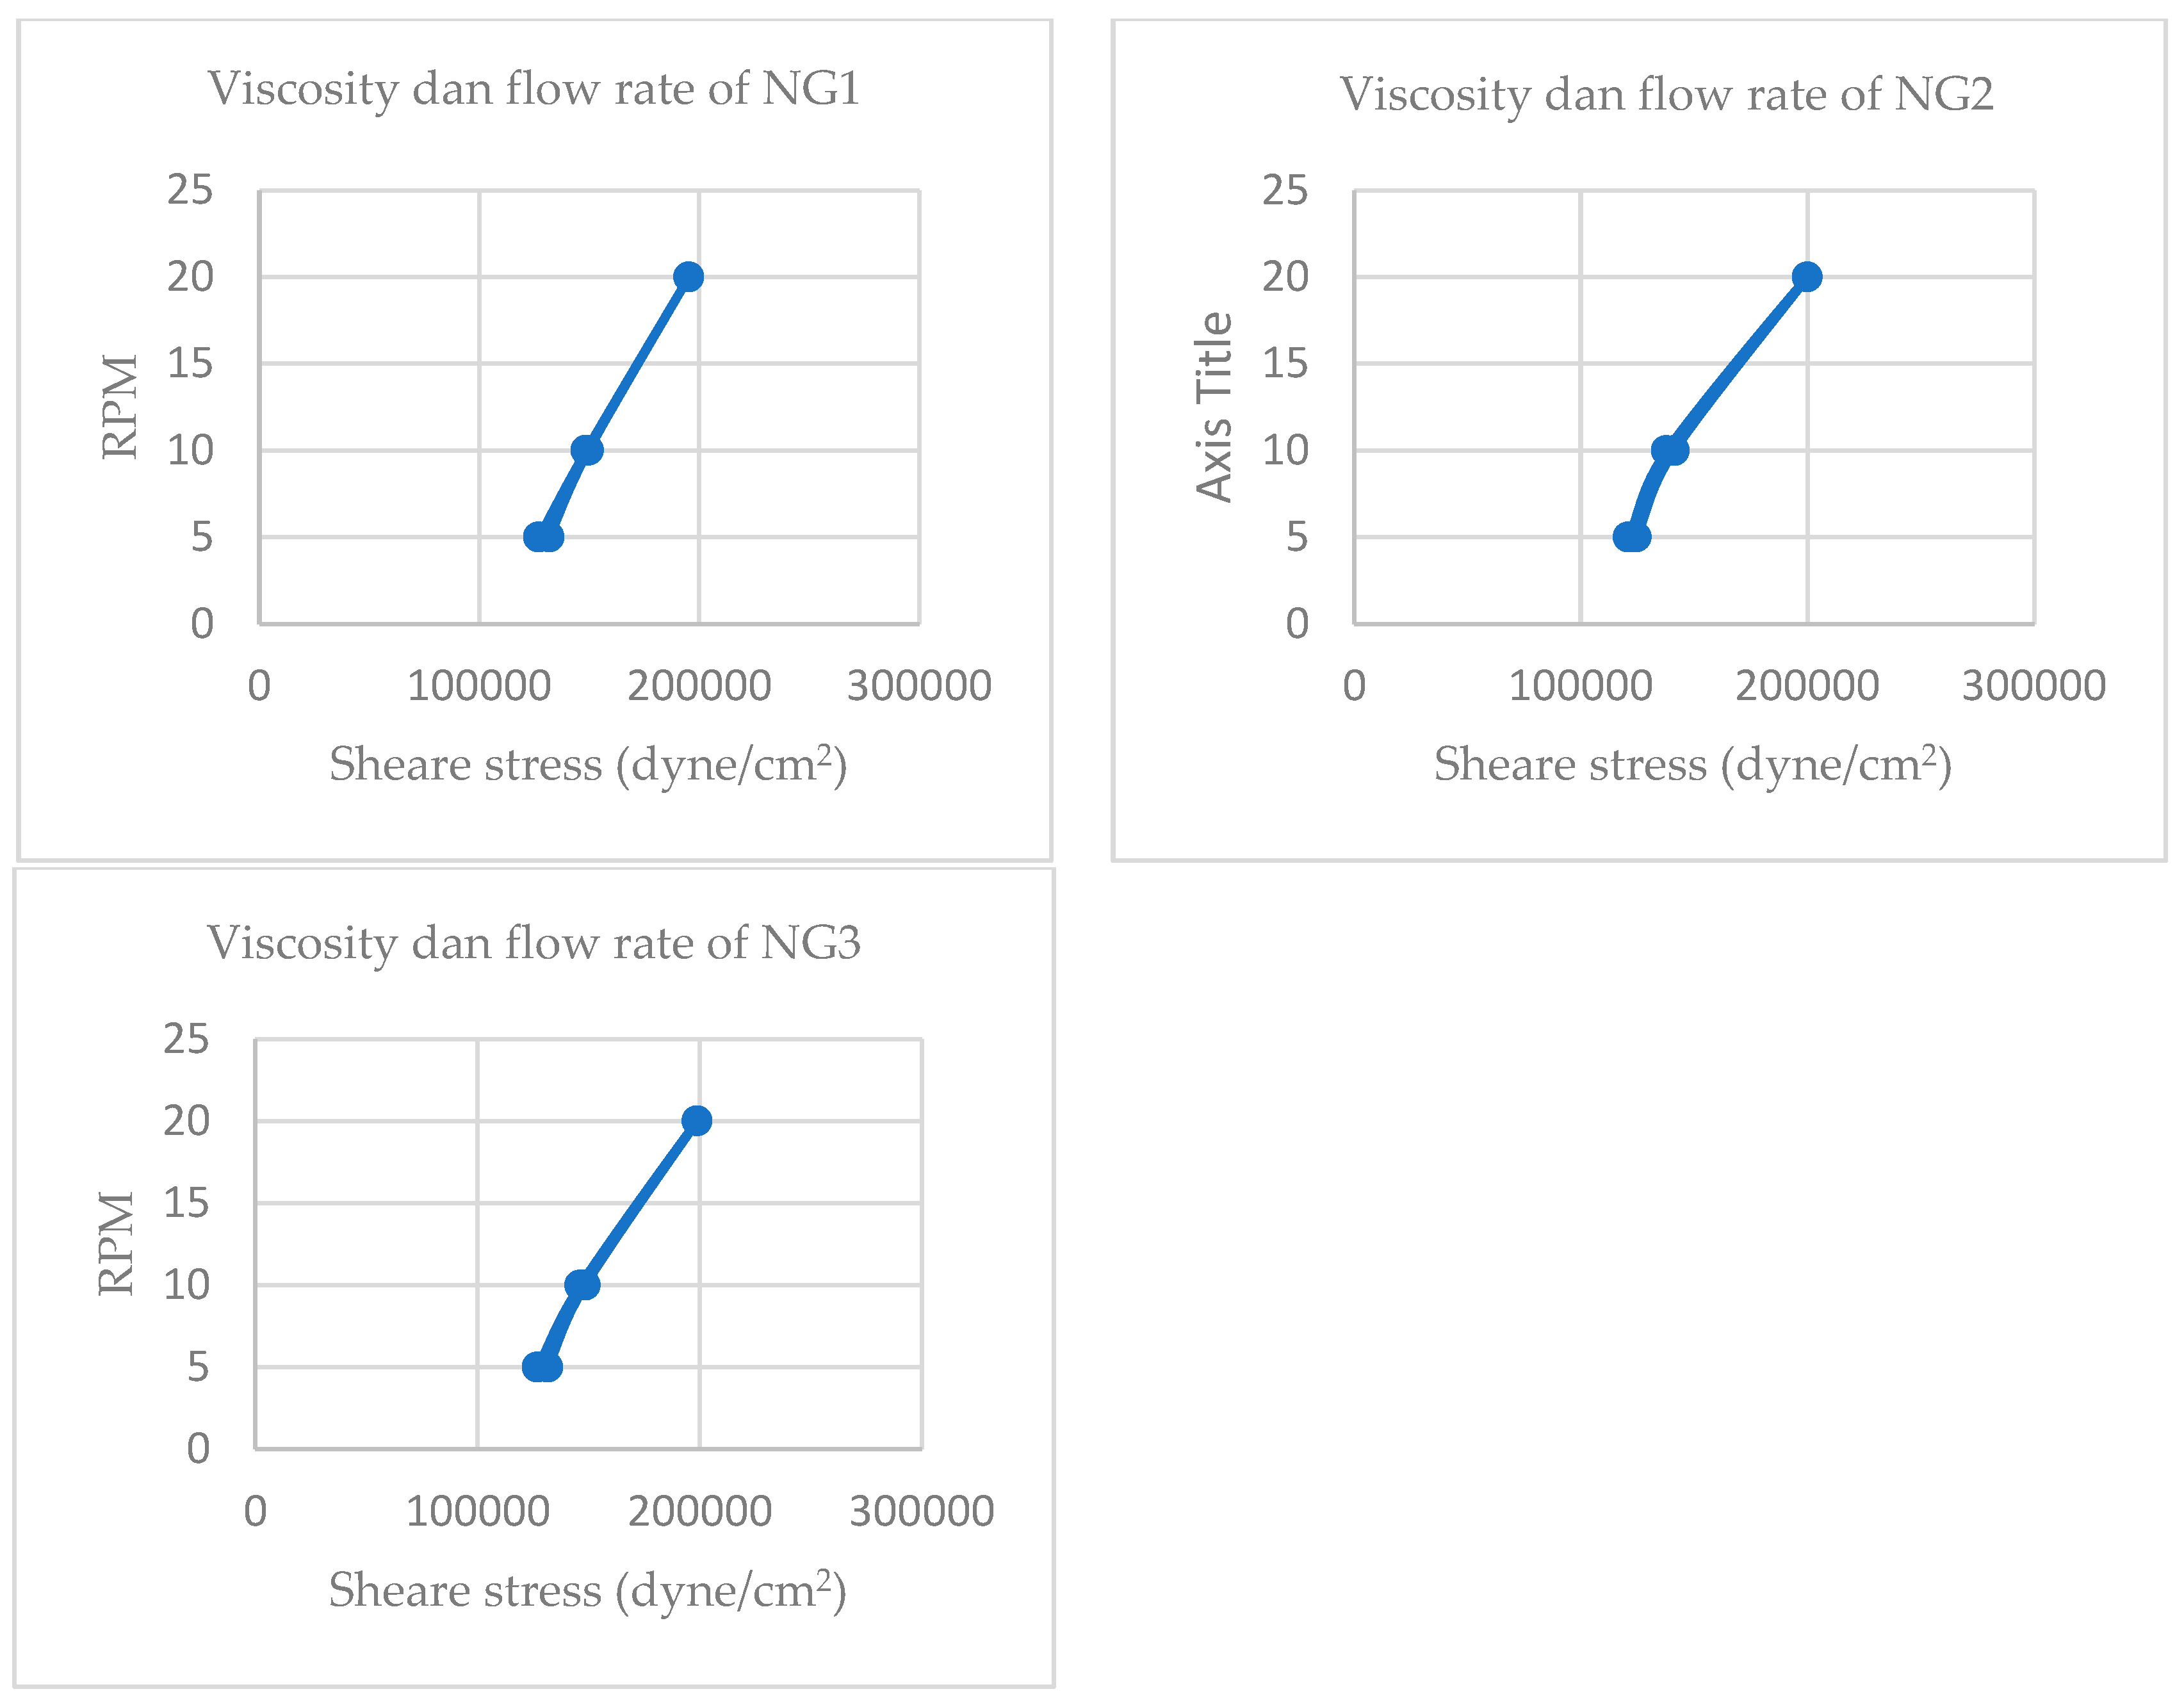
Viscosity testing was conducted to evaluate the rheological behavior of the blank sunscreen gel formulation using a Brookfield viscometer. Measurements were taken across multiple spindle types (5, 6, and 10) and rotational speeds (RPM), generating viscosity values in centipoise (cP) and corresponding shear stress (dyne/cm²).
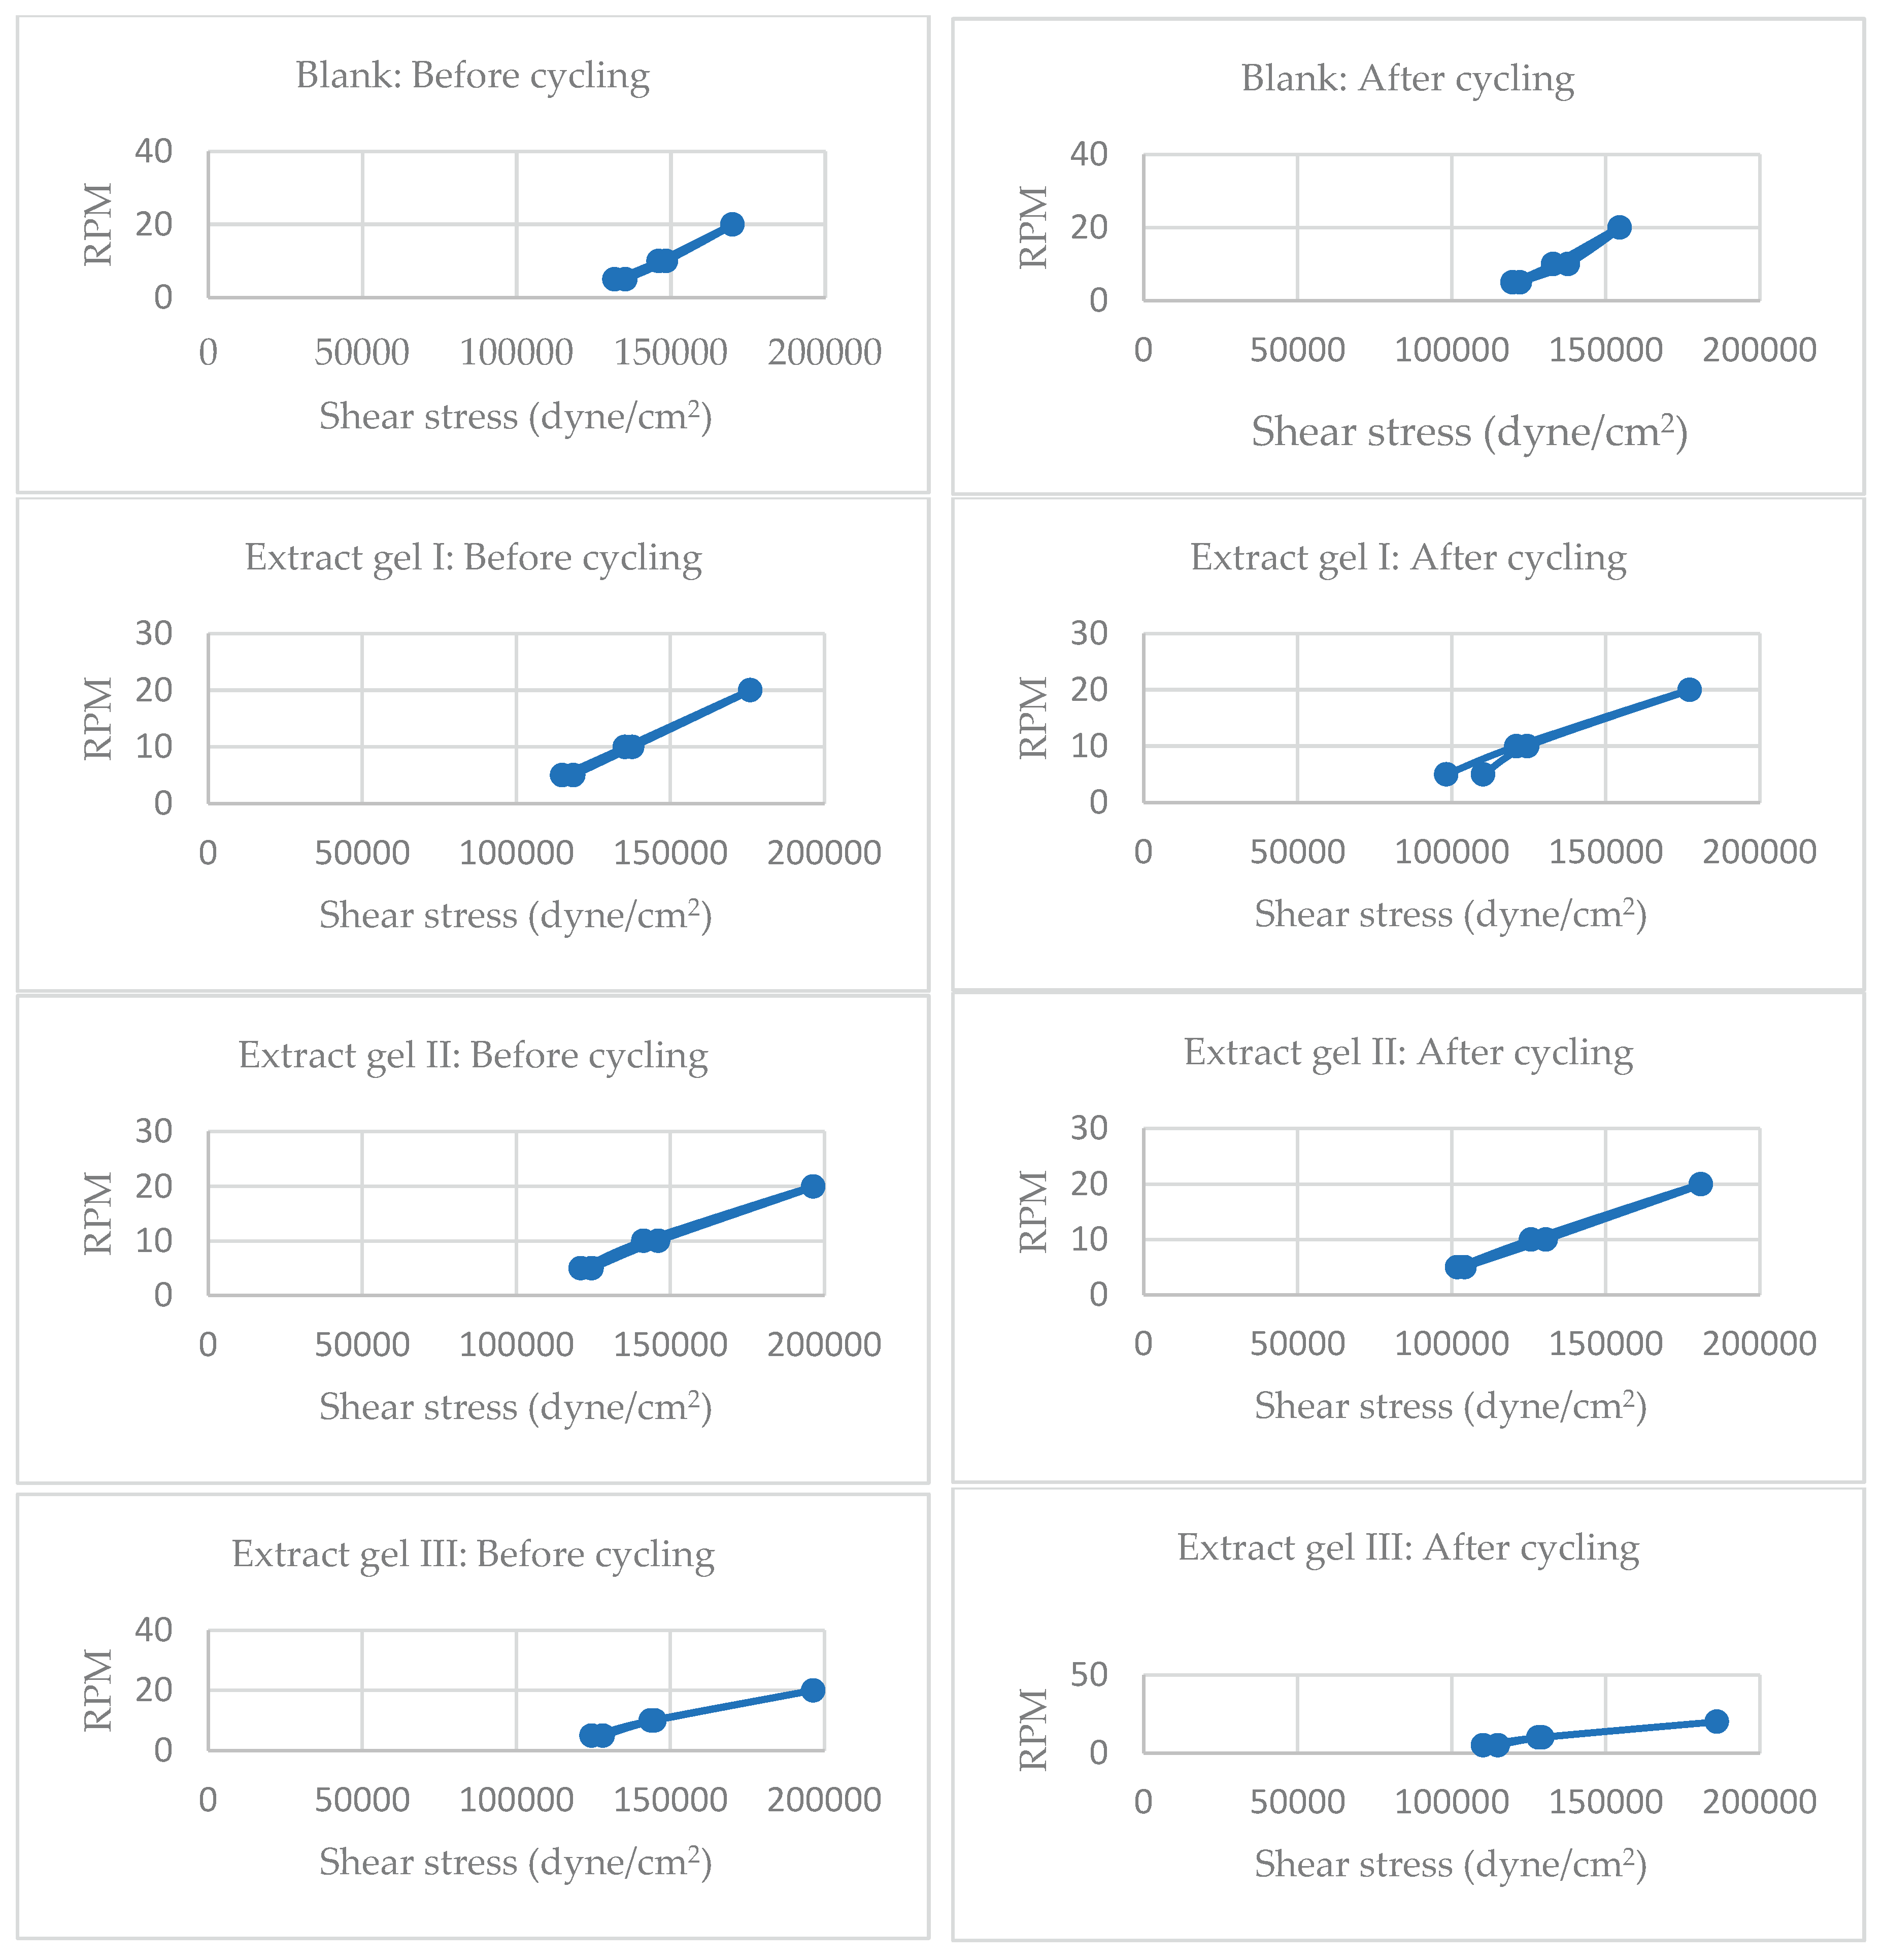
Figure 4.
Profiles of viscosities and flow rates of Syzygium gels containing extract (EG) and containing nanoparticles (NG).
Figure 4.
Profiles of viscosities and flow rates of Syzygium gels containing extract (EG) and containing nanoparticles (NG).
The viscosity test aims to determine whether the gel's thickness meets the required standards for topical application. According to SNI 16-4399-1996, the acceptable viscosity range for gel preparations is 6000–50000 cP [
53]. All tested formulations—both extract-based and nanoparticle-based—fall within this range, indicating compliance with national standards and suitability for topical use.
Viscosity results:
- -
Extract-Based Formulations, F I (12,330 cP), F II (13,667 cP), and F III (13,667 cP), with a relationship F I < F II = F III.
- -
Nanoparticle-Based Formulations, F I (13,583 cP), F II (13,917 cP), F III (13,833 cP), with a relationship F I < F II > F III
The viscosity values of all formulations fall within the optimal range for gel-based sunscreens, ensuring adequate spreadability and user comfort. Notably, nanoparticle-based formulations exhibit slightly higher viscosity than their extract-based counterparts, which may be attributed to the increased surface area and interaction of nanoparticles with the gel matrix. F II consistently shows the highest viscosity in both groups, suggesting a potential influence of active concentration or stabilizer content. [
54]
Flow curve analysis reveals plastic flow behavior across all formulations, characterized by a yield stress threshold before flow initiation [
55]. This rheological profile is advantageous for topical gels, as it prevents premature spreading and particle sedimentation, thereby enhancing product stability and uniformity during storage and application.
These findings support the formulation's physical integrity and suggest that nanoparticle incorporation does not compromise viscosity but may enhance structural consistency. Further investigation into the correlation between viscosity and active release kinetics is recommended to optimize therapeutic performance.
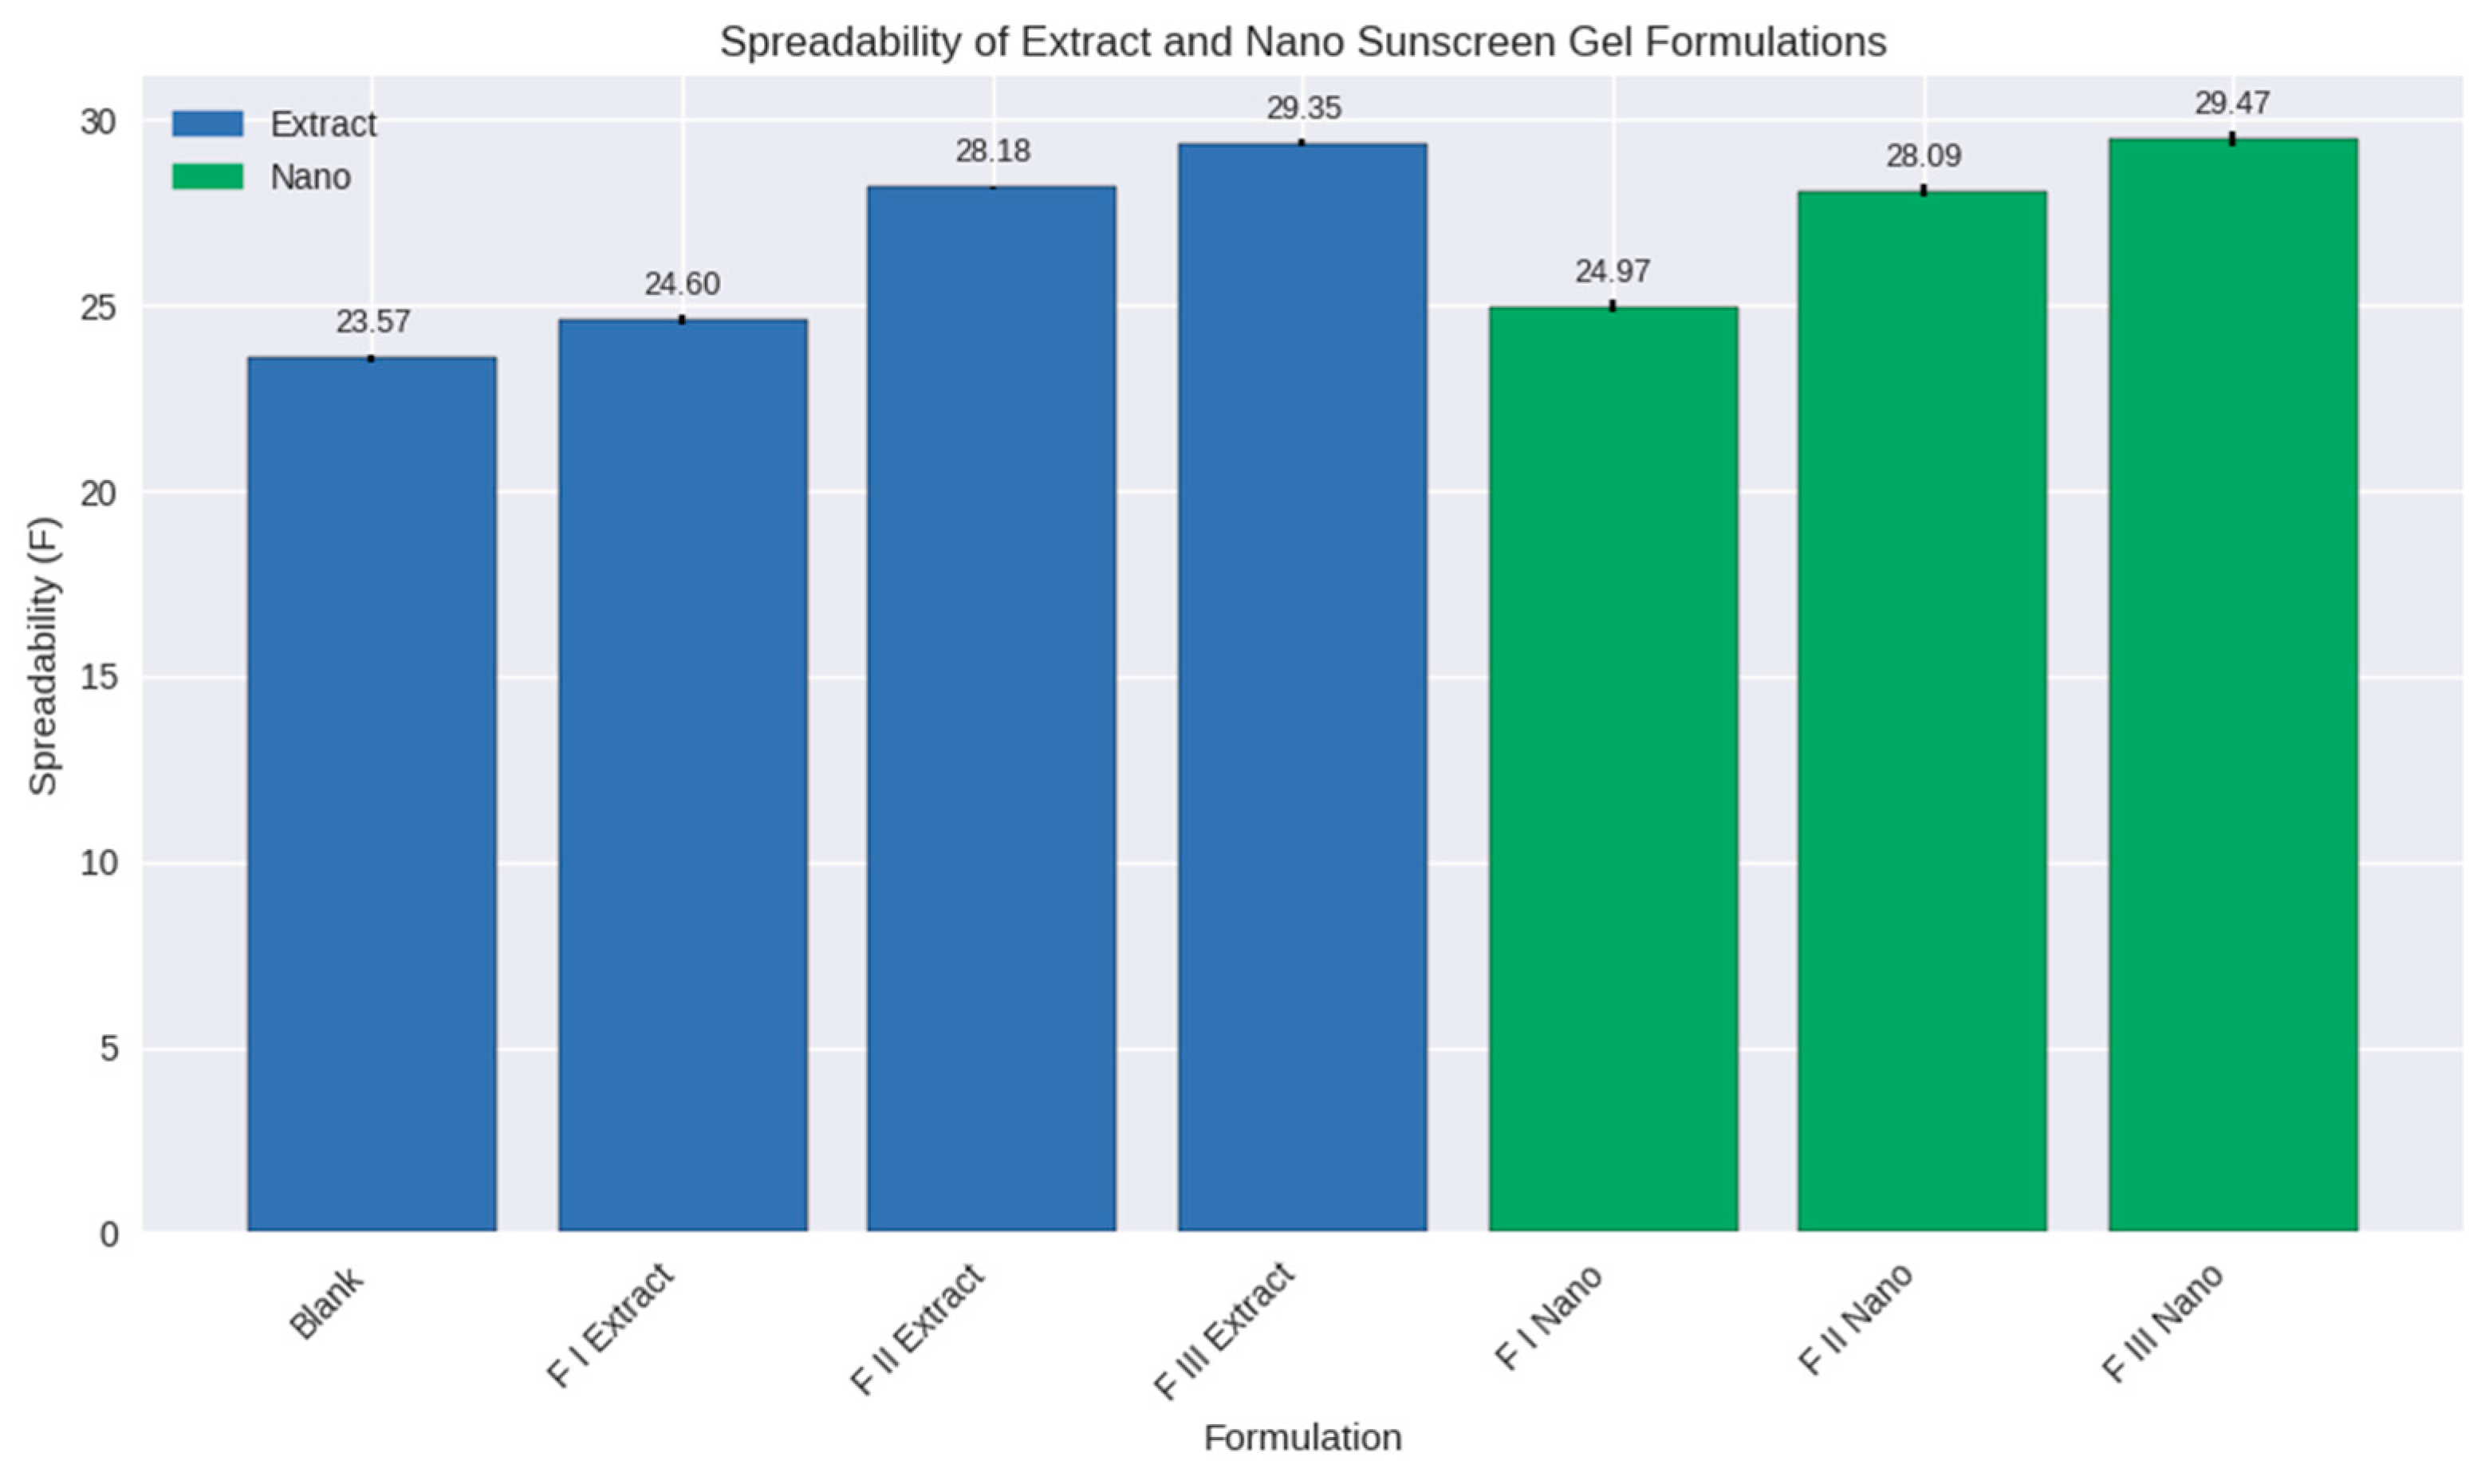
Figure 5.
Spreadability of formulations of Blank, containing extract (FI, FII, and FIII), and containing nanoparticles (FI, FII, and FIII).
Figure 5.
Spreadability of formulations of Blank, containing extract (FI, FII, and FIII), and containing nanoparticles (FI, FII, and FIII).
The spreadability test confirmed that all sunscreen gel formulations fell within the acceptable range of 5–7 cm, ensuring ease of application and uniform coverage on the skin. However, notable differences were observed betwthe blank, extract-based, and nanoformulations. The blank gel exhibited the lowest spreadability (23.57 ± 0.09), reflecting the baseline rheological properties of the gel matrix without active compounds. Extract-based formulations showed progressive increases in spreadability, with F III Extract reaching 29.35 ± 0.10, suggesting that higher extract concentrations contributed to reduced internal resistance and improved gel fluidity.
Nanoformulations demonstrated the highest spreadability values, with F III Nano achieving 29.47 ± 0.20. This superior performance can be attributed to the nanoparticle dispersion and stabilizing effect of gelatin, which enhance the uniform distribution of active compounds and reduce particle aggregation. The improved spreadability of nanoformulations complements their previously observed rheological and pH characteristics: slightly higher pH values due to buffering interactions and pseudoplastic flow behavior that facilitates spreading under shear. Together, these properties highlight the multifunctional role of gelatin as both a stabilizer and a rheology modifier [
56,
57].
From a practical perspective, enhanced spreadability is critical for sunscreen formulations, as it ensures uniform film formation, maximizes UV protection, and improves consumer acceptability. Poorly spreadable gels may leave uneven coverage, leading to reduced efficacy and potential skin irritation. The results therefore suggest that nanoformulations not only improve the physicochemical stability of the gel but also enhance its functional performance during topical application. In conclusion, the comparative analysis demonstrates that while all formulations are dermatologically acceptable, nanoformulations provide the most favorable balance of spreadability, viscosity, and pH compatibility, positioning them as promising candidates for advanced sunscreen delivery systems.
Stability
-
Organoleptic evaluation before and after cyclyng
Organoleptic assessment was conducted both before and after the cycling test.
Table 11.
Organoleptic evaluation of sunscreen gel (before cycling).
Table 11.
Organoleptic evaluation of sunscreen gel (before cycling).
| Before cycling |
| Formulation |
Form |
Color |
Odor |
| Blank |
Thick |
Thick |
Thick |
Colorless |
Colorless |
Colorless |
Charac. |
Charac. |
Charac. |
| F I (extract) |
Thick |
Thick |
Thick |
L yellow |
L yellow |
L yellow |
Charac. |
Charac. |
Charac. |
| F II (extract) |
Thick |
Thick |
Thick |
P yellow |
P yellow |
P yellow |
Charac. |
Charac. |
Charac. |
| F III (extract) |
Thick |
Thick |
Thick |
Yellow |
Yellow |
Yellow |
Charac. |
Charac. |
Charac. |
| F I (nanoparticles) |
Thick |
Thick |
Thick |
P yellow |
P yellow |
P yellow |
Charac. |
Charac. |
Charac. |
| F II (nanoparticles) |
Thick |
Thick |
Thick |
Turbid |
Turbid |
Turbid |
Charac. |
Charac. |
Charac. |
| F III (nanoparticles) |
Thick |
Thick |
Thick |
Turbid |
Turbid |
Turbid |
Charac. |
Charac. |
Charac. |
| L yellow: Light yellow; P yellow: Pale yellow; Charac.: Characteristic |
The organoleptic examination following the cycling stability test was conducted to determine whether the sunscreen gel formulation underwent any changes in physical characteristics—specifically texture, color, and odor. These parameters were observed before and after exposure to alternating temperature conditions. Any alteration in these attributes may indicate formulation instability, potentially compromising product efficacy and safety.
Based on the results, no changes were observed in texture, color, or odor across all formulations before and after the cycling test. This consistency indicates that the sunscreen gel maintains organoleptic stability even after exposure to extreme temperature variations. Such stability suggests that the formulation possesses robust physical integrity and is capable of preserving its sensory characteristics under stress conditions.
The absence of organoleptic changes post-cycling test reflects the formulation’s resilience against thermal stress, which is critical for maintaining consumer acceptance and product performance during storage and distribution. Stability in texture and color implies that the emulsion system remains intact, while consistent odor suggests no degradation of active or aromatic compounds. These findings align with previous studies emphasizing the importance of excipient selection and gel matrix design in achieving thermally stable topical formulations. [
49,
56]
- -
Homogeneity evaluation before and after cycling
Table 12.
Homogeneity evaluation of sunscreen gel (before cycling).
Table 12.
Homogeneity evaluation of sunscreen gel (before cycling).
| Before cycling |
| Formulation |
1 |
2 |
3 |
| Blank |
Homogeneous |
Homogeneous |
Homogeneous |
| F I (extract) |
Homogeneous |
Homogeneous |
Homogeneous |
| F II (extract) |
Homogeneous |
Homogeneous |
Homogeneous |
| F III (extract) |
Homogeneous |
Homogeneous |
Homogeneous |
| F I (nanoparticles) |
Homogeneous |
Homogeneous |
Homogeneous |
| F II (nanoparticles) |
Homogeneous |
Homogeneous |
Homogeneous |
| F III (nanoparticles) |
Homogeneous |
Homogeneous |
Homogeneous |
Table 13.
Homogeneity evaluation of sunscreen gel (after cycling).
Table 13.
Homogeneity evaluation of sunscreen gel (after cycling).
| After cycling |
| Formulation |
1 |
2 |
3 |
| Blank |
Homogeneous |
Homogeneous |
Homogeneous |
| F I (extract) |
Homogeneous |
Homogeneous |
Homogeneous |
| F II (extract) |
Homogeneous |
Homogeneous |
Homogeneous |
| F III (extract) |
Homogeneous |
Homogeneous |
Homogeneous |
| F I (nanoparticles) |
Homogeneous |
Homogeneous |
Homogeneous |
| F II (nanoparticles) |
Homogeneous |
Homogeneous |
Homogeneous |
| F III (nanoparticles) |
Homogeneous |
Homogeneous |
Homogeneous |
Homogeneity testing is essential to ensure that active compounds and excipients are evenly distributed throughout the gel matrix, thereby guaranteeing consistent therapeutic performance and consumer acceptability. As shown in
Table 12 and
Table 13, all formulations—blank, extract-based, and nanoparticle-based—remained homogeneous before and after the cycling stability test. No phase separation, sedimentation, or visual inconsistencies were observed, confirming that the gels maintained structural integrity under thermal stress.
The consistent homogeneity observed in nanoparticle formulations highlights the stabilizing role of polymers such as Carbopol and HPMC, which form a robust gel network capable of suspending dispersed particles uniformly. This finding is particularly relevant for nanoparticle systems, where aggregation risk is higher due to increased surface energy. The ability of the gel matrix to maintain uniformity under stress conditions supports the physical stability of the formulations and validates their suitability for long-term topical application.
Previous studies have emphasized that homogeneity is a critical parameter in sunscreen and topical gel formulations, directly linked to product stability and consumer perception. For instance, formulations containing natural extracts demonstrated stable homogeneity and physical properties even after stress testing [
58]. Similarly, nanoparticle-loaded gels have been shown to maintain uniform distribution of active compounds, enhancing both stability and bioavailability [
59]. These findings corroborate the present results, where both extract-based and nanoparticle-based gels exhibited excellent homogeneity before and after cycling.
- -
pH evaluation before and after cycling
Table 14.
pH test results of sunscreen gel formulations (before and after cycling).
Table 14.
pH test results of sunscreen gel formulations (before and after cycling).
| Formula |
pH Before Cycling (Mean ± SD) |
pH After Cycling (Mean ± SD) |
| Blank |
4.49 ± 0.02 |
5.64 ± 0.01 |
| F I (Extract) |
4.54 ± 0.02 |
5.67 ± 0.02 |
| F II (Extract) |
4.71 ± 0.01 |
5.64 ± 0.02 |
| F III (Extract) |
4.55 ± 0.01 |
5.37 ± 0.02 |
| F I (Nano) |
4.89 ± 0.03 |
5.17 ± 0.02 |
| F II (Nano) |
4.83 ± 0.03 |
5.34 ± 0.01 |
| F III (Nano) |
4 .85 ± 0.01 |
5.64 ± 0.01 |
The pH stability of sunscreen gel formulations is a critical parameter influencing both product safety and efficacy. In this study, all formulations exhibited an increase in pH following the cycling test, which simulates temperature fluctuations and mechanical stress during storage. The blank formulation showed the most pronounced pH shift (from 4.49 ± 0.02 to 5.64 ± 0.01), suggesting limited buffering capacity or absence of stabilizing agents.
Formulations containing extract (F I–F III) also demonstrated pH elevation, with F II (Extract) maintaining the highest pre-cycling pH (4.71 ± 0.01) and a moderate post-cycling value (5.64 ± 0.02). This may reflect the influence of phytochemical constituents, such as polyphenols and flavonoids, which can interact with excipients and affect pH resilience.
Interestingly, nano-formulated variants (F I–F III Nano) showed smaller pH shifts, particularly F I (Nano), which changed from 4.89 ± 0.03 to 5.17 ± 0.02. This suggests that nanoencapsulation may enhance pH stability by protecting active compounds from environmental stressors and reducing their direct interaction with the gel matrix. Such findings align with previous reports indicating that nanoscale delivery systems can improve the physical stability of sunscreen gels, including pH, viscosity, and spreadability.
Overall, the results support the hypothesis that nanoformulation contributes to better pH retention under stress conditions, which is essential for maintaining product performance and minimizing skin irritation risk. These insights are valuable for optimizing sunscreen gel formulations intended for tropical climates with variable storage conditions [
60,
61,
62].
- -
Viscosity before and after cycling
Figure 6.
Cycling test data on viscosity before and after cycling of Blank, Extract and Nanoparticle Formulations.
Figure 6.
Cycling test data on viscosity before and after cycling of Blank, Extract and Nanoparticle Formulations.
Cycling refers to repeated stress or temperature exposure, simulating long-term storage or usage. Stability is inferred from changes in shear stress at fixed RPMs—smaller changes suggest better structural resilience.
Before Cycling:
Shear stress values at 5 RPM range from ~114,992 to 128,168 dyne/cm².
At 20 RPM, values reach up to ~196,445 dyne/cm², indicating strong resistance to flow under high shear.
After Cycling:
Shear stress at 5 RPM drops to ~98,222–114,992 dyne/cm².
At 20 RPM, values decrease to ~124,575–186,862 dyne/cm².
Interpretation:
Significant reduction in shear stress post-cycling, especially at low RPMs, suggests partial breakdown of gel matrix or reduced internal cohesion.
The drop is more pronounced in extract gels, indicating lower rheological stability under stress.
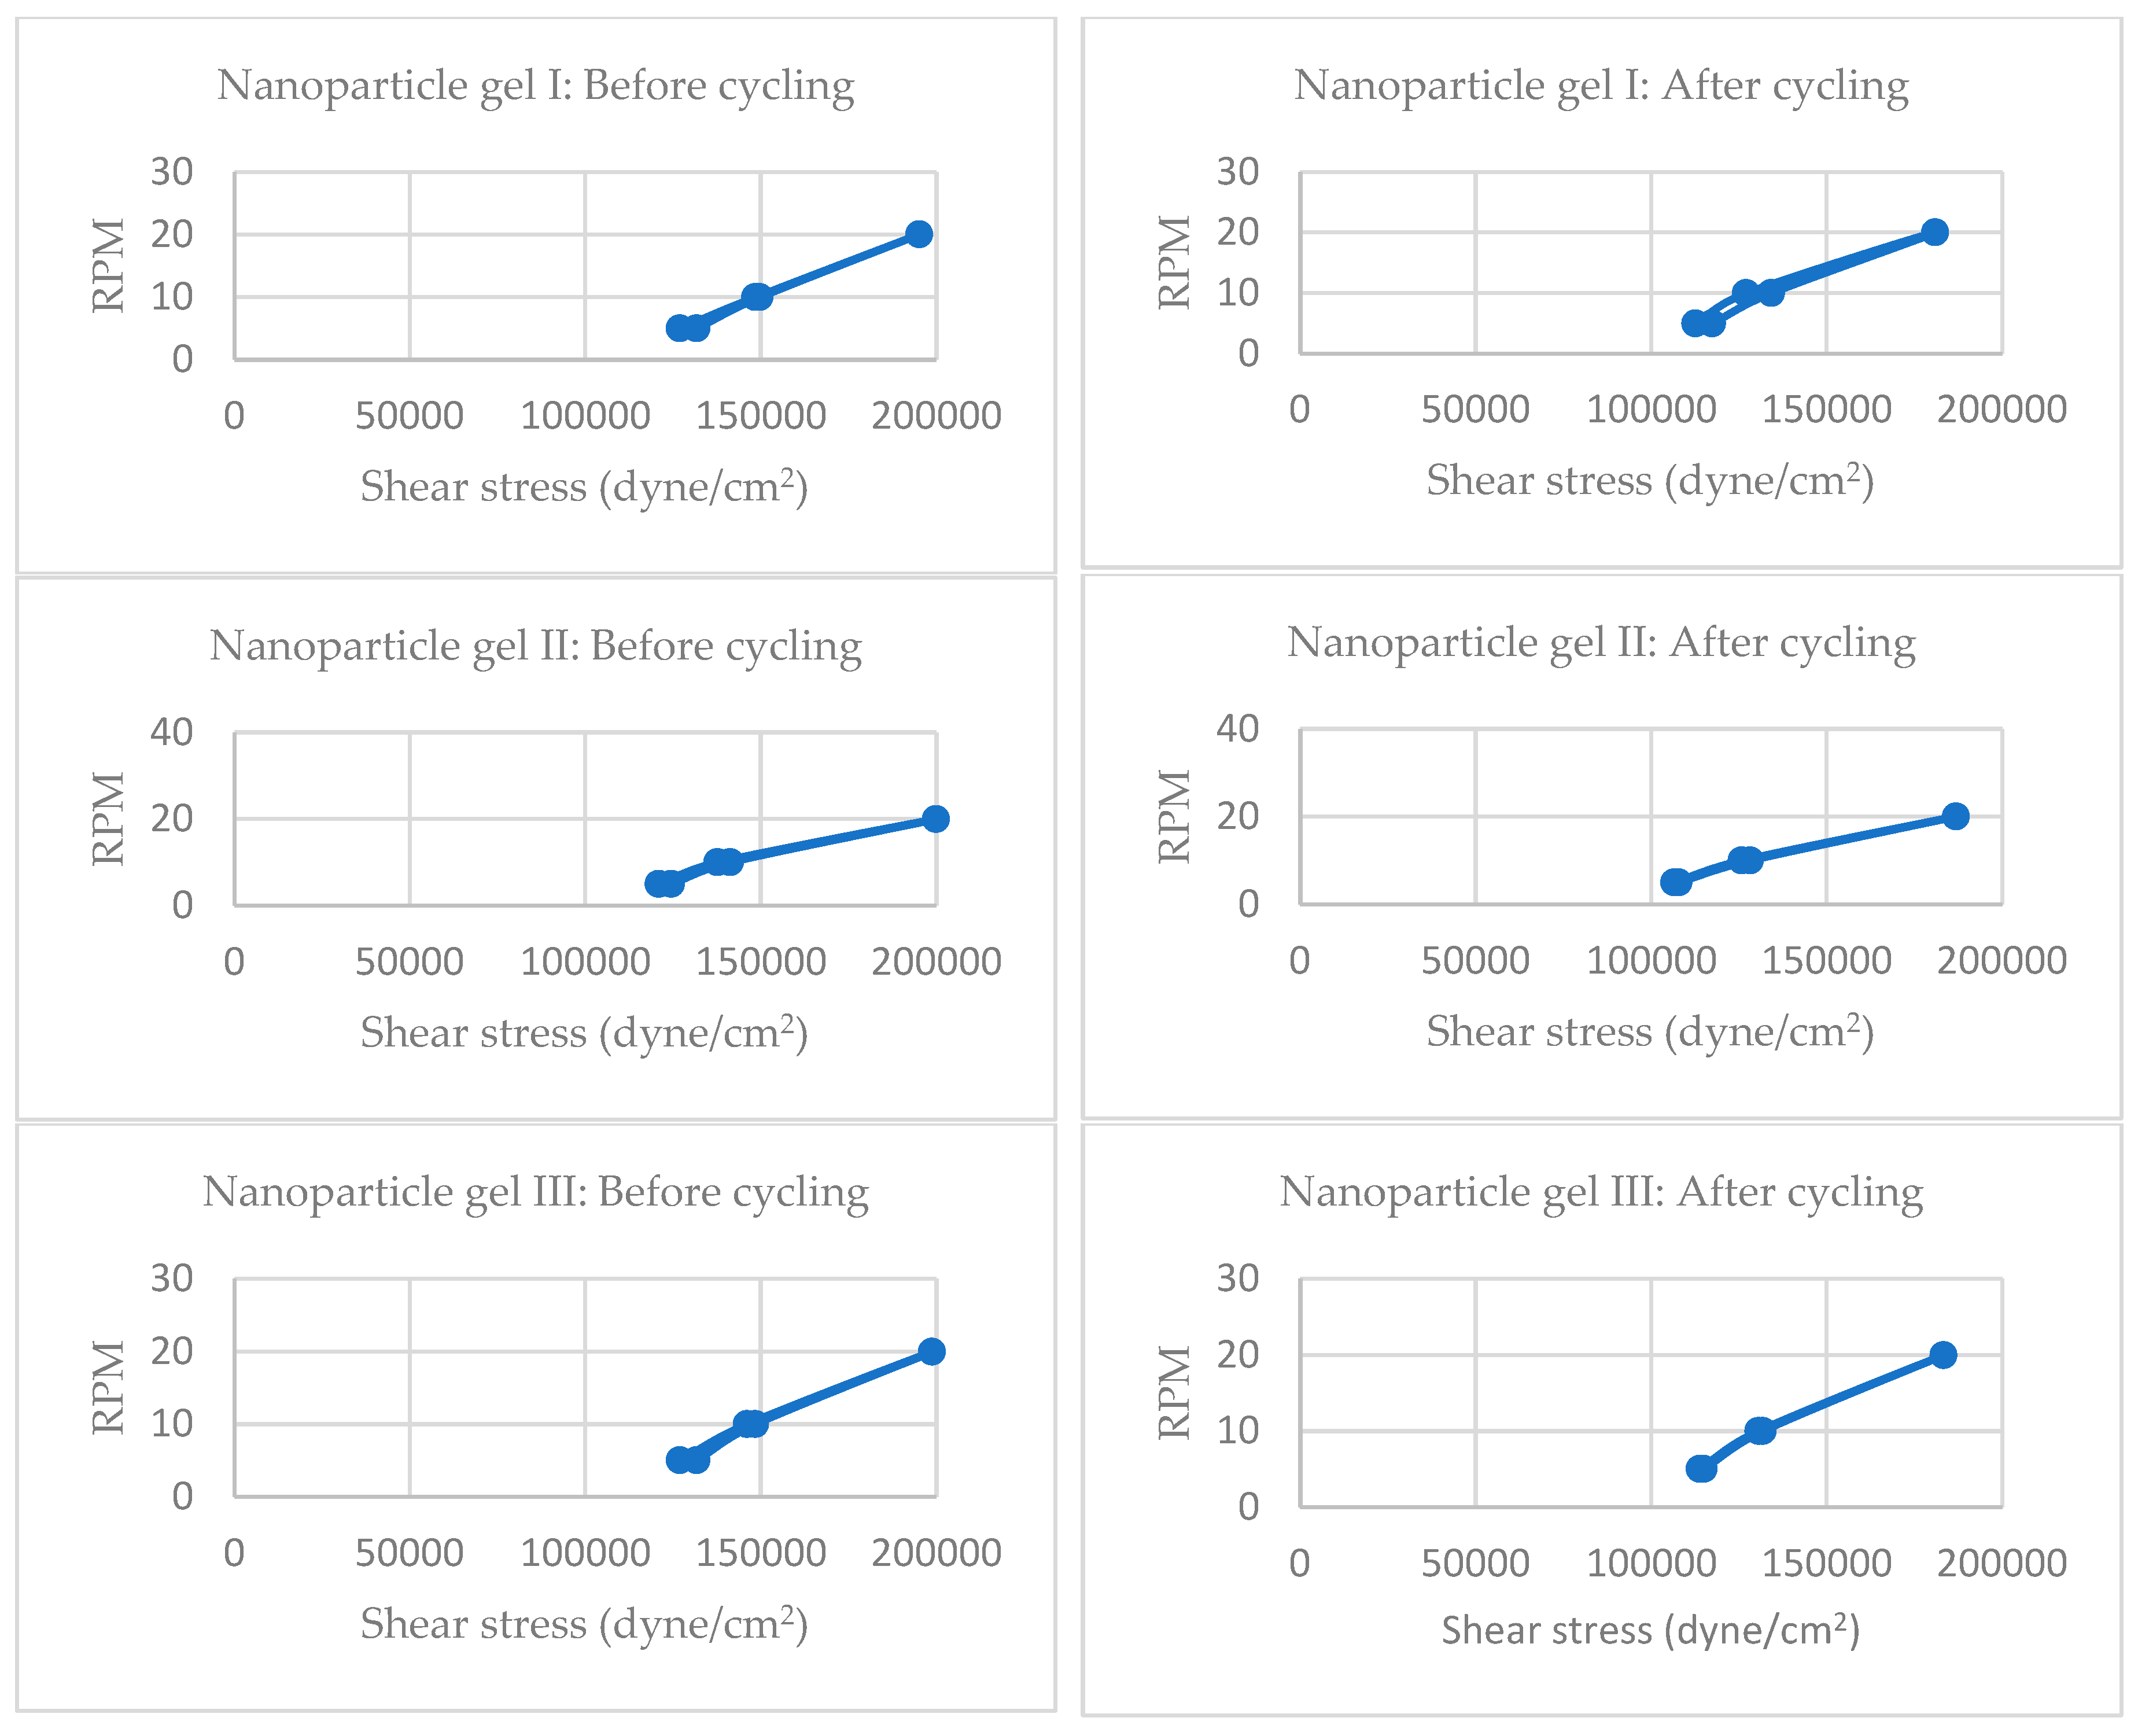
Nano Gel I Formulations
Before Cycling:
Shear stress at 5 RPM ranges from ~120,981 to 131,762 dyne/cm².
At 20 RPM, values reach ~195,247–200,004 dyne/cm².
After Cycling:
Shear stress at 5 RPM drops to ~106,607–117,388 dyne/cm².
At 20 RPM, values remain relatively high: ~180,873–186,862 dyne/cm².
Interpretation:
Moderate reduction in shear stress after cycling, but values remain higher than extract gels.
Indicates better structural retention, likely due to gelatin nanoparticle reinforcement and encapsulation effects.
Nano gels show enhanced resilience to mechanical stress, supporting their use in long-term topical applications.
Comparative Stability Summary
| Formulation |
Shear stress drop (5 RPM) |
Shear stress drop (20 RPM) |
Stability After Cycling |
| Extract Gel |
~10–20% |
~10–30% |
Moderate to Low |
| Nano Gel I |
~5–15% |
~5–10% |
High |
Nano gel formulations exhibit superior rheological stability compared to extract gels after cycling. This supports your hypothesis that nanoparticle incorporation enhances gel integrity, likely due to better polymeric network formation and reduced degradation under stress. [
63,
64]
- -
Spreadability
Table 15.
Spreadability test results of gel formulations (before and after cycling).
Table 15.
Spreadability test results of gel formulations (before and after cycling).
| Formula |
Diameter (cm) |
Spreadability (F) |
| Blank |
5.48 ± 0.01 |
23.57 ± 0.09 |
| F I (Extract) |
5.61 ± 0.01 |
24.68 ± 0.11 |
| F II (Extract) |
5.99 ± 0.01 |
28.12 ± 0.12 |
| F III (Extract) |
6.12 ± 0.01 |
29.35 ± 0.10 |
| F I (Nano) |
5.64 ± 0.02 |
24.97 ± 0.18 |
| F II (Nano) |
5.98 ± 0.02 |
28.09 ± 0.16 |
| F III (Nano) |
6.13 ± 0.02 |
29.47 ± 0.20 |
Spreadability reflects the ease of topical application and uniform distribution of gel on the skin. It is influenced by viscosity, polymer concentration, and structural integrity.
Blank gel shows the lowest spreadability (23.57 ± 0.09), serving as a baseline.
Extract gels (Formulas I–III) show increasing spreadability with higher extract concentration, peaking at Formula III (29.35 ± 0.10).
Nano gels (Formulas I–III) exhibit similar or slightly higher spreadability than their extract counterparts, with Formula III Nano reaching the highest value (29.47 ± 0.20).
Cycling did not significantly reduce spreadability, indicating good physical stability.
Nano formulations maintain or slightly improve spreadability, likely due to better dispersion and reduced particle aggregation.
These results align with rheological data showing nano gels retain shear stress better after cycling, confirming their superior structural resilience.
Based on the SPSS output using two-way ANOVA statistical analysis, the significance value (Sig.) for the normality test was 0.401 and for the homogeneity test was 0.945, both exceeding 0.05 and thus meeting the assumptions for parametric testing. The ANOVA test yielded a Sig. value of 0.931 (> 0.05), indicating that there is no significant interaction between the formula used and the storage conditions in determining the viscosity of the preparation. Therefore, the null hypothesis (H₀) is accepted, and the alternative hypothesis (H₁) is rejected. [
65,
66]
- -
Formulation SPF before and after cycling
SPF Determination of Sunscreen Gel Formulations:
The Sun Protection Factor (SPF) values of the sunscreen gel formulations were calculated using spectrophotometric absorbance data across UV wavelengths ranging from 290 to 320 nm. The SPF was determined using the Mansur equation: [
67]
CF is the correction factor (typically 10), EE × I represents the erythemal effect and solar intensity at each wavelength, and Abs is the absorbance of the sample.
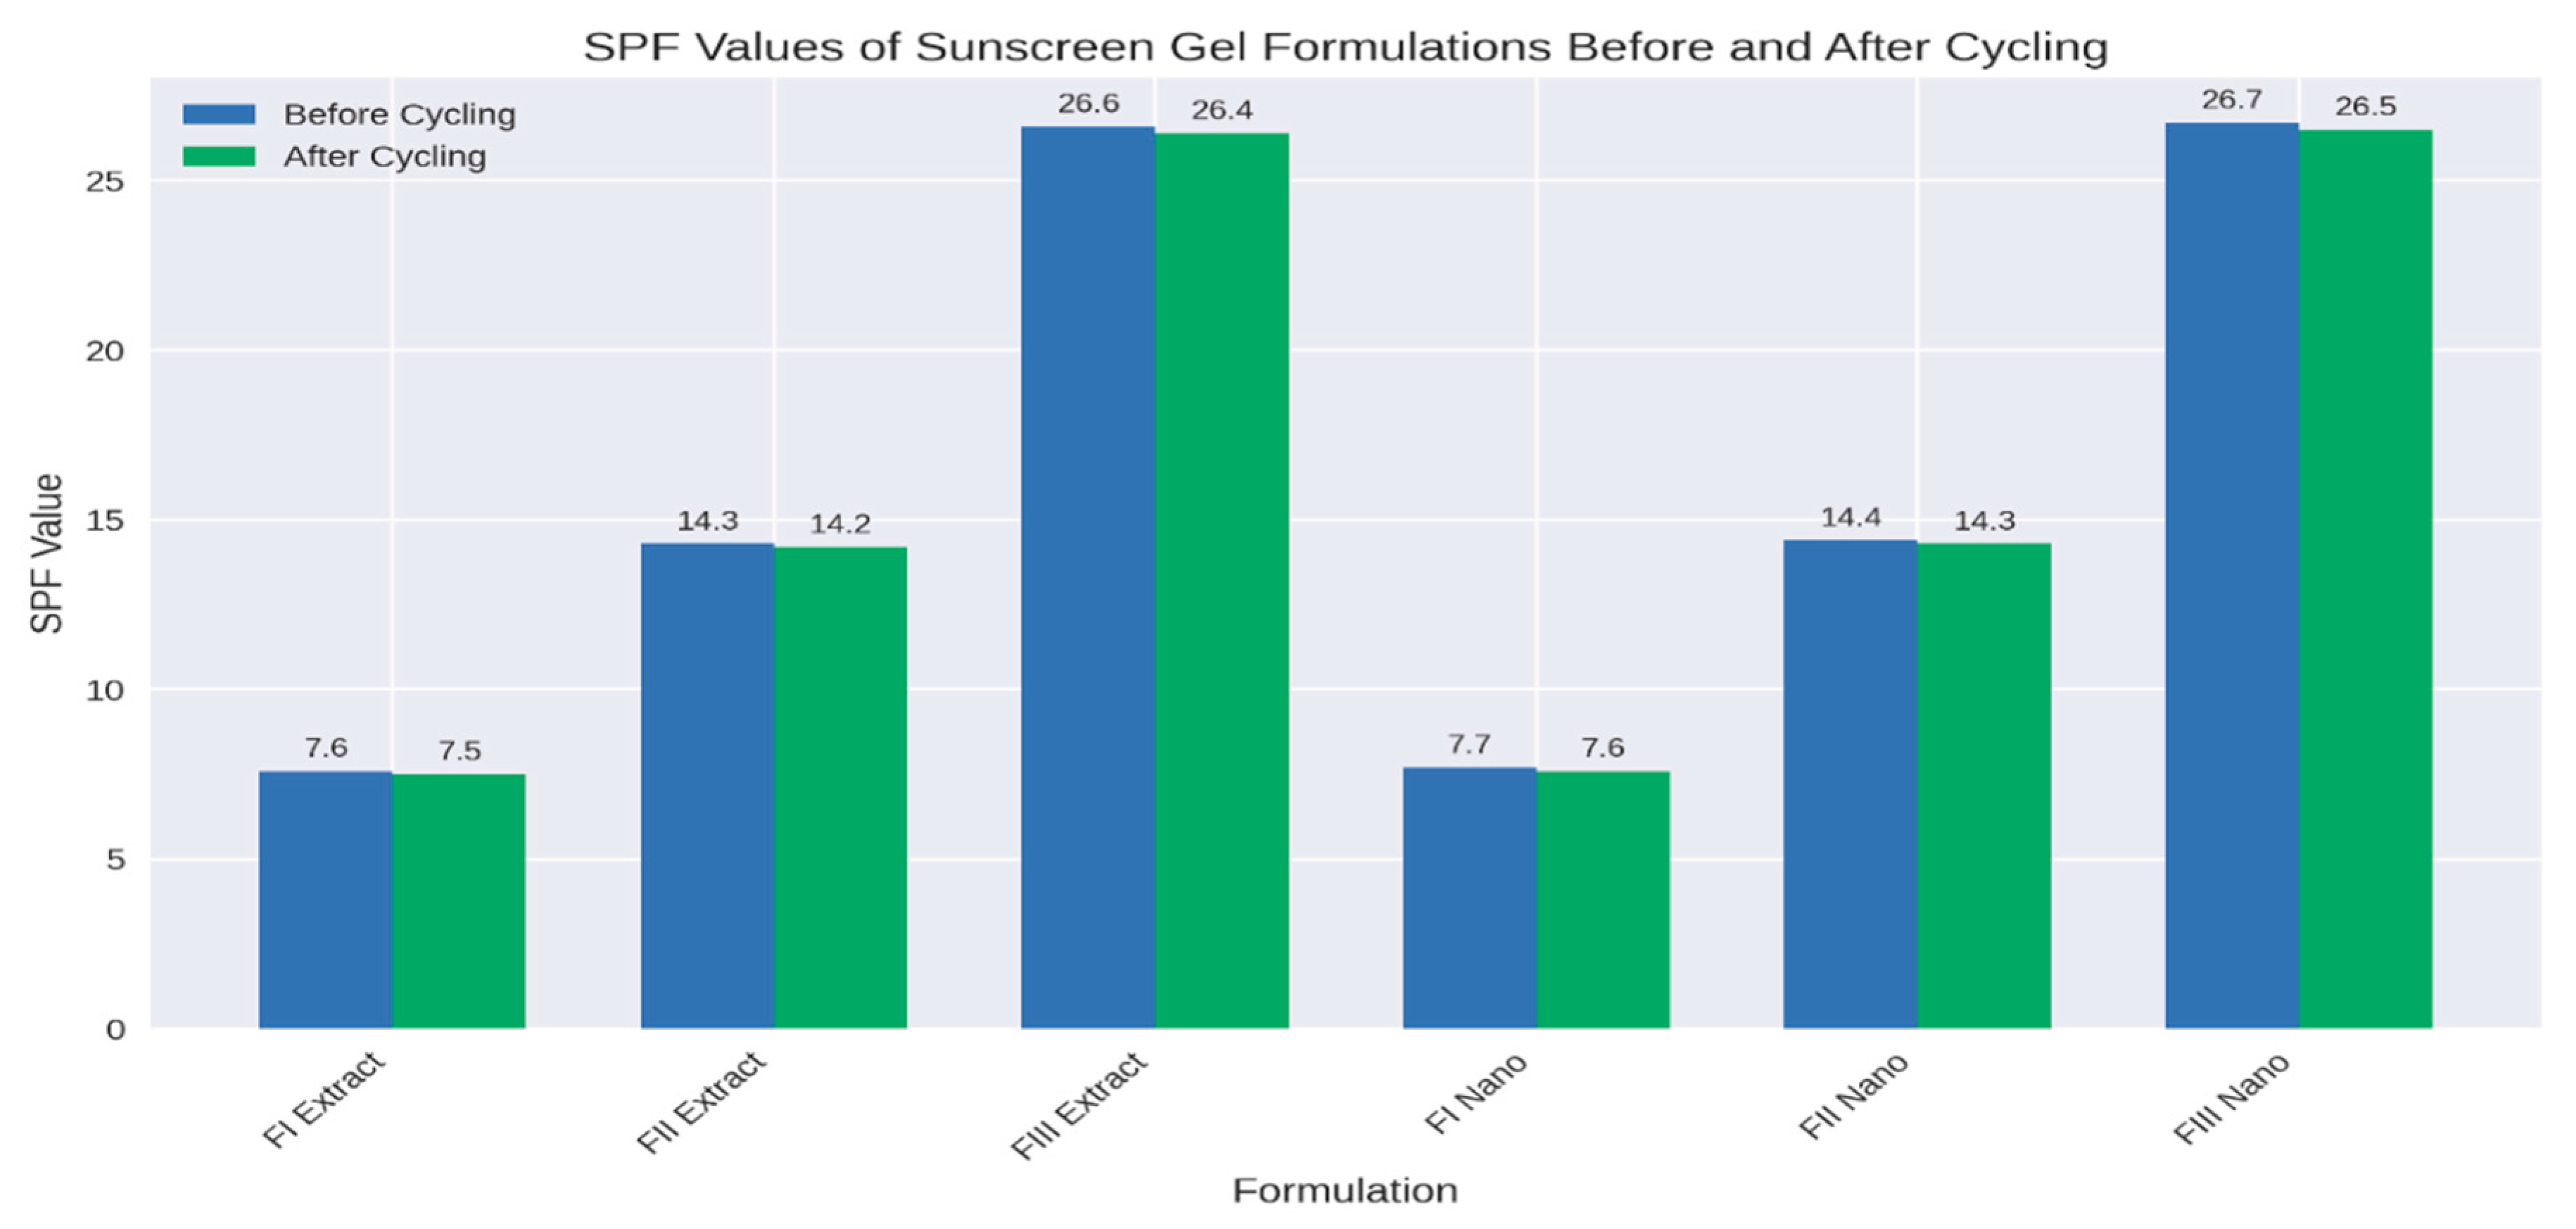
The grouped bar chart showed SPF values of extract and nano gels before and after cycling. It highlights how nano formulations consistently maintain slightly higher SPF values and better stability compared to extract gels:
Figure 7 shows clearly that while both systems are stable under cycling, nano gels outperform extract gels in SPF retention, especially at higher concentrations (Formula III). The bar chart compared SPF values of extract and nano gels before and after cycling. It clearly shows the stability advantage of the nano formulations:
Extract gels: FI (7.6 → 7.5), FII (14.3 → 14.2), FIII (26.6 → 26.4)
Nano gels: FI (7.7 → 7.6), FII (14.4 → 14.3), FIII (26.7 → 26.5)
Moreover, SPF values can be expressed as percentage of UV blocking to make them more intuitive. The general approximation is:
Low SPF (FI) blocks ~87% of UV radiation, suitable only for short exposure. Medium SPF (FII) blocks ~93%, offering moderate protection. High SPF (FIII) blocks ~96%, providing strong protection. Nano gels consistently show slightly higher % blocking compared to extract gels, confirming their enhanced photoprotective performance and stability after cycling. [
68,
69,
70]
Table 16.
Calculated % UV blocking.
Table 16.
Calculated % UV blocking.
| Formula |
SPF (Before) |
% Blocking (Before) |
SPF (After) |
% Blocking (After) |
| FI Extract |
7.6 |
86.8% |
7.5 |
86.7% |
| FII Extract |
14.3 |
93.0% |
14.2 |
92.9% |
| FIII Extract |
26.6 |
96.2% |
26.4 |
96.2% |
| FI Nano |
7.7 |
87.0% |
7.6 |
86.8% |
| FII Nano |
14.4 |
93.1% |
14.3 |
93.0% |
| FIII Nano |
26.7 |
96.3% |
26.5 |
96.2% |
- -
Antioxidant activity of formulations before and after cycling
Table 17.
Antioxidant activity of formulations before and after cycling.
Table 17.
Antioxidant activity of formulations before and after cycling.
| Formulations |
Before cycling |
After cycling |
| FI Extract |
52.78 + 0.13 |
52.76 + 0.59 |
| FII Extract |
49.30 + 0.05 |
48.14 + 0.38 |
| FIII Extract |
41.09 + 0.13 |
40.85 + 0.34 |
| FI Nano |
80.27 + 0.56 |
80.24 + 0.52 |
| F II Nano |
72.99 + 0.08 |
72.92 + 0.08 |
| F III Nano |
67.39 + 0.03 |
67.74 + 0.63 |
All formulations maintained strong antioxidant activity following thermal cycling, with minimal changes in IC₅₀ values, indicating robust stability of bioactive compounds under stress conditions.
Extract-based gels showed slight reductions in antioxidant potency post-cycling, particularly FII (↓1.16 ppm) and FIII (↓0.24 ppm), suggesting moderate sensitivity of polyphenolic constituents to thermal fluctuations. However, the changes remained within acceptable limits, with IC₅₀ values still below 100 ppm, confirming pharmacological relevance.
Nano-based gels demonstrated superior stability, with FI and FII showing negligible shifts (<0.1 ppm), and FIII even exhibiting a slight improvement (↑0.35 ppm), possibly due to enhanced dispersion or release kinetics post-cycling. The consistently low standard deviations (e.g., FII Nano: ±0.08) further underscore the reproducibility and robustness of the nanoparticle system.
These results affirm that
nanoparticle encapsulation enhances thermal resilience, preserving antioxidant efficacy during formulation stress. The findings support the suitability of nano-delivery systems for cosmeceutical applications requiring long-term stability. [
71]
- -
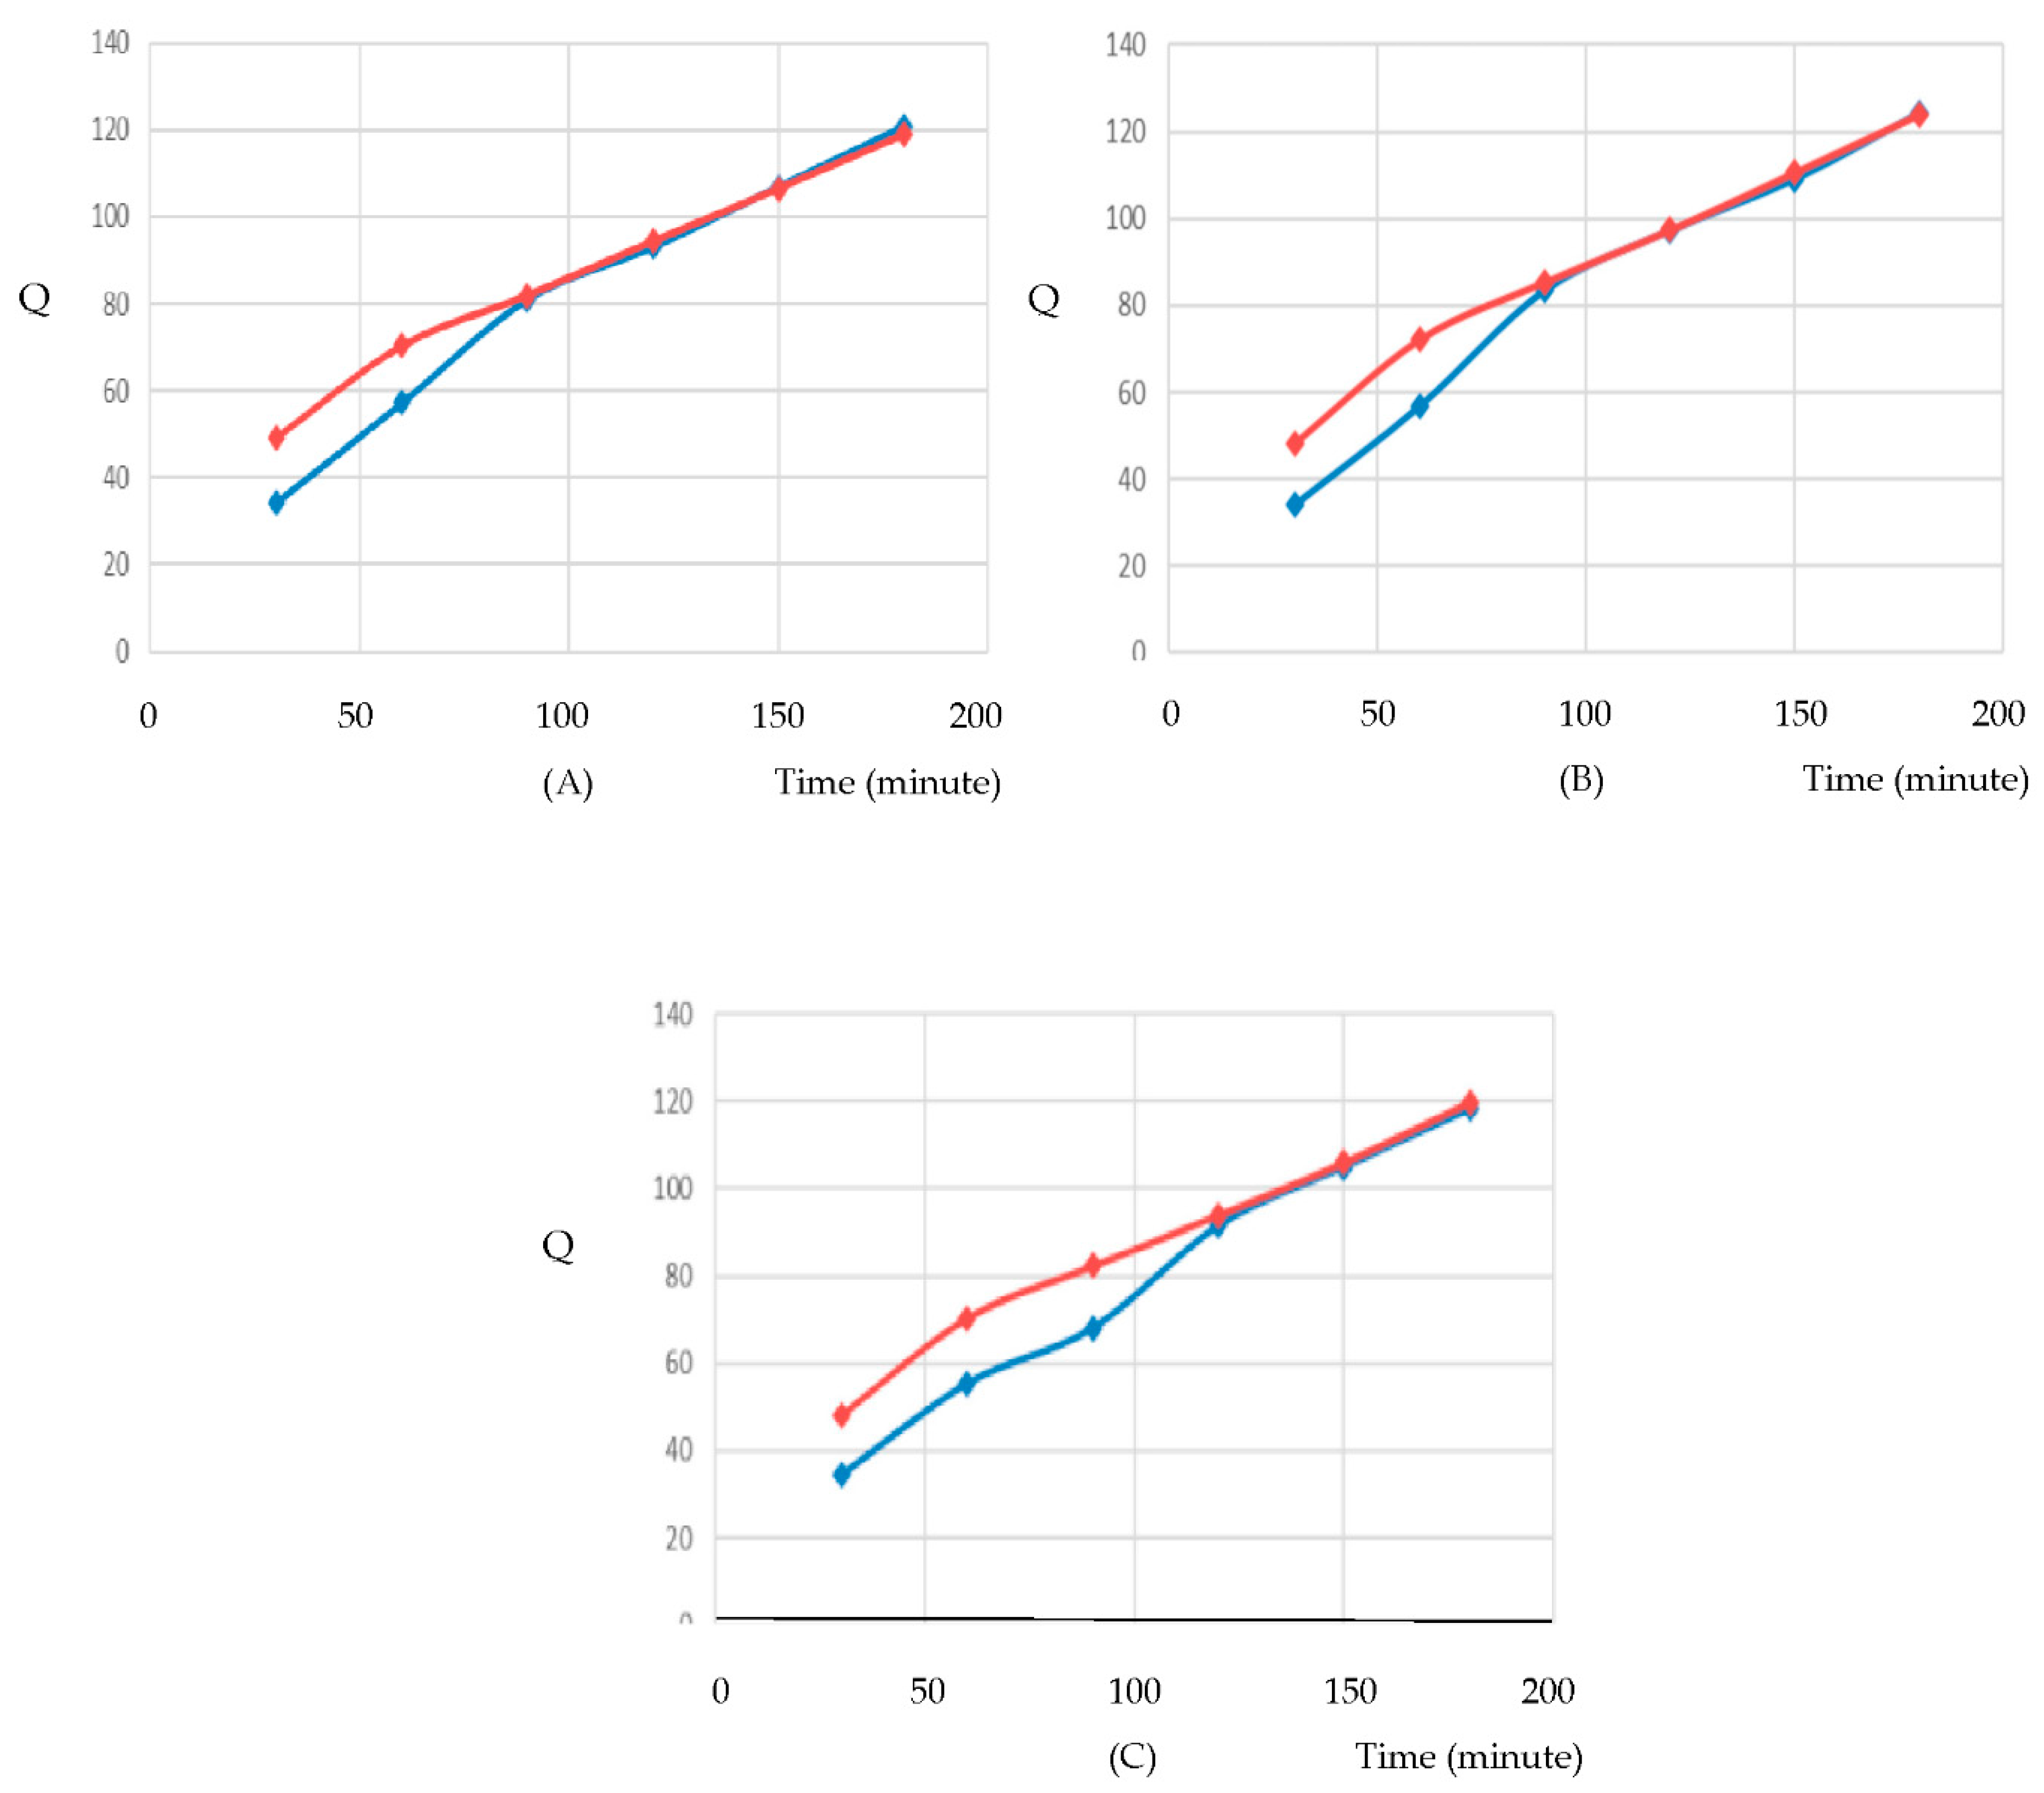
Franz Diffusion Profiles of Flavonoid Penetration
The Franz diffusion test was conducted to evaluate the transdermal penetration of flavonoids from extract and nanoparticle formulations of
Syzygium myrtifolium over time. The cumulative amount of flavonoid penetrated (Q) was measured at intervals up to 200 minutes using UV-VIS spectrophotometry. [
72]
Figure 8.
Relationship between time and Q for F I, F II, and F III.
Figure 8.
Relationship between time and Q for F I, F II, and F III.
-
F I:
Nanoparticle FI showed significantly higher penetration than Extract FI, with Q values reaching approximately 120 units at 180 minutes, compared to ~90 units for the extract. This suggests enhanced delivery due to nanoparticle encapsulation. [
72]
-
F II:
Similar trends were observed. Nanoparticle FII reached ~120 units, while Extract FII plateaued around ~100 units. The difference in slope indicates faster and more efficient diffusion from the nanoparticle system. [
72]
-
F III:
Nanoparticle FIII again outperformed Extract FIII, with Q values nearing 120 units versus ~100 units for the extract. The consistency across all formulas confirms the superior permeation profile of the nanoparticle formulations. [
72,
73]
Across all three formulas, nanoparticle systems consistently demonstrated:
These results validate the use of gelatin-based nanoparticles for enhancing skin delivery of flavonoid-rich botanical extracts, supporting their application in cosmeceutical formulations targeting antioxidant and photoprotective effects. [
72,
73]
The table below summarizes the results of Franz diffusion testing for three formulations (F I, F II, F III) in both extract and nanoparticle forms. Key parameters include flux (µg/cm²/h), permeability constant (cm/h), and diffusion coefficient (cm²/h).
Table 18.
Summary of Franz diffusion penetration test.
Table 18.
Summary of Franz diffusion penetration test.
| Parameter |
Flux (µg/cm²/h) |
Permeability Constant (cm/h) |
Diffusion Coefficient (cm²/h) |
| F1 (Nanoparticle) |
0.5633 |
0.1616 |
0.1092 |
| F2 (Nanoparticle) |
0.5904 |
0.0954 |
0.1145 |
| F3 (Nanoparticle) |
0.5633 |
0.0910 |
0.1092 |
| F1 (Extract) |
0.4451 |
0.0719 |
0.0863 |
| F2 (Extract) |
0.4827 |
0.0780 |
0.0936 |
| F3 (Extract) |
0.4527 |
0.0731 |
0.0878 |
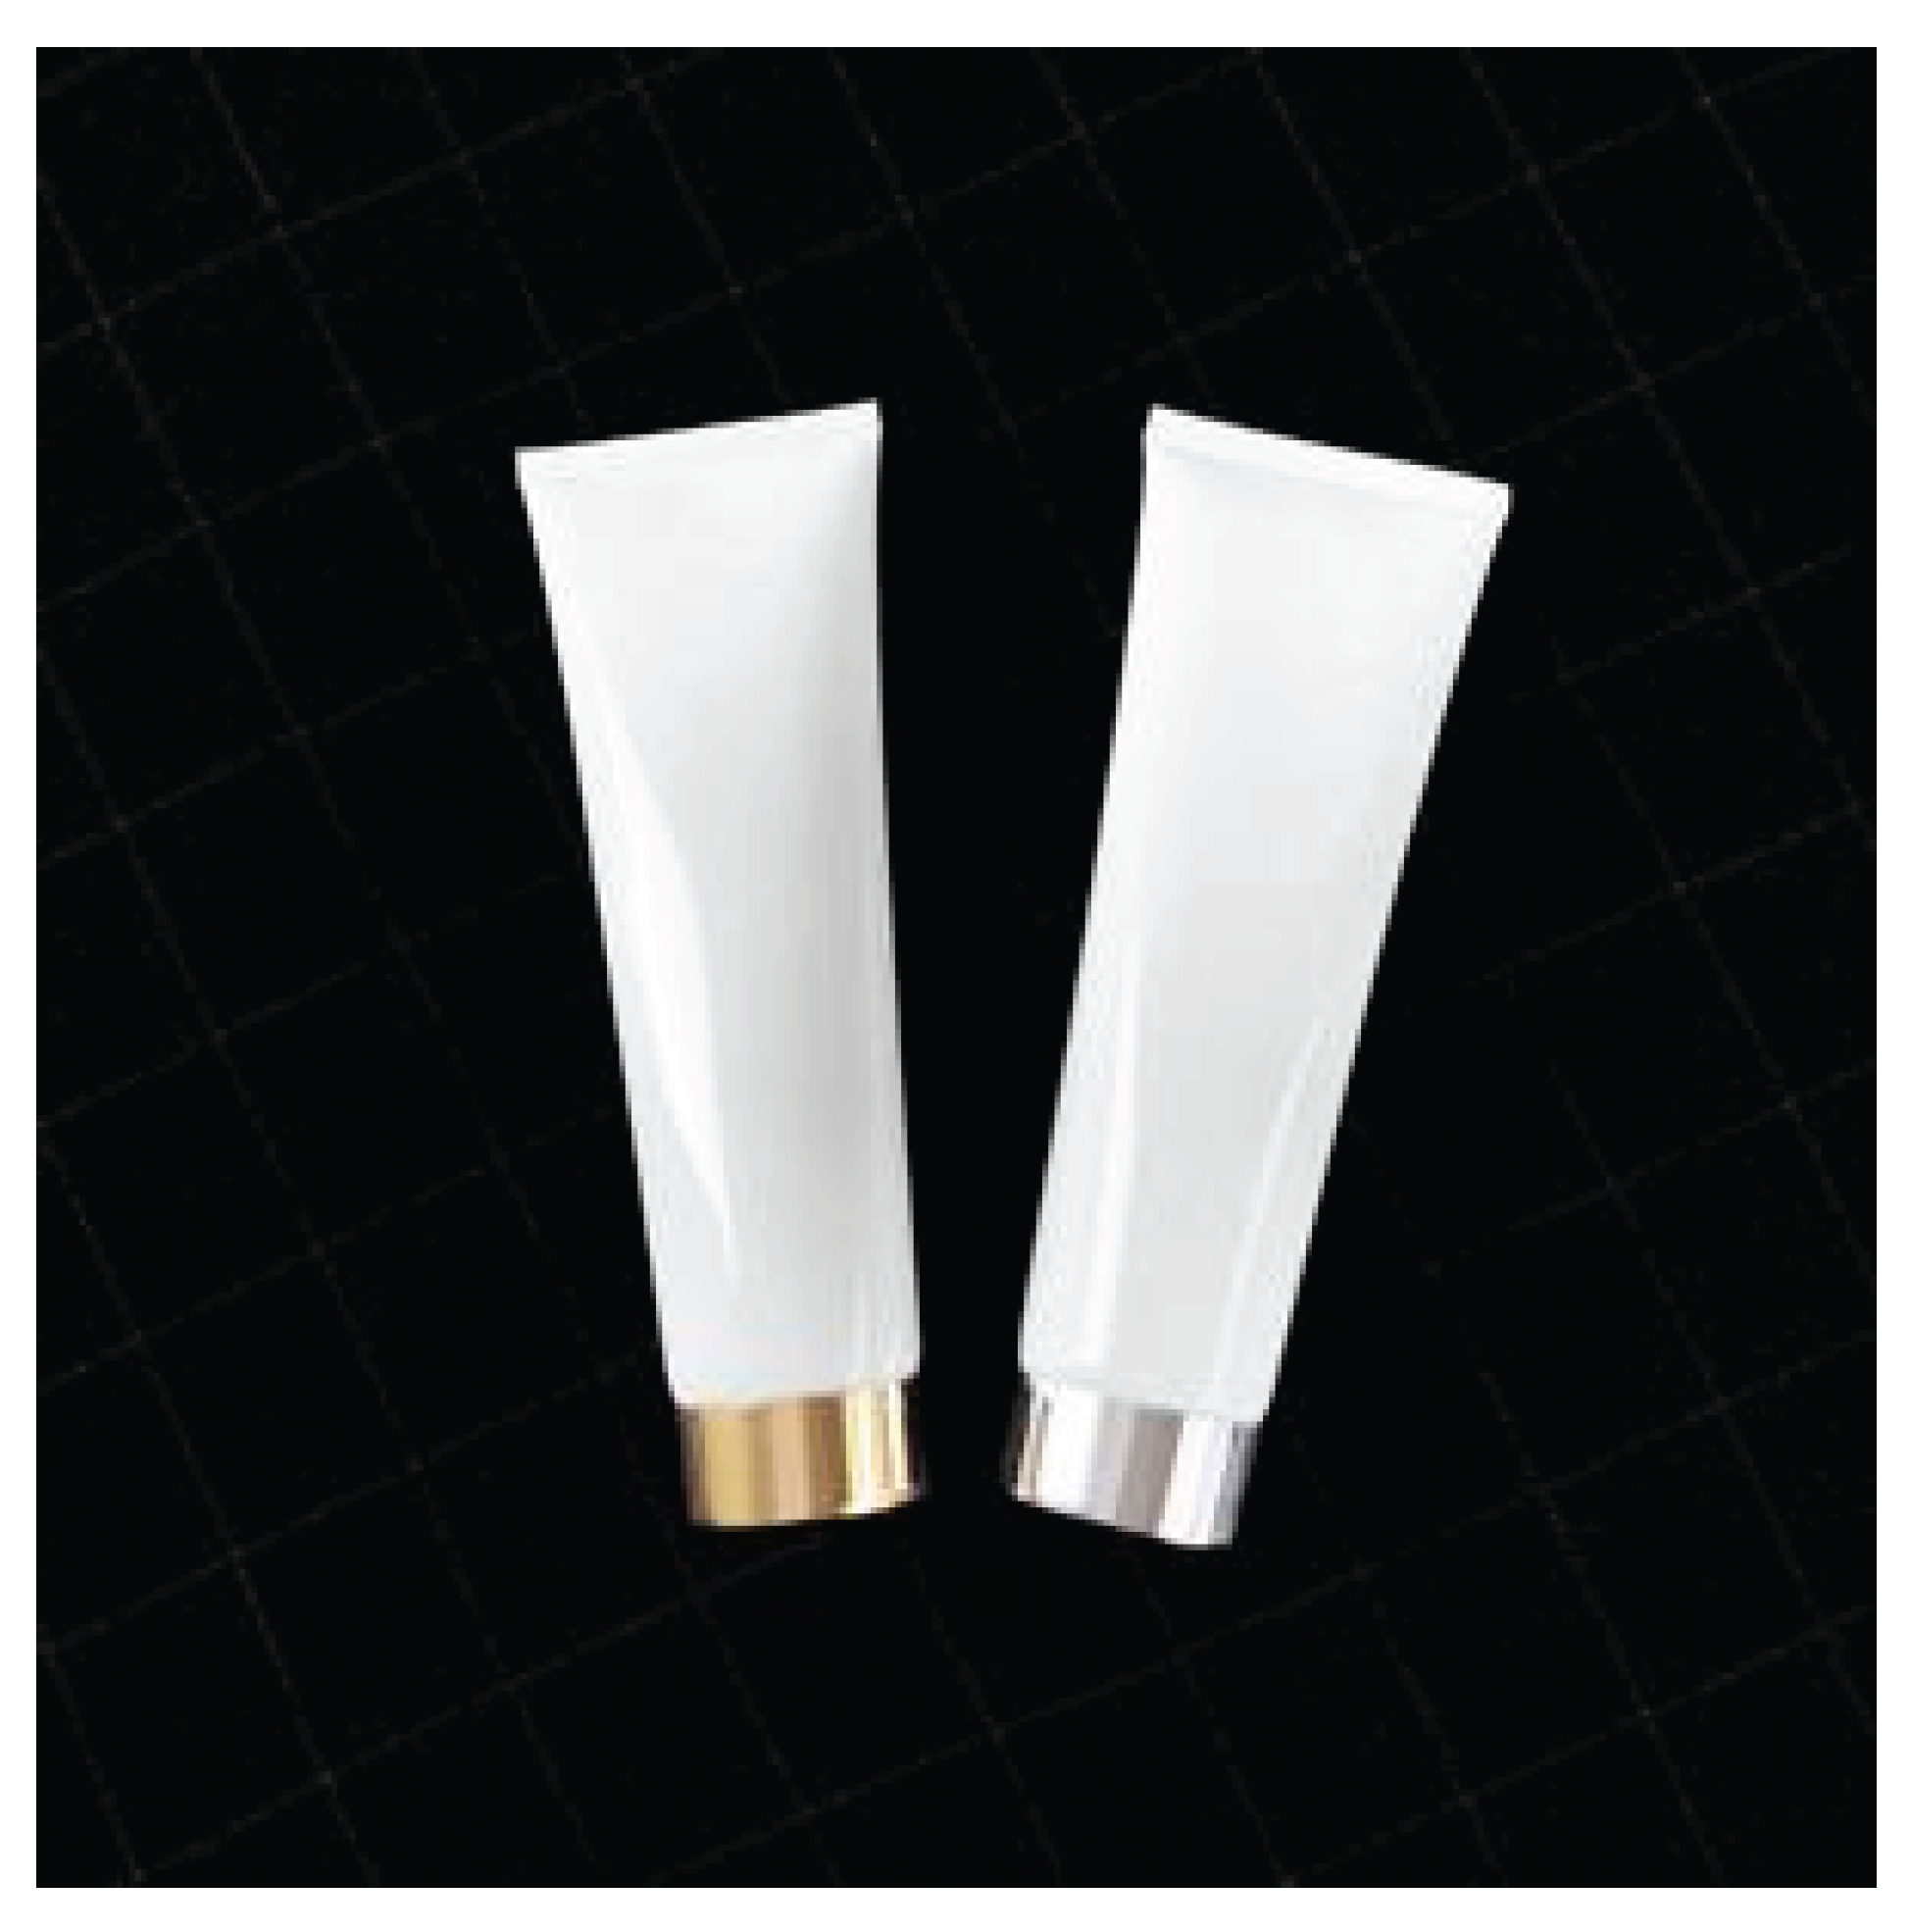
Figure 9.
Example of Syzygium myrtifolium sunscreen gels in HDPE tubes.
Figure 9.
Example of Syzygium myrtifolium sunscreen gels in HDPE tubes.