
Submitted:
22 December 2025
Posted:
23 December 2025
You are already at the latest version
Abstract
Pulsed electrolysis is a promising technology for the clean and sustainable generation of hydrogen. Research on electrode materials with similar geometries regarding their microscopic behavior in electrolysis at the solid-liquid interface is needed to improve the efficiency of this production process. This work compares zinc and stainless-steel electrodes using different electrolyte concentrations, employing both conventional and pulsed electrolysis. Parameters such as current and voltage curves, Tafel plots, efficiencies, solution resistances, and charge transfer resistance are compared. The findings highlight the duty cycle as a key operational parameter for modifying the electric double layer, demonstrating that optimized pulsed electrolysis can enhance efficiency without changing electrolyte concentration, and instead choosing the adequate chemical composition and surface roughness of the electrode material. Conclusions are drawn regarding the best electrode and the improvement techniques for corrosive electrodes.
Keywords:
electrode materials
; electrical double layer
; hydrogen
; electrolysis
1. Introduction
Hydrogen is a cornerstone of the ongoing energy transition, offering a carbon-neutral energy carrier for storage and industrial applications [1]. Alkaline water electrolysis (AWE) remains one of the most established technologies for hydrogen production due to its maturity, scalability, and ability to operate using non-precious metal electrodes [2]. However, conventional DC electrolysis suffers from efficiency limitations caused by activation, ohmic, and concentration overpotentials, as well as gas bubble formation at electrode surfaces.
Recent advances in pulsed electrolysis have demonstrated the potential to mitigate these losses by periodically interrupting the current, thus modifying interfacial conditions and improving mass transport [3]. The pulsed regime introduces dynamic charging and discharging of the Electrical Double Layer (EDL) at the electrode–electrolyte interface, a nanoscale region where ionic rearrangement governs charge transfer kinetics [4,5]. The behavior of this interfacial capacitance—dependent on electrolyte concentration, temperature, and potential—plays a crucial role in transient current response and overall efficiency.
In alkaline media such as KOH, the EDL is often modelled as a combination of a compact Stern layer and a diffuse Gouy–Chapman layer, forming a distributed capacitive system [6]. While the classical Gouy–Chapman–Stern (GCS) theory effectively describes steady-state capacitance, it does not fully capture the transient effects encountered under pulsed excitation. In pulsed DC electrolysis, the EDL is charged during the ON (ton) period and partially discharged during the OFF (toff) period, resulting in time-dependent potential relaxation and non-linear current behavior [3,7].
Electrode materials must possess certain properties that aid in their selection for efficient use [8]. These properties include current density, hydrogen production flux, electrical efficiency of hydrogen production, Tafel polarization curves, and corrosion properties. However, it is important to test electrode materials under realistic process conditions over a specific period [9].
This study presents an experimental evaluation of conventional and pulsed electrolysis for different concentrations and two types of electrodes (stainless steel and zinc). Voltage and current measurements for different electrolyte (KOH) concentrations were used to estimate the influence of the double layer and identify correlations with system performance. By interpreting the electrolysis cell as an equivalent circuit composed of the solution resistance (RS), charge transfer resistance (Rct), and electrical double layer capacitance (Cdl), this work establishes a bridge between electrical modelling and electrochemical phenomena. The objective is to explore an easily accessible electrode for efficient and optimized hydrogen production.
2. Methods
2.1. Conventional AWE
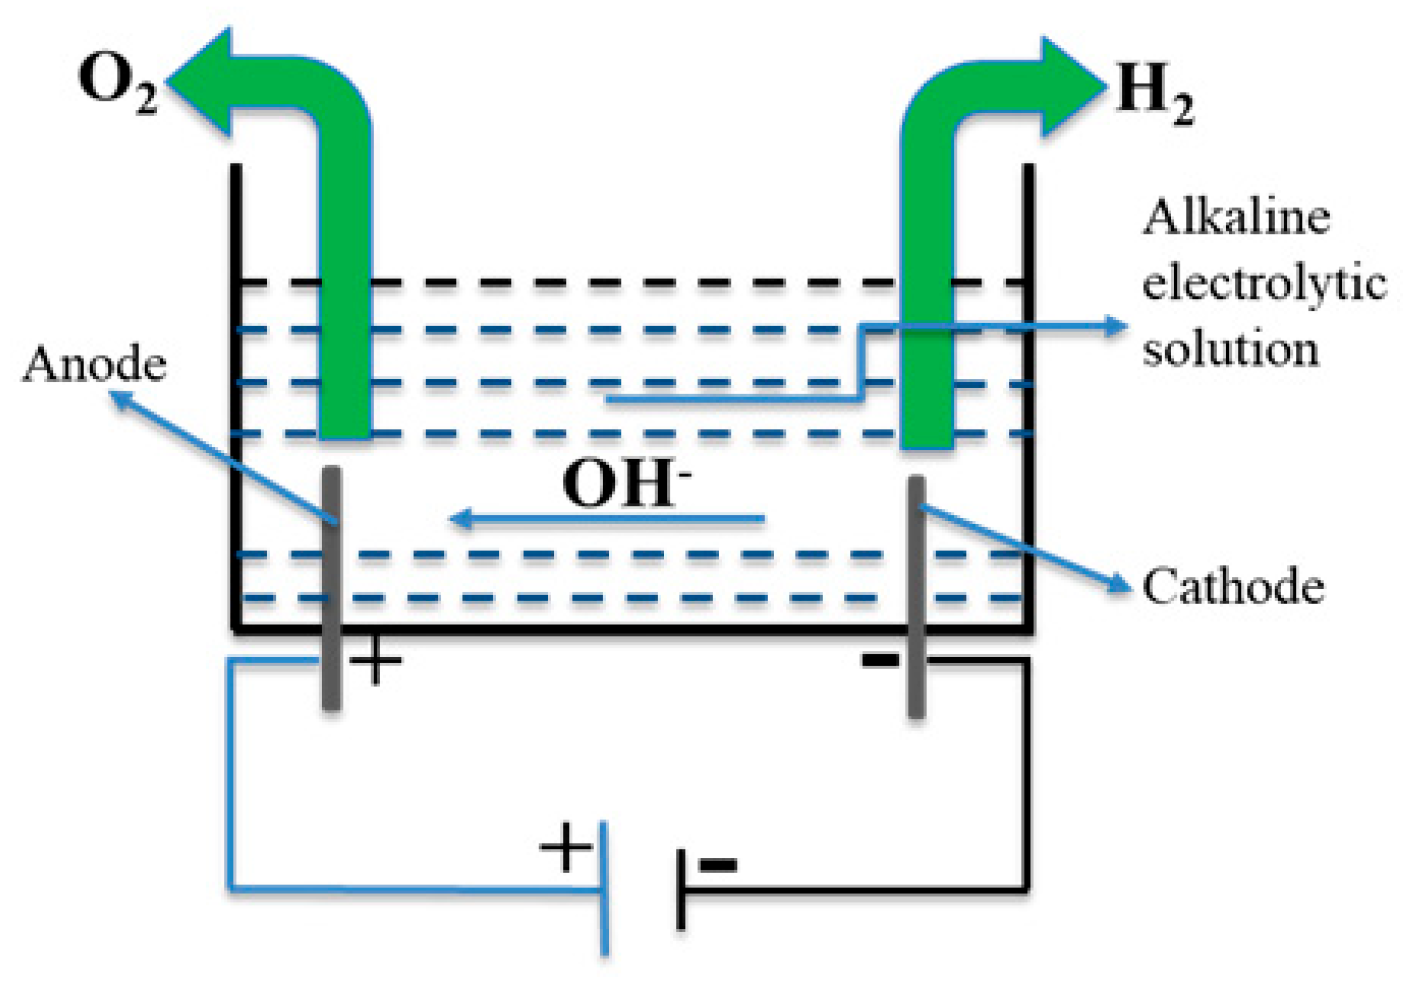
Alkaline electrolyzers are the most traditional and widely used for large-scale hydrogen production. The process occurs in an alkaline solution, usually aqueous potassium hydroxide (KOH) or sodium hydroxide (NaOH), which ensures good electrical conductivity [10].
At the cathode, water molecules are reduced to hydrogen (H2) and hydroxyl ions (OH⁻). Hydrogen leaves the cathode surface as gas, while OH⁻ ions move through the diaphragm to the anode, where water molecules are oxidized to oxygen (O2) and hydrogen atoms.
Typically, alkaline electrolyzers operate at 60–80 °C and 1–3 MPa, giving them durability and low cost. A very important aspect is integrating them with renewable energy, since their response to intermittent fluctuations is slower [11].
The figure below shows a simplified schematic of an alkaline electrolyzer.
Three types of electrolyzers are usually described in the literature: Alkaline, PEM (Proton Exchange Membrane) and SOEC (Solid Oxide Electrolyzer Cell) [12]. The alkaline electrolyzer was chosen because it has the following significant advantages over the others: commercial technology, the cheapest electrolysis option at the moment (no expensive metals), the large size of the stack and the production of ultra-pure hydrogen [13].
Conventional electrolysis is closely governed by Faraday’s law. This law states that the mass of a substance produced at an electrode is directly proportional to the amount of electric charge passing through the electrolytic cell [14].
where , in kg/s, is the mass flow rate, M is the molar mass of hydrogen (M = 2 g/mol), I is the applied current, z is the number of electrons transferred (z = 2) and F is the Faraday constant (F = 96485 C/mol).
The electrolysis of water requires a theoretical minimum electrical energy input of 237.23 kJ (Gibbs free energy). In turn, this energy produces a theoretical minimum voltage for the start of electrolysis (reversible voltage). Under normal conditions, the reversible cell voltage can be calculated using the following formula [15,16]:
To find the activation overpotentials of the anode and cathode, which are functions of the current density j, the Butler-Volmer equation (Equation (3)) is applied [17]:
where is the exchange current density in Acm-2 (which depends on the electrode material), R = 8.31 J/molK is the universal gas constant, T (K) is the absolute temperature, the constants α1 and α2 are the transfer coefficients, ƞ is the activation overvoltage (of the cathode or anode). If the transfer coefficients are assumed to be αA = 2 and αK = 0.5, then the following expressions are used to find the anode (ƞA) and cathode (ƞK) overvoltage [18]:
Several mathematical models, suggested by various authors, exist for determining the efficiency of electrolysis in the faradic regime [19,20,21]. In this work, one uses a practical model for determining the electrical efficiency of faradic electrolysis [22], Equation (7), where is chemical power in Watts (W), is the calorific value of hydrogen , is the electrical power in Watts (W), U is the voltage applied to the electrolyzer in Volts (V) and I is the current intensity in Amperes (A).
2.2. Electrical Double Layer and Pulsed AWE
To better understand pulsed electrolysis, it is necessary to understand the electrical double layer (EDL), formed at the interface between different phases. A double layer is a contact phenomenon where two different molecular structures meet, and a rearrangement occurs in the transition zone. It occurs at the contact boundary between two phases, one or both of which may be solid, liquid, or gas. The double layer, therefore, extends only to the electrolyte side and not to the metal side [23]. The charge separation in the double layer can be compared to parallel plates in a capacitor, as was done by Helmholtz.
The structural scheme of the Helmholtz model is like that of conventional (dielectric) capacitors, where two parallel planar electrodes are separated by a dielectric [24]. This Helmholtz model was modified by Gouy in 1910 [25] and Chapman in 1913 [26], respectively, to account for the mobile ions in the solvent electrolyte. According to Figure 2b, instead of ions being packed close to the electrode surface, ions with opposite signs to the electrode are distributed in a region with a thickness much greater than d. In 1924 [27], Stern combined the Helmholtz model with the Gouy-Chapman (GC) model to explicitly account for two distinct charge regions, namely, the Stern layer and the diffuse layer, as shown in Figure 2c. The Gouy-Chapman-Stern (GCS) EDL theory was widely adopted in the development of static EDLs [24].
The static Gouy-Chapman-Stern (GCS) model can be represented as an association of two capacitors in series.
In Figure 3, CS (in Fm-2) is the Stern capacitance, CD (in Fm-2) is the capacitance of the diffuse layer, and ψ is the potential of the entire EDL. The equivalent capacitance of two capacitors in series is:
where is the relative electrical permittivity of the medium, is the electrical permittivity of a vacuum ( = 8,85.10-12 Fm-1), d is the double layer distance described by the Helmholtz model, z is the number of electrons transferred (z = 2), is the elemental charge ( = 1,6.10-19 C), is Avogadro’s number ( = 6,022.1023 mol-1) , is the molar concentration of the electrolyte in the bulk (mL-1), is the Debye length, is the electric potential in the diffuse layer, T is the absolute temperature (in K), is the Boltzmann constant (= 1,38.10-23 JK-1).
By relating equations (10) and (11), CD is directly proportional to the square root of concentration.
If we consider pulsed electrolysis, there are resonance frequencies at which diffusion phenomena and double-layer effects are minimal [28]. This is possible because the electrolyzer is powered by a pulsating electric field that generates a specific pulsed waveform [3] (in our case, PWM, square wave).
Considering the concepts of electrical double layers, the electrical circuit below is based on the Randles model [29].
In Figure 4, RS is the resistance of the electrolytic solution, Rct is the charge transfer resistance, ZW is called the Walburg element and is calculated as , where is the Warburg coefficient, is the imaginary unit , and is the angular frequency () [29].
This work utilized stainless steel (class A4) and zinc (class 8.8) electrodes with a smooth, compact, and low-roughness surface [30,31], so diffusion effects are greatly reduced. In such cases, the system response is mainly governed by charge transfer resistance and double-layer capacitance, while the Warburg impedance, related to semi-infinite diffusion, becomes negligible [32,33]. Thus, Figure 4 will have the following configuration:
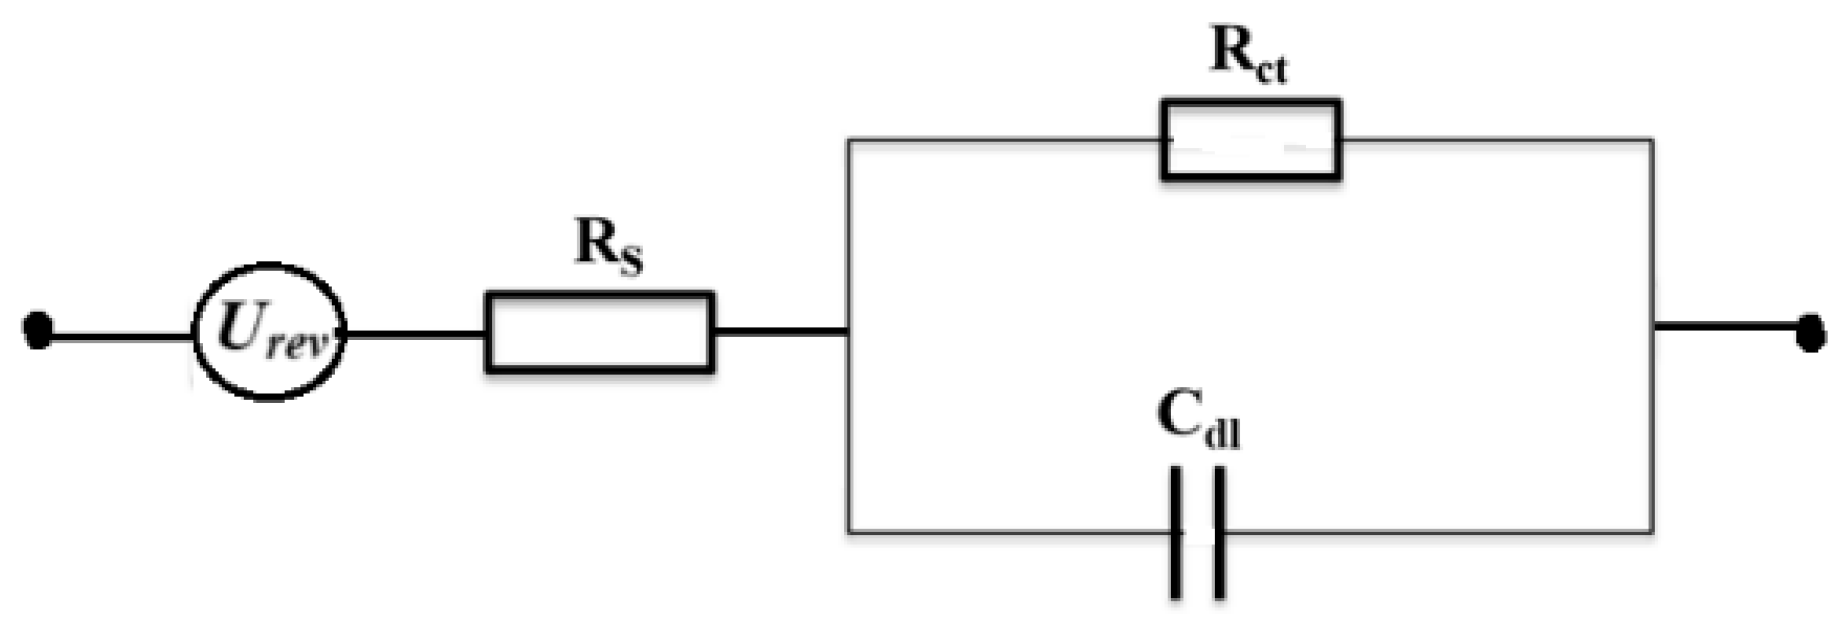
Figure 5.
Simplified electrical circuit in the Randles model.
The equivalent impedance of this combination is:
RS can be determined by making a linear approximation to the I-U curve (experimentally using Ohm’s law), Equation (14) or also by using the dimensions of the electrodes and the properties of the electrolytic solution, Equation (15), where d is half distance between electrodes, A is are of electrode (same dimensions) and is the conductivity of the electrolytic solution.
According to the Nyquist criteria, RS is determined by the left edge of the semicircle, and Rct corresponds to the diameter of the semicircle [34].
For small changes in potential from equilibrium (linearization of the Butler–Volmer equation [17]), Equation (3), the relationship between charge transfer resistance and exchange current density () is given by Equation (16) [35].
The value of can be obtained by fitting the experimental Tafel polarization curve:
There are two types of pulsed electrolysis: DC pulsed electrolysis and AC pulsed electrolysis. However, this paper focuses only on DC pulsed electrolysis, since AC pulsed electrolysis involves alternating polarity, difficult frequency control, and remains underexplored, requiring further investigation [36].
Currently, two types of pulsed DC electrolysis are studied: voltage pulses and current pulses [37]. In the first, the voltage is changed from a base value (called off-voltage) to a peak value (called on-voltage). The sum of the on-time (ton) and off-time (toff) is the pulse period. The quotient of the on-time and the pulse period is defined as the duty cycle , and the frequency is the inverse of the pulse period. The pulse amplitude is the difference between the off-voltage and the on-voltage. The resulting current will be the sum of a faradic current (IF, if the peak current is in a potential range in which water electrolysis occurs) and a capacitive current (INF, non-faradic) for charging/discharging the double layer [36,38].
The pulse operation sequence is displayed in Figure 6.
It is important to mention that when we use voltage pulse (UPulse) in electrolysis for its characterization, it can be applied by altering parameters such as level, amplitude, and duty cycle of the operating point of the pulsed waveform through the practical definition of pulse-width modulation (PWM).
To determine the efficiency of pulsed electrolysis, according to the model proposed in this work, it is necessary to determine the pulsed power. The pulsed power is determined using fast Fourier transforms (FFTs) [39], since it is a periodic signal in the time domain (Figure 7).
Puranen et al. [39] reports that the active power of the source characterizes the rate of energy conversion, including heat, in electrical systems over a given period. Since current and voltage are periodic signals and multiple operations are performed, the average pulsed active power is determined by the expression Equation (20):.
where and are the average voltage and current values, and are the magnitudes of the voltage and current at harmonic n, and are the magnitudes of the phases of the voltage and current at harmonic n.
For a pulsed signal, the ratio between the average value and the RMS value of a square wave is [40,41,42]:
Thus, Equation (20) takes the form:
The mass flow rate for pulsed electrolysis was determined considering the value of :
It can be said that one of the main advantages of DC pulsed electrolysis is the ability to improve the energy efficiency of hydrogen production. High-intensity pulses followed by relaxation periods allow for better water dissociation, thereby reducing energy consumption [43]. However, precise control of pulse timing and intensity is crucial to optimizing the process. Moreover, a thorough study of electrode material corrosion under current pulses is necessary, as the on/off cycling can increase component wear [44].
3. Experimental
To clarify the objectives of this work, Figure 8 shows the experimental setup used for conventional and pulsed electrolysis.
Current and voltage measurements were taken for each concentration of KOH (potassium hydroxide) dissolved in one liter of demineralized water: 0.25 mol/L, 0.30 mol/L, 0.35 mol/L, and 0.40 mol/L. These measurements were carried out for both types of electrolysis and for both types of electrodes: stainless steel (class A4) and zinc (class 8.8). The experiment was conducted in an environment with a temperature of 20 ºC.
First, in pulsed electrolysis, a constant duty cycle was maintained, and current and voltage measurements were taken. Secondly, a certain concentration was maintained while the duty cycle was varied.
The electrodes (stainless steel and zinc) had the same hexagonal geometry (on the top and bottom surfaces) and rectangular on the sides (thickness), whose area was determined by Equation (25), where = 3 mm = 0,3 cm and = 5 mm = 0,5 cm.
Substituting the values of and into Equation (25), the area came out to 1.55 cm². This value was used to determine the current densities, exchange current (for determining Rct).
For pulse electrolysis, an HP 214B pulse generator was used, which employs semiconductor technology to generate power pulses with a repetition rate of up to 10 MHz. This pulse generator provides 100 V pulses with a rise time of 15 ns. It has the following output characteristics: Amplitude from 0.3 V to 100 V in 5 ranges, fixed source impedance of 50 Ω nominal in ranges up to 10 V, polarity can be positive or negative depending on the selection, pulse-top disturbances of ≤±5% of the amplitude, operating temperature from 0 ºC to 55 ºC, power supply of 100/120/220/240 V rms; +5%, -10%, 48 to 66 Hz, maximum 360 VA.
4. Results and Discussions
4.1. Conventional and Pulsed Electrolysis for Different Concentrations
As can be seen in Figure 9, the same voltage range was used. For conventional electrolysis, the currents were higher than in pulsed electrolysis with a constant β of 67.53%. This shows that when comparing pulsed electrolysis with conventional electrolysis, for certain values of the duty cycle (β), energy consumption is higher in conventional electrolysis, which reduces the efficiency of the electrolysis process. Also in Figure 9, it can be observed that the increase in current is directly proportional to the increase in the concentration of the KOH solution. The higher the concentration, the higher the current. This occurs because, as the concentration increases, the speed of electrons in the solution increases, the mobility time decreases, and the solution’s resistance decreases, practically following Ohm’s law.
Experience has shown that using zinc electrodes, within the same voltage range, the currents were lower compared to stainless steel electrodes. This is because corrosion is more effective in zinc, thereby causing a low current (and clearly low current density).
In Table 1, Rct is obtained from the linearization of Butler–Volmer using the small overpotential region (first points of positive current). RS is obtained from a linear fit of the highest current points (last 3 points). Figure 10 shows the Tafel plots that served as the basis for the results in Table 1.
In Figure 10, the η vs j graph (overpotential vs current density) describes the overall performance of electrolysis, including: electrochemical activation regime, ohmic contribution (Rs), and the possible onset of mass transport limitation. In this context, it is observed that higher KOH concentration results in lower η for the same j and downward-shifted curves. This is because there is an increase in ionic conductivity, a reduction in solution resistance (Rs), and greater availability of OH⁻ for the hydrogen evolution reaction (HER). Thus, increasing the electrolyte concentration reduces ohmic losses and improves electrochemical efficiency.
For the same concentration and electrode, pulsed electrolysis shows a lower η across the entire range of j. This may indicate a reduction in polarization, better renewal of the electrode–electrolyte interface, and possibly more efficient removal of H2 bubbles. This emphasizes the fact that the pulsed regime favors more efficient kinetic and interfacial conditions, reducing energy losses.
The experimental results showed that zinc tends to exhibit lower η at low j, and steeper curves at high j. Meanwhile, stainless steel showed greater stability and better performance at higher current regimes. These differences reflect the characteristics of each material.
In Figure 10c,d, the Tafel plots (η vs log j) revealed a systematic decrease in the Tafel slope and a significant increase in the exchange current density when pulsed electrolysis was used. This indicates enhanced charge transfer kinetics and higher electrochemical activity, attributed to the periodic renewal of the interface and the reduction of bubble coverage on the electrode surface.
As we can see in Table 1, conventional electrolysis shows lower solution resistance (RS), higher charge transfer resistance (Rct), and low exchange currents. Firstly, as the KOH concentration increases, the ionic conductivity of the solution also increases (more OH⁻ and K⁺ ions per volume), which reduces RS and promotes ionic transport between the electrodes, decreasing ohmic losses and allowing the actual current to approach the exchange current density [45] . Secondly, for stainless steel electrodes, electrochemical behavior (and thus the surface activation for hydrogen evolution reactions (HER)) strongly depends on the composition of the surface film, which can change according to the KOH concentration [46]. As can be seen in the same Table 1, in conventional electrolysis, zinc exhibits a higher exchange current because its metallic surface has more favorable electron transfer kinetics for hydrogen evolution, but it suffers from severe corrosion and passivation [47]. In pulsed electrolysis, however, stainless steel gains an advantage: the pulses reduce bubbles and charge resistances, activate catalytic sites, and prevent passivation, increasing the apparent I0 [48]. The Rct of zinc is higher than that of stainless steel in pulsed electrolysis. For this reason, in pulsed electrolysis, stainless steel electrodes have essentially been chosen.
This trend, of the increase in current density, reflects a higher intrinsic reaction rate at the electrode/solution interface due to the combination of greater availability of ions and higher surface catalytic activity, is consistent with the Butler-Volmer equation, which relates j0 to Rct, and with studies on stainless steel electrodes in alkaline solutions, showing that high concentrations of KOH reduce kinetic and ohmic barriers, increasing the efficiency of the electrolysis in question. [49].
These results led us to analyses other parameters to further compare the two electrodes. The chosen element was energy efficiency. Figure 11 presents these results.
As seen in Figure 11, for both stainless steel and zinc electrodes, the efficiency decreases monotonically with increasing current, regardless of the electrolyte concentration. This behavior indicates that efficiency losses are mainly determined by current-dependent phenomena, such as ohmic losses, gas bubble coverage, and mass transport limitations, rather than by the electrolyte concentration or the electrode material under conventional electrolysis conditions. It can also be added that these identical efficiency values observed suggest that, within the investigated current range, the overall system efficiency is dominated by resistive and transport effects at the cell level.
It is added that in pulsed electrolysis, both stainless steel and zinc electrodes show a decreasing efficiency with increasing current, in a similar manner to conventional electrolysis. The overlapping of efficiency values at different concentrations indicates that the pulsed mode maintains the same current-dependent behavior, without any additional loss or gain in efficiency due to the electrolyte concentration. This supports the conclusion that, under pulsed conditions, efficiency is mainly determined by the instantaneous current and mass transport limitations, rather than by the electrode material or bulk concentration [22,35,36].
4.2. Pulsed Electrolysis at a Concentration and Different Duty Cycles
According to Table 1, a concentration of 0.40 mol/L was chosen as the ideal one to make a comparison by varying the duty cycle to observe the behavior of the I-U curve.
In Figure 12, for both stainless steel (Figure 12a) and zinc (Figure 12b), a comparison is made between the current–voltage characteristics of conventional electrolysis (β = 0) and pulsed electrolysis at different duty cycles for the stainless-steel electrode in c = 0.40 mol/L. It is observed that pulsed operation significantly increases the current response at a given voltage, particularly for β above 86%, thus indicating an improvement in charge transfer kinetics and a reduction in effective polarization losses. At high duty cycles, the pulsed regime approaches nearly continuous operation, still benefiting from the transient effects of double-layer relaxation.
In Table 2, it can be observed that even when alternating the values of β, Rct continues to decrease, clearly showing that in pulse electrolysis the effects of charge transfer can be neglected. For this reason, many authors do not use Rct in pulse electrolysis.
As can be seen in Table 2, for a higher duty cycle, both for zinc and stainless steel, there is a lower load resistance and a higher exchange current. This reinforces the idea that a duty cycle close to 90% outperforms conventional electrolysis.
The results in Table 2 were obtained considering the Tafel polarization graphs. These graphs are presented below.
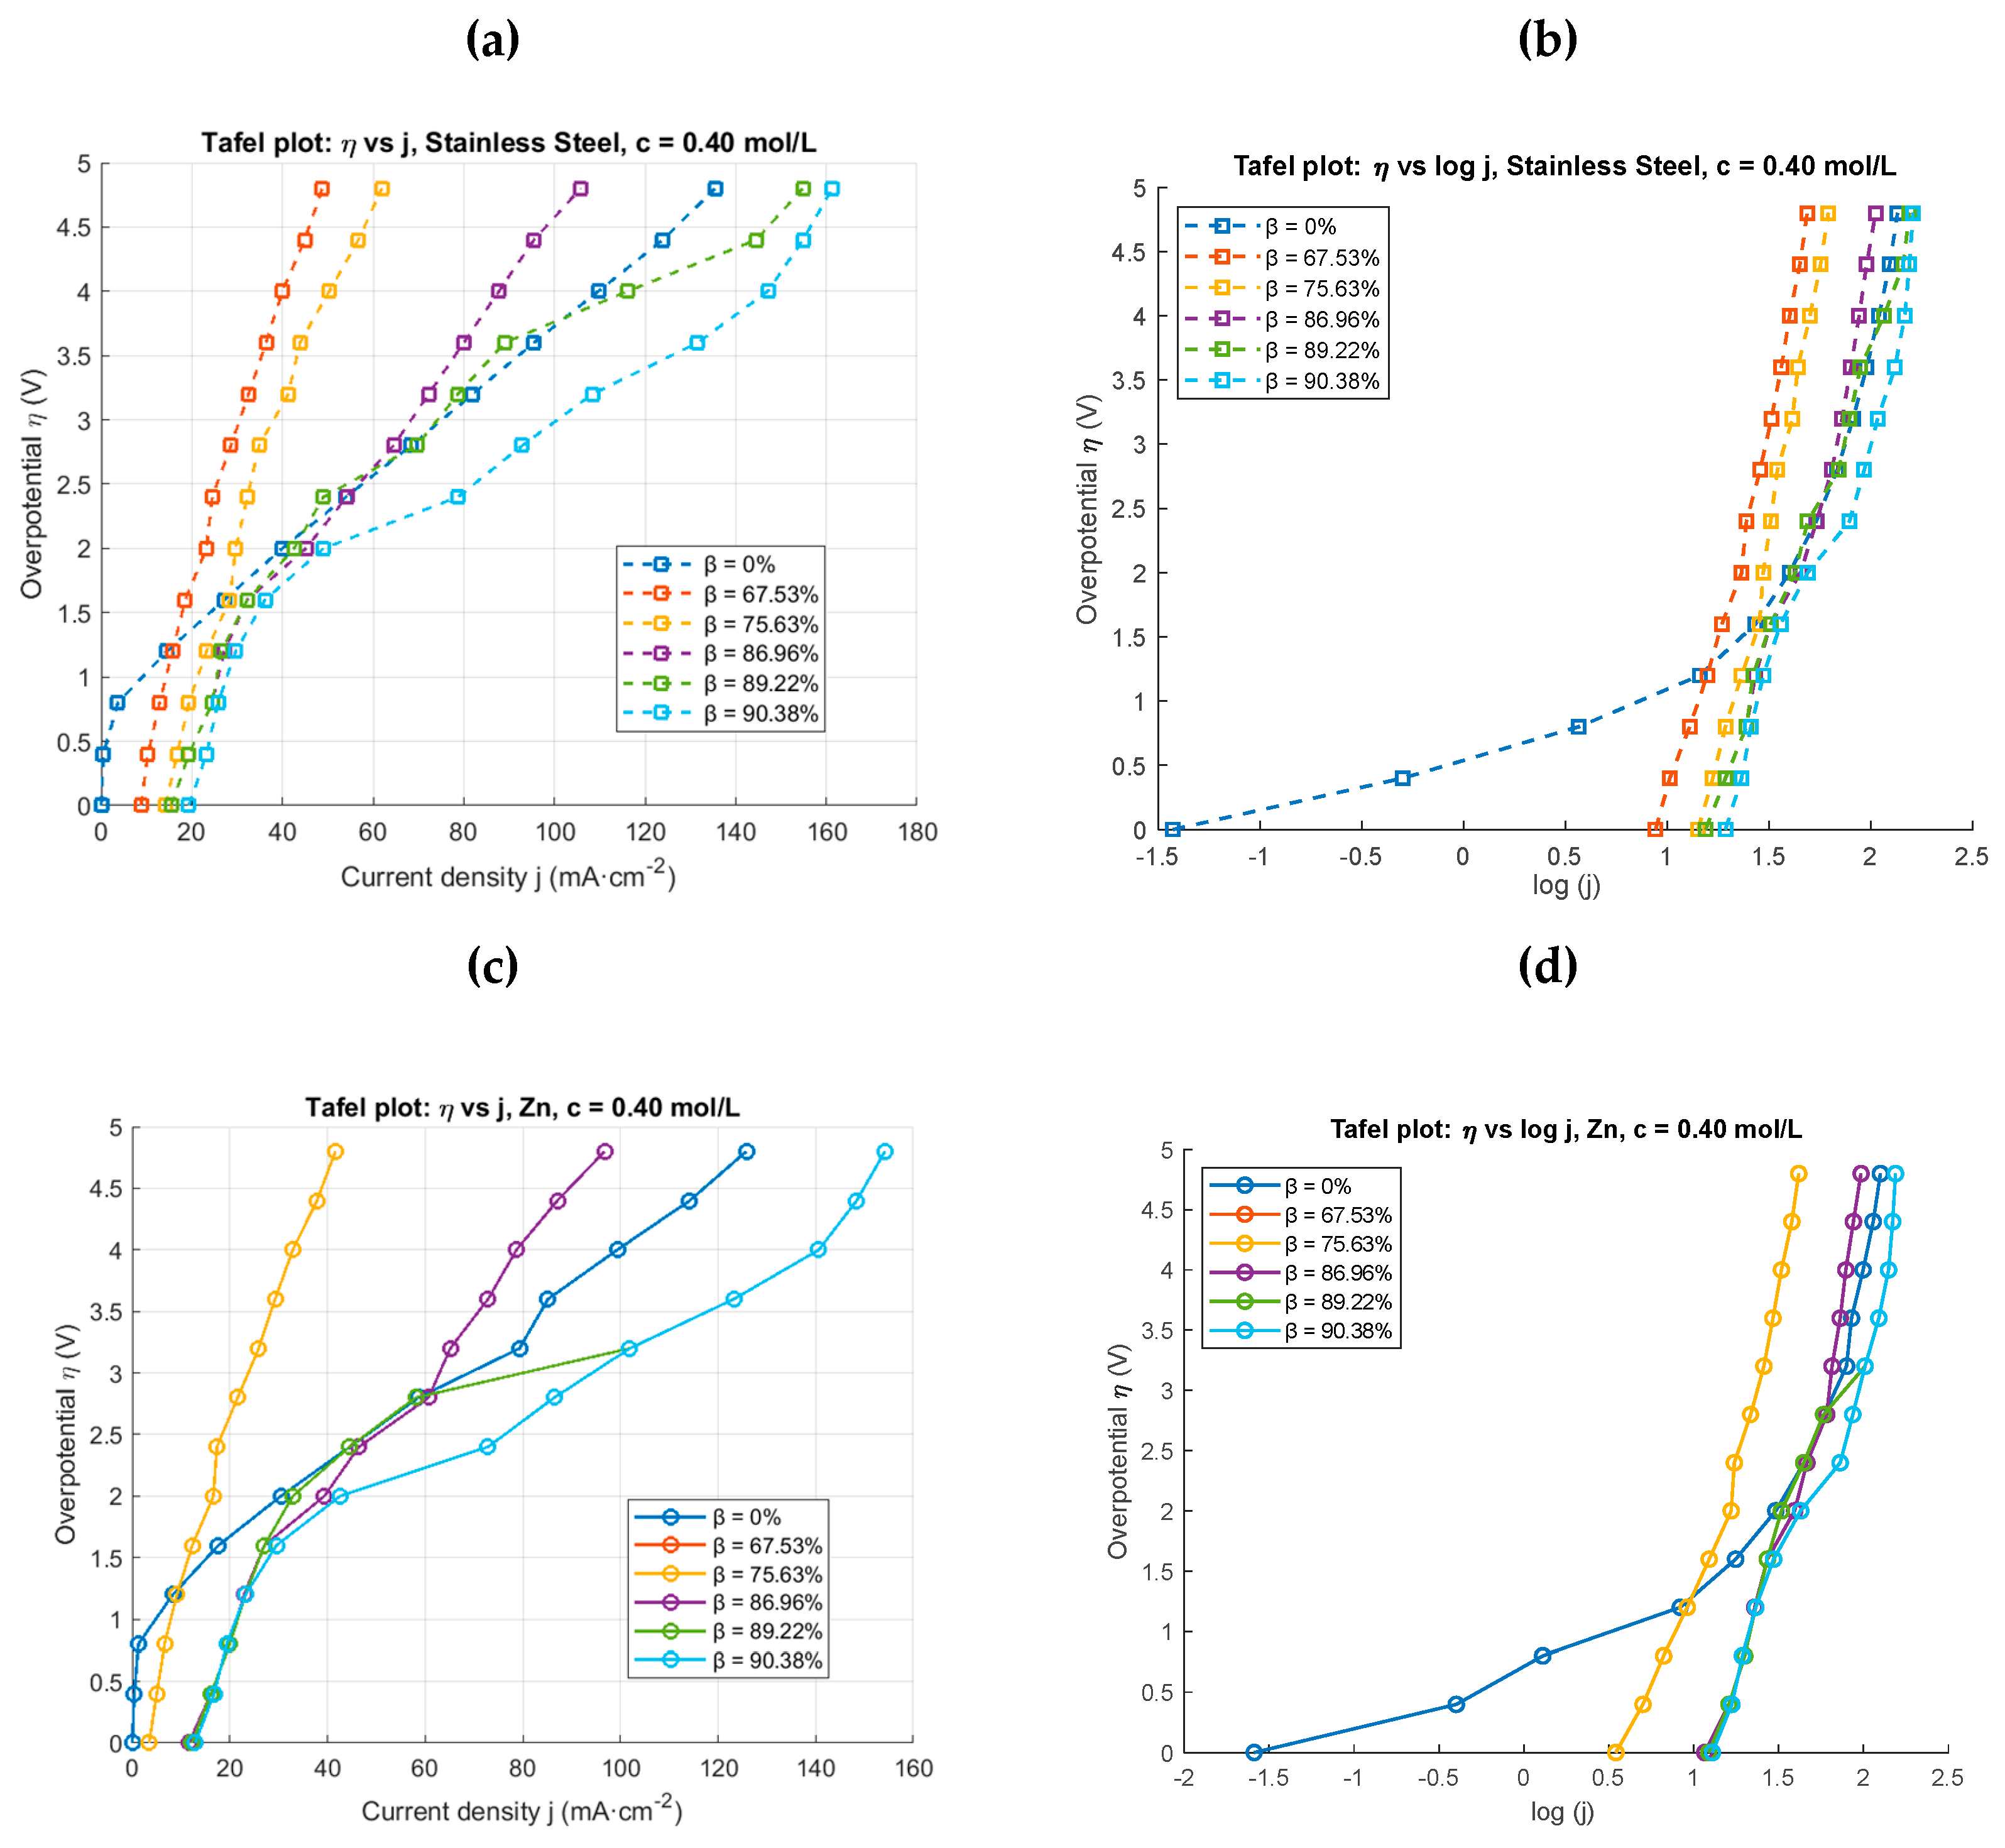
Figure 13.
Tafel plots for different duty cycles using stainless-steel (SS) and zinc electrodes at fixed concentration (c = 0.40 mol/L): (a) overpotential (ƞ) vs current density (j), SS (b) ƞ vs log(j), SS, (c) ƞ vs j, zinc, and (d) ƞ vs log(j), zinc.
Figure 13.
Tafel plots for different duty cycles using stainless-steel (SS) and zinc electrodes at fixed concentration (c = 0.40 mol/L): (a) overpotential (ƞ) vs current density (j), SS (b) ƞ vs log(j), SS, (c) ƞ vs j, zinc, and (d) ƞ vs log(j), zinc.
The behavior of efficiencies as a function of different beta values was also analyzed (Figure 14). It was found that for beta values of 86.96%, 89.22%, and 90.38%, the efficiency values were higher than in conventional electrolysis, for both stainless steel and zinc. It was also observed that for each beta value, even using different electrodes and different currents, the efficiencies of zinc and stainless steel were the same, thus supporting the same conclusion as in Figure 11.
As can be seen in Figure 14, for c = 0.40 mol/L KOH, the efficiency of hydrogen evolution was essentially identical for the stainless steel and zinc electrodes across all operating cycles (β = 0 - 90.38%). This indicates that, under these conditions, the performance of electrolysis is dominated by the electrolyte conductivity and the applied current, rather than the properties of the electrode material, in agreement with previous studies on alkaline water electrolysis [22,35,36].
5. Conclusions and Perspectives
The work on the topic in question presented a systematic comparison between zinc and stainless-steel electrodes operating under conventional and pulsed alkaline electrolysis at different electrolyte concentrations (0.25, 0.30, 0.35, and 0.40 mol/L). As expected, under conventional electrolysis (β = 0), it was found that efficiency is essentially independent of both the electrolyte concentration and the electrode material, indicating that, within the investigated range, the overall process is mainly governed by the bulk electrolyte conductivity and ohmic losses, rather than interfacial kinetics. A similar behavior, independent of concentration, was also observed for pulsed electrolysis operated with a duty cycle of 67.53%, confirming that moderate pulsing does not significantly alter Faradaic efficiency when compared to conventional electrolysis.
When the duty cycle was systematically varied (β = 0, 67.53, 75.63, 86.96, 89.22, and 90.38%), a clear increase in efficiency was observed for high duty cycles (β ≥ 86.96%) for both electrode materials. In this regime, pulsed electrolysis outperformed conventional electrolysis, which can be attributed to an improvement in interfacial mass transport, partial relaxation of the electric double layer, and attenuation of concentration polarization effects during the pulse-off period. These results demonstrate that the duty cycle is a critical operational parameter and that properly optimized pulsed electrolysis can outperform conventional operation in terms of efficiency, even without changes in electrolyte concentration.
During the investigation of the two electrode materials, stainless steel consistently demonstrated superior electrochemical performance, particularly under pulsed electrolysis conditions. Lower values of charge transfer resistance (Rct) were obtained for stainless steel compared to zinc, indicating faster electrode kinetics and reduced interfacial energy barriers. The higher Rct values observed for zinc are likely associated with corrosion and surface passivation phenomena in alkaline media, which hinder charge transfer during pulsed operation. Consequently, the use of stainless-steel electrodes is recommended for pulsed alkaline water electrolysis due to their higher efficiency, lower Rct, and greater electrochemical stability. However, for zinc electrodes, surface modification strategies or protective coatings are suggested to suppress corrosion and reduce Rct, which could allow for simpler double-layer models in pulsed electrolysis systems and improve their technical feasibility.
In general, both in pulsed electrolysis and conventional electrolysis, it was observed that as the voltage and current increased, the efficiency of the electrolysis decreased. In the future, to produce larger amounts of hydrogen, it will be necessary to find a technique that does not significantly reduce efficiency at higher currents and voltages. Even for high currents and voltages, stainless steel is expected to be feasible.
Funding
This work was supported by FCT - Fundação para a Ciência e Tecnologia, I.P., by project reference and DOI identifier: https://doi.org/10.54499/PRT/BD/154538/2021 and by FCT - Fundação para a Ciência e Tecnologia in the research unit CTS - Center of Technology and Systems /UNINOVA/ FCT/ NOVA, with the reference CTS/00066.
Conflicts of Interest
The authors declare no conflict of interest. The funders had no role in the design of the study; in the collection, analyses, or interpretation of data; in the writing of the manuscript, or in the decision to publish the results.
References
- R. Lobo, “A Brief on Nano-Based Hydrogen Energy Transition,” Hydrogen, MDPI, pp. 679-693, 2023. [CrossRef]
- R. Lobo and M. Pinheiro, R. Lobo, in Advanced Topics in Contemporary Physics for Engineering: Nanophysics, Plasma Physics and Electrodynamics, Portugal: CRC Press-New York, ISBN 9781032247632, 2022. [CrossRef]
- T. Paulec, J. Tvarožek, P. Resutík, P. Špánik and M. Praženica, “Review of the Dynamic Response of Water Electrolyzers,” Electrical Engineering, vol. 107, pp. 10499-10506, 18 March 2025. [CrossRef]
- B. E. Conway, Electrochemical Supercapacitors: Scientific Fundamentals and Technological Applications, Springer, 1999. [CrossRef]
- GroB and S. Sakong, “Modelling the electric double layer at electrode-electrolyte interfaces,” Current Opinion in Electrochemistry - Elsevier, vol. 14, pp. 1-6, 2019. [CrossRef]
- J. O. Bockris, A. K. N. Reddy, M. Gamboa-Aldeco and L. M. Peter, “Comprehensive Modern Electrochemistry : Modern Electrochemistry,” Platinum Metals Review, vol. 46, nº 1, pp. 15-17, 2002. [CrossRef]
- C. Haoran, X. Yanghong, H. Zhiyuan and W. Wei, “Optimum pulse electrolysis for efficiency enhancement of hydrogen production by alkaline water electrolyzers,” Applied Energy, vol. 358, p. 122512, 2024. [CrossRef]
- D. Pletcher and X. Li, “Prospects for alkaline zero gap water electrolysers for hydrogen production,” International Journal of Hydrogen Energy, vol. 36, pp. 15089-150104, 2011. [CrossRef]
- N. Colli, H. H. Girault and A. Battistel, “Non-Precious Electrodes for Practical Alkaline Water Electrolysis,” materials, MDPI, vol. 12, nº 1336, pp. 1-17, 2019. [CrossRef]
- M. Davida., C. Ocampo-Martínezc. and R. Sánchez-Peña., “Advances in alkaline water electrolyzers: A review,” Journal of Energy Storage, pp. 392-403, 2019. [CrossRef]
- H. Mabarak., S. Elmazouzi., D. Takky., Y. Naimi. e I. Colak, “Hydrogen Production by Water Electrolysis: Review,” em 12th IEEE International Conference on Renewable Energy Research and Applications, Canada, 2023. [CrossRef]
- L. Vidas and R. Castro, “Recent Developments on Hydrogen Production Technologies: State-of-the-Art Review with a Focus on Green-Electrolysis,” Applied Sciences, MDPI, vol. 11363, p. 11, 2021. [CrossRef]
- B. Decourt, B. Lajoie, R. Debarre and S. Olivier, Hydrogen-based energy conversion, Gravenhage, Netherlands: AT Kearney/ Energy Transition Institute, 2014. https://www.energy-transition-institute.com/documents/17779499/17781876/Hydrogen+Based+Energy+Conversion_FactBook.pdf.
- M. Faraday, “ On Electrical Decomposition,” Philosophical Transactions of the Royal Society, vol. 124, pp. 77-124, 1834. On electro-chemical decomposition, continued : Faraday, Michael, 1791-1867 : Free Download, Borrow, and Streaming : Internet Archive.
- S. Bespalko. and J. Mizeraczyk, “Overview of the Hydrogen Production by Plasma-Driven Solution Electrolysis,” energies, MDPI, nº 7508, p. 15, 2022. [CrossRef]
- H. K. A. L. W. L. U. L. Lange, “Technical evaluation of the flexibility of water electrolysis systems to increase energy flexibility: A review,” International Journal of Hydrogen Energy, pp. 1571-1583, 2023. [CrossRef]
- R. Pinskya, P. Sabharwallb, J. Hartvigsenb and J. O. O’Brien, “Comparative Review of Hydrogen Production Technologies for Nuclear Hybrid Energy Systems,” Progress in Nuclear Energy, vol. 123, nº 103317, p. 16, 2020. [CrossRef]
- F. Marangio, M. Santarelli and M. Cali, “Theoretical model and experimental analysis of a high pressure PEM water electrolyser for hydrogen,” International Journal of Hydrogen Energy, pp. 1143-1158, 2009. [CrossRef]
- Ø. Ulleberg, “Modelagem de eletrolisadores alcalinos avançados: uma abordagem de simulação de sistemas,” International Journal of Hydrogen Energy, vol. 28, nº 1, pp. 21-33, 2003. [CrossRef]
- S. Tijani, N. A. B. Yusup and A. H. A. Rahim., “Mathematical modelling and simulation analysis of advanced alkaline electrolyzer system for hydrogen production,” Procedia Technology, vol. 15, pp. 798-806, 2014. [CrossRef]
- Yodwong, D. Guilbert, M. Oliveira, W. Kaewmanee, M. Hinaje and G. Vitale, “Performance modeling of PEM electrolyzer for hydrogen production using solar PV electricity under varying environmental conditions,” Energies, 13, 4792, MDPI, p. 14, 2020. [CrossRef]
- M. Carmo, D. L. Fritz, J. Mergel and a. D. Stolten, “A Comprehensive Review on PEM Water Electrolysis,” International Journal of Hydrogen Energy, vol. 38, nº 12, pp. 4901-4934, 2013. [CrossRef]
- Ø. G. Martinsen. and A. Heiskanen, “Electrical double layer,” em Basics of Bioimpedance and Bioelectricity (fourth edition), 2023. [CrossRef]
- R. Burt, G. Birkett and X. S. Zhao, “A review of molecular modelling of electric double layer capacitors,” Royal Society of Chemistry, vol. 16, pp. 6519-6538, 2014. [CrossRef]
- M. Gouy, “Sur la constitution de la charge électrique à la surface d’un électrolyte,” Journal de physique théorique appliquée, vol. 9, nº 1, pp. 447-458, 1910. [CrossRef]
- D. Chapman, “LI. A contribution to the theory of electrocapillarity,” The London, Edinburgh, and Dublin Philosophical Review and Journal of Science, vol. 25, pp. 475-481, 1913. [CrossRef]
- H. Stern, “ZUR THEORIE DER ELEKTROLYTISCHEN DOPPELSCHICHT,” ZITSCHRITFT FUR ELEKTROCHEME, vol. 30, pp. 508-516, 1924. [CrossRef]
- M. S. Ebaid, M. Hammad and T. Alghamdi, “Thermoeconomic analysis of a 100 MW hybrid photovoltaic and hydrogen gas turbine power plant.,” International Journal of Hydrogen Energy, vol. 40, nº 36, pp. 12120-12143, 2015. [CrossRef]
- G. A. Ruiz and C. J. Felice, “Electrochemical-Fractal Model Versus Randles Model: A Discussion About Diffusion Process,” International Journal of Electrochemical Science, pp. 8484-8496, 2015. [CrossRef]
- M. E. Orazem and B. Tribollet, Electrochemical Impedance Spectroscopy; ISBN:9780470381588, New York: John Wiley & Sons, Inc., 2008. [CrossRef]
- H. Fricke, “The theory of electrolytic polarization,” The London, Edinburgh, and Dublin Philosophical Magazine and Journal of Science, vol. 14, nº 90, pp. 310-318, 1932. [CrossRef]
- C. Lim, “Transport Phenomena. Warburg Impedance,” MIT OpenCourseWare. https://ocw.mit.edu, acess: 25.11.2025, 2014. 10.626 Lecture Notes, Transient diffusion.
- L. Geddes and L. E. Baker, Principles of Applied Biomedical Instrumentation, 3rd edition, New York: John Wiley, LC: 88-27915; ISBN: 9780471608998; ISBN: 0471608998, 1989, pp. 853, chap. 13.
- E. Barsoukov and J. R. Macdonald, Impedance Spectroscopy: Theory, Experiment, and Applications - 2nd Edition. ISBN: 0-471-64749-7, Hoboken, New Jersey.: John Wiley & Sons, Inc., 2005. [CrossRef]
- J. Bard and L. R. Faulker, Electrochemical Methods: Fundamentals and Applications - 2nd Edition. ISBN 0-471-04372-9, New York: John Wiley & Sons, Inc., 2001. https://books.google.co.ao/books?id=eZ6HDAEACAAJ.
- F. Rocha, Q. Radiguès, G. Thunis and J. Proost, “Pulsed water electrolysis: A review,” Electrochimica Acta, pp. 20, 377, 138052, 2021. [CrossRef]
- J.-H. Kim, C.-Y. Oh, K.-R. Kim, J.-P. Lee and T.-J. Kim, “Electrical Double Layer Mechanism Analysis of PEM Water Electrolysis for Frequency Limitation of Pulsed Currents,” Energies, MDPI, vol. 14, nº 7822, p. 17, 2021. [CrossRef]
- H. C. Cheg, Y. Xia, Z. Hu and W. Wei, “Optimum pulse electrolysis for effciency enhancement of hydrogen production by alkaline water electrolyzers,” Applied Energy, vol. 358, nº 122510, p. 10, 2024. [CrossRef]
- P. Puranen, V. Ruuskanen, L. Järvinen, M. Niemelä, A. Kosonen, P. Kauranen and J. Ahola, “Calculating active power for waterelectrolyzers in dynamicoperation: Simple, isn’t it?,” International Journal of Hydrogen Energy, vol. 91, pp. 267-271, 2024. [CrossRef]
- E. Emanuel, Power Definitions and the Physical Mechanism of Power Flow, New Jersey, USA: Wiley, 2010. ISBN: 978-0-470-68399-8, 2010. [CrossRef]
- F. T. Ulaby and U. Ravaioli, Fundamentals of Applied Electromagnetics (8th ed.), London, UK: Person, 2023. Fundamentals of Applied Electromagnetics, Global Edition, 8/ed.
- P. Horowitz and W. Hill, The Art of Electronics (3rd ed.), Cambridge University Press, 2015. new08_popular_opamp_noise_plots_fullpageheight.
- N. Monk and S. Watson, “REVIEW OF PULSED POWER FOR EFFICIENT HYDROGEN PRODUCTION,” CORE, p. 15, 2016. 288373965.pdf.
- T. Paulec, P. Špánik, J. Tvarožek and M. Praženica, “Design of the Converter Prototype for Powering the Hydrogen Electrolyzer,” MDPI, Applied Science, 15, 2601, 2025. [CrossRef]
- V. Solorio and et.al, “Investigation of Pore Size on the Hydrogen Evolution Reaction of 316L Stainless Steel Porous Electrodes,” catalysts, MDPI, vol. 15, nº 38, pp. 1-14, 2025. [CrossRef]
- B. Basori, W. Mohamad, M. Mansor, N. Tamaldin, A. Iswadi, M. Ajiriyanto and F. Susetyo, “Effect of KOH concentration on corrosion behavior and surface morphology of stainless steel 316L for HHO generator application,” J. Electrochem. Sci. Eng., vol. 13, nº 3, pp. 451-457, 2023. [CrossRef]
- C. Jiang, H. Huang and Q. e. a. Ji, “Investigation of high current density on zinc electrodeposition and anodic corrosion in zinc electrowinning,” J Solid State Electrochem, vol. 26, pp. 1455-1467, 2022. [CrossRef]
- T. Miličić, S. M. C. Blümner, A. Sorrentino and T. Vidaković-Koch, “Pulsed electrolysis – explained,” RSC Publishing, vol. 246, pp. 179-197, 2023. [CrossRef]
- Barauskien, G. Laukaitis and E. Valatka, “Stainless steel as an electrocatalyst for overall water splitting under alkaline and neutral conditions,” Journal of Electroanalytical Chemistry, vol. 950, 2023. [CrossRef]
Figure 2.
Simplified diagrams of EDL structures: (a) Helmholtz model, (b) Gouy-Chapman model and (c) Gouy-Chapman-Stern model.
Figure 2.
Simplified diagrams of EDL structures: (a) Helmholtz model, (b) Gouy-Chapman model and (c) Gouy-Chapman-Stern model.
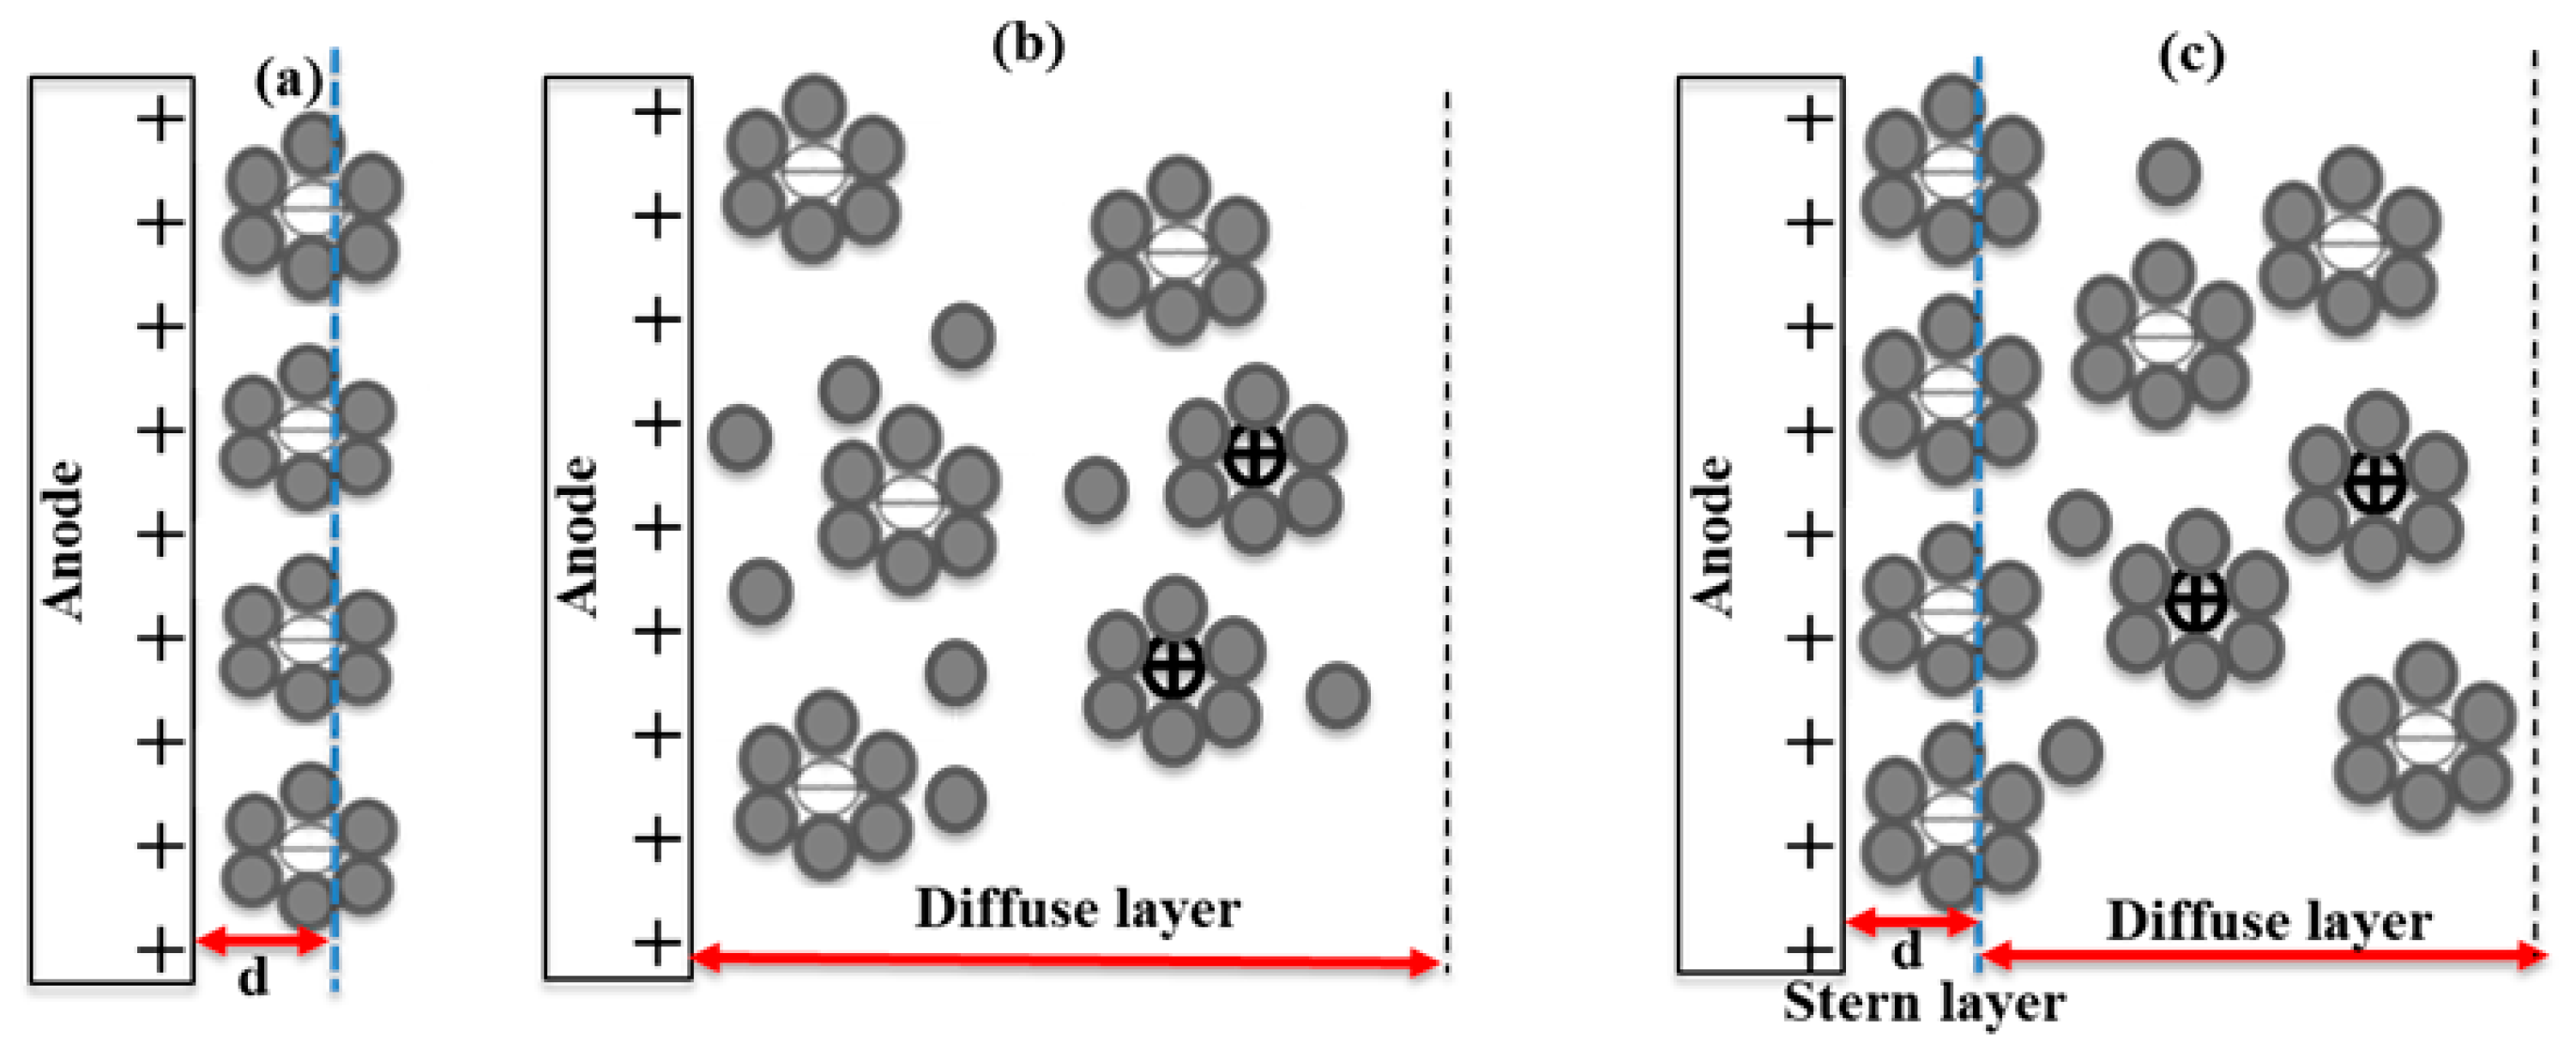
Figure 3.
Representation of the GCS in the form of a series connection of capacitors.
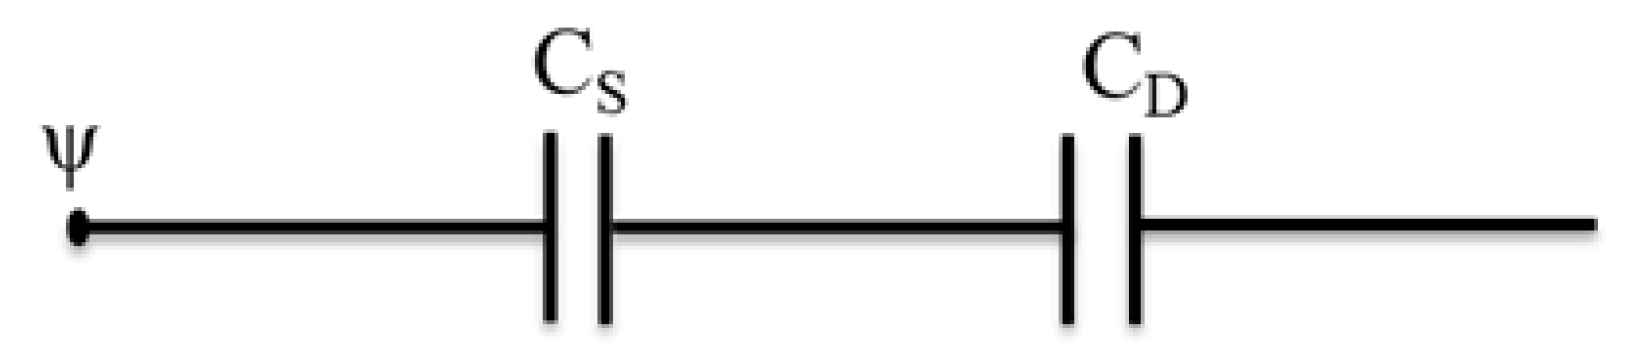
Figure 4.
Electrical circuit of the Randles model.
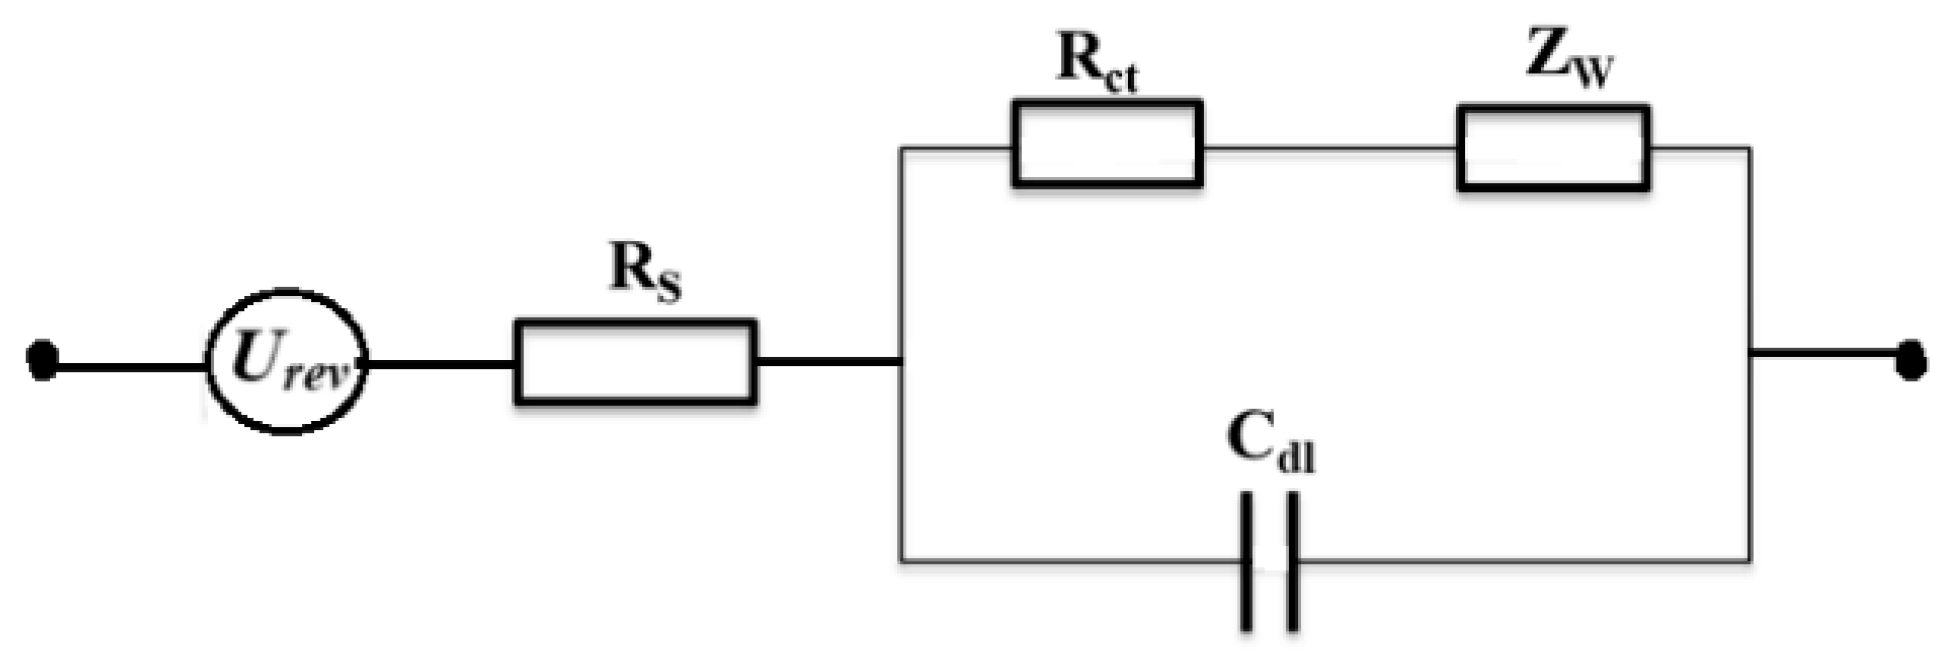
Figure 6.
Pulse operation (a) by voltage pulse (Adapted from [37]) and (b) Current pulse with a null total current during off time.
Figure 6.
Pulse operation (a) by voltage pulse (Adapted from [37]) and (b) Current pulse with a null total current during off time.
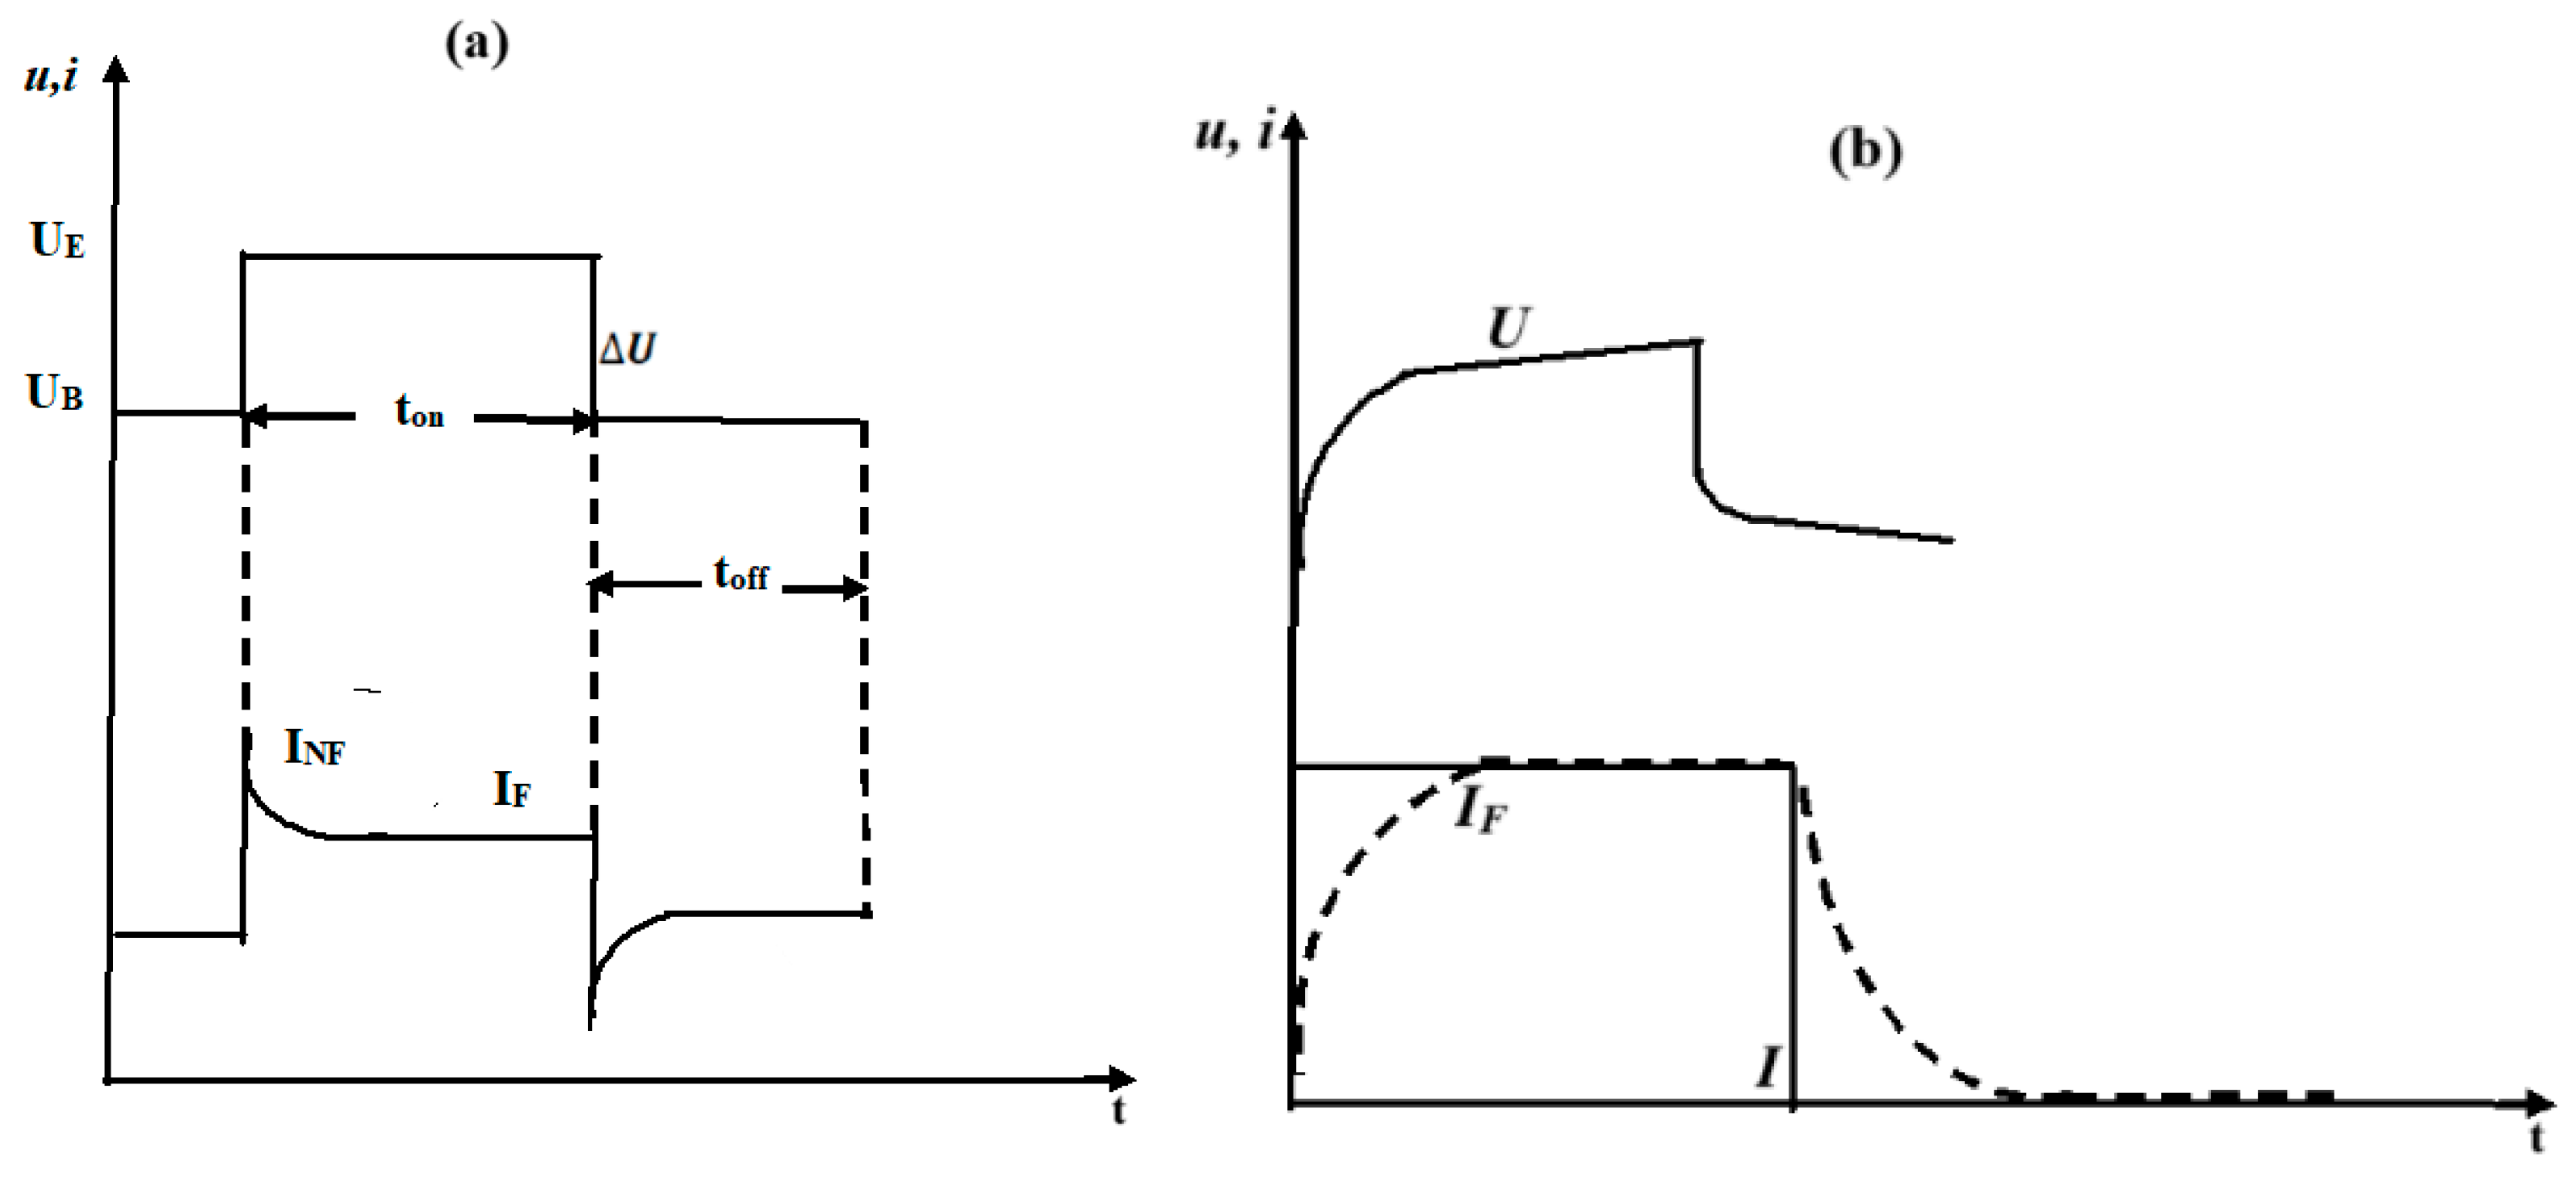
Figure 7.
Example of a square wave. The solid line represents voltage, and the dashed line represents current.
Figure 7.
Example of a square wave. The solid line represents voltage, and the dashed line represents current.
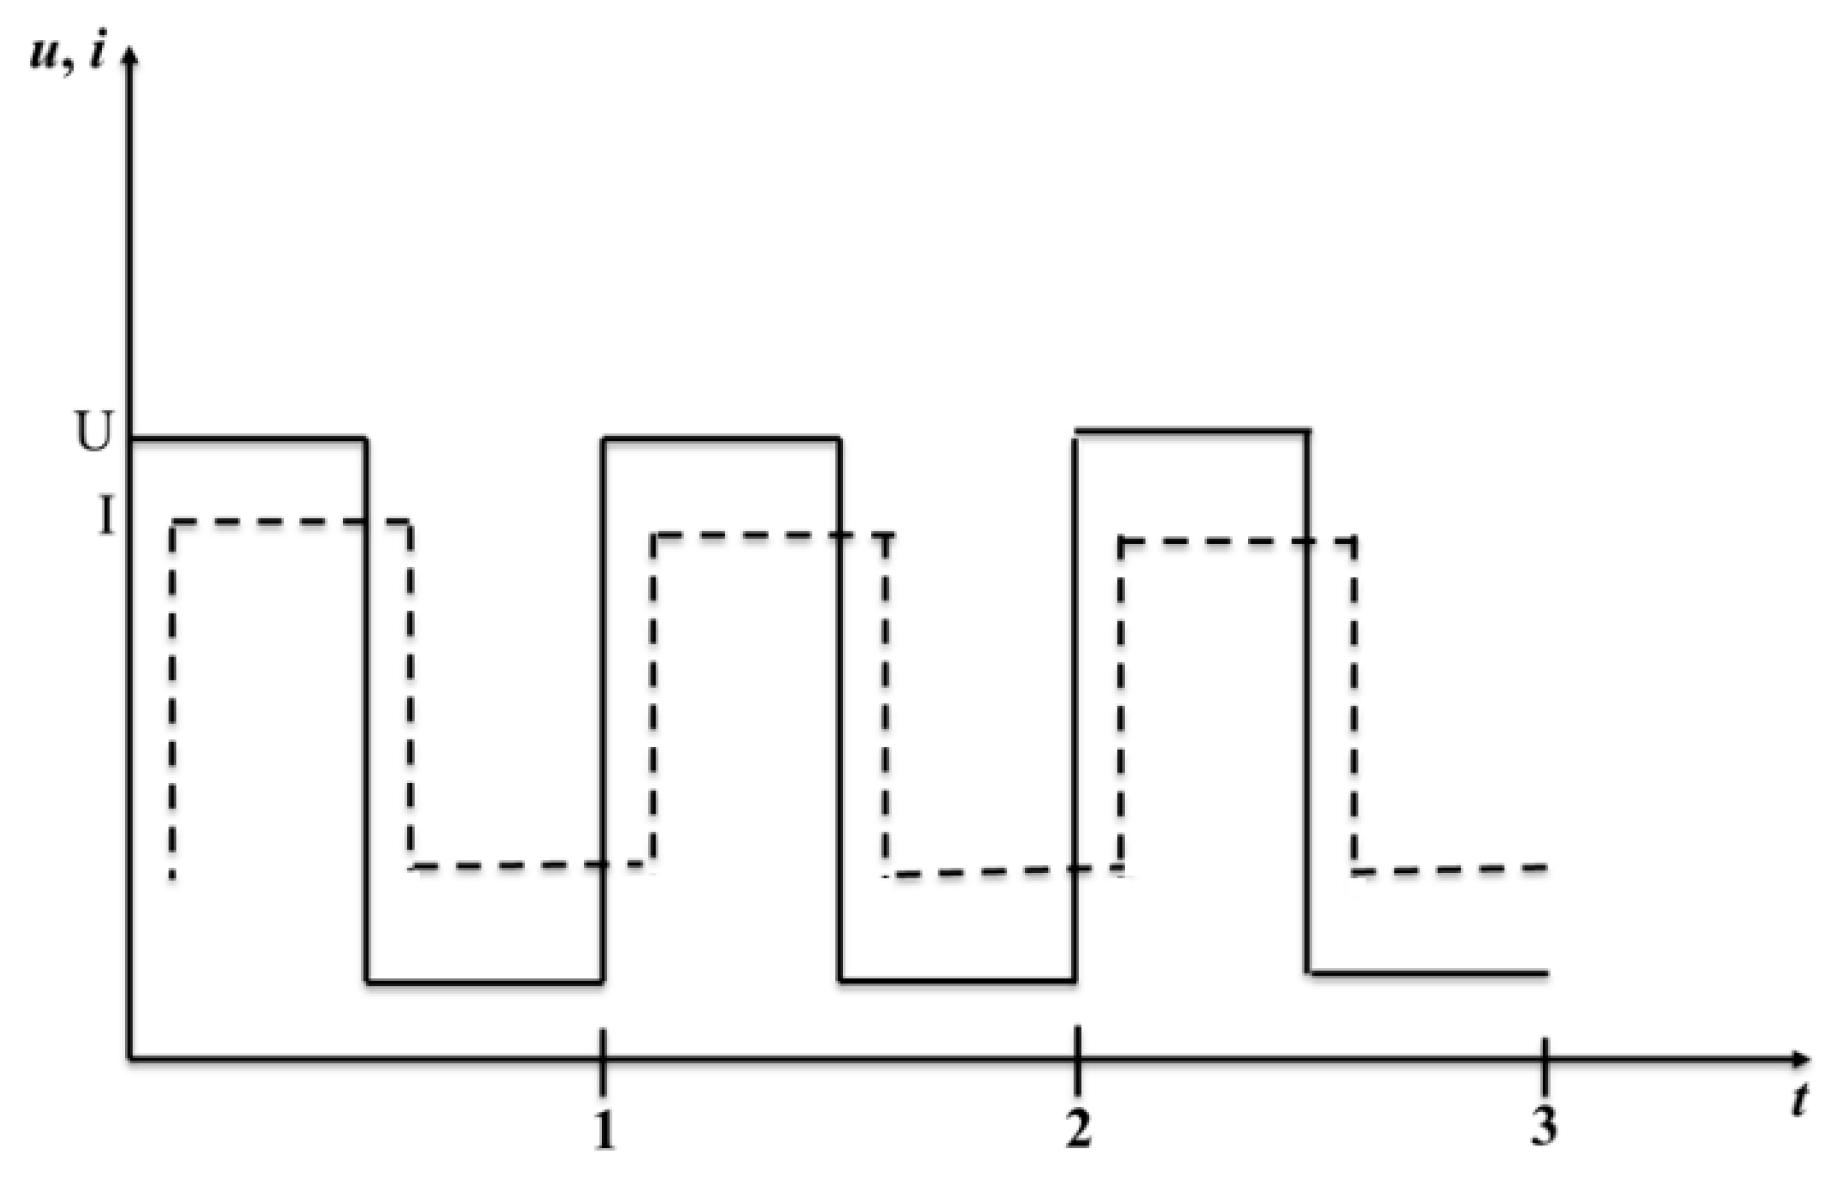
Figure 8.
Simplified experimental schemes used in this work: (a) Conventional electrolysis and (b) pulsed electrolysis.
Figure 8.
Simplified experimental schemes used in this work: (a) Conventional electrolysis and (b) pulsed electrolysis.
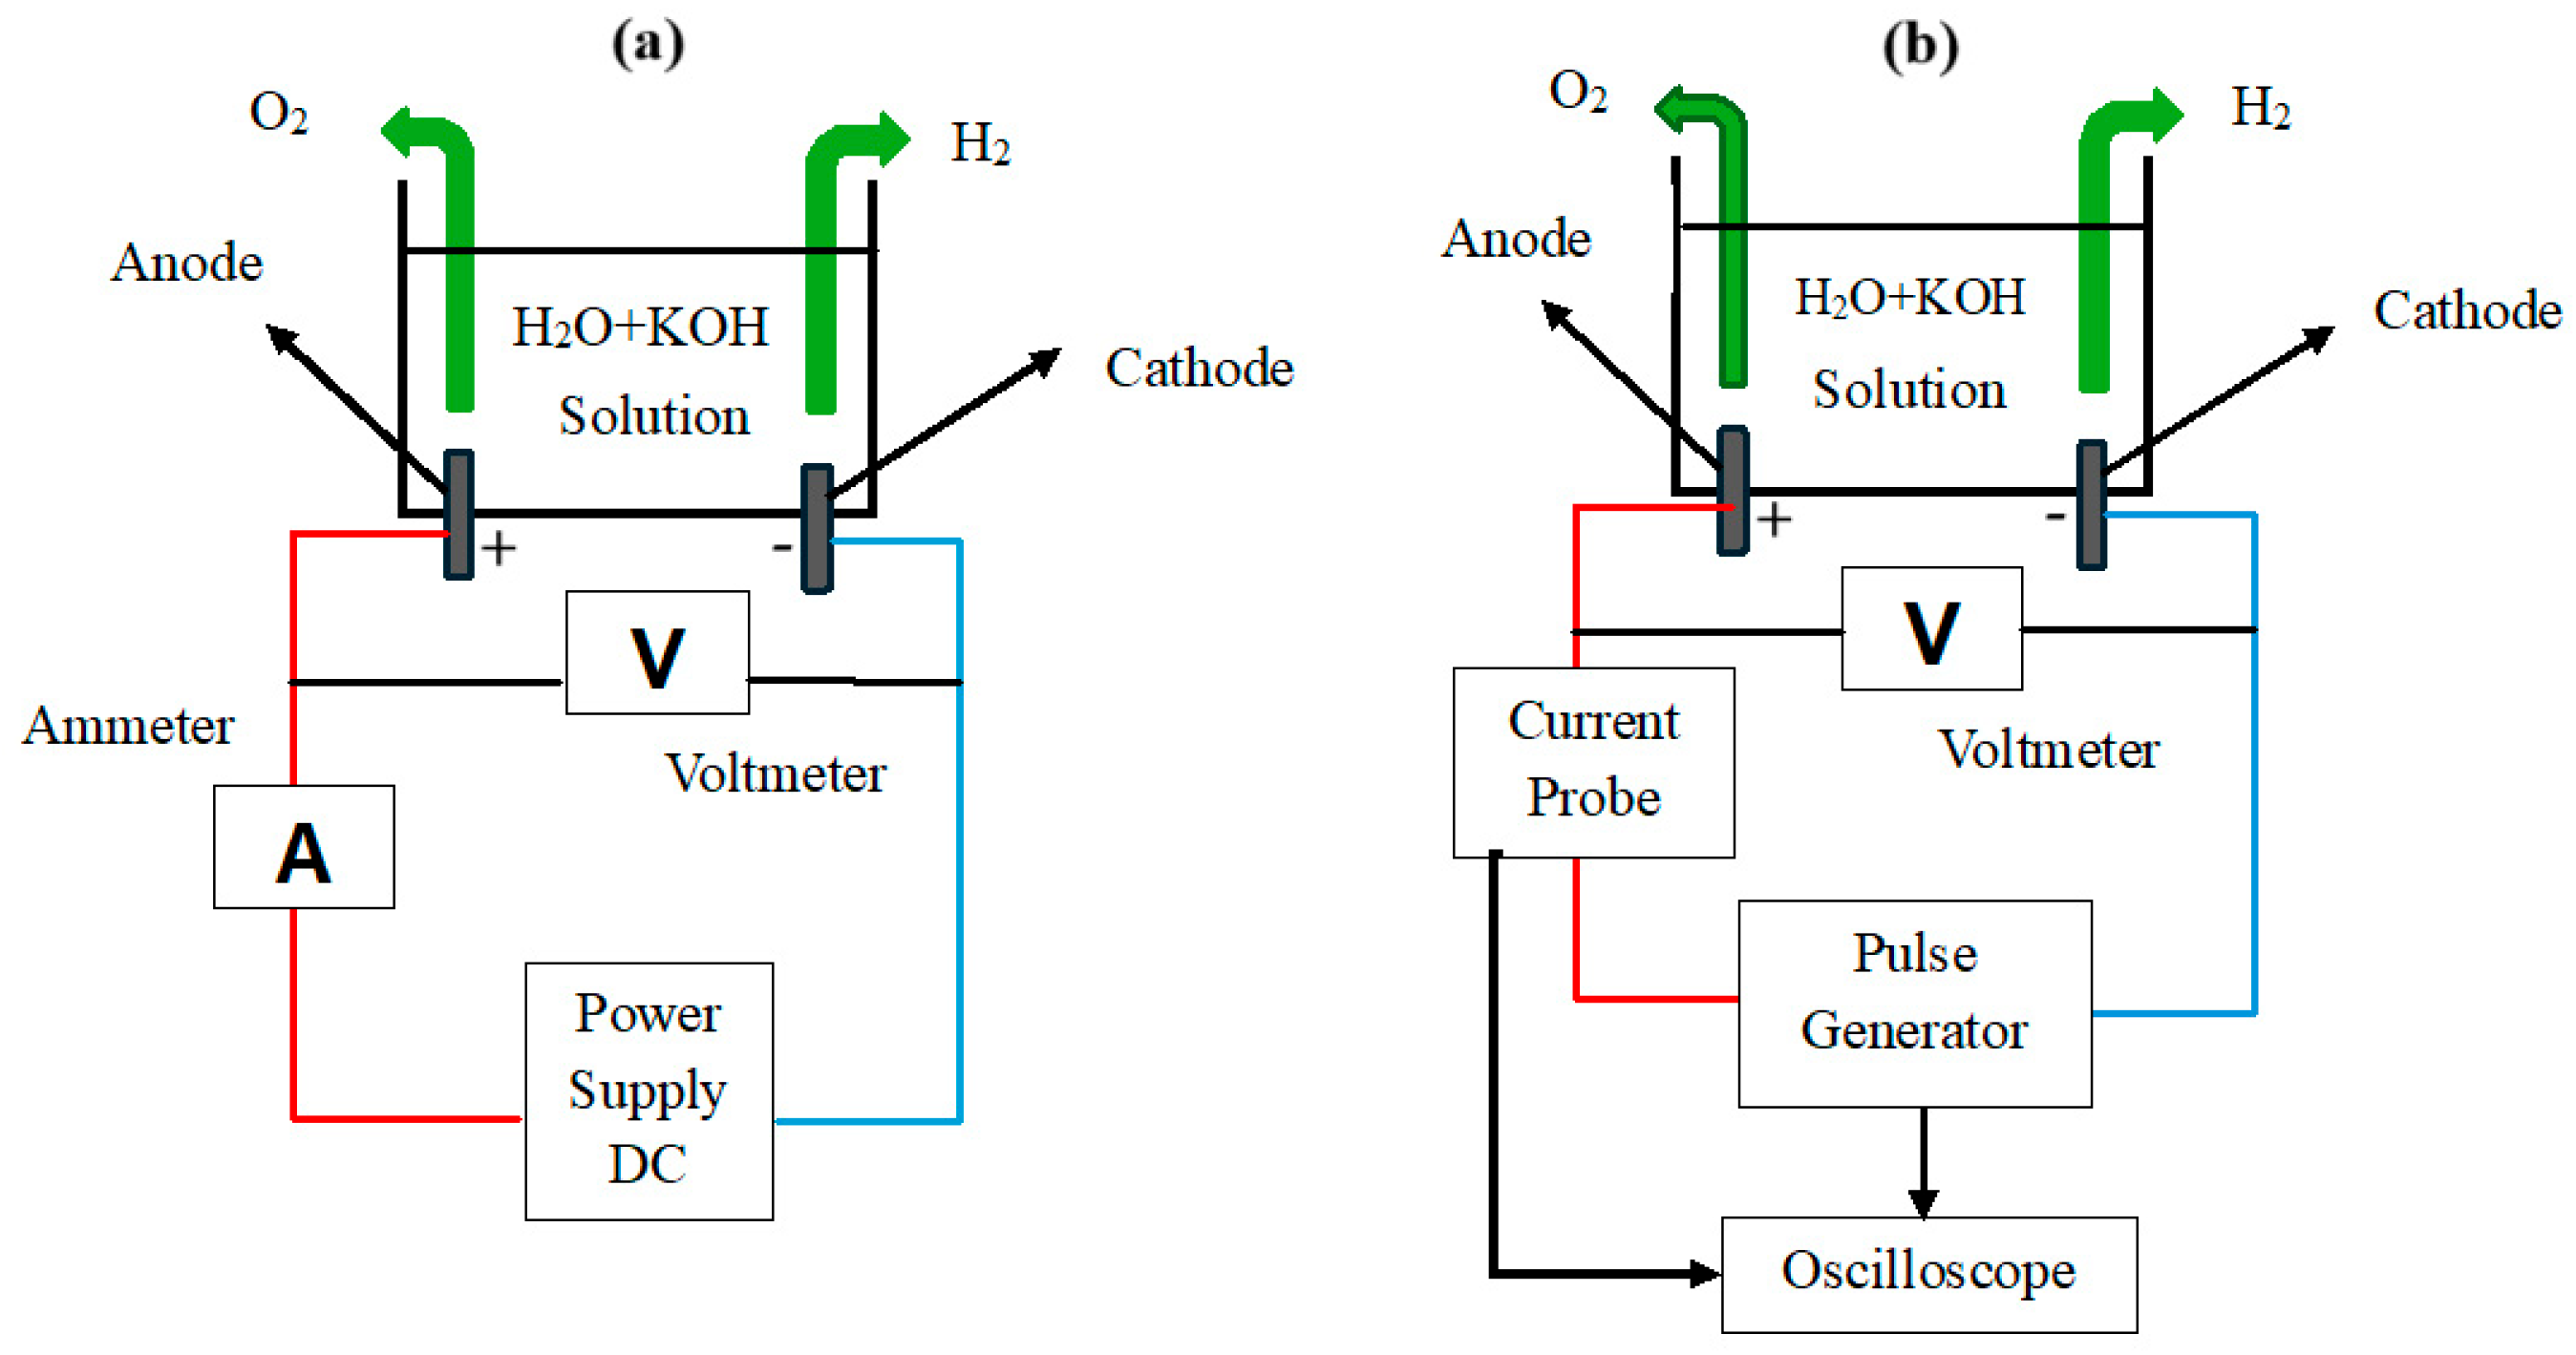
Figure 9.
I-U curves for different concentrations using a stainless-steel and zinc electrodes for conventional and pulsed (β = 67.53%) electrolysis: (a) c = 0.25 mol/L, (b) c = 0.30 mol/L, (c) c = 0.35 mol/L and (d) c = 0.40 mol/L.
Figure 9.
I-U curves for different concentrations using a stainless-steel and zinc electrodes for conventional and pulsed (β = 67.53%) electrolysis: (a) c = 0.25 mol/L, (b) c = 0.30 mol/L, (c) c = 0.35 mol/L and (d) c = 0.40 mol/L.
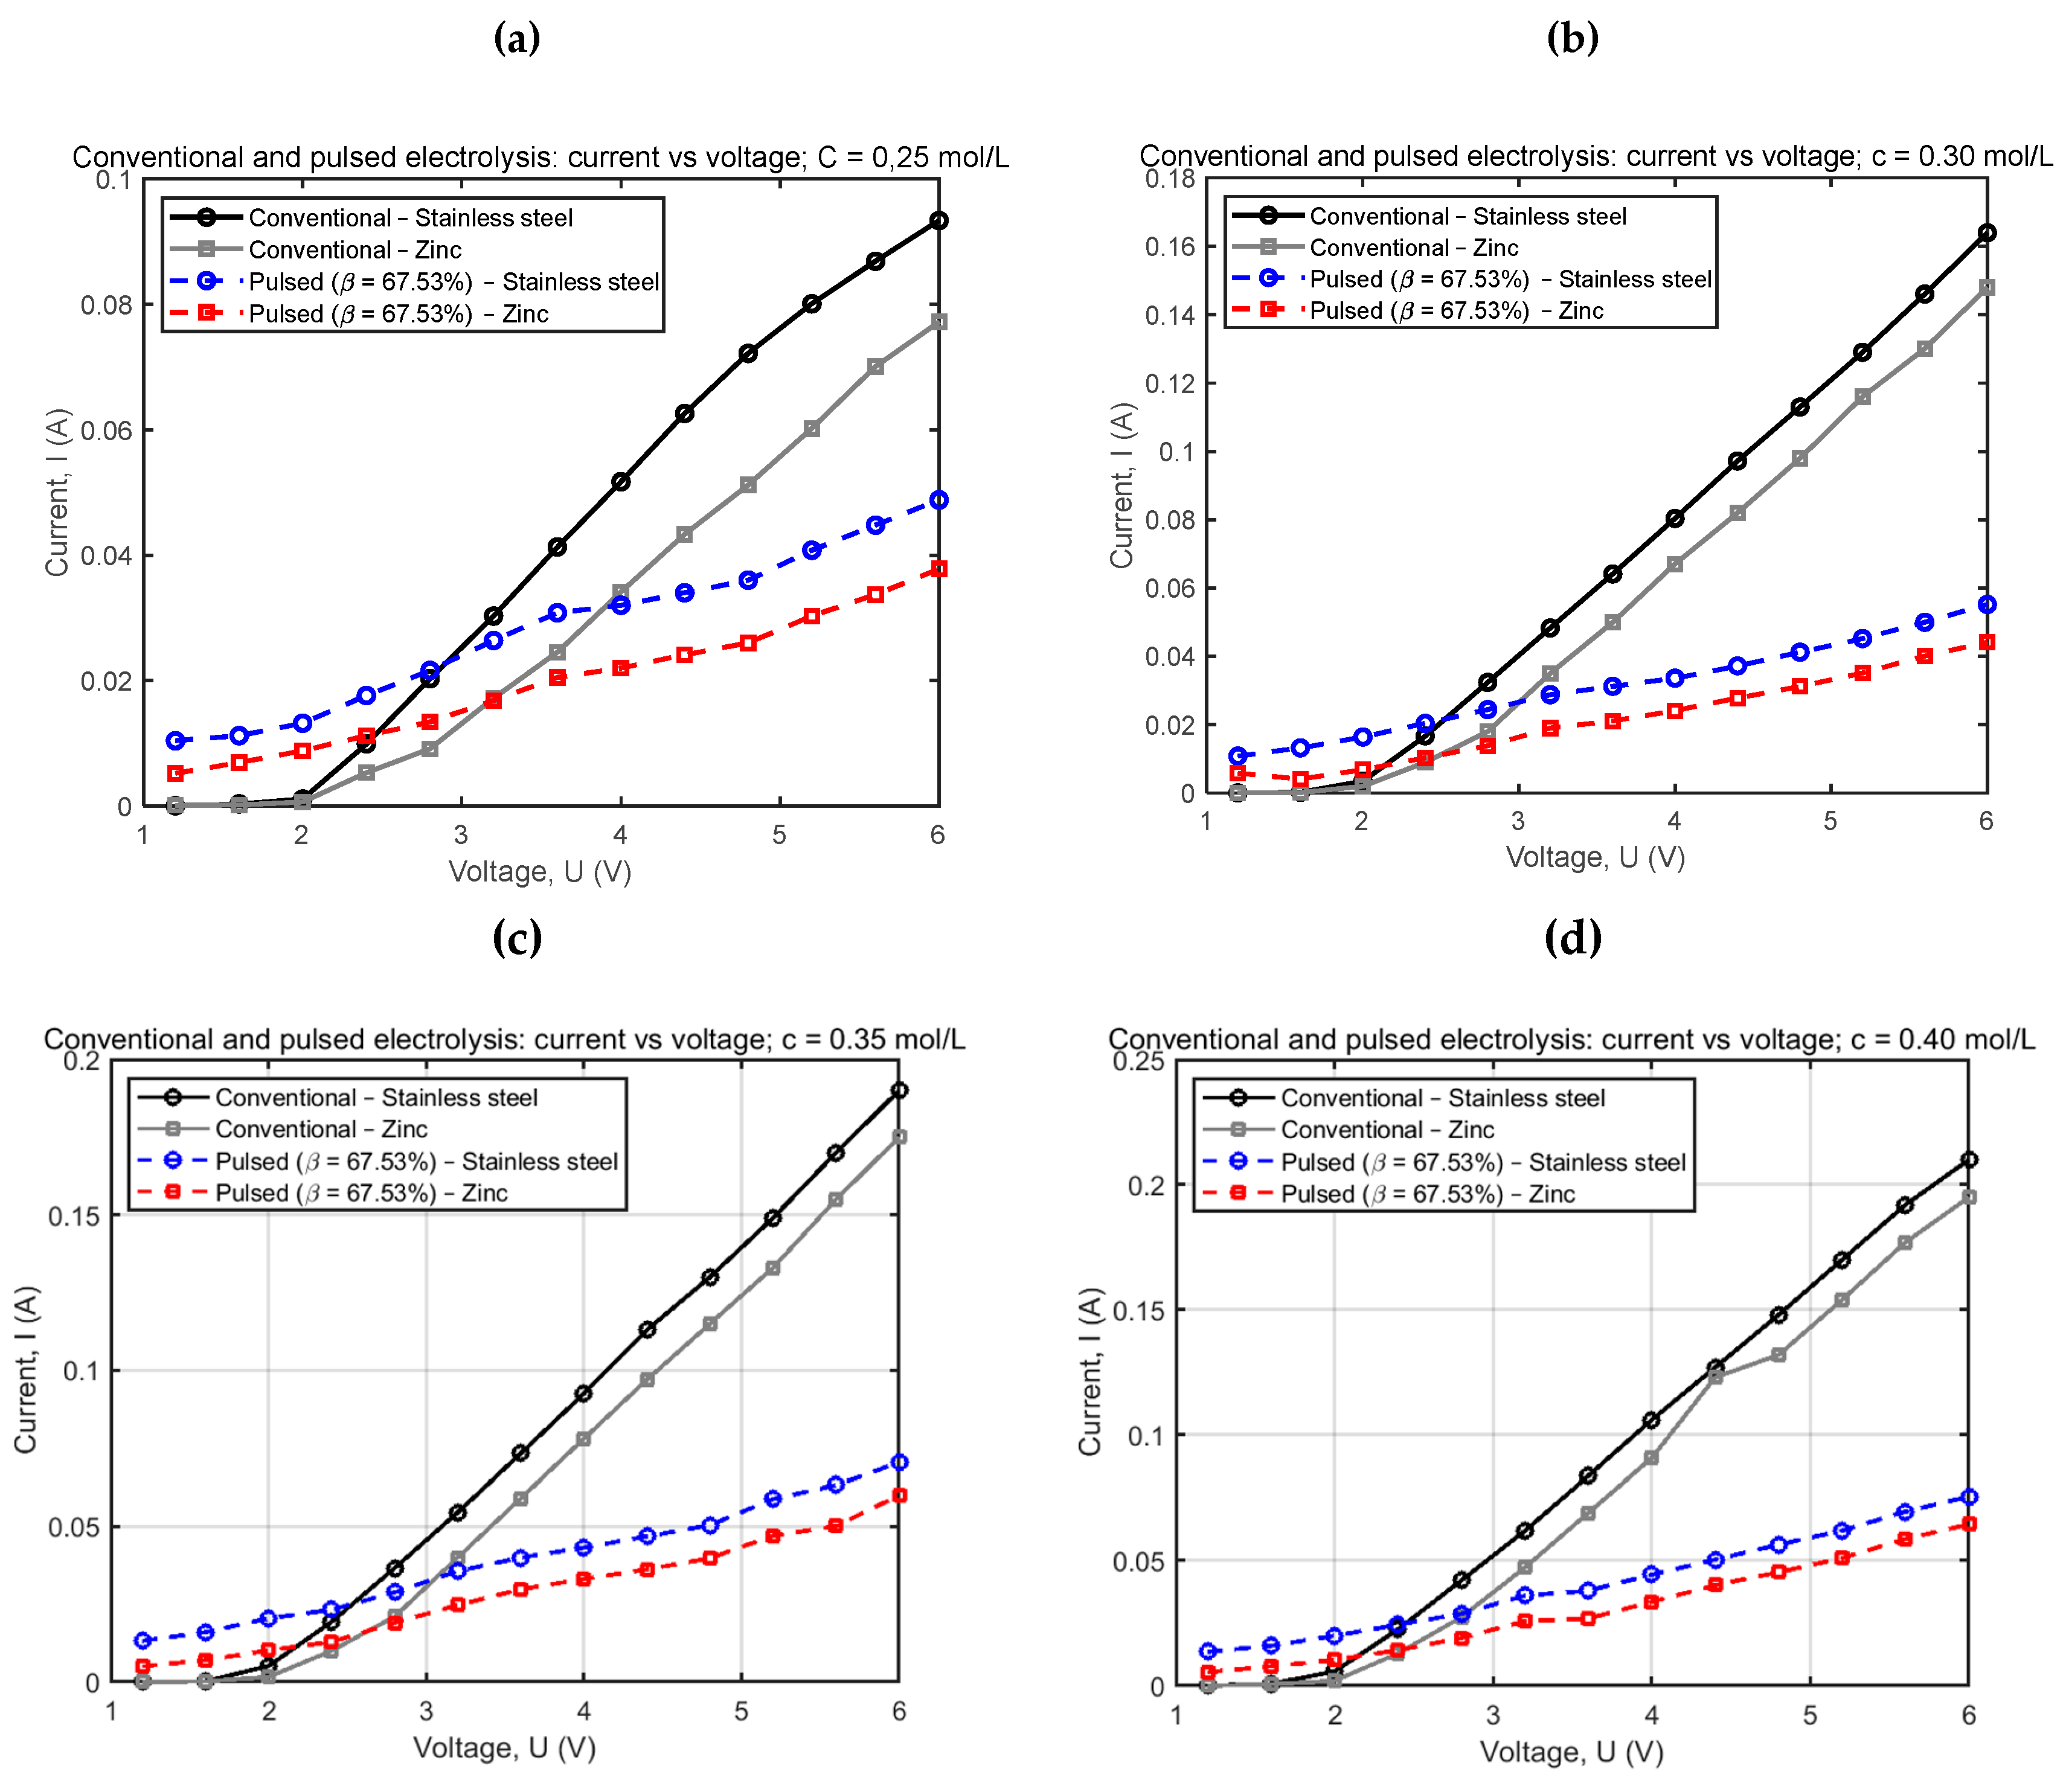
Figure 10.
Tafel plots for different concentrations using stainless steel and zinc electrodes for conventional and pulsed electrolysis (β = 67.53%): (a) conventional, overpotential (ƞ) vs current density (j), (b) pulsed, ƞ vs j, (c) conventional ƞ vs log(j), and (d) pulsed, ƞ vs log(j).
Figure 10.
Tafel plots for different concentrations using stainless steel and zinc electrodes for conventional and pulsed electrolysis (β = 67.53%): (a) conventional, overpotential (ƞ) vs current density (j), (b) pulsed, ƞ vs j, (c) conventional ƞ vs log(j), and (d) pulsed, ƞ vs log(j).
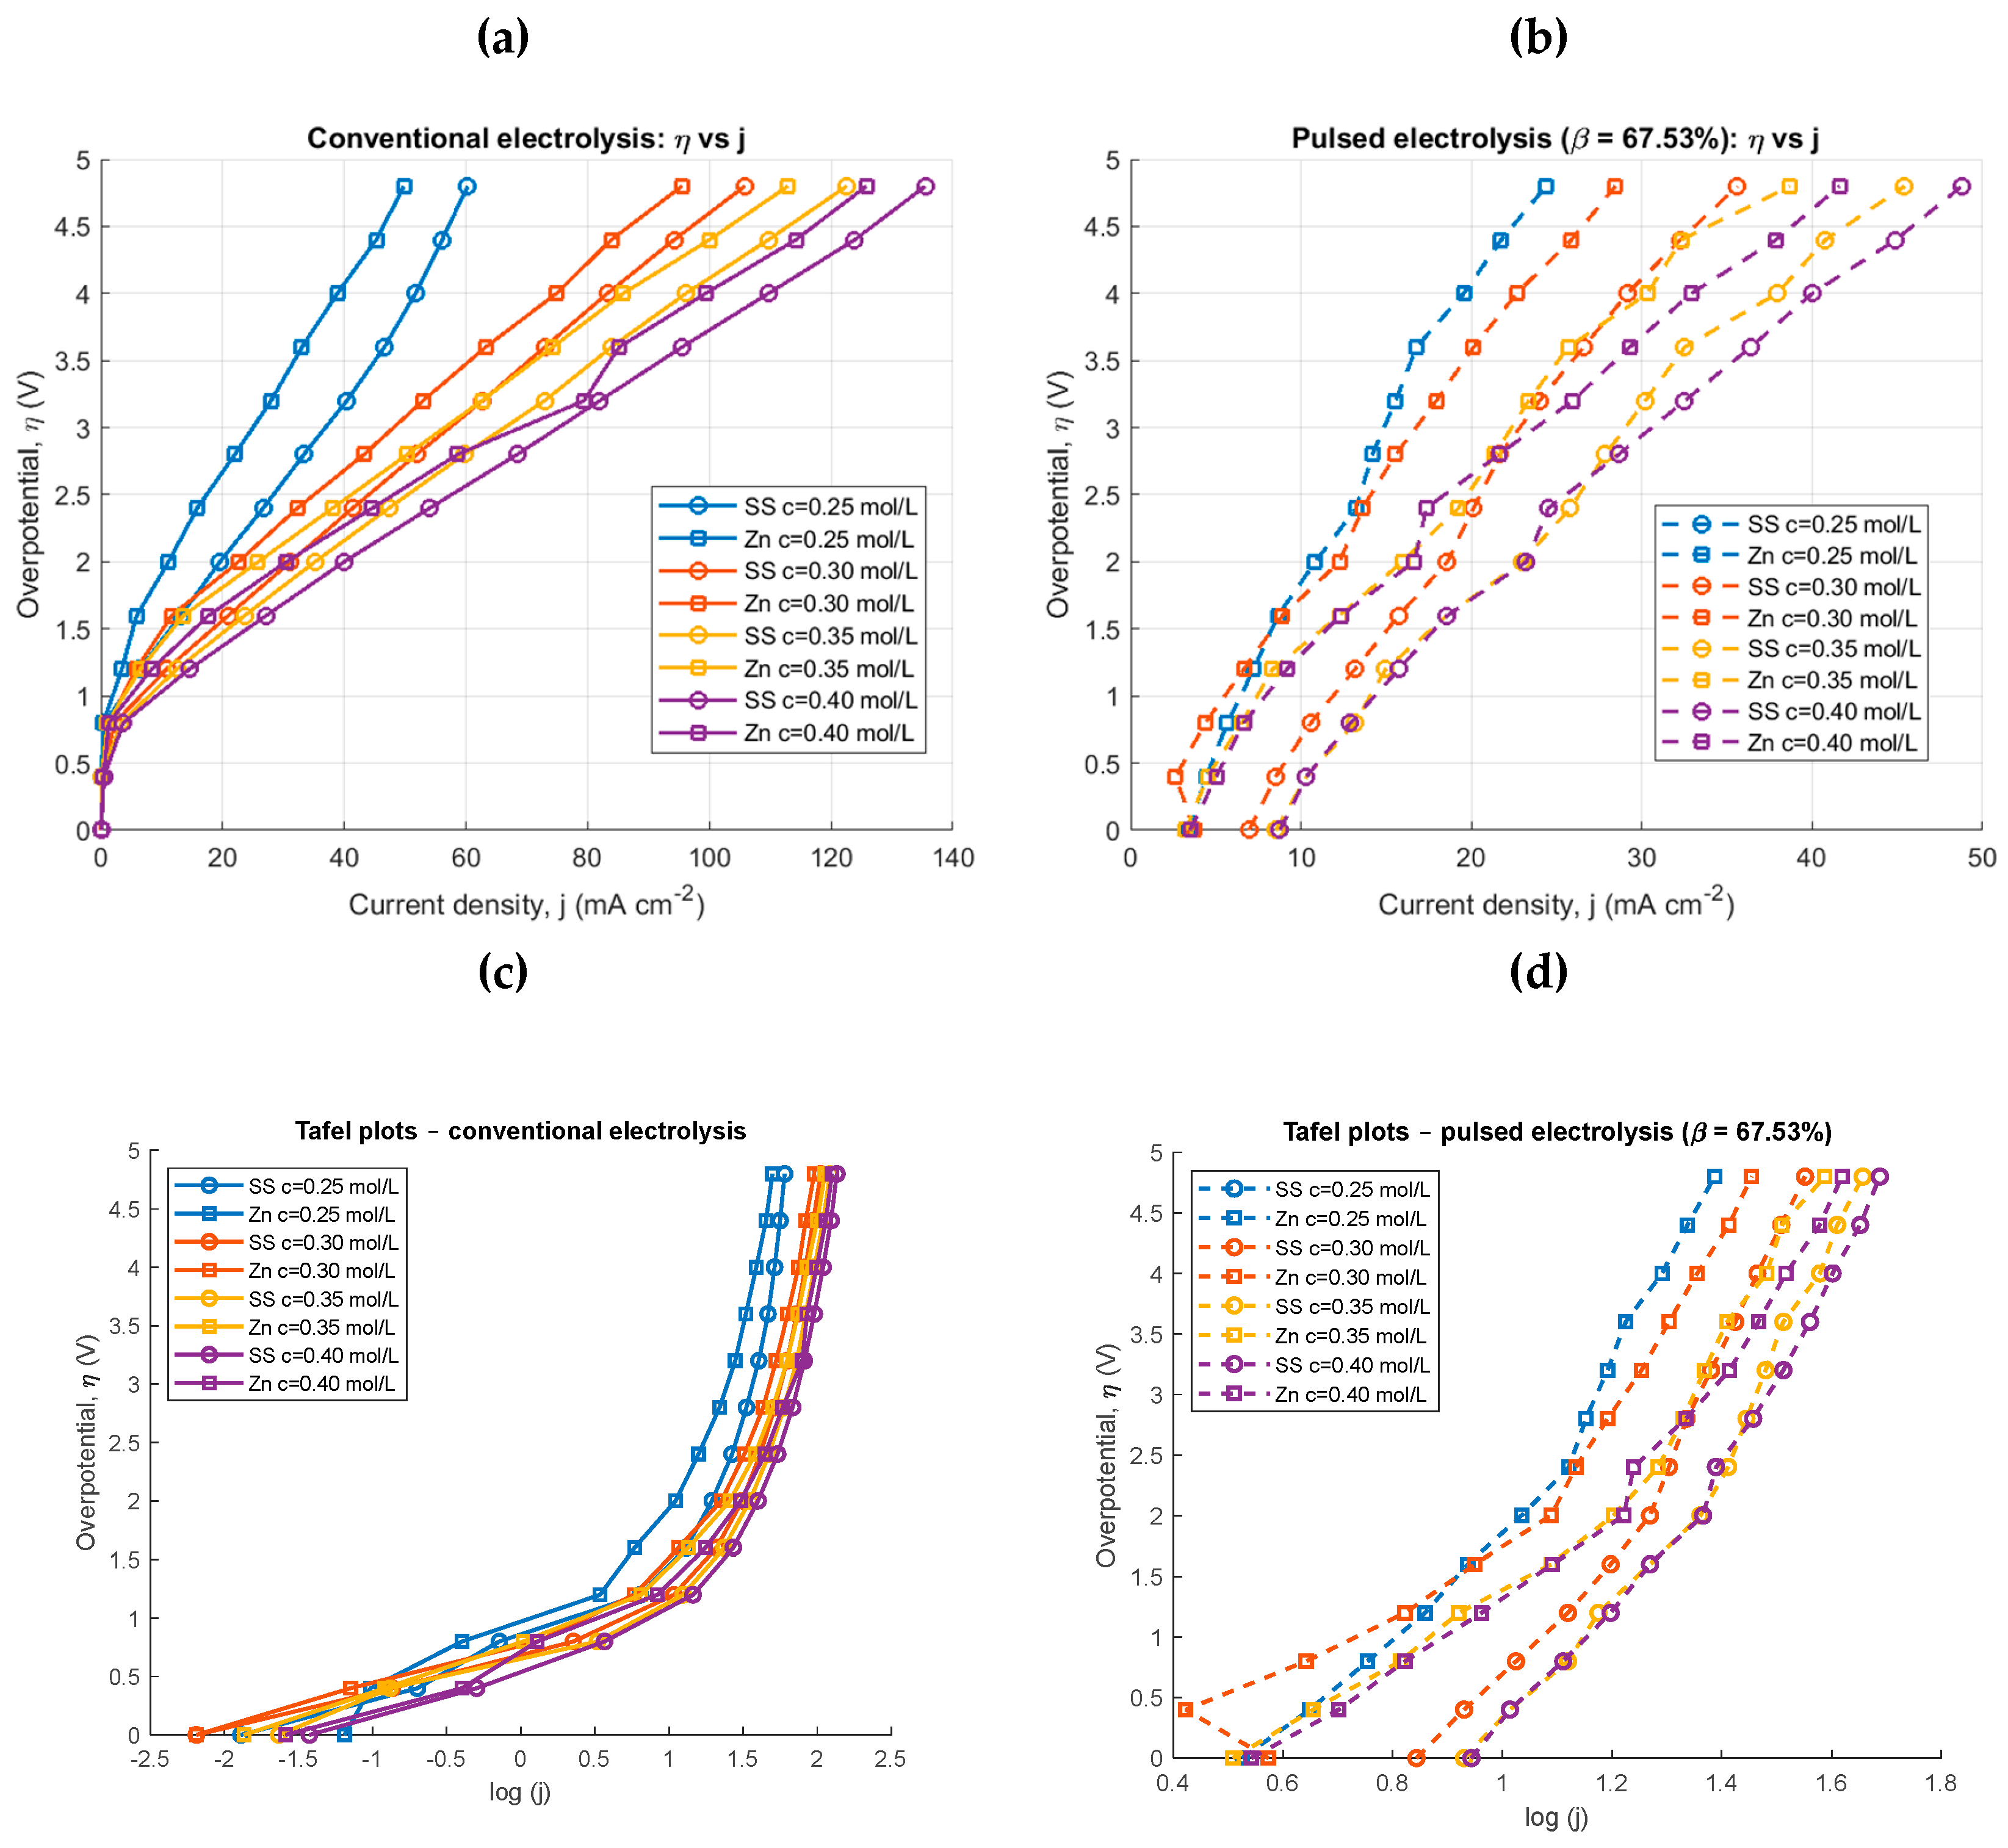
Figure 11.
Efficiencies for different concentrations using stainless steel and zinc electrodes for conventional and pulsed electrolysis (β = 67.53%): (a) conventional, stainless steel, (b) conventional, zinc, (c) pulsed, stainless steel, and (d) pulsed, zinc.
Figure 11.
Efficiencies for different concentrations using stainless steel and zinc electrodes for conventional and pulsed electrolysis (β = 67.53%): (a) conventional, stainless steel, (b) conventional, zinc, (c) pulsed, stainless steel, and (d) pulsed, zinc.
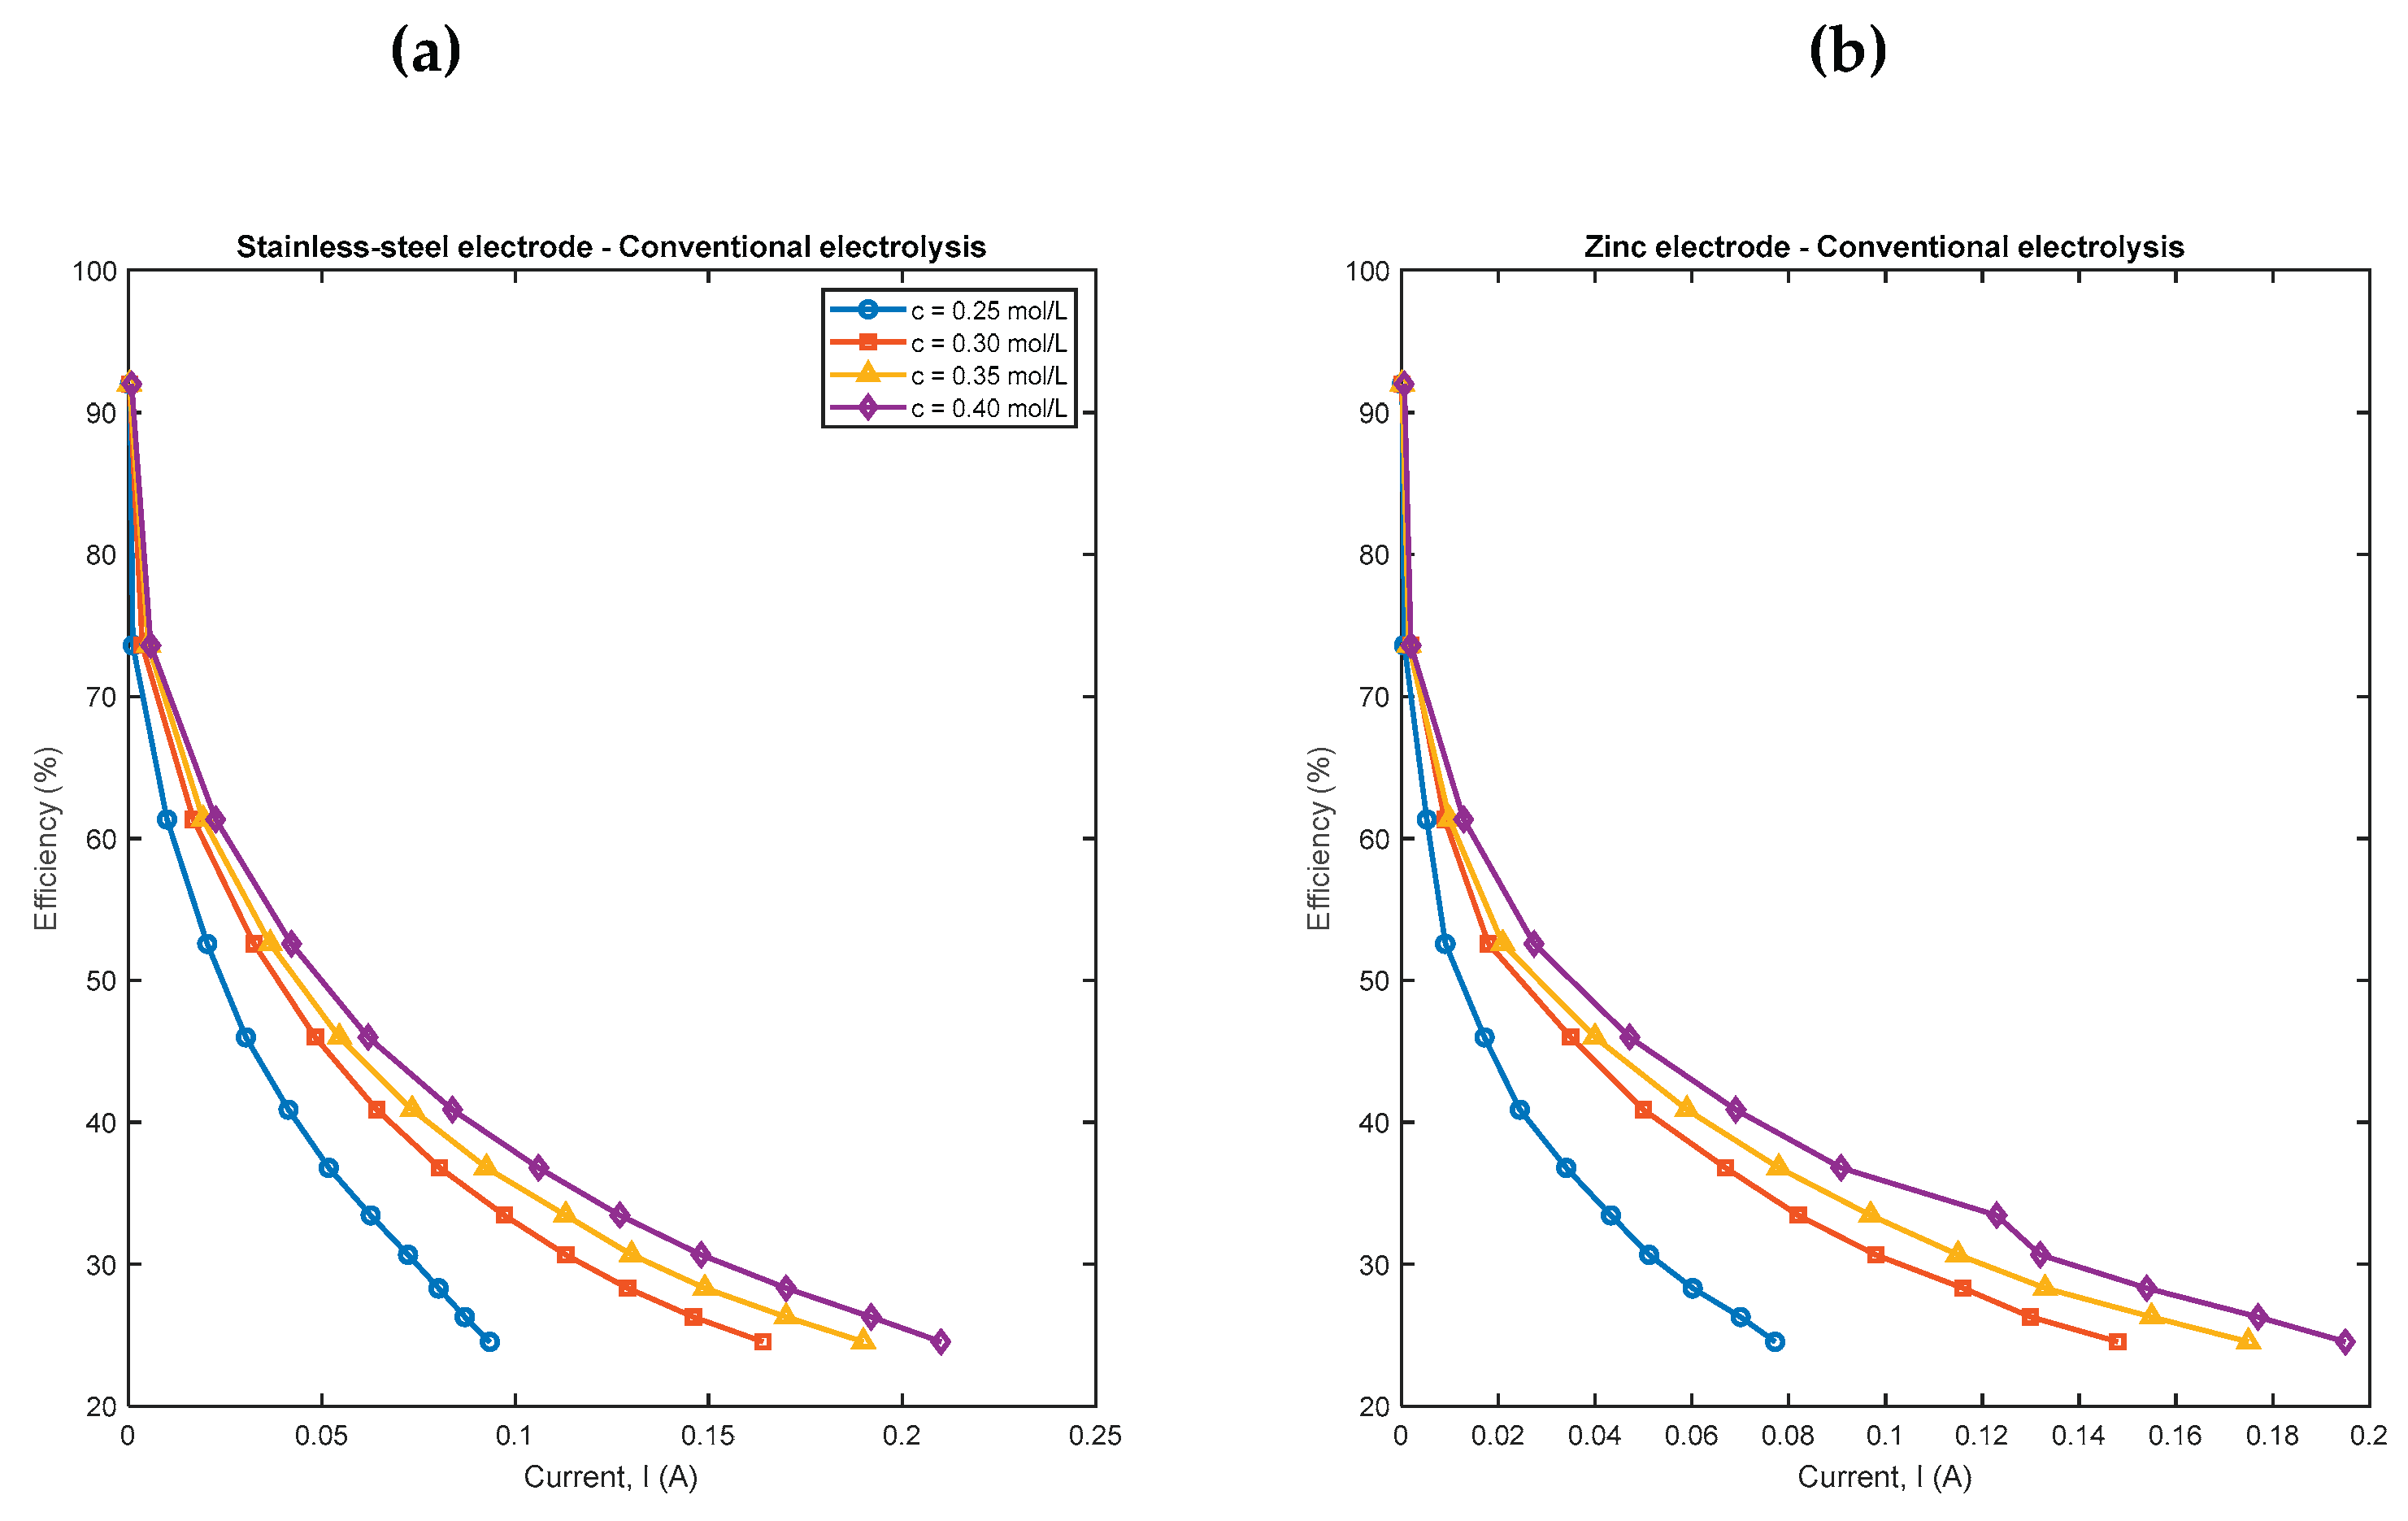
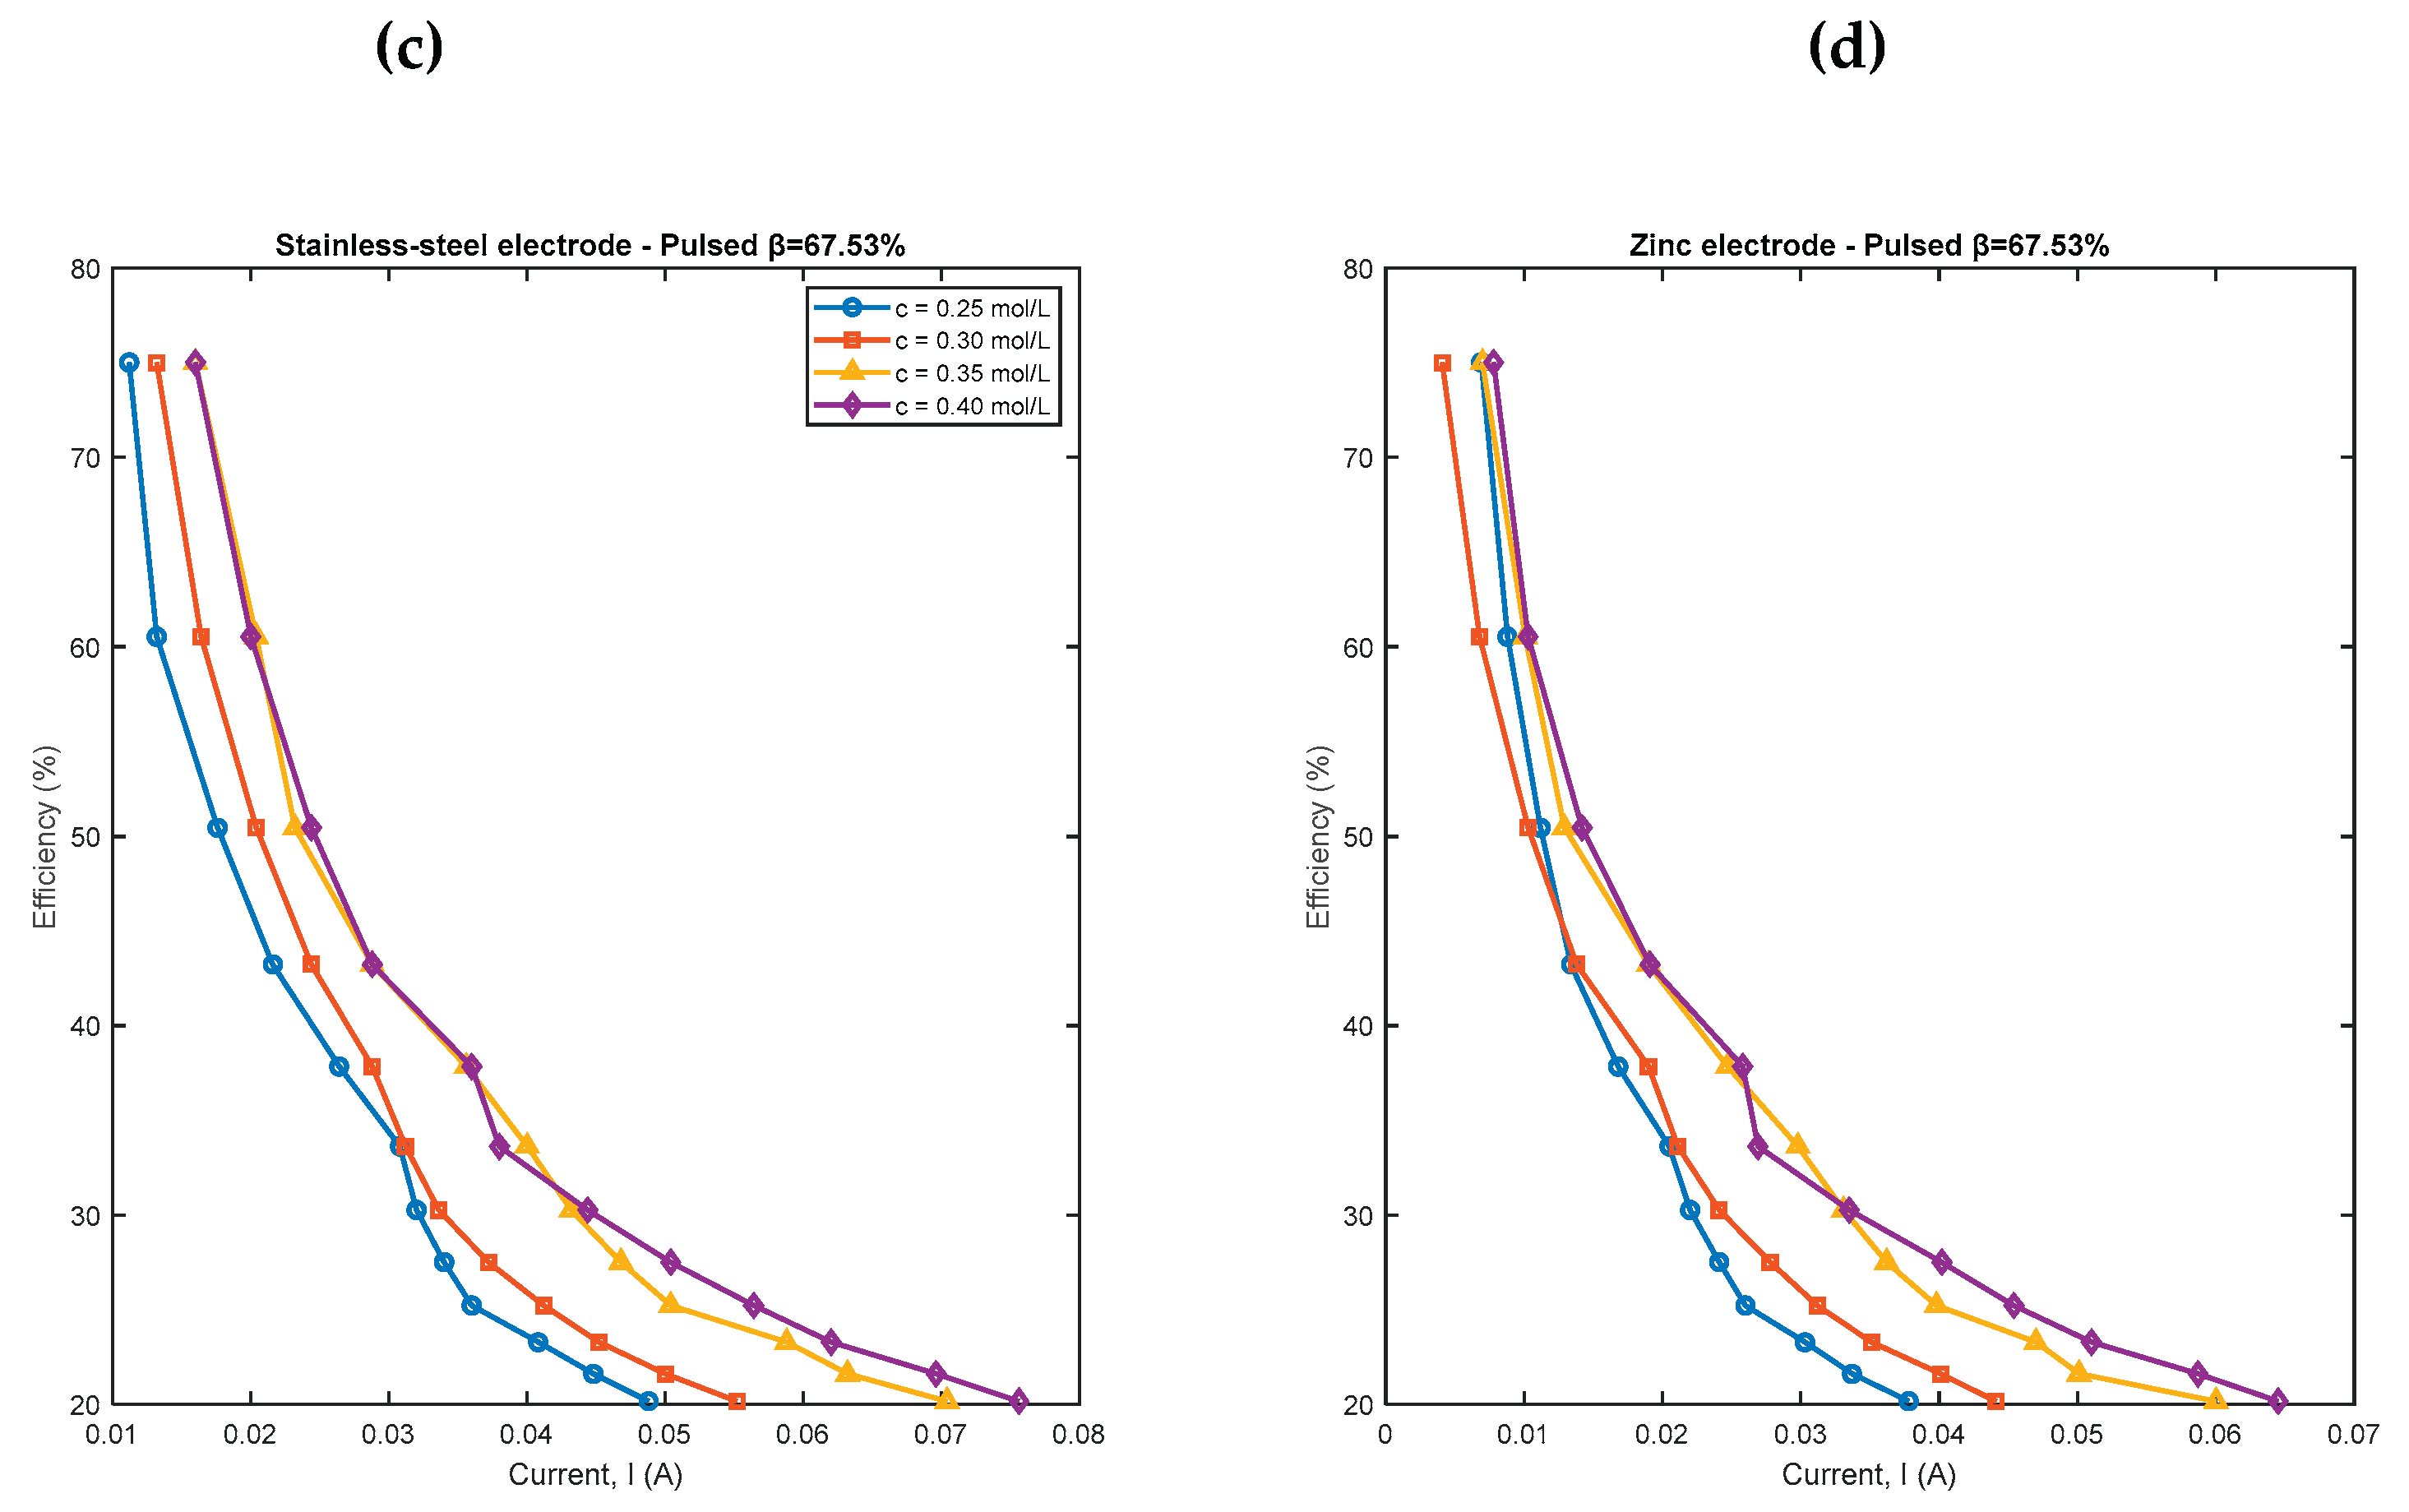
Figure 12.
I-U curves of concentration 0.40 mol/L for different values of β: (a) conventional and pulsed electrolysis for stainless-steel (SS) electrode, and (b) conventional and pulsed electrolysis for zinc electrode.
Figure 12.
I-U curves of concentration 0.40 mol/L for different values of β: (a) conventional and pulsed electrolysis for stainless-steel (SS) electrode, and (b) conventional and pulsed electrolysis for zinc electrode.
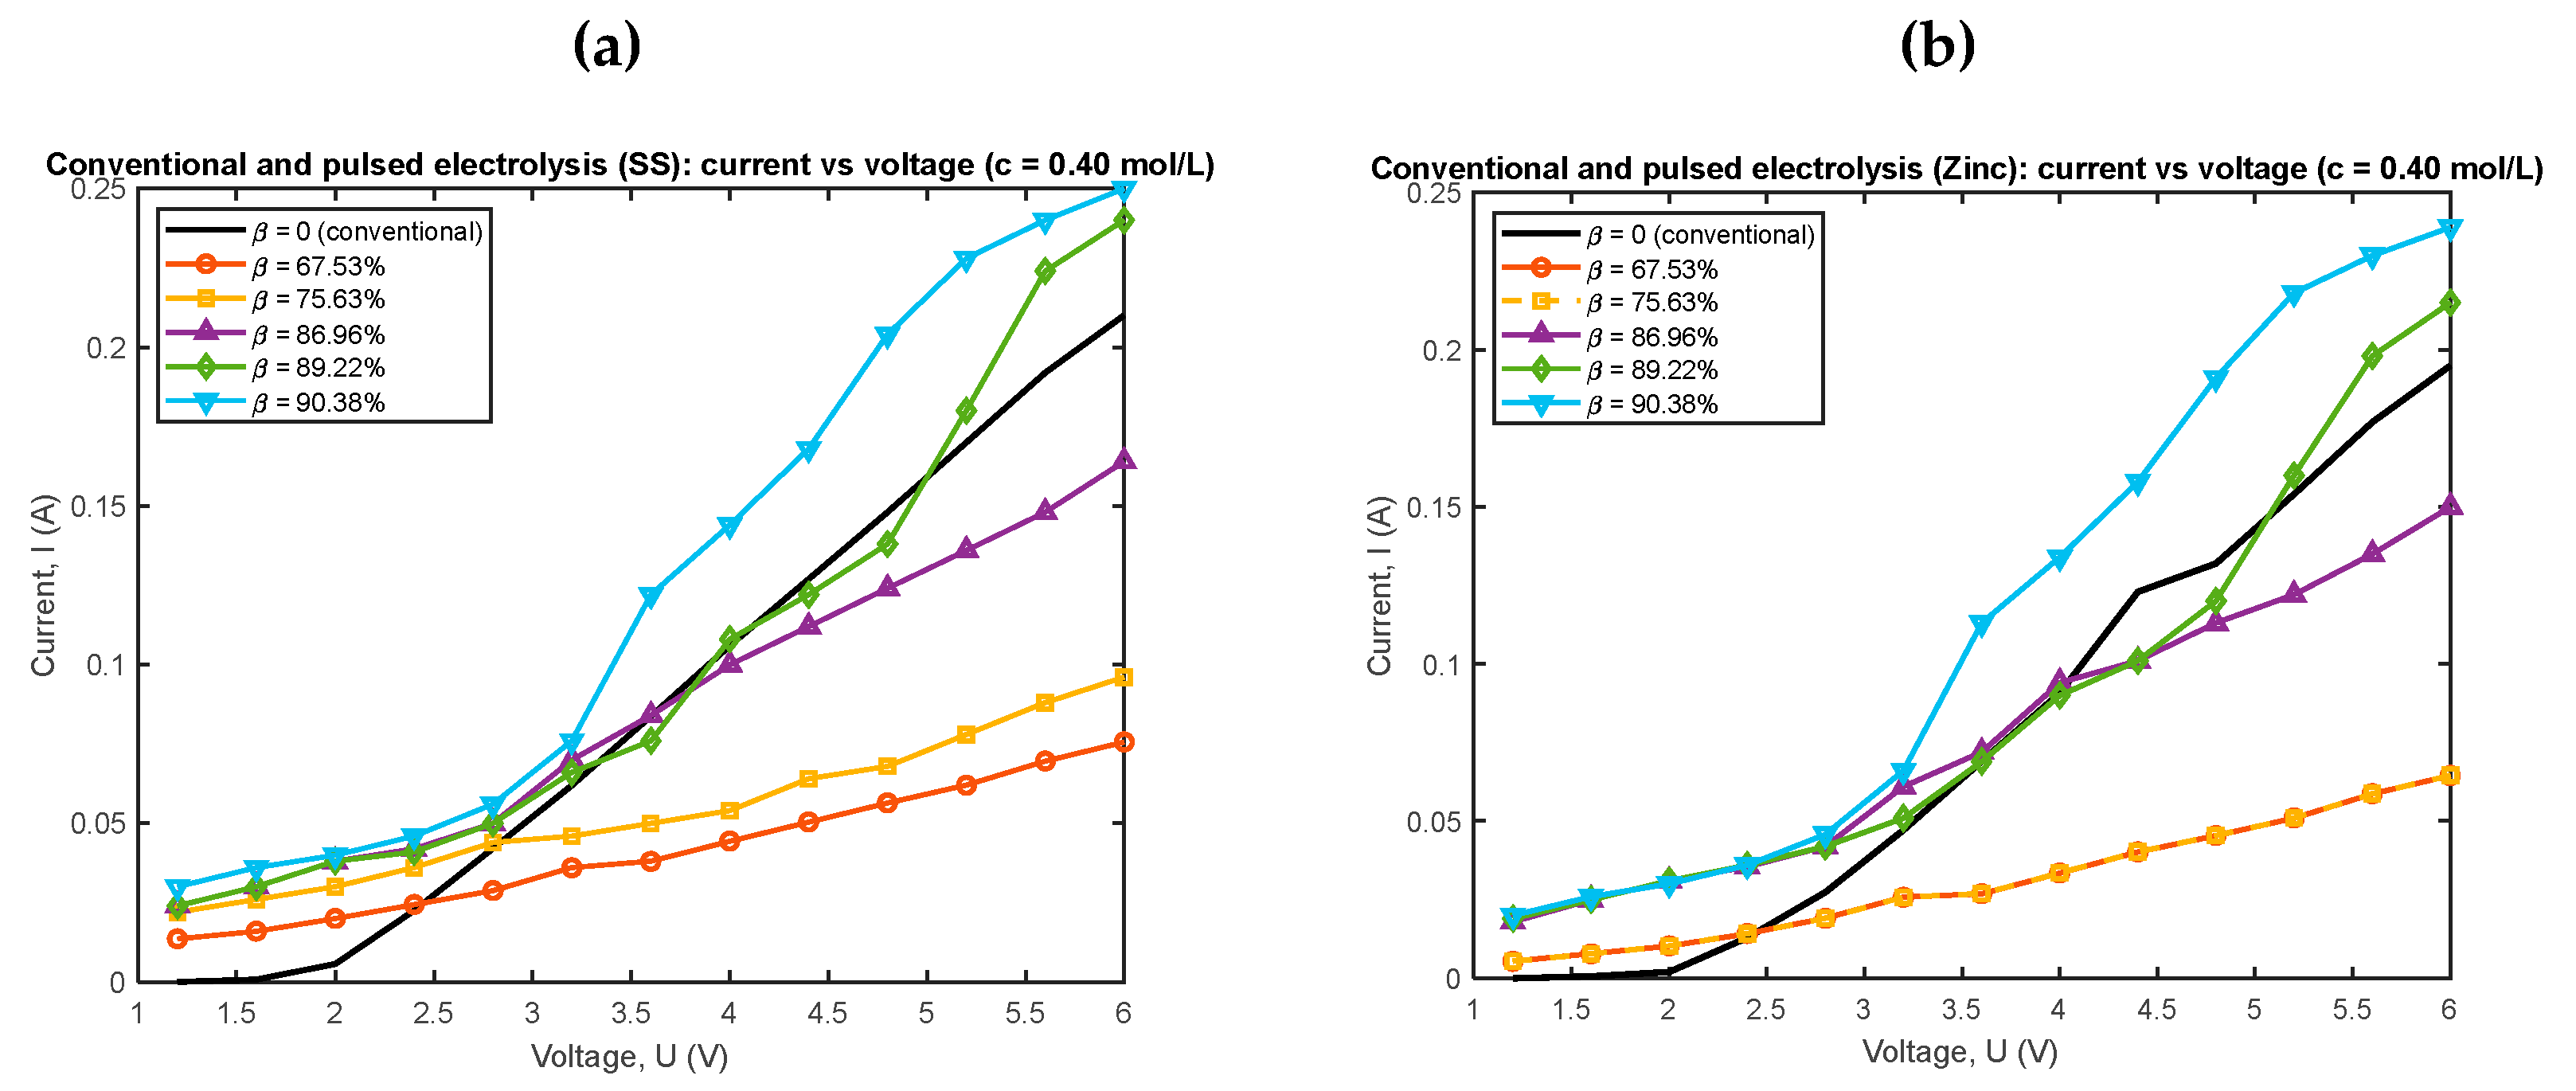
Figure 14.
Efficiencies vs current for a concentration of 0.40 mol/L for different values of β: (a) stainless steel (SS) and (b) zinc electrode.
Figure 14.
Efficiencies vs current for a concentration of 0.40 mol/L for different values of β: (a) stainless steel (SS) and (b) zinc electrode.
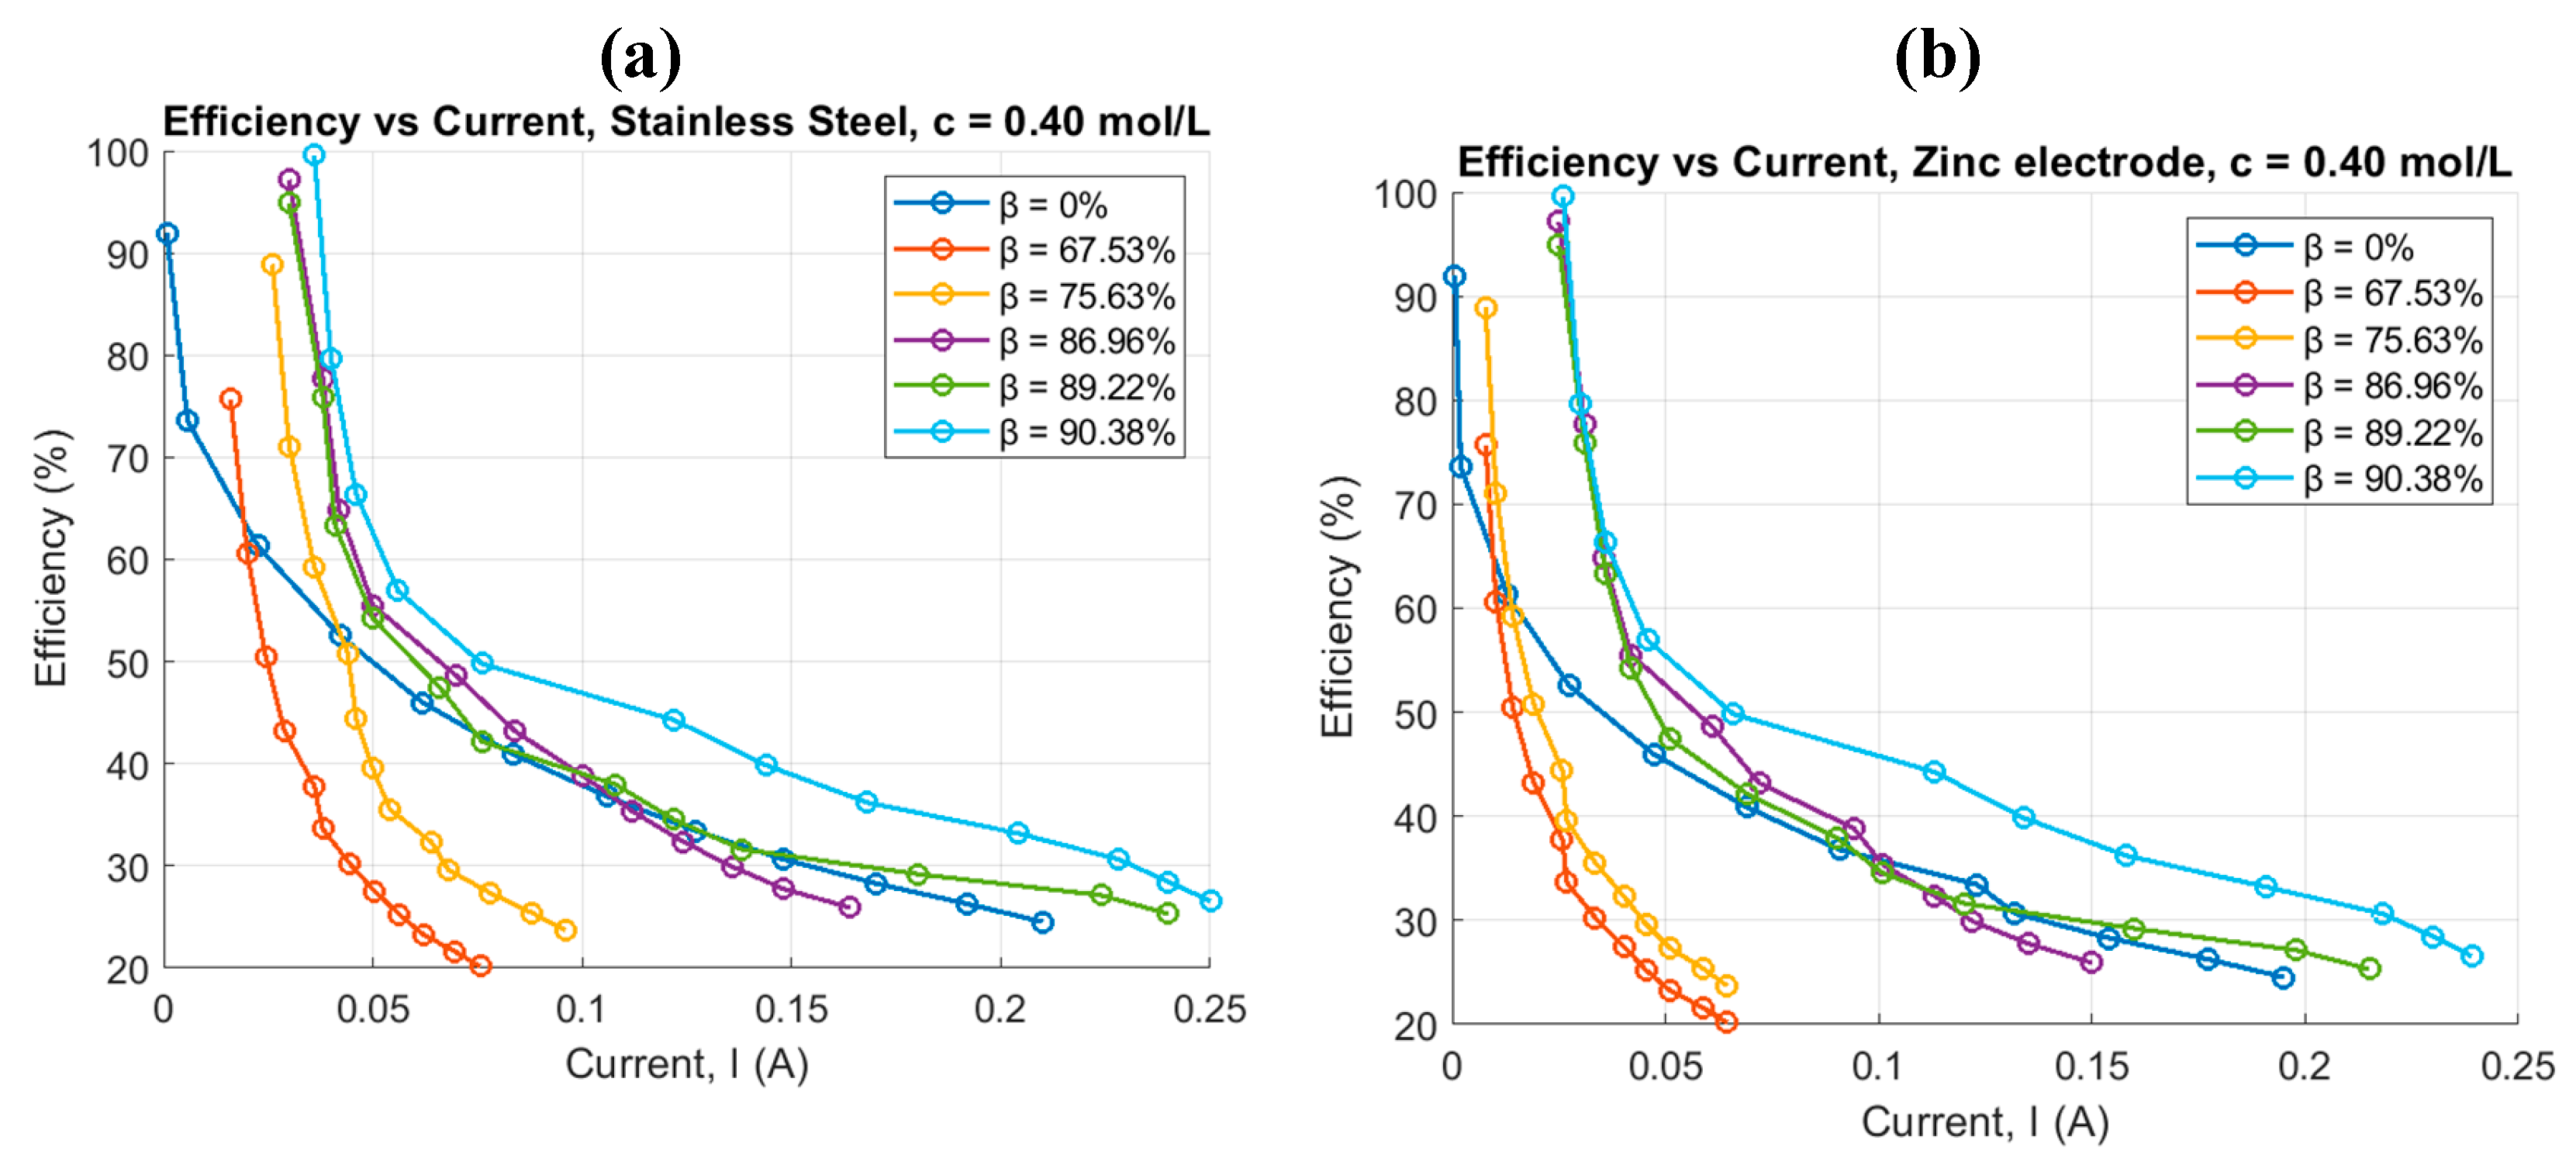

Table 1.
RS and Rct results for stainless-steel (SS) and zinc electrodes.
| Conventional electrolysis | Pulsed electrolysis | |||||||
|
SS |
c (mol/L) | RS (Ω) | Rct (Ω) | I0 (µA) | c(mol/L) | RS (Ω) | Rct (Ω) | I0 (mA) |
| 0.25 | 60.14 | 540.77 | 23.4 | 0.25 | 100 | 1.23 | 10.24 | |
| 0.30 | 22.85 | 1118.69 | 11.3 | 0.30 | 79.96 | 1.17 | 10.77 | |
| 0.35 | 19.51 | 485.15 | 26.0 | 0.35 | 67.65 | 0.97 | 13.08 | |
| 0.40 | 19.93 | 199.39 | 63.3 | 0.40 | 58.56 | 0.94 | 13.44 | |
|
Zinc |
0.25 | 19.42 | 269.85 | 46.78 | 0.25 | 587.87 | 2.31 | 5.47 |
| 0.30 | 19.03 | 597.20 | 21.14 | 0.30 | 56.40 | 2.54 | 4.97 | |
| 0.35 | 24.87 | 1383.60 | 91.24 | 0.35 | 88.53 | 5.37 | 2.35 | |
| 0.40 | 46.64 | 164.18 | 76.89 | 0.40 | 106.36 | 2.41 | 5.23 | |
Table 2.
RS and Rct results for the stainless-steel (SS) and zinc electrodes.
| Conventional electrolysis | Pulsed electrolysis, c = 0.40 mol/L | |||||||
|
SS |
c (mol/L) | RS (Ω) | Rct (Ω) | I0 (µA) | β (%) | RS (Ω) | Rct (Ω) | I0 (mA) |
|
0.40 |
19.93 |
199.39 |
63.3 |
67.53 | 58.56 | 0.94 | 13.44 | |
| 75.63 | 14.46 | 0.57 | 22.2 | |||||
| 86.96 | 28.38 | 0.53 | 23.9 | |||||
| 89.22 | 12.43 | 0.53 | 23.9 | |||||
| 90.38 | 36.26 | 0.42 | 30.1 | |||||
|
zinc |
0.40 |
46.64 |
164.18 |
76.89 |
67.53 | 106.36 | 2.41 | 5.23 |
| 75.63 | 58.87 | 3.58 | 3.53 | |||||
| 86.96 | 28.53 | 1.07 | 11.79 | |||||
| 89.22 | 13.87 | 1.02 | 12.37 | |||||
| 90.38 | 37.84 | 0.96 | 13.09 | |||||
Disclaimer/Publisher’s Note: The statements, opinions and data contained in all publications are solely those of the individual author(s) and contributor(s) and not of MDPI and/or the editor(s). MDPI and/or the editor(s) disclaim responsibility for any injury to people or property resulting from any ideas, methods, instructions or products referred to in the content. |
© 2025 by the authors. Licensee MDPI, Basel, Switzerland. This article is an open access article distributed under the terms and conditions of the Creative Commons Attribution (CC BY) license (http://creativecommons.org/licenses/by/4.0/).
Copyright: This open access article is published under a Creative Commons CC BY 4.0 license, which permit the free download, distribution, and reuse, provided that the author and preprint are cited in any reuse.


