Preprint
Article

This version is not peer-reviewed.

A Test of the Adaptive Lag Hypothesis of the Evolution of Cancer Suppression and Lifespan in Dog Breeds

Submitted:

23 December 2025

Posted:

23 December 2025

You are already at the latest version

Abstract

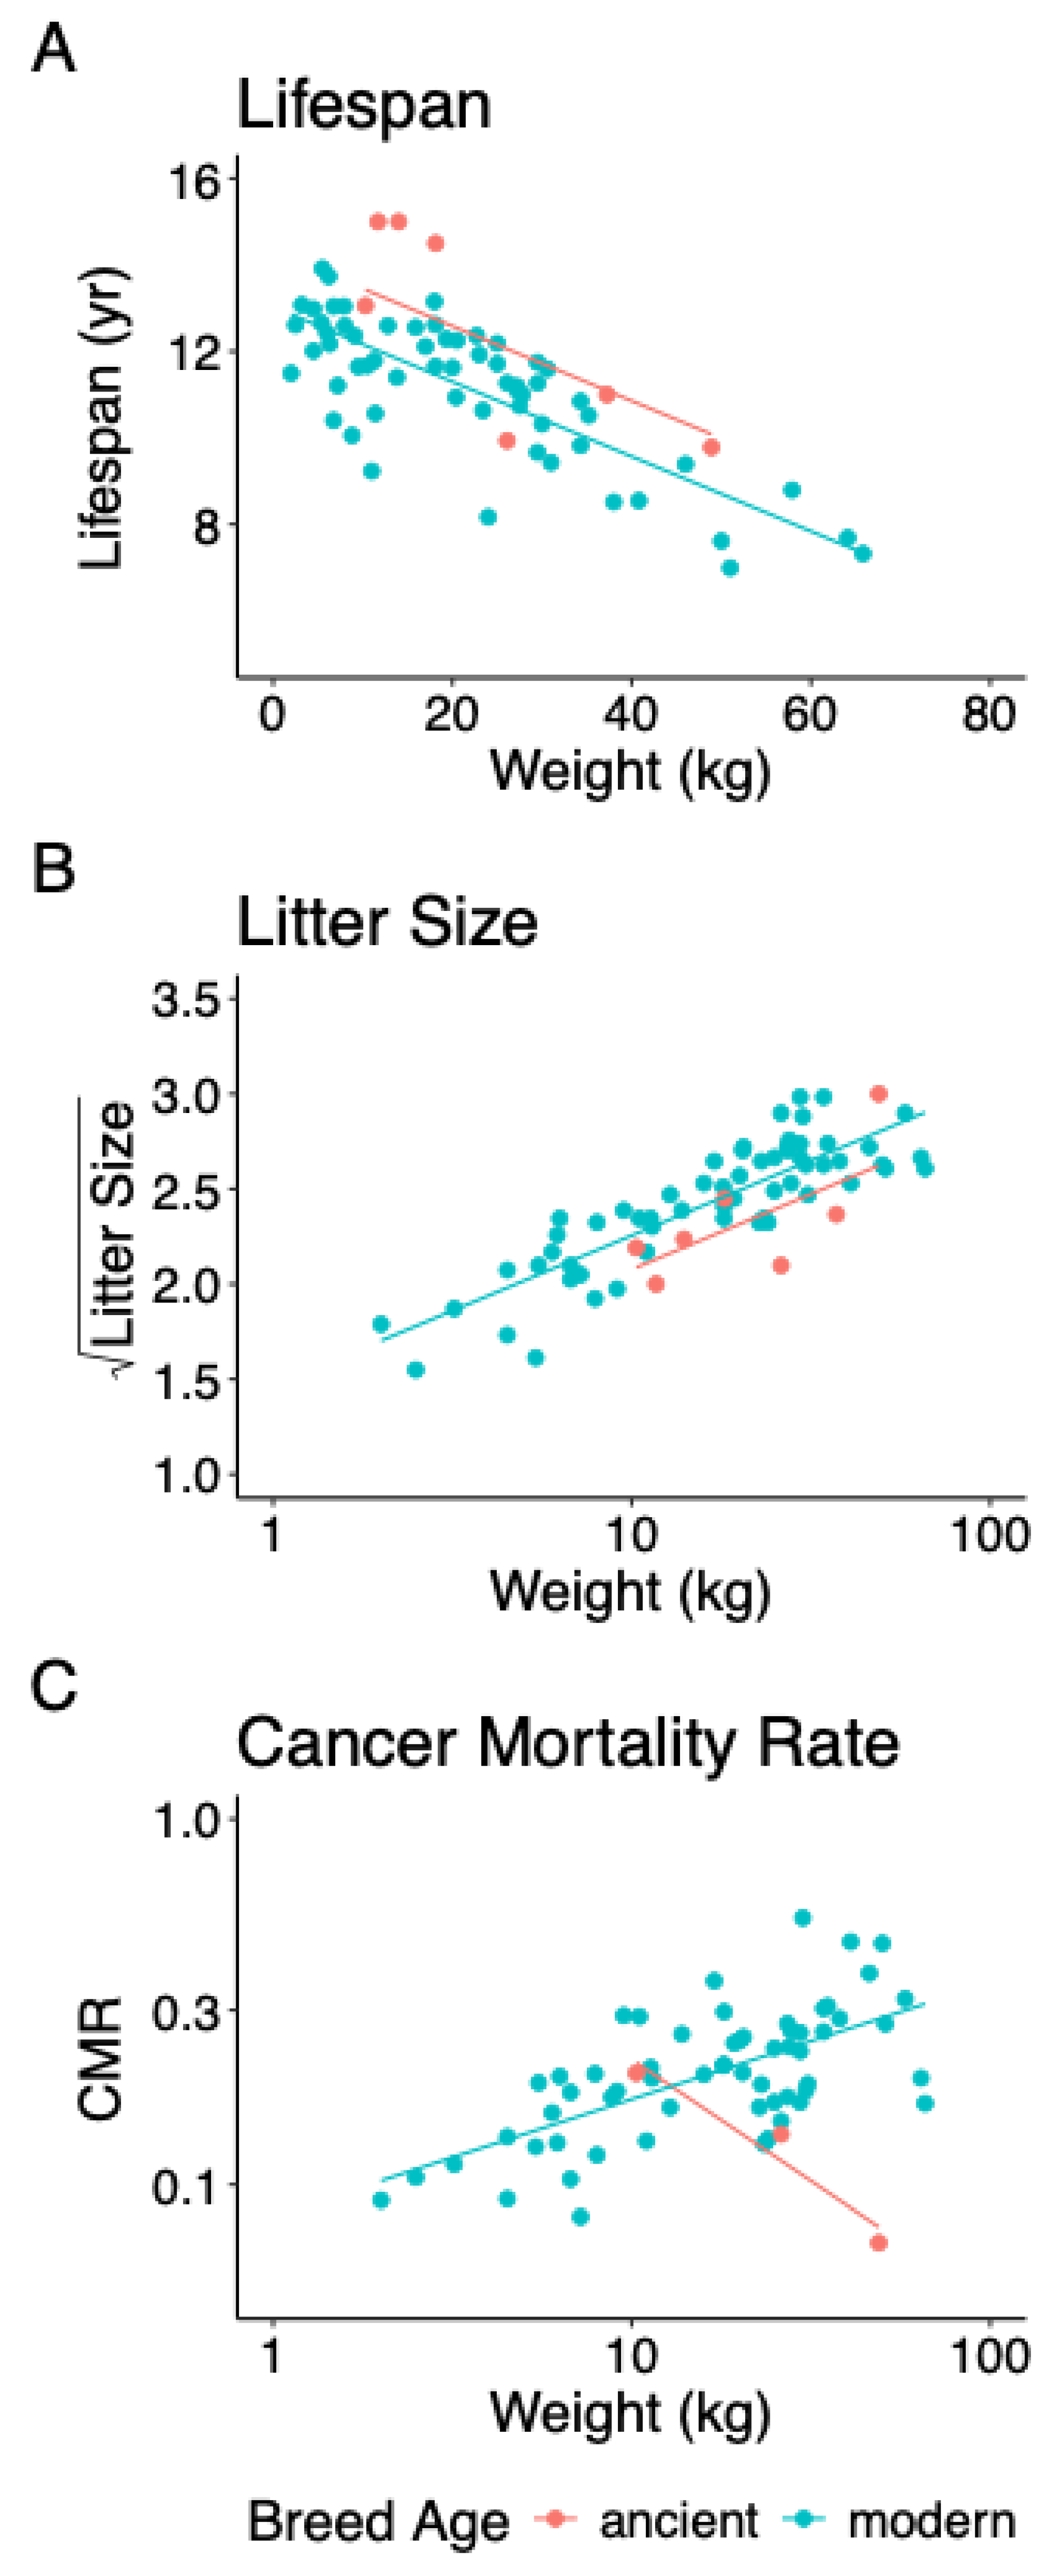
Background/Objectives: The well-established inverse relationship between lifespan and weight across dog breeds is associated with higher cancer mortality in larger breeds. However, Peto’s Paradox implies that larger-bodied species experience lower than expected cancer mortality because of higher levels of cancer suppression. Therefore, it has been hypothesised that recently established large dog breeds experience high cancer mortality because of a lag in their evolution of cancer suppression. This “adaptive lag hypothesis” predicts that ancient breeds, which have had more time to evolve optimal cancer suppression, exhibit lower cancer mortality rates, longer lifespans, and smaller litter sizes (a cost of cancer suppression) compared to modern breeds of the same size. Methods: The adaptive lag hypothesis is tested here by comparing ancient and modern breeds defined by their levels of modern European genetic admixture. Results: Ancient breeds have significantly longer lifespans and smaller litters than modern breeds of the same size after controlling for phylogenetic relationships. The sparse data on cancer mortality rates of ancient breeds do not allow a definitive test of a difference between ancient and modern breeds, but ancient breeds show a significant departure from the increase in cancer mortality rate with weight observed for modern breeds. Conclusions: The results are consistent with the adaptive lag hypothesis, that the evolution of cancer suppression in large modern dog breeds has lagged behind their increased risk of cancer, thus shortening their lives compared to smaller breeds and compared to ancient breeds of the same size.

Keywords: 
;  ;  ;  ;  ;  

1. Introduction

The well-established decrease in individual lifespan with increasing body weight in dogs (Canis familiaris) is associated with cancer mortality, the only studied cause of death whose rate increases with breed-specific body weight [1,2]. Larger individuals of any animal species are expected to have greater susceptibility to cancer because most cancers are the result of somatic mutations arising from stem-cell division [3,4,5,6,7,8,9]. Taller humans also have on average shorter lives and higher rates of cancer [10,11,12]. The increase in cancer mortality rate with size in dogs may be explained by a multistage model of carcinogenesis with four driver mutations [13], which is consistent with an increase in the number of stem-cell divisions with size.
However, larger species of mammal generally live longer than smaller species [14,15,16,17]. In addition, larger species of mammal do not appear to have higher cancer mortality rates than smaller species [18,19,20,21,22], a pattern known as Peto’s paradox [but see 23]. Peto’s paradox implies that larger species invest more in cancer suppression [24,25,26], which appears to be the case [27,28,29]. More effective cancer suppression in larger species is also consistent with only a 3-fold range in somatic mutation burden across mammals compared to a 40,000-fold range in body mass [30].
Peto’s paradox has led to the hypothesis that larger dog breeds experience higher rates of cancer mortality because the evolution of greater cancer suppression has lagged behind recent rapid increases in size [24,25,31]. Selection for extremely large size in some modern breeds has occurred very recently, well after breed establishment [32]. The hypothesis implicitly assumes that cancer suppression, through the inhibition and repair of DNA damage and the control of cellular proliferation [27,28], has fitness costs and thus is optimised to maximise fitness [33,34]. This assumption is supported by reduced growth and reproduction in dogs and laboratory mice with increased cancer suppression [35,36,37,38,39,40,41,42]. Alternatively, there is no selection for greater cancer suppression in large dog breeds because selective breeding tends to occur at young ages while most cancer mortality occurs at old ages [13]. The hypothesis that increased cancer suppression has lagged behind recent increases in size (the adaptive lag hypothesis) is tested here with a recently published high-quality dataset on cancer mortality rates in dog breeds [43].
The adaptive lag hypothesis can be tested in dogs because most European breeds were established only in the last 200 years, while other, “ancient”, breeds were established more than 500 years ago [1,44,45,46,47,48,49]. The recent establishment of modern European breeds may have provided insufficient time for their evolution of optimal cancer suppression [1,43]. Thus, ancient breeds are predicted here to have evolved levels of cancer suppression closer to their optima than have modern breeds. This hypothesis predicts that ancient breeds have lower cancer mortality rates, longer lifespans, and smaller litters (a cost of cancer suppression) than modern breeds of the same size.
To test these predictions, published data on the genetic admixture of dog breeds [50,51] were used to identify ancient breeds and their lineal relationships. After controlling for phylogeny, ancient breeds were found to live longer and have smaller litters than modern breeds of the same size, as predicted. Cancer mortality rate increases with body size for modern breeds but appears to decrease with body size for the few ancient breeds for which data are available. These results are consistent with the adaptive lag hypothesis and help explain the inverse relationship between lifespan and body weight in dogs.

2. Materials and Methods

2.1. Identification of Ancient and Modern Breeds

The proportion of a breed’s modern European ancestry, based on the genetic admixture data [50], is the average of 10 individuals for each breed. Ancient breeds were defined as those containing < 20% modern European ancestry. Seven ancient breeds were identified in this manner (Table B1). Using a less stringent cut-off resulted in the inclusion of breeds that are known to have been established recently (e.g., eurasier) [44]. Ancient breeds were compared to modern European breeds, defined as those containing ≥ 90% modern European ancestry. One hundred and four modern European breeds were identified (Fig. A1).

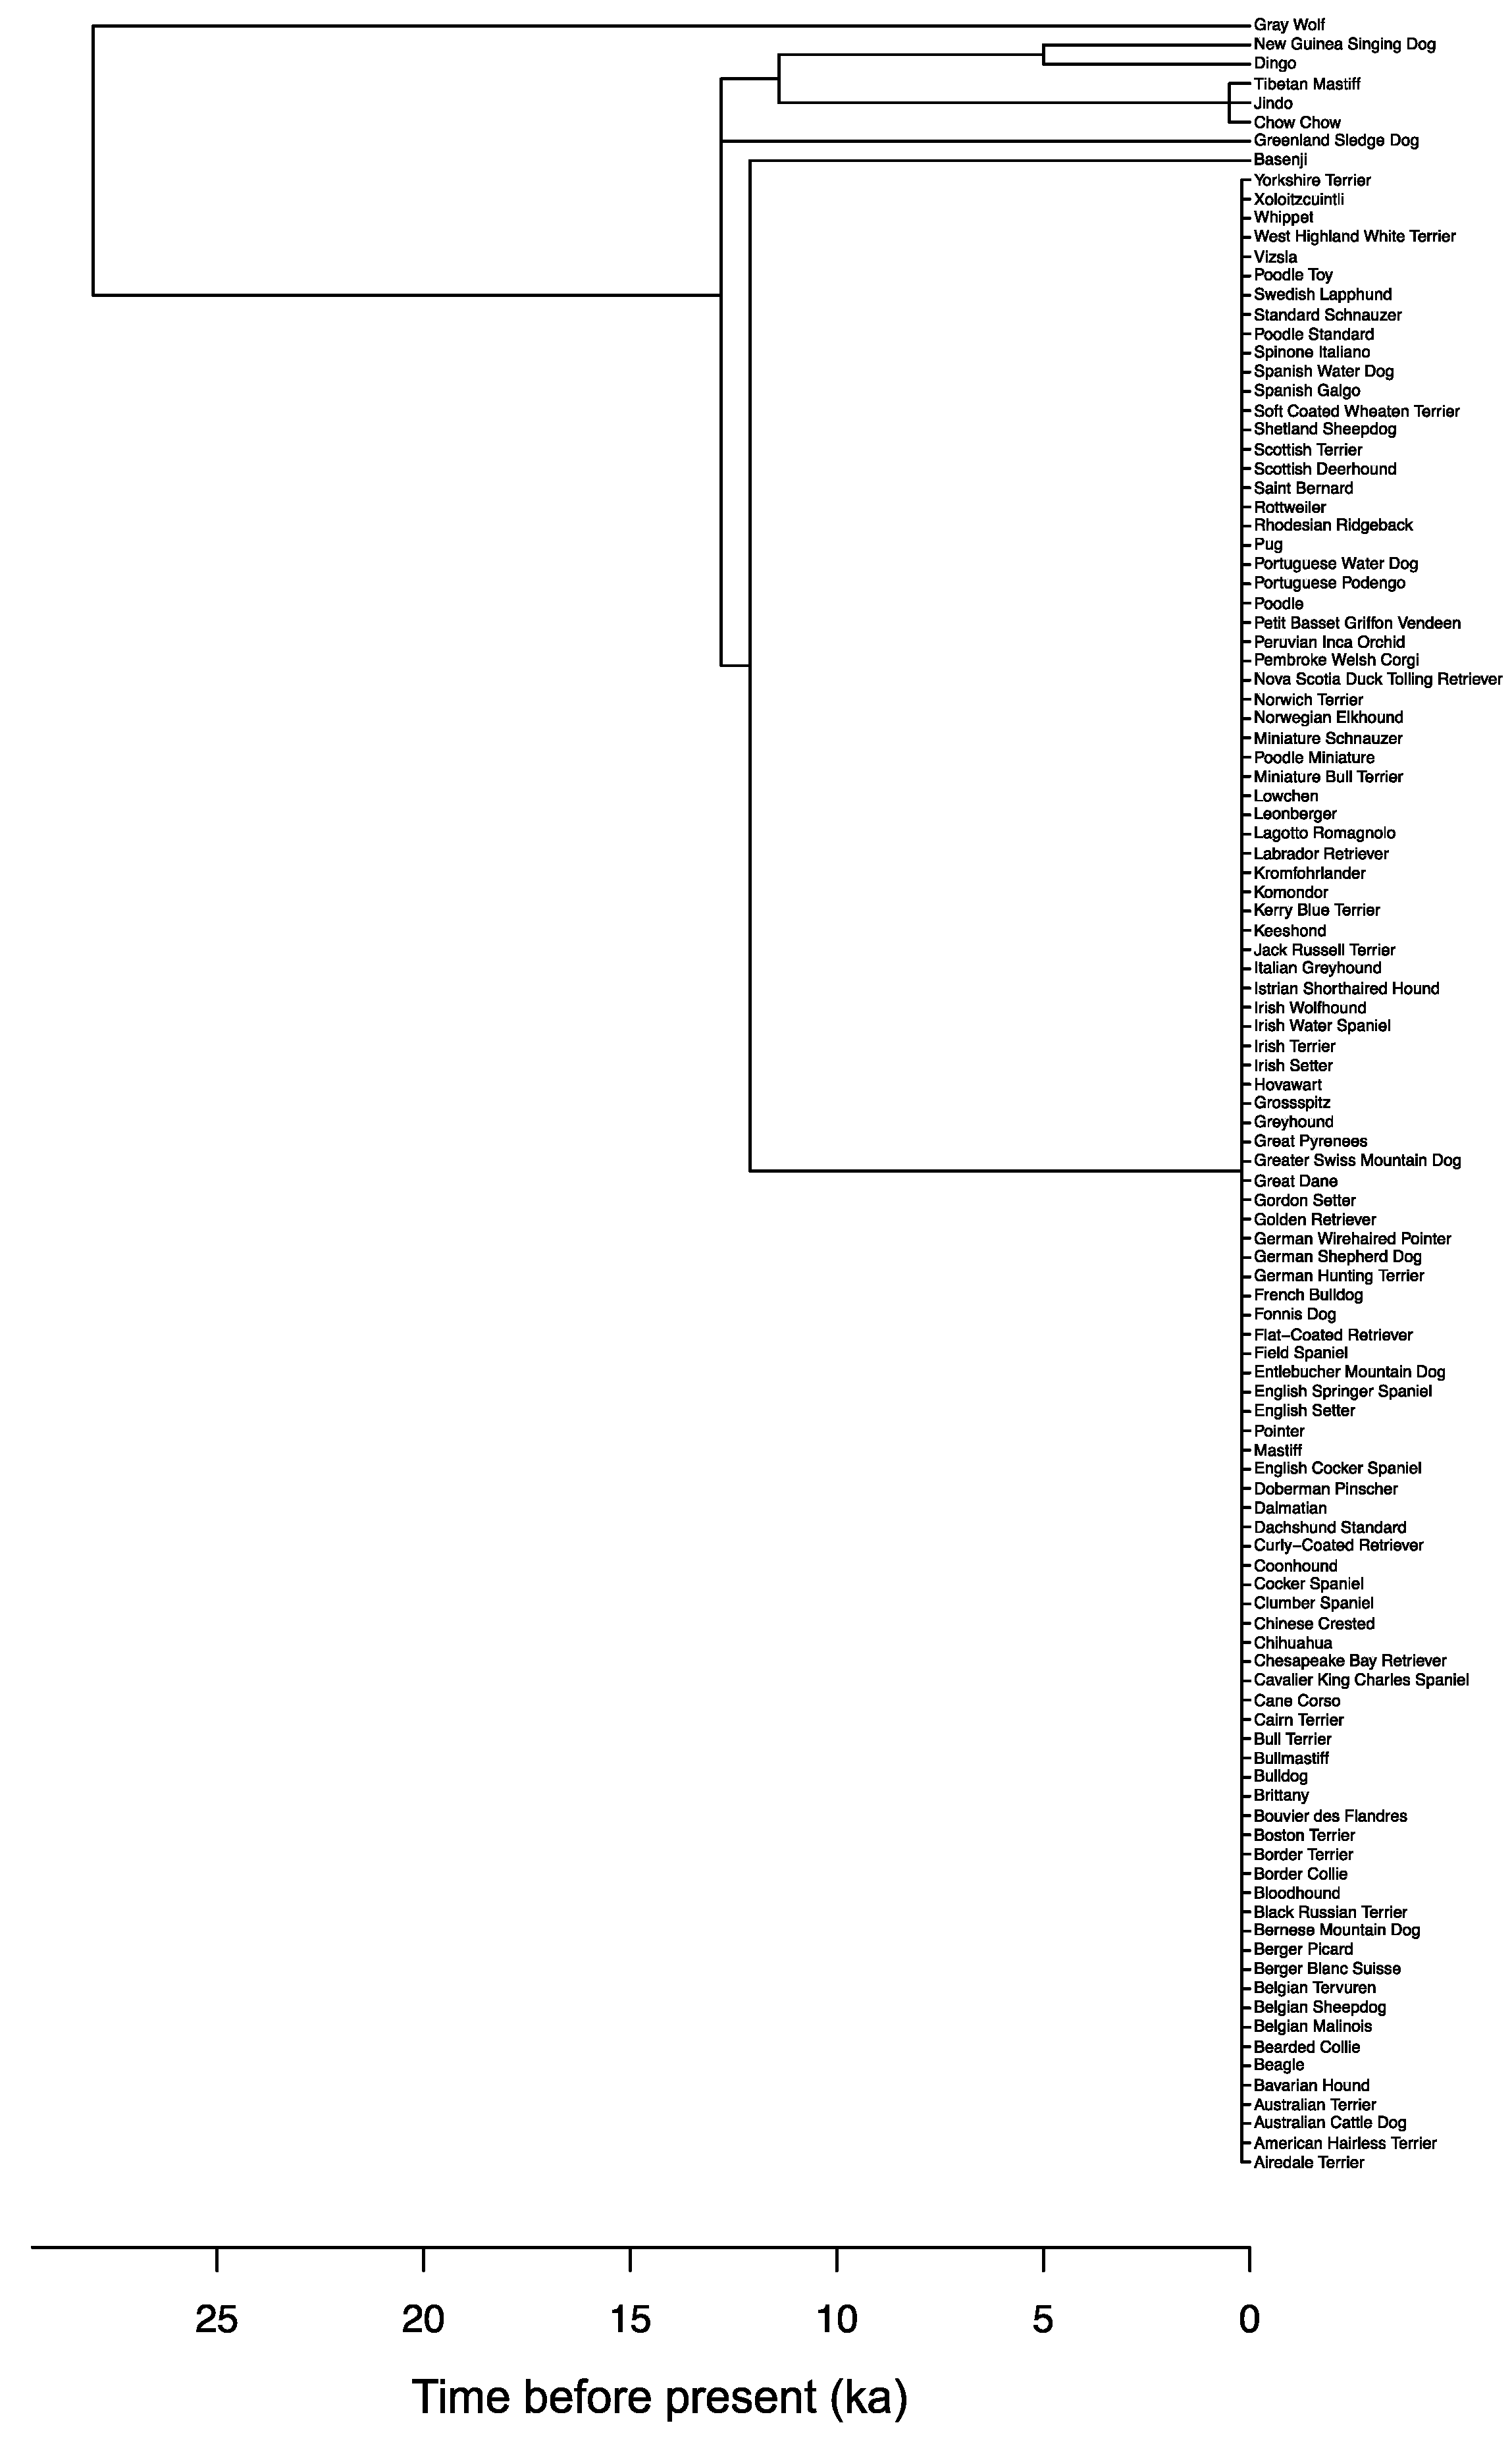
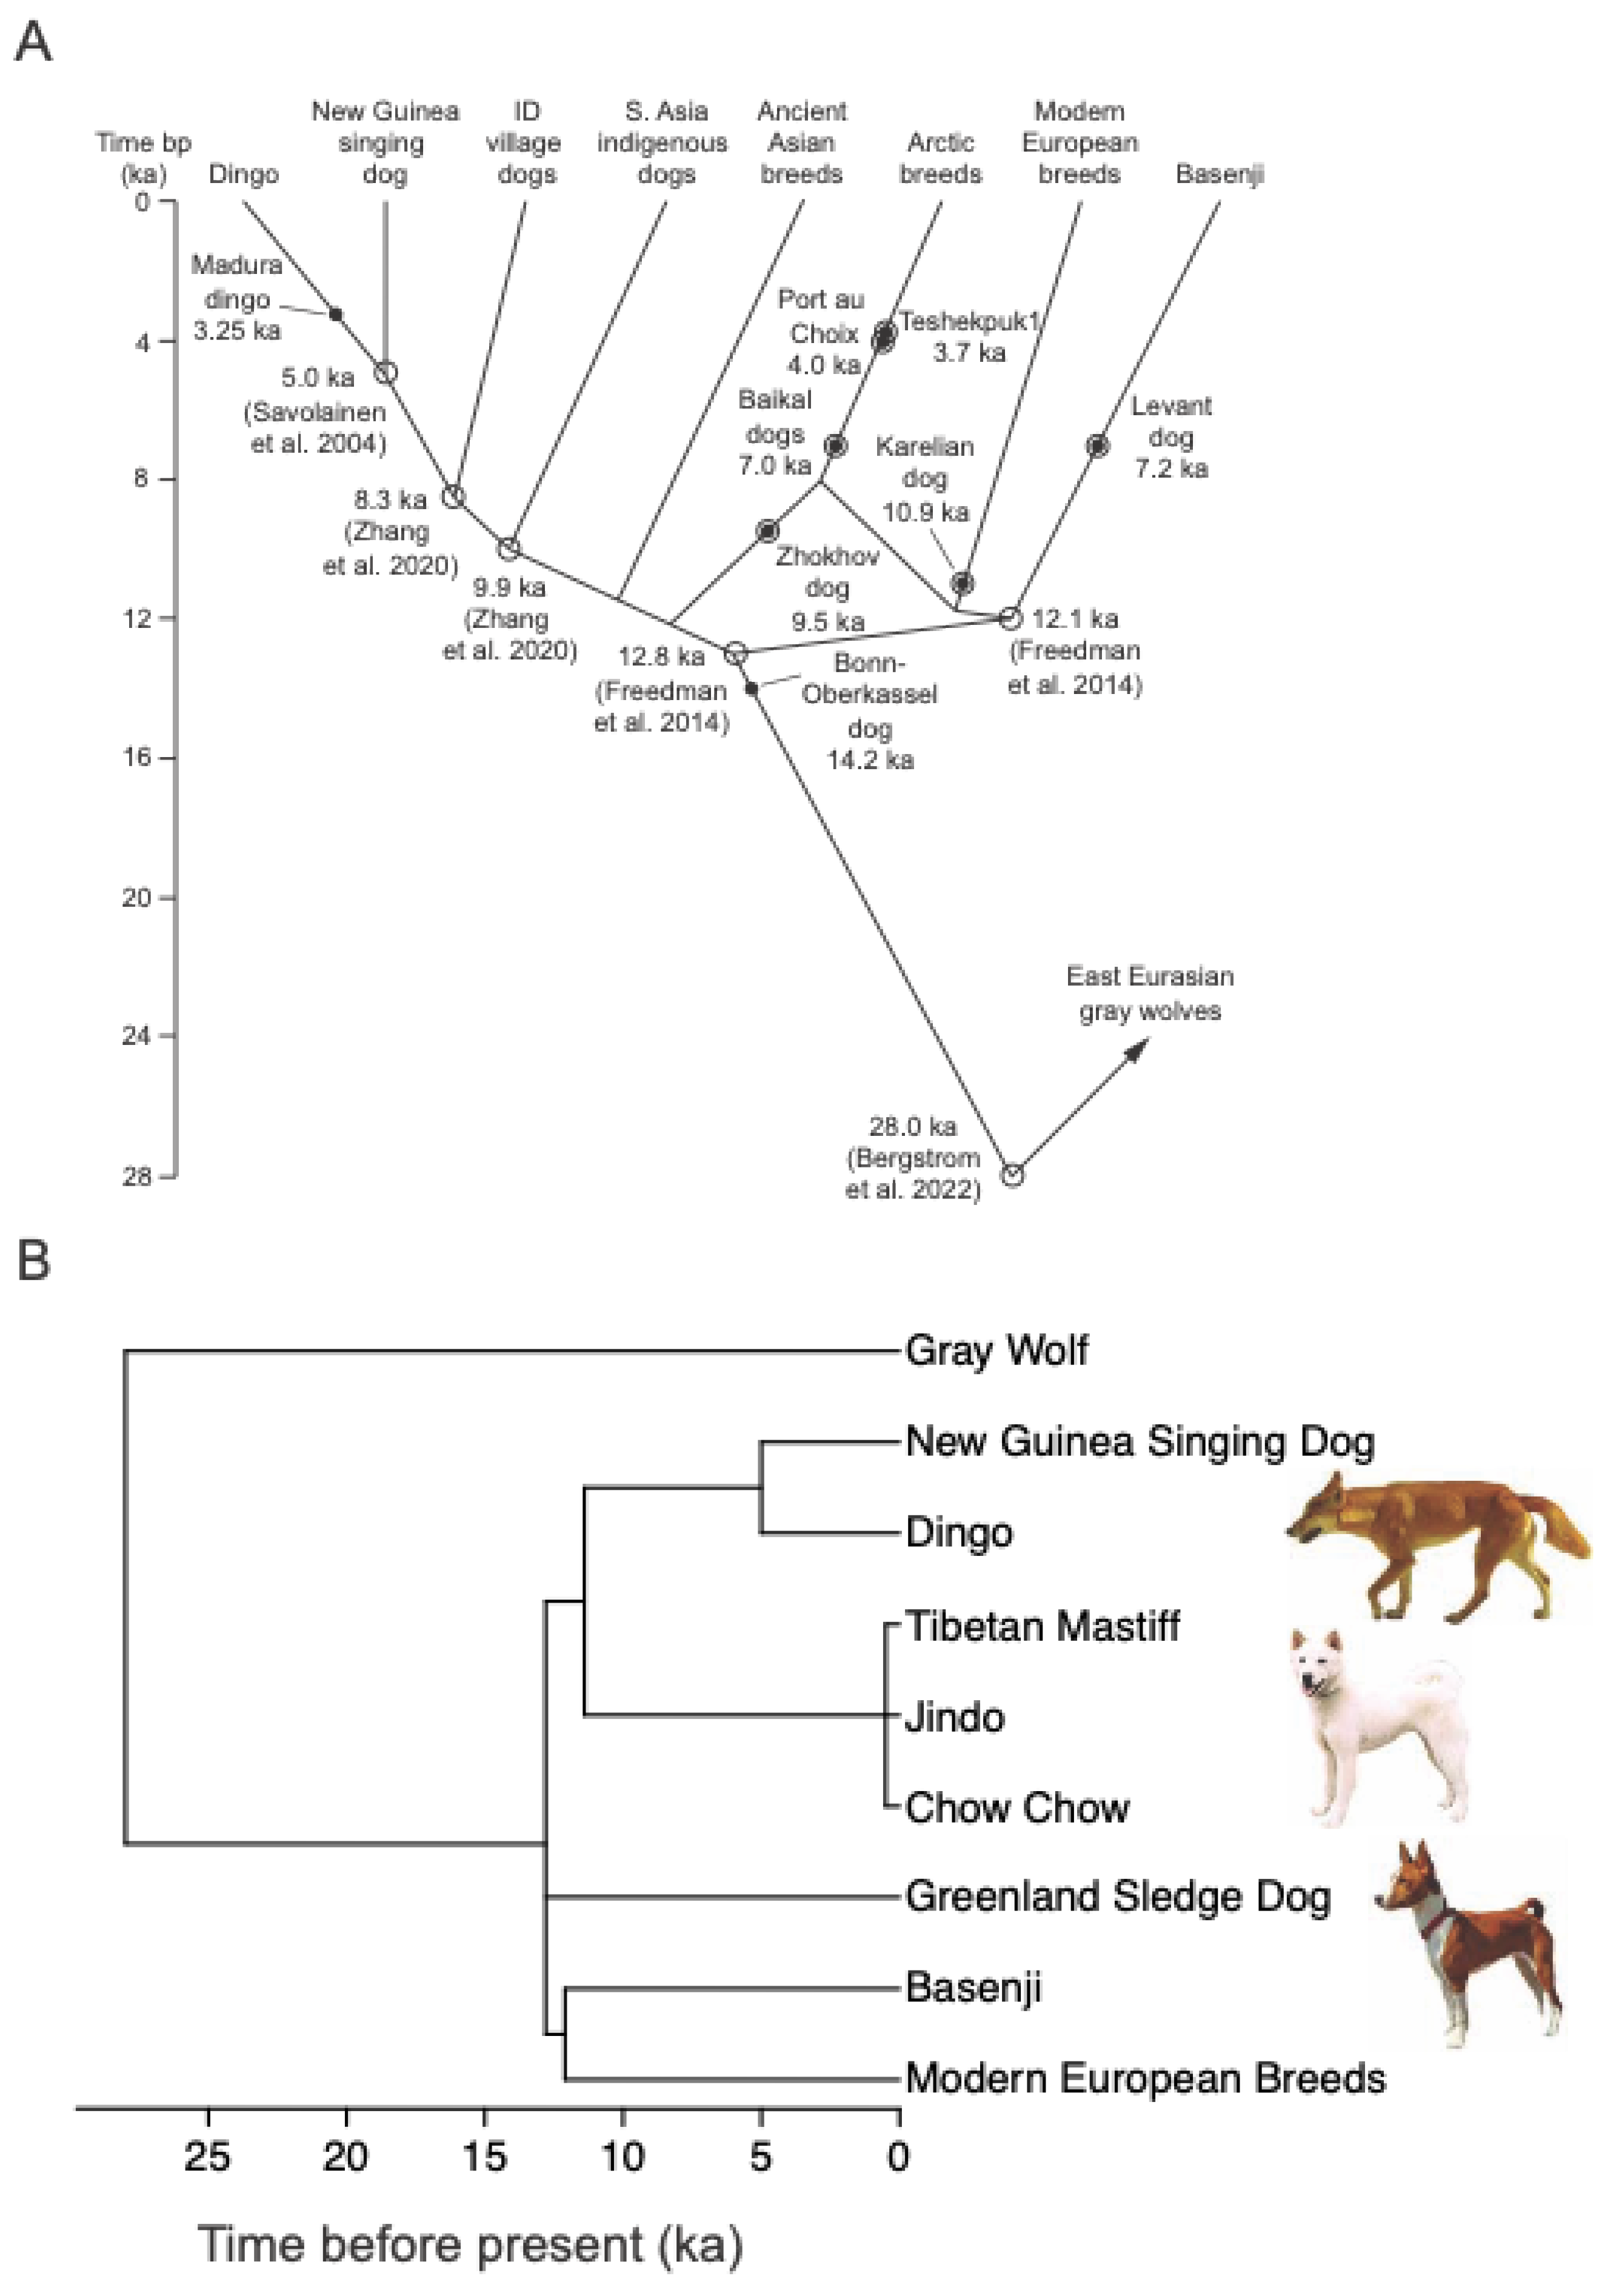
2.2. Ancient Breed Lineages and Phylogeny

A composite diagram of the time-scaled lineage relationships of ancient dogs, including ancient admixtures (Figure 1A), was constructed from multiple sources [47,49,51,52,53,54,55]. This diagram was converted to a time-scaled phylogeny of breeds (Figure 1B) that was used in phylogenetic comparative analyses (see below). In constructing the breed phylogeny, the ancient Asian breeds (Tibetan mastiff, jindo, and chow chow) are assumed to form a polytomy with terminal branches of length 500 years since their time-scaled phylogenetic relationships have not been determined [44,45,46]. The dates of origin of most modern European breeds in their current forms are not available, and those that are available are from the last 200 years [1,44]. Therefore, modern European breeds are represented as a polytomy with terminal branches of length 200 years (Fig. A1).

2.3. Breed Life History Data

High-quality data on body weights, lifespans and causes of death for 118 breeds are from Kraus, Snyder-Mackler and Promislow [43]. They report breed standard body weights primarily from the Fédération Cynologique Internationale. Their breed lifespans and causes of death are from the koiranet public database of the Finnish Kennel Club. Mean lifespans were calculated from owner-reported ages at death for breeds with at least 80 reported deaths in the database. Only the 1988-2002 birth cohorts were used to avoid underestimating lifespans due to the inclusion of incomplete birth cohorts. Dogs that died due to extrinsic causes were excluded to provide an estimate of the potential lifespan. The percent mortality due to cancer (cancer mortality rate) for each breed was calculated as the proportion of dogs that died of cancer out of the dogs with a diagnosed cause of death. Mean breed litter sizes are from 224 breeds registered in the Norwegian Kennel Club from 2006 to 2007 [56].
Data on body weight, lifespan, litter size, and cancer mortality rate were available from the above sources for only three ancient breeds: basenji, Tibetan mastiff, and chow chow. For the remaining ancient breeds (dingo, New Guinea singing dog, jindo, and Greenland sledge dog), weight, lifespan, and litter size data are from various sources (Table B1). For the dingo and New Guinea singing dog, which exist mainly as feral populations, these data are from captive individuals, providing the best comparisons to other breeds. These data are typically reported as a range of values, in which case the midpoint was used. Lifespans from these sources represent potential lifespans and are therefore comparable to the cohort-corrected lifespans from Kraus, Snyder-Mackler and Promislow [43].

2.4. Phylogenetic Comparative Analyses

To account for the non-independence of breeds due to their phylogenetic relationships when testing for statistical relationships among life history variables, phylogenetic generalized least squares (PGLS) analyses [57] were used as implemented by the R package caper [58,59]. This method estimates the covariance between each pair of taxa using the branch lengths of a time-scaled (ultrametric) phylogeny. The initial covariance matrix is estimated assuming a Brownian motion model of evolution, in which phenotypes track adaptive optima that change incrementally and continuously in an unbiased random walk. To account for departures from strict Brownian motion, transformations are applied to improve the fit of the model to the data using maximum likelihood methods. The evolution of mammal body size is better described by biased Brownian motion than by alternatives such as “pulsed change” models or “adaptive landscape” models, including the Ornstein-Uhlenbeck model [60].
Continuous variables were transformed when necessary to correct for curvilinearity or heteroscedasticity (non-homogeneity of variance) and to normalize the distribution of residuals to meet the assumptions of parametric analyses of variance [61] and the related PGLS analyses. Contrary to a recent claim [23], cancer mortality rate is expected to evolve like any other life history trait because it reflects a balance between susceptibility to cancer, dependent on body size, and resource allocation to cancer suppression, a form of somatic maintenance. Log transformation of cancer mortality rate, a proportion, provides a better match to the assumptions than either the arcsine or logit transformations, which are often recommended for analyses of proportions [62]. A test of departure from normality (Jarque-Bera test for normality in the R package moments) of phylogenetic residuals from a PGLS regression of log-transformed cancer mortality rate on log-transformed adult body mass shows no significant departure (JB = 0.053118, P = 0.9738).

3. Results

3.1. Lifespan

Mean lifespan declines linearly with increasing body weight for both ancient and modern breeds, but ancient breeds have on average significantly longer lifespans across all body weights (no interaction) (Figure 2A; effect of breed age: ancient – modern = 1.2870 yr, SE = 0.3046, t = 4.2258, P = 7.58 x 10⁻⁵). An increase of 10 kg predicts a decline of 0.87 years for both ancient and modern breeds (slope = –0.0865, SE = 0.0083, t = –10.3796, P = 2.00 x 10⁻¹⁵), but ancient breeds live 1.29 years longer.
A seemingly weak effect of phylogeny, reflected in the lack of phylogenetic signal in the residuals of the analysis ( λ = 0 ), is the result of all modern breeds analysed (104 breeds) emanating from a single recent node in the phylogeny, creating a polytomy (Figure 1B and Fig. A1). When comparing modern and ancient breeds in the model, this phylogenetic structure is removed (running the analysis without breed age as a factor gives λ = 1 ). There is, however, evidence of recent rapid evolution of lifespan ( δ = 3 ) occurring mainly at breed divergences ( κ = 0.15 ), likely due to the indirect effects of recent strong selection on body size in modern breeds.

3.2. Litter Size

The square root of mean litter size increases linearly with the log of breed weight for both ancient and modern breeds, but ancient breeds have on average significantly smaller litters across all body weights (no interaction) (Figure 2B; effect of breed age: ancient – modern = –0.1778, SE = 0.0727, t = –2.4435, P = 0.0173). Increasing weight from 10 kg to 50 kg, the range for the ancient breeds analysed, increases predicted litter size for ancient breeds from 4.32 to 6.92 and increases predicted litter size for modern breeds from 5.09 to 7.89.

3.3. Cancer Mortality Rate

Tests of the effects of breed age (ancient versus modern) on cancer mortality rate are limited by cancer mortality rate being available for only three ancient breeds: basenji, Tibetan mastiff, and chow chow. On log scales, cancer mortality rate increases linearly with weight for modern breeds (slope = 0.3187) but decreases for ancient breeds (slope = –0.6639) (Figure 2C; interaction effect: F 1,60 = 11.9144 ,   P = 0.0010 ). This result suggests that the largest ancient breeds invest more in cancer suppression. The result may seem surprising given so few data from ancient breeds, but the analysis accounts for the numbers of modern and ancient breeds and their phylogenetic relationships, including the fact that the modern breeds share a very recent common ancestor. For modern breeds, increasing weight from 10 kg to 50 kg increases cancer mortality rate from 0.17 to 0.29.
The effects of each of lifespan and litter size on cancer mortality rate after controlling for weight and its interaction with breed age were also tested. Neither lifespan (slope = 0.0195, SE = 0.0145, t = 1.3448, P = 0.1839) nor litter size (slope = 0.0287, SE = 0.0202, t = 1.4229, P = 0.1601) explain any additional variance in cancer mortality rate.

4. Discussion

The increase in cancer mortality rate with body size in dogs is hypothesised to result from lags in the evolution of cancer suppression in response to the higher cancer burdens of recent increases in size [24,25,31]. Assuming that ancient dog breeds have had more time than modern breeds to evolve cancer suppression optimal for their size, this hypothesis predicts that large ancient breeds have longer lifespans, smaller litters, and lower cancer mortality rates than modern breeds of the same size. These predictions are generally confirmed. Ancient breeds have on average longer lifespans and smaller litter sizes than modern European breeds of the same body weight. Unfortunately, the small number of ancient breeds for which cancer mortality rates are available prevents a firm conclusion being made about the difference in cancer mortality rates between modern and ancient breeds. However, cancer mortality rate increases with weight for modern breeds but appears to decrease with weight for ancient breeds. This lends support to the hypothesis that ancient breeds have evolved greater cancer suppression at a cost of smaller litters. Such a trade-off is supported by findings that transgenic mice overexpressing the tumour suppressor gene TP53 are not only more resistant to cancer but also have lower growth rates, reduced size, shorter lifespans, and reduced fertility [40,41,42].
Alternatively, the longer lifespans and potentially lower cancer mortality rates of ancient breeds could be due to lower levels of inbreeding arising from less stringent selective breeding over longer periods, although there is no evidence for this [13,43]. In addition, lower levels of inbreeding would not explain the smaller litter sizes (lower fertility) of ancient breeds.
Nunney [13] has analysed the relationships between cancer mortality rate and body mass and lifespan across dog breeds and concludes that the variation of cancer mortality rate is explained by a multi-stage model of carcinogenesis with four driver mutations. However, Nunney argues that there is no selection for increased cancer suppression in large breeds since selective breeding occurs at young ages but most cancer mortality occurs at old ages. Selective breeding tends to occur before age 7 yr [56], the mean lifespan of some Giant breeds (Figure 2A), but there is substantial cancer mortality at these young ages. Cancer mortality rate averaged across 82 breeds, each with 100 individuals sampled, increases linearly from 0.12 to 0.39 over the ages 2-7 yr, and peaks at 0.41 at 10 yr Figure 3 in [2]. Therefore, at age 6 yr, the average cancer mortality rate is 0.34, 83% of the peak rate. Since these estimates are averages over a variety of breeds, Giant breeds may be assumed to have even higher rates. In addition, although cancer mortality increases with age, the proportion of a birth cohort alive diminishes with age and thus deaths at younger ages impose stronger natural selection because younger individuals have more of their expected reproduction ahead of them [63,64]. Therefore, cancer mortality should impose significant selection on cancer suppression before age 7 yr in dogs.
This was investigated by compiling life tables for breed size classes using available data on probabilities of surviving from birth to age x ( l x ) [65] and mean age-specific litter sizes [56]. Age-specific fecundity rate ( m x ) was calculated from litter sizes assuming that 82.2% of females produce only one litter per year, 17.1% produce two litters, and 0.66% produce three litters [56]. From these data, fitness, measured as expected (mean) lifetime reproductive success, is calculated as L R S = x = 0 l x m x . Considering only reproduction spanning ages 2 to 6 (assuming m x = 0 at all other ages), the age range of consistent selective breeding [56], L R S for the Giant breed size class (> 45 kg) is 36.81 (Table 1). Then, if the mortality rate of a Giant breed could be reduced through increased cancer suppression or reduced cancer susceptibility to that of a Large breed (25-45 kg), increasing its life expectance at birth from 10.6 to 12.5 years [65] and decreasing its early-age litter sizes from ~7.5 to ~7.0 [56], a Giant breed would increase its L R S by 2.84 offspring (Table 1). This gives a selection coefficient of s = 2.84 / 36.81 = 0.08 , indicating moderately strong selection. With a breed effective population size of N e = 100 [66], greater cancer suppression would be selectively favoured because s > 1 / 2 N e = 0.005 [67].
).
The longer lifespans and smaller litters of ancient breeds compared to modern breeds of the same size are consistent with the prediction that ancient breeds have evolved cancer suppression closer to their optima than have modern breeds. The limited data on cancer mortality rate available for ancient breeds supports this conclusion in that cancer mortality rate increases with weight for modern breeds but not for ancient breeds. Thus, the expectation that larger breeds are more susceptible to cancer mortality because of a greater number of stem cell divisions is supported. This increased risk of cancer mortality may then select for increased cancer suppression, depending on the age distribution of risk and the fitness cost of suppression. Analysis of lifetable data for Giant breeds shows that selection for increased cancer suppression or reduced cancer susceptibility at a cost of reduced reproduction is plausible. Therefore, considering that cancer is the only cause of death that increases with breed size [1,2], it appears that the decrease in lifespan with breed size is explained by increased susceptibility to cancer and a lag in the evolution of increased cancer suppression.

Funding

This research received no external funding.

Institutional Review Board Statement

Not applicable.

Data Availability Statement

The original contributions presented in this study are included in the article/supplementary material. Further inquiries can be directed to the corresponding author.

Conflicts of Interest

The authors declare no conflicts of interest.

Abbreviations

The following abbreviations are used in this manuscript:
PGLS Phylogenetic Generalized Least Squares
LRS Lifetime Reproductive Success

Appendix A

Figure A1. Phylogeny of dog breeds showing all ancient and modern breeds used in analyses. Scale is in thousands of years (ka).
Preprints 191057 g0a1

Appendix B

Table A1. Ancient dog breed data.
Breed Modern European Admixture (%) Mean Adult Mass (kg)* Litter Size* Midpoint Life Expectancy (yr)*
Basenji 15.3 10.43 [68] 4.8 [56] 13.5 [68]
Chow Chow 13.1 26.08 [68] 4.4 [56] 10 [68]
Dingo (captive) 7.0 14 [69] 5 [69] 15 [70]
Greenland Sledge Dog 17.0 37.25 [71] 5.6 [56] 11 [72]
Jindo 10.1 18.14 [68] 6 [73] 14.5 [68]
New Guinea Singing Dog (captive) 0.3 11.7 [69] 4 [74] 15 [75]
Tibetan Mastiff 5.1 48.76 [68] 9 [76] 11 [68]
*Sources of data are cited.

References

  1. da Silva, J.; Cross, B.J. Dog life spans and the evolution of aging. The American Naturalist 2023, 201, E000–E000. [Google Scholar] [CrossRef]
  2. Fleming, J.M.; Creevy, K.E.; Promislow, D.E.L. Mortality in North American dogs from 1984 to 2004: An investigation into age-, size-, and breed-related causes of death. Journal of Veterinary Internal Medicine 2011, 25, 187–198. [Google Scholar] [CrossRef]
  3. Nowak, M.A.; Waclaw, B. Cancer genes, environment, and “bad luck”. Science 2017, 355, 1266–1267. [Google Scholar] [CrossRef]
  4. Tomasetti, C.; Li, L.; Vogelstein, B. Stem cell divisions, somatic mutations, cancer etiology, and cancer prevention. Science 2017, 355, 1330–1334. [Google Scholar] [CrossRef]
  5. Tomasetti, C.; Vogelstein, B. Variation in cancer risk among tissues can be explained by the number of stem cell divisions. Science 2015, 347, 78–81. [Google Scholar] [CrossRef]
  6. Frank, S.A. Somatic evolutionary genomics: Mutations during development cause highly variable genetic mosaicism with risk of cancer and neurodegeneration. Proceedings of the National Academy of Sciences 2010, 107, 1725–1730. [Google Scholar] [CrossRef]
  7. Frank, S.A.; Nowak, M.A. Problems of somatic mutation and cancer. Bioessays 2004, 26, 291–299. [Google Scholar] [CrossRef]
  8. Nunney, L. Lineage selection and the evolution of multistage carcinogenesis. Proceedings of the Royal Society of London. Series B: Biological Sciences 1999, 266, 493–498. [Google Scholar] [CrossRef]
  9. Nunney, L. The population genetics of multistage carcinogenesis. Proceedings of the Royal Society of London. Series B: Biological Sciences 2003, 270, 1183–1191. [Google Scholar] [CrossRef]
  10. Nunney, L. Size matters: height, cell number and a person’s risk of cancer. Proceedings of the Royal Society B: Biological Sciences 2018, 285. [Google Scholar] [CrossRef]
  11. Choi, Y.J.; Lee, D.H.; Han, K.-D.; Yoon, H.; Shin, C.M.; Park, Y.S.; Kim, N. Adult height in relation to risk of cancer in a cohort of 22,809,722 Korean adults. British Journal of Cancer 2019, 120, 668–674. [Google Scholar] [CrossRef]
  12. Green, J.; Cairns, B.J.; Casabonne, D.; Wright, F.L.; Reeves, G.; Beral, V. Height and cancer incidence in the Million Women Study: prospective cohort, and meta-analysis of prospective studies of height and total cancer risk. Lancet Oncology 2011, 12, 785–794. [Google Scholar] [CrossRef]
  13. Nunney, L. The effect of body size and inbreeding on cancer mortality in breeds of the domestic dog: a test of the multi-stage model of carcinogenesis. R Soc Open Sci 2024, 11, 231356. [Google Scholar] [CrossRef]
  14. Austad, S.N.; Fischer, K.E. Mammalian aging, metabolism, and ecology: evidence from the bats and marsupials. Journal of Gerontology 1991, 46, B47–B53. [Google Scholar] [CrossRef]
  15. Reinke, B.A.; Cayuela, H.; Janzen, F.J.; Lemaître, J.-F.; Gaillard, J.-M.; Lawing, A.M.; Iverson, J.B.; Christiansen, D.G.; Martínez-Solano, I.; Sánchez-Montes, G.; et al. Diverse aging rates in ectothermic tetrapods provide insights for the evolution of aging and longevity. Science 2022, 376, 1459–1466. [Google Scholar] [CrossRef]
  16. Austad, S.N. Animal size, metabolic rate, and survival, among and within species. In The Comparative Biology of Aging; Wolf, N.S., Ed.; Springer Netherlands: Dordrecht, 2010; pp. 27–41. [Google Scholar]
  17. Speakman, J.R. Body size, energy metabolism and lifespan. Journal of Experimental Biology 2005, 208, 1717–1730. [Google Scholar] [CrossRef]
  18. Vincze, O.; Colchero, F.; Lemaitre, J.F.; Conde, D.A.; Pavard, S.; Bieuville, M.; Urrutia, A.O.; Ujvari, B.; Boddy, A.M.; Maley, C.C.; et al. Cancer risk across mammals. Nature 2022, 601, 263–267. [Google Scholar] [CrossRef]
  19. Peto, R. Quantitative implications of the approximate irrelevance of mammalian body size and lifespan to lifelong cancer risk. Philosophical Transactions of the Royal Society B: Biological Sciences 2015, 370, 20150198. [Google Scholar] [CrossRef]
  20. Abegglen, L.M.; Caulin, A.F.; Chan, A.; Lee, K.; Robinson, R.; Campbell, M.S.; Kiso, W.K.; Schmitt, D.L.; Waddell, P.J.; Bhaskara, S. Potential mechanisms for cancer resistance in elephants and comparative cellular response to DNA damage in humans. The Journal of the American Medical Association 2015, 314, 1850–1860. [Google Scholar] [CrossRef]
  21. Compton, Z.T.; Mellon, W.; Harris, V.K.; Rupp, S.; Mallo, D.; Kapsetaki, S.E.; Wilmot, M.; Kennington, R.; Noble, K.; Baciu, C.; et al. Cancer prevalence across vertebrates. Cancer Discovery 2024, OF1–OF18. [Google Scholar] [CrossRef]
  22. Bulls, S.; Platner, L.; Ayub, W.; Moreno, N.; Arditi, J.-P.; Dreyer, S.; McCain, S.; Wagner, P.; Burgstaller, S.; Davis, L.; et al. Cancer prevalence is related to body mass and lifespan in tetrapods and remarkably low in turtles. 2022. [Google Scholar] [CrossRef]
  23. Butler, G.; Baker, J.; Amend, S.R.; Pienta, K.J.; Venditti, C. No evidence for Peto’s paradox in terrestrial vertebrates. Proceedings of the National Academy of Sciences 2025, 122, e2422861122. [Google Scholar] [CrossRef]
  24. Leroi, A.M.; Koufopanou, V.; Burt, A. Cancer selection. Nature Reviews Cancer 2003, 3, 226–231. [Google Scholar] [CrossRef]
  25. Caulin, A.F.; Maley, C.C. Peto’s Paradox: evolution’s prescription for cancer prevention. Trends in Ecology & Evolution 2011, 26, 175–182. [Google Scholar] [CrossRef]
  26. Nunney, L. Resolving Peto’s paradox: Modeling the potential effects of size-related metabolic changes, and of the evolution of immune policing and cancer suppression. Evolutionary Applications 2020, 13, 1581–1592. [Google Scholar] [CrossRef]
  27. Seluanov, A.; Gladyshev, V.N.; Vijg, J.; Gorbunova, V. Mechanisms of cancer resistance in long-lived mammals. Nature Reviews Cancer 2018, 18, 433–441. [Google Scholar] [CrossRef]
  28. Tollis, M.; Schiffman, J.D.; Boddy, A.M. Evolution of cancer suppression as revealed by mammalian comparative genomics. Current Opinion in Genetics & Development 2017, 42, 40–47. [Google Scholar] [CrossRef]
  29. Tollis, M.; Schneider-Utaka, A.K.; Maley, C.C. The evolution of human cancer gene duplications across mammals. Molecular Biology and Evolution 2020, 37, 2875–2886. [Google Scholar] [CrossRef]
  30. Cagan, A.; Baez-Ortega, A.; Brzozowska, N.; Abascal, F.; Coorens, T.H.H.; Sanders, M.A.; Lawson, A.R.J.; Harvey, L.M.R.; Bhosle, S.; Jones, D.; et al. Somatic mutation rates scale with lifespan across mammals. Nature 2022. [Google Scholar] [CrossRef]
  31. Nunney, L. The real war on cancer: The evolutionary dynamics of cancer suppression. Evolutionary Applications 2013, 6, 11–19. [Google Scholar] [CrossRef]
  32. Galis, F.; Van Der Sluijs, I.; Van Dooren, T.J.M.; Metz, J.A.J.; Nussbaumer, M. Do large dogs die young? Journal of Experimental Zoology Part B: Molecular and Developmental Evolution 2007, 308B, 119–126. [Google Scholar] [CrossRef] [PubMed]
  33. Kirkwood, T.B.L.; Rose, M.R. Evolution of senescence: late survival sacrificed for reproduction. Philosophical Transactions - Royal Society of London, B 1991, 332, 15–24. [Google Scholar] [CrossRef] [PubMed]
  34. Dujon, A.M.; Boutry, J.; Tissot, S.; Lemaitre, J.F.; Boddy, A.M.; Gerard, A.L.; Alvergne, A.; Arnal, A.; Vincze, O.; Nicolas, D.; et al. Cancer susceptibility as a cost of reproduction and contributor to life history evolution. Frontiers in Ecology and Evolution 2022, 10. [Google Scholar] [CrossRef]
  35. Bartke, A. Growth hormone and aging. Reviews in Endocrine and Metabolic Disorders 2021, 22, 71–80. [Google Scholar] [CrossRef]
  36. Ostrander, E.A.; Wayne, R.K.; Freedman, A.H.; Davis, B.W. Demographic history, selection and functional diversity of the canine genome. Nature Reviews Genetics 2017, 18, 705. [Google Scholar] [CrossRef]
  37. Plassais, J.; Kim, J.; Davis, B.W.; Karyadi, D.M.; Hogan, A.N.; Harris, A.C.; Decker, B.; Parker, H.G.; Ostrander, E.A. Whole genome sequencing of canids reveals genomic regions under selection and variants influencing morphology. Nature Communications 2019, 10, 1–14. [Google Scholar] [CrossRef]
  38. Plassais, J.; vonHoldt, B.M.; Parker, H.G.; Carmagnini, A.; Dubos, N.; Papa, I.; Bevant, K.; Derrien, T.; Hennelly, L.M.; Whitaker, D.T.; et al. Natural and human-driven selection of a single non-coding body size variant in ancient and modern canids. Current Biology 2022, 32, 889–897. [Google Scholar] [CrossRef]
  39. Khanna, C.; Paoloni, M.C. Cancer biology in dogs. In The Dog and its Genome; Ostrander, E.A., Giger, U., Lindblad-Toh, K., Eds.; Cold Spring Harbor Laboratory Press: Cold Spring Harbor, New York, 2006; pp. 451–472. [Google Scholar]
  40. Tyner, S.D.; Venkatachalam, S.; Choi, J.; Jones, S.; Ghebranious, N.; Igelmann, H.; Lu, X.; Soron, G.; Cooper, B.; Brayton, C.; et al. p53 mutant mice that display early ageing-associated phenotypes. Nature 2002, 415, 45–53. [Google Scholar] [CrossRef]
  41. Allemand, I.; Anglo, A.; Jeantet, A.-Y.; Cerutti, I.; May, E. Testicular wild-type p53 expression in transgenic mice induces spermiogenesis alterations ranging from differentiation defects to apoptosis. Oncogene 1999, 18, 6521–6530. [Google Scholar] [CrossRef]
  42. Maier, B.; Gluba, W.; Bernier, B.; Turner, T.; Mohammad, K.; Guise, T.; Sutherland, A.; Thorner, M.; Scrable, H. Modulation of mammalian life span by the short isoform of p53. Genes & development 2004, 18, 306–319. [Google Scholar] [CrossRef]
  43. Kraus, C.; Snyder-Mackler, N.; Promislow, D.E.L. How size and genetic diversity shape lifespan across breeds of purebred dogs. GeroScience 2023, 45, 627–643. [Google Scholar] [CrossRef] [PubMed]
  44. Larson, G.; Karlsson, E.K.; Perri, A.; Webster, M.T.; Ho, S.Y.W.; Peters, J.; Stahl, P.W.; Piper, P.J.; Lingaas, F.; Fredholm, M.; et al. Rethinking dog domestication by integrating genetics, archeology, and biogeography. Proceedings of the National Academy of Sciences 2012, 109, 8878. [Google Scholar] [CrossRef] [PubMed]
  45. Parker, H.G.; Dreger, D.L.; Rimbault, M.; Davis, B.W.; Mullen, A.B.; Carpintero-Ramirez, G.; Ostrander, E.A. Genomic analyses reveal the influence of geographic origin, migration, and hybridization on modern dog breed development. Cell Reports 2017, 19, 697–708. [Google Scholar] [CrossRef] [PubMed]
  46. vonHoldt, B.M.; Pollinger, J.P.; Lohmueller, K.E.; Han, E.; Parker, H.G.; Quignon, P.; Degenhardt, J.D.; Boyko, A.R.; Earl, D.A.; Auton, A.; et al. Genome-wide SNP and haplotype analyses reveal a rich history underlying dog domestication. Nature 2010, 464, 898–902. [Google Scholar] [CrossRef]
  47. Sinding, M.-H.S.; Gopalakrishnan, S.; Ramos-Madrigal, J.; de Manuel, M.; Pitulko, V.V.; Kuderna, L.; Feuerborn, T.R.; Frantz, L.A.; Vieira, F.G.; Niemann, J. Arctic-adapted dogs emerged at the Pleistocene–Holocene transition. Science 2020, 368, 1495–1499. [Google Scholar] [CrossRef]
  48. Brown, S.K.; Darwent, C.M.; Wictum, E.J.; Sacks, B.N. Using multiple markers to elucidate the ancient, historical and modern relationships among North American Arctic dog breeds. Heredity 2015, 115, 488–495. [Google Scholar] [CrossRef]
  49. Feuerborn, T.R.; Appelt, M.; Bougiouri, K.; Bachmann, L.; Nielsen, I.B.; Buckley, R.M.; Egevang, C.; Diaz-Maroto, P.F.; Gopalakrishnan, S.; Gotfredsen, A.B.; et al. Origins and diversity of Greenland’s Qimmit revealed with genomes of ancient and modern sled dogs. Science 2025, 389, 163–168. [Google Scholar] [CrossRef]
  50. Bergström, A.; Frantz, L.; Schmidt, R.; Ersmark, E.; Lebrasseur, O.; Girdland-Flink, L.; Lin, A.T.; Storå, J.; Sjögren, K.-G.; Anthony, D.; et al. Origins and genetic legacy of prehistoric dogs. Science 2020, 370, 557. [Google Scholar] [CrossRef]
  51. Bergström, A.; Stanton, D.W.G.; Taron, U.H.; Frantz, L.; Sinding, M.-H.S.; Ersmark, E.; Pfrengle, S.; Cassatt-Johnstone, M.; Lebrasseur, O.; Girdland-Flink, L.; et al. Grey wolf genomic history reveals a dual ancestry of dogs. Nature 2022. [Google Scholar] [CrossRef]
  52. Zhang, S.-j.; Wang, G.-D.; Ma, P.; Zhang, L.-l.; Yin, T.-T.; Liu, Y.-h.; Otecko, N.O.; Wang, M.; Ma, Y.-p.; Wang, L. Genomic regions under selection in the feralization of the dingoes. Nature Communications 2020, 11, 671. [Google Scholar] [CrossRef]
  53. Freedman, A.H.; Gronau, I.; Schweizer, R.M.; Ortega-Del Vecchyo, D.; Han, E.; Silva, P.M.; Galaverni, M.; Fan, Z.; Marx, P.; Lorente-Galdos, B. Genome sequencing highlights the dynamic early history of dogs. PLoS Genet 2014, 10, e1004016. [Google Scholar] [CrossRef]
  54. Savolainen, P.; Leitner, T.; Wilton, A.N.; Matisoo-Smith, E.; Lundeberg, J. A detailed picture of the origin of the Australian dingo, obtained from the study of mitochondrial DNA. Proceedings of the National Academy of Sciences 2004, 101, 12387–12390. [Google Scholar] [CrossRef]
  55. Balme, J.; O’Connor, S.; Fallon, S. New dates on dingo bones from Madura Cave provide oldest firm evidence for arrival of the species in Australia. Scientific Reports 2018, 8, 9933. [Google Scholar] [CrossRef] [PubMed]
  56. Borge, K.S.; Tønnessen, R.; Nødtvedt, A.; Indrebø, A. Litter size at birth in purebred dogs—A retrospective study of 224 breeds. Theriogenology 2011, 75, 911–919. [Google Scholar] [CrossRef] [PubMed]
  57. Pagel, M. Inferring the historical patterns of biological evolution. Nature 1999, 401, 877–884. [Google Scholar] [CrossRef] [PubMed]
  58. R Core Team R: A Language and Environment for Statistical Computing; R Foundation for Statistical Computing: Vienna, Austria, 2025.
  59. Orme, D.; Freckleton, R.; Thomas, G.; Petzoldt, T.; Fritz, S.; Isaac, N.; Pearse, W. Package ‘caper’: Comparative Analyses of Phylogenetics and Evolution in R, 1.0.3 2023.
  60. Pagel, M.; O’Donovan, C.; Meade, A. General statistical model shows that macroevolutionary patterns and processes are consistent with Darwinian gradualism. Nature communications 2022, 13, 1113. [Google Scholar] [CrossRef]
  61. Zar, J.H. Biostatistical Analysis, 4th ed.; Prentice Hall: Upper Sadle River, NJ, 1999. [Google Scholar]
  62. Warton, D.I.; Hui, F.K. The arcsine is asinine: the analysis of proportions in ecology. Ecology 2011, 92, 3–10. [Google Scholar] [CrossRef]
  63. Hamilton, W.D. The moulding of senescence by natural selection. Journal of Theoretical Biology 1966, 12, 12–45. [Google Scholar] [CrossRef]
  64. Medawar, P.B. An Unsolved Problem of Biology; H. K. Lewis: London, 1952; p. 24. [Google Scholar]
  65. Inoue, M.; Hasegawa, A.; Hosoi, Y.; Sugiura, K. A current life table and causes of death for insured dogs in Japan. Preventive Veterinary Medicine 2015, 120, 210–218. [Google Scholar] [CrossRef]
  66. Lewis, T.W.; Abhayaratne, B.M.; Blott, S.C. Trends in genetic diversity for all Kennel Club registered pedigree dog breeds. Canine Genetics and Epidemiology 2015, 2, 13. [Google Scholar] [CrossRef]
  67. Crow, J.F.; Kimura, M. An Introduction to Population Genetics Theory; Harper & Row: New York, 1970; p. pp. xiv, 591. [Google Scholar]
  68. American Kennel Club. The American Kennel Club. Available online: https://www.akc.org.
  69. Corbett, L.K. Australia and Oceania (Australasian). In Canids: Foxes, Wolves, Jackals, and Dogs: Status Survey and Conservation Action Plan; Sillero-Zubiri, C., Hoffmann, M., Macdonald, D.W., Eds.; IUCN--The World Conservation Union, 2004. [Google Scholar]
  70. Jackson, S. Australian Mammals: Biology and Captive Management; CSIRO publishing, 2007. [Google Scholar]
  71. The Royal Kennel Club. The Kennel Club. Available online: https://www.thekennelclub.org.uk.
  72. Purina. Greenland Dog. Available online: https://www.purina.co.uk/find-a-pet/dog-breeds/greenland-dog#no-back.
  73. PetGuide.com. Korean Jindo. Available online: https://www.petguide.com/breeds/dog/korean-jindo/.
  74. San Diego Zoo Wildlife Alliance. New Guinea Singing Dog. Available online: https://sdzwildlifeexplorers.org/animals/new-guinea-singing-dog.
  75. Wisdom Panel. New Guinea Singing Dog. Available online: https://www.wisdompanel.com/en-us/dog-breeds/new-guinea-singing-dog.
  76. Fetch, Pet Care. Breed Breakdown: The Tibetan Mastiff. Available online: https://www.fetchpetcare.com/blog/breed-breakdown-the-tibetan-mastiff/.
Figure 1. Ancient breed lineages. Time is in thousands of years (ka) before present (bp). (A) Composite diagram of lineage relationships of ancient dogs, including ancient admixtures. Dots indicate dates from archaeological/fossil evidence. Open circles indicate dates estimated from genetic data. Open circles with dots indicate dates from archaeological/fossil evidence and lineage placement based on ancient DNA admixture models or phylogenies. ID = Indonesia. (B) Phylogeny of ancient and modern breeds.
Preprints 191057 g001
Figure 2. Phylogenetic generalized least squares analyses of covariance of the effect of breed age (ancient versus modern) with weight as a covariate. (A) Effect of breed age on lifespan: λ = 0 ,   κ = 0.15 ,   δ = 3.0 ; R 2 = 0.63 ,   F 2 ,   65 = 55.43 ,   P = 8.962 × 10 15 . (B) Effect of breed age on litter size: λ = 0 ,   κ =   0.49 ,   δ = 1.6 ; R 2 = 0.72 ,   F 2 ,   64 = 80.38 ,   P < 2.2 × 10 16 . (C) Effect of breed age on cancer mortality rate (CMR): λ = 0 ; R 2 = 0.48 ,   F 3 ,   60 = 18.47 ,   P = 1.328 × 10 8 . Note that visual inspection of the distribution of data points is not a good guide to differences between breed ages because of the phylogenetic structure of breeds (all modern breeds have descended from a recent common ancestor).
Preprints 191057 g002
Table 1. Life tables for breed size classes over ages of selective breeding ( m x > 0
Large Giant
Age, x (yr) lx mx lxmx lx mx lxmx
2 0.9818 8.3 8.1358 0.9620 8.8 8.4272
3 0.9754 8.5 8.3137 0.9494 9.0 8.5416
4 0.9675 8.3 8.0173 0.9359 8.5 7.9770
5 0.9500 8.3 7.8723 0.8914 7.5 6.6480
6 0.9357 7.8 7.3107 0.8320 6.3 5.2201
L R S Σ 39.6497 36.8140
Disclaimer/Publisher’s Note: The statements, opinions and data contained in all publications are solely those of the individual author(s) and contributor(s) and not of MDPI and/or the editor(s). MDPI and/or the editor(s) disclaim responsibility for any injury to people or property resulting from any ideas, methods, instructions or products referred to in the content.
Copyright: This open access article is published under a Creative Commons CC BY 4.0 license, which permit the free download, distribution, and reuse, provided that the author and preprint are cited in any reuse.
Prerpints.org logo

Preprints.org is a free preprint server supported by MDPI in Basel, Switzerland.

Subscribe

Disclaimer

Terms of Use

Privacy Policy

Privacy Settings

© 2026 MDPI (Basel, Switzerland) unless otherwise stated