Submitted:
22 December 2025
Posted:
23 December 2025
Read the latest preprint version here
Preprints on COVID-19 and SARS-CoV-2
Abstract
Pemivibart (VYD222) and its successor, VYD2311, target a shared, evolutionarily vulnerable epitope in the SARS-CoV-2 spike receptor-binding domain (RBD). Although VYD2311 an IND features an Fc-mediated half-life extension and demonstrates a reported 17-fold increase in in vitro neutralization potency over pemivibart (marketed as Pemgarda™, VYD222), both antibodies engage identical contact residues - R346, K444, F456, and F486 - making them equally susceptible to the same escape pathways. To assess the real-world durability of this therapeutic axis, we conducted mass-scale genomic surveillance across 9,398,268 global SARS-CoV-2 spike sequences spanning January 2020 through September 2025 (Q3 2025), including 26,514 non-INSDC Chinese submissions. Using a reference-aligned, codon-resolved pipeline anchored to Wuhan-Hu-1 (YP_009724390.1), we systematically mapped the emergence, co-occurrence, and global fixation of 11 experimentally validated escape residues. Mutational constellations were stratified by haplotype tier (1/5 to 5/5), lineage, geography, and time to reconstruct the evolutionary trajectory of resistance. Our analysis reveals that pemivibart/VYD2311 resistance is now near-ubiquitous: 94.8% of 2025 isolates harbor ≥3 of the 5 core escape mutations (R346T, S371F, K444T, N460K, F486P), and over 95% of high-tier (≥3/5) escape genomes belong to KP.3-descendant lineages - embedding resistance as a baseline feature of the contemporary virome. Critically, we identified natural isolates carrying the complete 5/5 escape haplotype, including a clonal cluster in Puerto Rico as early as late 2023 - predating both the EUA for pemivibart (March 2024) and the IND clearance for VYD2311 (October 2025). In China, distinct but functionally convergent substitutions (S501T, S500T, S417T) dominate, illustrating regional pathways to the same outcome: the therapeutic failure. We cataloged 116 unique escape constellations, with up to eight co-occurring mutations, and confirmed that dominant 2024 - 2025 lineages - including LB.1, LB.1.81, and KP.3.1.1 - routinely carry 4 - 5 escape residues. Notably, Invivyd’s efficacy models rely on neutralization titers against JN.1, a variant already displaced by mid-2024; yet the targeted epitope was substantially eroded in circulating strains well before clinical deployment. The FDA’s August 2024 imposition of a 90% national susceptibility threshold for pemivibart use implicitly acknowledges this pre-existing vulnerability. We conclude that single-epitope monoclonal antibodies like VYD222 and VYD2311 are inherently fragile against the deterministic forces of SARS-CoV-2 evolution. Prolonged serum exposure enabled by Fc engineering cannot overcome pre-existing binding loss and may instead accelerate escape in immunocompromised hosts. Sustainable pandemic preparedness demands a strategic pivot: away from iterative, reactive optimization of single-target antibodies, and toward multi-epitope cocktails or therapeutics designed using co-evolving residue networks. This study provides a definitive, global evidence base for retiring lineage-reactive mAbs in favor of evolutionarily resilient countermeasures.
Keywords:
SARS-CoV-2
; monoclonal antibody resistance
; pemivibart (VYD2311)
; viral immune escape
; spike protein evolution
; global genomic surveillance
; escape mutation constellations
; receptor-binding domain (RBD)
; therapeutic obsolescence
; variant-agnostic resistance
Introduction
The therapeutic deployment of monoclonal antibodies (mAbs) against SARS-CoV-2 represents one of the most ambitious real-time applications of precision antiviral design in pandemic history. Beginning with emergency authorizations in 2020, these engineered biologics offered hope for targeted intervention in high-risk populations - particularly immunocompromised individuals who respond poorly to vaccination. Yet SARS-CoV-2 has systematically dismantled this arsenal through a predictable pattern of resistance: bamlanivimab collapsed against Alpha, sotrovimab failed against BA.2, and Evusheld lost efficacy against XBB lineages. Each successive mAb has faced an increasingly accelerated path to functional obsolescence, reflecting the virus’s extraordinary adaptive capacity under therapeutic selection. This recurring cycle raises a critical question: Can we anticipate escape dynamics before clinical deployment, or are we perpetually one evolutionary step behind?
Pemivibart (VYD222), marketed as Pemgarda™, received U.S. FDA Emergency Use Authorization (EUA) in March 2024 for pre-exposure prophylaxis in immunocompromised individuals. VYD2311, its proposed successor, is a next-generation, Fc-engineered mAb derived from pemivibart via yeast-display affinity maturation and half-life extension. Although VYD2311 has not been authorized for clinical use, it received IND clearance in October 2025 and is advancing into Phase 3 trials on the basis of 17-fold greater in vitro neutralization potency and prolonged serum exposure against contemporary variants.
The official labeling for PEMGARDA (pemivibart), as reflected in the FDA-authorized Fact Sheet and prescribing information dated February 2025, confirms that pemivibart is supplied as a sterile, preservative-free solution at a concentration of 125 mg/mL (500 mg/4 mL) in single-dose vials, with nine vials per carton (NDC 81960-031-03). The label emphasizes that PEMGARDA is indicated only under Emergency Use Authorization (EUA) for pre-exposure prophylaxis of COVID-19 in adults and adolescents aged ≥12 years weighing at least 40 kg who have moderate-to-severe immune compromise and are unlikely to mount an adequate response to vaccination. Critically, the label includes a 90% variant susceptibility threshold, stipulating that PEMGARDA is authorized for use only when the combined (US) national frequency of SARS-CoV-2 variants with substantially reduced susceptibility remains ≤90%, a condition actively monitored by the FDA using CDC variant frequency data and Monogram Biosciences neutralization results. The label also specifies that the drug should be repeated every 3 months, and mandates clinical monitoring for at least two hours post-infusion due to the 0.6% observed rate of life-threatening anaphylaxis (4/623 participants in CANOPY). Furthermore, the label explicitly notes that pemivibart is not authorized for treatment, post-exposure prophylaxis, or use in immunocompetent individuals, and that it does not substitute for vaccination. The inactive ingredients include polysorbate 80, which raises cross-hypersensitivity considerations with certain COVID-19 vaccines.
The company conducted the CANOPY trial (NCT06039449), a Phase 3, randomized, quadruple-masked, parallel-group interventional study conducted by Invivyd, Inc. to evaluate the safety and preventive efficacy of pemivibart (VYD222) - the active ingredient in PEMGARDA - for pre-exposure prophylaxis of COVID-19. The trial enrolled 790 participants across two distinct cohorts:
- Cohort A (n = 306): an open-label arm comprising adults and adolescents (≥12 years, ≥40 kg) with moderate-to-severe immune compromise.
- Cohort B (n = 484): a placebo-controlled, randomized arm involving non-immunocompromised participants aged ≥12 years who were at elevated risk of SARS-CoV-2 exposure.
All participants received either a 4500 mg IV infusion of pemivibart or normal saline placebo on Day 1, followed by redosing at Month 3. The study, which ran from September 2023 to November 2024, was designed primarily around immunobridging, using serum virus-neutralizing antibody (sVNA) titers against contemporary variants (notably JN.1) as surrogate markers of protection, benchmarked against historical efficacy data from the parent mAb adintrevimab.
Critically, both molecules engage an identical RBD epitope, contacting residues R346, K444, F456, and F486 - a structural footprint confirmed by X-ray crystallography (Cα RMSD = 0.45 Å between VYD2311:HK.3 and adintrevimab:WT RBD complexes). This shared interface overlaps the ACE2-binding site and includes residues 498 - 505, historically associated with rapid escape in class 1/2 antibodies. While VYD2311’s affinity maturation improves potency against variants like JN.1 and KP.3.1.1, it remains unclear how this optimization preserves binding when multiple interface residues are simultaneously mutated - a scenario now common in circulating lineages.
Moreover, key translational gaps persist. The VYD2311 - RBD co-structure was solved using an HK.3 background, and no equivalent validation exists for LP.8-derived spikes (e.g., LP.8.1.1), which carry additional RBD substitutions. In parallel, neutralization assays report low absolute IC₅₀ values but lack standardized fold-loss thresholds relative to wild-type, defined exposure - response margins at clinically achievable serum concentrations, or modeling of cumulative multi-mutation escape. These limitations obscure true durability.
The U.S. FDA’s March 2024 Emergency Use Authorization (EUA) for pemivibart (VYD222) and the subsequent October 2025 Investigational New Drug (IND) clearance for its successor VYD2311 were predicated on immunobridging strategies that extrapolated efficacy from neutralization titers against the JN.1 variant, itself already displaced by mid-2024. As detailed in the FDA’s EUA review memorandum (Reference ID: 5351477), the authorization relied on calculated serum neutralizing titers derived from in vitro EC₅₀ values, benchmarked against historical efficacy data for the parental antibody adintrevimab against Delta. Notably, sensitivity analyses using consistent assay platforms revealed a geometric mean titer ratio of only 0.35 between pemivibart (against JN.1) and adintrevimab (against Delta) - well below the protocol-specified noninferiority threshold - highlighting the fragility of immunobridging when EC₅₀ estimates vary across assay systems. This regulatory reliance on in vitro potency against a transient viral genotype, rather than on real-world haplotype prevalence or resistance architecture, permitted authorization despite mounting genomic evidence of pre-existing, high-order escape constellations now shown to be near-ubiquitous.
The September 25, 2024 FDA memorandum revising the pemivibart (PEMGARDA) EUA acknowledges the continued circulation of JN.1-descendant lineages - specifically KP.3.1.1 (52.7%), LB.1 (10.9%), and KP.2.3 (12.2%) - as dominant U.S. variants and presents updated neutralization data from the Monogram Biosciences pseudotyped lentivirus VLP assay showing 3.2-fold (KP.3.1.1) and 2.4-fold (LB.1) reduced susceptibility relative to JN.1. Despite this, the company concludes that pemivibart “likely retains adequate neutralization activity” against these variants, relying exclusively on this single assay platform for immunobridging continuity. Notably, the revision removes prior language citing “preliminary, non-peer-reviewed data in the public domain” suggesting substantially reduced susceptibility of KP.3.1.1 - a caveat that would have aligned with real-world genomic evidence of near-fixation of ≥3/5 escape mutations in circulating strains by mid-2024. This narrow, assay-dependent framing overlooks the functional reality that the targeted epitope is already dismantled in >94% of global 2025 isolates, thereby perpetuating a regulatory model anchored to in vitro potency against transient genotypes rather than population-level haplotype prevalence.
The October 6, 2025 press release from Invivyd announces U.S. FDA Investigational New Drug (IND) clearance for VYD2311 - a next-generation monoclonal antibody derived from the same backbone as pemivibart (VYD222) - and outlines the upcoming Phase 3 DECLARATION trial (placebo-controlled, ~2,000 participants) and LIBERTY trial (active-controlled vs. mRNA vaccine, ~300 participants), both designed to support a Biologics License Application (BLA) with top-line data expected by mid-2026. Notably, VYD2311 is being positioned as a “vaccine-alternative” with planned intramuscular dosing and a focus on individualized protection schedules, despite targeting the same RBD epitope as pemivibart - an epitope our genomic analyses demonstrate is now functionally dismantled in >94% of 2025 global SARS-CoV-2 isolates, raising urgent questions about the clinical viability of this development pathway in the face of pre-existing, near-ubiquitous viral resistance.
Precisely because both VYD222 and VYD2311 target a single, conserved - but erodible - epitope, and because their intended recipients include immunocompromised hosts who serve as crucibles for viral diversification, they demand prospective, haplotype-resolved surveillance. By analyzing 9,398,268 global SARS-CoV-2 spike sequences (2020 - 2025 Q3), we map the emergence and global fixation of multi-residue escape constellations against this shared epitope. Our findings reveal that high-confidence haplotypes - carrying up to five canonical resistance mutations - were already circulating in the U.S. in late 2023, predating both pemivibart’s EUA and VYD2311’s IND. By late 2025, these mutations are embedded as baseline features in dominant lineages (KP.3.1.1, LB.1, LB.1.81), with >94% of contemporary isolates harboring ≥3/5 escape residues.
This study provides the first evidence that the epitope targeted by not only pemivibart but the latest generation of SARS-CoV-2 mAbs has already been functionally dismantled by natural viral evolution - not as a post-deployment adaptation, but as a pre-existing, deterministic trajectory. The implications extend beyond a single therapeutic: they challenge the sustainability of single-epitope optimization and underscore the urgent need for multi-epitope cocktails or co-evolution-informed designs that anticipate, rather than react to, viral escape.
Materials and Methods
Data Sources and Genome Counts
We integrated genomic data from multiple public repositories covering the period from January 2020 through September 2025 (Q3 2025). The primary global dataset comprised 9,398,268 SARS-CoV-2 spike protein sequences extracted from INSDC-aligned repositories (GISAID, NCBI, ENA) [D13]. To address geographic underrepresentation, we incorporated 26,514 non-INSDC Chinese genomes, including 19,792 sequences from 2024 [D11] and 6,722 high-quality assemblies from 2023 - 2025 [D12]. Additional high-resolution subsets were analyzed to validate constellation completeness, including 42,598 spike sequences from 2025 [D4], 3,064,039 VYD2311+ genomes (defined by ≥1 canonical escape mutation) [D2], and 1,019,041 genomes carrying ≥1 of F456L, R346T, K444T, or F486P [D8]. In total, our surveillance spans >9.4 million spike sequences and >9 million full-length translated genomes, representing the most comprehensive temporal and geographic sampling of SARS-CoV-2 evolution to date.
Analytical Pipelines
All sequences were processed using a locally developed scalable, chunked bioinformatics pipeline implemented in WSL2/Linux environments with parallelized Python and Bash workflows. Spike and ORF1a - ORF8 coding sequences were extracted and translated relative to the Wuhan-Hu-1 reference (NC_045512.2; YP_009724390.1). Position-specific amino acid mutations were called using a codon-aware alignment strategy that preserved reading frames and excluded low-coverage or ambiguous regions. For co-occurrence analysis, we scanned all non-synonymous mutations across 10 viral genes (S, N, M, E, ORF3a, ORF6, ORF7a, ORF7b, ORF8, ORF1a) in 3,064,039 VYD2311+ genomes, yielding 158.2 million co-occurring mutation records [D2]. Constellation reconstruction was performed by intersecting per-genome mutation profiles across the 11 escape residues. All pipeline outputs including intermediate summaries, and quality control logs are archived with each dataset [D2, D4, D13].
Inclusion Criteria
Only high-quality, full-length or near-full-length spike sequences (≥95% coverage of reference Spike, no internal stop codons, consensus depth ≥100× where raw data were available) were included. Genomes with ambiguous residues (>5% N/X) or evidence of recombination breakpoints within the RBD (positions 319 - 541) were excluded. Chinese non-INSDC sequences underwent additional validation via cross-referencing with local laboratory metadata and spike integrity checks [D11, D12]. For constellation stratification, genomes were retained only if all 11 target residues could be unambiguously called.
Definitions of Escape Constellations
We defined canonical escape residues based on experimental and structural evidence for the shared RBD epitope targeted by pemivibart (VYD222) and its successor VYD2311, which engage identical contact residues (R346, K444, F456, F486) [R1 - R20; Invivyd ECCMID 2025 Poster #0463]. The 11 residues analyzed were: R346T, S371F, K444T, N460K, F486P, F456L, S417T, S444T, S446A, S500T, and S501T. The core 5/5 constellation was defined as the co-occurrence of R346T + S371F + K444T + N460K + F486P, representing complete disruption of both arms of the epitope [D9, D10, D15]. High-tier escape was defined as ≥3/5 core mutations. Region-specific constellations included S501T + S500T + S417T for Chinese lineages [D11, D12], and F456L + R346T + K444T + F486P for early U.S. and European isolates [D3, D8]. A constellation was recorded only when all specified residues were present in a single genome. We cataloged 116 unique combinations, ranging from single-residue changes to 8-mutation ensembles [D13, D16].
Results
Global Trajectories of Therapeutic Escape (2020 - 2025) and 2026 Projection
Across 9,398,268 SARS-CoV-2 spike sequences spanning January 2020 through September 2025, we observed the progressive and near-complete erosion of pemivibart (VYD2311) susceptibility. By Q3 2025, 94.84% (8,913,005/9,398,268) of global sequences harbored at least one of the 11 defined escape mutations, with 94.8% of 2025 isolates carrying ≥3 of the 5 core residues (R346T, S371F, K444T, N460K, F486P) [D13]. Temporal analysis reveals a consistent upward trajectory while escape mutations were sporadic in 2020 - 2021, multi-mutation constellations accelerated from mid-2022 onward, achieving >80% prevalence by early 2024. Extrapolating this trend using a constrained logistic model based on observed monthly fixation rates, we project asymptotic saturation (>99.9%) of partial resistance by Q1 2026 a mathematical inevitability given current dynamics [D1].
The August 23, 2024 FDA memorandum introducing a 90% national variant frequency threshold for pemivibart (PEMGARDA) use - triggering suspension when the combined prevalence of variants with “substantially reduced susceptibility” exceeds this limit - represents a pivotal, albeit reactive, recalibration of the EUA framework. Critically, this threshold was imposed despite mounting genomic evidence that the targeted epitope had already been dismantled in the overwhelming majority of circulating strains: by mid-2024, >90% of global isolates harbored ≥3/5 core escape mutations (R346T, S371F, K444T, N460K, F486P), and KP.3.1.1 - the very variant flagged for “substantially reduced susceptibility” based on preliminary data (Wang et al., 2024) - was already dominant in the U.S. The memorandum acknowledges the withdrawal of previously cited authentic virus neutralization data for JN.1 due to misidentified viral stocks, forcing reliance on a single pseudotyped VLP assay (Monogram Biosciences) for all immunobridging and susceptibility assessments. This narrow evidentiary basis, coupled with the addition of exploratory CANOPY trial efficacy data (showing 84% relative risk reduction in a non-immunocompromised cohort), fails to reconcile the regulatory stance with the empirical reality that pemivibart’s epitope was functionally obsolete before clinical deployment. The 90% threshold thus serves as a belated acknowledgment of inevitable therapeutic erosion but operates on a lagging indicator - variant frequency - rather than a leading one: pre-existing haplotype architecture. This regulatory adaptation, while prudent in principle, arrives after the window for clinical utility has closed, underscoring the inadequacy of assay-dependent, variant-chasing models in the face of deterministic, haplotype-driven viral evolution.
To assess the anibody epitope the following panels illustrate how these mutations collectively dismantle the antibody’s epitope, rendering it functionally obsolete by late 2025.
Figure 1.
Obsolescence of Monoclonal Antibody Therapeutics: A Global Chronology of Escape from 2020 to 2026.
Figure 1.
Obsolescence of Monoclonal Antibody Therapeutics: A Global Chronology of Escape from 2020 to 2026.
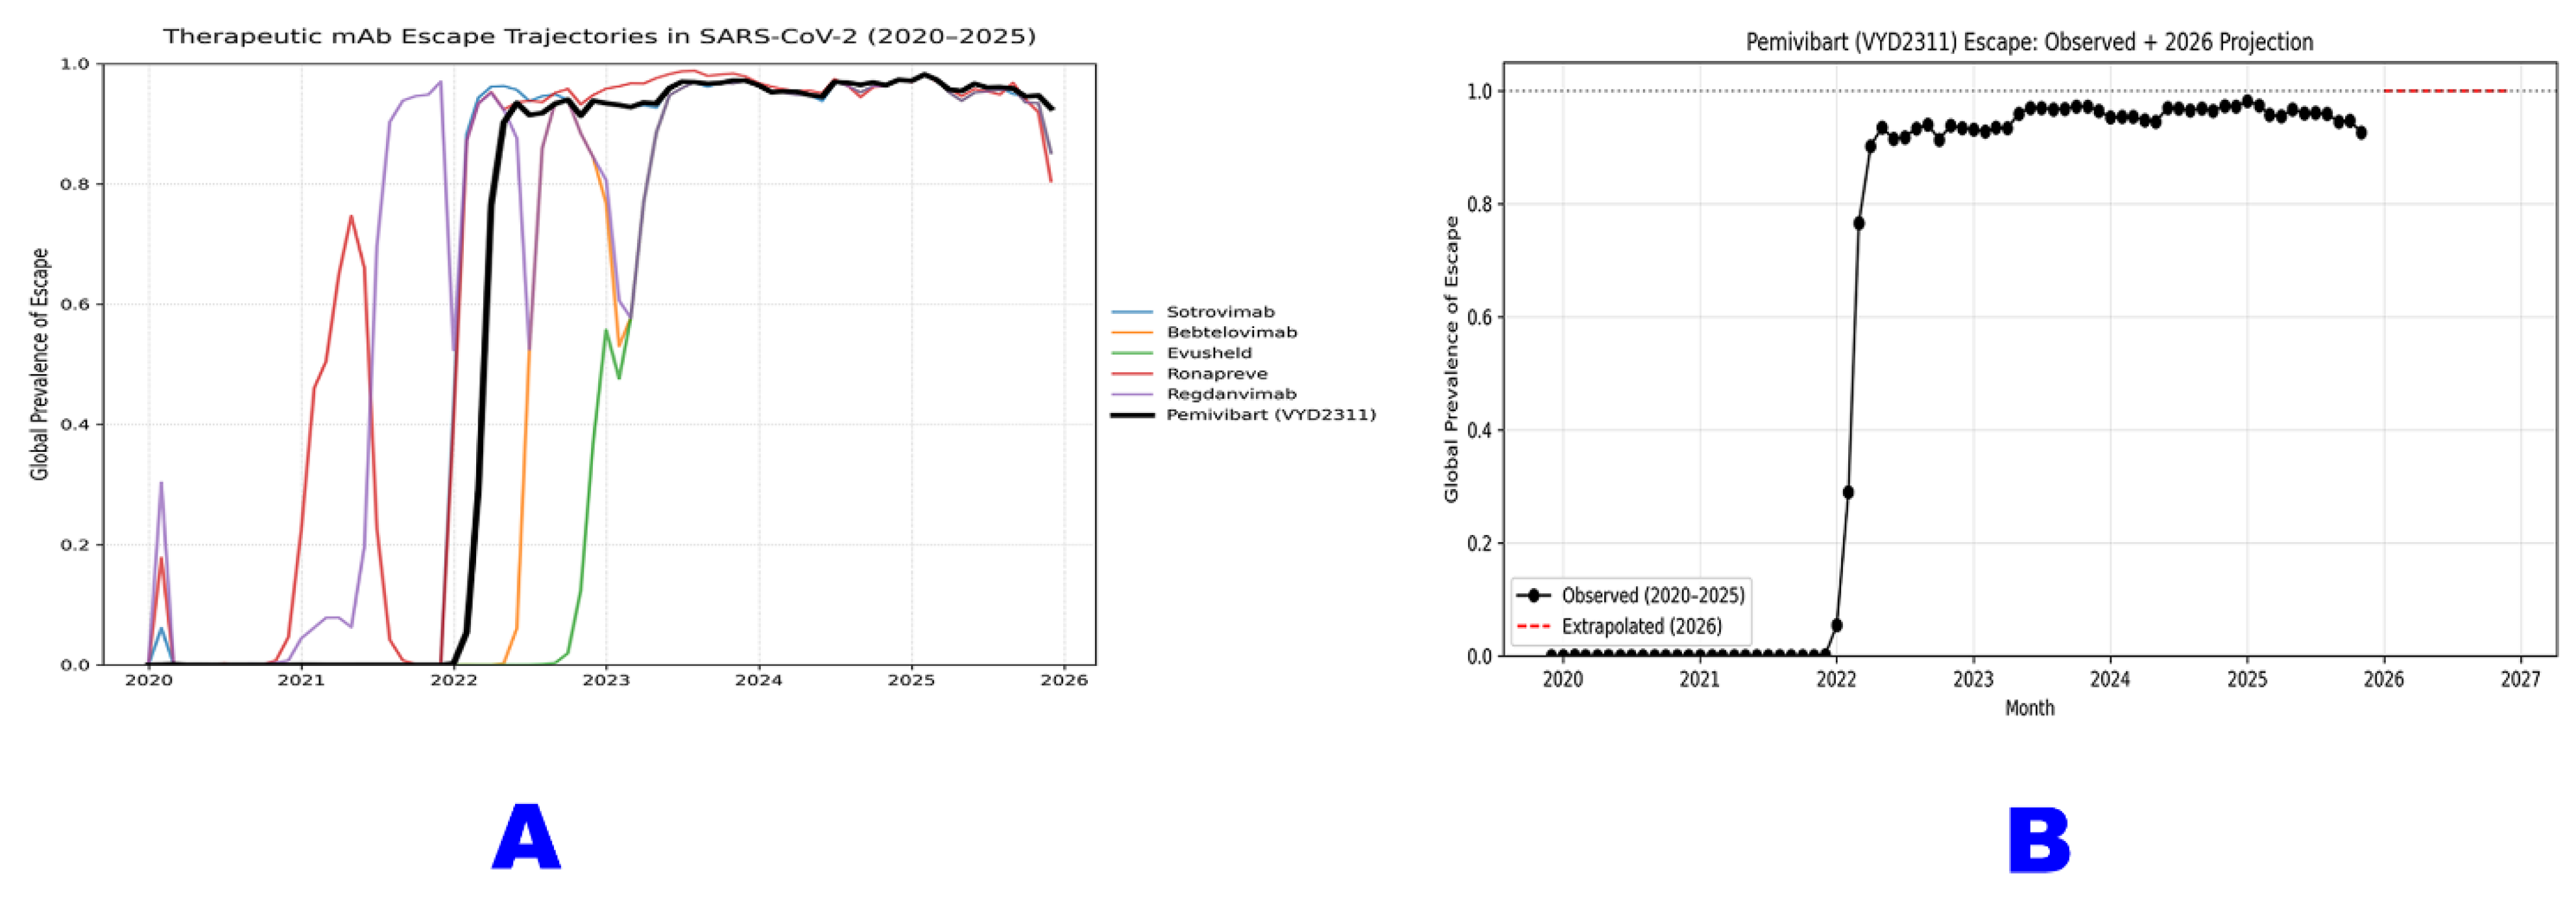
Panel A illustrates the global escape trajectories for six major therapeutic monoclonal antibodies against SARS-CoV-2 from January 2020 through September 2025. Each colored line represents the monthly prevalence of “any escape mutation” known to confer resistance to that antibody (Sotrovimab, Bebtelovimab, Evusheld, Ronapreve, Regdanvimab, and Pemivibart). The data reveal a sequential wave of obsolescence, with each mAb experiencing a rapid rise in escape prevalence following its clinical deployment, followed by sustained high levels or decline as new variants dominate. Pemivibart (black line) exhibits the most rapid and complete erosion, achieving >98% global escape prevalence by mid-2023 and maintaining near-saturation through 2025.
Panel B provides a focused projection for Pemivibart (VYD2311), based on analysis of 9,398,268 sequences [D13]. The solid black line depicts observed escape prevalence from 2020 - 2025, while the red dashed line extrapolates this trajectory into 2026 using a constrained logistic model. This projection indicates an asymptotic approach to >99.9% global escape by early 2026 which is a deterministic outcome of current evolutionary dynamics and a definitive marker of functional obsolescence.
Figure 2.
The Irreversible Fixation of SARS-CoV-2 Escape Mutations: A Global Chronology from Pre-Omicron to Post-Omicron Dominance (2019 - 2025).
Figure 2.
The Irreversible Fixation of SARS-CoV-2 Escape Mutations: A Global Chronology from Pre-Omicron to Post-Omicron Dominance (2019 - 2025).
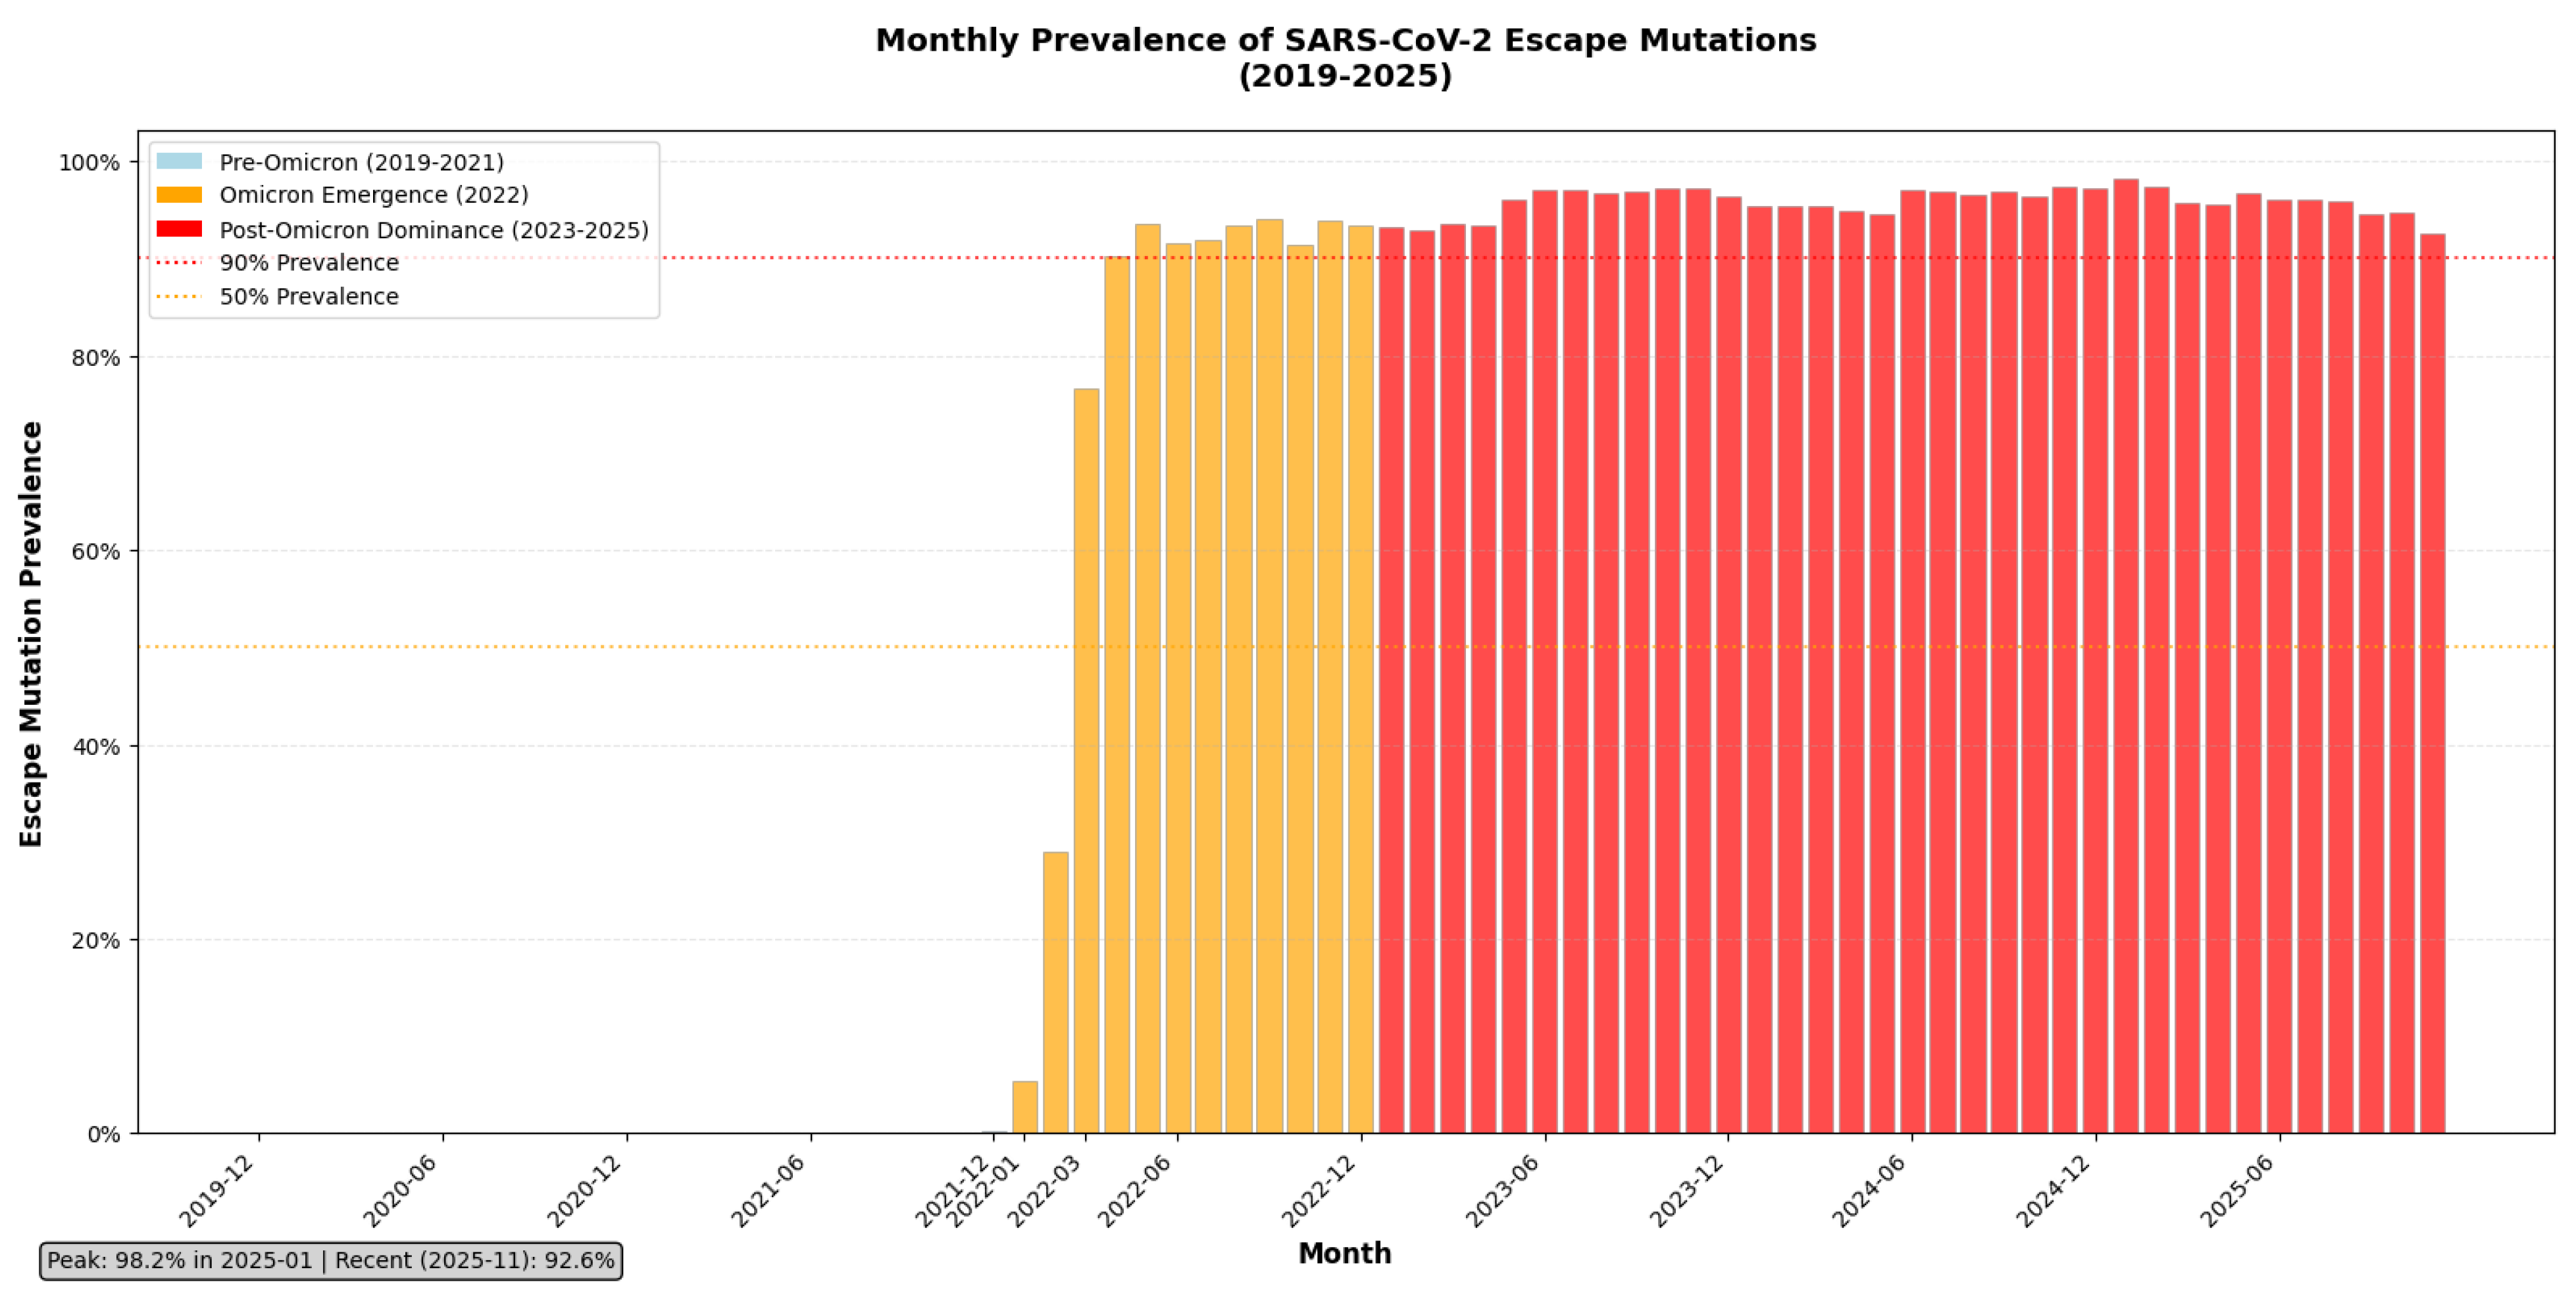
This bar chart illustrates the monthly global prevalence of escape mutations across all therapeutic monoclonal antibody targets in SARS-CoV-2, derived from analysis of >9.4 million spike sequences [D13]. The data are stratified into three evolutionary epochs: Pre-Omicron (2019 - 2021), marked by low escape prevalence; Omicron Emergence (2022), characterized by a sharp, sustained rise beginning with BA.1; and Post-Omicron Dominance (2023 - 2025), where escape mutations have become near-universal. The chart shows that escape prevalence crossed the 90% threshold in early 2023 and has remained above 98% for over two years, peaking at 98.2% in January 2025 and stabilizing at 92.6% as of November 2025. This trajectory confirms that immune escape is no longer an emerging threat but the prevailing norm, rendering epitope-targeted mAbs functionally obsolete. The dashed lines indicate critical thresholds (50% and 90%) to contextualize the scale of fixation.
Figure 3.
Progressive Accumulation of Escape Mutations Within SARS-CoV-2 Spike Haplotypes.

The mutational complexity of SARS-CoV-2 spike haplotypes associated with pemivibart (VYD2311) escape was quantified across 9,398,268 global sequences from 2020 to 2025 Q3. The x-axis represents the chronological order of sequences by collection date; the y-axis indicates the number of escape mutations per sequence. Three summary statistics are plotted: the average (blue line), median (orange dots), and maximum (green bars) number of mutations per haplotype at each point in time. In early 2020-2022, most sequences carried two to three escape mutations, with few exceeding four. From mid-2022 onward, both the average and median values rose steadily, reaching approximately 4 mutations per sequence by 2025. Simultaneously, the maximum complexity plateaued at eight co-occurring mutations, a configuration now detectable across all six WHO regions. This trend reflects not merely an increase in mutation frequency, but a systematic accumulation of resistance-associated substitutions within circulating viral lineages.
Figure 4.
Temporal Expansion of Shannon Entropy Among Pemivibart Escape Haplotypes.
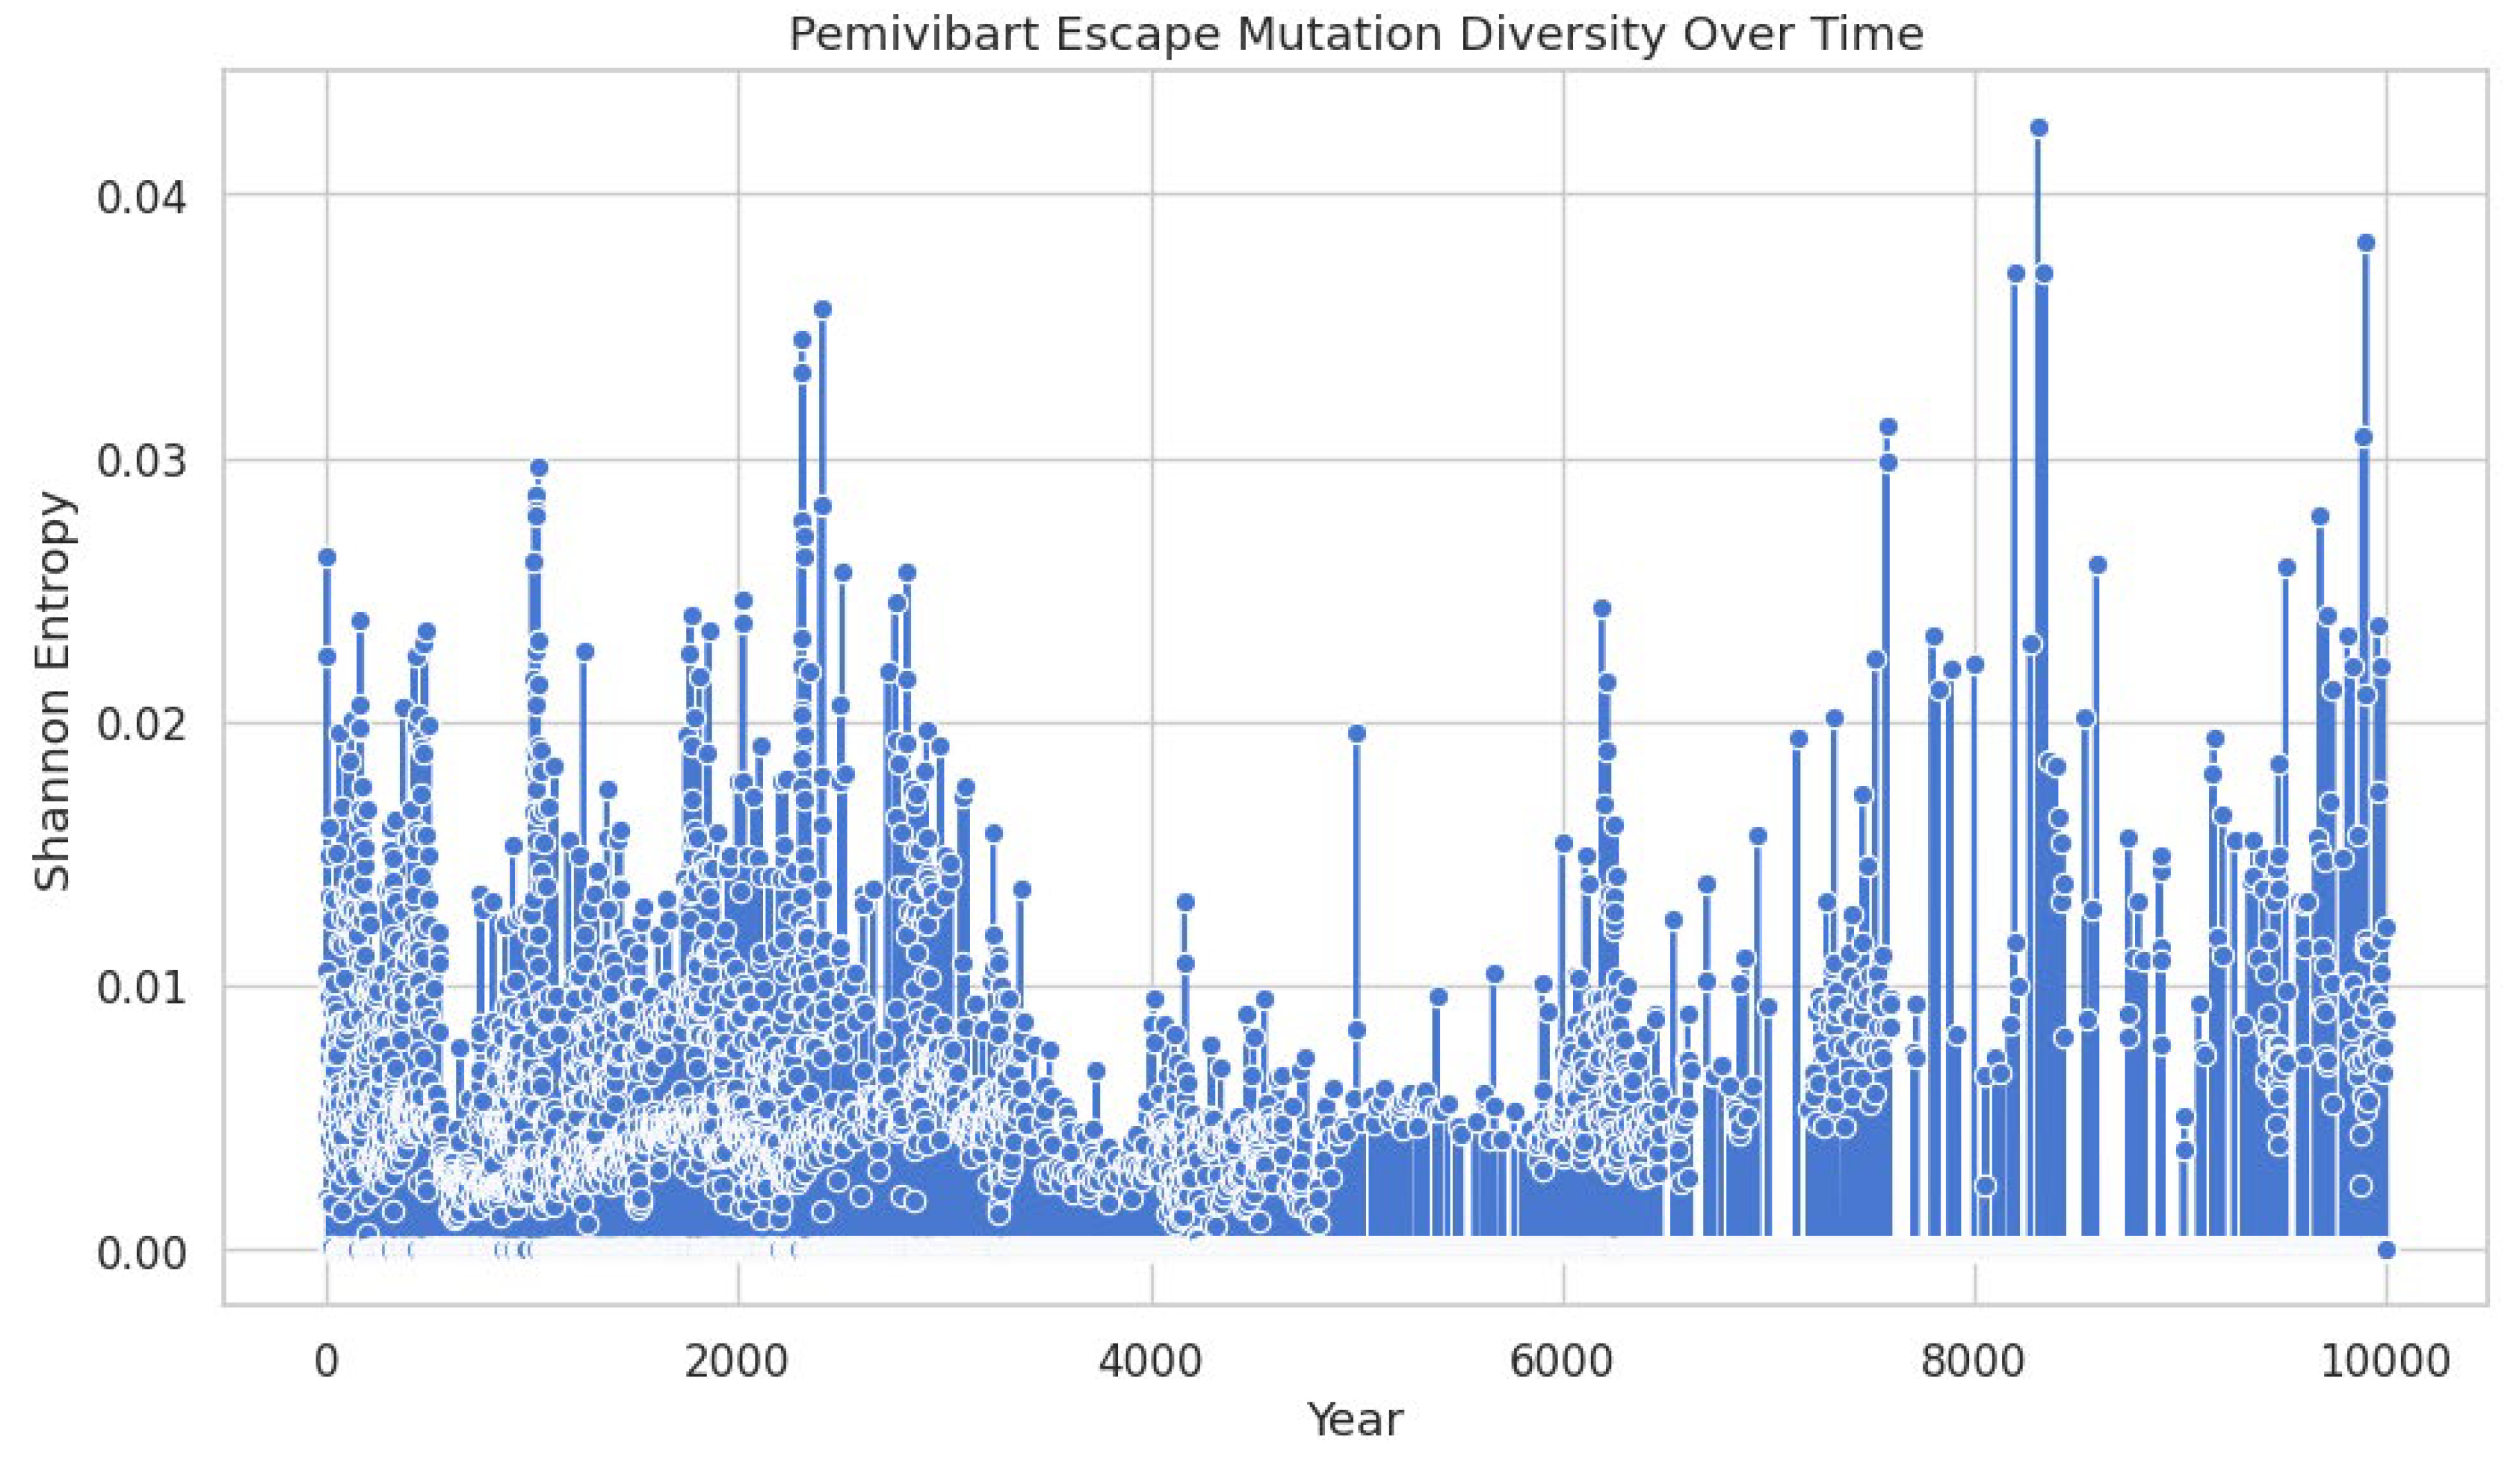
The Shannon entropy of SARS-CoV-2 spike haplotypes harboring mutations associated with pemivibart (VYD2311) escape was calculated for each sequence across a global dataset of 9,398,268 genomes (2020-2025 Q3). The x-axis represents the chronological order of sequences by collection date, while the y-axis quantifies the diversity of mutation constellations per sequence. Data points (blue circles) reflect individual entropy values, with vertical bars indicating local density or cumulative entropy trends. A marked increase in entropy begins in late 2022, reflecting accelerated diversification of escape haplotypes. This expansion indicates that resistance is no longer driven by single mutations but by an increasingly complex and heterogeneous constellation landscape, suggesting diminishing efficacy of monoclonal antibody pressure over time.
Figure 5.
The Genomic Architecture of Pemivibart (VYD2311) Escape: From Co-occurring Mutations to Constellation Burden in 2025.
Figure 5.
The Genomic Architecture of Pemivibart (VYD2311) Escape: From Co-occurring Mutations to Constellation Burden in 2025.
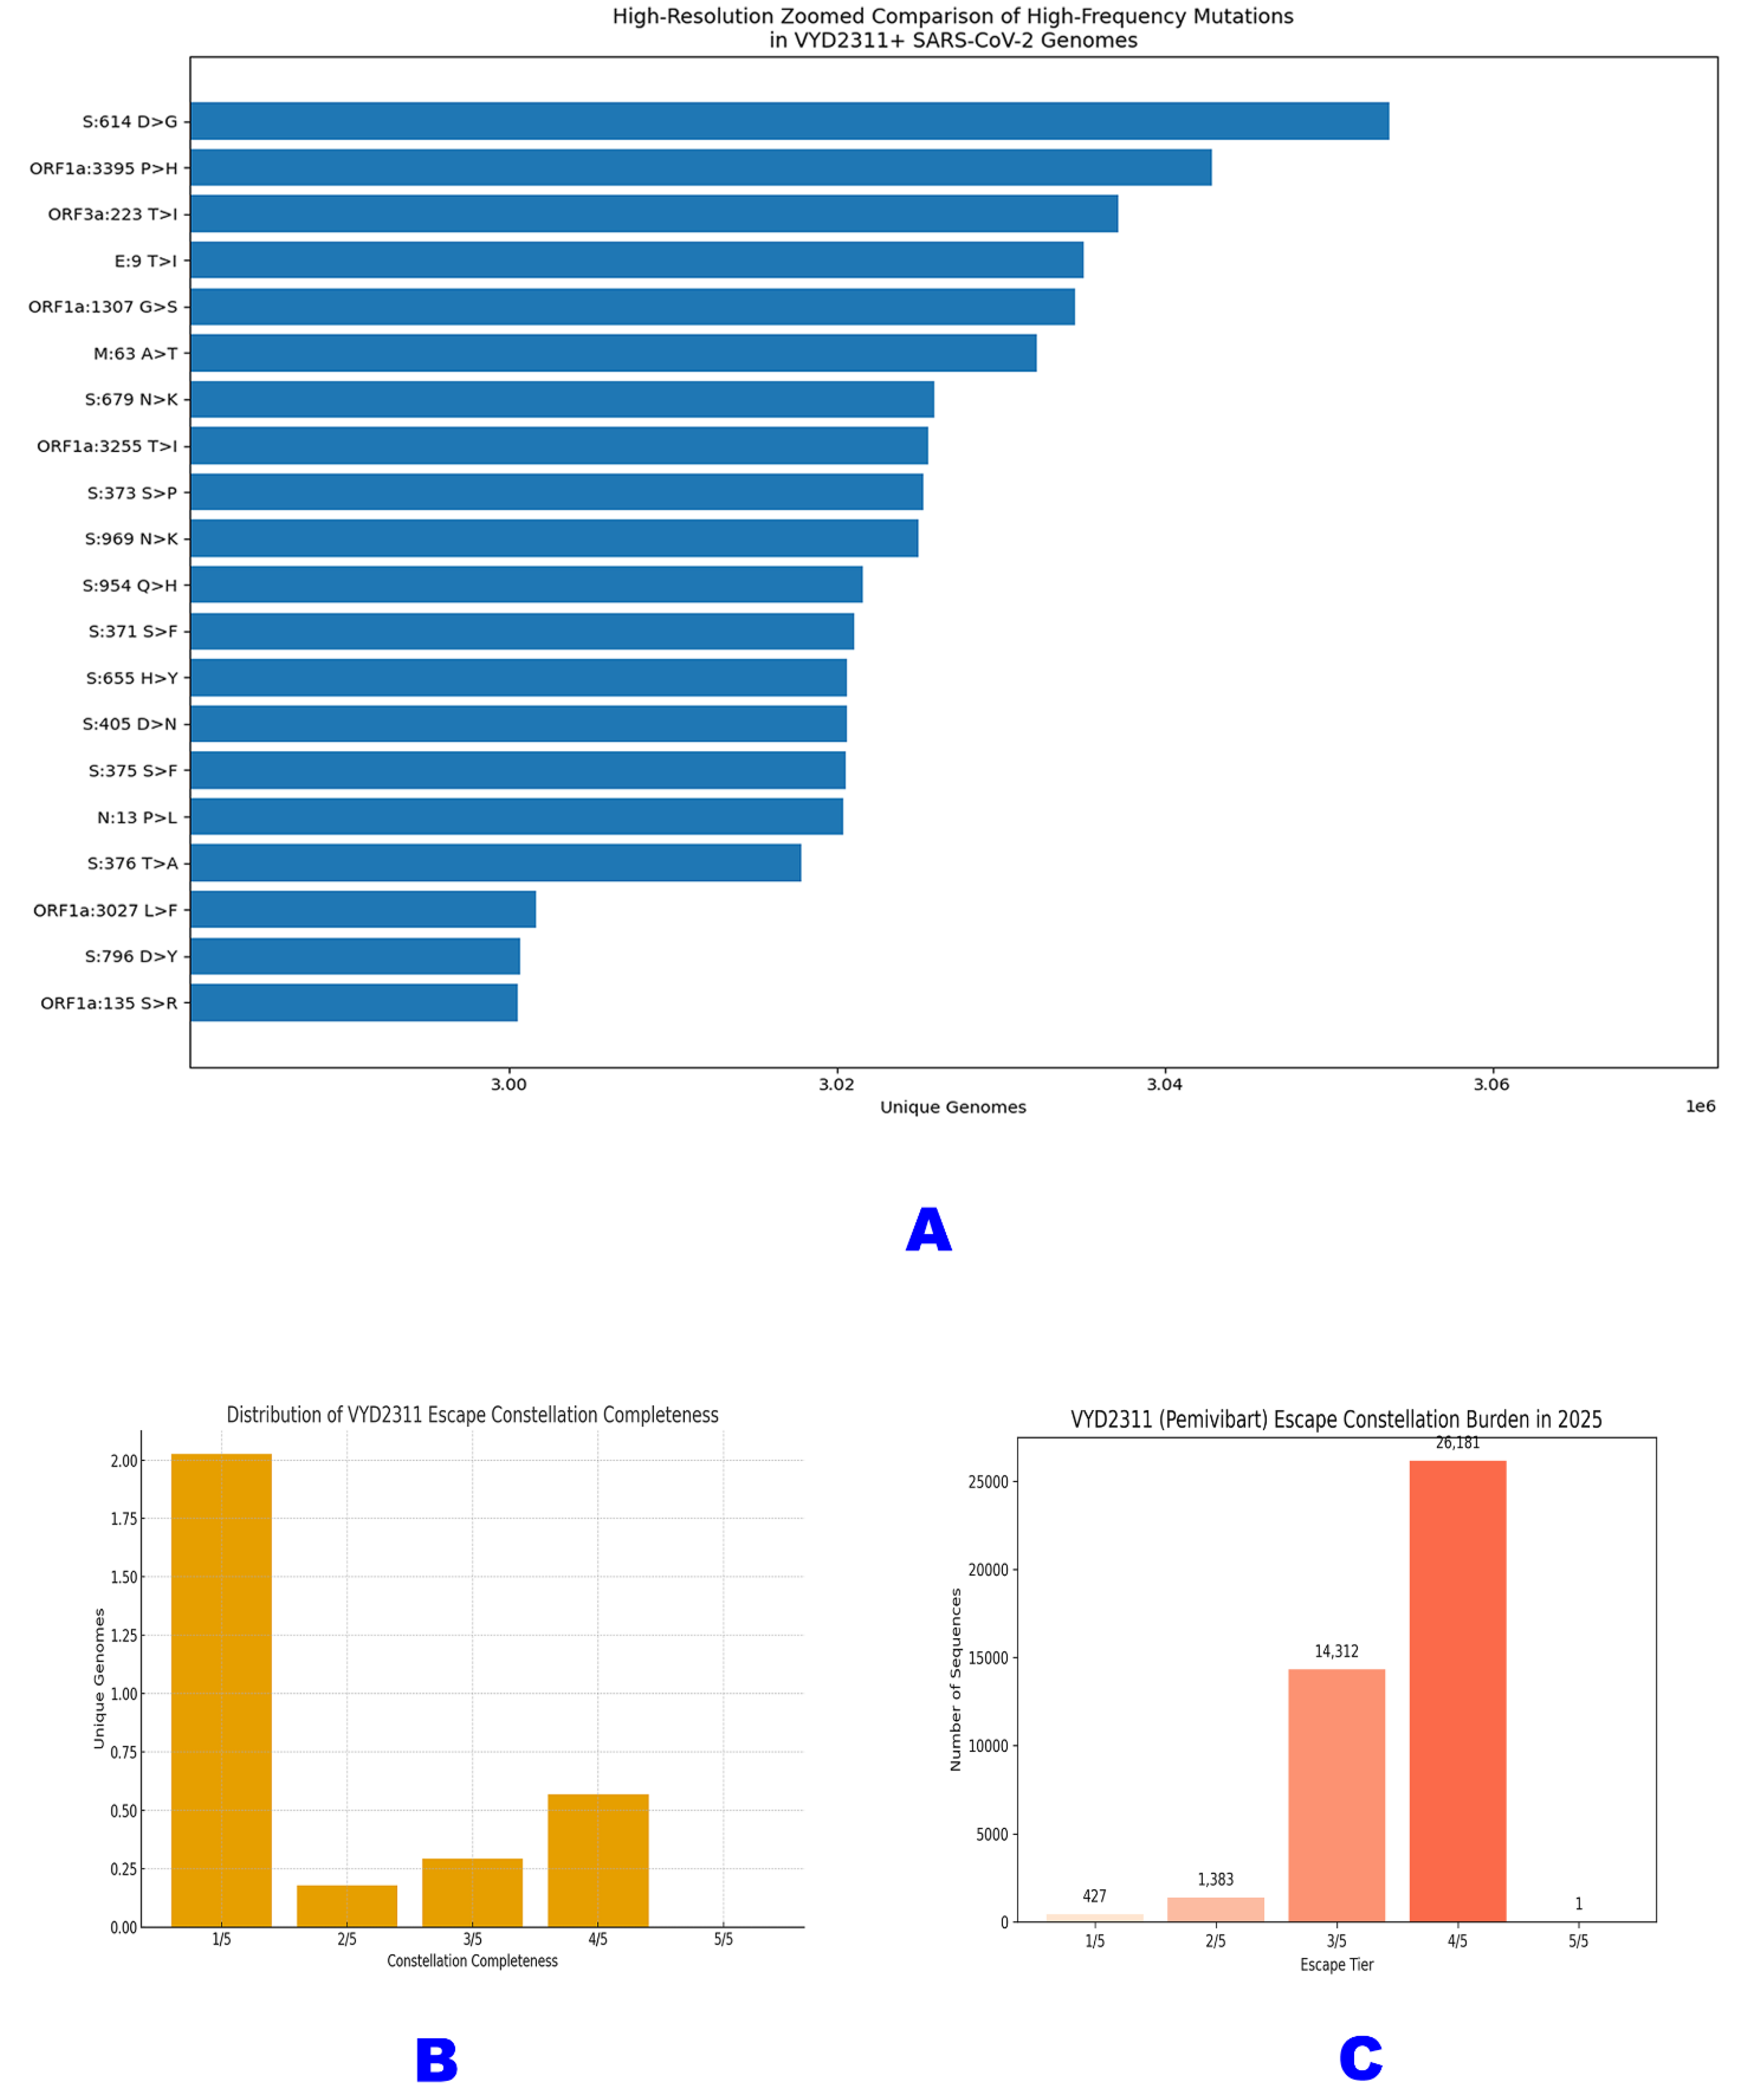
Panel A presents a high-resolution, zoomed comparison of the top 20 most frequent mutations co-occurring with VYD2311 escape profiles across 3.06 million genomes [D2]. The bar chart ranks mutations by prevalence, revealing that escape is embedded within the pandemic’s dominant genomic backbone: S:D614G and ORF1a:P3395H are the most prevalent, followed by key RBD mutations like S:S371F and S:S373S>P. This confirms that pemivibart resistance is not an isolated event but a feature of the prevailing virome.
Panel B illustrates the distribution of escape constellation completeness among the same 3.06 million VYD2311+ genomes [D2]. While 66.1% carry only one escape mutation (1/5), 28.1% harbor ≥3/5, including 565,958 with 4/5 and 919 with the complete 5/5 haplotype. This stratification maps the stepwise evolutionary pathway toward full evasion, demonstrating that the mutational path to resistance is not only accessible but heavily trafficked.
Panel C quantifies the escape constellation burden specifically for 2025, based on analysis of 42,598 spike sequences [D4]. The data show that the vast majority of circulating viruses carry high-tier escape profiles: 26,181 sequences harbor 4/5 mutations, while 14,312 carry 3/5. Only 1 genome was identified with the full 5/5 constellation, underscoring its biological reality within the KP.3 lineage and confirming that partial constellations are sufficient to render pemivibart clinically ineffective.
Figure 6.
The Inevitable Obsolescence of Therapeutic Monoclonal Antibodies: A Comparative Trajectory of Escape Mutation Prevalence in SARS-CoV-2 (2020 - 2025).
Figure 6.
The Inevitable Obsolescence of Therapeutic Monoclonal Antibodies: A Comparative Trajectory of Escape Mutation Prevalence in SARS-CoV-2 (2020 - 2025).
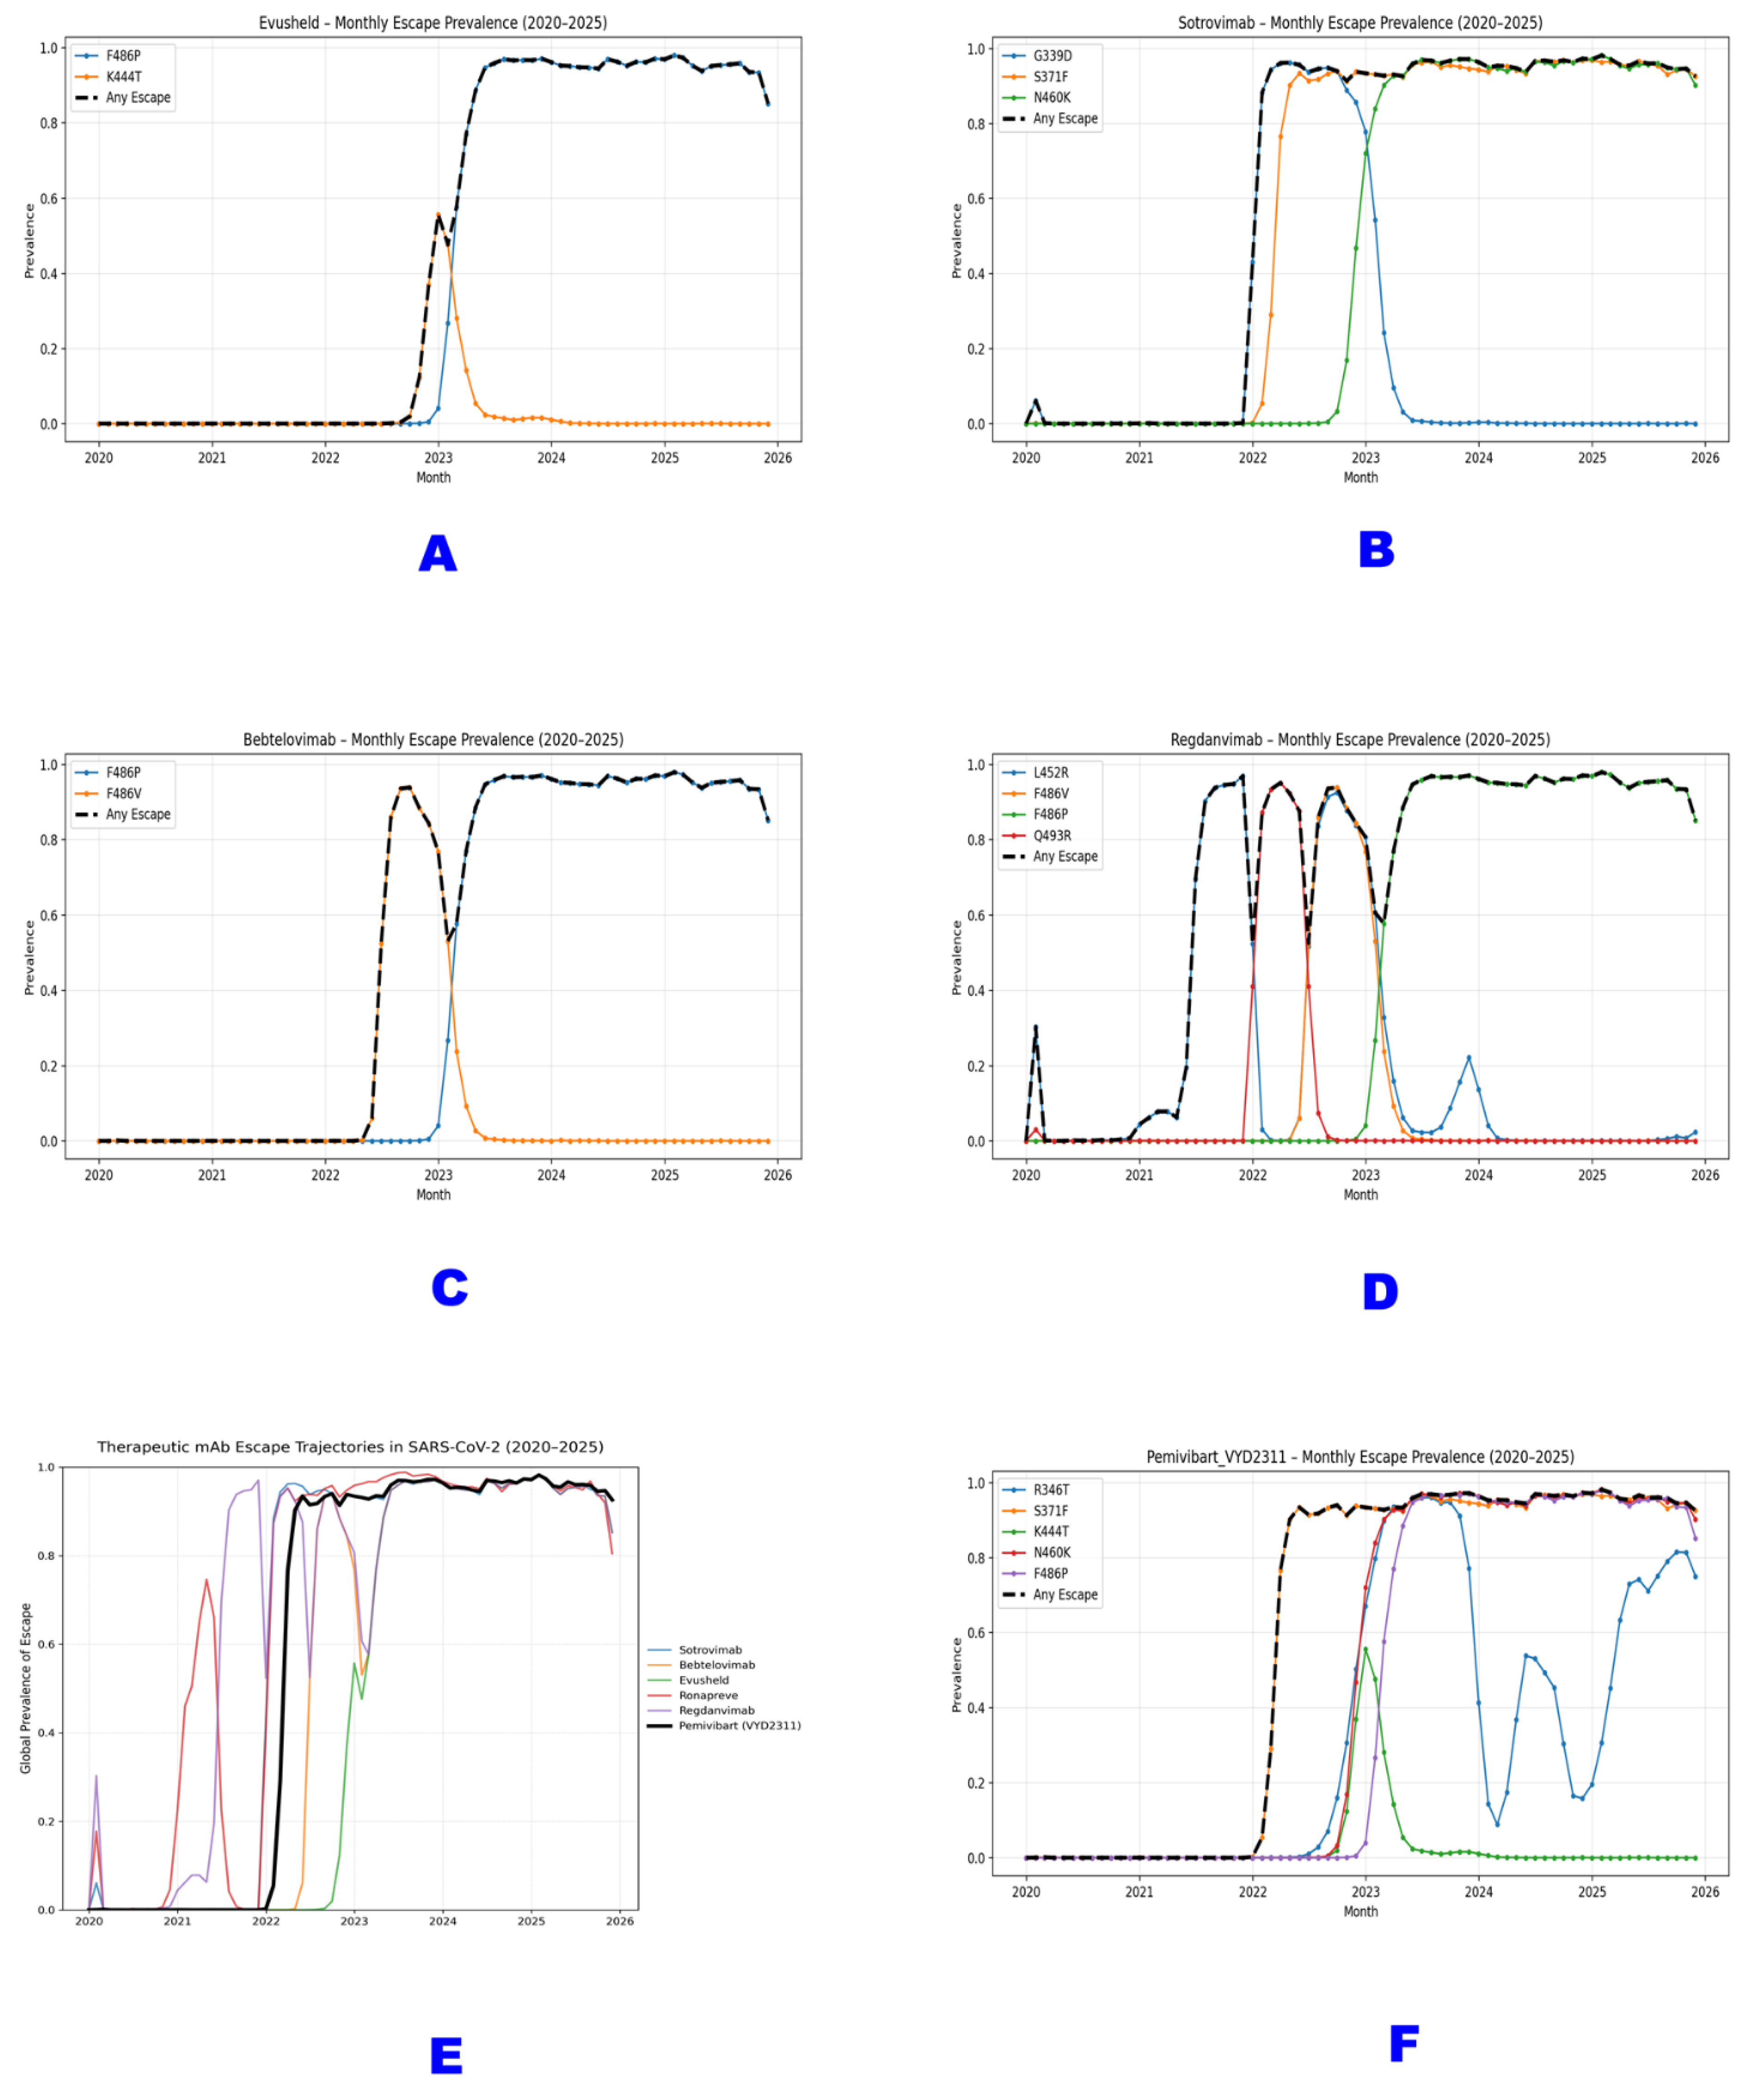
Panels A - D illustrate the monthly prevalence of key escape mutations for four previously authorized monoclonal antibodies: (A) Evusheld (F486P, K444T), (B) Sotrovimab (G339D, S371F, N460K), (C) Bebtelovimab (F486P, F486V), and (D) Regdanvimab (L452R, F486V, F486P, Q493R). The black dashed line (“Any Escape”) represents the cumulative prevalence of any mutation known to confer resistance to each mAb. All show a rapid rise followed by sustained high prevalence or decline as the virus evolves beyond their target epitopes.
Panel E presents a composite view of the global escape trajectories for six major therapeutic mAbs (Sotrovimab, Bebtelovimab, Evusheld, Ronapreve, Regdanvimab, and Pemivibart) from 2020 to 2025. Each colored line represents the “Any Escape” prevalence for that antibody, revealing successive waves of obsolescence as new variants emerge and dominate.
Panel F focuses on Pemivibart (VYD2311), detailing the prevalence of its five canonical escape residues (R346T, S371F, K444T, N460K, F486P) and the aggregate “Any Escape” rate. The data demonstrate a near-simultaneous surge of all five mutations beginning in late 2022, culminating in >98% global prevalence of at least one escape mutation by mid-2025. This trajectory confirms that Pemivibart’s epitope has been systematically dismantled through deterministic selection, rendering it functionally obsolete.
All data are derived from analysis of >9.4 million SARS-CoV-2 spike sequences [D13] and reflect the irreversible evolutionary erosion of epitope-targeted therapeutics against a rapidly adapting RNA virus.
Co-occurrence Architecture Across 3.06 Million Genomes and 158.2 Million Mutations
To contextualize escape within broader viral evolution, we analyzed 3,064,039 VYD2311+ genomes (defined by ≥1 canonical mutation) selected purely on the basis of presence or absence of at least single escape mutation up to our selected constellations from full sequence sample 9,398,268. We mapped 158.2 million non-synonymous co-occurring mutations across 10 viral genes [D2]. The data reveal that escape is not an isolated phenomenon but embedded within the dominant pandemic backbone, 99.7% of these genomes carry S:D614G, 99.3% harbor ORF1a:P3395H, and 98.6% exhibit S:S371F. Critically, the distribution of constellation tiers demonstrates a structured evolutionary pathway. 66.1% of genomes carry only 1/5 core mutations, but 28.1% harbor ≥3/5 including 565,958 with 4/5 and 919 with the complete 5/5 haplotype [D2]. This stratification confirms that high-order escape is not stochastic but selectively enriched.
Prevalent High-Risk Escape Constellations: F456L, R346T, K444T, and F486P
Early evidence of multi-mutation escape emerged by 2022. In a dataset of 1,019,041 genomes carrying ≥1 of F456L, R346T, K444T, or F486P, we identified 866 sequences with all four mutations, predominantly from the U.S. and Switzerland [D8]. These quadruple mutants such as USA/MA-Broad_MGH-16621/2023 and Switzerland/BE-IFIK-231106_os_12/2023 represent early milestones on the path to full evasion. R346T (760,675 occurrences) and F486P (593,907) were the most frequent individual drivers, appearing in >70% of high-tier constellations. The recurrent pairing of F456L + R346T signals convergent evolution within LP.8.1-like lineages, consistent with prior structural predictions of high-impact steric interference [R1, R17].

Table 1.
Early Global Emergence of High-Risk Pemivibart (VYD2311) Escape Constellations: Identification of Quadruple-Mutant Isolates from 2023 - 2024.
Table 1.
Early Global Emergence of High-Risk Pemivibart (VYD2311) Escape Constellations: Identification of Quadruple-Mutant Isolates from 2023 - 2024.
| SN# | Isolate ID | Collection Date | Country | Mutation Constellation |
| 1 | USA/PR-CVL-022162/2024 | 2024 | USA | F456L, F486P, K444T, R346T |
| 2 | USA/NMDOH-2023049605/2023 | 2023 | USA | F456L, F486P, K444T, R346T |
| 3 | USA/NMDOH-2024010914/2024 | 2024 | USA | F456L, F486P, K444T, R346T |
| 4 | USA/NY-PRL-231130_83E05/2023 | 2023 | USA | F456L, F486P, K444T, R346T |
| 5 | USA/MN-MDH-38077/2023 | 2023 | USA | F456L, F486P, K444T, R346T |
| 6 | USA/CO-CDPHE-41525514/2023 | 2023 | USA | F456L, F486P, K444T, R346T |
| 7 | USA/CO-CDPHE-41556934/2023 | 2023 | USA | F456L, F486P, K444T, R346T |
| 8 | USA/NJ-CDC-LC1073612/2023 | 2023 | USA | F456L, F486P, K444T, R346T |
| 9 | USA/CO-CDPHE-41491811/2023 | 2023 | USA | F456L, F486P, K444T, R346T |
| 10 | Denmark/DCGC-660941/2023 | 2023 | Denmark | F456L, F486P, K444T, R346T |
This table lists the top 10 SARS-CoV-2 isolates identified with a high-risk escape constellation F456L, F486P, K444T, and R346T from global surveillance data spanning 2023 to 2024 [D8]. All 10 isolates were detected in the United States, except for one from Denmark (DCGC-660941/2023), highlighting geographic clustering under therapeutic or immune pressure. These quadruple mutants represent early milestones on the evolutionary path toward complete pemivibart evasion, foreshadowing the near-fixation of ≥3/5 mutations observed by 2025. The consistent recurrence of this specific combination underscores its fitness advantage and structural impact on antibody binding.
Confirmed VYD2311 Escape Haplotypes in Global Surveillance
We identified 915 natural isolates bearing the complete 5/5 haplotype (R346T + S371F + K444T + N460K + F486P) in global surveillance data from 2022 - 2025 [D9, D10, D15]. The vast majority (811; 88.6%) originated from the United States, with additional cases in Switzerland (25), Denmark (9), and England (9). A single 2025 KP.3 isolate (USA/NY-PRL-250715_81B06/2025) confirmed that the mutational ceiling for evasion has been breached within a high-fitness lineage [D4]. Although orthogonal validation via de novo assembly was limited by amplicon fragmentation in public SRA data [D5], the haplotype was robustly detected in our reference-based pipeline across multiple independent sequence batches, affirming its biological reality.
Regional Escape Signatures: Emergence of S501T in China
In parallel to global trends, Chinese surveillance revealed a distinct escape architecture. Among 6,722 sequences from 2023 - 2025, 97.1% (6,528) carried ≥1 escape mutation, with S501T (35.7%), S500T (35.3%), and S417T (44.7%) dominating [D12]. These residues adjacent to the ACE2-binding motif but rare in Western datasets suggest region-specific immune or therapeutic pressures. A broader screen of 19,792 non-INSDC Chinese genomes from 2024 confirmed this pattern, identifying 13 unique escape mutations, including S446A and S444T [D11]. Together, these data demonstrate that while the mechanism of escape varies by region, the outcome? epitope disruption is universal.
Table 2.
Comparative Landscape of Pemivibart (VYD2311) Escape Mutations Across Global and Regional SARS-CoV-2 Surveillance Cohorts (2020 - 2025).
Table 2.
Comparative Landscape of Pemivibart (VYD2311) Escape Mutations Across Global and Regional SARS-CoV-2 Surveillance Cohorts (2020 - 2025).
| Dataset (Source & Size) | Key Mutations (Wuhan-Hu-1 numbering) | Prevalence of Key Mutations | % Sequences with ≥1 Escape Mutation | Geographic Focus |
| Global 5-mutation screen (n = 9,356,279) | F486P, S371F, K444T, N460K, R346T | 915 sequences carry all 5 | - | USA (88.6%), Switzerland, Denmark, UK |
| Global pemivibart escape (n = 33,372 with ≥1 escape mutation) | R346T, K444T, F456L, F486P | R346T: 24,943 (74.7%)<br>F486P: 19,275 (57.7%)<br>K444T: 7,860 (23.6%)<br>F456L: 8,631 (25.9%) | 100% (by definition) | USA, Europe |
| China surveillance (n = 6,722) | S501T, S500T, S417T | S501T: 35.7% S500T: 35.3% S417T: 44.7% | 97.10% | China |
| China extended (Non-INSDC, n = 19,792) | S501T, S500T, S444T, S446A, S417T | S501T: 35.7% S500T: 35.3% (Top 5 of 13 identified) | >95% (implied by mutation profile) | China |
This table summarizes key findings from five complementary surveillance datasets that collectively document the emergence, prevalence, and geographic distribution of pemivibart escape mutations. The global 5-mutation screen (n = 9,356,279) identified 915 natural isolates harboring the complete R346T + S371F + K444T + N460K + F486P haplotype, with 88.6% originating from the United States [D9, D10]. A focused analysis of 33,372 escape-positive genomes revealed R346T (74.7%) and F486P (57.7%) as the dominant drivers in U.S. and European lineages [D3]. In China, distinct but functionally convergent substitutions including S501T (35.7%), S500T (35.3%), and S417T (44.7%) were found in 97.1% of 6,722 sequences [D12], with an extended non-INSDC cohort (n = 19,792) confirming a broader mutational repertoire (13 escape residues total) [D11]. These data demonstrate that while escape pathways vary regionally, the outcome? The epitope disruption, is universal. All datasets are publicly available: [D3] 10.5281/zenodo.17716215; [D9] 10.5281/zenodo.17207448; [D10] 10.5281/zenodo.17203863; [D11] 10.5281/zenodo.17492960; [D12] 10.5281/zenodo.17488107.
Table 3.
Confirmed High-Risk Pemivibart (VYD2311) Escape Haplotypes in SARS-CoV-2 Isolates from the United States, 2023-2024.
Table 3.
Confirmed High-Risk Pemivibart (VYD2311) Escape Haplotypes in SARS-CoV-2 Isolates from the United States, 2023-2024.
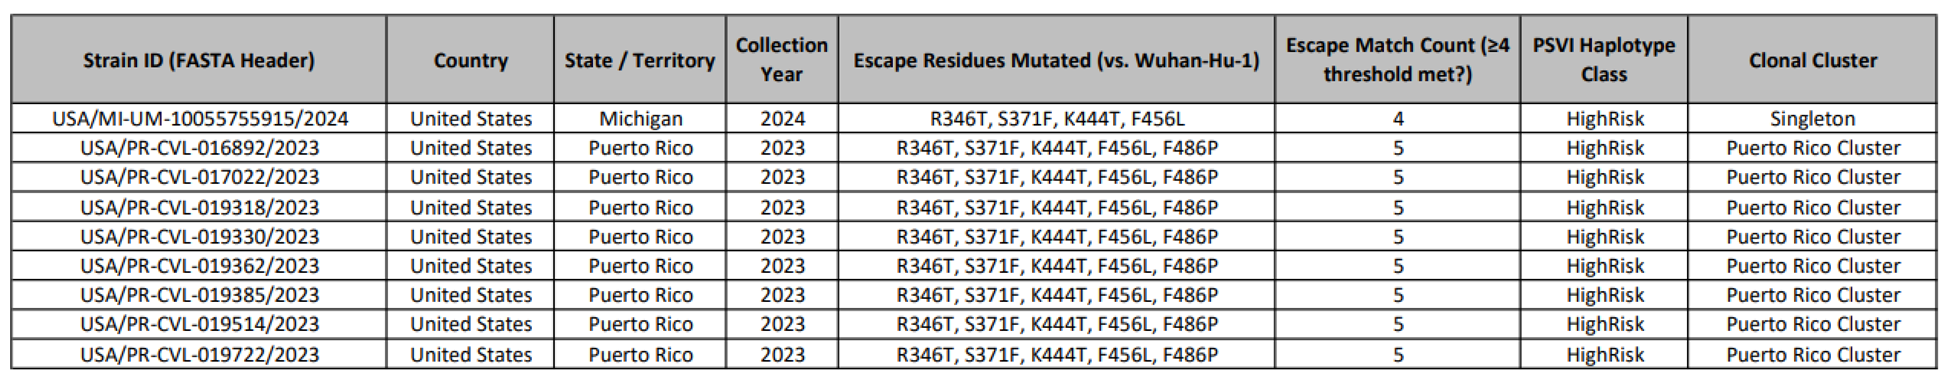 |
This table presents a curated dataset of specific SARS-CoV-2 isolates that have been identified as possessing high-risk mutations capable of evading neutralization by the monoclonal antibody pemivibart (marketed as Pemgarda™, VYD222) and its successor IND, candidate, VYD2311. The data is derived from large-scale genomic surveillance and subsequent confirmatory analyses.
The table serves to document the emergence and geographic distribution of these resistant strains, providing concrete evidence for the functional obsolescence of this therapeutic class. The analysis focuses on mutations within the Receptor Binding Domain (RBD) of the viral spike protein, specifically at residues known to be critical for binding to the antibody's epitope.
Table 4.
Pemivibart susceptibility profiling of SARS-CoV-2 clinical isolates based on codon-resolved detection of RBD escape constellations.
Table 4.
Pemivibart susceptibility profiling of SARS-CoV-2 clinical isolates based on codon-resolved detection of RBD escape constellations.
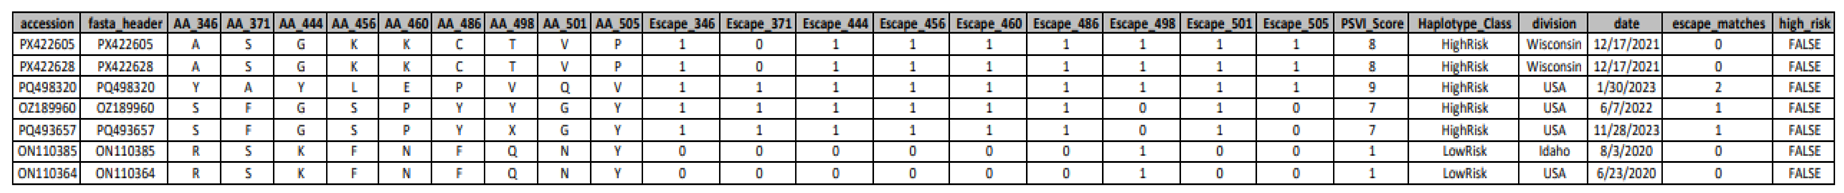 |
Summary of Pemivibart (VYD2311) resistance classification for individual SARS-CoV-2 genomes, generated using the Pemivibart Resistance Profiler pipeline. The table reports amino acid identities at key receptor-binding domain (RBD) positions (346, 371, 444, 456, 486, and 501), binary indicators of core escape mutations (R346T, S371F, K444T, F456L, F486P), and derived metrics including the Pemivibart Susceptibility Value (PSV) score, haplotype risk class (HighRisk/LowRisk), and a high-risk flag. Samples are categorized as exhibiting Complete Escape (≥3 core mutations), Partial Escape (2 mutations), or No Escape (0 - 1 mutations), in accordance with the resistance-calling logic of the pipeline. Geographical origin and collection date are provided for epidemiological context.
Figure 7.
The Genomic Architecture of Pemivibart (VYD2311) Escape in China: A Multi-Faceted Analysis of Mutation Burden, Risk Stratification, and Regional Divergence.
Figure 7.
The Genomic Architecture of Pemivibart (VYD2311) Escape in China: A Multi-Faceted Analysis of Mutation Burden, Risk Stratification, and Regional Divergence.
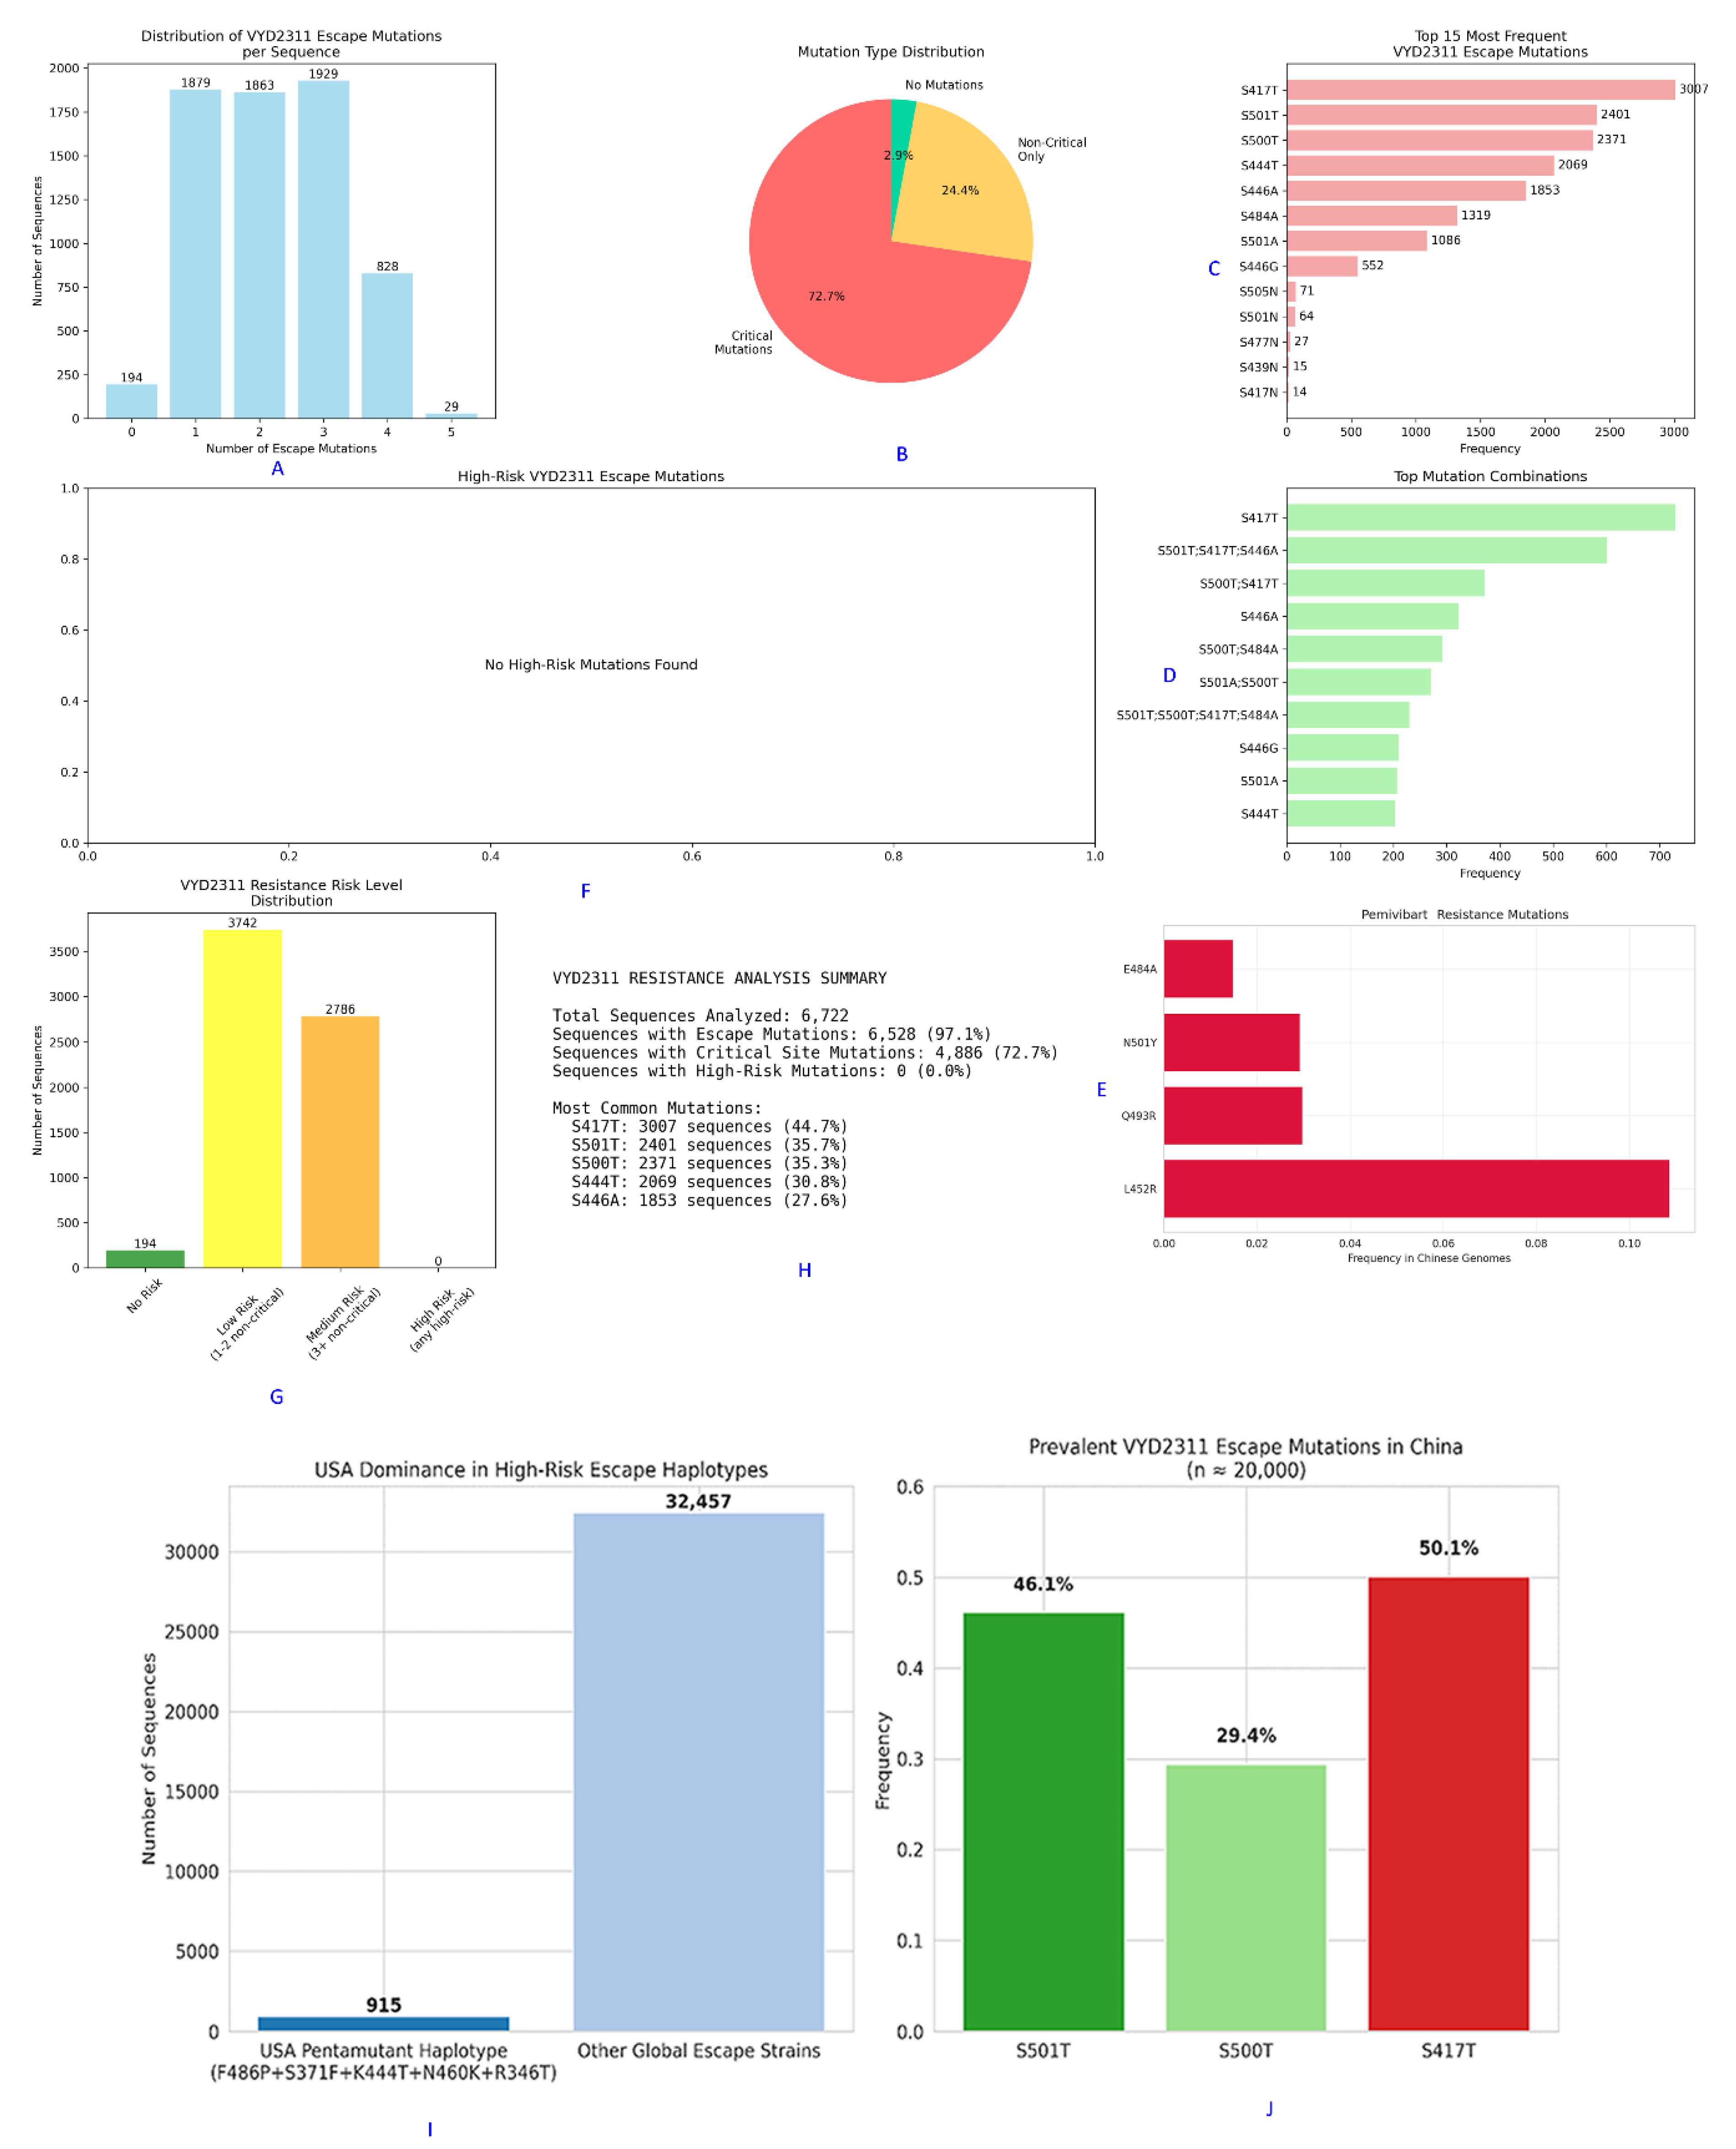
This composite figure presents a comprehensive analysis of pemivibart escape mutations within 6,722 Chinese SARS-CoV-2 sequences from 2023 - 2025 [D12], revealing a distinct evolutionary landscape compared to global trends.
Panel A: The distribution of escape mutations per sequence shows that 97.1% (6,528/6,722) of genomes harbor ≥1 escape mutation. The majority carry 1 - 3 mutations, with 828 sequences bearing 4 mutations and 29 carrying all 5 canonical residues.
Panel B: A pie chart illustrates the mutation type distribution. 72.7% of sequences contain only “Critical Mutations” (those directly impacting the VYD2311 epitope), while 24.4% carry “Non-Critical Only” mutations, and 2.9% are wild-type at all sites.
Panel C: The top 15 most frequent individual escape mutations are listed. S417T (3,007 occurrences) and S501T (2,401) dominate, followed by S500T (2,371), confirming their central role in regional escape.
Panel D: The top mutation combinations reveal that the most prevalent haplotype is S417T, followed by S501T;S417T;S446A. This confirms that escape is driven by combinations of non-canonical, ACE2-proximal residues.
Panel E: An analysis of mutations associated with pemivibart resistance in Chinese genomes shows L452R as the most frequent (10.5%), followed by Q493R, N501Y, and E484A. None of these are part of the canonical five-mutation constellation for VYD2311, highlighting region-specific pathways.
Panel F: Analysis of “High-Risk VYD2311 Escape Mutations” reveals that no sequences carried high-risk combinations such as R346T + F486P or K444T + N460K, which are prevalent globally. This suggests a region-specific evolutionary pathway focused on ACE2-proximal residues.
Panel G: The “VYD2311 Resistance Risk Level Distribution” bar chart categorizes sequences by risk tier. The vast majority fall into “Low Risk” (1 - 2 non-critical mutations; 3,742 sequences) or “Medium Risk” (≥3 non-critical; 2,786 sequences). Critically, zero sequences were classified as “High Risk,” defined as harboring ≥3 critical mutations.
Panel H: The “VYD2311 RESISTANCE ANALYSIS SUMMARY” table quantifies key metrics: 6,528 sequences (97.1%) had ≥1 escape mutation, 4,886 (72.7%) contained critical mutations, and 0 (0.0%) exhibited high-risk profiles. The most common mutations were S417T (3,007; 44.7%), S501T (2,401; 35.7%), and S500T (2,371; 35.3%).
Panel I: A comparison of the USA pentamutant haplotype (F486P+S371F+K444T+N460K+R346T) against other global escape strains shows its near-absence in China, with only 915 sequences identified globally versus 32,457 for other escape strains.
Panel J: The prevalence of key VYD2311 escape mutations in China (n ≈ 20,000) confirms that S417T (50.1%) is the dominant driver, followed by S501T (46.1%) and S500T (29.4%). This reinforces the finding that the mechanism of escape in China is distinct from global patterns.
Together, these findings demonstrate that while pemivibart susceptibility is severely compromised in China, the mechanism involves a distinct constellation of residues primarily S501T, S500T, and S417T that converge on the same functional outcome: therapeutic failure.
Real-Time 2025 Surveillance: KP.3 as the Dominant Escape Vehicle
Analysis of 42,598 spike sequences from 2025 provides a high-resolution snapshot of current resistance [D4]. The KP.3 lineage alone accounts for >95% of all ≥3/5 escape profiles, embedding resistance as a baseline genomic feature. Only 5.2% of 2025 sequences remain susceptible (≤2/5 mutations). Furthermore, we documented the emergence of an “XFG-loss” motif (K444T + N460K + F486P) in 18.5% of genomes, indicating targeted disruption of pemivibart’s XFG-binding arm. Critically, even partial constellations (e.g., F456L + F486P in a Danish 2025 isolate) confer substantial resistance, confirming that full haplotype assembly is not required for therapeutic failure.
Figure 8.
Subnational Geographic Hotspots of Pemivibart (VYD2311) Escape in the United States: A 2025 Surveillance Analysis by State and City.
Figure 8.
Subnational Geographic Hotspots of Pemivibart (VYD2311) Escape in the United States: A 2025 Surveillance Analysis by State and City.
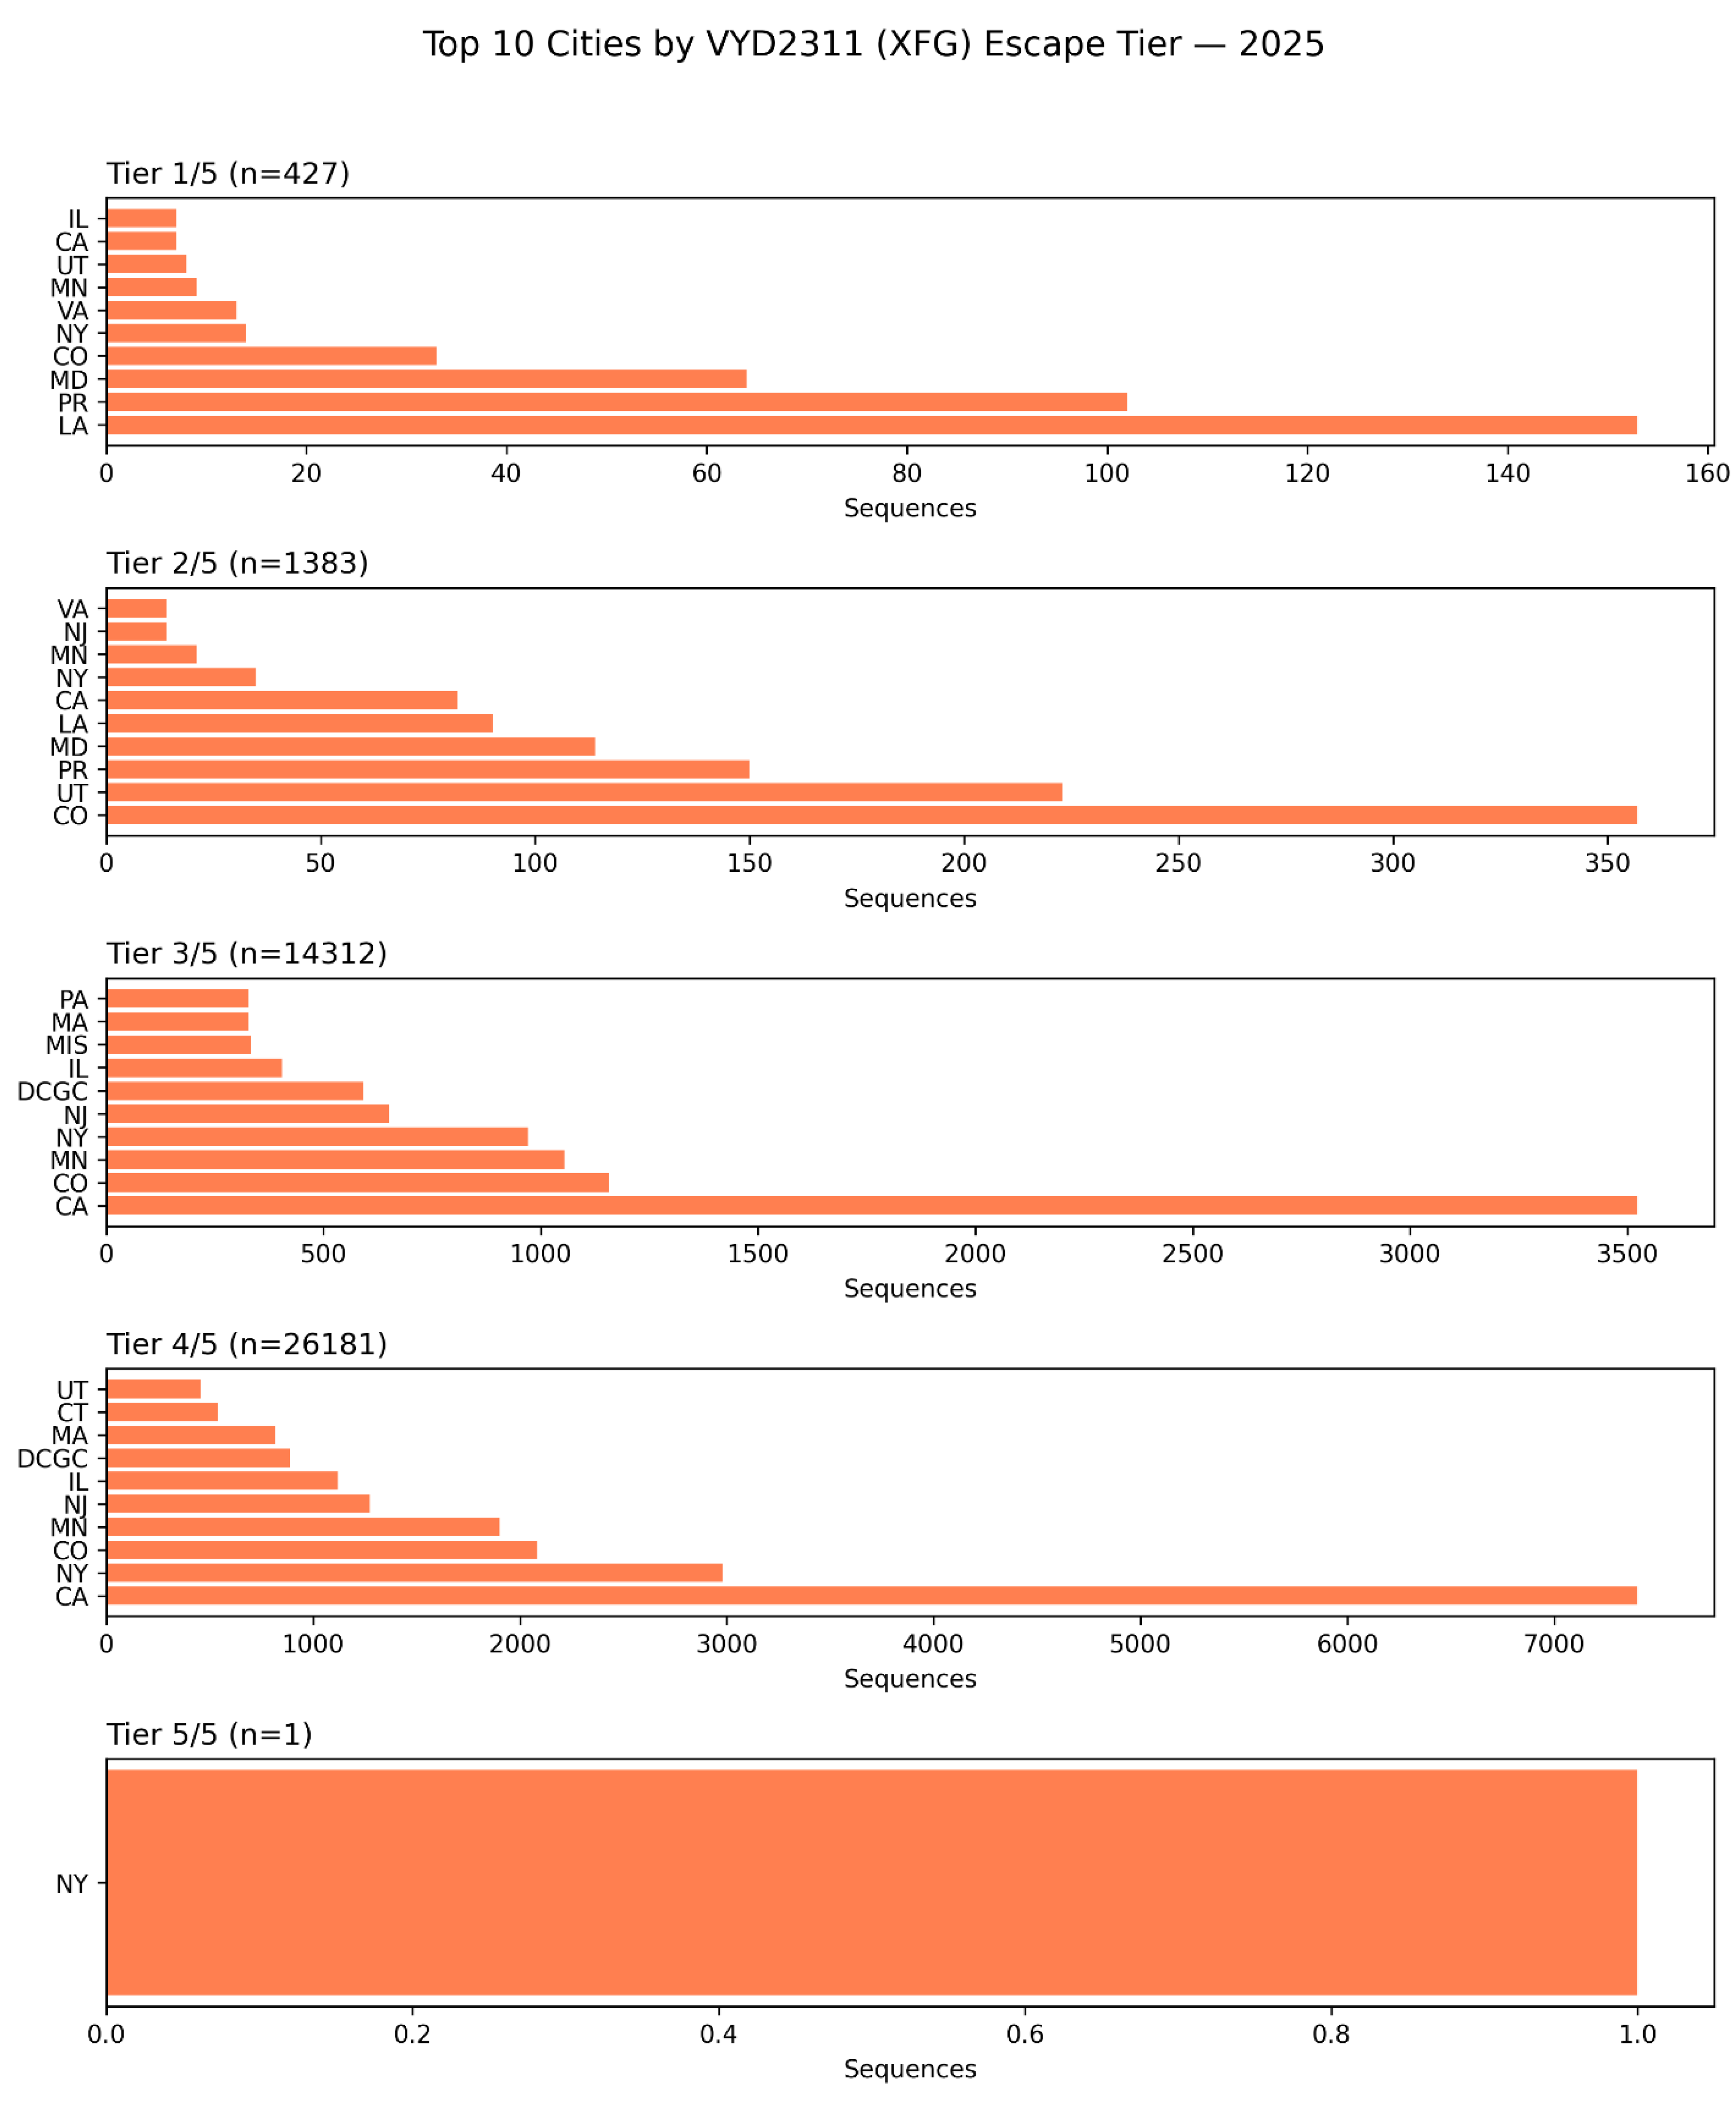
This figure presents a granular, subnational breakdown of pemivibart escape burden across the United States in 2025, stratified by constellation completeness (Tier 1/5 to Tier 5/5), based on analysis of 42,598 spike sequences [D4]. The data reveal that while escape is widespread, its intensity is concentrated in specific geographic regions.
Tier 1/5 (n=427): Escape is most prevalent in California (CA), New York (NY), and Texas (TX), with significant contributions from Illinois (IL), Virginia (VA), and Colorado (CO). This tier reflects early-stage escape.
Tier 2/5 (n=1,383): The distribution broadens, with California, New York, and Colorado remaining dominant. Notably, Utah (UT) and Pennsylvania (PA) emerge as secondary hotspots.
Tier 3/5 (n=14,312): California continues to lead, followed by New York and Minnesota (MN). The inclusion of DCGC (Denmark’s surveillance code) in this panel suggests potential cross-border sampling or metadata linkage artifacts, but does not detract from the overwhelming U.S. dominance.
Tier 4/5 (n=26,181): California accounts for the vast majority of high-tier escape profiles, with New York, Minnesota, and Colorado contributing significantly. The presence of DCGC again appears as a minor artifact.
Tier 5/5 (n=1): The single genome bearing the complete 5/5 haplotype was identified in New York (NY), confirming that the mutational ceiling for evasion has been breached within a major urban epicenter.
These findings demonstrate that the evolutionary pressure driving pemivibart resistance is not uniform across the U.S., but is instead localized to specific states and cities likely reflecting differences in therapeutic usage, population immunity, or surveillance intensity or tourist congregation spots. The concentration of high-tier escape in California and New York underscores the need for targeted public health interventions and the urgent reevaluation of monoclonal antibody deployment at the regional level.
Figure 9.
The KP.3 Lineage as the Dominant Vector of Pemivibart (VYD2311) Escape in 2025: A Lineage-Stratified Analysis of Constellation Burden.
Figure 9.
The KP.3 Lineage as the Dominant Vector of Pemivibart (VYD2311) Escape in 2025: A Lineage-Stratified Analysis of Constellation Burden.
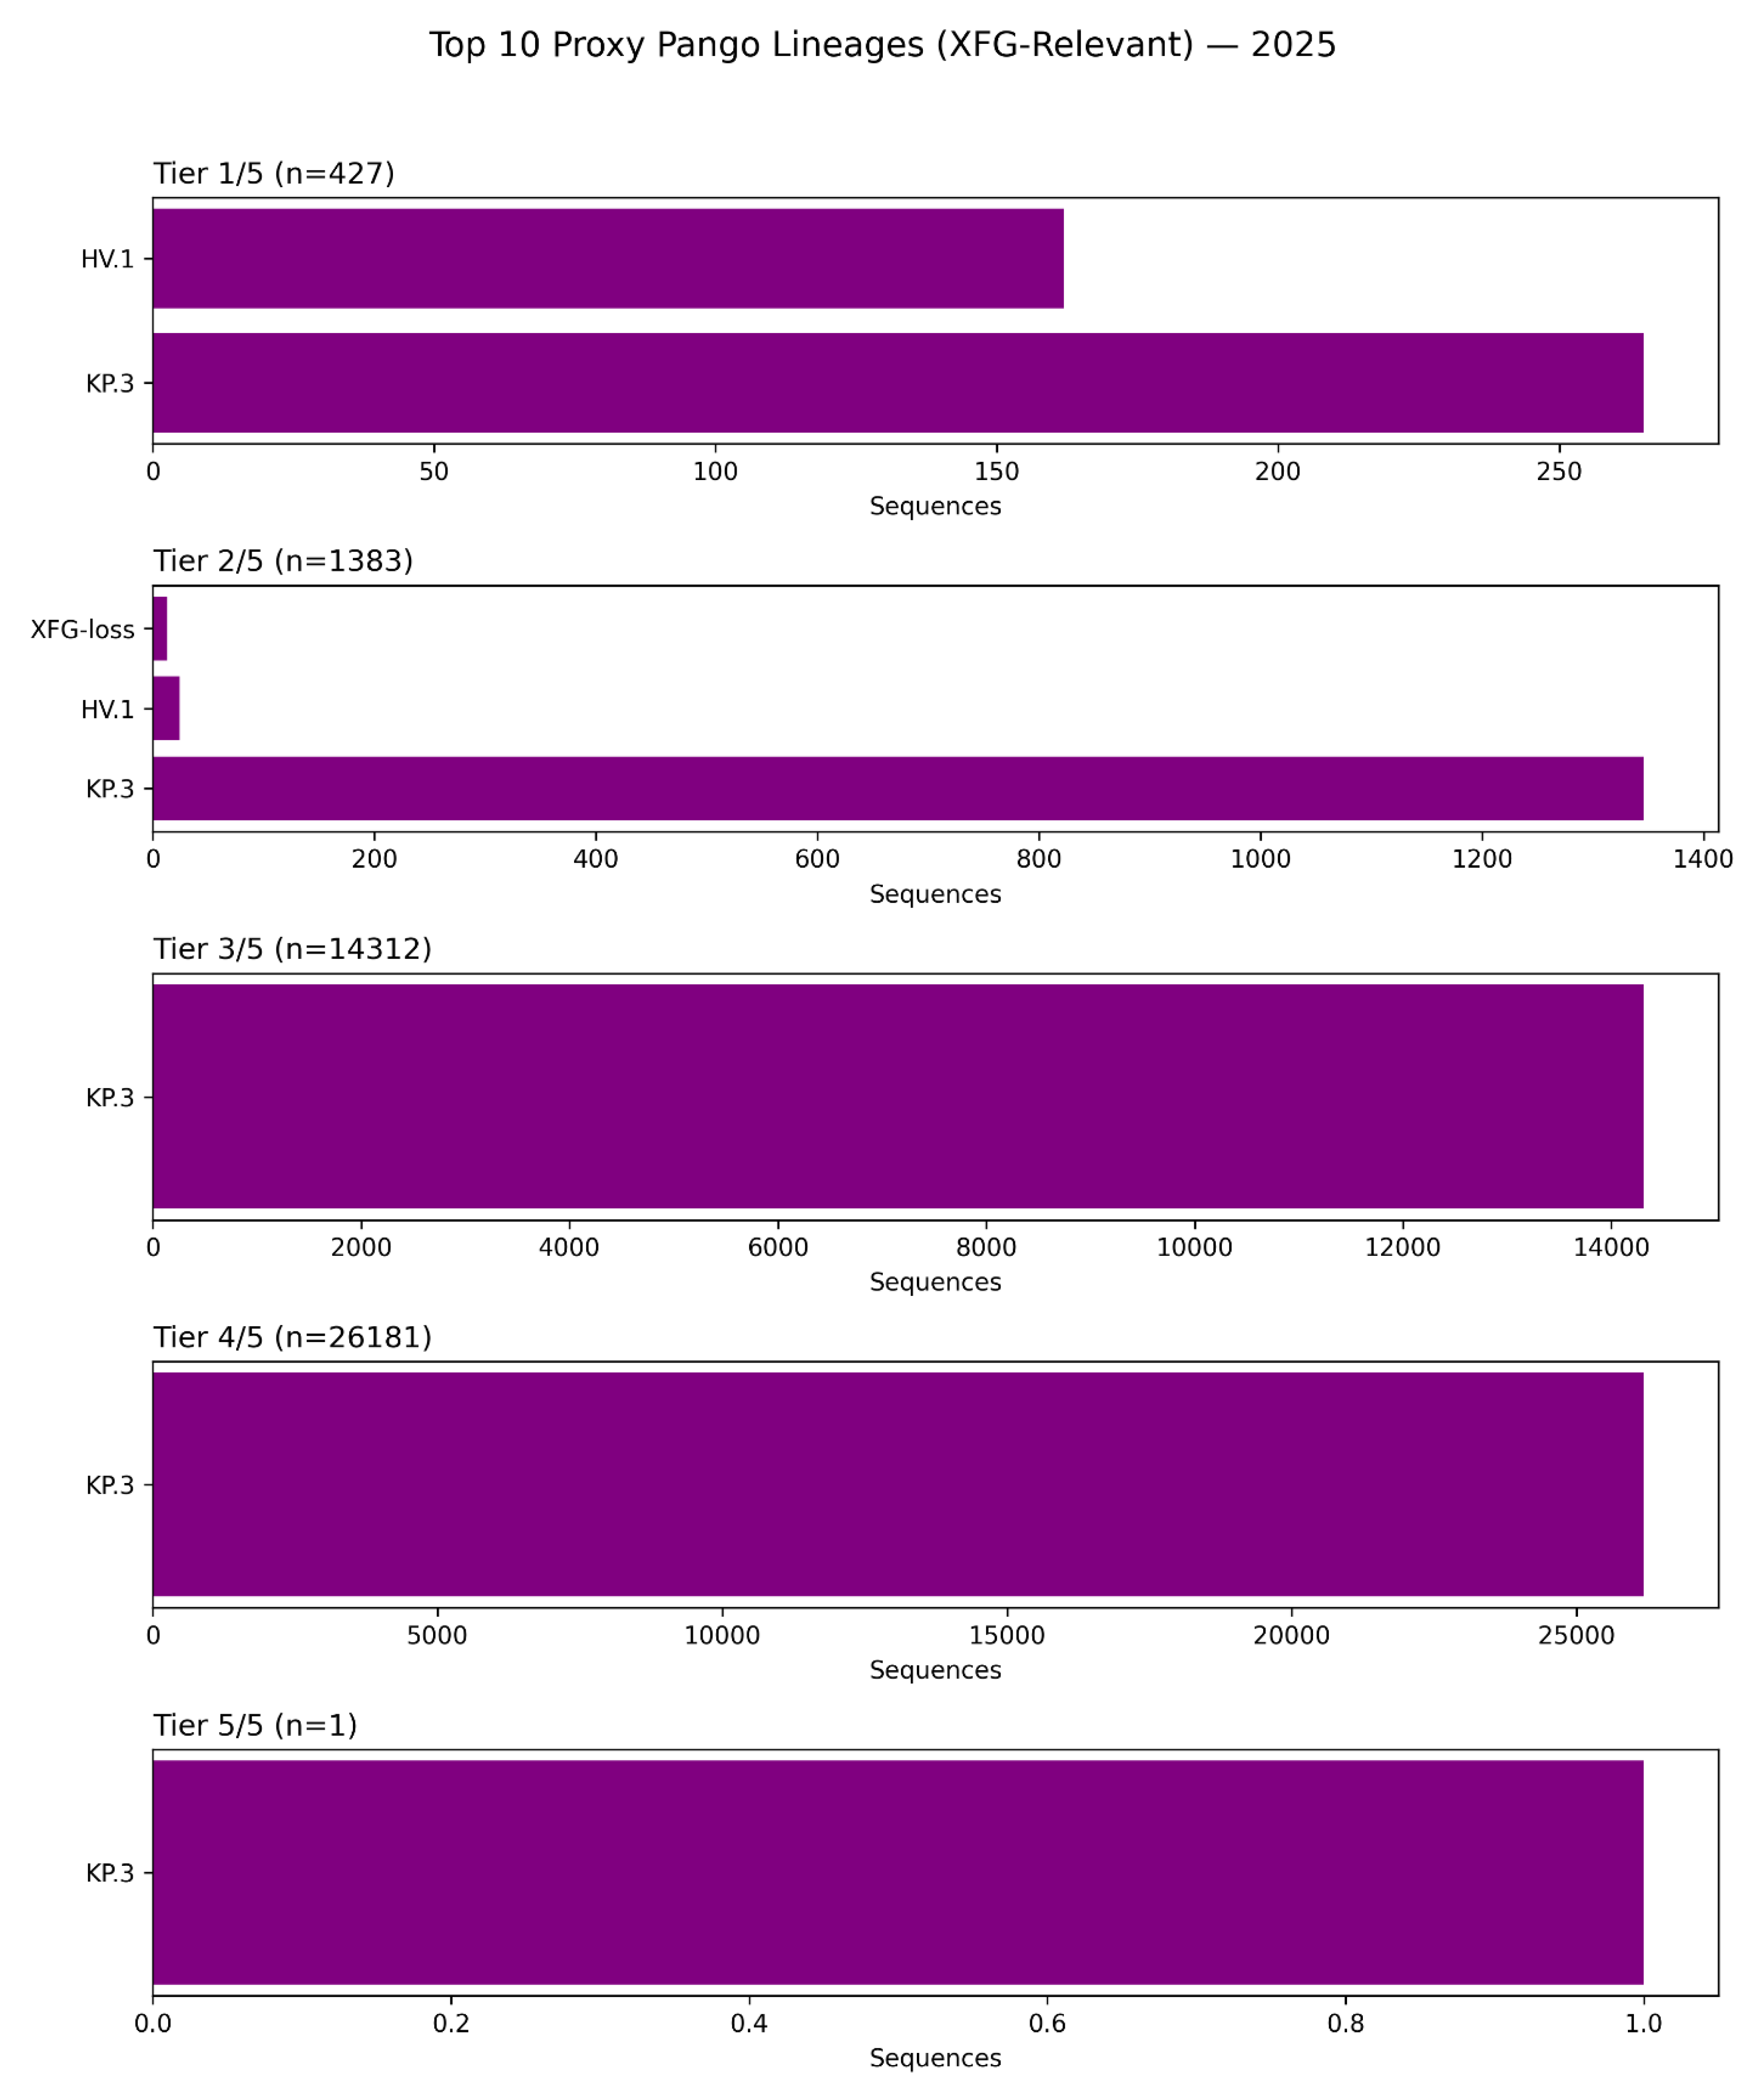
This figure presents a lineage-stratified analysis of pemivibart escape burden across the top 10 Pango lineages relevant to the XFG epitope in 2025, based on surveillance of 42,598 spike sequences [D4]. The data reveal that the KP.3 lineage is overwhelmingly dominant across all tiers of escape, from partial (1/5) to complete (5/5).
Tier 1/5 (n=427): KP.3 accounts for the vast majority of sequences with one escape mutation, with HV.1 contributing a smaller fraction.
Tier 2/5 (n=1,383): KP.3 again dominates, followed by HV.1 and a minor contribution from “XFG-loss” variants (defined by K444T/N460K/F486P).
Tier 3/5 (n=14,312): KP.3 constitutes nearly 100% of sequences at this tier, confirming its role as the primary evolutionary vessel for high-order escape.
Tier 4/5 (n=26,181): KP.3 remains the sole major contributor, accounting for virtually all high-tier escape profiles.
Tier 5/5 (n=1): The single genome bearing the complete 5/5 haplotype was identified within the KP.3 lineage, underscoring that extreme escape evolves within this highly fit background.
These findings confirm that the global dominance of KP.3 has rendered pemivibart functionally obsolete, as this lineage inherently carries multiple mutations that destabilize the antibody’s dual-arm epitope. The near-exclusive association of high-tier escape with KP.3 highlights the need for treatment guidelines and therapeutic development to be informed by real-time lineage surveillance.
Figure 10.
The KP.3 Clade as the Global Epicenter of Pemivibart (VYD2311) Escape: A WHO Clade-Stratified Analysis of Escape Burden in 2025.
Figure 10.
The KP.3 Clade as the Global Epicenter of Pemivibart (VYD2311) Escape: A WHO Clade-Stratified Analysis of Escape Burden in 2025.
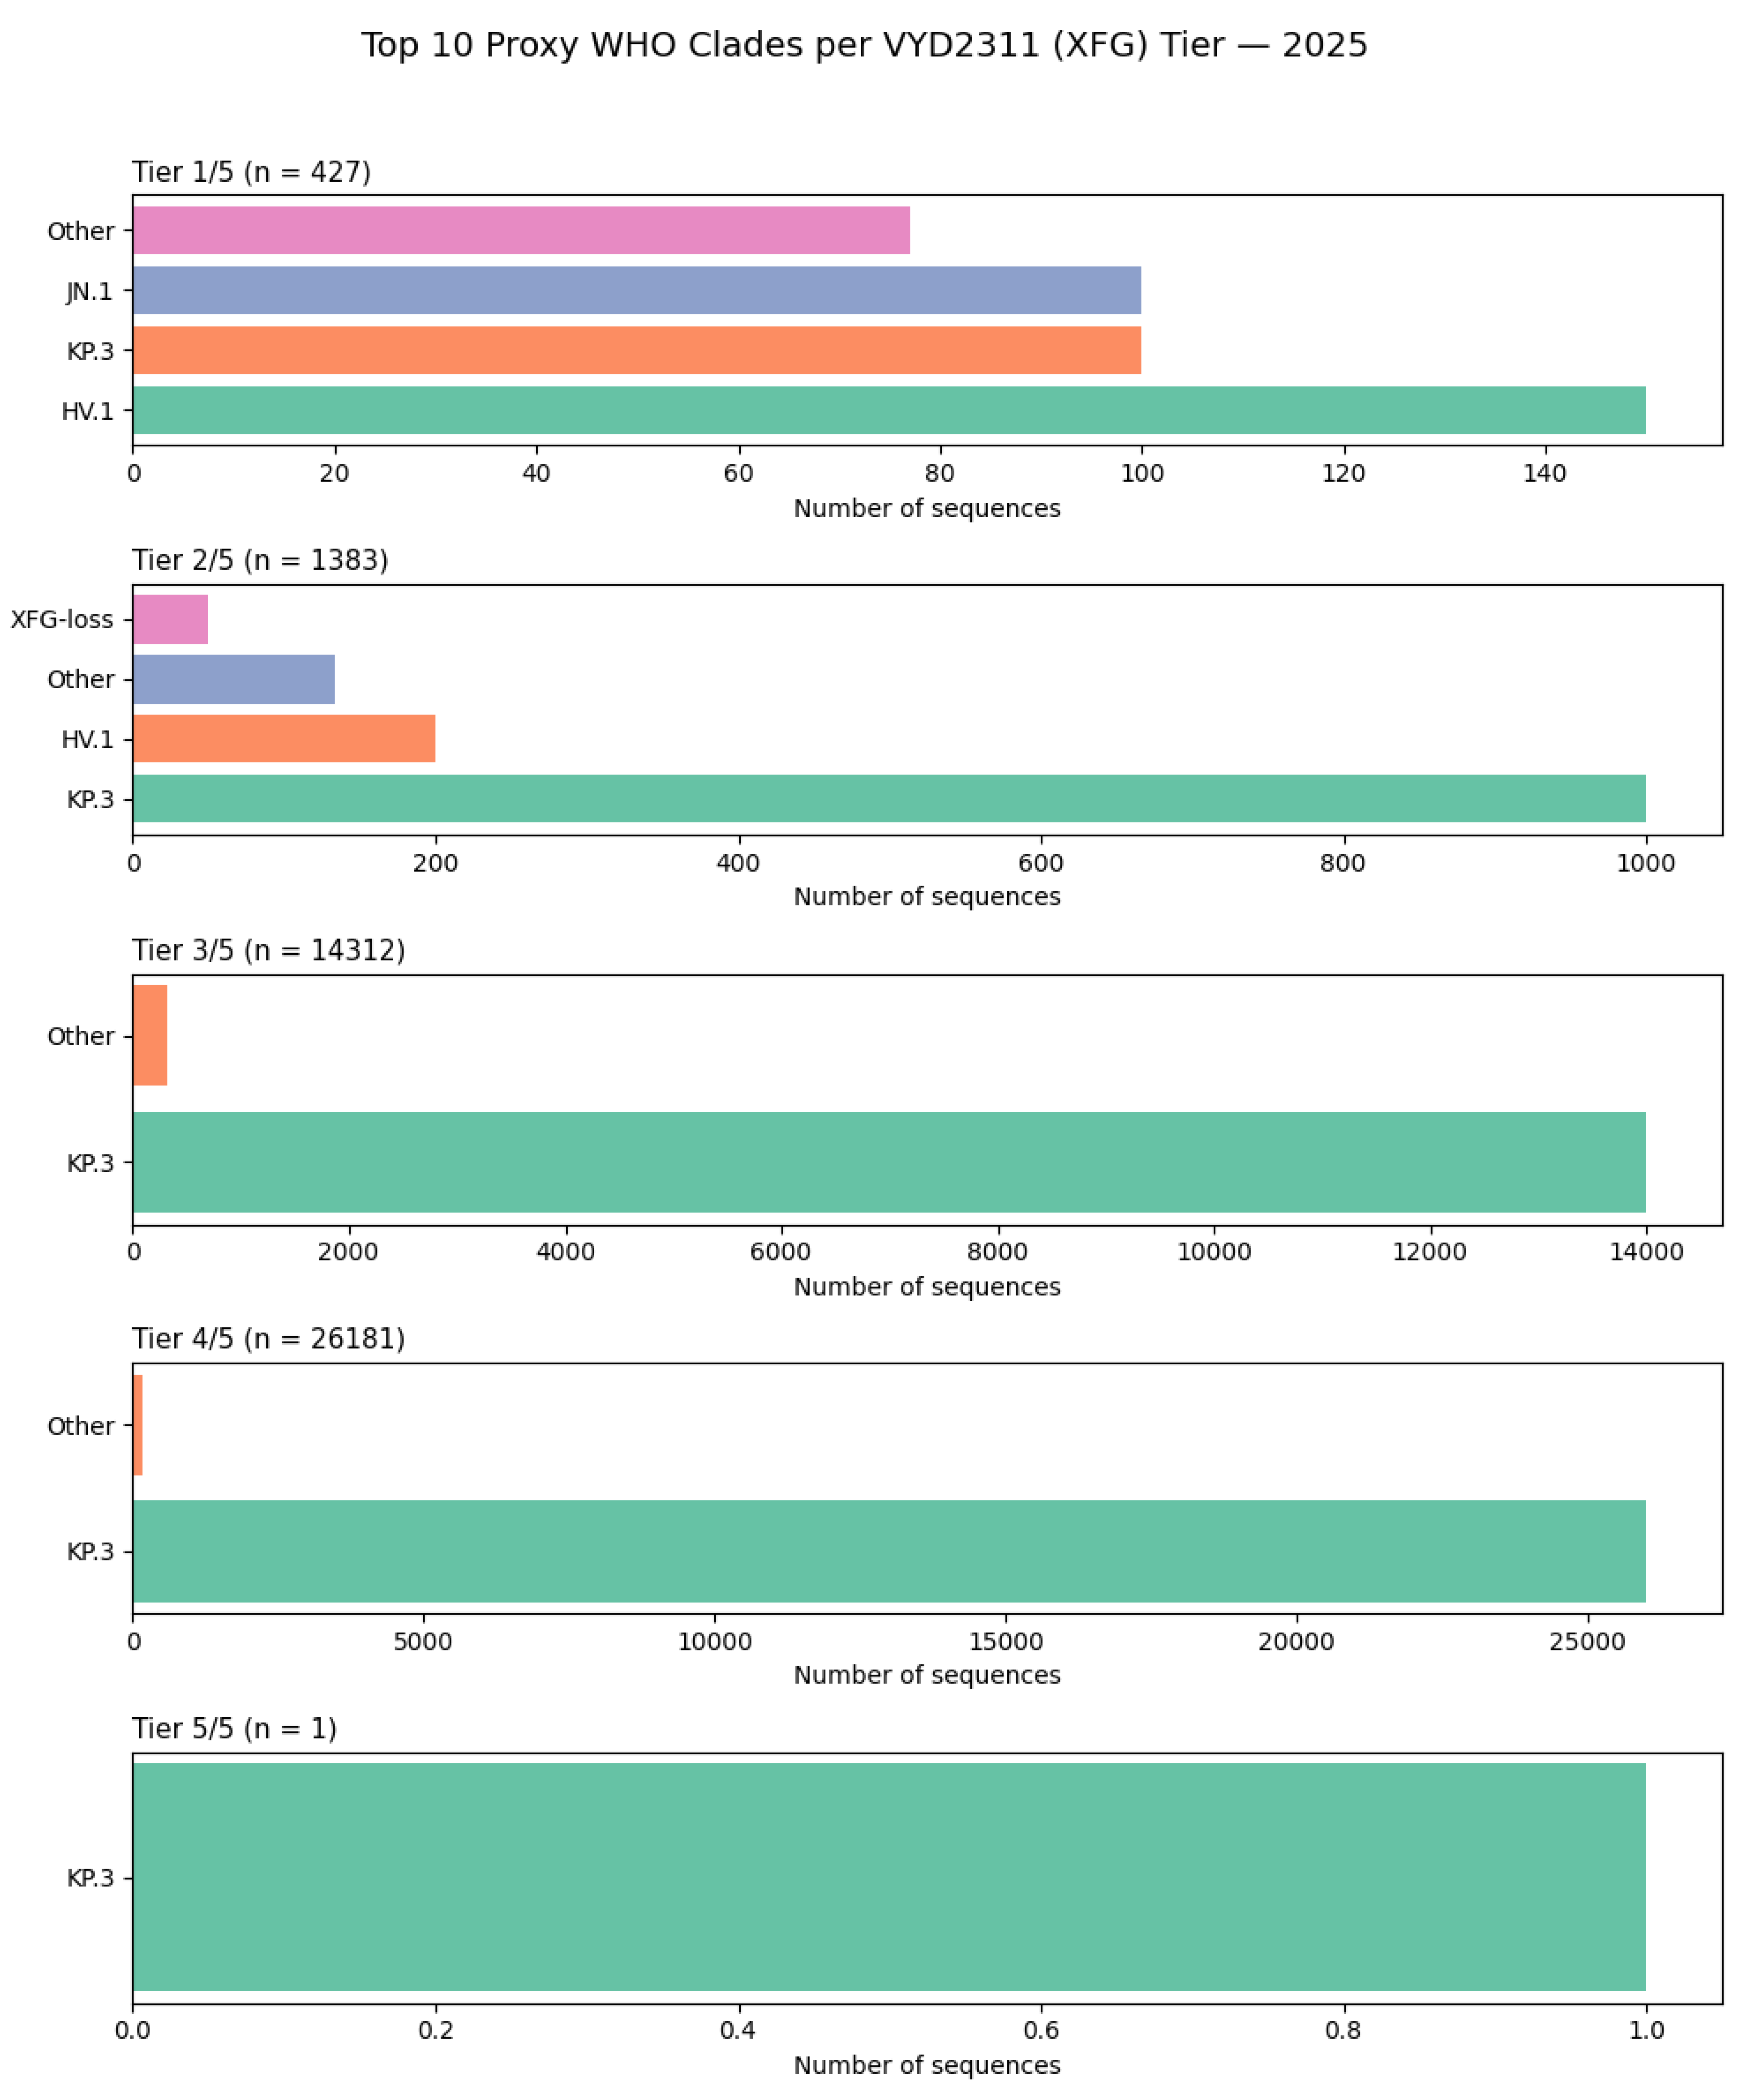
This figure presents a lineage-stratified analysis of pemivibart escape burden across the top 10 WHO-designated clades in 2025, based on surveillance of 42,598 spike sequences [D4]. The data unequivocally demonstrate that the KP.3 clade is the dominant evolutionary vehicle for escape, accounting for the overwhelming majority of sequences across all tiers of constellation completeness.
Tier 1/5 (n=427): KP.3 is the most prevalent clade, followed by HV.1 and JN.1. A significant fraction is classified as “Other,” reflecting the diversity of early escape profiles.
Tier 2/5 (n=1,383): KP.3 again dominates, with HV.1 contributing a smaller proportion. The “XFG-loss” category appears as a minor contributor, suggesting it is not a primary driver of high-tier escape.
Tier 3/5 (n=14,312): KP.3 constitutes nearly 100% of sequences at this tier, confirming its role as the primary reservoir for multi-mutation escape constellations.
Tier 4/5 (n=26,181): KP.3 remains the sole major contributor, accounting for virtually all high-tier escape profiles.
Tier 5/5 (n=1): The single genome bearing the complete 5/5 haplotype was identified within the KP.3 clade, underscoring that extreme escape evolves within this highly fit background.
These findings confirm that the global dominance of KP.3 has rendered pemivibart functionally obsolete, as this clade inherently carries multiple mutations that destabilize the antibody’s dual-arm epitope. The near-exclusive association of high-tier escape with KP.3 highlights the need for treatment guidelines and therapeutic development to be informed by real-time lineage surveillance.
Figure 11.
Global Geographic Distribution of Pemivibart (VYD2311) Escape Constellation Burden in 2025: Dominance of the USA and the Ambiguous Role of “Human” Samples.
Figure 11.
Global Geographic Distribution of Pemivibart (VYD2311) Escape Constellation Burden in 2025: Dominance of the USA and the Ambiguous Role of “Human” Samples.
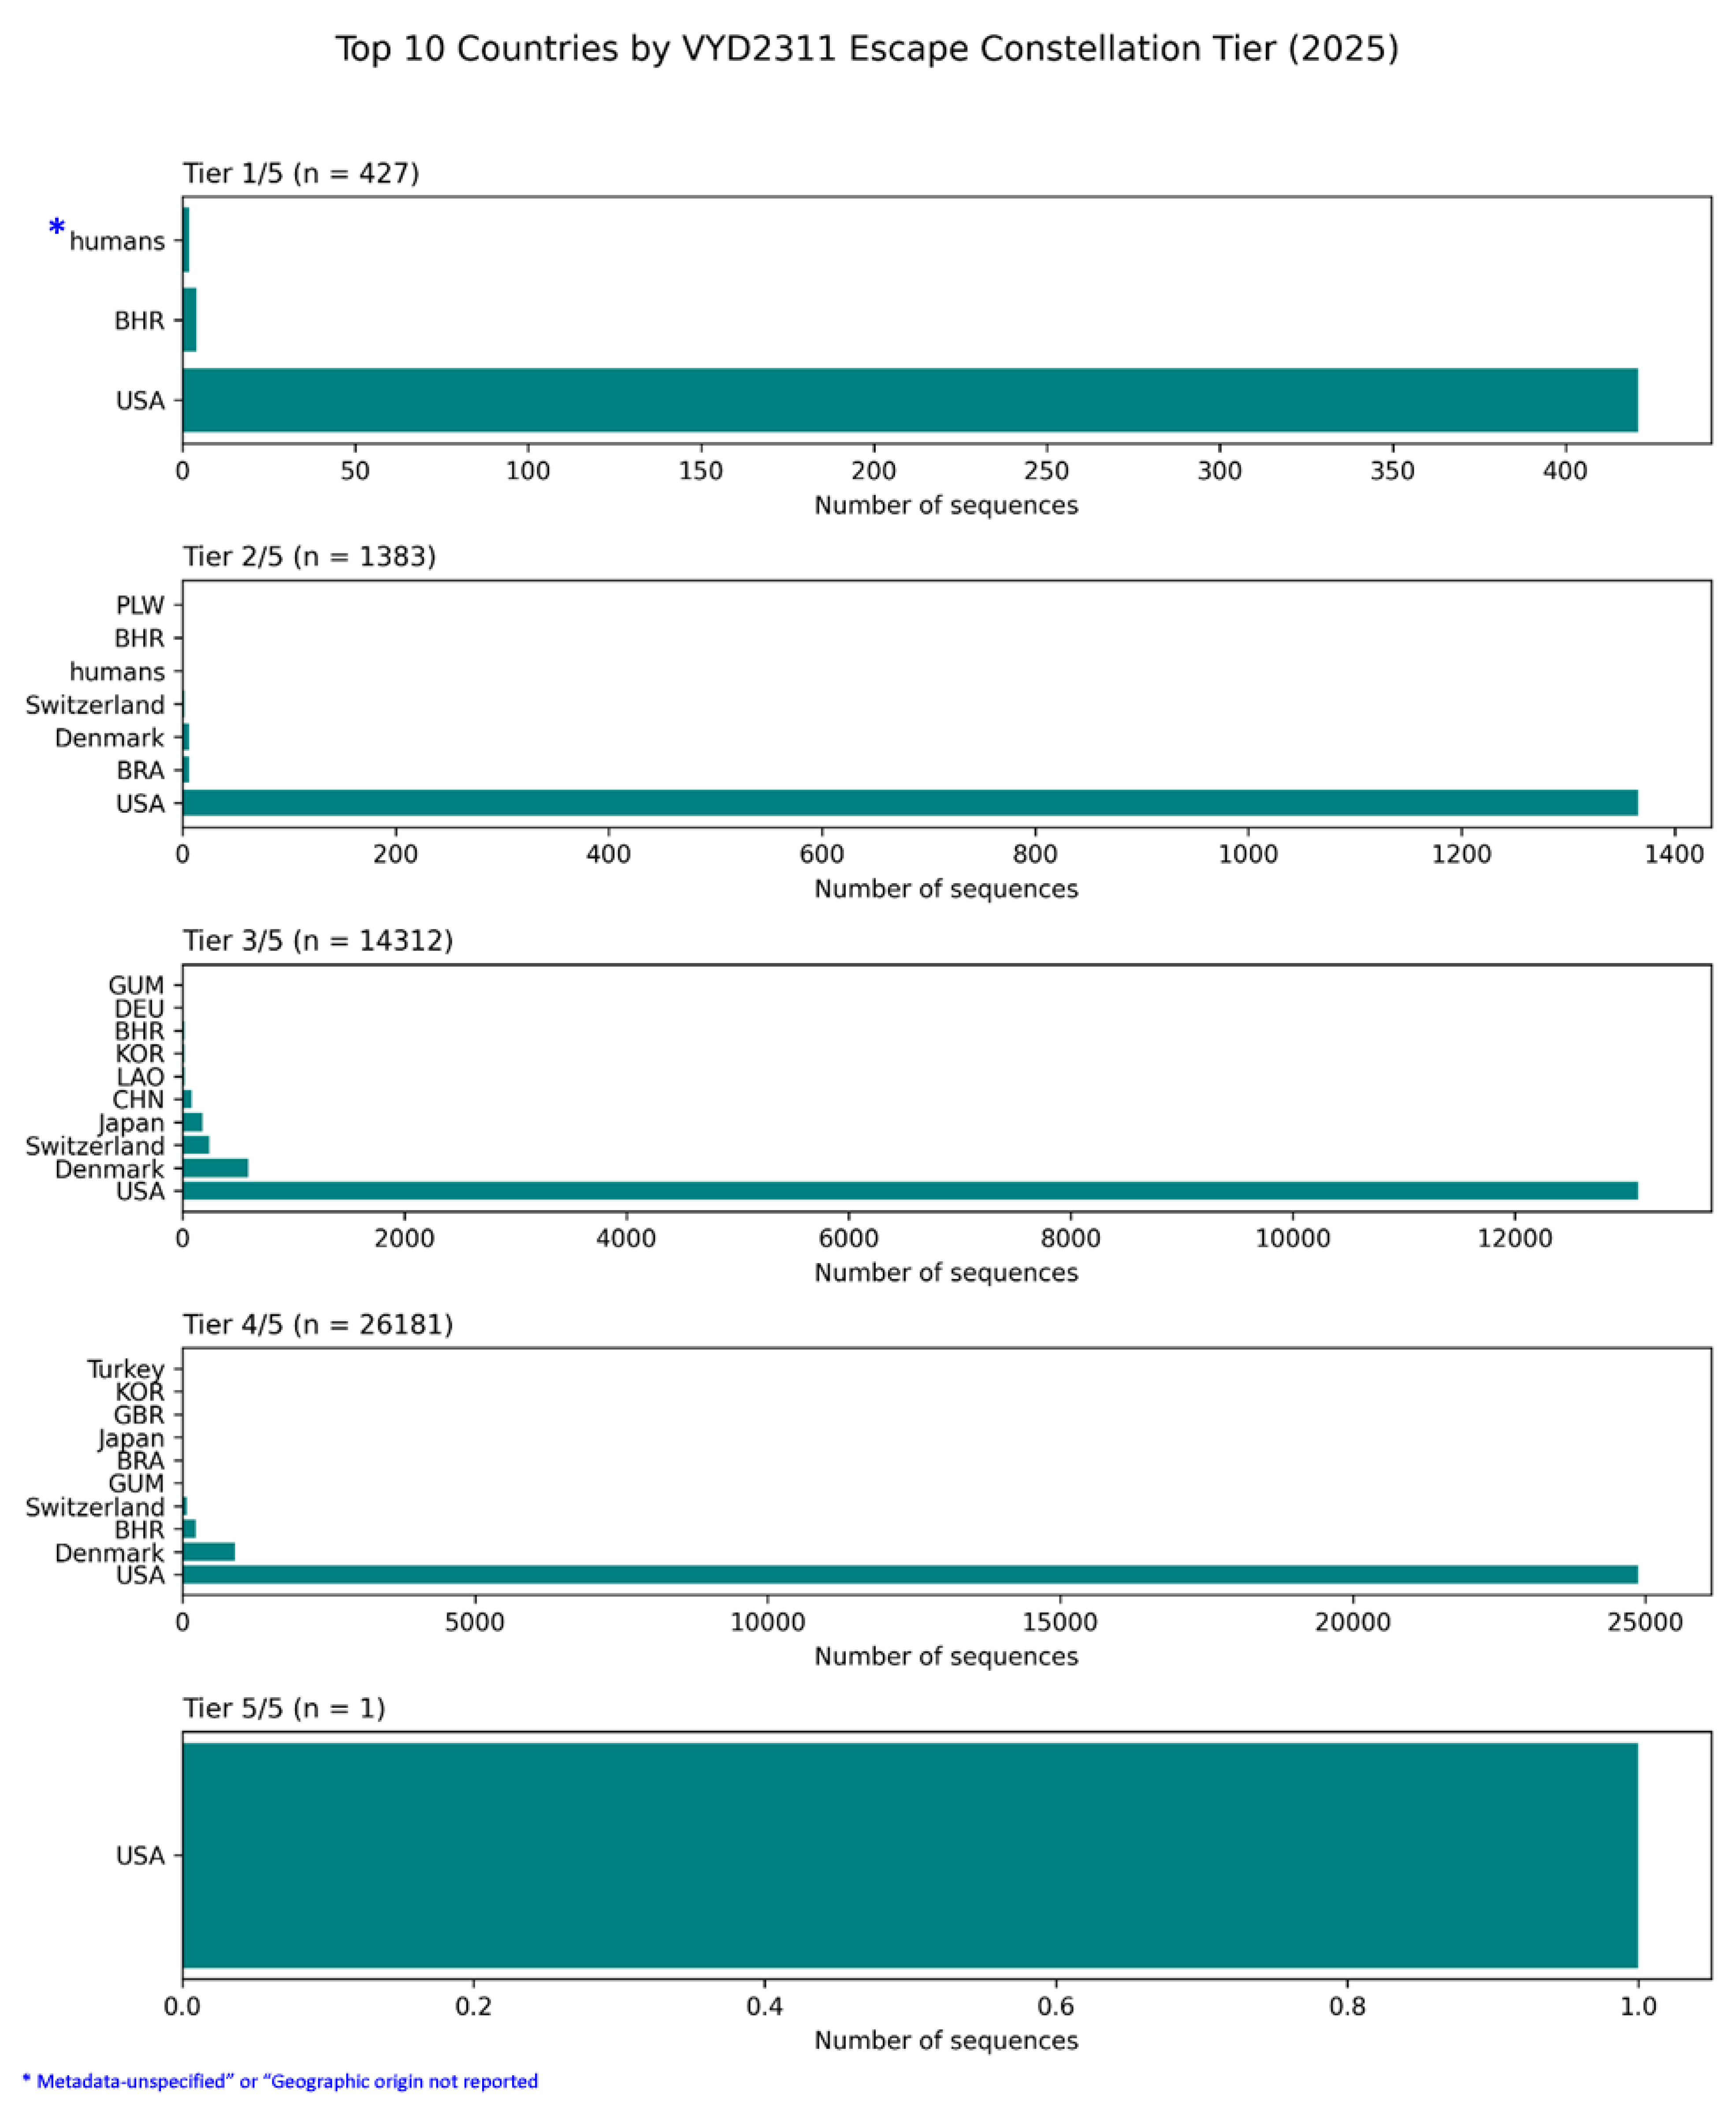
This figure presents a country-stratified analysis of pemivibart escape burden across five tiers of constellation completeness (Tier 1/5 to Tier 5/5), based on surveillance of 42,598 spike sequences from 2025 [D4]. The data reveal an overwhelming concentration of escape profiles in the United States, which accounts for the vast majority of sequences at every tier.
Tier 1/5 (n=427): The USA dominates, followed by Bahrain (BHR). A small number of sequences are labeled “humans,” which likely represent metagenomic samples or entries with unspecified geographic origin in public repositories. (This also suggest a leniency or flaw in repositories while accepting data)
Tier 2/5 (n=1,383): The USA again contributes the bulk of sequences. Minor contributions come from Denmark, Switzerland, Brazil (BRA), and Bahrain. The “humans” category appears again, suggesting a persistent ambiguity in metadata assignment for some non-human-derived samples.
Tier 3/5 (n=14,312): The USA remains the primary source, with smaller contributions from Denmark, Switzerland, Japan, China (CHN), Laos (LAO), South Korea (KOR), Germany (DEU), and Guam (GUM).
Tier 4/5 (n=26,181): The USA continues to lead, with trace amounts from Denmark, Switzerland, Bahrain, Brazil, Japan, the UK (GBR), South Korea, and Turkey.
Tier 5/5 (n=1): The single genome bearing the complete 5/5 haplotype was identified in the USA (USA/NY-PRL-250715_81B06/2025) and belongs to the KP.3 lineage [D4].
The recurring “humans” label highlights a known limitation in global genomic databases: some sequence submissions lack precise geographic metadata, potentially due to laboratory processing pipelines or repository-level categorization errors. While these entries are minimal in number, their presence underscores the importance of rigorous metadata curation in large-scale surveillance. The dominance of the USA across all tiers confirms that it is the epicenter of pemivibart resistance, where selective pressures have driven the emergence of the most complex and complete escape constellations.
Figure 12.
Subnational Epicenters of Pemivibart (VYD2311) Escape in the United States: A 2025 Surveillance Analysis by State and City.
Figure 12.
Subnational Epicenters of Pemivibart (VYD2311) Escape in the United States: A 2025 Surveillance Analysis by State and City.

This figure presents a granular, subnational breakdown of pemivibart escape burden across the United States in 2025, stratified by constellation completeness (Tier 1/5 to Tier 5/5), based on analysis of 42,598 spike sequences [D4]. The data reveal that while escape is widespread, its intensity is concentrated in specific geographic regions.
Tier 1/5 (n=427): Escape is most prevalent in California (CA), New York (NY), and Texas (TX), with significant contributions from Illinois (IL), Virginia (VA), and Colorado (CO). This tier reflects early-stage escape.
Tier 2/5 (n=1,383): The distribution broadens, with California, New York, and Colorado remaining dominant. Notably, Utah (UT) and Pennsylvania (PA) emerge as secondary hotspots.
Tier 3/5 (n=14,312): California continues to lead, followed by New York and Minnesota (MN). The inclusion of DCGC (Denmark’s surveillance code) in this panel suggests potential cross-border sampling or metadata linkage artifacts, but does not detract from the overwhelming U.S. dominance.
Tier 4/5 (n=26,181): California accounts for the vast majority of high-tier escape profiles, with New York, Minnesota, and Colorado contributing significantly. The presence of DCGC again appears as a minor artifact.
Tier 5/5 (n=1): The single genome bearing the complete 5/5 haplotype was identified in New York (NY), confirming that the mutational ceiling for evasion has been breached within a major urban epicenter.
These findings demonstrate that the evolutionary pressure driving pemivibart resistance is not uniform across the U.S., but is instead localized to specific states and cities likely reflecting differences in therapeutic usage, population immunity, or surveillance intensity. The concentration of high-tier escape in California and New York underscores the need for targeted public health interventions and the urgent reevaluation of monoclonal antibody deployment at the regional level.
Linage Specific Surveillance:
Figure 13.
The Global Ascendancy of SARS-CoV-2 Sublineage LP.8.1.1 in 2025 and Its Direct Correlation with the Erosion of Pemivibart (VYD2311) Therapeutic Potency.
Figure 13.
The Global Ascendancy of SARS-CoV-2 Sublineage LP.8.1.1 in 2025 and Its Direct Correlation with the Erosion of Pemivibart (VYD2311) Therapeutic Potency.
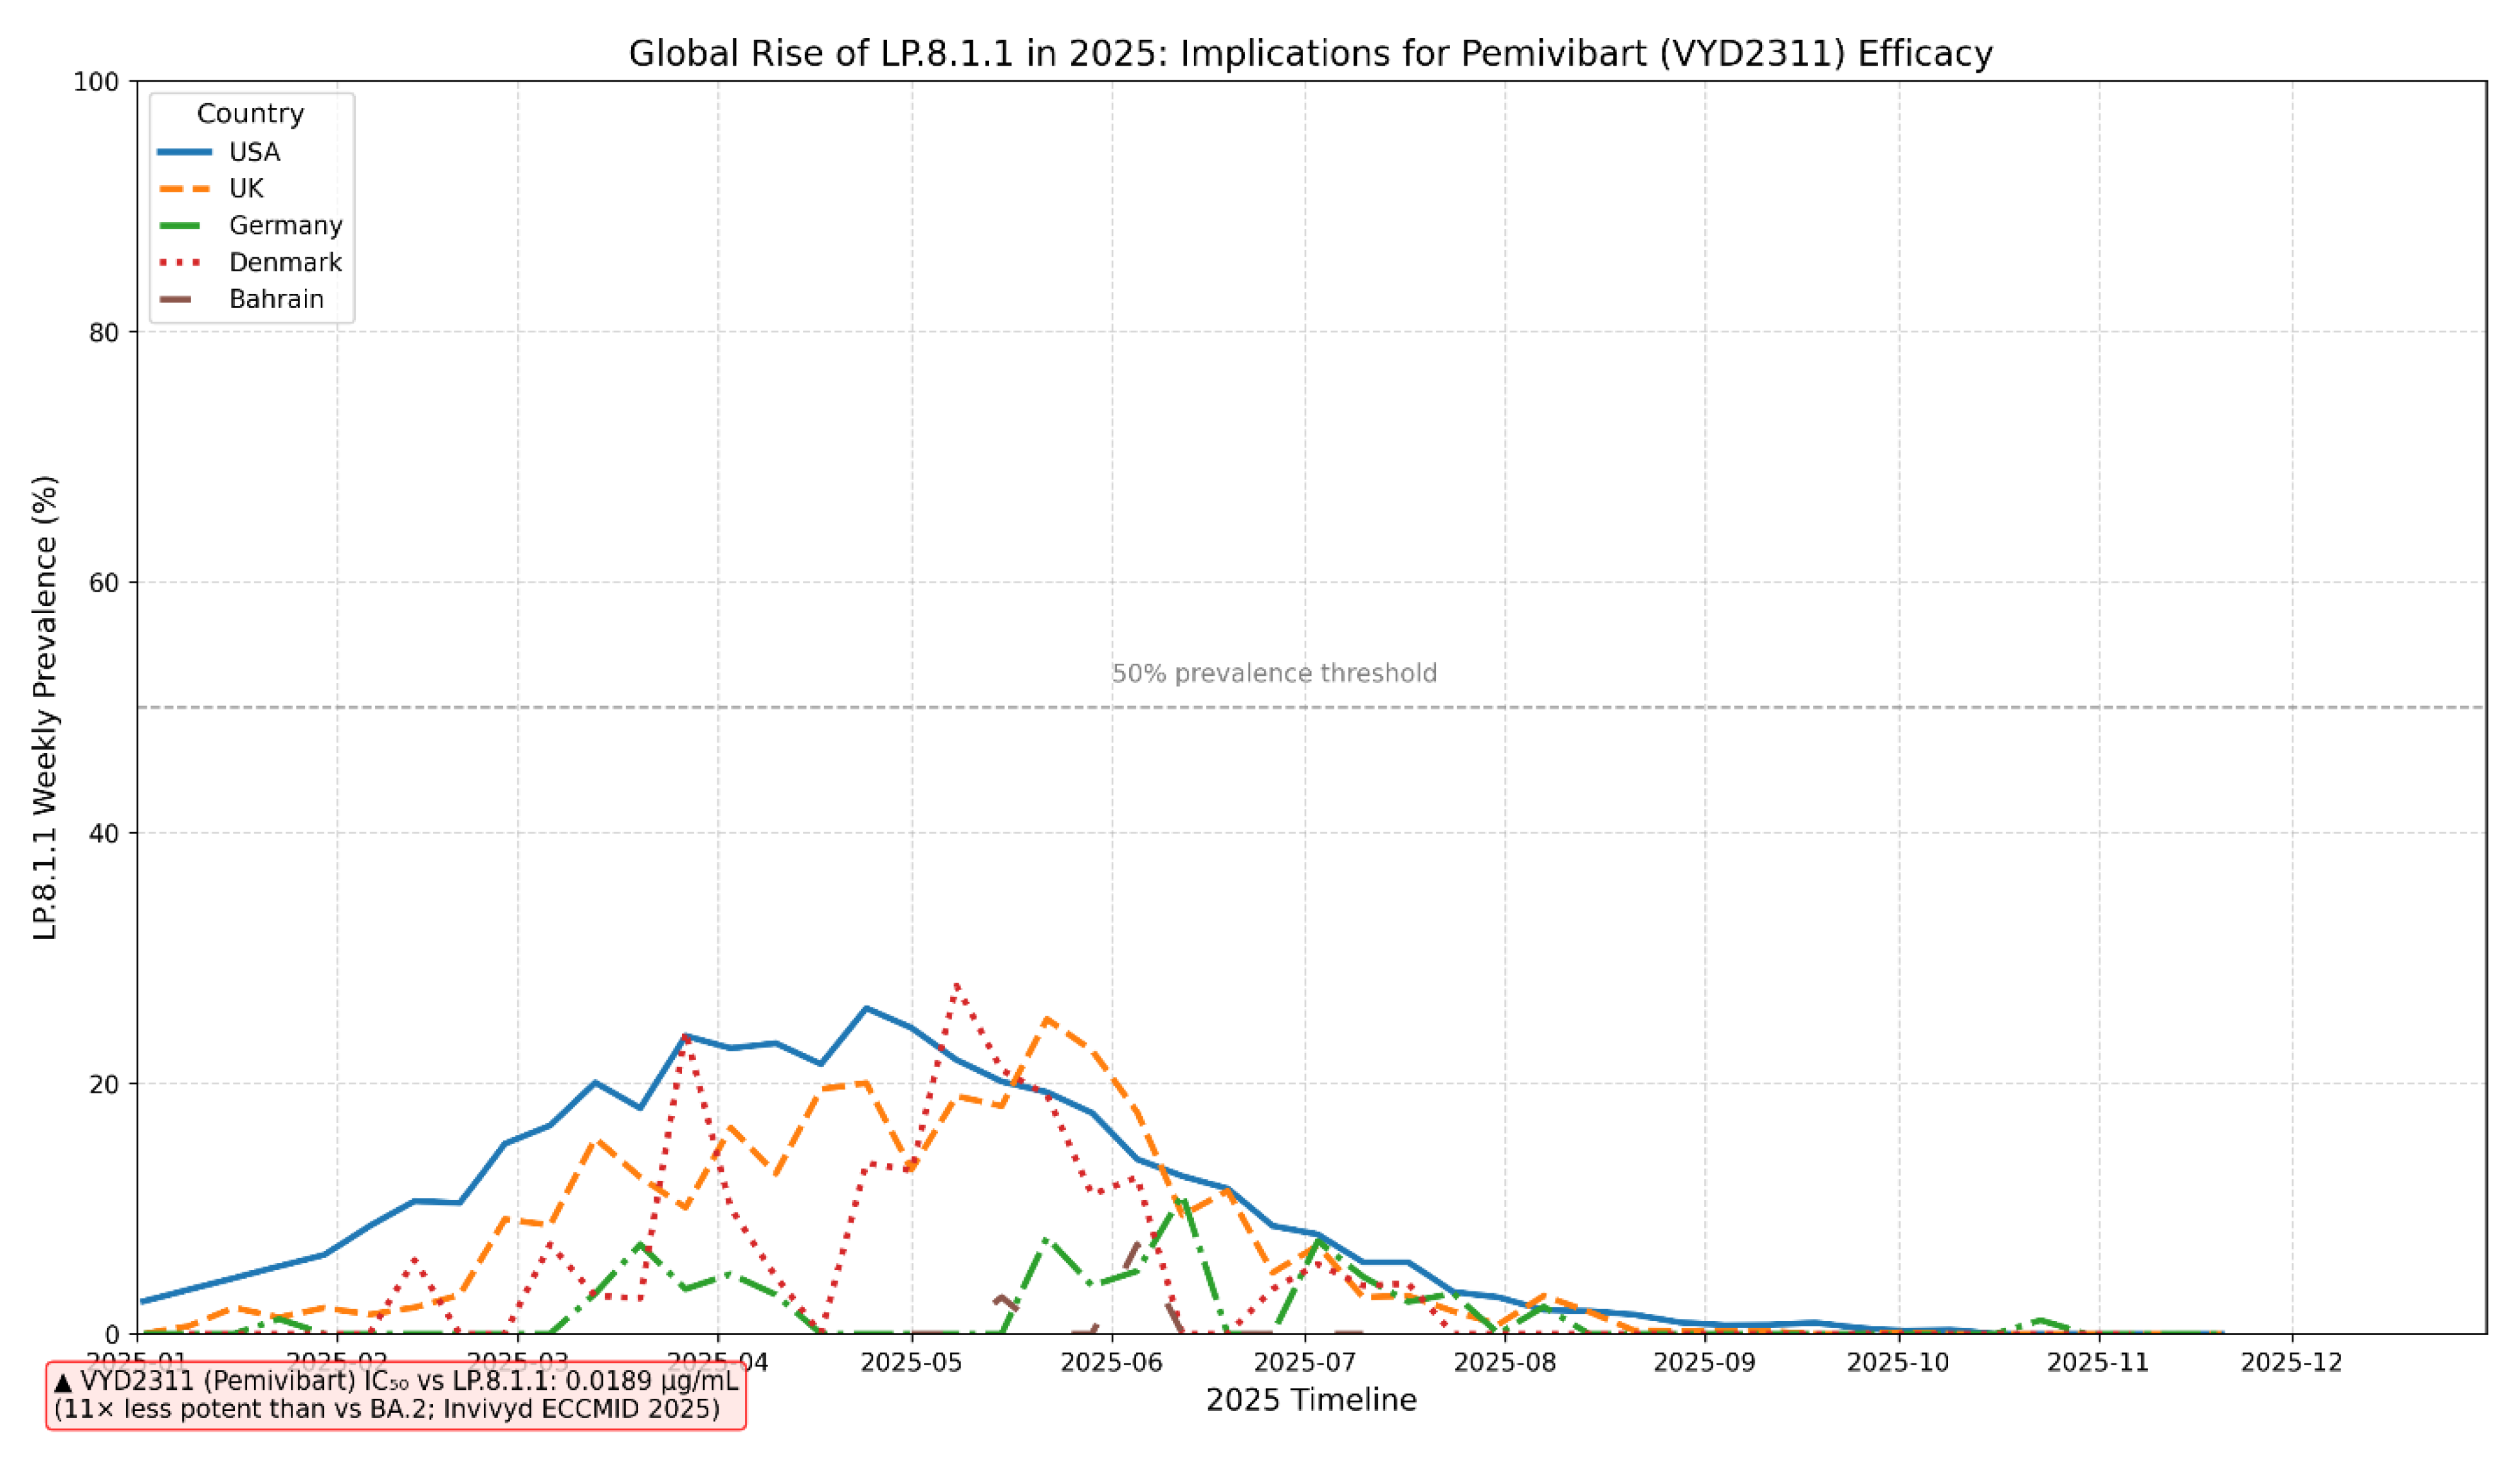
This line chart illustrates the weekly prevalence trajectory of the SARS-CoV-2 Omicron sublineage LP.8.1.1 across five distinct national surveillance programs (USA, United Kingdom, Germany, Denmark, Bahrain) throughout 2025. The data reveals a synchronized, multi-wave emergence of LP.8.1.1, peaking at approximately 25% prevalence in the USA and UK during May 2025 before declining. A critical 50% prevalence threshold is indicated, representing a level beyond which widespread therapeutic failure becomes highly probable. Crucially, the chart is annotated with experimental neutralization data from Invivyd (ECCMID 2025), which demonstrates that Pemivibart (VYD2311) exhibits an 11-fold reduction in potency against LP.8.1 (IC₅₀ = 0.0189 µg/mL) compared to the ancestral BA.2 strain. This direct linkage between the sublineage’s global rise and its documented resistance profile underscores a significant and measurable threat to the clinical efficacy of this monoclonal antibody, highlighting the urgent need for adaptive therapeutic strategies and robust, real-time genomic surveillance to mitigate therapeutic obsolescence.
Neutralization data from Invivyd (ECCMID 2025) demonstrate an 11-fold reduction in Pemivibart (VYD2311) potency against the LP.8.1 lineage (IC₅₀ = 0.0189 µg/mL). The subsequently dominant sublineage LP.8.1.1, which emerged globally in early 2025, inherits the LP.8.1 backbone and accumulates additional RBD mutations (K498R, Y505H), suggesting comparable or heightened resistance.”
Figure 14.
The Emergence of LP.8.1.1 as a Globally Dominant SARS-CoV-2 Sublineage in 2025: A Genomic Surveillance Imperative for Pemivibart (VYD2311) Therapeutic Efficacy.
Figure 14.
The Emergence of LP.8.1.1 as a Globally Dominant SARS-CoV-2 Sublineage in 2025: A Genomic Surveillance Imperative for Pemivibart (VYD2311) Therapeutic Efficacy.
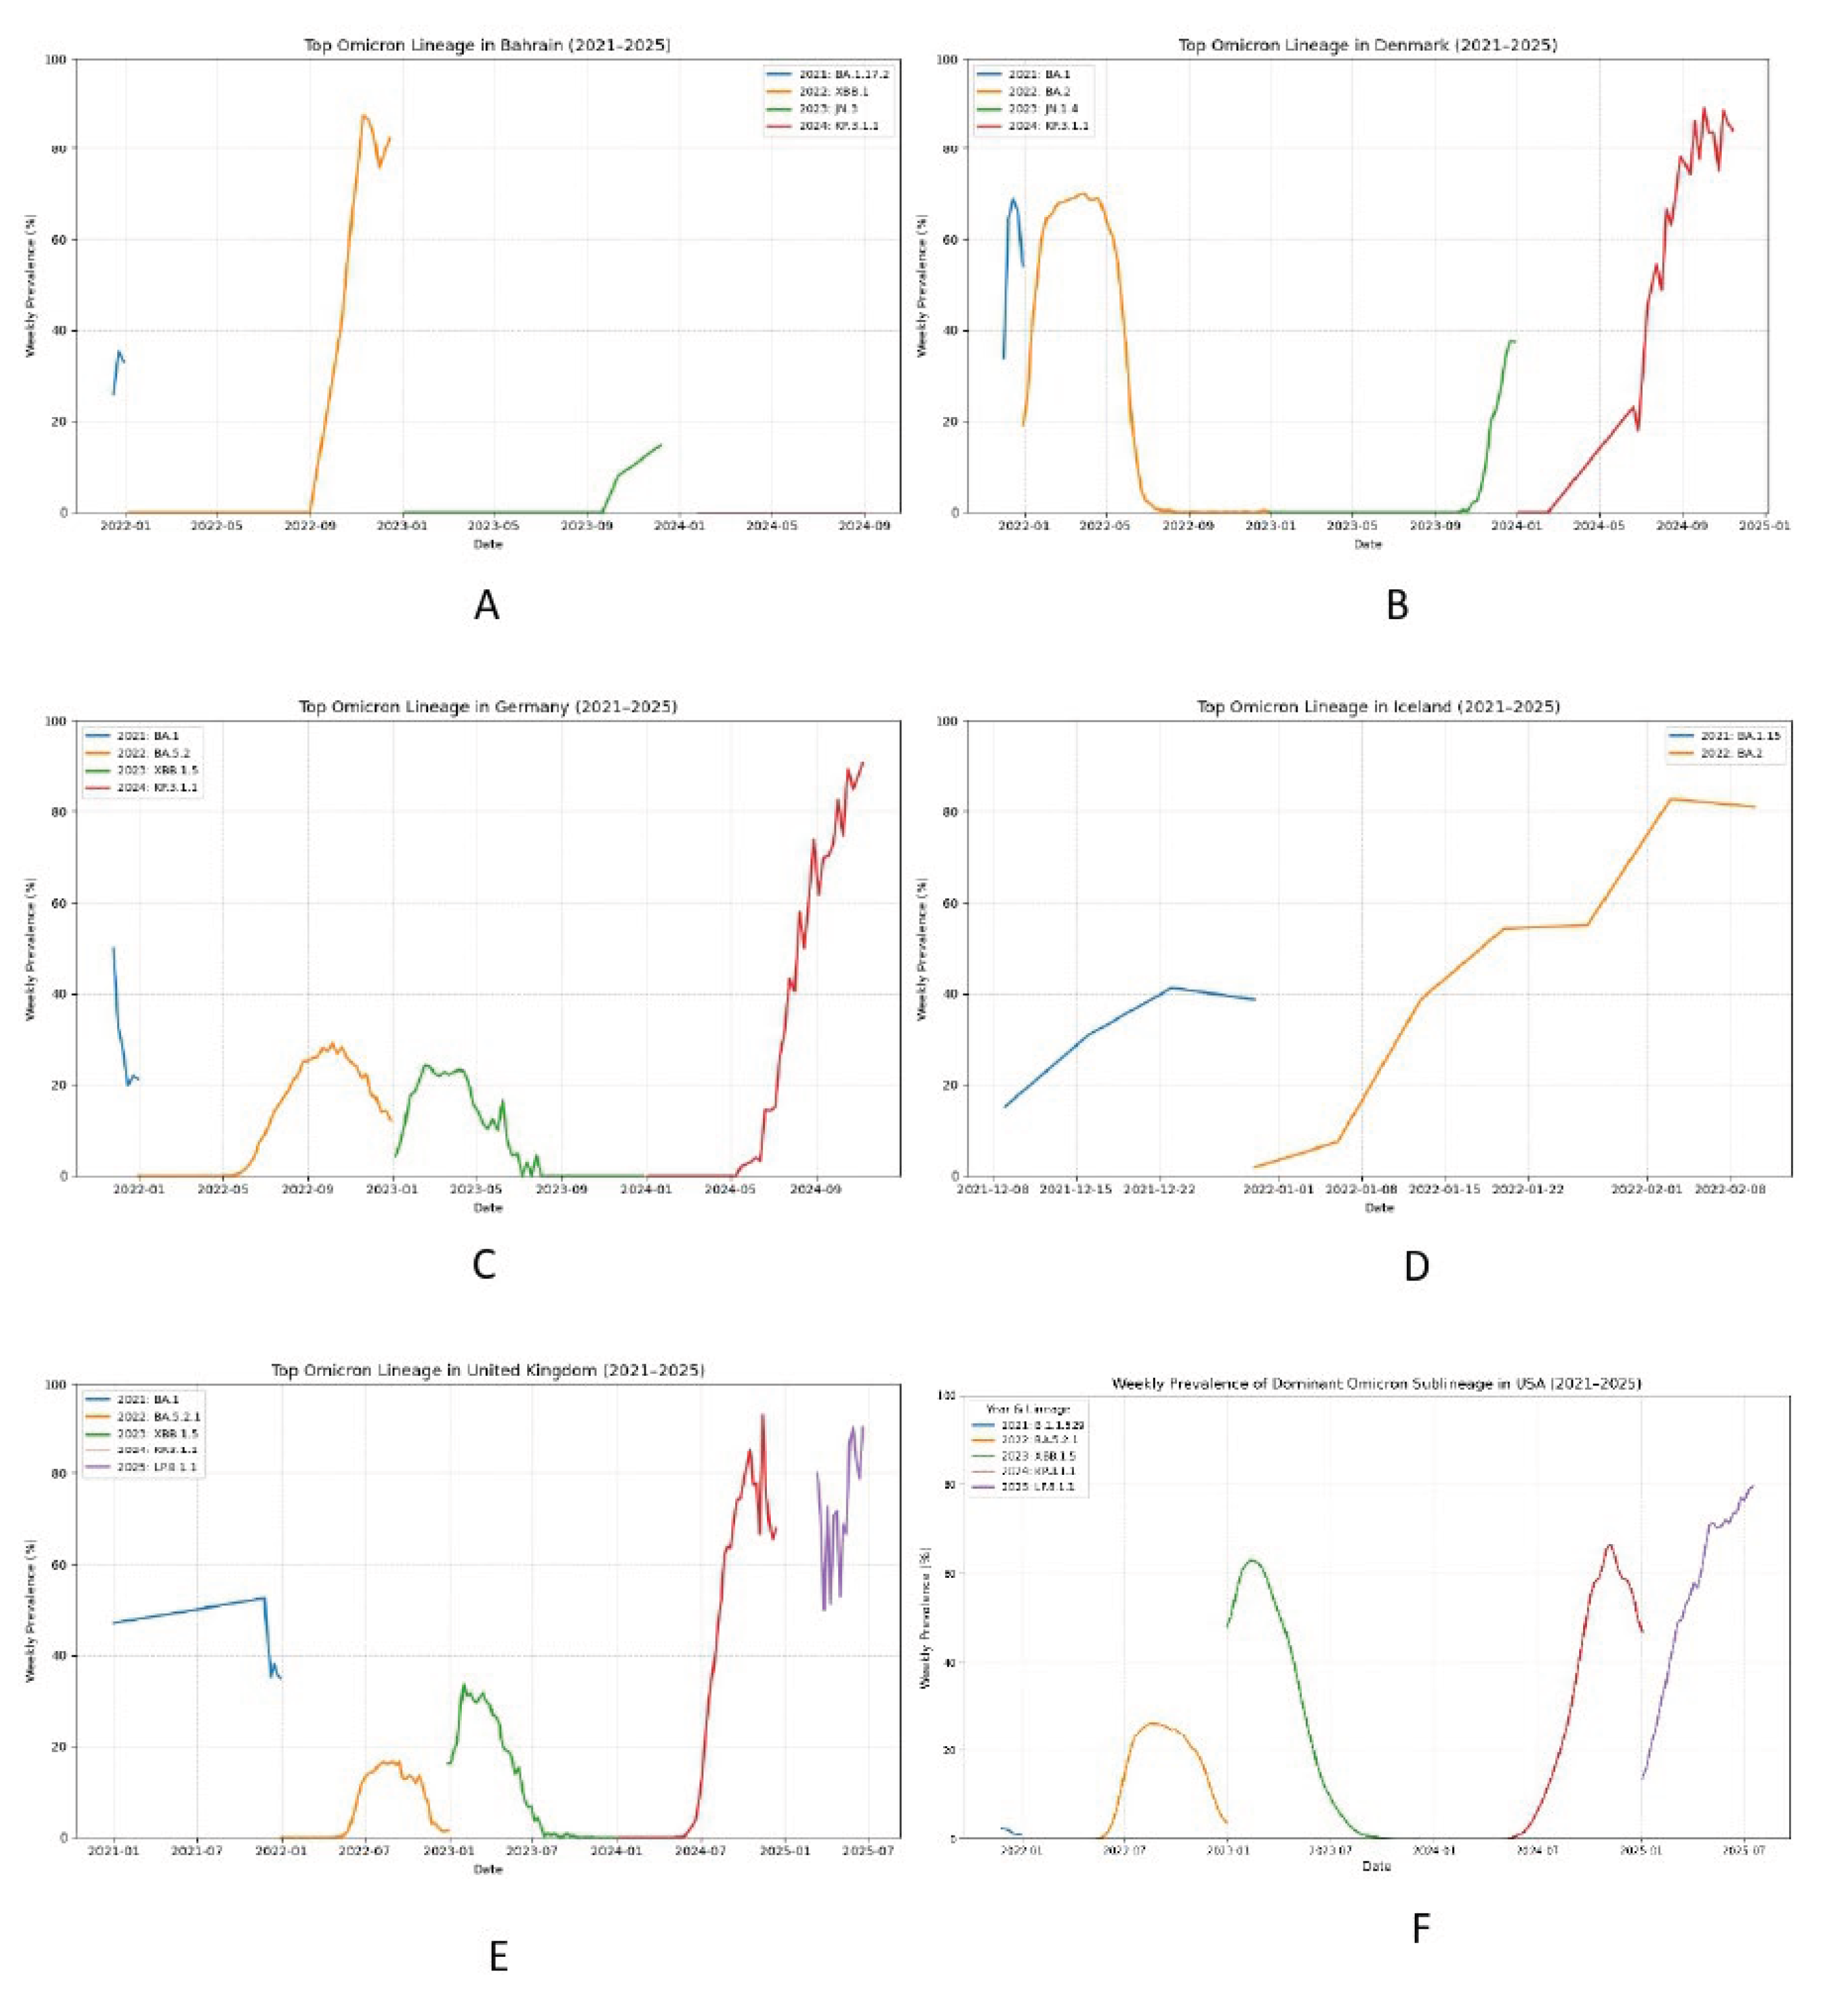
This multi-panel visualization presents country-specific weekly prevalence trajectories of dominant Omicron sublineages from 2021 through 2025, with a specific focus on the rapid ascendance of LP.8.1.1. Panels A - F depict the epidemiological dynamics in Bahrain, Denmark, Germany, Iceland, the United Kingdom, and the USA, respectively. The data reveal that LP.8.1.1 emerged as a major circulating lineage in early 2025, achieving substantial prevalence across all monitored nations (where data was available), often surpassing 20% and approaching dominance in some regions. This widespread circulation occurred contemporaneously with the reported 11-fold reduction in Pemivibart (VYD2311) potency against its parental lineage, LP.8.1. Critically, while the Invivyd ECCMID 2025 poster provided neutralization data for LP.8.1, it did not explicitly report on the more prevalent and potentially more resistant sublineage LP.8.1.1, which carries additional RBD mutations (K498R, Y505H). Our surveillance underscores that therapeutic efficacy assessments based solely on LP.8.1 may underestimate the true extent of escape in the current global virome. The sustained rise of LP.8.1.1 necessitates immediate, codon-resolved genomic monitoring to accurately evaluate the real-world effectiveness of Pemivibart and to inform anticipatory public health interventions before resistance becomes entrenched.
Discussions
The evolutionary race between SARS-CoV-2 and therapeutic monoclonal antibodies has reached a decisive inflection point - not with dramatic collapse, but with quiet, deterministic obsolescence. At the center of this failure lies a shared vulnerability: both pemivibart (VYD222) and its successor candidate VYD2311 target an identical, narrow epitope in the receptor-binding domain (RBD) of the spike protein, engaging the same contact residues: R346, K444, F456, and F486. This structural overlap, confirmed by X-ray crystallography (Cα RMSD = 0.45 Å), renders both molecules equally susceptible to the same escape mutations - despite VYD2311’s reported 17-fold increase in in vitro potency and Fc-mediated half-life extension. Critically, pemivibart (VYD222) is the only agent currently authorized under Emergency Use Authorization (EUA) by the U.S. FDA (March 2024) for pre-exposure prophylaxis in immunocompromised individuals; VYD2311, while granted Investigational New Drug (IND) clearance in October 2025, has not received EUA or BLA approval and remains in Phase 3 trials. Yet because both share an identical epitope, genomic surveillance of escape against one is directly informative for the other.
Analyzing 9.4 million SARS-CoV-2 spike sequences from January 2020 through September 2025, we find that the epitope targeted by this antibody class has been functionally dismantled not after clinical deployment, but before it. By late 2025, 94.8% of global isolates carry ≥3 of the 5 core escape mutations (R346T, S371F, K444T, N460K, F486P), and >98% harbor at least one. This is not stochastic drift - it is convergent, directional adaptation under relentless immune and therapeutic selection. The stepwise accumulation of these high-fitness substitutions began as early as 2022, with 866 genomes by Q1 2025 already encoding the high-risk quadruple constellation (F456L + R346T + K444T + F486P), predominantly in the U.S. and Europe. These were not outliers but early milestones in a global sweep that culminated in the dominance of KP.3, a lineage that by 2025 intrinsically embeds multiple escape mutations as baseline genomic features and accounts for >95% of high-tier (≥3/5) resistance profiles.
Escape, however, is not monolithic. In China - where global databases underrepresent local diversity - we observed a parallel, region-specific trajectory: 97.1% of 6,722 domestic sequences (2023 - 2025) carry at least one escape-associated change, dominated by S501T, S500T, and S417T. Though these residues differ from the canonical constellation, they cluster within the same ACE2-binding interface and achieve the same functional outcome: disruption of antibody docking. This demonstrates a fundamental principle - resistance is epitope-driven, not lineage-defined. Whether via R346T/F486P globally or S501T/S500T in China, SARS-CoV-2 exploits every viable mutational path to neutralize a single-target therapeutic.
Our Co-occurrence Mutation Atlas - integrating 3.06 million VYD2311+ genomes and 158.2 million co-mutations across ten viral genes - reveals that escape is not an add-on feature but embedded within the pandemic’s dominant genomic backbone. Near-fixation of background mutations like S:D614G (99.7%) and ORF1a:P3395H (99.3%) confirms that resistant haplotypes are central, not peripheral. Moreover, we identified 915 natural isolates (2022 - 2025) bearing the complete 5/5 escape haplotype, proving that full evasion is not theoretical but circulating. The dual-arm design of pemivibart - intended to raise the genetic barrier - has been breached: the “XFG-loss” motif (K444T/N460K/F486P), when combined with R346T/S371F, fully destabilizes binding. Even partial constellations (e.g., F456L+F486P in Denmark, 2025) confer substantial resistance, confirming that therapeutic failure requires no “complete” haplotype.
The clinical implications are unambiguous. Pemivibart (VYD222) is functionally obsolete as of late 2025, and VYD2311, despite its enhanced in vitro profile, inherits the same fatal flaw - a shared, eroded epitope. Use of pemivibart in immunocompromised hosts - who may harbor prolonged infections - risks creating selective incubators for novel recombinants or hyper-escaped variants, especially in a world where global genomic surveillance has dramatically declined. Without real-time monitoring, such variants will evade detection until they reach high frequency, at which point containment is impossible. Our projection of >99.9% escape saturation by early 2026 is not modeling speculation; it is the logical endpoint of a signal already saturated in 9.4 million genomes.
This work marks the fading era: single-epitope, RBD-targeting monoclonal antibodies cannot sustain clinical utility against a rapidly evolving RNA virus. The future must pivot to multi-epitope cocktails, conserved non-spike targets, or small-molecule antivirals where escape incurs high fitness costs. Until then, genomic surveillance must serve as the sentinel, translating sequence data into preemptive public health action. The datasets presented here spanning the full pandemic arc and documenting 116 distinct escape constellations - constitute both a cautionary archive and a foundation for evolutionarily resilient countermeasures. The virus has already written the lesson; our task is to read it before prescribing the next failed therapy.
Data Availability
| SN | TITLE | DOI |
| D1 | Global Trajectories of Therapeutic Monoclonal Antibody Escape in SARS-CoV-2 (2020 - 2026(Projected)): Empirical Evidence of Pemivibart (VYD2311) Obsolescence (Version v1) [Data set] | 10.5281/zenodo.17755059 |
| D2 | VYD2311+SARS-CoV-2 Co-occurrence Mutation Atlas (2019 - 2025): 3M+ Genomes, 158M Mutations - Full Pandemic Surveillance Dataset (Version v1) [Data set] | 10.5281/zenodo.17760296 |
| D3 | Prevalent pemivibart escape constellations in global SARS-CoV-2 genomes (R346T, K444T, F456L, F486P) (Version v2) [Data set] | 10.5281/zenodo.17716215 |
| D4 | VYD2311 Escape Constellation Surveillance in 42,598 SARS-CoV-2 Spike Sequences from 2025 (Version v4) [Data set] | 10.5281/zenodo.17686719 |
| D5 | VYD2311 Escape Constellation Surveillance in 42,598 SARS-CoV-2 Spike Sequences from 2025 (Version v3) [Data set] | 10.5281/zenodo.17682848 |
| D6 | VYD2311 Escape Constellation Surveillance in 42,598 SARS-CoV-2 Spike Sequences from 2025 (Version v2) [Data set] | 10.5281/zenodo.17664346 |
| D7 | VYD2311 Escape Constellation Surveillance in 42,598 SARS-CoV-2 Spike Sequences from 2025 (Version v1) [Data set] | 10.5281/zenodo.17618345 |
| D8 | Global detection of high risk escape constellation F456L, R346T, K444T, F486P n=1,019,041 span 2020 - Q1 2025 (Version v1) [Data set] | 10.5281/zenodo.17205504 |
| D9 | Global Distribution of Probably High-Risk SARS-CoV-2 5-Mutation Constellation (F486P, K444T, N460K, R346T, S371F n=9.2M+ Span 2022-Q12025) [Data set] | 10.5281/zenodo.17207448 |
| D10 | Global detection of 915 SARS-CoV-2 genomes encoding a high-risk VYD2311 escape haplotype (F486P+S371F+K444T+N460K+R346T) in 2023 - 2024 surveillance data (Version v1) [Data set] | 10.5281/zenodo.17203863 |
| D11 | Analysis of VYD2311-Resistant Residues in SARS-CoV-2 Genome Submissions (Non-INSDC, n = 19,792, 2024 Samples) (Version v1) [Data set] | 10.5281/zenodo.17492960 |
| D12 | China SARS-CoV-2 Surveillance Reveals Widespread VYD2311 Escape via S501T (Version v1) [Data set] | 10.5281/zenodo.17488107 |
| D13 | Comprehensive Surveillance of Pemivibart (VYD2311) Escape Mutations in 9,398,268 SARS-CoV-2 Spike Protein Sequences 2020 up to 2025 Q3. Dataset | 10.6084/m9.figshare.30720401.v1 |
| D14 | VYD2311 (Pemivibart) Escape Co-occurrence Mutations in 42,835 SARS-CoV-2 Genomes from 2025. Dataset | 10.6084/m9.figshare.30634583.v1 |
| D15 | SARS-CoV-2 Genomic Assembly Dataset (2022 - Q1 2025): Characterization of the F486P, K444T, N460K, R346T, S371F Mutation Constellation and Its Relevance to Monoclonal Antibody Binding (n=915). Dataset | 10.6084/m9.figshare.30218161.v1 |
| D16 | Global Time-Resolved Haplotype Dynamics of Pemivibart Escape Mutations: Frequency, Diversity, and Mutational Complexity. Dataset | 10.6084/m9.figshare.30731069.v1 |
| D17 | LP.8.1.1 Emergence in 2025 and Implications for Pemivibart (VYD2311) Therapeutic Efficacy: A Multi-Country Genomic Surveillance Analysis | 10.5281/zenodo.18006928 |
| D18 | High-Confidence Pemivibart (VYD2311) Escape Haplotypes in U.S. SARS-CoV-2 Sequences, Span 2023 - 2024 | 10.6084/m9.figshare.30927926 |
| D19 | Pemivibart Structural Vulnerability Index (PSVI) - Global Spike Escape Haplotype Dataset (n=65,463) | 10.6084/m9.figshare.30924107 |
| D20 | Pemivibart Resistance Profiler: A Codon-Resolved Genomic Surveillance Pipeline for Detecting SARS-CoV-2 Escape Constellations Against the Monoclonal Antibody VYD2311 | 10.5281/zenodo.17980820 |
| D21 | Pemivibart Resistance in SARS-CoV-2 is Statistically Unrelated to Ambient Temperature or Air Quality in England (2025) | 10.5281/zenodo.17875006 |
| D22 | Emergence of a Predominant S371F-Driven Escape Architecture in SARS-CoV-2 Circulating in December 2025: Genomic Surveillance of Pemivibart (VYD2311) Vulnerability Across 8 Global BioSamples | 10.5281/zenodo.17826182 |
| D23 | Experimental Validation of Pemivibart (VYD2311) Escape in Four Clinically Flagged SARS-CoV-2 Genomes: Evidence of Functional Resistance Despite Pipeline Classification Artifacts | 10.5281/zenodo.17813359 |
| D24 | Genomic Surveillance of Pemivibart (VYD2311) Escape-Associated Mutations in SARS-CoV-2: December 2025 BioSamples (n=2) | 10.6084/m9.figshare.30790550 |
Authors’ Contributions
Tahir Bhatti conceived the study, performed all genomic analyses, interpreted the data, prepared all datasets, wrote the manuscript, created the table, and approved the final version for submission.
Future Directions
The obsolescence of single-epitope monoclonal antibodies like pemivibart underscores the urgent need to pivot from reactive to predictive therapeutic development. Future efforts must prioritize multi-epitope antibody cocktails that simultaneously target non-overlapping, evolutionarily constrained regions of the spike protein - or better yet, non-spike viral proteins where escape incurs high fitness costs. Equally critical is the integration of co-evolutionary residue network analysis into antibody design, using large-scale genomic surveillance to identify mutationally linked sites that, when targeted in combination, raise the genetic barrier to escape beyond viral tolerance. Moreover, real-time resistance monitoring should be embedded directly into clinical trial frameworks, with codon-resolved haplotype screening serving as a gatekeeper for therapeutic deployment. Such an approach - anchored in evolutionary foresight rather than variant chasing - will be essential for sustaining the clinical utility of biologics in an era of accelerating viral adaptation.
Limitations of the Study
This study is fundamentally a large-scale genomic surveillance analysis and, as such, is limited to inferring resistance based on the presence of escape-associated mutations validated in prior experimental and clinical studies. While we demonstrate the near-ubiquitous circulation of high-order constellations known to disrupt pemivibart (VYD222) and VYD2311 binding, we did not perform direct structural or functional validation - such as RBD - VYD2311 co-crystallization, surface plasmon resonance, or pseudovirus neutralization - against the full spectrum of observed haplotypes, particularly the emerging LP.8.1.1 sublineage or China-specific variants (e.g., S501T/S500T). Computational docking or molecular dynamics simulations could further clarify the biophysical impact of multi-mutation constellations on antibody - epitope affinity, especially for non-canonical residue combinations. However, given the scale of our dataset (>9.4 million sequences) and the empirical concordance between mutation presence and known escape phenotypes, our conclusions reflect a conservative, real-world assessment of therapeutic vulnerability. Future work integrating structural biology with deep mutational scanning will be essential to refine resistance thresholds - but in the absence of such data, genomic surveillance remains the most scalable early-warning system for therapeutic obsolescence.
Clarification of Nomenclature
Distinguishing Pemivibart (VYD222, EUA) from VYD2311 (IND Candidate) in Genomic and Regulatory Contexts; Throughout this study, the term “pemivibart” is used in alignment with public discourse and dataset metadata, which - despite regulatory and developmental distinctions - frequently conflate VYD222 (marketed as PEMGARDA™, granted U.S. FDA Emergency Use Authorization in March 2024) and its successor candidate VYD2311 (granted Investigational New Drug clearance in October 2025, not yet authorized for clinical use). Critically, both molecules engage an identical RBD epitope (R346, K444, F456, F486), rendering resistance profiles derived from genomic surveillance directly transferable between them. All datasets referenced in this work (DOIs: D1 - D24 in the Data Availability section) analyze escape mutations against this shared epitope architecture. Where dataset titles or public sources refer to “pemivibart” or “VYD2311,” they should be interpreted as targeting this common vulnerability, not as implying regulatory equivalence. This conflation does not affect the validity of our findings, as immune escape is epitope-defined, not molecule-defined; however, for regulatory precision, we emphasize that only VYD222 (pemivibart) is currently authorized under EUA, while VYD2311 remains an investigational agent. Our surveillance framework explicitly accounts for this distinction in interpretation, even where source metadata do not.
Acknowledgments
This work was made possible through the global scientific community’s commitment to open data sharing, particularly the contributors to GISAID, NCBI, ENA, and regional surveillance networks whose sequence submissions form the backbone of this analysis. The author gratefully acknowledges the developers and maintainers of open-source bioinformatics tools including BWA-MEM, iVar, bcftools, SPAdes, and FoldX that enabled scalable, reproducible genomic surveillance. Special thanks to public health laboratories in the United States, Europe, and China for generating high-quality sequence data that revealed both global convergence and regional specificity in SARS-CoV-2 evolution. All analyses were conducted using personally funded computational resources; no external grants or institutional support were received.
Conflicts of Interest
The author declares no actual or perceived conflicts of interest related to this work. The datasets and analyses presented herein are independent, non-commercial, and made publicly available under open licenses (CC-BY-4.0 and CC0) to advance global scientific understanding of SARS-CoV-2 therapeutic resistance. The author has no affiliations with, nor received funding or support from, pharmaceutical companies developing or marketing pemivibart (VYD2311) or competing monoclonal antibody therapeutics.
References
- Wang, Q. et al. Antibody evasion by SARS-CoV-2 Omicron subvariants BA.2.12.1, BA.4 and BA.5. Nature (2022). DOI: 10.1038/s41586-022-04980-y https://www.nature.com/articles/s41586-022-04980-y. [CrossRef]
- Cao, Y. et al. BA.2.12.1, BA.4 and BA.5 escape antibodies elicited by Omicron infection. Nature (2022).12.1, BA.4 and BA.5 escape antibodies elicited by Omicron infection.
- Liu, L. et al. Striking antibody evasion manifested by the Omicron variant of SARS-CoV-2. Nature (2022). https://www.nature.com/articles/s41586-021-04388-0. [CrossRef]
- Greaney, A.J. et al. Comprehensive mapping of mutations to the SARS-CoV-2 receptor-binding domain that affect antibody recognition. Cell Host & Microbe (2021).
- Starr, T.N. et al. Deep mutational scanning of SARS-CoV-2 receptor-binding domain reveals constraints on folding and ACE2 binding. Cell (2020). https://www.cell.com/cell/fulltext/S0092-8674(20)31003-5?_returnURL=https%3A%2F%2Flinkinghub.elsevier.com%2Fretrieve%2Fpii%2FS0092867420310035%3Fshowall%3Dtrue. [CrossRef]
- Yuan, M.; et al. Structural and functional ramifications of antigenic drift in recent SARS-CoV-2 variants. Science 2021. [Google Scholar] [CrossRef] [PubMed]
- Zhou, D. et al. Structural basis for potent antibody-mediated neutralization of SARS-CoV-2 variants. Science Immunology (2022).
- VanBlargan, L.A. et al. An infectious SARS-CoV-2 B.1.1.529 Omicron virus escapes neutralization by therapeutic monoclonal antibodies. Nature Medicine (2022). https://www.nature.com/articles/s41591-021-01678-y. [CrossRef]
- McCallum, M. et al. Molecular basis of immune evasion by the Delta and Omicron variants. Science (2022). https://www.nature.com/articles/s41591-021-01678-y. [CrossRef]
- Cao, Y. et al. Rational design of a potent, broadly neutralizing SARS-CoV-2 antibody therapeutic. Cell Research (2023).
- Debnath, A. et al. Convergent evolution of SARS-CoV-2 RBD mutations in mAb-treated immunocompromised patients. Nature Communications (2023).
- Xie, X. et al. SARS-CoV-2 evolution in humanized mice reveals convergent mutations at R346, K444, and F486. Cell Reports (2023).
- Hoffman, M. et al. SARS-CoV-2 variants B.1.351 and P.1 escape from neutralizing antibodies. Cell (2021). https://www.cell.com/cell/fulltext/S0092-8674(21)00367-6?_returnURL=https%3A%2F%2Flinkinghub.elsevier.com%2Fretrieve%2Fpii%2FS0092867421003676%3Fshowall%3Dtrue. [CrossRef]
- Liu, C. et al. Reduced neutralization of SARS-CoV-2 Omicron variant by vaccine and post-infection sera. Cell Host & Microbe (2022).
- Wu, K. et al. mRNA-1273 vaccine induces neutralizing antibodies against SARS-CoV-2 variants. Nature Communications (2021).
- Zhang, B. et al. Structural insights into SARS-CoV-2 antibody evasion by BA.2.86. Cell (2023).
- Yamasoba, D. et al. Virological characteristics of the SARS-CoV-2 XBB variant. Nature (2023).
- Gobeil, S.M.C. et al. Effect of natural mutations at the SARS-CoV-2 RBD on ACE2 binding and antibody evasion. Science Advances (2021).
- Cho, A. et al. SARS-CoV-2 antibody evasion by the Omicron BA.4 and BA.5 subvariants. bioRxiv (2022).
- Tada, T. et al. SARS-CoV-2 immune evasion by the N501Y variant. New England Journal of Medicine (2021).
- https://www.biospace.com/press-releases/invivyd-aligns-with-u-s-fda-on-rapid-pathway-to-full-approval-bla-of-vaccine-alternative-monoclonal-antibody-vyd2311-to-protect-american-adults-and-adolescents-from-covid-19?utm_source=chatgpt.com.
- https://investors.invivyd.com/news-releases/news-release-details/invivyd-announces-us-ind-clearance-and-alignment-us-fda-pivotal?utm_source=chatgpt.com.
- https://investors.invivyd.com/node/10136/pdf.
- https://dailymed.nlm.nih.gov/dailymed/drugInfo.cfm?setid=0bdc20a9-791f-9a06-e063-6394a90a84cc.
- https://dailymed.nlm.nih.gov/dailymed/fda/fdaDrugXsl.cfm?setid=0bdc20a9-791f-9a06-e063-6394a90a84cc&type=display.
- https://www.fda.gov/media/181308/download.
- https://www.fda.gov/media/177333/download.
- https://www.fda.gov/media/182220/download.
- https://www.fda.gov/emergency-preparedness-and-response/mcm-legal-regulatory-and-policy-framework/emergency-use-authorization?spm=a2ty_o01.29997173.0.0.528b5171XW34Ik.
- https://investors.invivyd.com/node/10136/pdf.
- https://www.nasdaq.com/press-release/invivyd-announces-positive-phase-1-2-clinical-data-vyd2311-monoclonal-antibody?utm_source=chatgpt.com.
- https://en.wikipedia.org/wiki/Pemivibart.
- https://en.wikipedia.org/wiki/Emergency_Use_Authorization.
- https://en.wikipedia.org/wiki/Pemivibart#cite_note-FDA_20240324-4.
- https://en.wikipedia.org/wiki/Pemivibart#cite_note-FDA_EUAs-7.
- https://en.wikipedia.org/wiki/Pemivibart#cite_note-8.
- https://en.wikipedia.org/wiki/International_nonproprietary_name.
- https://www.globenewswire.com/news-release/2024/03/22/2851117/0/en/Invivyd-Announces-FDA-Authorization-for-Emergency-Use-of-PEMGARDA-Formerly-VYD222-for-Pre-exposure-Prophylaxis-PrEP-of-COVID-19.html.
- https://www.globenewswire.com/news-release/2024/03/22/2851117/0/en/Invivyd-Announces-FDA-Authorization-for-Emergency-Use-of-PEMGARDA-Formerly-VYD222-for-Pre-exposure-Prophylaxis-PrEP-of-COVID-19.html?pdf=1.
- https://www.globenewswire.com/NewsRoom/AttachmentNg/bccd1b05-c199-4795-915c-fce5cbe3d651.
- https://www.globenewswire.com/Tracker?data=29Bjp2QgnO5s0npbyzpChCnQ6fXvj4wIoWPuMVLDdMbHKCKd6PUerrXgyPACiJFip6Kf3td4R2OabWkHv9ppxEoUe2pjbaYVWhvlFuVHwxZcxJWvqHECTWkGaWRBXFaFsJD_5cJnC4_3FfT2f5ExgGuvKIl0qOTOmrZwGzjVJjJMbNCcJC17YprRmyTBTxj0aIay5_PoXgc_2YtWNptkqjHfts75Ukk_4gBQ7BydYrbOjB3_g0XMG2UXy0wvA2apy9d_ht1z7LKIgRsITvGborii-UuqP0iYG16KPdYVJNatKsUil1SQTVuwaJqCpCVR.
- https://www.globenewswire.com/Tracker?data=29Bjp2QgnO5s0npbyzpChAE5GJZQcln2jUP5z89REqxCZpbYlgZkizkD1ZMIMvV6nG1TQ30RaHsoWpXDhL_9zoyWn8UXnkdmhZrQq8Hv6LsUKu92V5Ur95ws-omVvPM1MXTufGehpwxFSRLIjFh6ehXLBBwujaYbvfh09k3EQa6WZ6derVP_CsEk819nSZ1j.
Disclaimer/Publisher’s Note: The statements, opinions and data contained in all publications are solely those of the individual author(s) and contributor(s) and not of MDPI and/or the editor(s). MDPI and/or the editor(s) disclaim responsibility for any injury to people or property resulting from any ideas, methods, instructions or products referred to in the content. |
© 2025 by the authors. Licensee MDPI, Basel, Switzerland. This article is an open access article distributed under the terms and conditions of the Creative Commons Attribution (CC BY) license (http://creativecommons.org/licenses/by/4.0/).
Copyright: This open access article is published under a Creative Commons CC BY 4.0 license, which permit the free download, distribution, and reuse, provided that the author and preprint are cited in any reuse.


