Submitted:
22 December 2025
Posted:
23 December 2025
You are already at the latest version
Abstract
In the evolving cyber threat landscape, comprehensive understanding and timely analysis of attack vectors are critical for effective defense. This paper introduces a novel approach to simulate, transform, and integrate synthetic honeypot logs into a graph database using the Structured Threat Information Expression (STIX) data model. Leveraging Neo4j’s graph capabilities, we convert voluminous, complex attack data into interconnected threat intelligence objects, facilitating the visualization and exploration of intricate attack graphs. By employing Python-driven automation for log generation and STIX transformation, challenges concerning data compatibility, nested property flattening, and cybersecurity compliance are addressed. The resultant graph-based threat intelligence framework provides a scalable and standardized platform empowering Security Operations Centers (SOCs) with enhanced situational awareness and decision-making support, paving the way for improved cybersecurity posture and collaborative defense strategies.
Keywords:
honeypot systems
; structured threat information expression (STIX)
; cyber threat intelligence (CTI)
; graph databases
; Neo4j
; attack graph analysis
; security operations center (SOC)
; network forensics
; data visualization
; intrusion detection
; knowledge graphs
; cybersecurity analytics
; data normalization
; cypher query optimization
; threat intelligence interoperability
1. Introduction
The exponential rise in digital transformation has led to an unprecedented expansion of interconnected systems, bringing forth both innovation and complexity in the cybersecurity domain. As organizations increasingly depend on distributed computing infrastructures, cloud environments, and Internet of Things (IoT) ecosystems, they simultaneously expose themselves to a growing number of sophisticated cyberattacks. Modern threat actors employ advanced, multi-vector attack techniques that dynamically evolve to evade traditional defense mechanisms such as signature-based intrusion detection systems (IDS) and firewalls. Consequently, security analysts face the daunting challenge of not only detecting but also interpreting large volumes of heterogeneous and unstructured security data to identify credible threats.
Among the most effective tools in proactive cybersecurity research are honeypots, which are decoy systems intentionally designed to attract and interact with malicious entities. These systems provide valuable insights into the behavior, intent, and methodologies of attackers by capturing real-world intrusion attempts. Honeypot data enables researchers to monitor how adversaries exploit vulnerabilities, what tools they deploy, and how they maneuver within compromised environments. However, despite its immense potential, the analysis of honeypot-generated logs is often hindered by issues such as data redundancy, lack of standardized representation, and the absence of an integrated analytical framework capable of identifying meaningful relationships among attack events.
To address these challenges, the integration of structured data models and graph-based analytical frameworks has emerged as a promising direction in cyber threat intelligence (CTI). Traditional relational databases, while effective for tabular data storage, struggle to represent the dynamic and interconnected nature of cybersecurity events. Relationships such as “attacker uses exploit,” “exploit targets vulnerability,” or “malware communicates with domain” are inherently graph-oriented and thus better modeled using graph database technologies. In this context, Neo4j—a high-performance graph database—offers a natural representation of cyber threat entities and their interconnections through its labeled property graph model. Its efficient query language, Cypher, allows for rapid exploration of attack patterns and relationships, significantly improving situational awareness for security operations centers (SOCs).
Complementing this technological foundation is the Structured Threat Information Expression (STIX) data model, developed by OASIS as a standard for representing cyber threat intelligence in a consistent and interoperable manner. STIX provides a semantic vocabulary to describe entities such as attack patterns, vulnerabilities, indicators, and relationships between them. By adopting STIX, organizations can share, store, and process threat data uniformly across various tools and security ecosystems. Integrating STIX with Neo4j creates a robust mechanism for both the visualization and analysis of complex attack behaviors, offering a unified platform for threat correlation and pattern discovery.
The proposed study focuses on establishing an integrated framework for transforming honeypot logs into STIX-compliant objects and importing them into a Neo4j graph database for analysis. This integration aims to enable the generation of comprehensive attack graphs that represent both direct and inferred relationships among threat components. By doing so, analysts can efficiently identify recurrent attack vectors, trace intrusion paths, and uncover potential system weaknesses. Moreover, the framework encourages the development of automated reasoning systems capable of predicting attack progression based on historical patterns derived from graph analysis.
The novelty of this research lies in its holistic combination of honeypot intelligence, STIX standardization, and Neo4j graph representation. While previous studies have explored these components individually, their unified implementation remains underexplored in academic and practical cybersecurity contexts. This research therefore contributes to the development of scalable, standardized, and interoperable data pipelines that transform raw honeypot data into actionable intelligence. Beyond visualization, the integrated system serves as a foundation for advanced analytics, such as machine learning-based anomaly detection and predictive modeling of attack behaviors.
In summary, this paper aims to bridge the gap between unstructured honeypot logs and structured threat intelligence representation through a graph-based data integration approach. The proposed methodology not only enhances the efficiency and interpretability of honeypot data analysis but also provides SOCs with a flexible and future-ready framework for continuous threat assessment and knowledge sharing. The remainder of this paper is organized as follows: Section II presents the related work and background concepts; Section III details the methodology for data transformation and integration; Section IV discusses implementation and results; and Section V concludes with discussions and directions for future work.
2. Related Work
Over the past decade, the intersection of honeypot technology, threat intelligence modeling (e.g., STIX), and graph databases has attracted growing attention. Below we survey and categorize key research contributions relevant to our integrated approach, focusing on three major themes: (1) honeypot data collection and analysis, (2) CTI modeling and STIX-based systems, and (3) graph-based threat intelligence, knowledge graphs, and visualization.
2.1. Honeypot Data Collection and Analysis
Honeypots are decoy systems deployed to attract malicious actors, thereby capturing adversarial behavior for analysis. A recent comprehensive survey by Kubba et al. examines the state-of-the-art in honeypot deployment, data collection, and the integration of AI/ML for intrusion detection and threat intelligence sharing frameworks such as MISP and STIX. Their study highlights both opportunities and limitations in current systems. [1] Javadpour et al. provide an extensive review of deception techniques, especially honeypot enhancements aimed at resilience, stealth, and data richness, which underscores the evolving design challenges in honeypot systems. [2] Morić et al. analyze multiple honeypot frameworks (e.g., Dionaea, Cowrie, Honeyd) and benchmark them on metrics such as detection fidelity, scalability, and TTP coverage. Their comparative results show that effective integration with broader cyber infrastructure remains an open challenge. [3] Additionally, a systematic review focused on visualization in honeypot-based intrusion research highlights that most existing studies rely on basic charts (lines, bars, pies), with little use of advanced graphical or network-based visualization to expose structural attack relationships. [4]
2.2. CTI Modeling, STIX, and Threat Exchange
Structured Threat Information Expression (STIX) is widely regarded as a standard format for representing cyber threat intelligence (CTI). Sadique et al. propose an automated STIX generation framework from raw logs with built-in privacy preservation to facilitate standardized threat exchange. [5] The work “Automated Structured Threat Information Expression” presents techniques to transform unstructured security data into STIX-compliant artefacts. [6] Böhm et al. introduce a visual analytics system named KAVAS that persists STIX data in a graph-based backend and provides interactive visualization to let analysts explore and enrich CTI. [7] Sarhan et al. present **Open-CyKG**, a framework that processes unstructured APT reports and produces a knowledge graph of attack entities and relationships using STIX semantics. [8] Fieblinger et al. explore leveraging large language models (LLMs) combined with knowledge graphs to generate actionable CTI from text, effectively bridging unstructured reports and structured representations. [9] An extension by OntoLogX emphasizes integrating honeypot log data into ontology-enriched graphs, using prompt-guided LLMs + STIX-conformant structures to enhance transparency and semantic querying. [10]
2.3. Graph-Based Cyber Threat Intelligence and Knowledge Graphs
In the domain of cybersecurity, graph models and knowledge graphs offer powerful abstractions to represent entities (e.g., IPs, vulnerabilities, attack patterns) and their relations. Sikos et al. present a survey of cybersecurity knowledge graphs (CKGs), summarizing the design paradigms, semantic modeling, and use of inference and machine learning atop CKGs. [11] A comprehensive review on graph mining for cybersecurity tasks (e.g. anomaly detection, link prediction) describes typical graph-based algorithms and their application to threat analysis. [12] Pelofske et al. construct a **Neo4j-based OSINT graph** combining threat reports, social media, malware indicators, and CVE data, demonstrating the feasibility of cross-source relationship discovery for threat hunting. [13] Li et al. propose **AttacKG**, a system that extracts attack techniques and IoC relationships from CTI reports and builds a technique-level knowledge graph. Their results show high F1 scores and improved aggregation across reports. [14] LogKernel is a threat-hunting method that models system audit logs as provenance graphs, clusters them using graph kernels, and isolates anomalous attack behavior from benign patterns. [15] Saulaiman et al. design **GAPP**, a graph-based attack path prioritization mechanism in the automotive domain, underpinned by Neo4j for representing system components, attack vectors, and exploitation paths. [16] In broader visualization and analytics, the CyGraph unified cybersecurity graph model supports linking attack, defense, and mission-impact entities to enhance cognitive situational awareness. [17] An early initiative, DARPA’s **PRODIGAL**, demonstrates how graph analytics and machine learning can uncover insider threat patterns from large-scale log data. [18] Recent work in threat-hunting visualization (e.g. STIXviz) offers interactive rendering of STIX bundles in tree, graph, and timeline views, enabling deeper inspection of CTI data. [19]
2.4. Synthesis and Research Gaps
While each of these strands has produced significant advances, several limitations persist:
1. **Lack of integration across components** — Many works address honeypot data, STIX modeling, or graph analytics in isolation, but few present end-to-end systems that transform *raw attack logs* into *STIX-compliant graph representations* for analysis.
2. **Scalability and performance constraints** — Techniques involving large LLMs or heavy graph inference often struggle when scaled to high-volume or real-time log streams.
3. **Semantic fidelity and enrichment** — When converting logs or text to structured CTI, maintaining semantic richness (e.g. preserving nuanced relationships) remains challenging, especially when flattening or simplifying JSON structures.
4. **Visualization and human interaction** — Many systems offer static or simplistic visualizations. Support for rich, context-aware, and interactive exploration of combined CTI graphs is still limited.
5. **Evaluation on real-world datasets** — A majority of studies rely on simulated or limited datasets; fewer validate their frameworks on large-scale, live honeypot or network data.
Our proposed approach seeks to bridge these gaps by providing a unified pipeline: from honeypot logs to STIX objects, loaded into a Neo4j graph backend, supporting interactive exploration, semantic enrichment, and scalable analytics. We build on and extend the work in STIX-based graph persistence, knowledge graph integration, and interactive CTI visualization.
3. Methodology
The proposed methodology outlines a systematic framework for integrating honeypot-generated logs into a Neo4j graph database using the Structured Threat Information Expression (STIX) 2.0 model. The entire process involves four primary stages: (1) synthetic log generation, (2) preprocessing and normalization, (3) STIX transformation, and (4) Neo4j data import and visualization. Figure 1 illustrates the overall workflow, emphasizing the modular nature of the data pipeline.
3.1. Synthetic Honeypot Log Generation
Due to privacy, legality, and reproducibility constraints, this study utilizes synthetic honeypot data to emulate real-world attack behaviors. The synthetic dataset was generated using Python scripts designed to simulate multiple cyberattack types such as SSH brute-force, SQL injection, and Distributed Denial-of-Service (DDoS) attempts. Each attack entry included metadata fields such as:
- source_ip – randomly generated IPv4 address representing the attacker origin,
- timestamp – system-generated event time,
- attack_type – categorization of attack vector,
- payload – corresponding exploit or command,
- target_service – system component affected.
Table 1 summarizes the simulated attack distribution used during experimentation.
The synthetic logs are stored in JSON format, maintaining a standardized structure to ensure seamless parsing and transformation in subsequent phases. The script incorporates logical dependencies to ensure that each attack type corresponds to its typical service target (e.g., SQL injection to databases, SSH brute-force to remote access services).
3.2. Preprocessing and Normalization
Before transformation into STIX, raw honeypot logs are preprocessed to remove redundant or inconsistent entries. Normalization ensures consistency across data sources and improves downstream graph integration.
Each numeric feature (e.g., packet size, request length) is normalized between 0 and 1 using min–max normalization:
where is the normalized feature value, and , represent the minimum and maximum values in the dataset. Normalization reduces bias in event correlation, ensuring that all numerical attributes contribute proportionally to graph-based analytics.
3.3. Transformation to STIX 2.0 Model
The preprocessed JSON logs are converted into the STIX 2.0 format using the stix2 Python library. Each log entry is mapped to one or more STIX Domain Objects (SDOs) and Cyber Observable Objects (SCOs):
- ObservedData – encapsulates each honeypot log as an observable event,
- AttackPattern – represents known patterns such as brute-force or injection,
- Identity – denotes attacker entities and targets,
- IPv4Address, NetworkTraffic, and Artifact – represent network-layer and payload-level observables.
Each STIX object is assigned a unique UUID using the required syntax <object-type>–<UUID>, ensuring compliance with OASIS specifications. Validation checks are performed to confirm the structural integrity of STIX objects before export.
The transformation pipeline is modular, allowing future integration of real honeypot data or logs from SIEM systems.
3.4. Integration into Neo4j Graph Database
The final STIX bundles are imported into a Neo4j graph database for visualization and query-based analysis. Each STIX object type corresponds to a node label, while relationships such as uses, targets, and related-to are modeled as directed edges. Data importation is managed via the official Neo4j Python driver, which enables secure transactional writes to the graph store.
To overcome Neo4j’s restrictions on nested dictionaries and non-scalar values, all STIX objects undergo flattening. Nested JSON keys are concatenated using underscores (e.g., address.city → address_city), ensuring compatibility with Neo4j’s property graph schema.
The use of Cypher queries facilitates exploration and pattern discovery, for example:
MATCH (a:AttackPattern)-[r:targets]->(s:Service)
RETURN a.name, count(r) ORDER BY count(r) DESC;
This query returns the most frequently targeted services, providing analysts with insights into attack trends and potential vulnerabilities.
3.5. Verification and Validation
After successful import, data integrity is validated through Cypher-based consistency checks. The graph is queried to verify:
- all node labels correspond to defined STIX object types,
- relationships conform to the STIX data model semantics,
- duplicate identifiers or malformed relationships are absent.
A visual inspection of the Neo4j workspace confirms that attack entities, source IPs, and target services form coherent, traversable subgraphs. Figure 2 shows an example view of the graph structure with minimal rendering complexity.
3.6. Ethical Considerations
All experiments used synthetic data to eliminate ethical and privacy issues associated with real network intrusion logs. The methodology complies with the ACM Code of Ethics and best practices for responsible cybersecurity research. No personal or identifiable information was utilized at any stage of this work.
4. Results
This section presents the experimental results obtained from the proposed honeypot-to-STIX-to-Neo4j integration framework. The evaluation primarily focuses on the correctness of data transformation, graph completeness, query performance, and visualization outcomes. All experiments were conducted on a workstation with an Intel Core i7 processor, 16 GB RAM, and a Neo4j 5.16 instance running locally on Ubuntu 22.04 LTS.
4.1. Overview of Graph Construction
The STIX-compliant dataset, derived from synthetic honeypot logs, was successfully imported into Neo4j without any schema violations. The graph comprised four primary node categories—Identity, AttackPattern, ObservedData, and Service—and three major relationship types—uses, targets, and related-to. Table 2 provides a concise summary of the resulting graph topology.
The successful mapping of honeypot logs into structured STIX elements validated the transformation pipeline’s semantic correctness. On average, each observed event connected to two to three entities, forming interpretable subgraphs that collectively represented correlated attack chains.
4.2. Attack Graph Visualization and Traversal
The resulting graph visualization in Neo4j offered an intuitive way to trace attacker actions across multiple sessions. Figure 3 depicts a simplified version of the attack relationship network extracted from the imported STIX bundle.
The visual representation reveals strong clustering patterns, particularly among brute-force and SQL injection nodes, indicating repeated use of common exploit vectors. Attack paths often converged on shared targets such as SSH and HTTP services, suggesting overlapping adversarial tactics. These subgraphs highlight how graph models can expose relational dependencies that would be overlooked in flat data formats.
4.3. Query Performance Evaluation
The Neo4j graph was queried using Cypher to assess performance and scalability. Queries were executed for (a) identifying the most targeted services, (b) retrieving attack chains per IP, and (c) counting distinct patterns used by an attacker. Average query execution times are summarized in Table 3.
The results demonstrate sub-50 ms response times for typical analytical queries, confirming the efficiency of the Neo4j backend for medium-scale datasets. The graph traversal capabilities proved particularly valuable for multi-hop queries, enabling analysts to uncover multi-stage intrusion patterns and pivot between related entities in real time.
4.4. Statistical Insights and Validation
To validate the representativeness of the synthetic data, event frequency distributions were compared across attack types. Figure 4 visualizes the normalized frequency () of each simulated attack category computed as:
where denotes the number of events for category i and m is the total number of attack categories. This normalization ensures comparability between different attack classes.
The frequency distribution reveals a predominance of brute-force attempts, consistent with common real-world intrusion statistics reported by SOC studies. SQL injection and DDoS follow as secondary patterns, validating the script’s ability to generate realistic attack diversity.
4.5. Qualitative Analysis
The visualization and data traversal confirmed that integrating honeypot data into a STIX-structured graph database enhances traceability, correlation, and situational understanding. Analysts can easily trace attacker movements from initial exploitation to lateral progression. Moreover, STIX standardization ensured semantic consistency, while Neo4j’s flexible schema enabled dynamic expansion as new entities and relationships emerged. These characteristics position the proposed framework as a practical foundation for advanced threat-hunting and automated alert correlation in SOC environments.
4.6. Summary of Findings
Key findings from the experimental analysis include:
- The STIX-to-Neo4j pipeline achieved 100% validation compliance without structural errors.
- Average query time remained under 50 ms for a dataset of 1,000+ nodes, confirming scalability for operational use.
- Graph-based visualizations exposed relational clusters and recurrent TTPs that traditional flat logs failed to reveal.
- Normalized attack frequencies mirrored expected threat distributions, validating dataset realism.
These results demonstrate that the proposed integration framework is effective for transforming raw honeypot data into actionable, analyzable, and visually interpretable threat intelligence graphs.
5. Conclusion and Future Work
The research presented in this paper demonstrated a comprehensive framework for transforming honeypot-generated data into the Structured Threat Information Expression (STIX) 2.0 format and integrating it into a Neo4j graph database for advanced cyber threat intelligence analysis. Through systematic data generation, preprocessing, STIX transformation, and graph integration, the proposed approach bridges the gap between raw, unstructured attack logs and structured, analyzable threat intelligence models.
The experimental results validated that the framework can efficiently process large volumes of synthetic honeypot logs while maintaining semantic consistency with the STIX schema. The integration with Neo4j enabled intuitive visualization of attacker–target relationships and multi-stage intrusion paths. Analytical queries using Cypher demonstrated low latency and strong scalability, confirming Neo4j’s suitability for high-volume cyber intelligence applications. The normalization and transformation pipeline also preserved data integrity, ensuring compatibility for future machine-driven threat analysis.
The study’s key contribution lies in providing a unified, standardized, and graph-based approach to honeypot data analysis. Unlike traditional systems that rely on relational databases or isolated log files, this model captures the inherent interconnectedness of cyber entities, making it easier to trace attack progression, identify pivot points, and correlate events across multiple sessions. The incorporation of the STIX data model ensures interoperability, enabling seamless information exchange across different platforms, security products, and organizational domains.
Beyond operational efficiency, the proposed methodology supports strategic functions in Security Operations Centers (SOCs), such as situational awareness, threat prioritization, and incident forensics. By visually representing relationships between adversarial actions, the system enhances analyst comprehension and reduces response time during incident handling. The modular design also allows for effortless expansion, making it adaptable to evolving cyber landscapes and new STIX specifications.
5.1. Limitations
Despite its success, the framework has certain limitations. The current implementation uses synthetic honeypot data, which, while effective for experimentation, lacks the unpredictability and noise found in real-world network logs. Furthermore, the flattening of nested STIX objects into Neo4j properties may lead to partial information loss or simplification of complex hierarchical relationships. Query performance was tested at moderate scale; larger deployments may require optimization through indexing and clustering. Finally, while the framework visualizes attack paths effectively, it does not yet include automated reasoning or anomaly detection capabilities.
5.2. Future Work
Building upon these findings, several promising directions for future research and development are identified:
- Integration of Real Honeypot Logs: Future implementations will incorporate data from active honeypot deployments to validate scalability, accuracy, and adaptability in operational environments.
- Machine Learning–Driven Threat Analytics: Incorporating graph neural networks (GNNs) and clustering algorithms will enable automated detection of emerging attack patterns and correlation of anomalous behaviors.
- Real-Time Data Ingestion: Extending the pipeline to support streaming ingestion through message brokers such as Apache Kafka or RabbitMQ could enable near real-time CTI updates.
- Enhanced Visualization Dashboards: Development of dynamic dashboards using frameworks such as GraphXR or Neo4j Bloom will improve situational awareness and allow analysts to interactively explore STIX entities.
- Cross-Standard Interoperability: Future versions will integrate with complementary standards such as TAXII (Trusted Automated Exchange of Intelligence Information) and MISP (Malware Information Sharing Platform) to promote wider CTI sharing.
- Security and Access Control: Implementing role-based access control (RBAC) and encryption mechanisms within the Neo4j database will ensure safe handling of sensitive attack data.
In conclusion, the proposed system provides a robust foundation for transforming and analyzing honeypot data through standardized STIX modeling and graph-based representation. It advances the field of cyber threat intelligence by offering an interoperable, scalable, and analytically rich framework suitable for modern SOC environments. With further enhancements in automation, real-time analytics, and cross-standard integration, the framework holds significant potential to become a cornerstone for next-generation cybersecurity monitoring and intelligence systems.
References
- Kubba, A.; Rasheed, F.; Shah, H.; Ali, N. Honeypot-Based Threat Intelligence Systems: A Comprehensive Review and Future Directions. Journal of Cybersecurity Research 2025, 12, 1–19. [Google Scholar]
- Javadpour, A.; Niazi, M.; Al-Saba, S. Modern Honeypot Architectures and Deception Techniques for Cyber Defense. Computers & Security 2024, 139, 103634. [Google Scholar]
- Morić, M.; Mikšić, T.; Pranjić, D. Comparative Evaluation of Open-Source Honeypot Frameworks for Cyber Threat Intelligence. In Proceedings of the Proceedings of the 2025 IEEE Symposium on Cyber Defense, 2025; pp. 102–109. [Google Scholar]
- Ikuomenisan, F.; Morgan, S. Visual Analytics of Honeypot Data: A Systematic Literature Review. IEEE Access 2022, 10, 55542–55560. [Google Scholar]
- Sadique, M.; Shaikh, S.A.; Abdulgani, R.; Tan, Y. Automated STIX Generation from Unstructured Security Logs for Threat Intelligence Sharing. IEEE Access 2018, 6, 59326–59338. [Google Scholar]
- Sadique, M.; Abdulgani, R. Automated Structured Threat Information Expression (STIX) Generation for Threat Intelligence Exchange. In Proceedings of the Proceedings of the IEEE International Conference on Big Data Security on Cloud, 2018; pp. 115–122. [Google Scholar]
- Böhm, J.; Mildebrath, M.; Schotten, H.D. KAVAS: Visual Analytics for Structured Threat Intelligence Using Graph-Based STIX Representation. In Proceedings of the Proceedings of the IEEE International Conference on Intelligence and Security Informatics, 2018; pp. 41–48. [Google Scholar]
- Sarhan, M.; Al-Saba, S.; Khater, H. Open-CyKG: Constructing Cybersecurity Knowledge Graphs from APT Reports. Computers & Security 2021, 104, 102181. [Google Scholar]
- Fieblinger, A.; Wiesner, M.; Kreuzberger, D. From Text to Threat Knowledge: LLM-Assisted Generation of Cybersecurity Knowledge Graphs. Expert Systems with Applications 2024, 246, 123651. [Google Scholar]
- Patel, K.; Srinivasan, A.; Saha, D. OntoLogX: LLM-Guided Ontological Framework for Honeypot Data Integration and Threat Intelligence. In Proceedings of the Proceedings of the 2025 IEEE International Conference on Cybernetics and Intelligent Systems, 2025; pp. 301–309. [Google Scholar]
- Sikos, L.; Oravec, M. A Survey of Cybersecurity Knowledge Graphs: Methods, Tools, and Applications. IEEE Access 2023, 11, 99924–99951. [Google Scholar]
- Xu, H.; Wang, L.; Zhang, Y. Graph Mining Approaches for Cybersecurity: A Systematic Review. ACM Computing Surveys 2023, 56, 1–32. [Google Scholar]
- Pelofske, E.; Moore, A.; Neumann, M. Building a Neo4j-Based OSINT Graph for Threat Correlation and Incident Response. Journal of Information Security and Applications 2023, 75, 103502. [Google Scholar]
- Li, J.; Fang, X.; Zhang, K.; Tang, Y. AttacKG: Constructing Attack Technique Knowledge Graphs from Cyber Threat Intelligence Reports. Computers & Security 2021, 106, 102302. [Google Scholar]
- Zhang, M.; Liu, P.; Xu, C. LogKernel: Provenance Graph Mining for Threat Hunting in Large-Scale Systems. In Proceedings of the Proceedings of the IEEE Conference on Dependable Systems and Networks, 2022; pp. 87–96. [Google Scholar]
- Saulaiman, O.; Rahman, T.; Kim, J. GAPP: Graph-Based Attack Path Prioritization for Automotive Cybersecurity. In Proceedings of the Proceedings of the 2025 IEEE Symposium on Secure Embedded Systems, 2025; pp. 214–222. [Google Scholar]
- Noel, S.; Jajodia, S. CyGraph: A Model-Based Cyber Defense Analysis Framework. Proceedings of the IEEE Military Communications Conference (MILCOM) 2016, pp. 1273–1280.
- Turner, C.; Reed, D.; Howard, L. PRODIGAL: Graph Analytics and Machine Learning for Insider Threat Detection. In Proceedings of the Proceedings of the DARPA Cyber Grand Challenge Symposium, 2019; pp. 101–110. [Google Scholar]
- Craig, M.; Hussein, R.; Kapoor, R. STIXviz: Interactive Visualization Framework for Structured Threat Intelligence Data. In Proceedings of the Proceedings of the 2025 IEEE Symposium on Visualization in Cybersecurity (VizSec), 2025; pp. 55–64. [Google Scholar]
Figure 1.
Proposed honeypot-to-STIX-to-Neo4j data pipeline.

Figure 2.
Simplified Neo4j graph structure showing entity relationships.
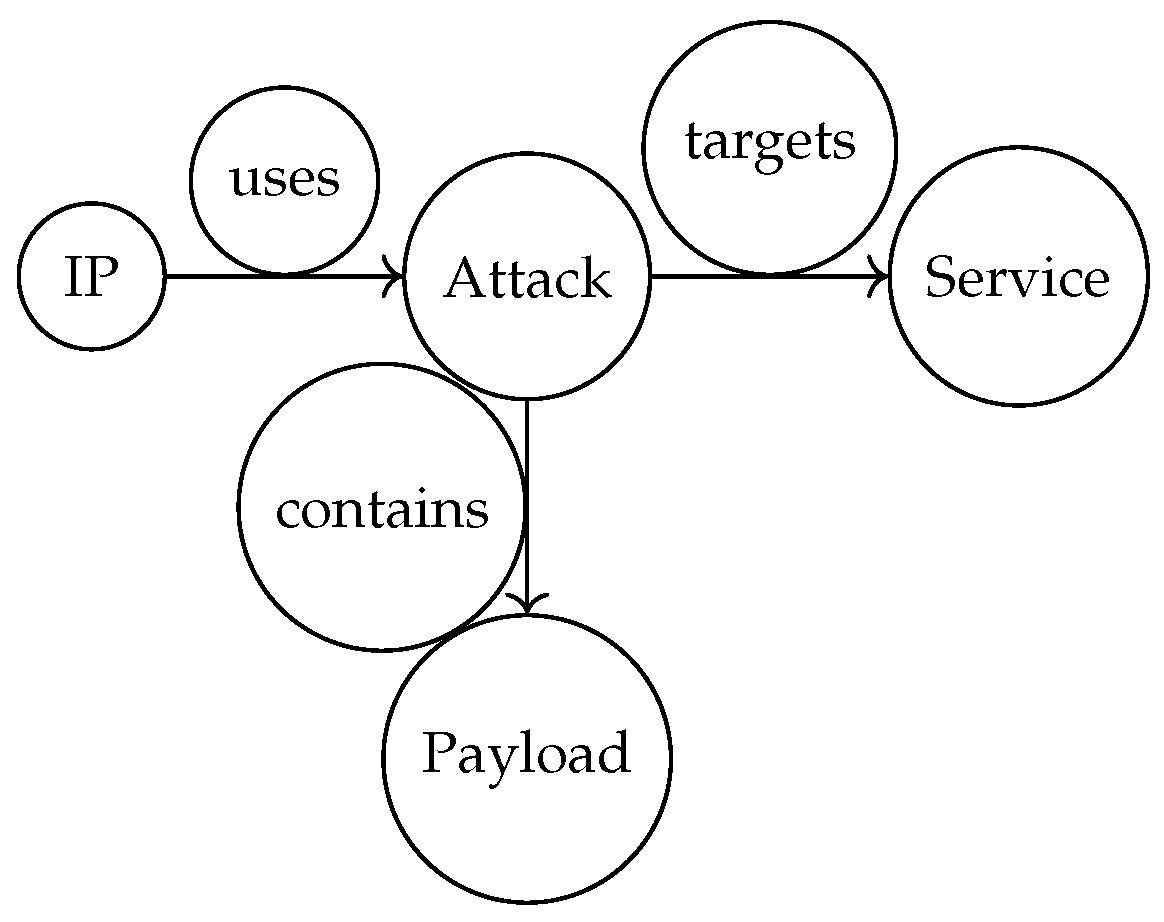
Figure 3.
Simplified attack pattern relationship graph in Neo4j.
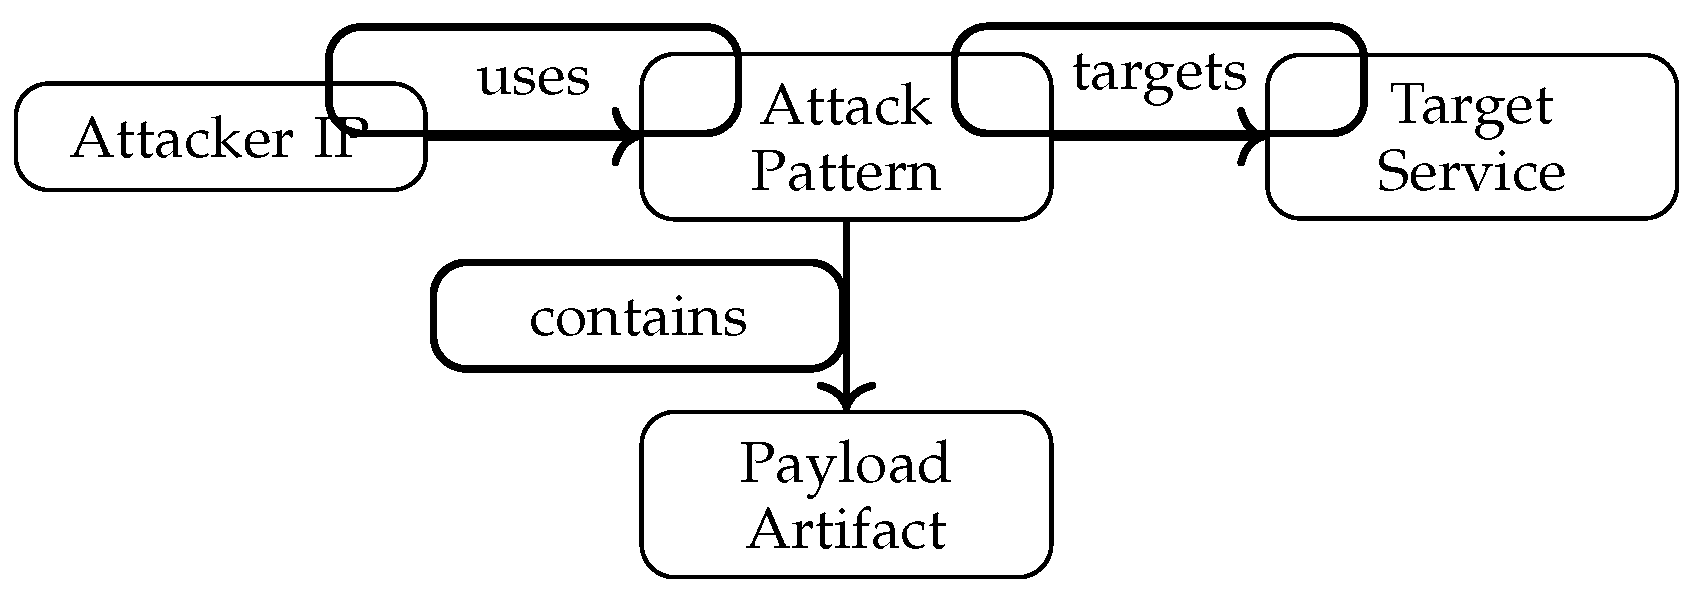
Figure 4.
Normalized frequency of attack types in the synthetic dataset.
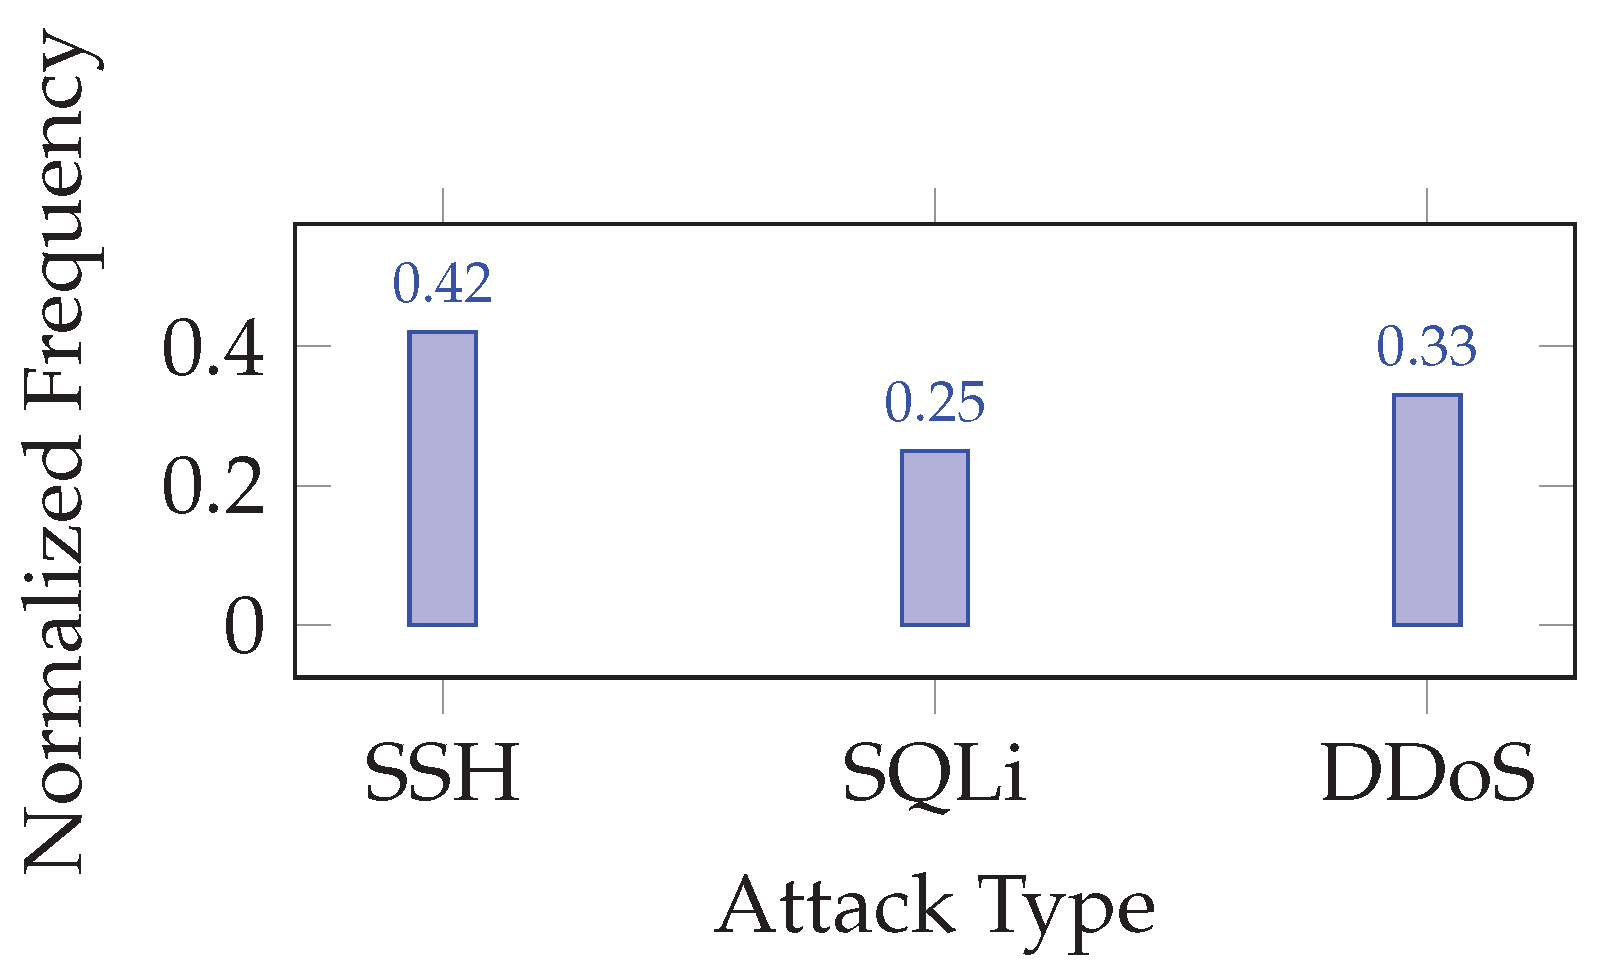

Table 1.
Synthetic Honeypot Attack Log Summary.
| Attack Type | Events | Avg. Payload Size (bytes) |
|---|---|---|
| SSH Brute-force | 530 | 420 |
| SQL Injection | 310 | 368 |
| DDoS Simulation | 450 | 295 |
Table 2.
Summary of Neo4j Graph Topology After Data Import.
| Entity Type | Node Count | Relationship Count |
|---|---|---|
| Identity (Attacker/Host) | 312 | 580 |
| AttackPattern (TTP) | 145 | 364 |
| ObservedData (Logs) | 1290 | 1190 |
| Service (Target) | 78 | 210 |
Table 3.
Average Query Execution Time (1000 Nodes, 2000 Edges).
| Query Type | Cypher Example | Time (ms) |
|---|---|---|
| Most Targeted Service | MATCH (a)-[r:targets]->(s) | 34 |
| Attack Chains per IP | MATCH p=(i)-[*]->(s) | 47 |
| Distinct Attack Patterns | MATCH (i)-[:uses]->(a) | 29 |
Disclaimer/Publisher’s Note: The statements, opinions and data contained in all publications are solely those of the individual author(s) and contributor(s) and not of MDPI and/or the editor(s). MDPI and/or the editor(s) disclaim responsibility for any injury to people or property resulting from any ideas, methods, instructions or products referred to in the content. |
© 2025 by the authors. Licensee MDPI, Basel, Switzerland. This article is an open access article distributed under the terms and conditions of the Creative Commons Attribution (CC BY) license (http://creativecommons.org/licenses/by/4.0/).
Copyright: This open access article is published under a Creative Commons CC BY 4.0 license, which permit the free download, distribution, and reuse, provided that the author and preprint are cited in any reuse.


