
Submitted:
22 December 2025
Posted:
23 December 2025
You are already at the latest version
Abstract
Leading-edge erosion of wind turbine blades caused by repeated raindrop impingement can significantly reduce power output and increase maintenance costs. This study develops a rain erosion atlas for Japan over 11 years from 2006 to 2016 based on CRIEPI-RCM-Era2 dataset. The NREL 5 MW, DTU 10 MW, and IEA 15 MW wind turbines were employed to evaluate the incubation time (erosion onset time) of commercial polyurethane-based coating at blade tip. Erosion progression was simulated using an empirical damage model that relates raindrop impingement and impact velocity to the incubation time. The rain erosion atlas reveals a clear correlation between wind turbine size and erosion risk: the NREL 5MW turbine shows the incubation time of 3–12 years, the DTU 10MW turbine 1–4 years, and the IEA 15MW turbine 0.5–2 years. Shorter incubation times are observed on the Pacific Ocean side, where annual precipitation is higher than on the Sea of Japan side. Additionally, the influence of coating degradation due to ultraviolet radiation was assessed using solar radiation data, revealing a further reduction in incubation time on the Pacific Ocean side. Finally, the potential of erosion-safe mode operation was examined, demonstrating its effectiveness in alleviating erosion progression.
Keywords:
wind turbine
; blades
; rain erosion
; wind energy
; Japan
; incubation time
1. Introduction
Leading-edge erosion is a major issue for wind turbine operators, causing higher costs for inspection, maintenance, and repair, as well as reduced annual energy production (AEP) due to degraded aerodynamic performance of the blades and increased down time [1,2]. There are strong emphases on understanding erosion mechanisms [2,3,4], advancing protective measures [2], establishing preventive strategies [1], and mapping environmental drivers that accelerate blade degradation [5,6,7,8,9]. Among environmental drivers such as rain, sand, hail, airborne particles, sea spray, insects etc., rain has been widely recognized as the primary cause of leading-edge erosion [10]. In Japan, where annual precipitation levels are two to three times higher than in Europe, concerns over accelerated erosion are particularly pronounced. The erosion risk is further heightened in floating offshore wind turbines, as their larger rotor diameters lead to higher blade tip speeds, exacerbating rain erosion progression.
The selection of optimal methods to mitigate the leading-edge erosion is critically dependent on the rate of damage accumulation at a given location. For a better understanding of regional variations in erosion progression, studies on the construction of rain erosion atlas—a geospatial visualization of erosion risk based on meteorological conditions—have been explored in Europe [5,6,7] and the United States [8]. Pugh et al. [5] developed a rain erosion atlas for Britain and Ireland, illustrating monthly erosion rates of blade tips in January and May, averaged over 20 years, with overlays marking areas of frequent hail. Verma et al. [6] proposed a probabilistic long-term framework for assessing site-specific blade coating lifetime. Their geographic bubble charts for 31 sites in the Netherlands reveal that coastal sites experience three times faster leading-edge erosion compared to inland sites. Hannesdottir et al. [7] constructed a rain erosion atlas for Scandinavia and Finland, based on numerical simulations of environmental conditions. They utilized ERA5 [11], a global reanalysis model, and NORA3 [12], a mesoscale hindcasting model for the erosion atlas constructions. Pryor et al. [8] estimated blade coating lifetimes at 883 sites across the United States using high-frequency (5-minute) meteorological measurements. Their time series analyses indicate that up to one-third of a blade coating's lifetime can be depleted within just 360 5-minute periods in the Southern Great Plains, highlighting erosion-safe mode operation as a cost-effective mitigation strategy.
In Japan, several wind energy-related atlases have been developed, mapping available energy resources [13] and potential lightning strike risks [14]. These atlases assist in wind turbine project planning and preparation by identifying areas of interest and potential lightning risks prior to project initiation. However, despite the existence of these atlases, rain erosion atlas capable of supporting decision-making for wind farm operators with respect to adoption/selection of erosion alleviation measures, has yet to be constructed.
The objective of this study is to provide the first rain erosion atlas for wind turbine blades in and around Japan. We employed the CRIEPI-RCM-Era2, a long-term high-resolution reproduction dataset [15] developed by our institute. This is because the dataset has been extensively used to evaluate hazards associated with meteorological disasters affecting power infrastructure, including transmission lines and towers in Japan. The rain erosion atlas was calculated for the NREL 5 MW [16], DTU 10 MW [6,17] and IEA 15 MW [18] reference wind turbines, integrating an erosion damage model. In this study, we employed the empirical impingement model [19], which is based on whirling arm rain erosion test data for a commercial polyurethane coating. The same protective coating is assumed to be applied to each wind turbine model. When raindrops impact the blade surface, plastic deformation of the coating material dominates, but no mass loss occurs during the incubation time. This is followed by the onset of mass loss as the number of impacting droplets increases. Since the incubation time (also referred to as an erosion onset time) is a critical parameter, this study estimates its value at the leading edge of wind turbine blade tips.
2. Materials and Methods
2.1. Meteorologial and Climate Dataset
The long-term high-resolution reproduction dataset CRIEPI-RCM-Era2 [15] was developed based on 53 years of weather and climate reproduction simulations over Japan (excluding some remote islands), spanning from September 1957 to December 2010. These simulations were conducted using the regional climate model NuWFAS-RCM [20], derived from the Advanced Research WRF [21]. To enhance the regional resolution of climate predictions, horizontal mesh size was set to 5 km. The simulation was conducted with a time step of 90 seconds, while the CRIEPI-RCM-Era2 dataset records data at hourly intervals. In the simulation, initial and boundary conditions were obtained from the ECMWF (European Centre for Medium-Range Weather Forecasts) reanalysis datasets, ERA-40 [22], and ERA-Interim [23]. The Kain–Fritsch scheme, Morrison 2-Moment scheme, YSU scheme, Noah-LSM scheme, RRTM scheme, and Dudhia scheme were employed in the reproduction simulations. Further details on the CRIEPI-RCM-Era2 can be found in the previous report [15]. The dataset has been expanded to include data up to August 2019.
In this study, hourly rainfall intensity and wind speed data were extracted from the CRIEPI-RCM-Era2 covering the 11-year period from 2006 to 2016 and subsequently used for the rain erosion atlas creation. In certain analyses, additional variables—global solar radiation and 2 meters height air temperature—were also utilized.
2.2. Raindrop Size Measurements
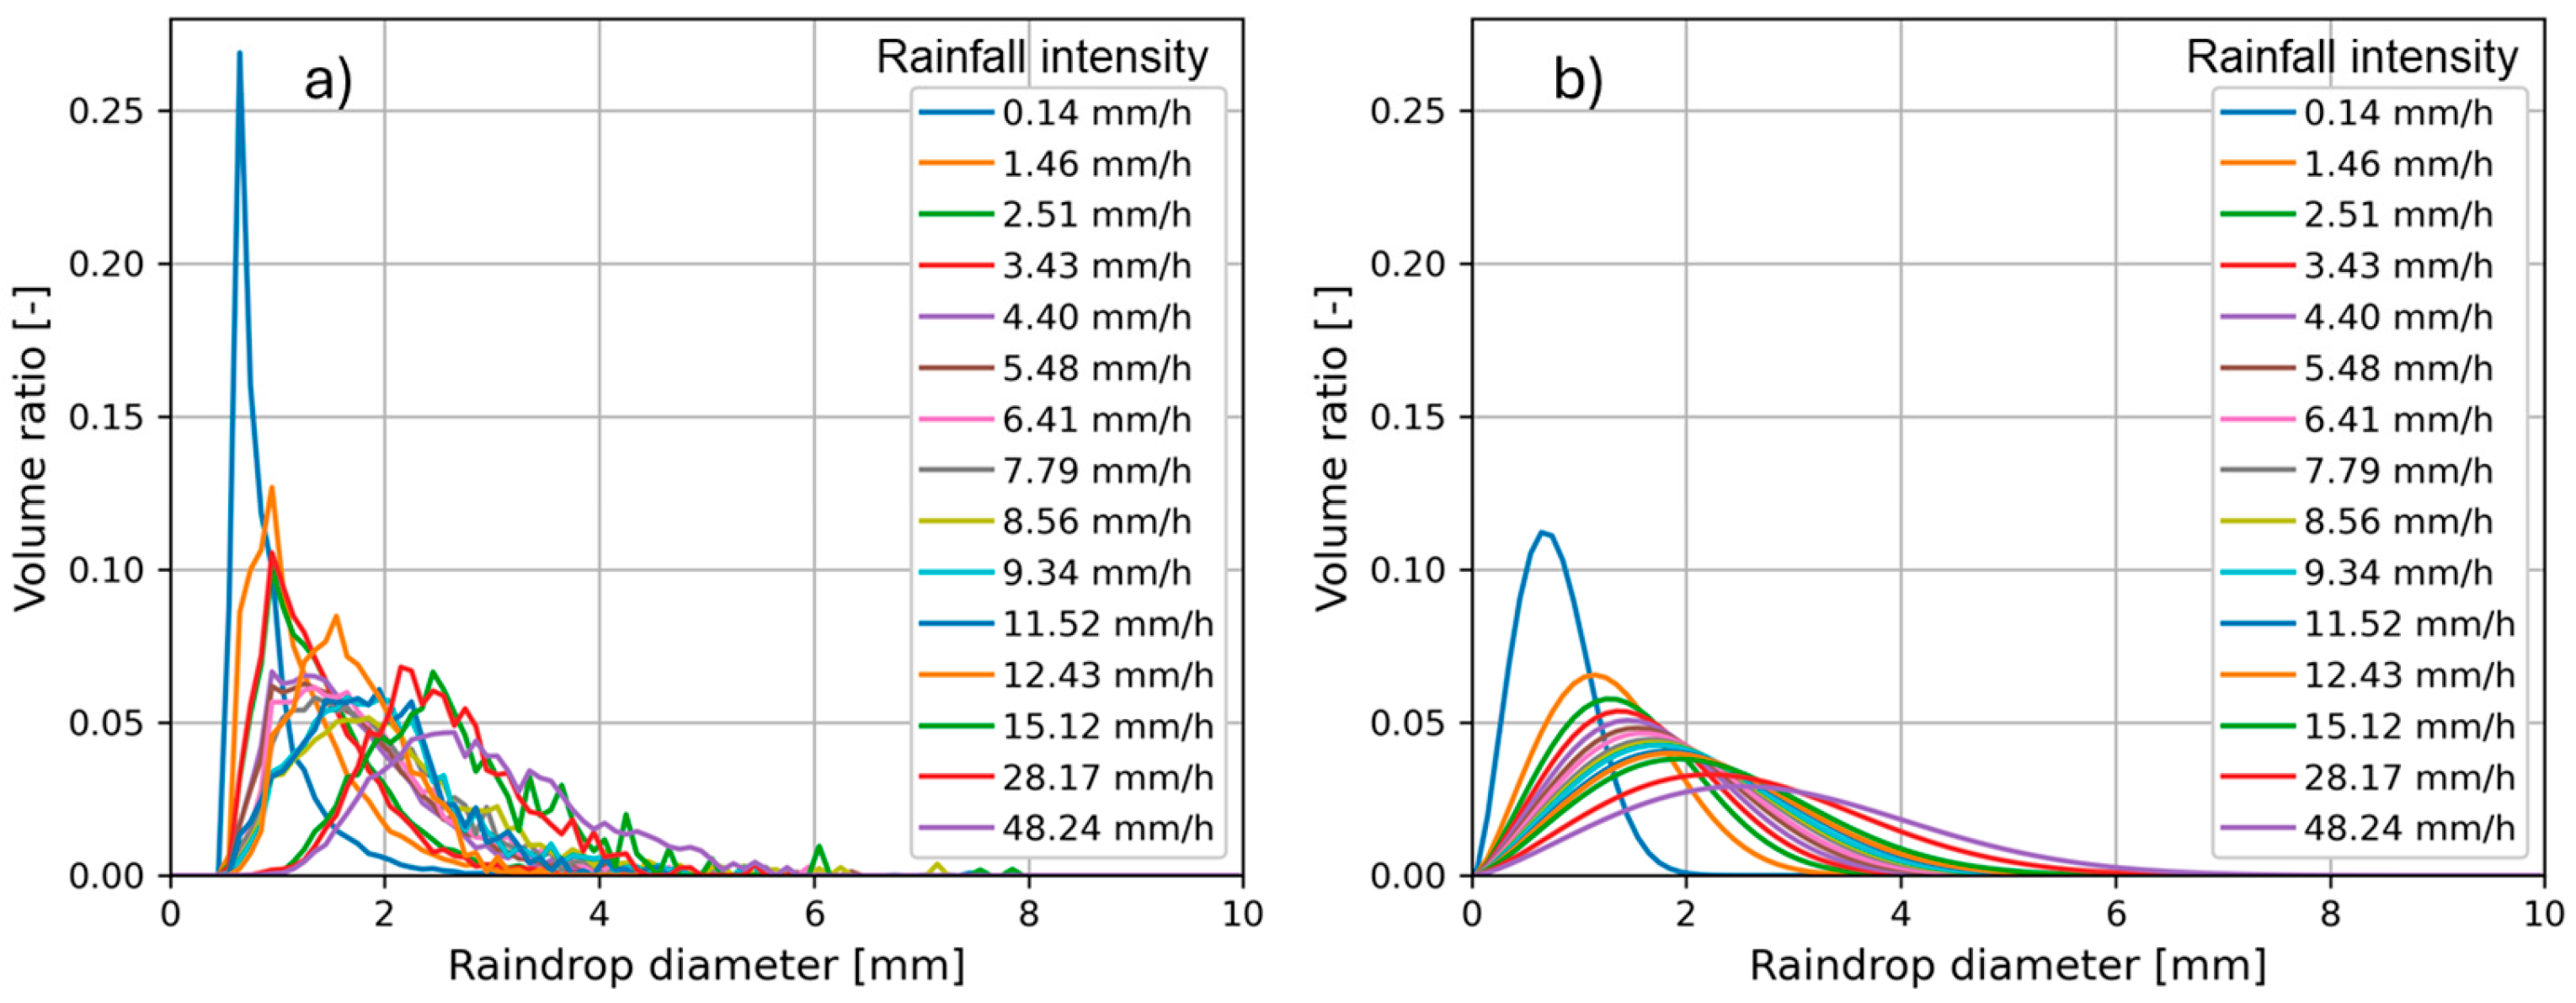
Raindrop size distribution is necessary for calculating rain erosion progression. Since the CRIEPI-RCM-Era2 does not contain rain drop size data, measurement data by one of the authors (Nanko) with a self-developed disdrometer [24] is utilized. The disdrometer has a lower measurement limit of 0.5 mm, and data were obtained from four locations in Japan: Tanashi in Tokyo (2003), Ogami in Okinawa (2007), and two sites in Tsukuba in Ibaraki (2007–2008). The measurement data were integrated and statistically processed to determine the probability density function (PDF) for a given rainfall intensity, Ir. To assess the influence of rain droplet size distribution on the erosion incubation time, the PDF derived from Best’s equation [25] was also utilized in Section 3.3. Figure 1 compares the raindrop size distributions for different rainfall intensities with those predicted by Best’s equation. The comparison reveals a consistent trend: larger raindrops are associated with higher rainfall intensities. However, the measured raindrop sizes tend to be smaller than those predicted by Best’s distribution at the same rainfall intensity.
2.3. Wind TURBINE Model
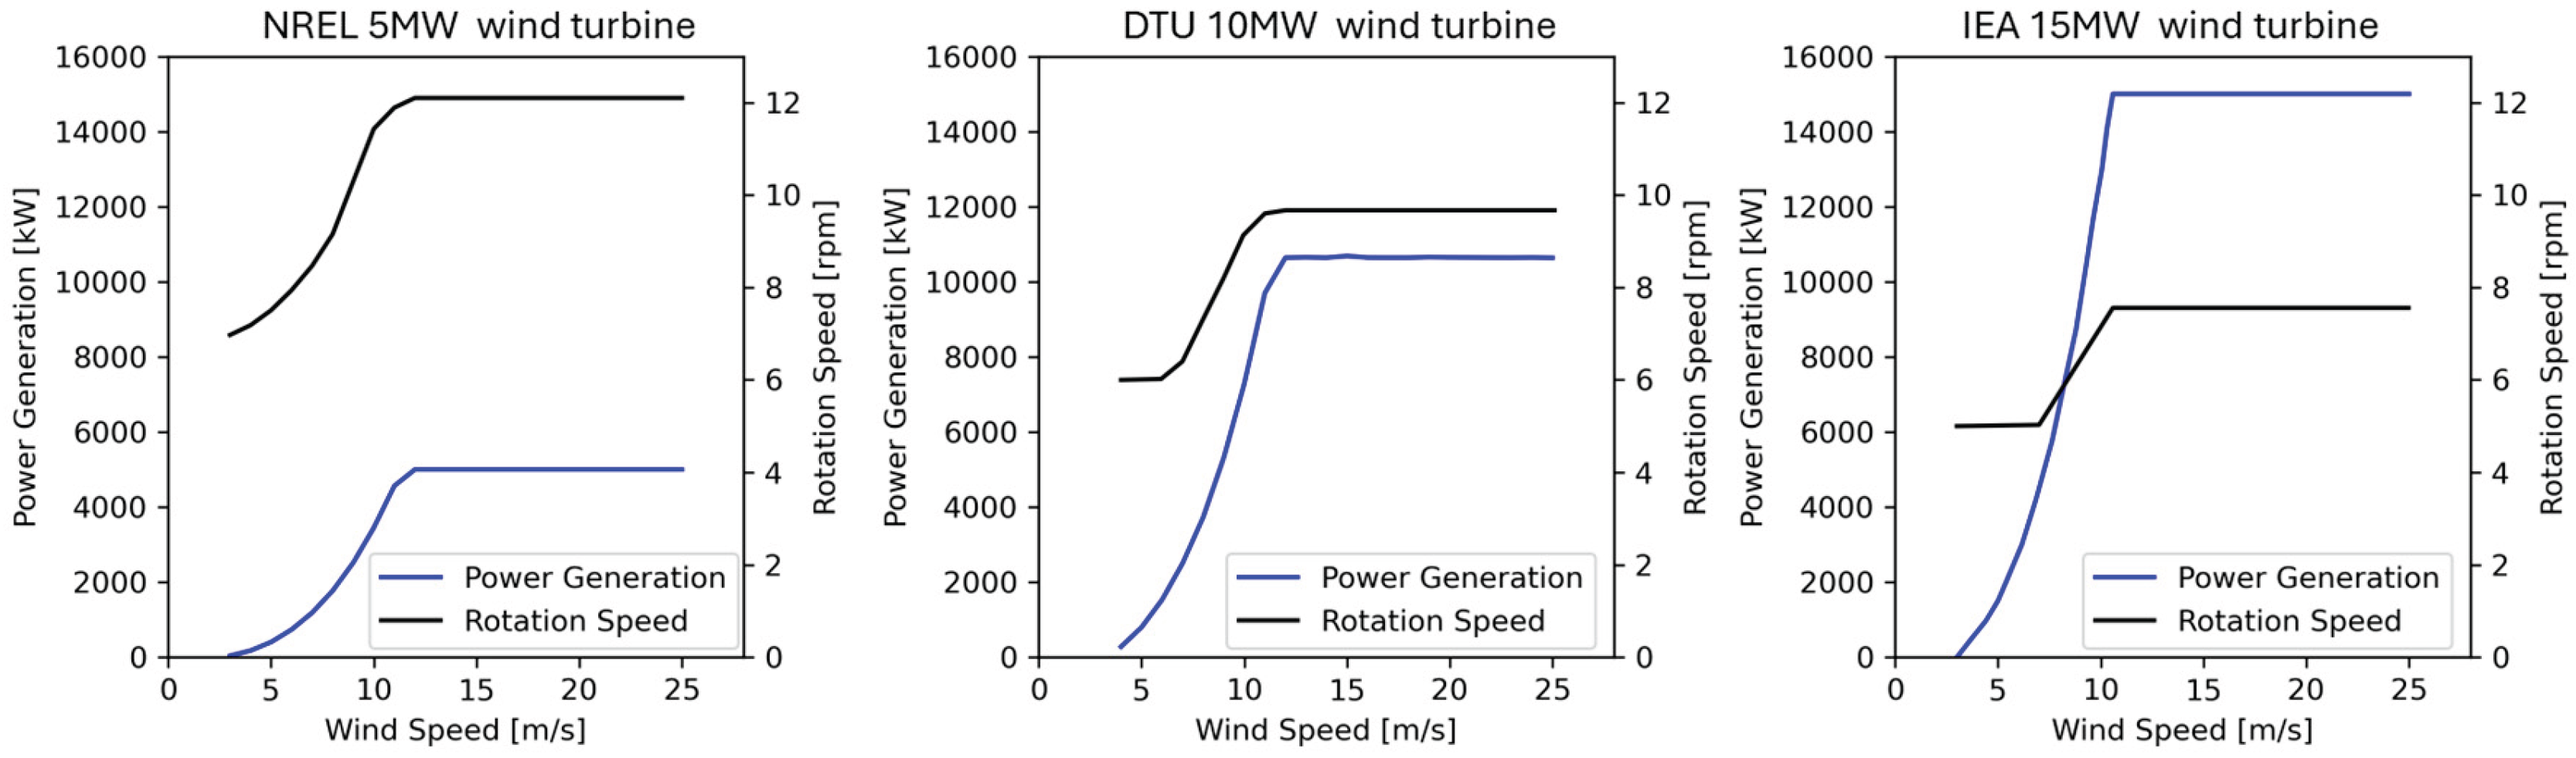
To assess the influence of wind turbine size on rain erosion progression, the NREL 5 MW, DTU 10 MW, and IEA 15 MW wind turbines were selected, as these reference models are commonly employed in similar studies [6,7]. The main specifications of each turbine are shown in Table 1, while Figure 2 illustrates power generation and rotor speed as a function of hub-height wind speed. As shown in Table 1 and Figure 2, increasing turbine rotor size corresponds to higher maximum blade tip speeds: 80 m/s for the NREL 5 MW turbine, 90 m/s for the DTU 10 MW turbine, and 95 m/s for the IEA 15 MW turbine, respectively. The relationships between hub-height wind speed and rotor rotation speed, and between rotor rotation speed and power generation were used to evaluate both power generation and erosion progression under site-specific wind and rainfall conditions derived from the CRIEPI-RCM-Era2.
2.4. Impingement Model for Incubation Time Calculations
The damage model we used in this study is the empirical impingement model proposed by Bech et al. [19]. The empirical model was derived based on the results of whirling arm rain erosion test (RET) at impact velocities from 90 to 150 m/s with four different rainfall setups generating mean droplet diameters of 0.76 mm (spray mode), 1.90 mm, 2.38 mm, and 3.50 mm. The end of the incubation time is determined by inspection of photographs captured inline at regular intervals throughout the tests. The test specimens consisted of glass fiber reinforced polymer (GFRP) substrates coated with a commercial polyurethane-based topcoat.
The erosion progression data is fitted to a power low function known as a VH curve, which correlates the rotor velocity, v, and drop size, d, to the impinged water column, H, representing the end of the incubation time.
The functions m(d) is defined as
The sifting parameter function, c(d) is defined with the expected impingement to damage for the tested drop sizes at 100m/s (H100) [19]. 100m/s is chosen as a reference velocity, because it is within the range of measurement data, and it is relatively close to tip speeds of modern large turbines.
where the correlation of H100(d) is fitted to a softsign function.
The fitted parameters for m(d), c(d) and H100(d) are as=-3.1, bs=8.9, d0=2.1, asH=-17.1 and d0H=2.3 for the erosion onset time of the commercial polyurethane-based coating [19].
2.5. Damage Calculation Based on CRIEPI-RCM-Era2
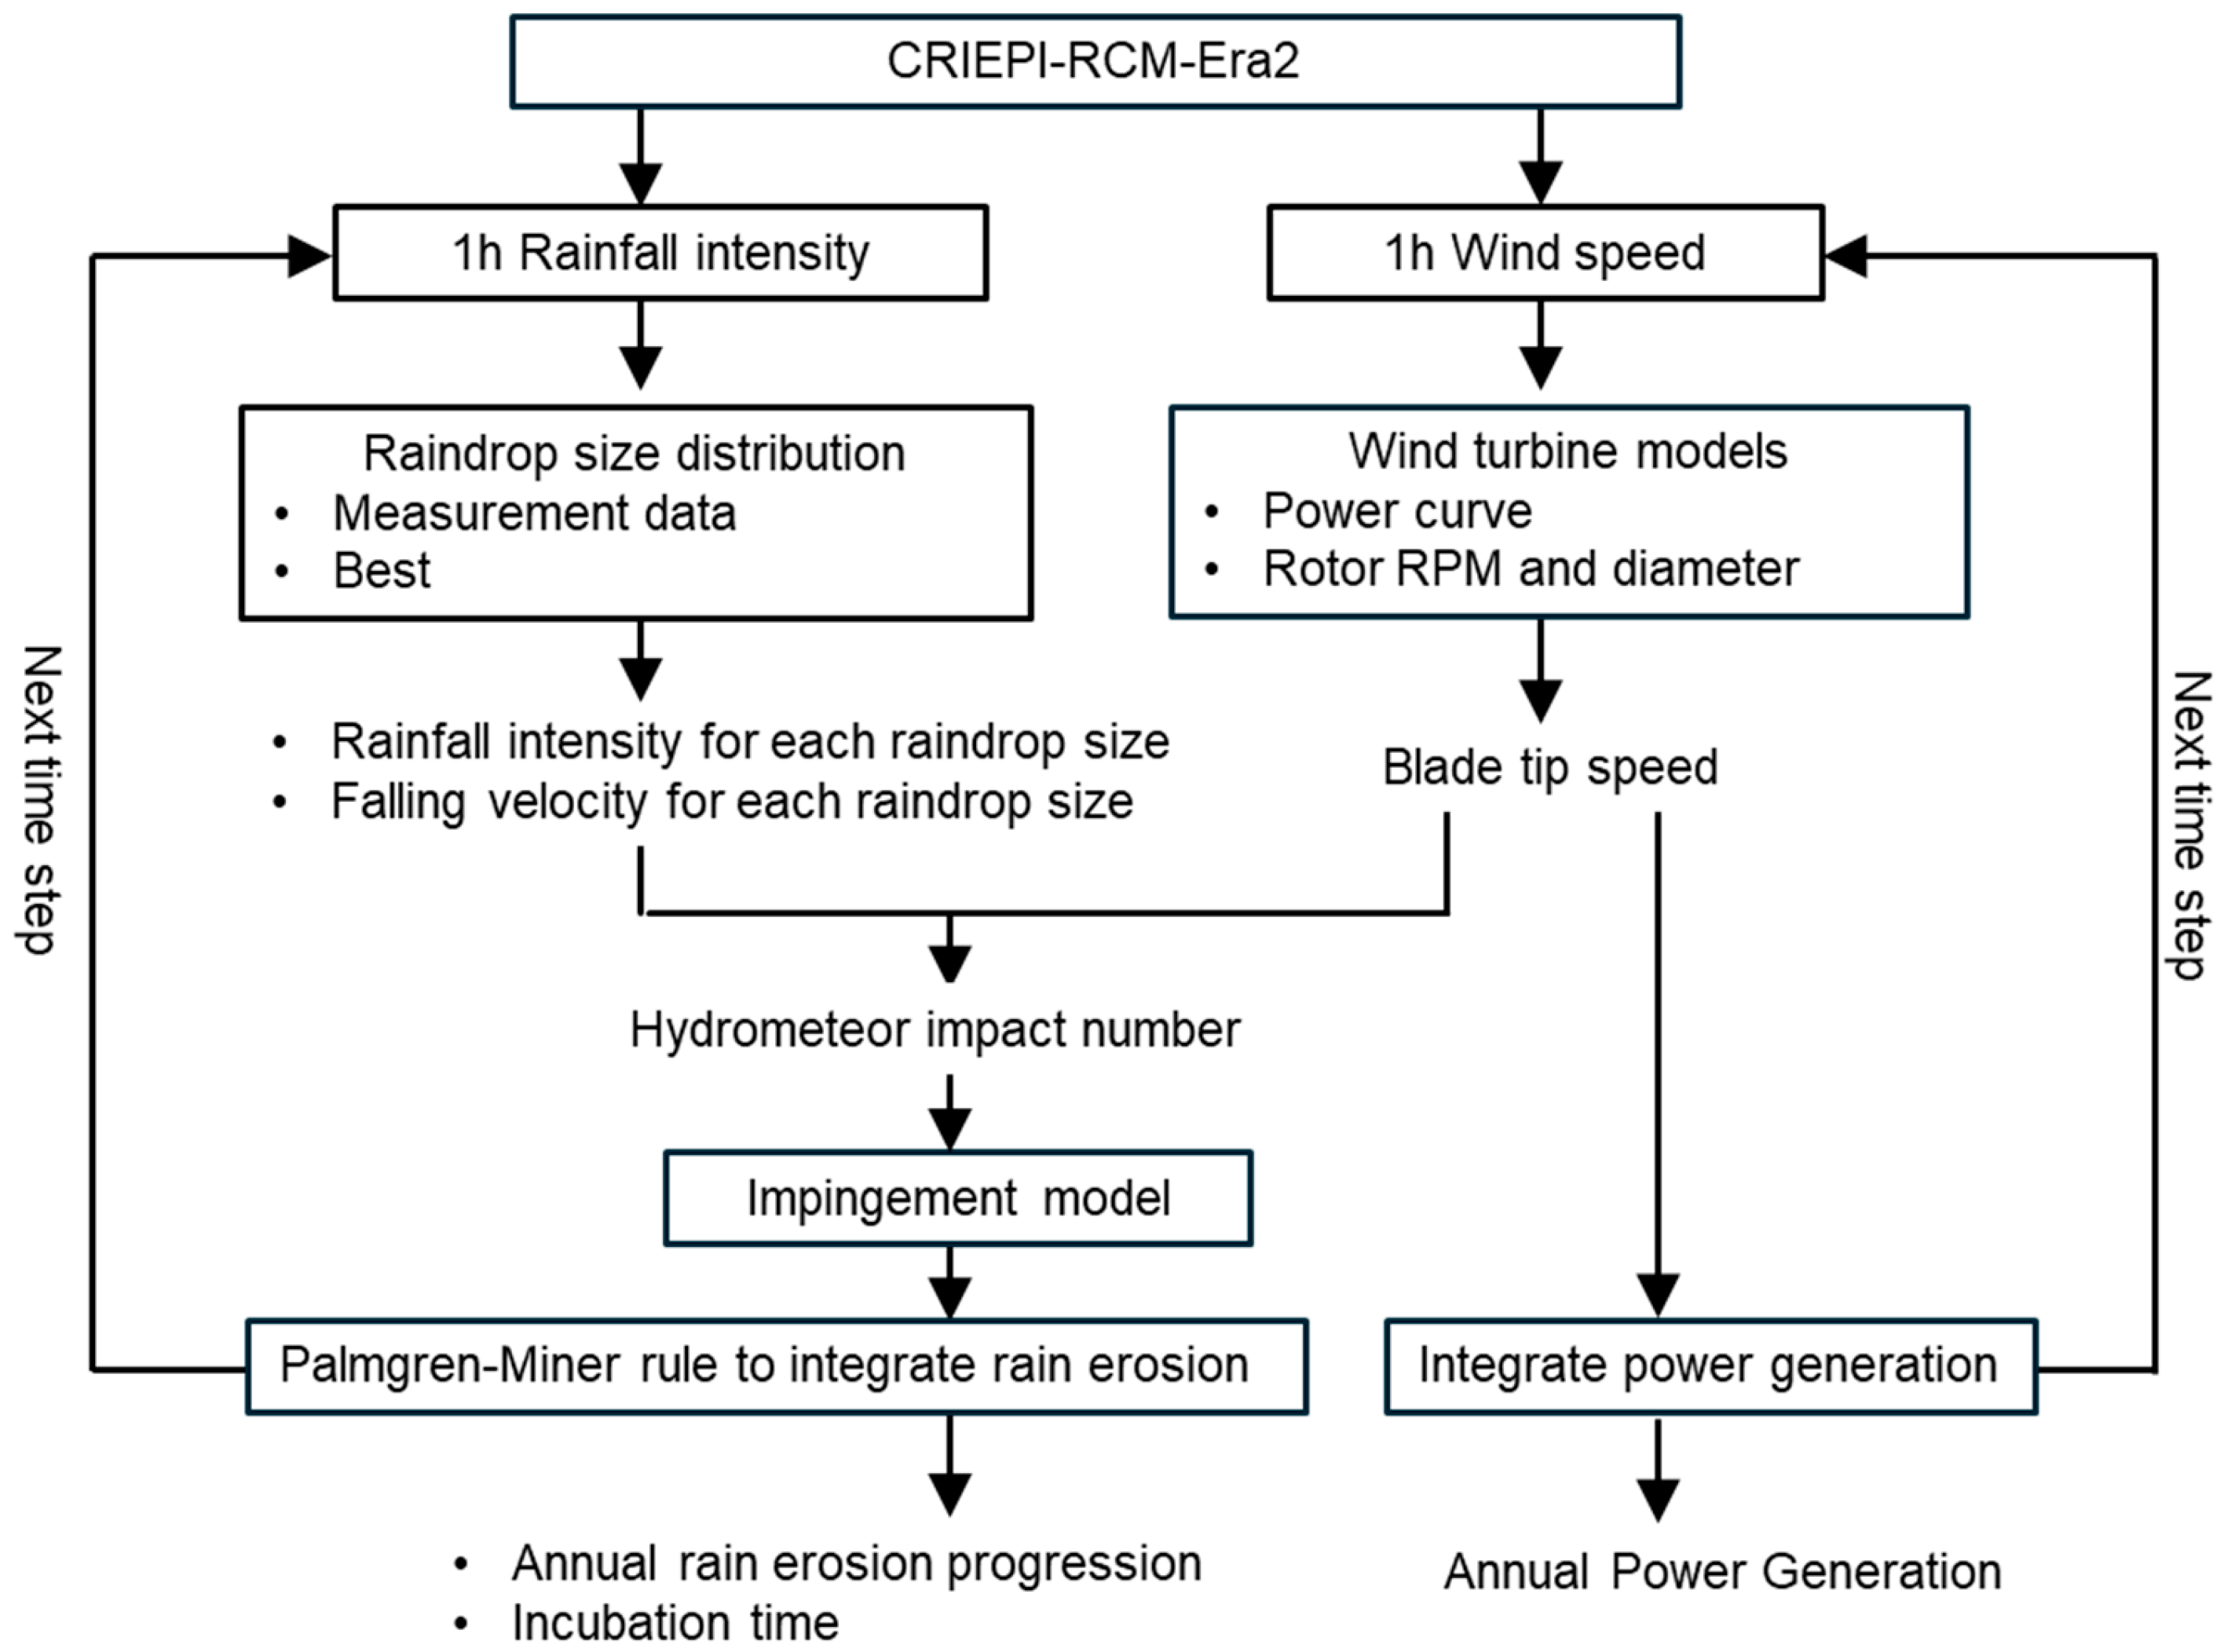
The methodology for erosion progression calculations is described in detail below, accompanied by a schematic workflow shown in Figure 3. Based on the raindrop size distributions shown in Figure 1, the hourly rainfall intensity from the CRIEPI-RCM-Era2, Ir, was allocated for each raindrop size with a resolution of d = 0.1 mm. Assuming spherical droplets with uniform diameter and constant falling velocity, the number of rain droplets per volume, N(d), can be expressed analytically as [1]:
where Ir(d) represents the rainfall intensity for a given droplet size. vr (d) is falling velocity, which depends on the rain drop size [6] (defined in mm in equation (6))
Assuming that a blade moves vertically from bottom to top through the rain, the number of impacts per unit projected area per time, F, can be expressed as:
where v(d) is relative velocity between the blade tip and rain (i.e., the impact velocity). That is calculated as [6]:
where vb is the blade tip speed, given by:
In the equation above, D represents the rotor diameter, while N denotes the rotor rotation speed for a corresponding hub-height wind speed, as provided in Figure 1.
From equations (5) and (7), impingement on the blade tip during rainfall for each raindrop size is calculated simply as:
Damage calculations follow the Palmgren-Miner rule as suggested in [1] and an accumulated rain erosion progression (accumulated distance to failure, ADF) is obtained by
where k is the number of time steps (96,432 hours in 11 years), while dmin and dmax represent the minimum and maximum raindrop diameters, respectively (dmin = 0.5 mm, dmax = 7.95 mm). The drop size, d, increases in increments of 0.1 mm. When ADF = 1, this indicates the end of the incubation time, but the aerodynamic performance is virtually unaffected. The annually averaged rain erosion progression was calculated by dividing ADF by the number of years (i.e., ADF /11). The annually averaged incubation time was defined as the inverse of this progression. In addition, year-by-year erosion progression was computed, and its standard deviation over 11 years was calculated to evaluate interannual variability.
The CRIEPI-RCM-Era2 has wind speeds at the height of 10, 30, 60, 100, 150 m. The hub-height wind speed for the NREL 5 MW and DTU 10 MW turbines are linearly interpolated. For the IEA 15 MW turbine, the 150 meter-height wind speed from the CRIEPI-RCM-Era2 was used directly as the hub-height wind speed.
In this study, all precipitation was assumed to be rainfall. However, in Section 3.4, we also examined differences in the progression of rain erosion by briefly distinguishing between rainfall and snowfall based on the 2-meter height air temperature. Hail was not considered in this study.
Figure 3.
Flowchart to calculate erosion progression based on the meteorological dataset.
3. Results
3.1. Comparison of Meteorological Data at Two Weather Stations
The accuracy of the CRIEPI-RCM-Era2 was assessed by comparing its output with meteorological data obtained from Japan's Automated Meteorological Data Acquisition System (AMeDAS) at 143 meteorological stations across Japan over a 20-year period (1991–2010). Averaged over all stations, the discrepancies amounted to 81 mm in annual mean precipitation and 1.2 m/s in annual mean wind speed [15]. In this study, the CRIEPI-RCM-Era2 dataset was validated against AMeDAS observations at two coastal stations—Choshi and Noshiro—over the period 2014–2016. These locations were selected because they are designated as Japanese promotion zones for offshore wind power [24]. The locations of these stations are indicated by blue dots in Figure 4. The red dots in Figure 4 show the locations where the incubation time was assessed in detail, as presented in Figure 8, Figure 15 and Figure 16.
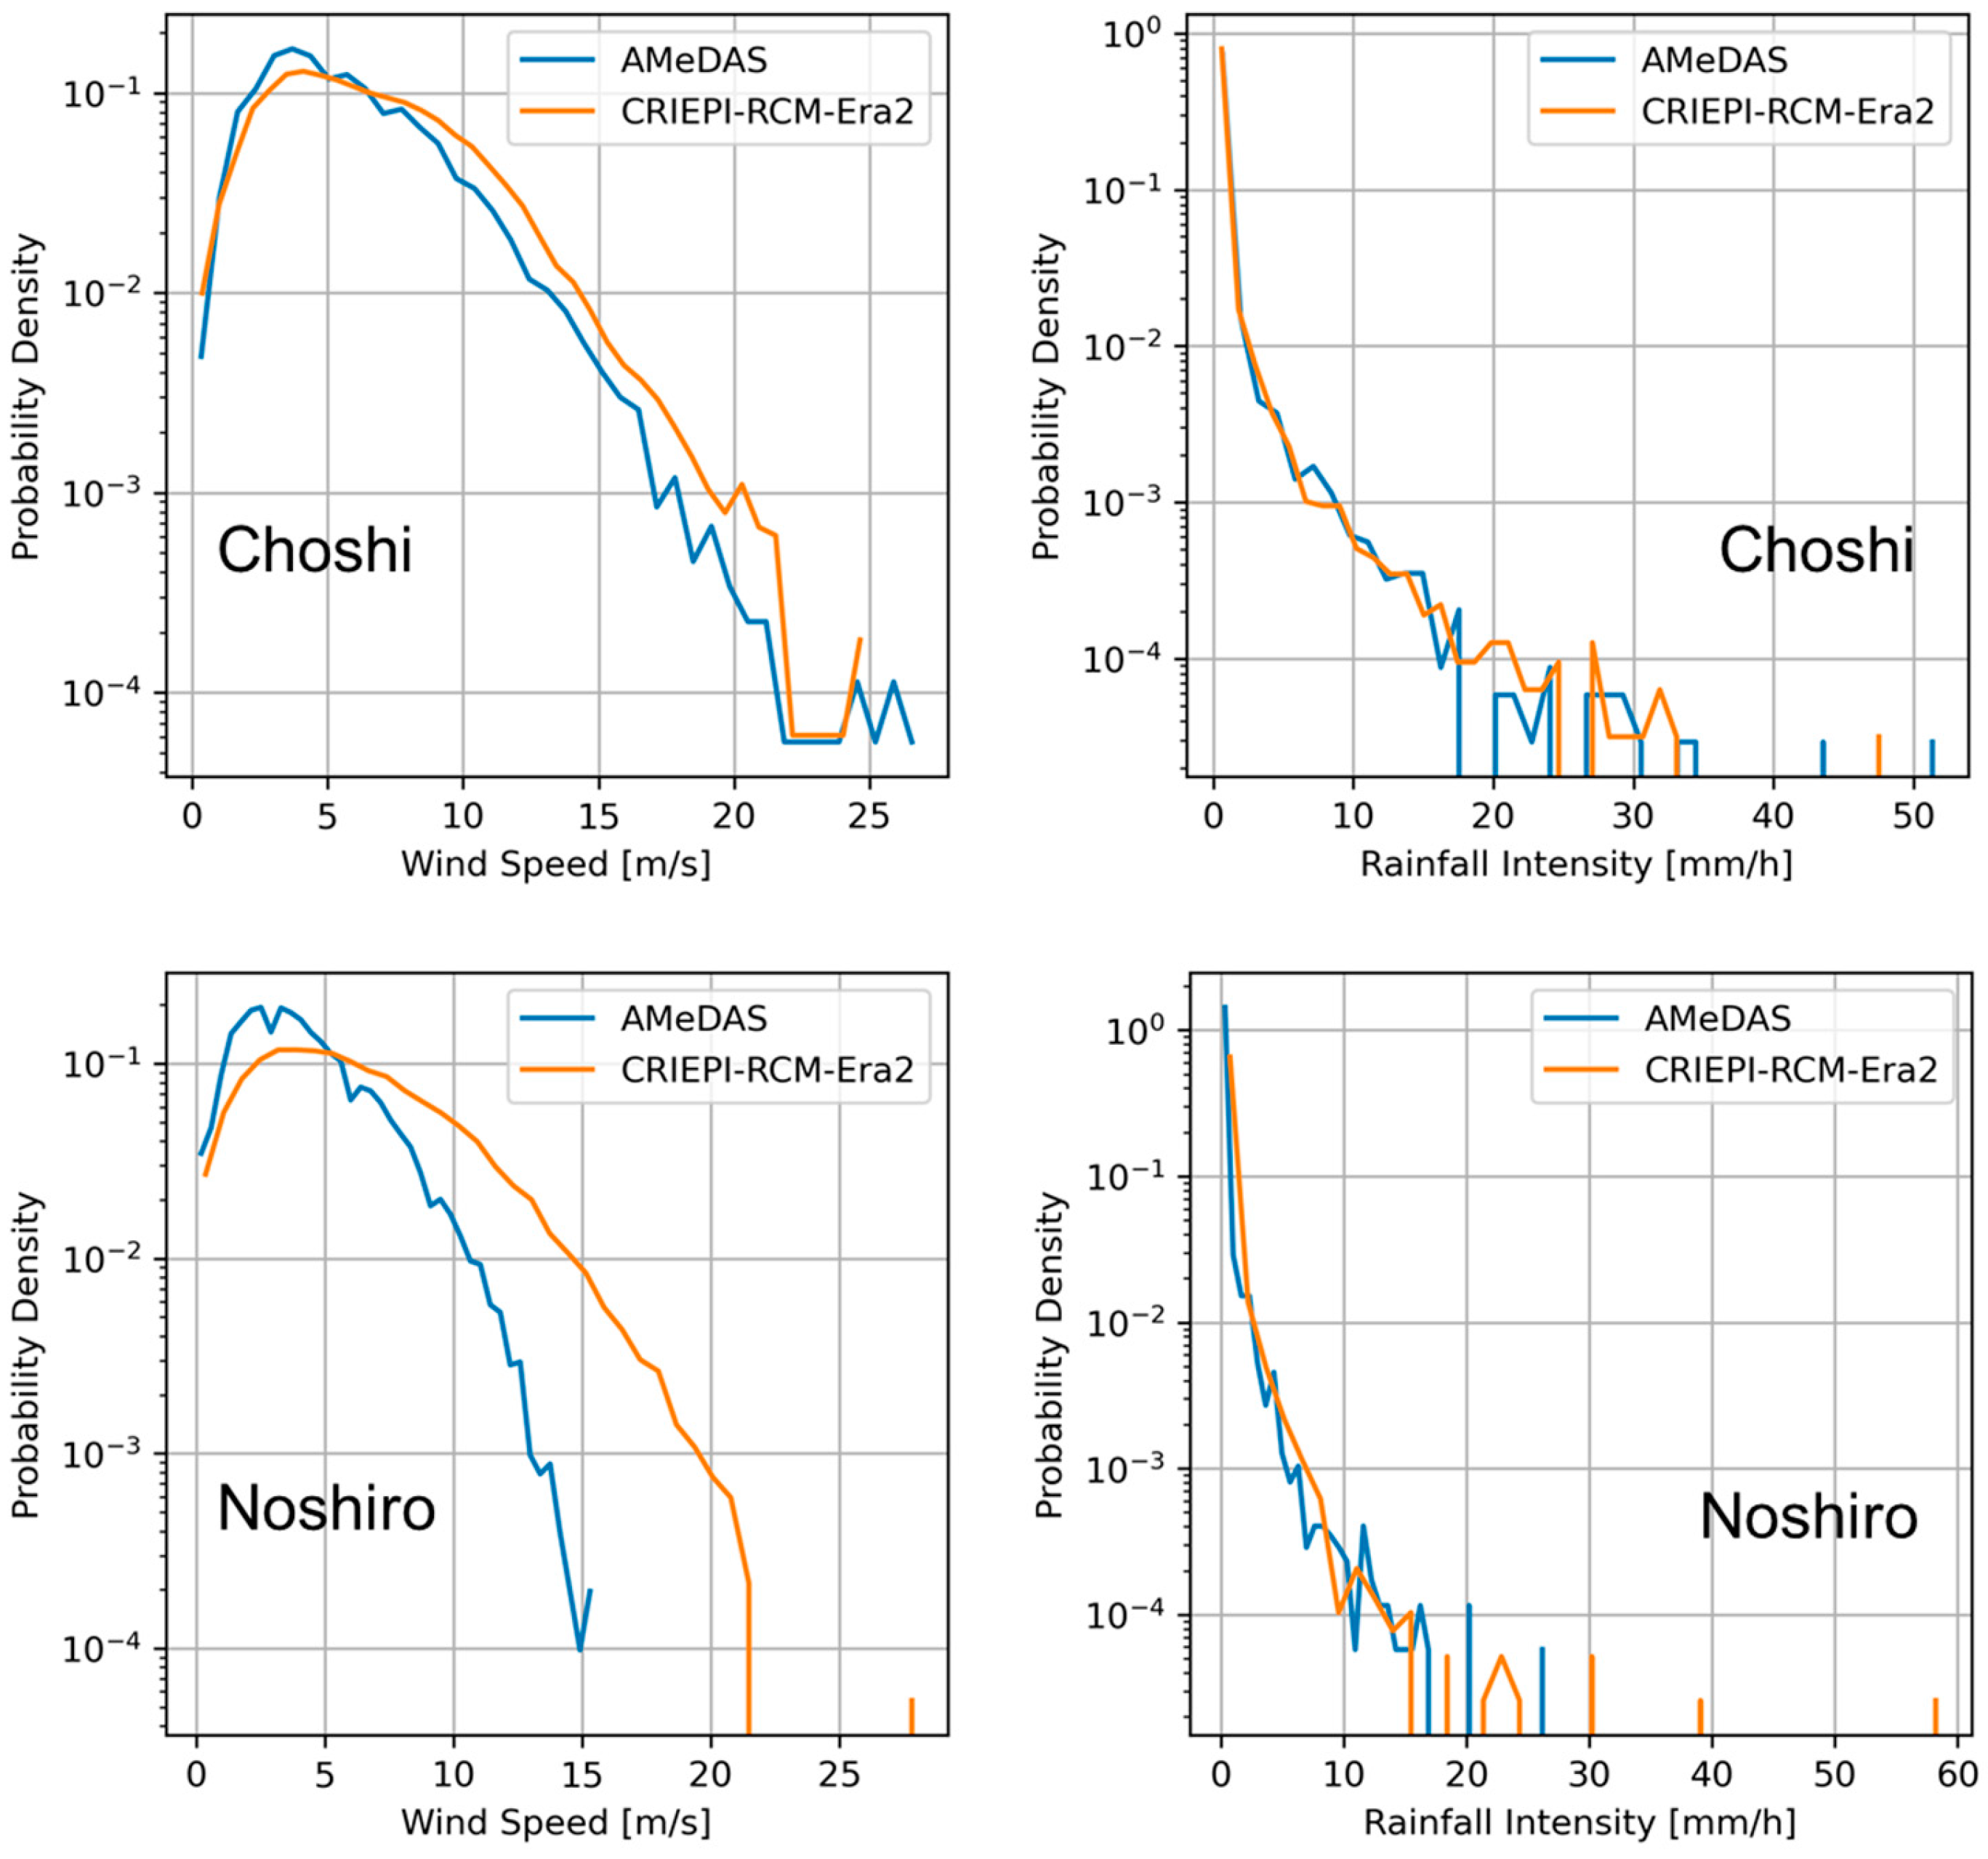
Figure 5 shows wind speed and rainfall intensity comparisons between the CRIEPI-RCM-Era2 and the AMeDAS. Rainfall intensity from the CRIEPI-RCM-Era2 agrees well with the AMeDAS observations. Wind speed histograms are also similar, though the CRIEPI-RCM-Era2 tends to overestimate the probability density at higher wind speeds. Although there is room for further quantitative refinement, especially in wind speed prediction, the CRIEPI-RCM-Era2 successfully captures qualitative wind speed trends and quantitatively reproduces rainfall intensity. This makes it suitable for analyzing regional and seasonal rain erosion characteristics across Japan.
Figure 4.
Locations of AMeDAS observation stations (blue dots).
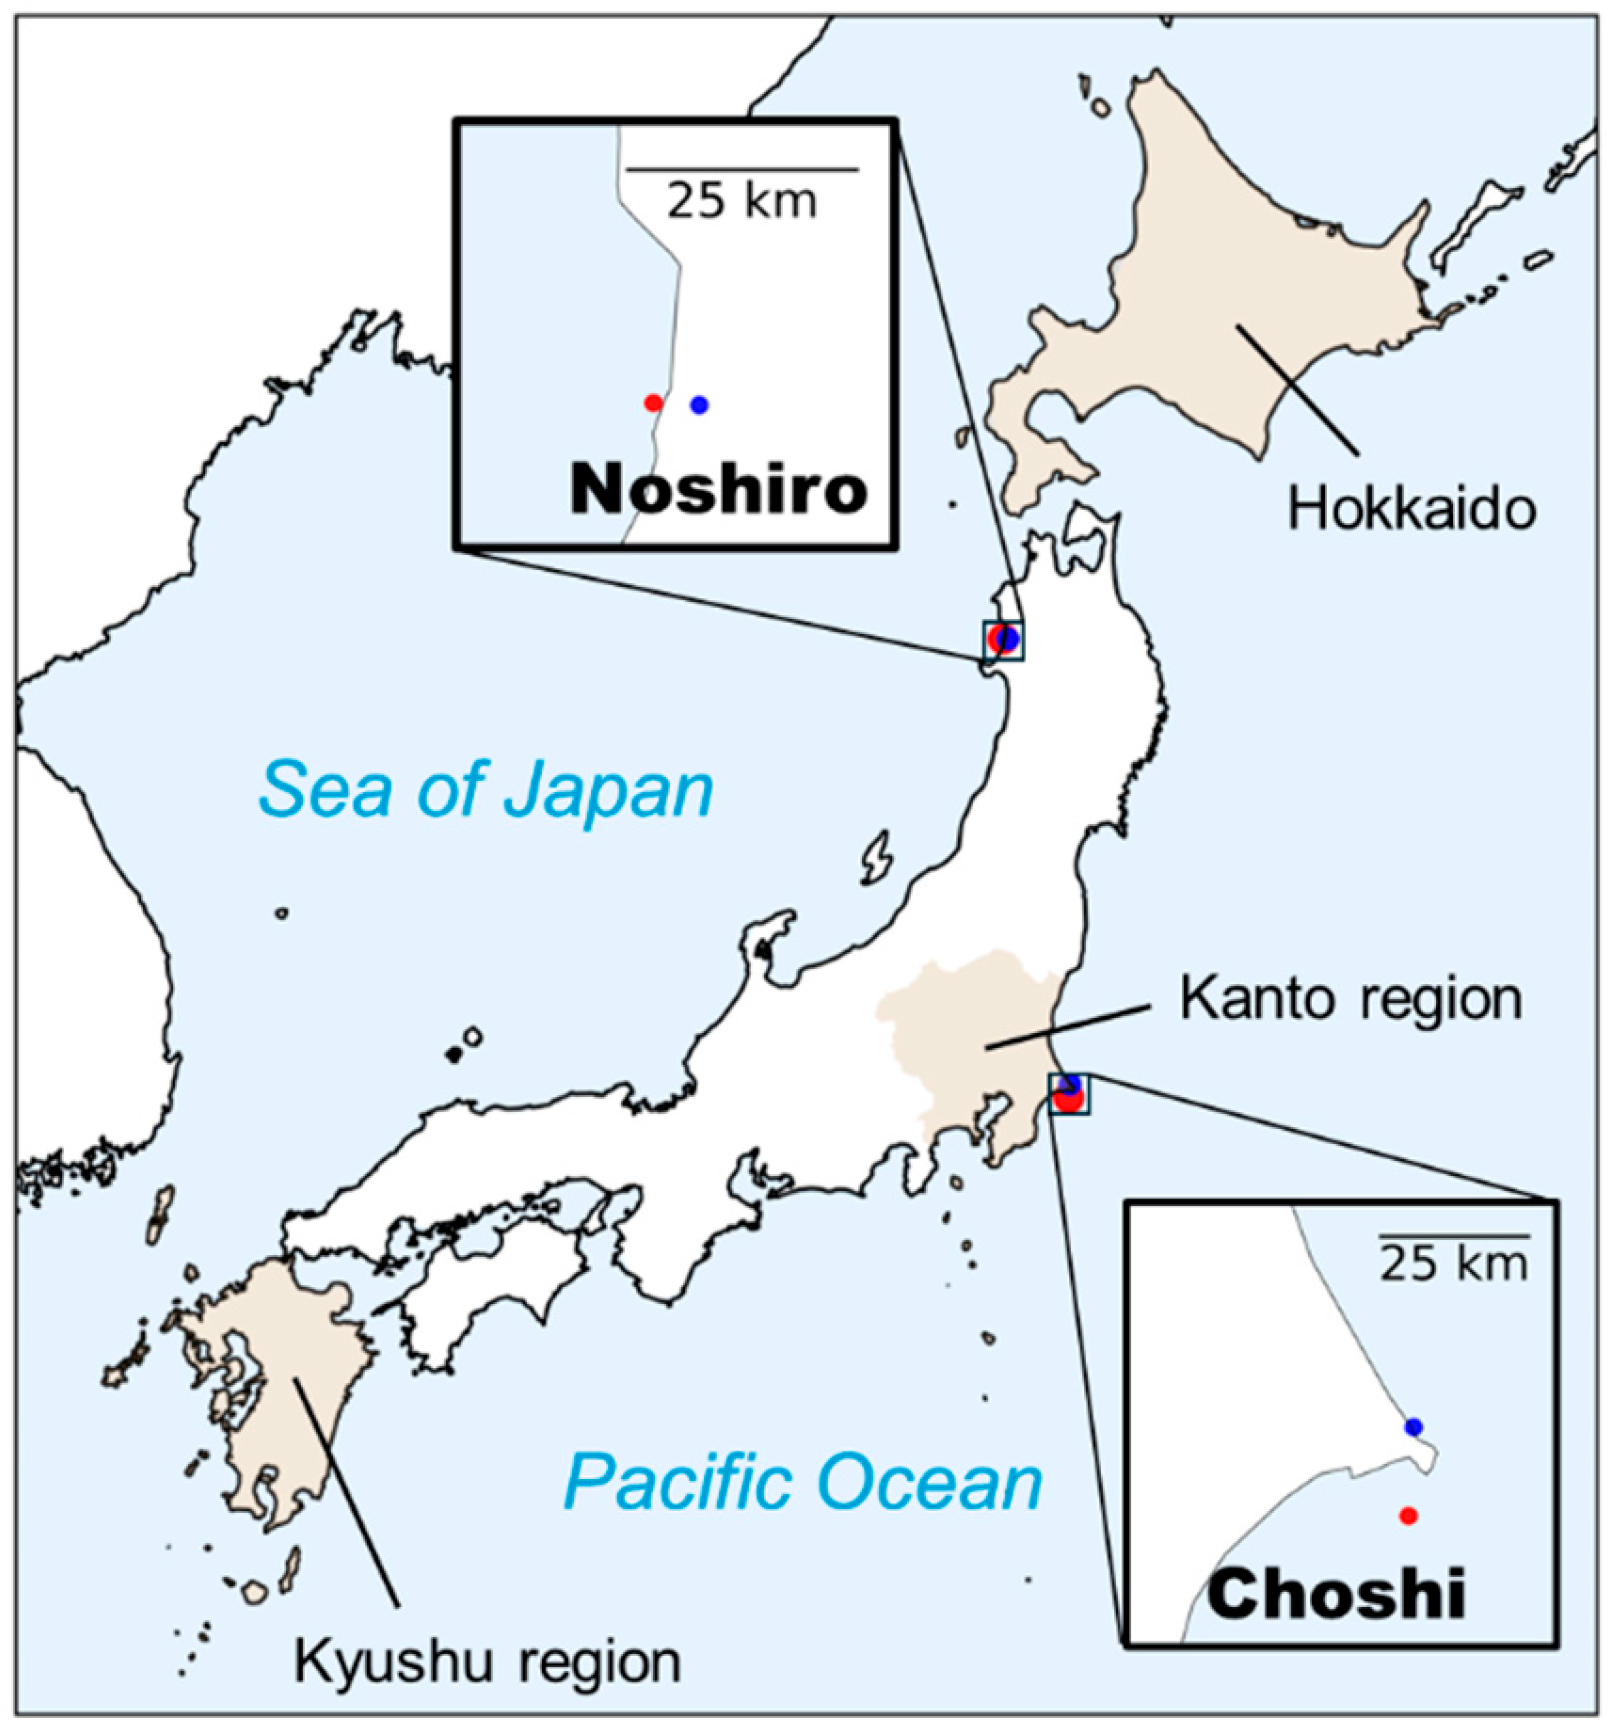
Figure 5.
Comparison of wind speed and rainfall intensity between CRIEPI-RCM-Era2 and AMeDAS at Choshi (top) and Noshiro (bottom).
Figure 5.
Comparison of wind speed and rainfall intensity between CRIEPI-RCM-Era2 and AMeDAS at Choshi (top) and Noshiro (bottom).
3.2. Rain Erosion Atlas Based on CRIEPI-RCM-Era2
Figure 6 shows the annual mean wind speed at a height of 100 m above ground level and the annual precipitation. In Figure 6a), high wind speeds are observed offshore in the Pacific Ocean from Hokkaido to Kanto region. Over land, areas of elevated wind speed correspond to mountainous regions. The overall wind speed distribution shows good agreement with the wind resource maps published by NEDO [13]. Figure 6b) reveals that annual precipitation is notably high over the Pacific Ocean and in land regions facing the Sea of Japan.
Figure 6.
Annual mean wind speed at 100 m height and annual precipitation.
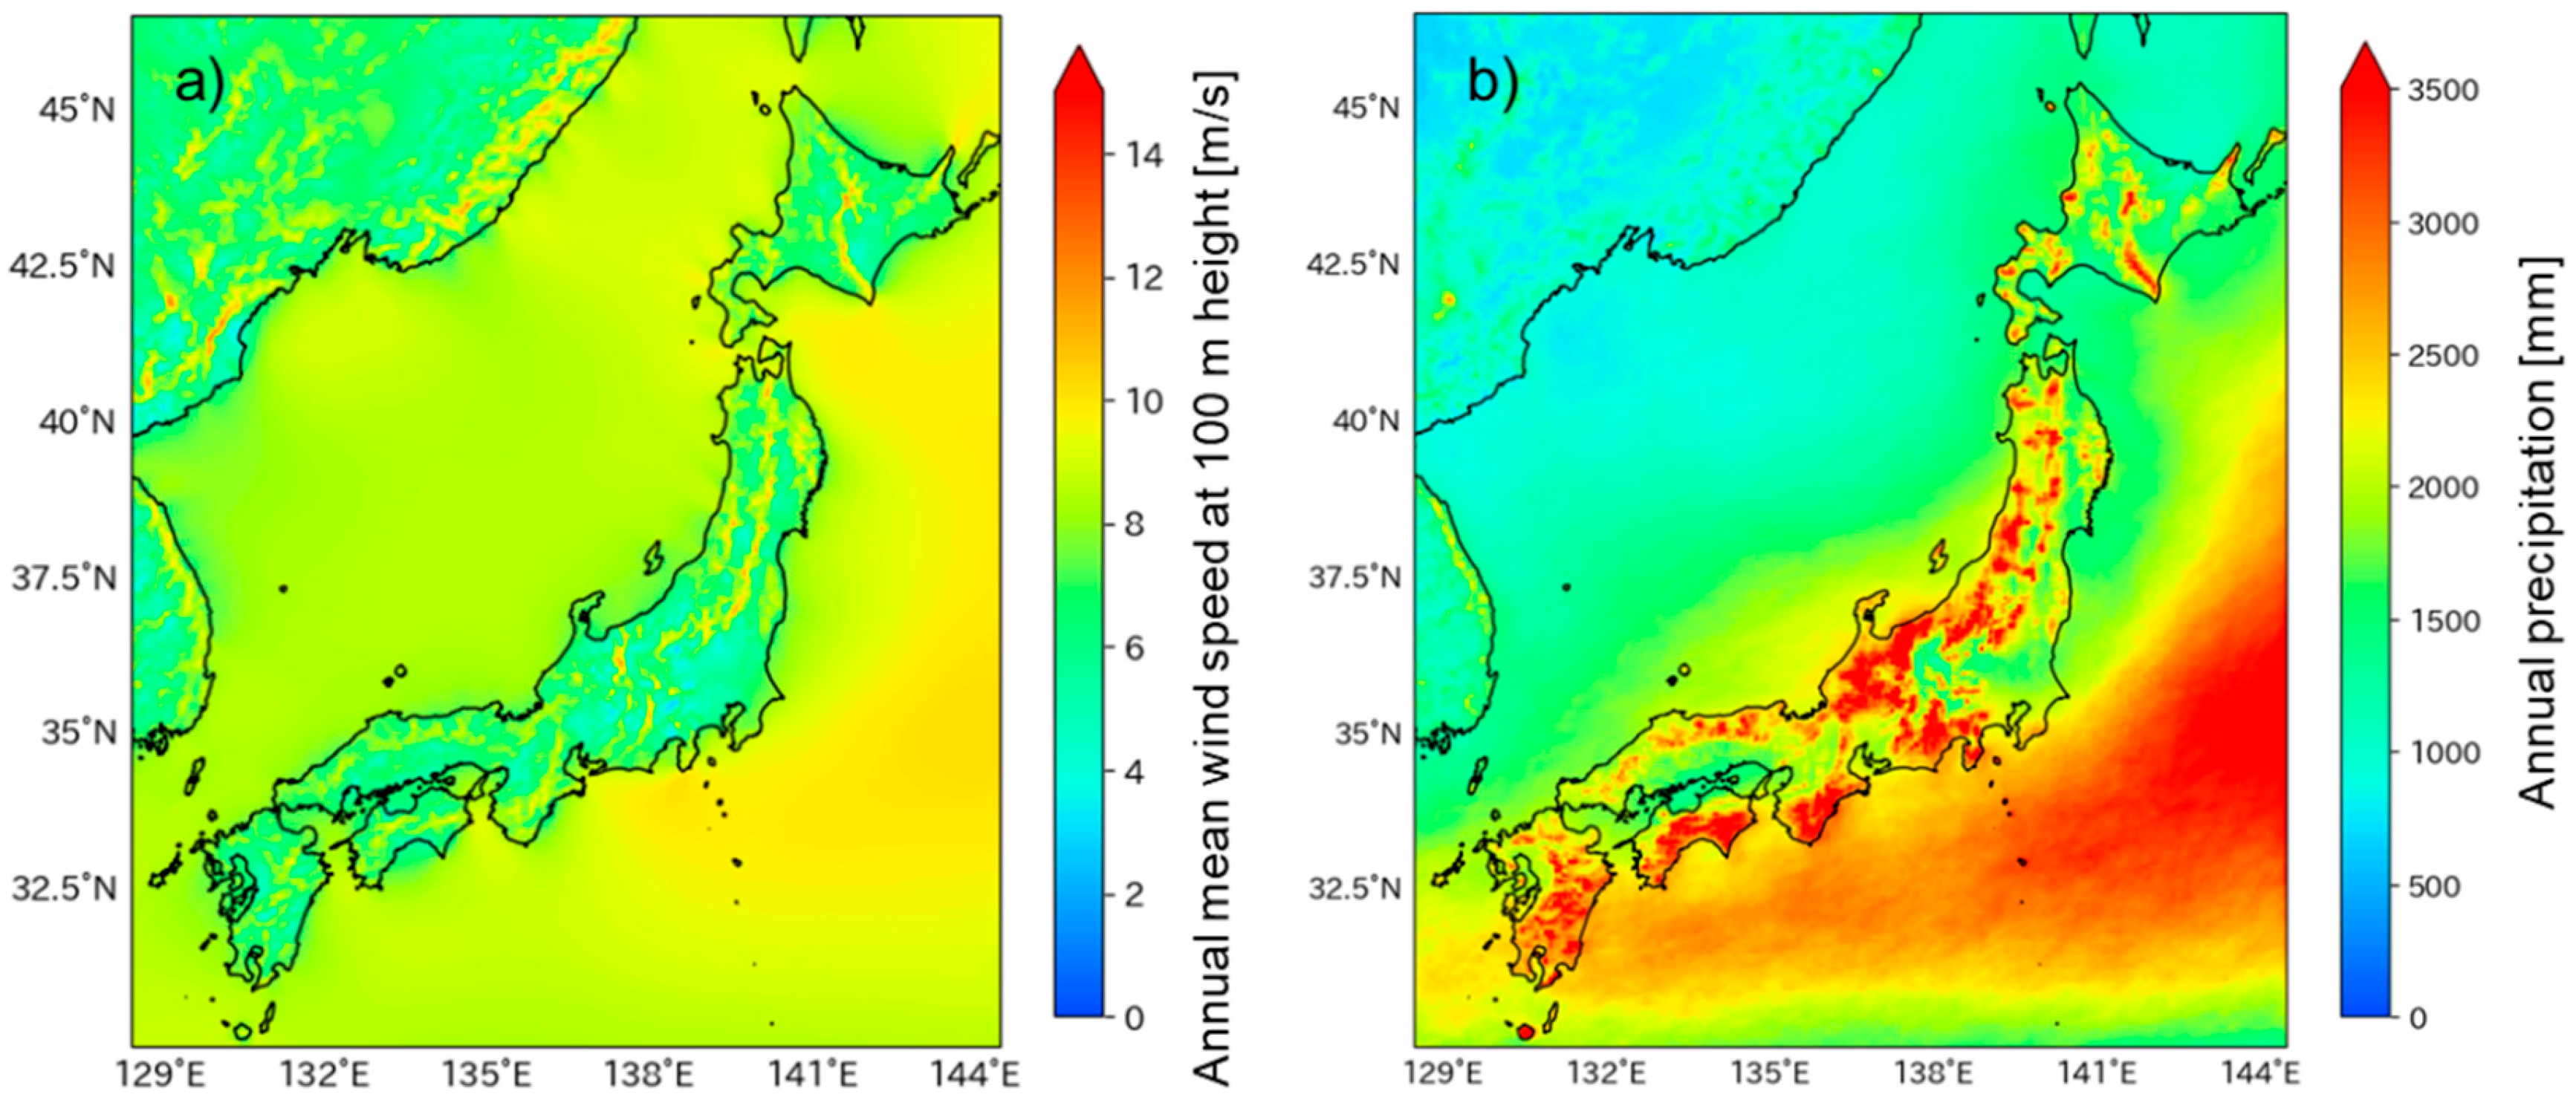
Figure 7 presents the incubation time for three reference wind turbines showing both the yearly averaged values and their standard deviations. The bottom figures of Figure 7 show annual energy production (AEP) for each wind turbine. a), b) and c) correspond to NREL 5 MW, DTU 10 MW and IEA 15 MW wind turbines. As illustrated in Figure 7a) (top), rain erosion progression exhibits clear regional variation. Shorter incubation times are observed on the Pacific Ocean side, from Kanto region to Kyushu, compared to the Sea of Japan side and Hokkaido. This trend corresponds to the differences in annual precipitation shown in Figure 6b). The spatial consistency between regions of shorter incubation time and higher annual precipitation suggests that precipitation plays a critical role in accelerating rain erosion progression. The reliability of the erosion atlas is notably supported by the highly accurate precipitation predictions of the CRIEPI-RCM-Era2 shown in Figure 5.
In Figure 7 (bottom) the annual power production increases with wind turbine size. In contrast, Figure 7 (top) shows that incubation time is inversely correlated with wind turbine size. For the NREL 5 MW wind turbine, the incubation time ranges from approximately 3 to over 12 years. In contrast, the DTU 10 MW wind turbine exhibits a reduced range of around 1 to 4 years. The IEA 15 MW wind turbine shows the shortest incubation time, between 0.5 and 2 years. Compared to the incubation time of approximately 1.5 to 5 years for the IEA 15 MW wind turbine in Scandinavia peninsula [7], the incubation time in Figure 7c) is notably shorter. This discrepancy might come from Japan’s higher annual precipitation levels (Figure 6b) relative to those in Northern Europe.
Figure 7.
Incubation time (top: average, middle: standard deviation) and annual power generation (bottom) (a: NREL 5 MW, b: DTU 10 MW and c: IEA 15 MW wind turbines).
Figure 7.
Incubation time (top: average, middle: standard deviation) and annual power generation (bottom) (a: NREL 5 MW, b: DTU 10 MW and c: IEA 15 MW wind turbines).
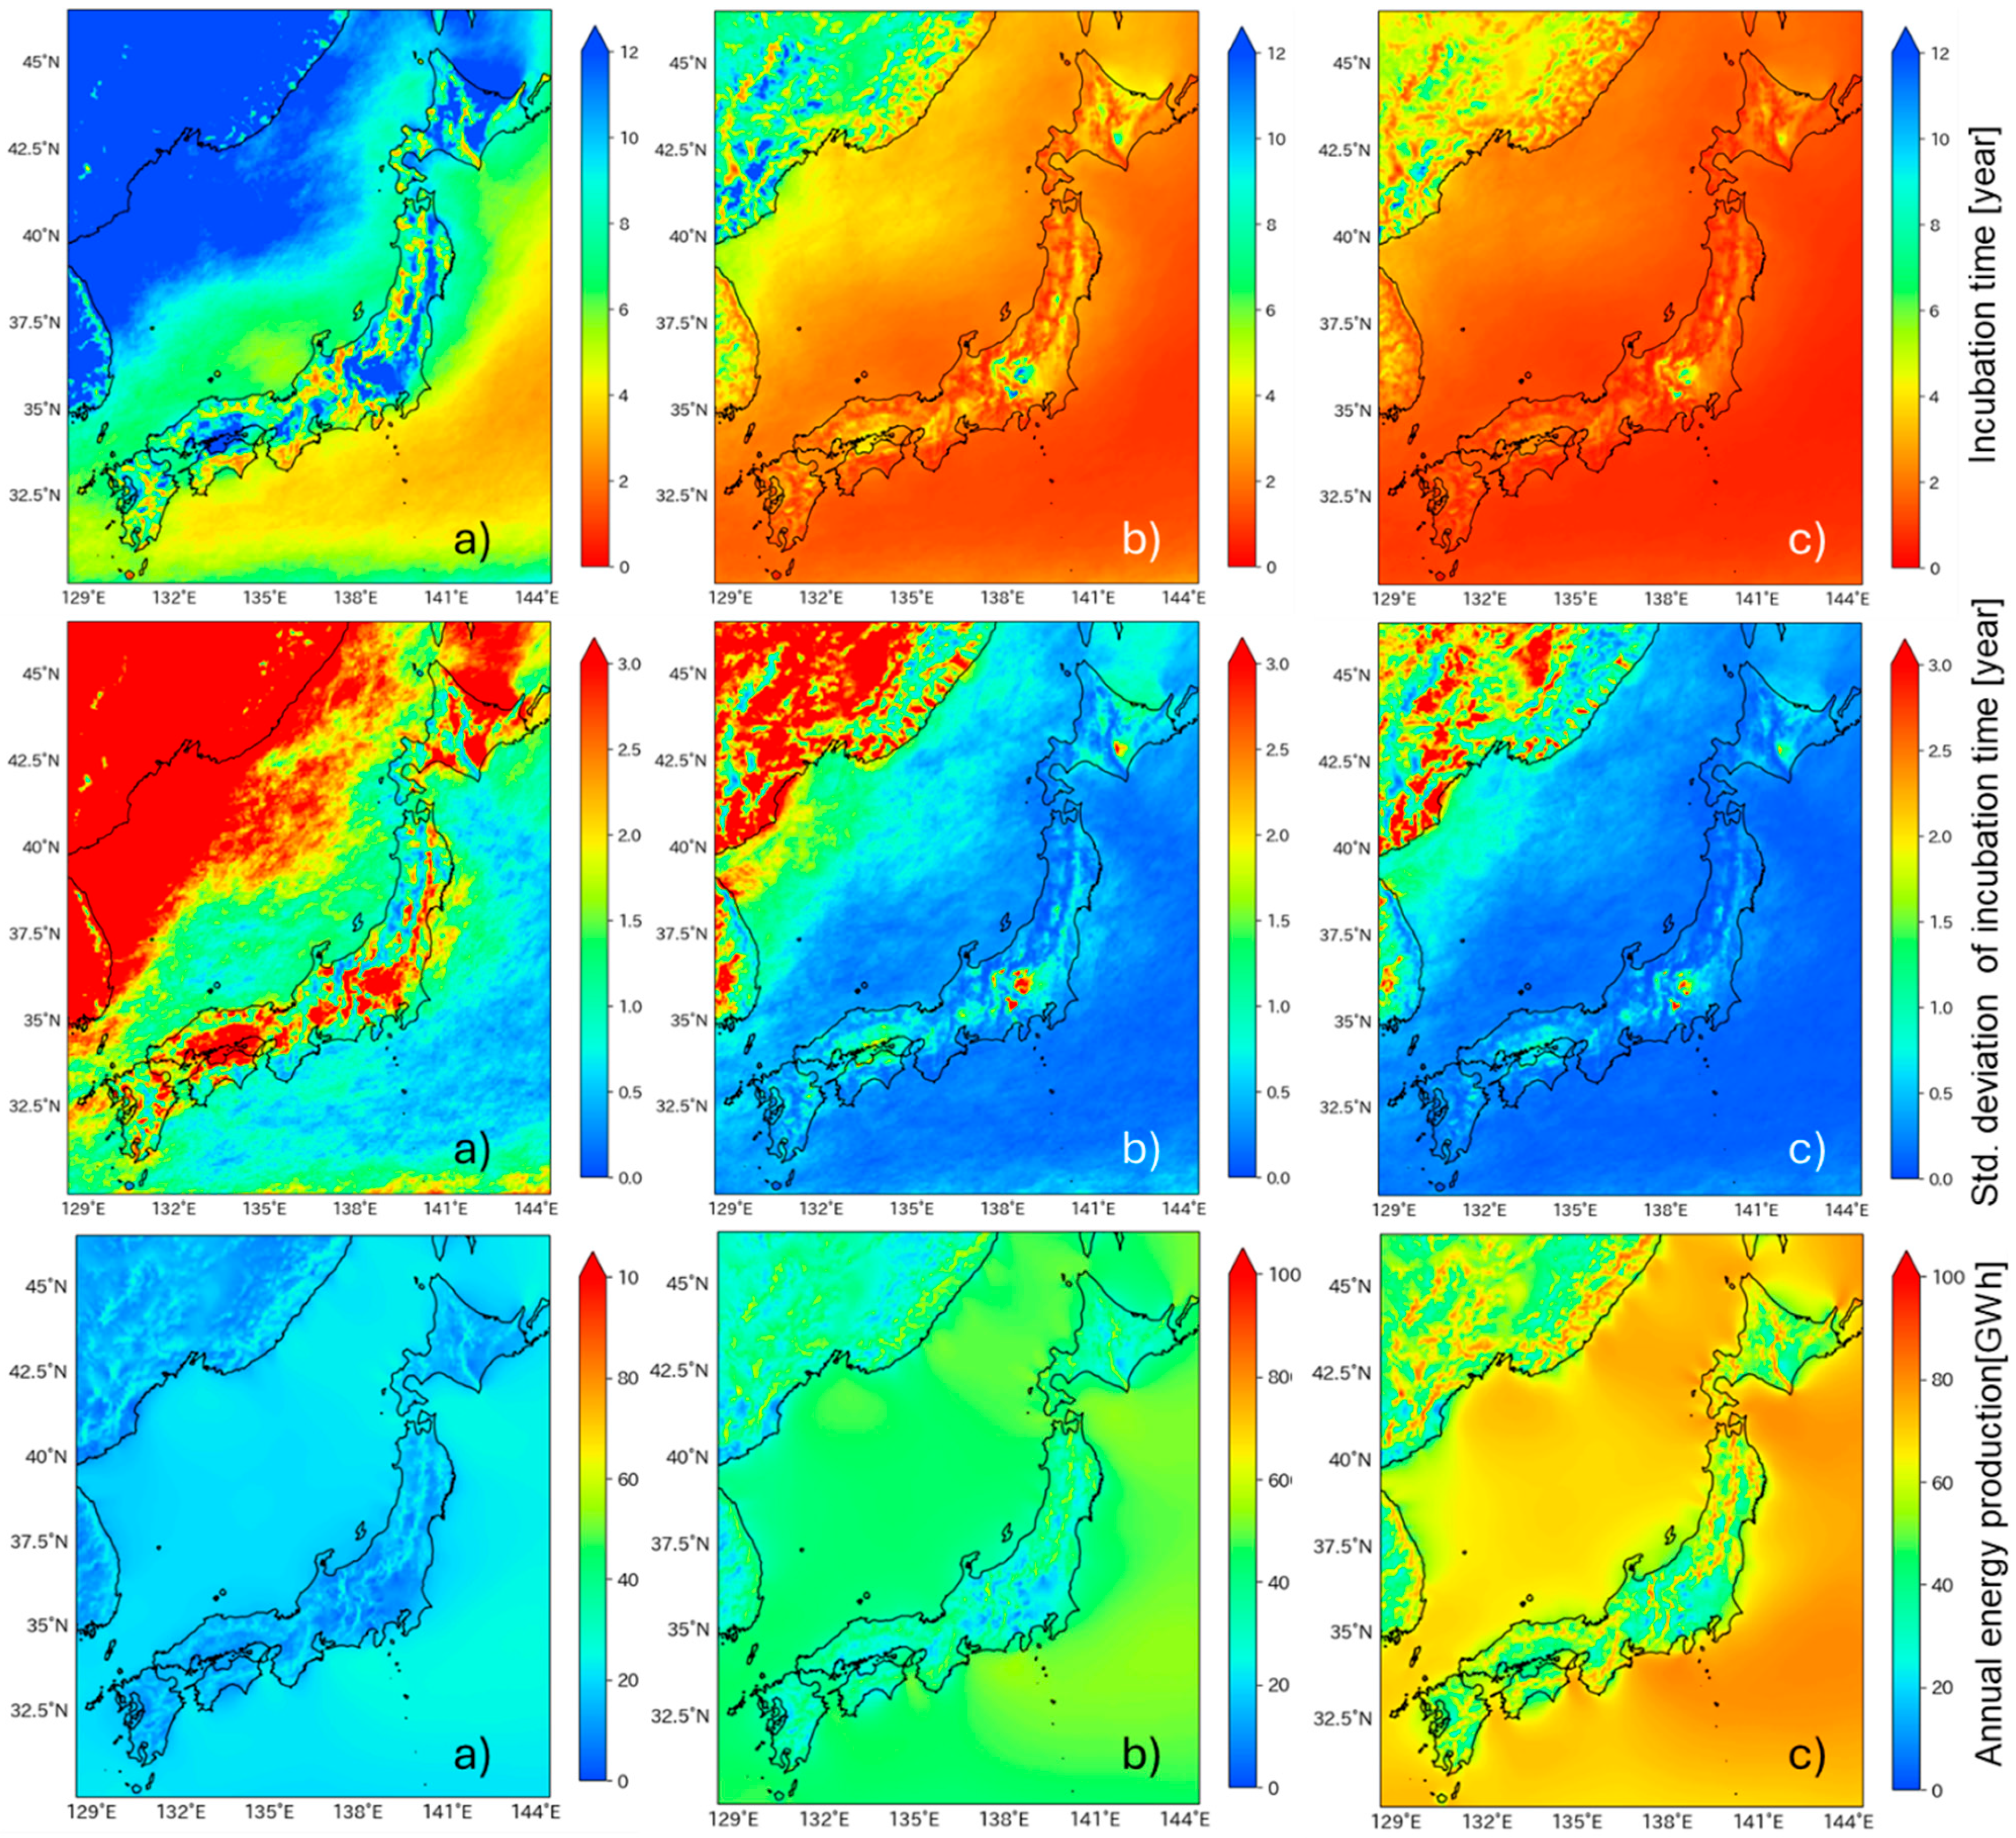
Although the NREL 5MW wind turbine exhibits a longer incubation time, the larger standard deviation is shown in Figure 7 (middle). This deviation must be carefully considered when developing maintenance strategies, as it implies that erosion progression may fluctuate significantly from year to year. In contrast, the consistently shortened incubation times observed for the DTU 10 MW and IEA 15 MW wind turbines across multiple regions highlight an urgent need for erosion mitigation strategies. These include the application of more durable protection coatings or tapes as well as the adoption of erosion-safe mode operation during high-risk weather conditions. The effectiveness of the erosion-safe mode operation is discussed in Section 3.6.
It should also be noted that the incubation time denotes the onset of rain erosion, whereas both the need for repair and the reduction in power generation due to degraded blade aerodynamic performance occur at more advanced stages of erosion. Therefore, actual maintenance interventions are expected to occur substantially later than the incubation time.
3.3. Raindrop Size and Rainfall Intensity Contributing Rain Erosion Progression
Figure 8 shows the rain erosion progression for each raindrop size for the DTU 10 MW wind turbine. It is apparent that rain erosion progresses with comparatively smaller raindrops of d = 1.05 mm. On the Pacific side of Japan, however, larger raindrops (d = 2.05, 3.05 mm) also contribute to rain erosion progression. In contrast, the impact of larger raindrops is less pronounced in the Sea of Japan side and Hokkaido. As shown in Figure 1, raindrop diameter tends to increase with rainfall intensity. Figure 8 suggests that, compared to the Sea of Japan side, the Pacific Ocean side experiences more frequent high-intensity rainfall events and during which rain erosion progresses.
Figure 8.
Rain erosion progression for each raindrop size (DTU 10 MW). (a: d = 1.05 mm, b: d = 2.05 mm, c: d = 3.05 mm, d: d = 4.05 mm).
Figure 8.
Rain erosion progression for each raindrop size (DTU 10 MW). (a: d = 1.05 mm, b: d = 2.05 mm, c: d = 3.05 mm, d: d = 4.05 mm).
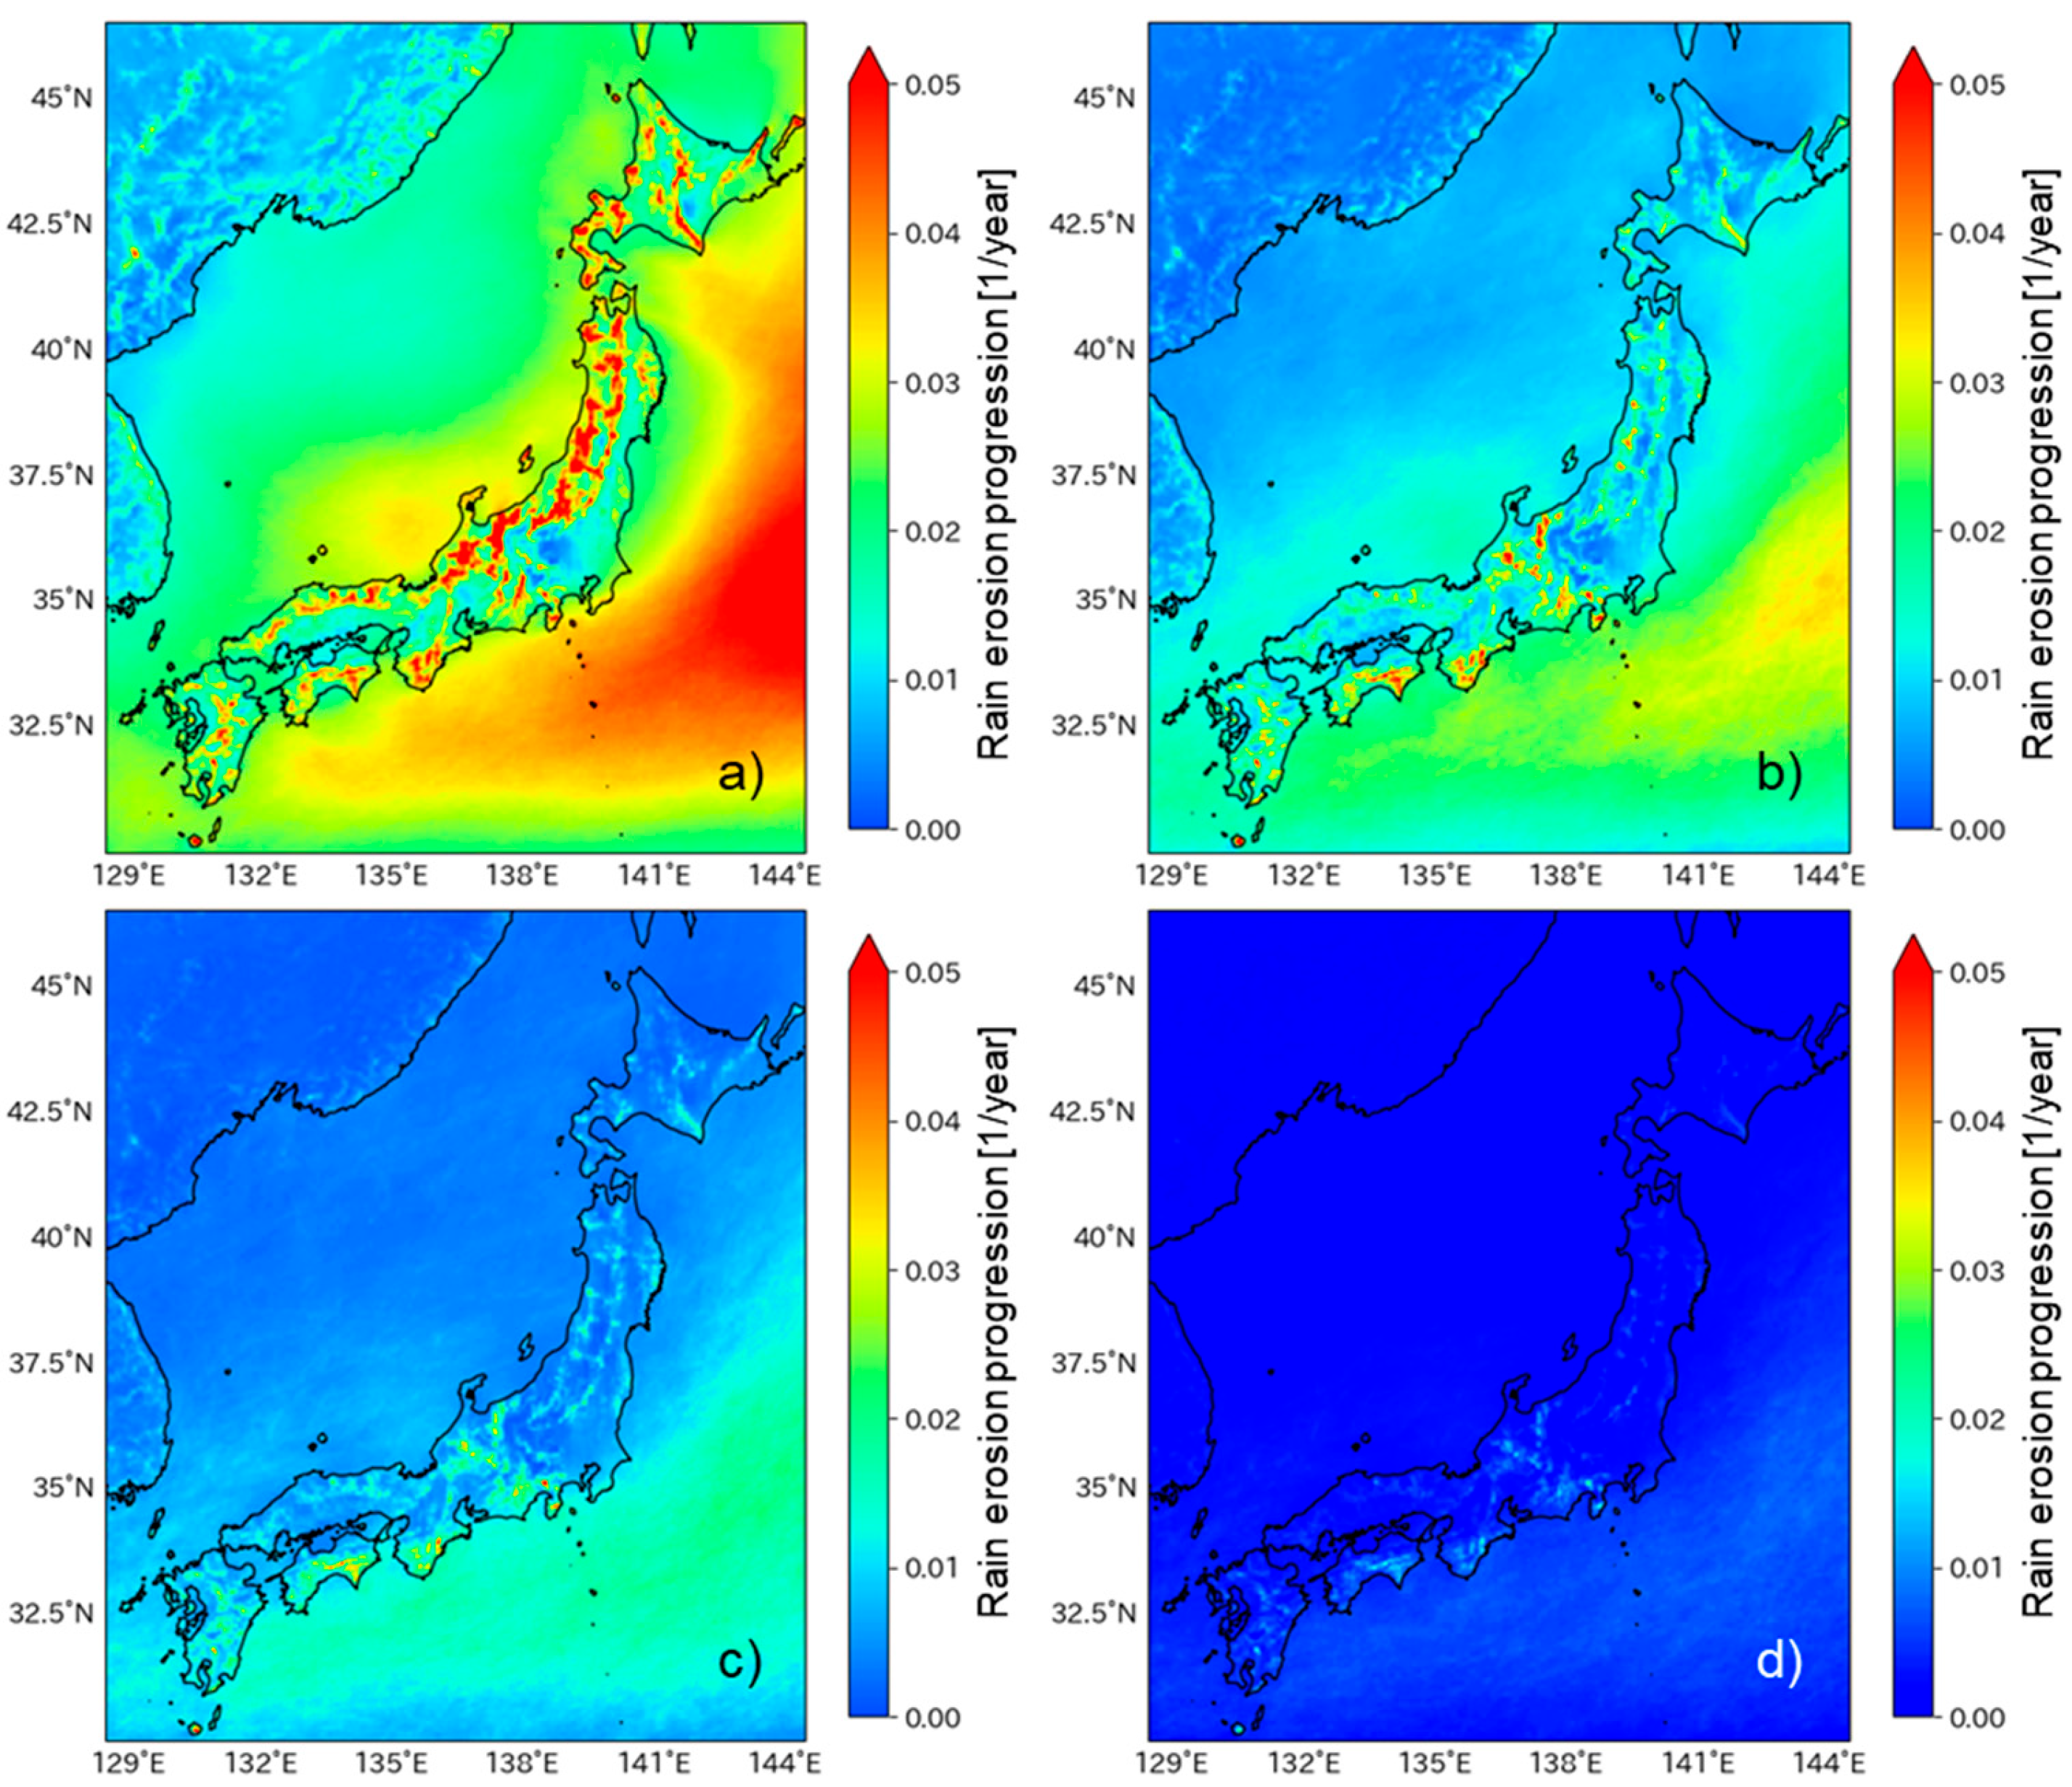
Figure 9 presents the cumulative rain erosion progression for the DTU 10 MW turbine, aggregated by rainfall intensity levels into 0.1 mm/h intervals, along with the corresponding cumulative occurrence time at two representative offshore locations—Choshi (Pacific Ocean side) and Noshiro (Sea of Japan side). These locations are also marked in Figure 4 as red dots. At both sites, most annual hours are associated with rainfall intensities below 5 mm/h. Rainfall events exceeding 5 mm/h are relatively rare, comprising approximately 1 % of annual hours in Choshi and 0.5 % in Noshiro. These values suggest that short-time heavy rainfall is more concentrated in Choshi, this trend is reflected in Figure 8. Despite their limited temporal occurrence, such high-intensity rainfall contributes disproportionately to rain erosion: approximately 54 % of annual rain erosion in Choshi and 22 % in Noshiro occurred during these brief periods (see Figure 9).
The disparity in erosion progression under low-frequency, high-intensity rainfall events is attributed to regional differences in precipitation systems. Convective rainfall predominates in Choshi, while stratiform rainfall is more common in Noshiro. Convective rainfall is characterized by short-duration, high-intensity precipitation generated by cumulonimbus clouds formed through strong vertical air motions—typical examples include summer thunderstorms and squalls. In contrast, stratiform rainfall consists of light, continuous precipitation produced by widespread stratiform clouds, often preceding low-pressure systems and persisting over extended periods. These regional precipitation characteristics—specifically, differences in the annual occurrence time of heavy rainfall—directly affect the effectiveness of erosion-safe mode operation; Figure 9 indicates that such operation is more effective in Choshi (Pacific Ocean side) than Noshiro (Sea of Japan side).
Figure 9.
Rain erosion progression and corresponding occurrence time for each rainfall intensity. (a: Choshi, b: Noshiro, locations are shown as red dots in Figure 3).
Figure 9.
Rain erosion progression and corresponding occurrence time for each rainfall intensity. (a: Choshi, b: Noshiro, locations are shown as red dots in Figure 3).
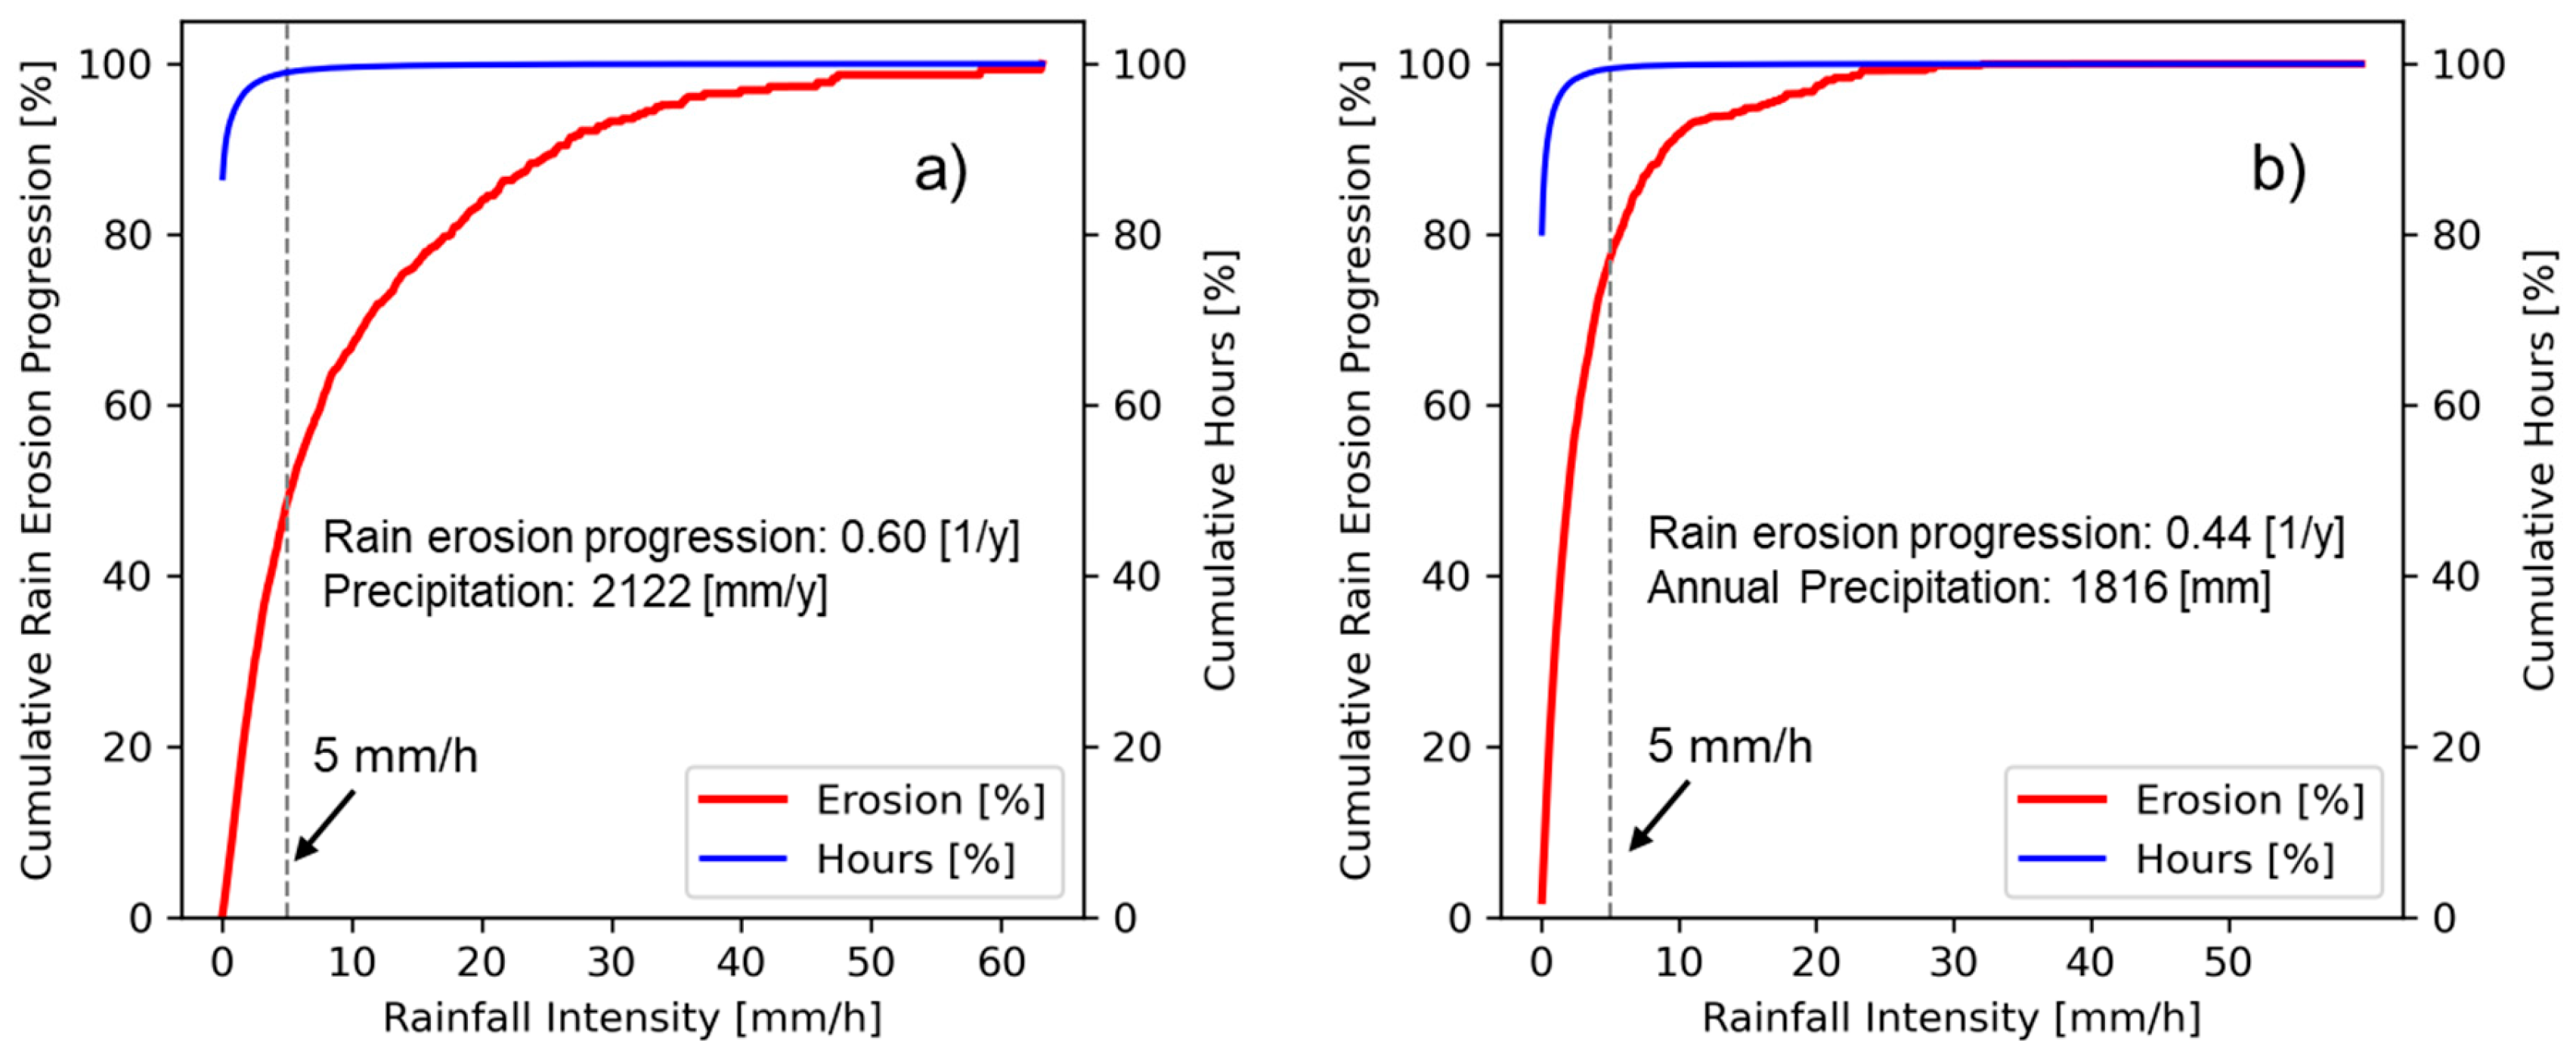
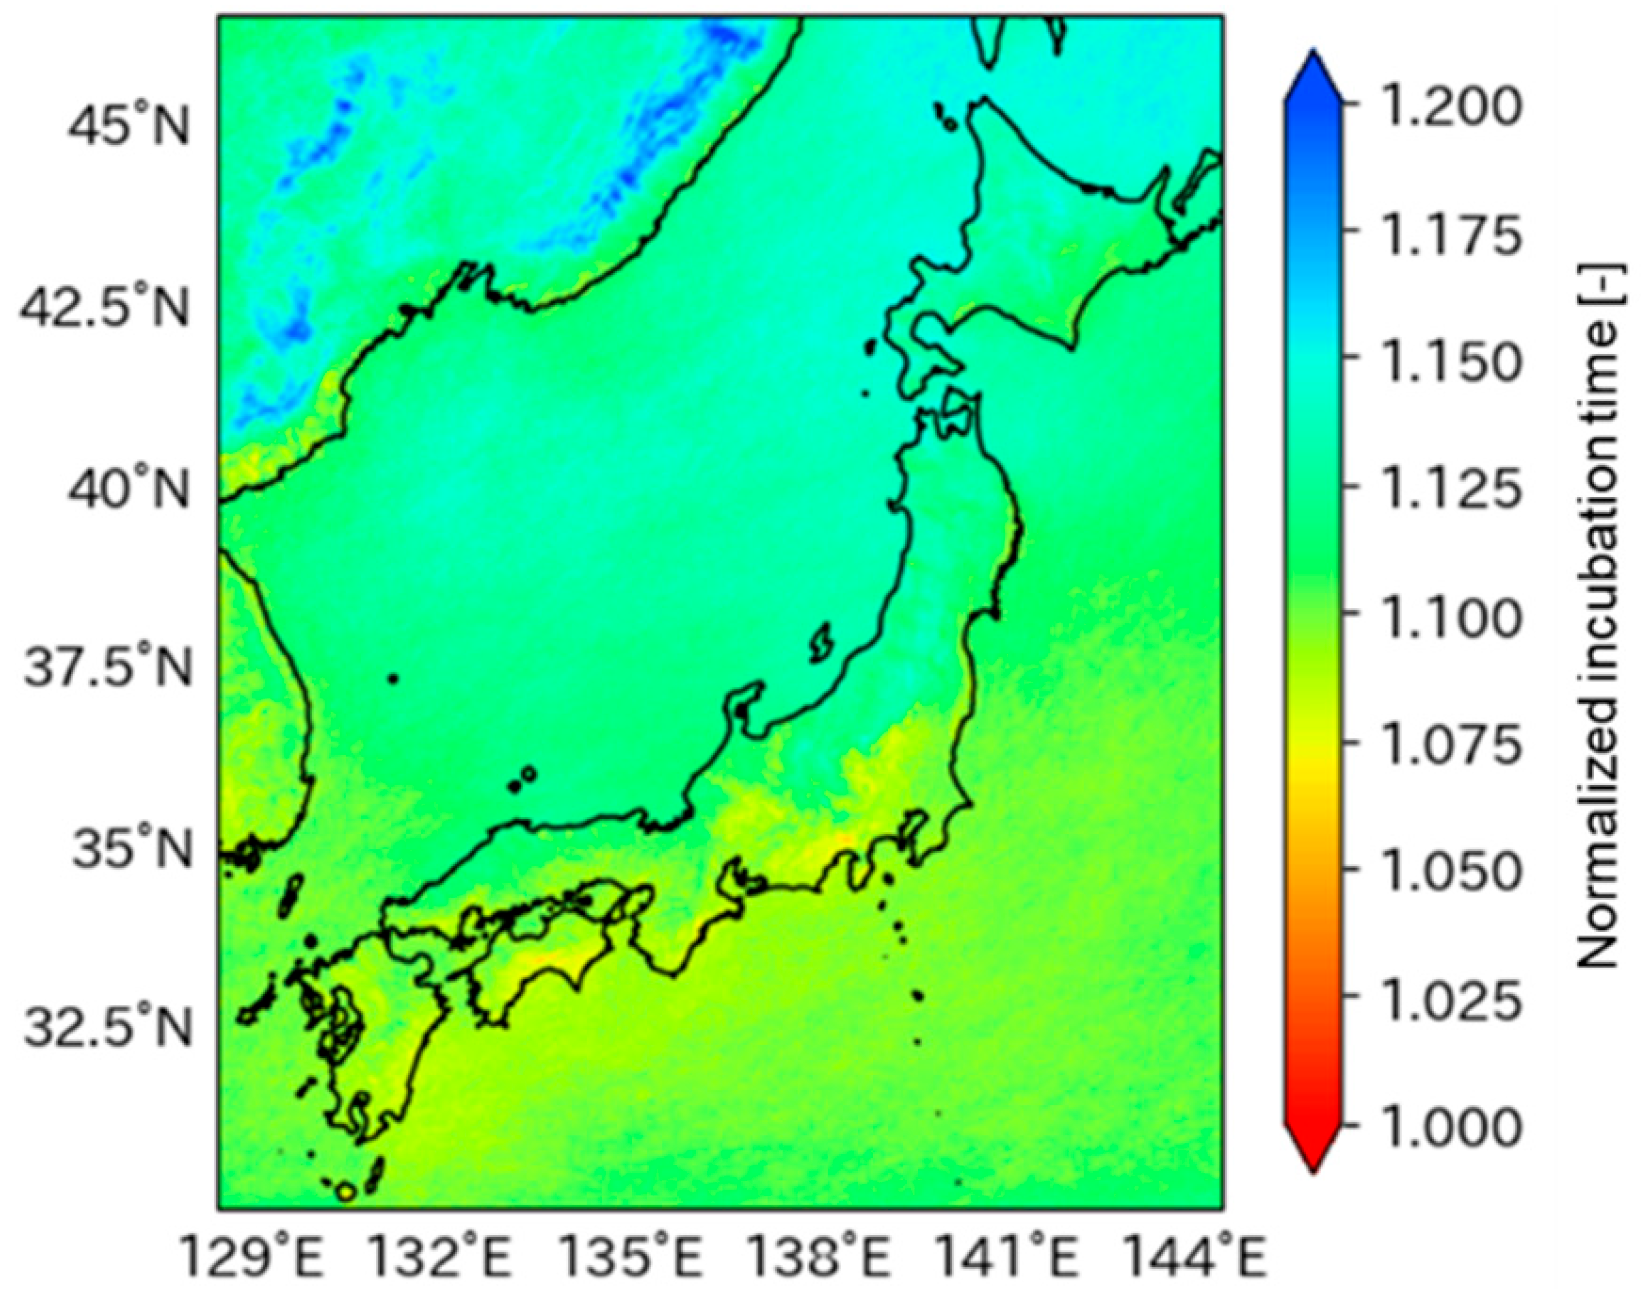
Figure 10 illustrates the incubation time for the DTU 10 MW wind turbine, normalized with the incubation time based on the Best’s raindrop size distribution. Since the Best’s equation predicts larger raindrop size under the same rainfall intensity (as shown in Figure 1), it yields approximately 10 % shorter incubation time compared to those based on the measurements, resulting in larger value than 1.0 in Figure 10. This indicates that raindrop size distribution has a measurable impact on the rain erosion progression. According to satellite-based observations by Yamaji et al. [27], raindrop sizes over oceanic regions tend to be smaller than those over land, suggesting that location-specific measurements for the raindrop size distribution is necessary for accurate rain erosion prediction and mitigation planning.
Figure 10.
The ratio of incubation time based on measurement to that based on Best’s equation. (DTU 10 MW).
Figure 10.
The ratio of incubation time based on measurement to that based on Best’s equation. (DTU 10 MW).
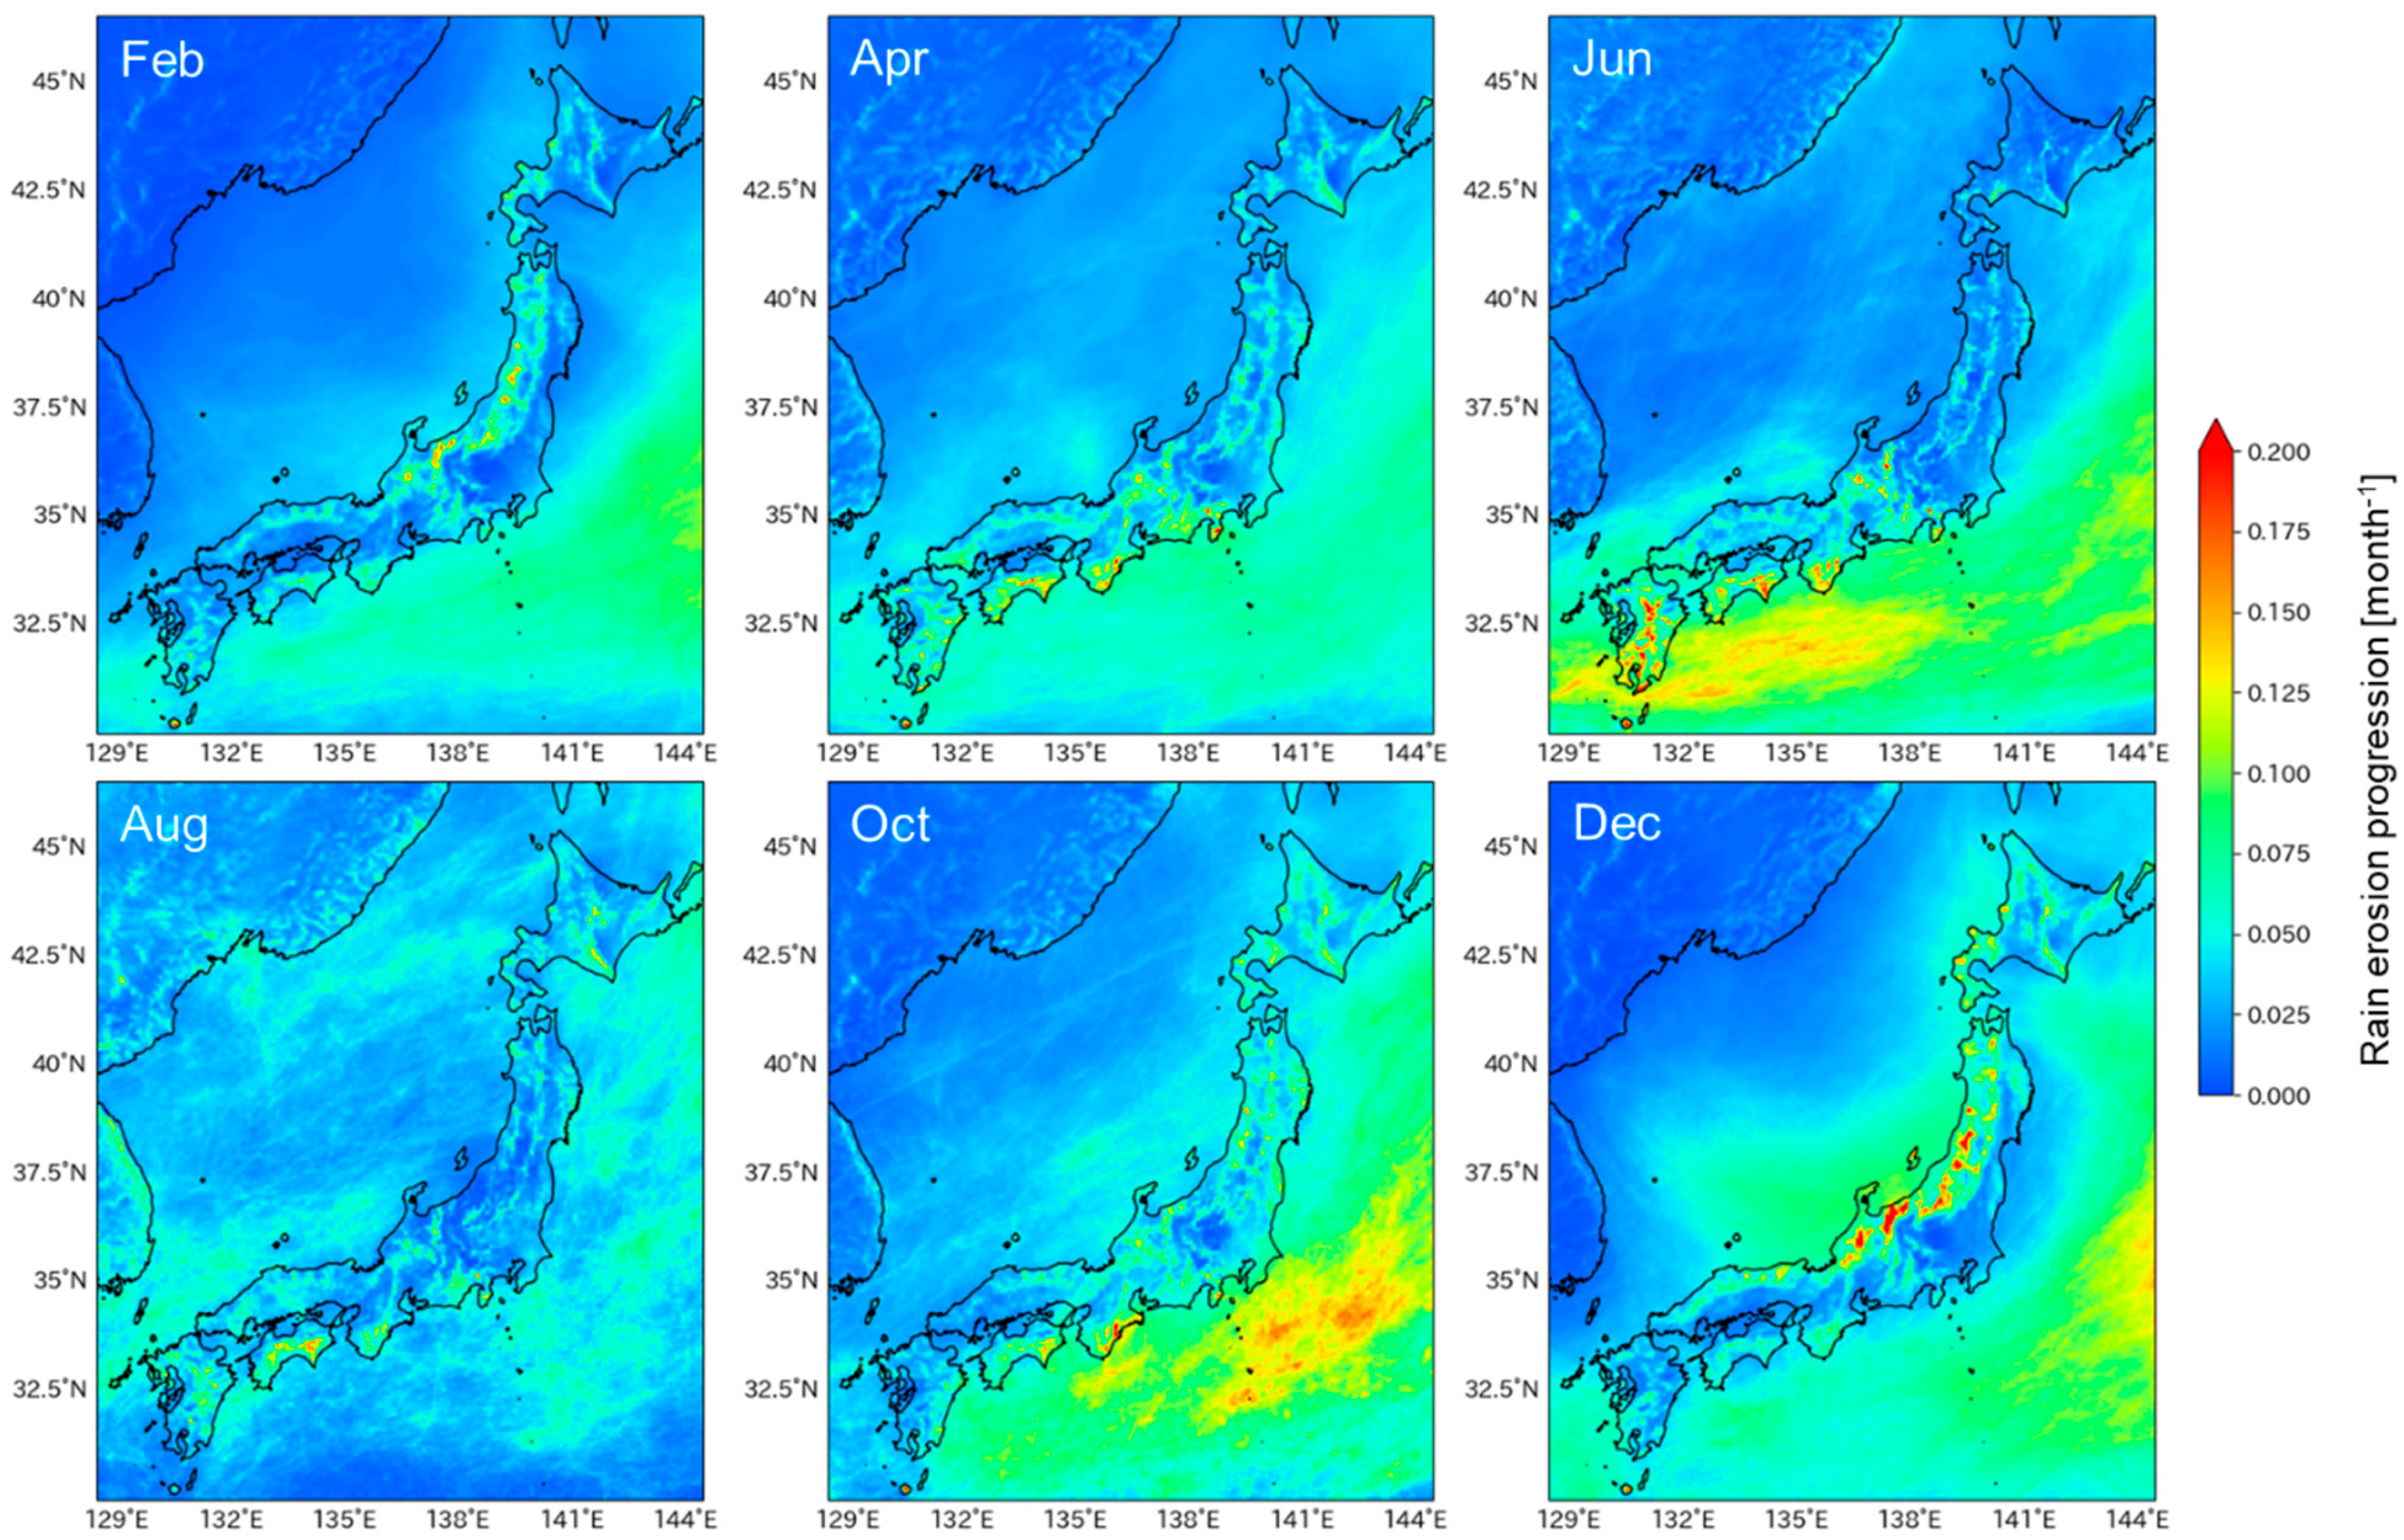
3.4. Monthly Erosion Progression
Figure 11 shows monthly erosion progressions for the DTU 10 MW wind turbine. Distinct seasonal and regional patterns are evident. On the Pacific Ocean side, erosion intensifies notably in June and October, corresponding to the rainy season and autumn rain/typhoon season, respectively. In contrast, on the Sea of Japan side, erosion tends to accelerate during the winter months, particularly from December to February.
Figure 11.
Monthly rain erosion progression for DTU 10 MW wind turbine.
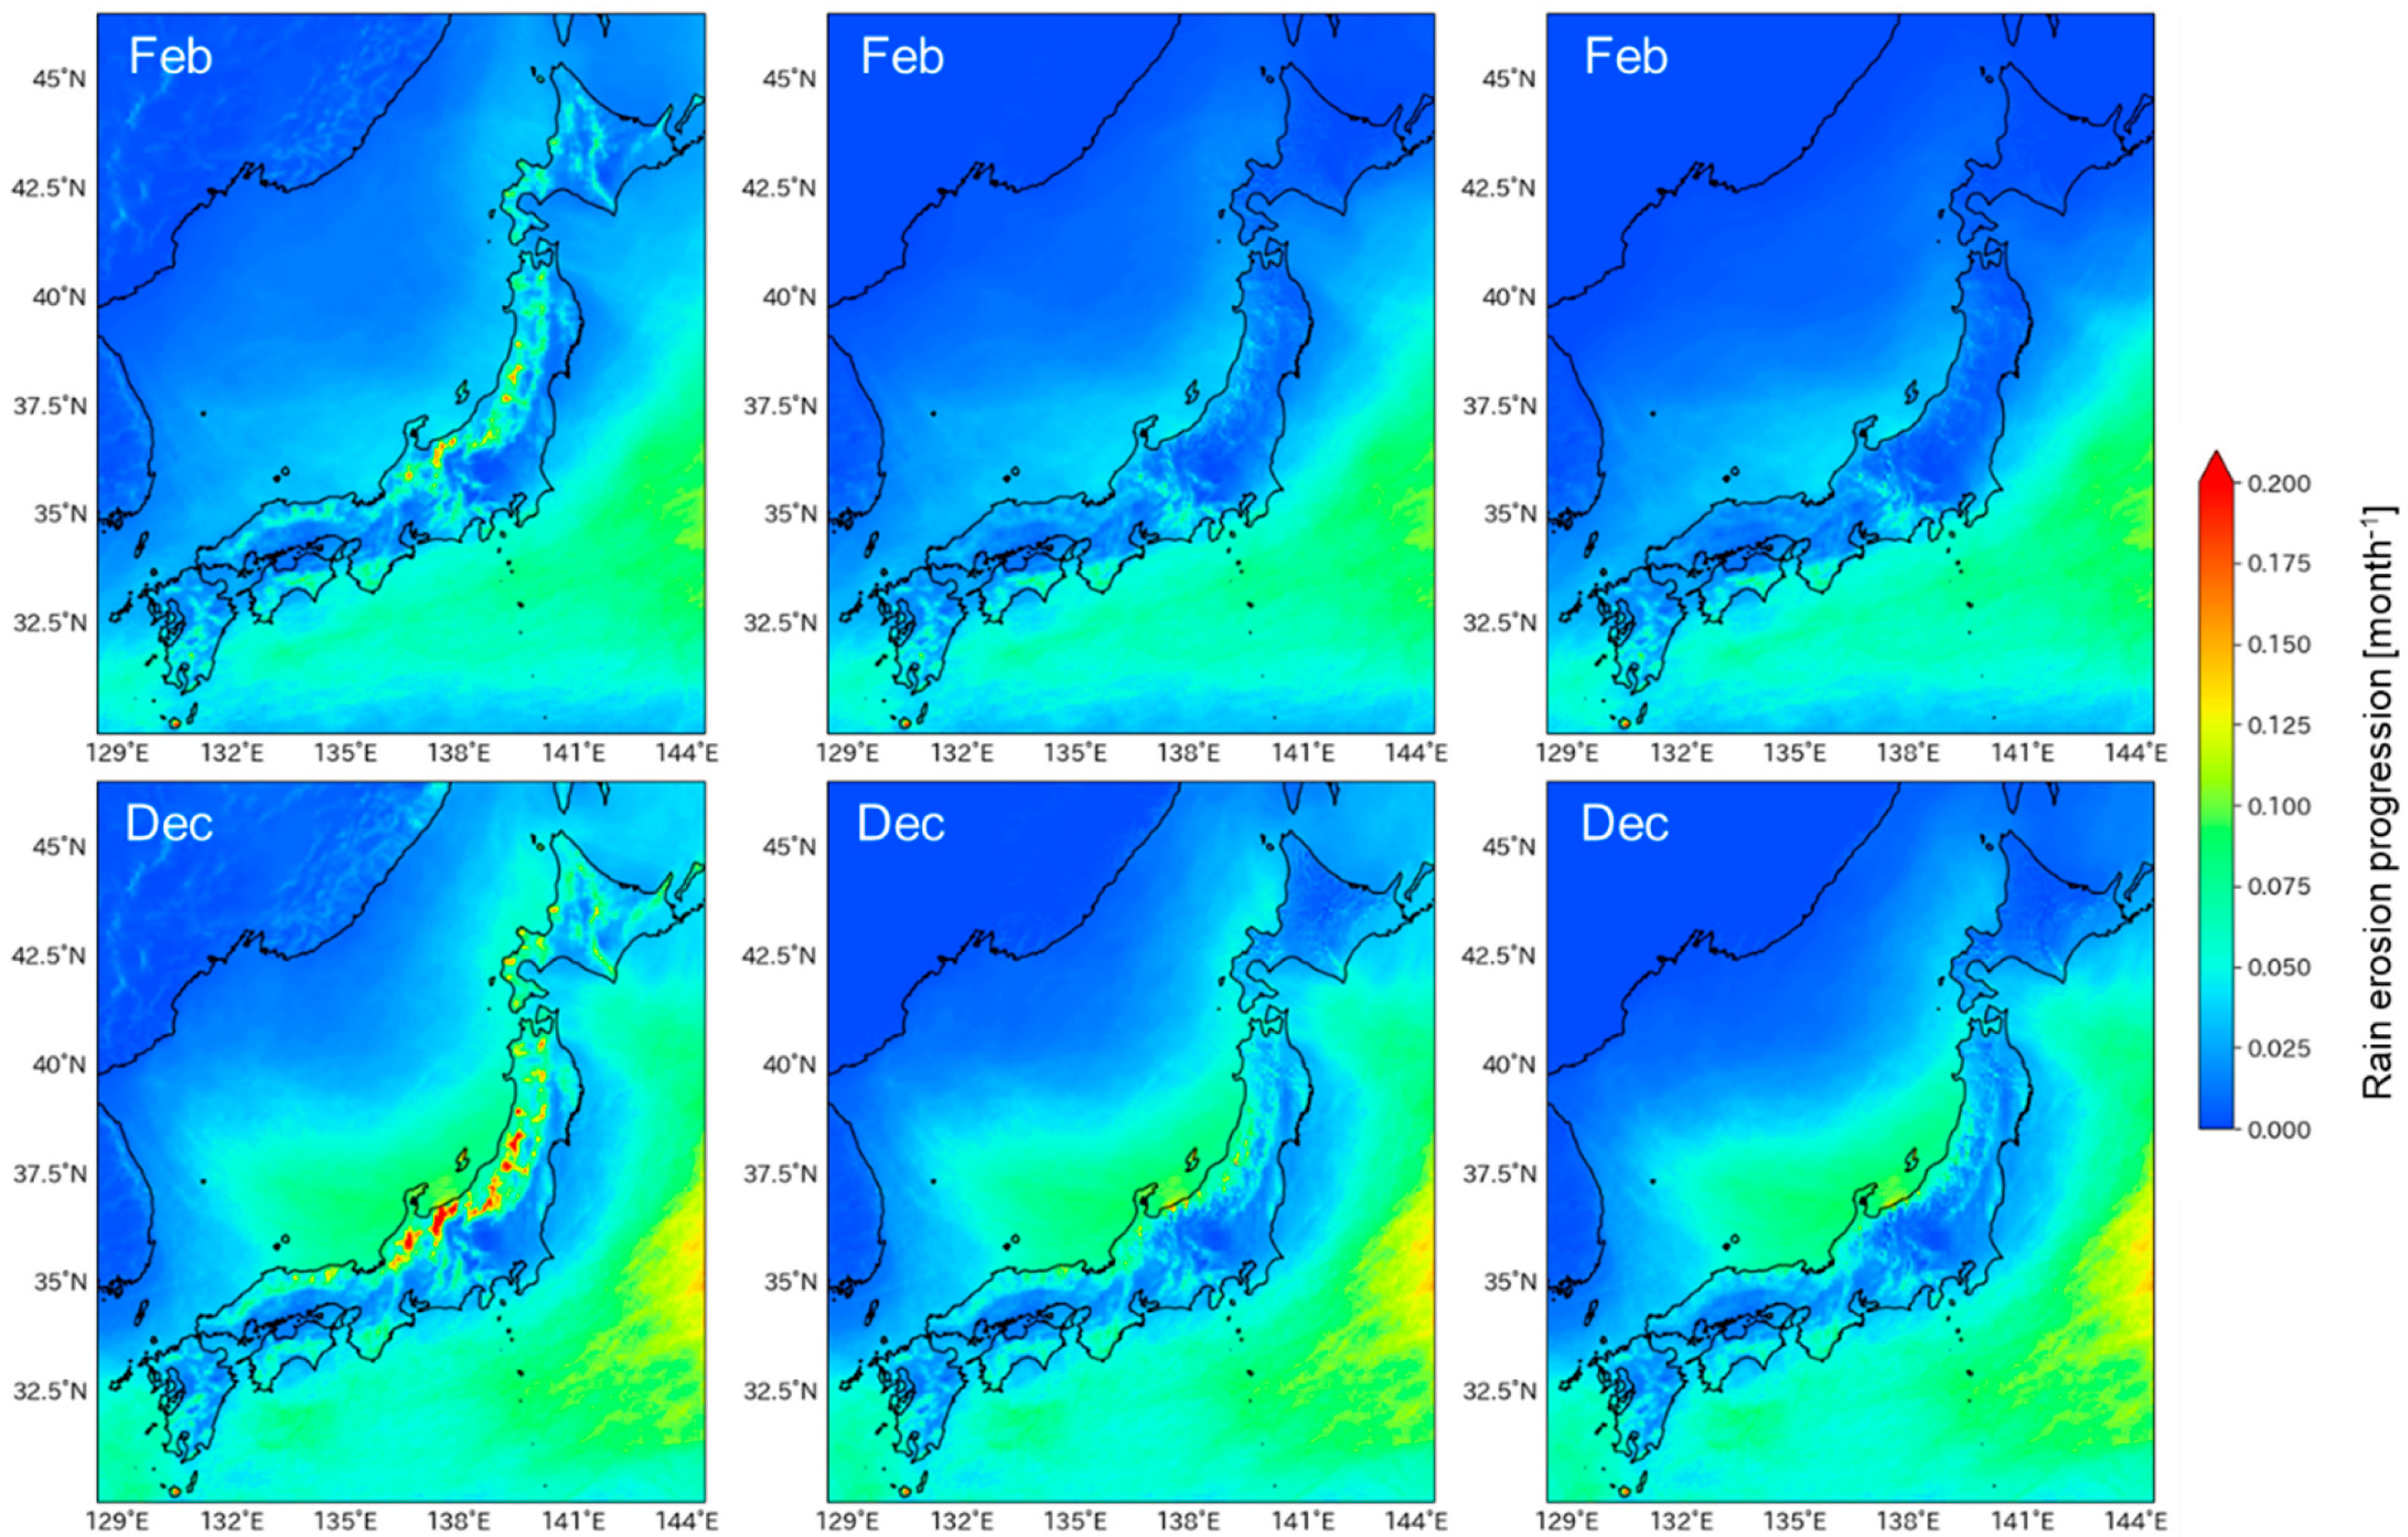
In winter, the Sea of Japan side area frequently experiences snowfall rather than rainfall. In Figure 11, all precipitation is treated as rain, which may lead to an overestimation of rain erosion in this region during the winter months, as snow is not expected to contribute to erosion [19]. To address this, threshold was applied to the 2-meter height air temperature, T2: when T2 falls below the threshold, precipitation was assumed to be snow, and rain erosion progression was set to zero. Threshold values of 273.15 K and 275.15 K were tested, and the corresponding results for the DTU 10 MW wind turbine in February and December are presented in Figure 12. For reference, Figure 12 also includes the monthly erosion progression for the baseline case, in which no distinction is made between rain and snow (the same figures as Figure 11).
As shown in Figure 12, monthly erosion progression during winter over land on the Sea of Japan side was significantly suppressed under the threshold conditions. Notably, the higher threshold of 275.15 K resulted in reduced erosion in February, underscoring the importance of distinguishing between snow and rain in erosion modeling. In this study, precipitation phase classification was performed rather simplistically using the temperature threshold. However, in actual conditions, humidity also plays a crucial role in differentiating between rain and snow, and the erosive impact of mixed-phase precipitation such as sleet and wet snow remains unclear, requiring further investigation.
Notably, the erosion progression on the Pacific Ocean side remains unchanged under the thresholding conditions. Therefore, if snow is not the primary driver of erosion, the regional variation in the rain erosion progression in Figure 7 may become more pronounced with a longer incubation time on the Sea of Japan side.
Figure 12.
Rain erosion progression in Feb and Dec with and w/o temperature thresholding. (left: w/o threshold, center: T2 = 273.15 K, right: T2 = 275.15 K).
Figure 12.
Rain erosion progression in Feb and Dec with and w/o temperature thresholding. (left: w/o threshold, center: T2 = 273.15 K, right: T2 = 275.15 K).
3.5. Effect of UV Radiation on Incubation Time Reduction
Ultraviolet (UV) exposure is known to significantly degrade the erosion resistance of protective coatings [10,28]. Iino et al. [28] investigated this phenomenon by irradiating a commercial polyurethane-based coating with UV light in the 300–400 nm range, followed by evaluation of incubation time using a whirling arm rain erosion tester. Their findings revealed that a UV dose of 432 MJ/m² reduced the incubation time to one-fifth of that for unirradiated samples.
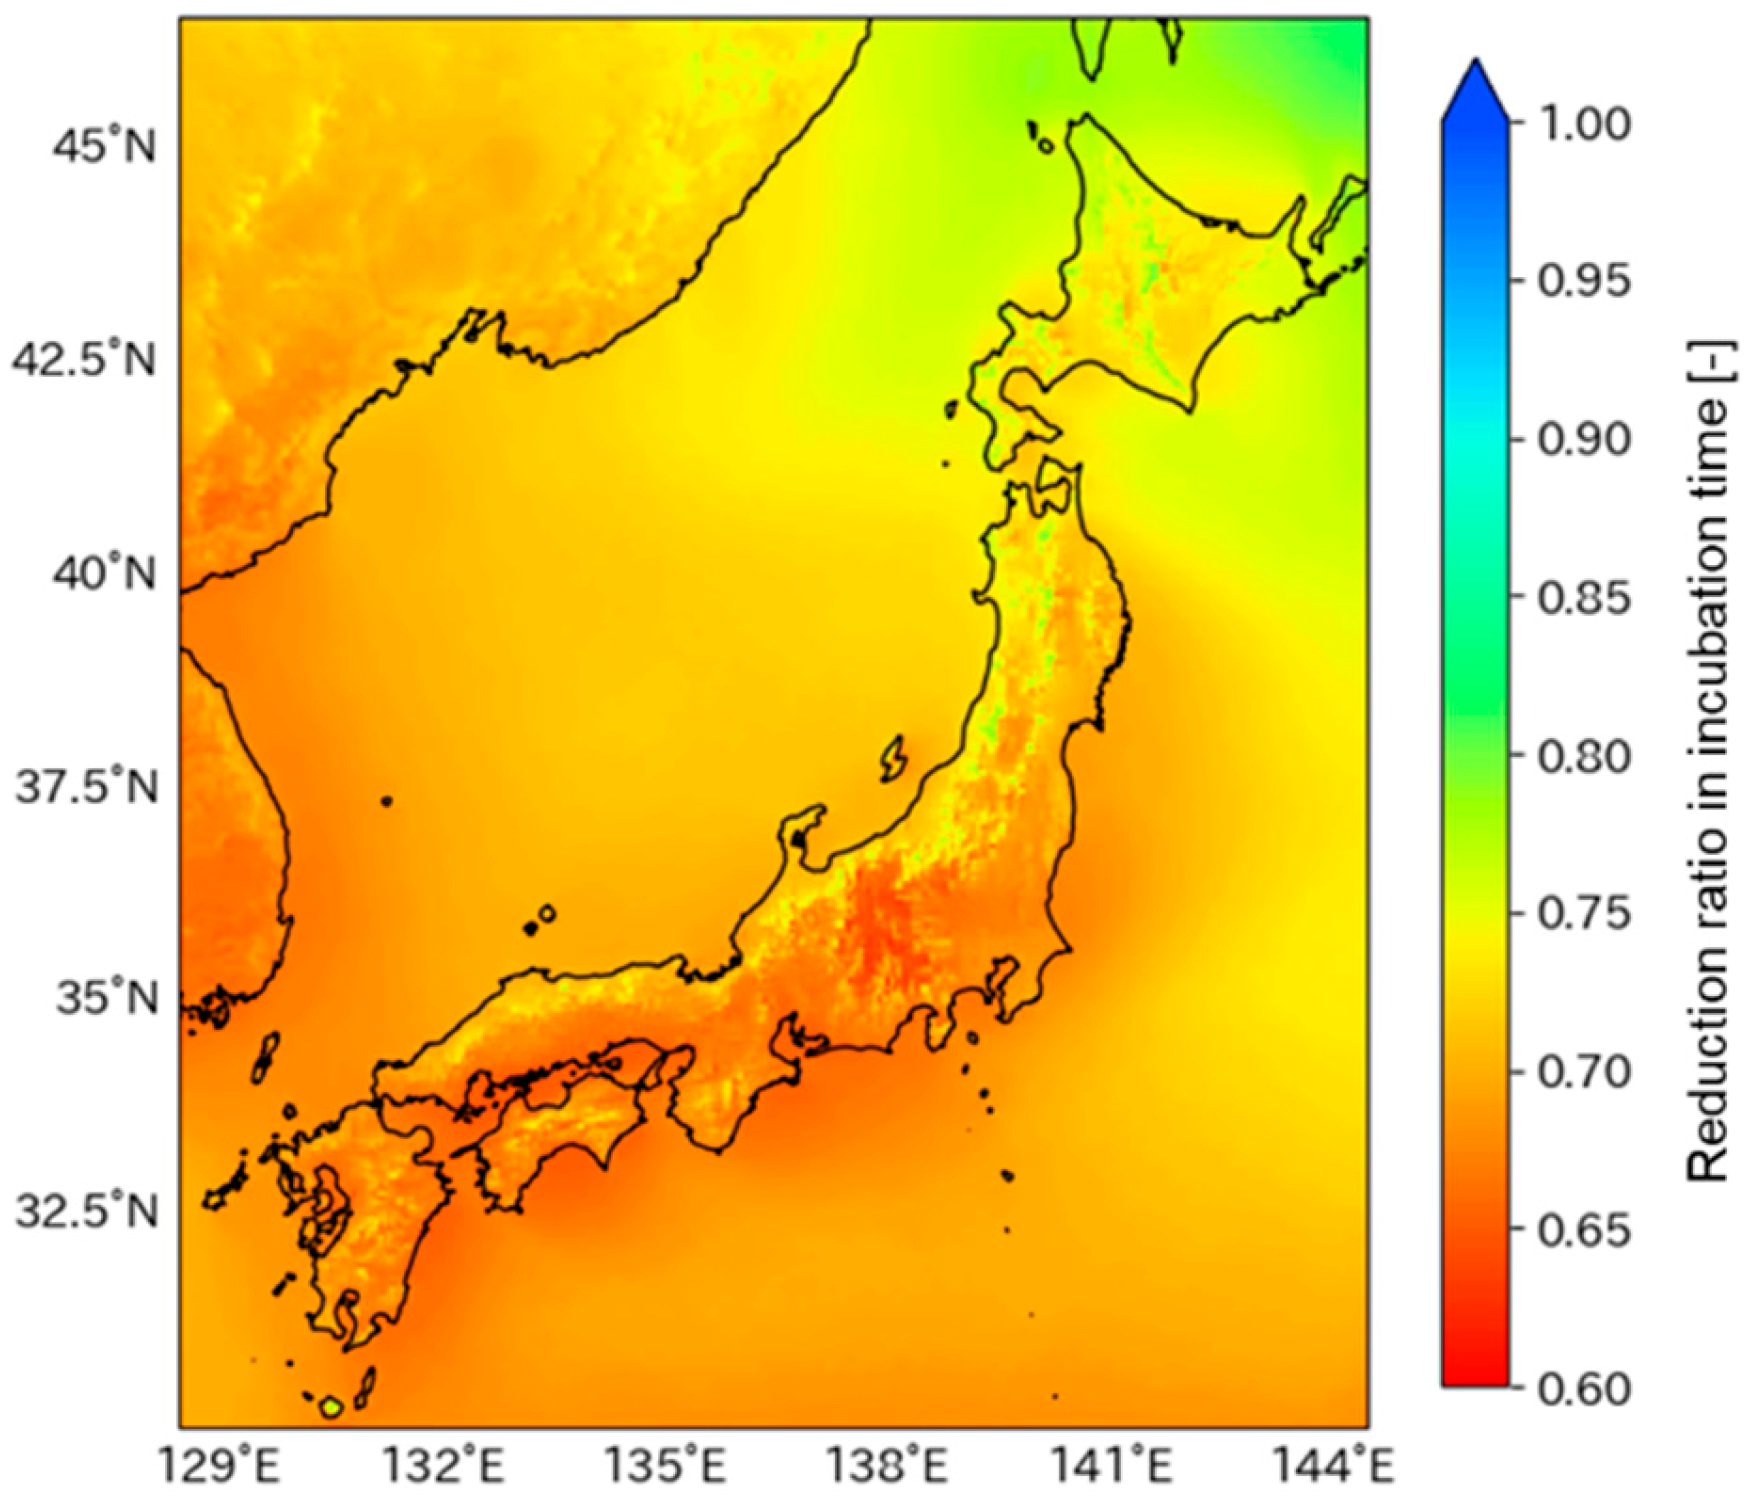
In this section, a simplified estimation was performed under the assumption that incubation time decreases proportionally with cumulative UV irradiation. Based on this relationship, the incubation time was estimated for one year of UV exposure on the DTU 10 MW wind turbine. Since UV radiation—defined here as wavelengths between 300 and 400 nm—accounts for approximately 3.3% of the total solar energy reaching Earth’s surface [29], 3.3% of the annual global solar radiation from the CRIEPI-RCM-Era2 (Figure 13) was attributed to UV exposure. Using this approximation and assuming a linear relationship between UV dose and incubation time reduction, the degraded incubation time due to one year of UV exposure was estimated here.
The resulting incubation time is presented in Figure 14, which shows the ratio of incubation time relative to the base case without UV degradation. The incubation time is significantly reduced when UV-induced degradation is considered. The reduction in incubation time exhibits regional variation, with a relatively modest decrease of 20–25% in Hokkaido, approximately 30% along the Japan Sea coast in northern Japan, and a more pronounced decrease of around 35% along the Pacific coast from Kanto region down to Kyushu.
Figure 13.
Annual global solar radiation.
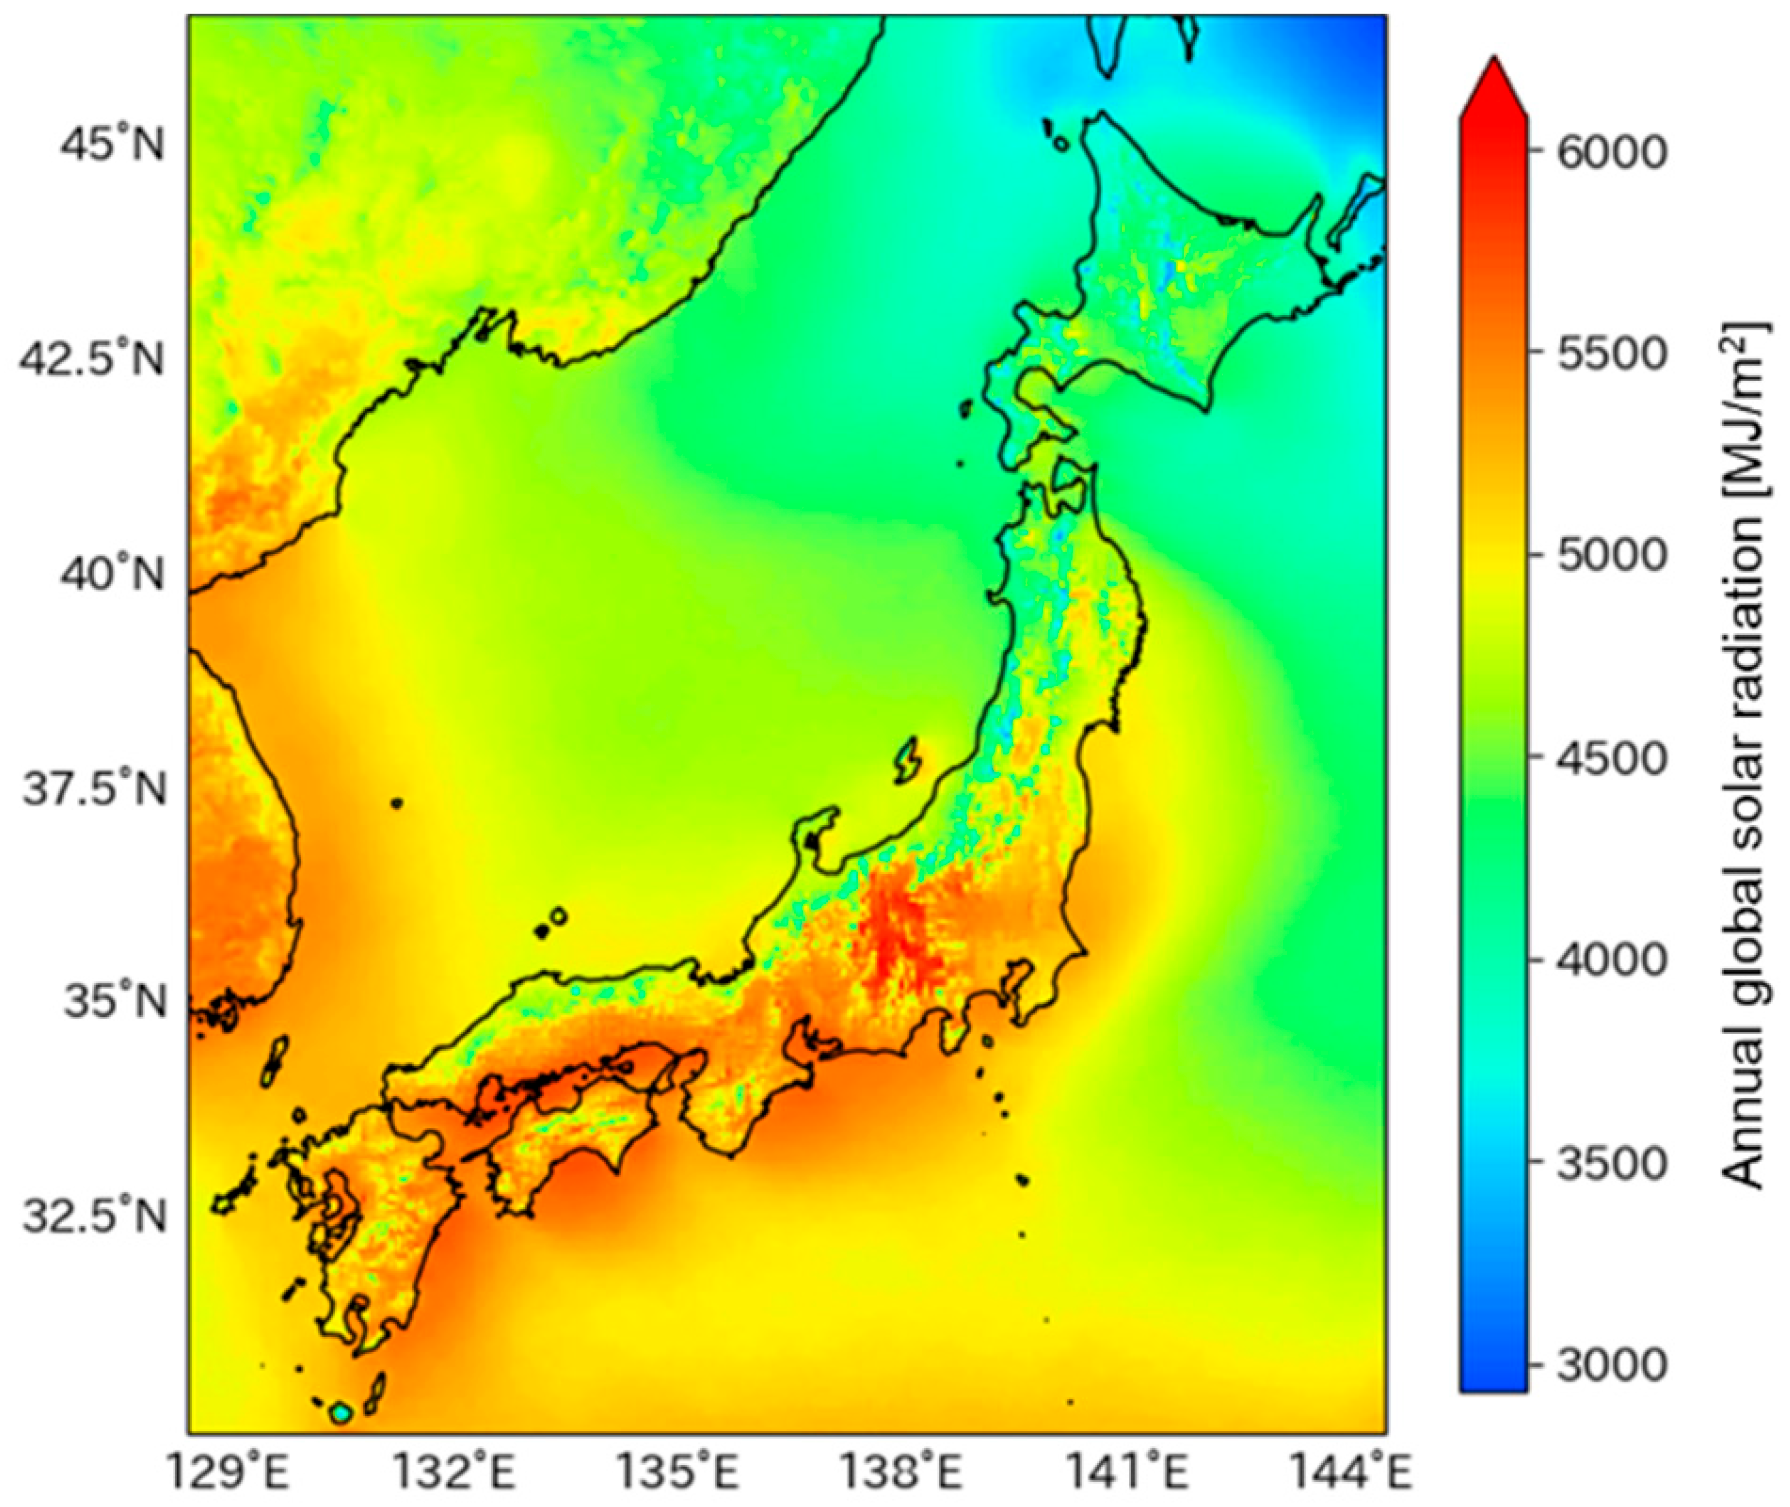
Figure 14.
Reduction in incubation time due to 1 year of UV exposure (DTU 10 MW).
3.6. Effectiveness of Erosion-Safe Mode Operation
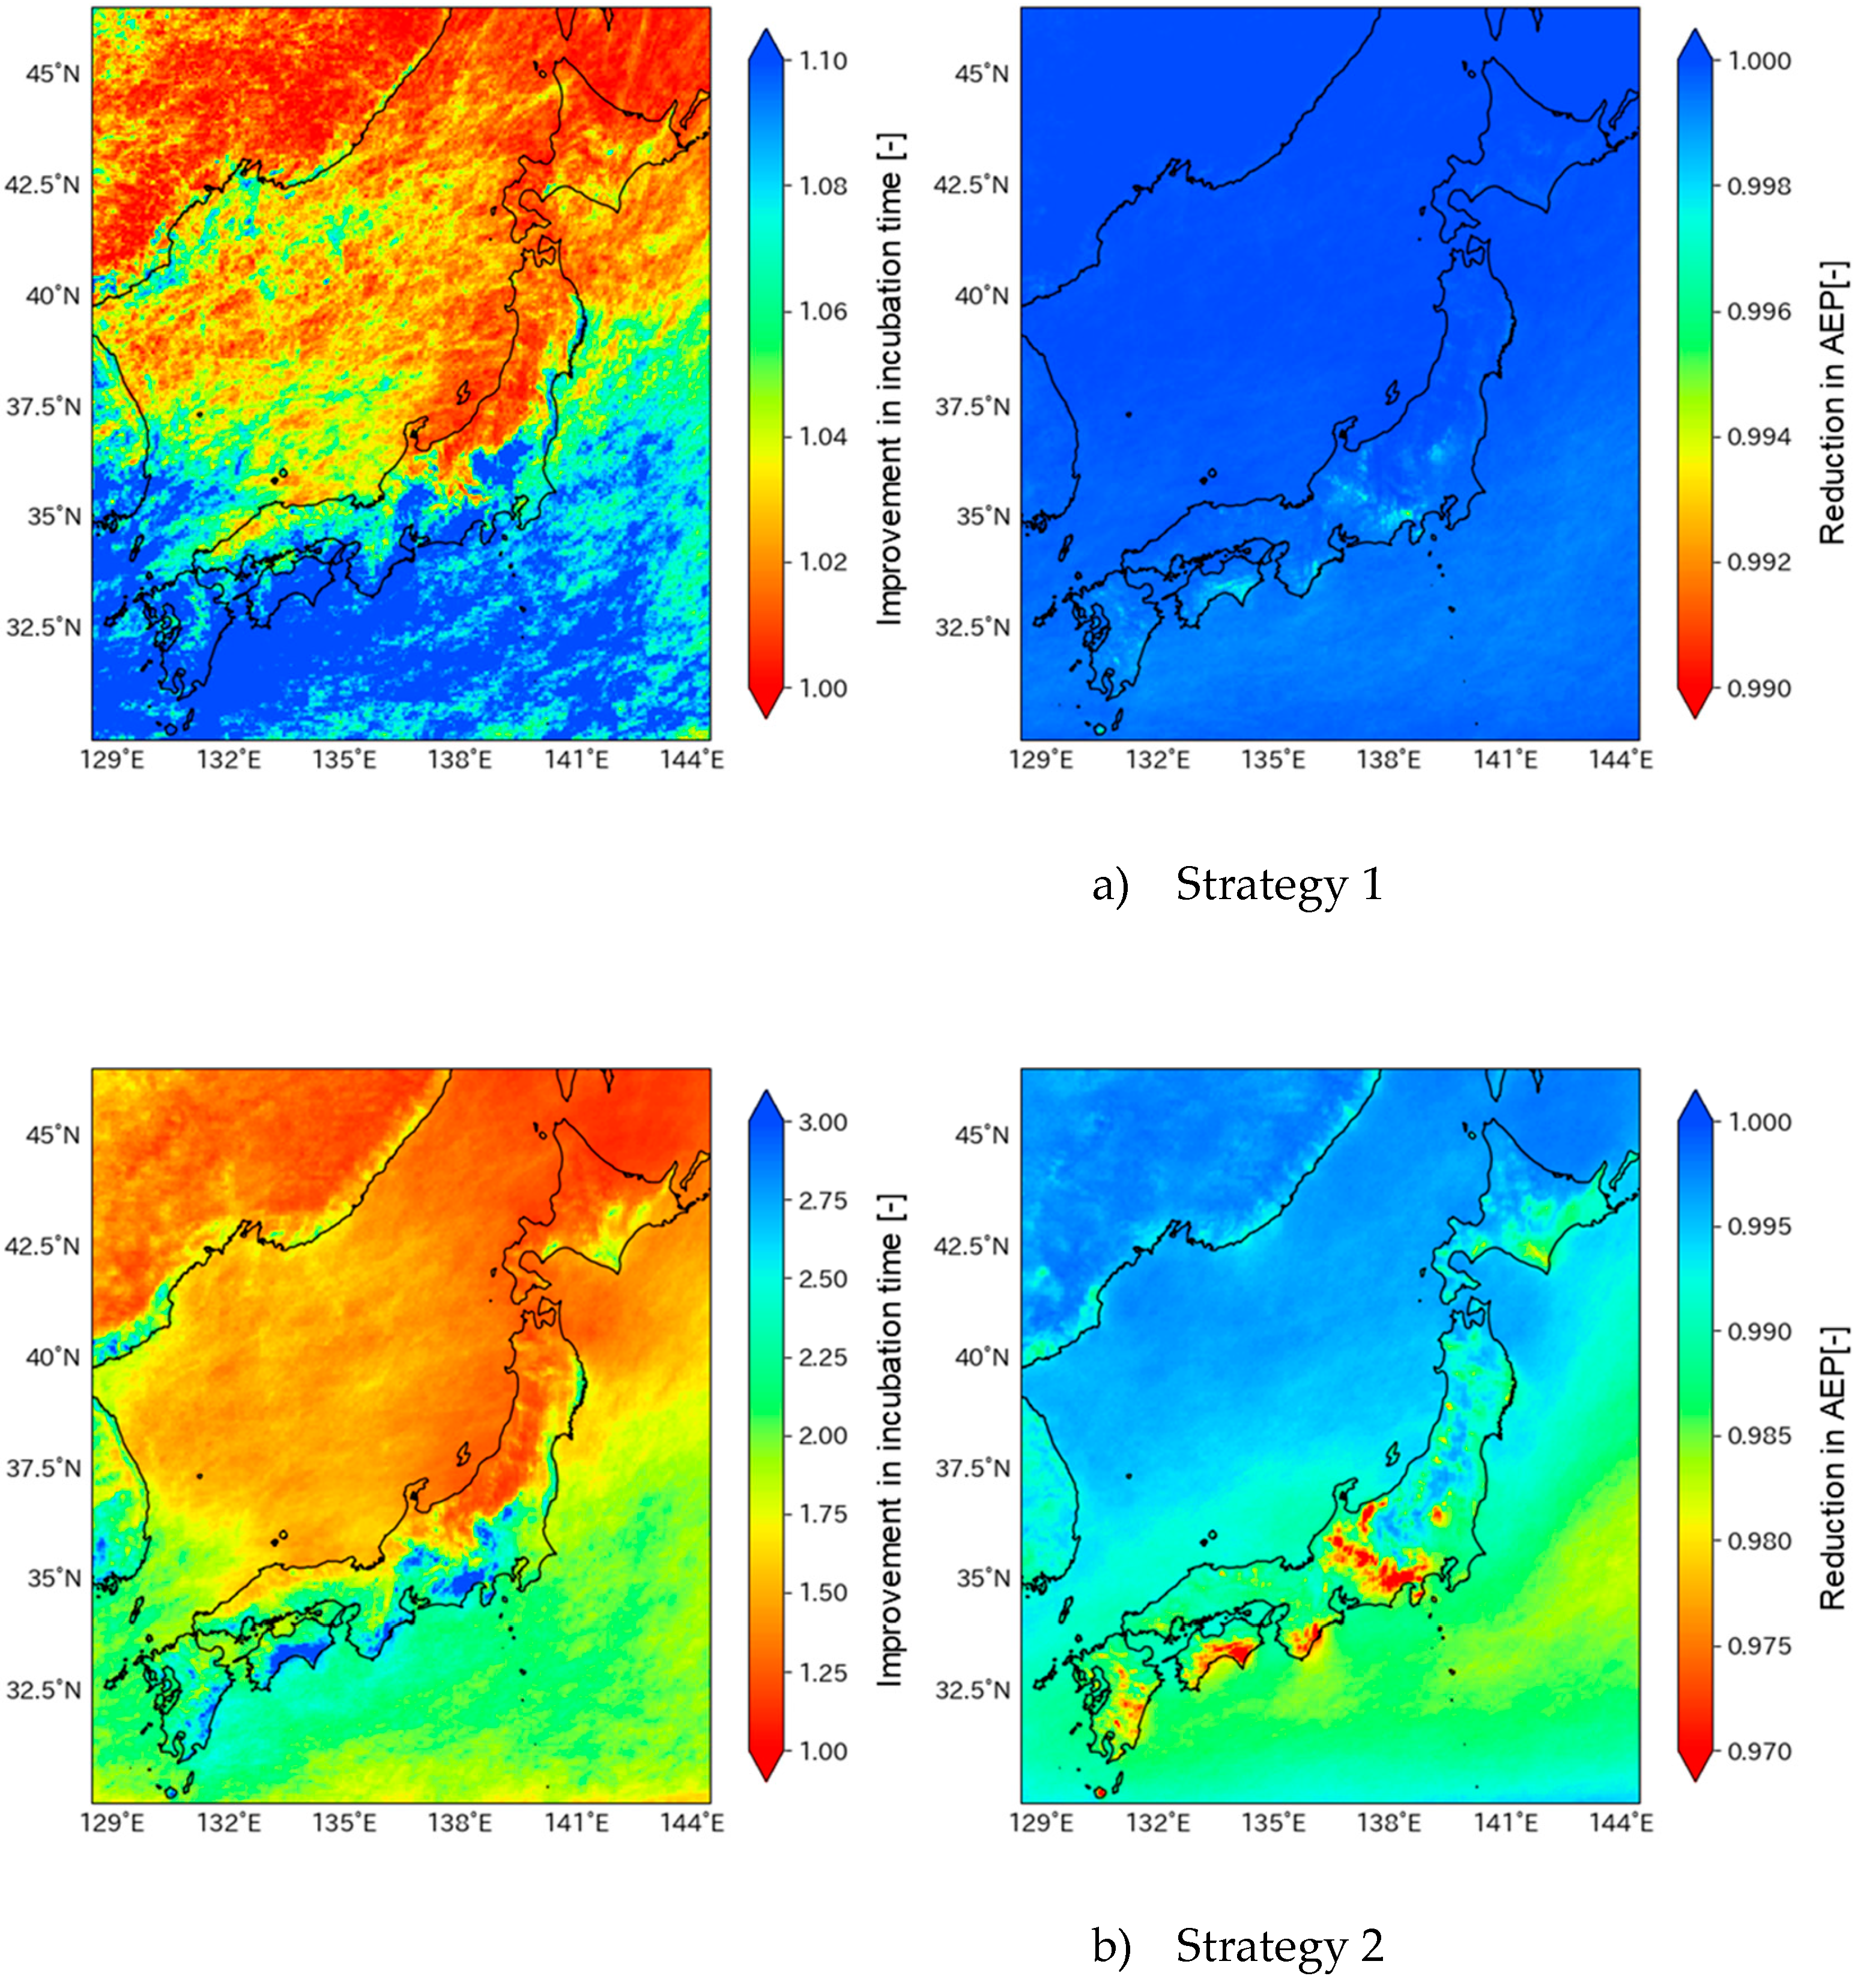
Effectiveness of erosion-safe mode operation in mitigating rain erosion progression was evaluated for the DTU 10 MW wind turbine. Two operational strategies were considered: (1) when rainfall intensity exceeds 20 mm/h, blade rotational speed is reduced to 90% of the nominal value; and (2) when rainfall intensity exceeds 5 mm/h, the blade rotation speed is reduced to 70%. Figure 15 presents the corresponding incubation time and annual energy production (AEP) for the two erosion-safe mode strategies. Both values are normalized relative to those obtained under normal operation without the implementation of erosion-safe mode strategies. Figure 15a) corresponds to erosion-safe mode strategy 1, while Figure 15b) corresponds to strategy 2. Note that the color bar ranges differ between a) and b).
As shown in Figure 15, erosion-safe mode operation appears promising in Japan, particularly along the Pacific coast. In strategy 1, AEP decreases by approximately 0.2%, while the incubation time is extended by about 10 %. In strategy 2, although AEP decreases by around 2–3%, the incubation time can potentially be more than doubled in Pacific coast. On the Sea of Japan side, strategy 2 yields a 20–50 % improvement in incubation time. In both strategies, the relatively small reduction in AEP is attributed to the infrequent occurrence of heavy rainfall events in Japan, as illustrated in Figure 9.
Recently, TNO conducted detailed precipitation measurements in the North Sea and revealed that approximately 30% of annual erosion damage to wind turbine blades occurs within just 12 hours of the year [30]. This finding underscores the potential effectiveness of erosion-safe mode operation. Our results, presented in Figure 15, similarly demonstrate its applicability under Japanese meteorological conditions.
Figure 15.
Effects of erosion safe mode operation (left: incubation time, right: AEP).
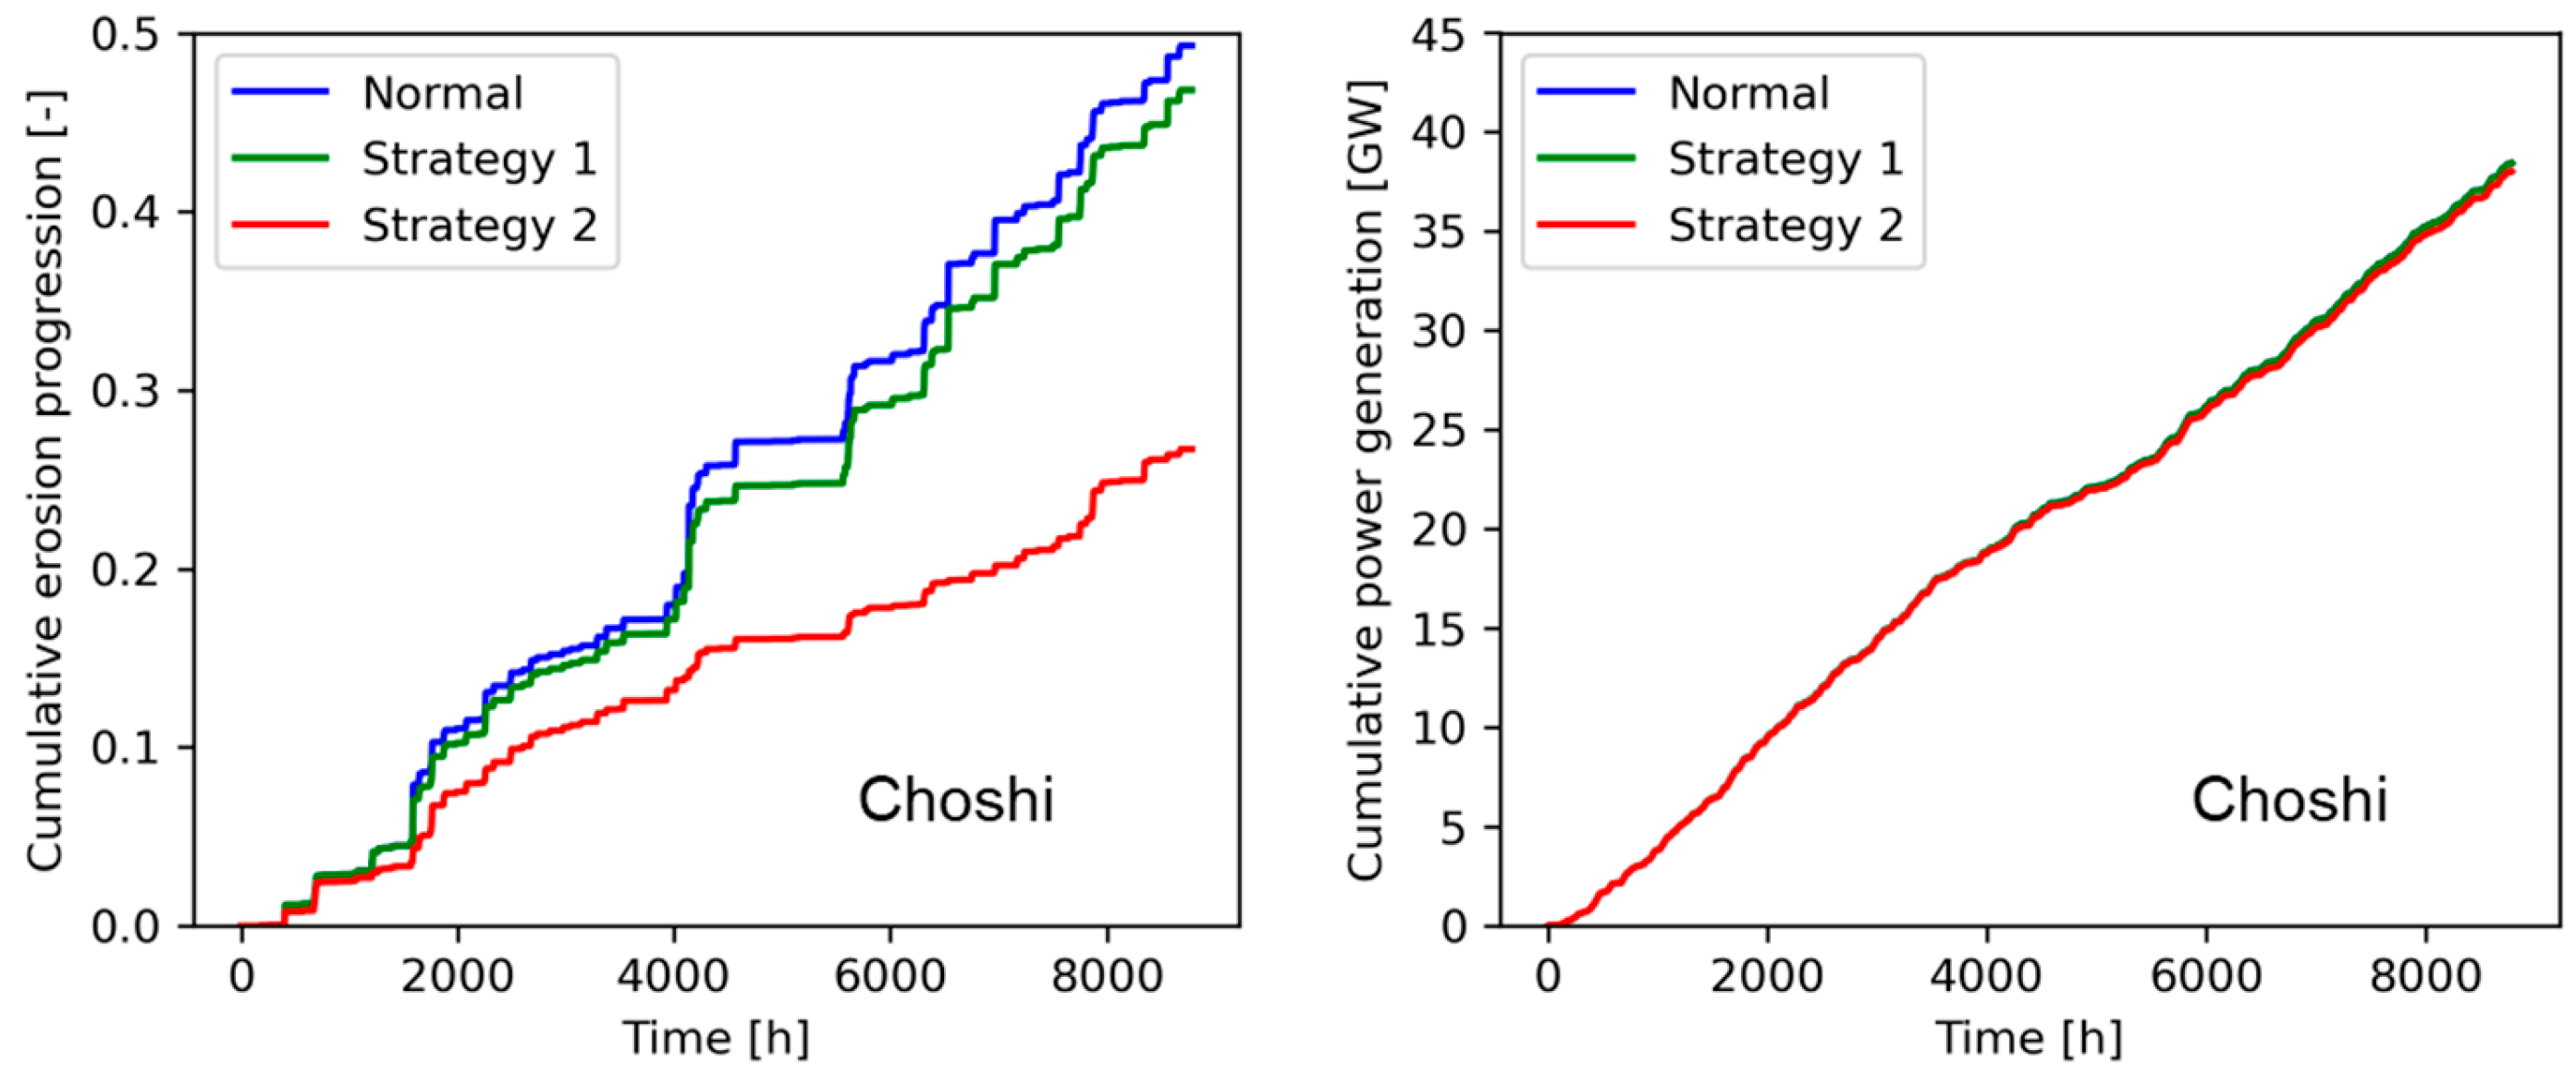
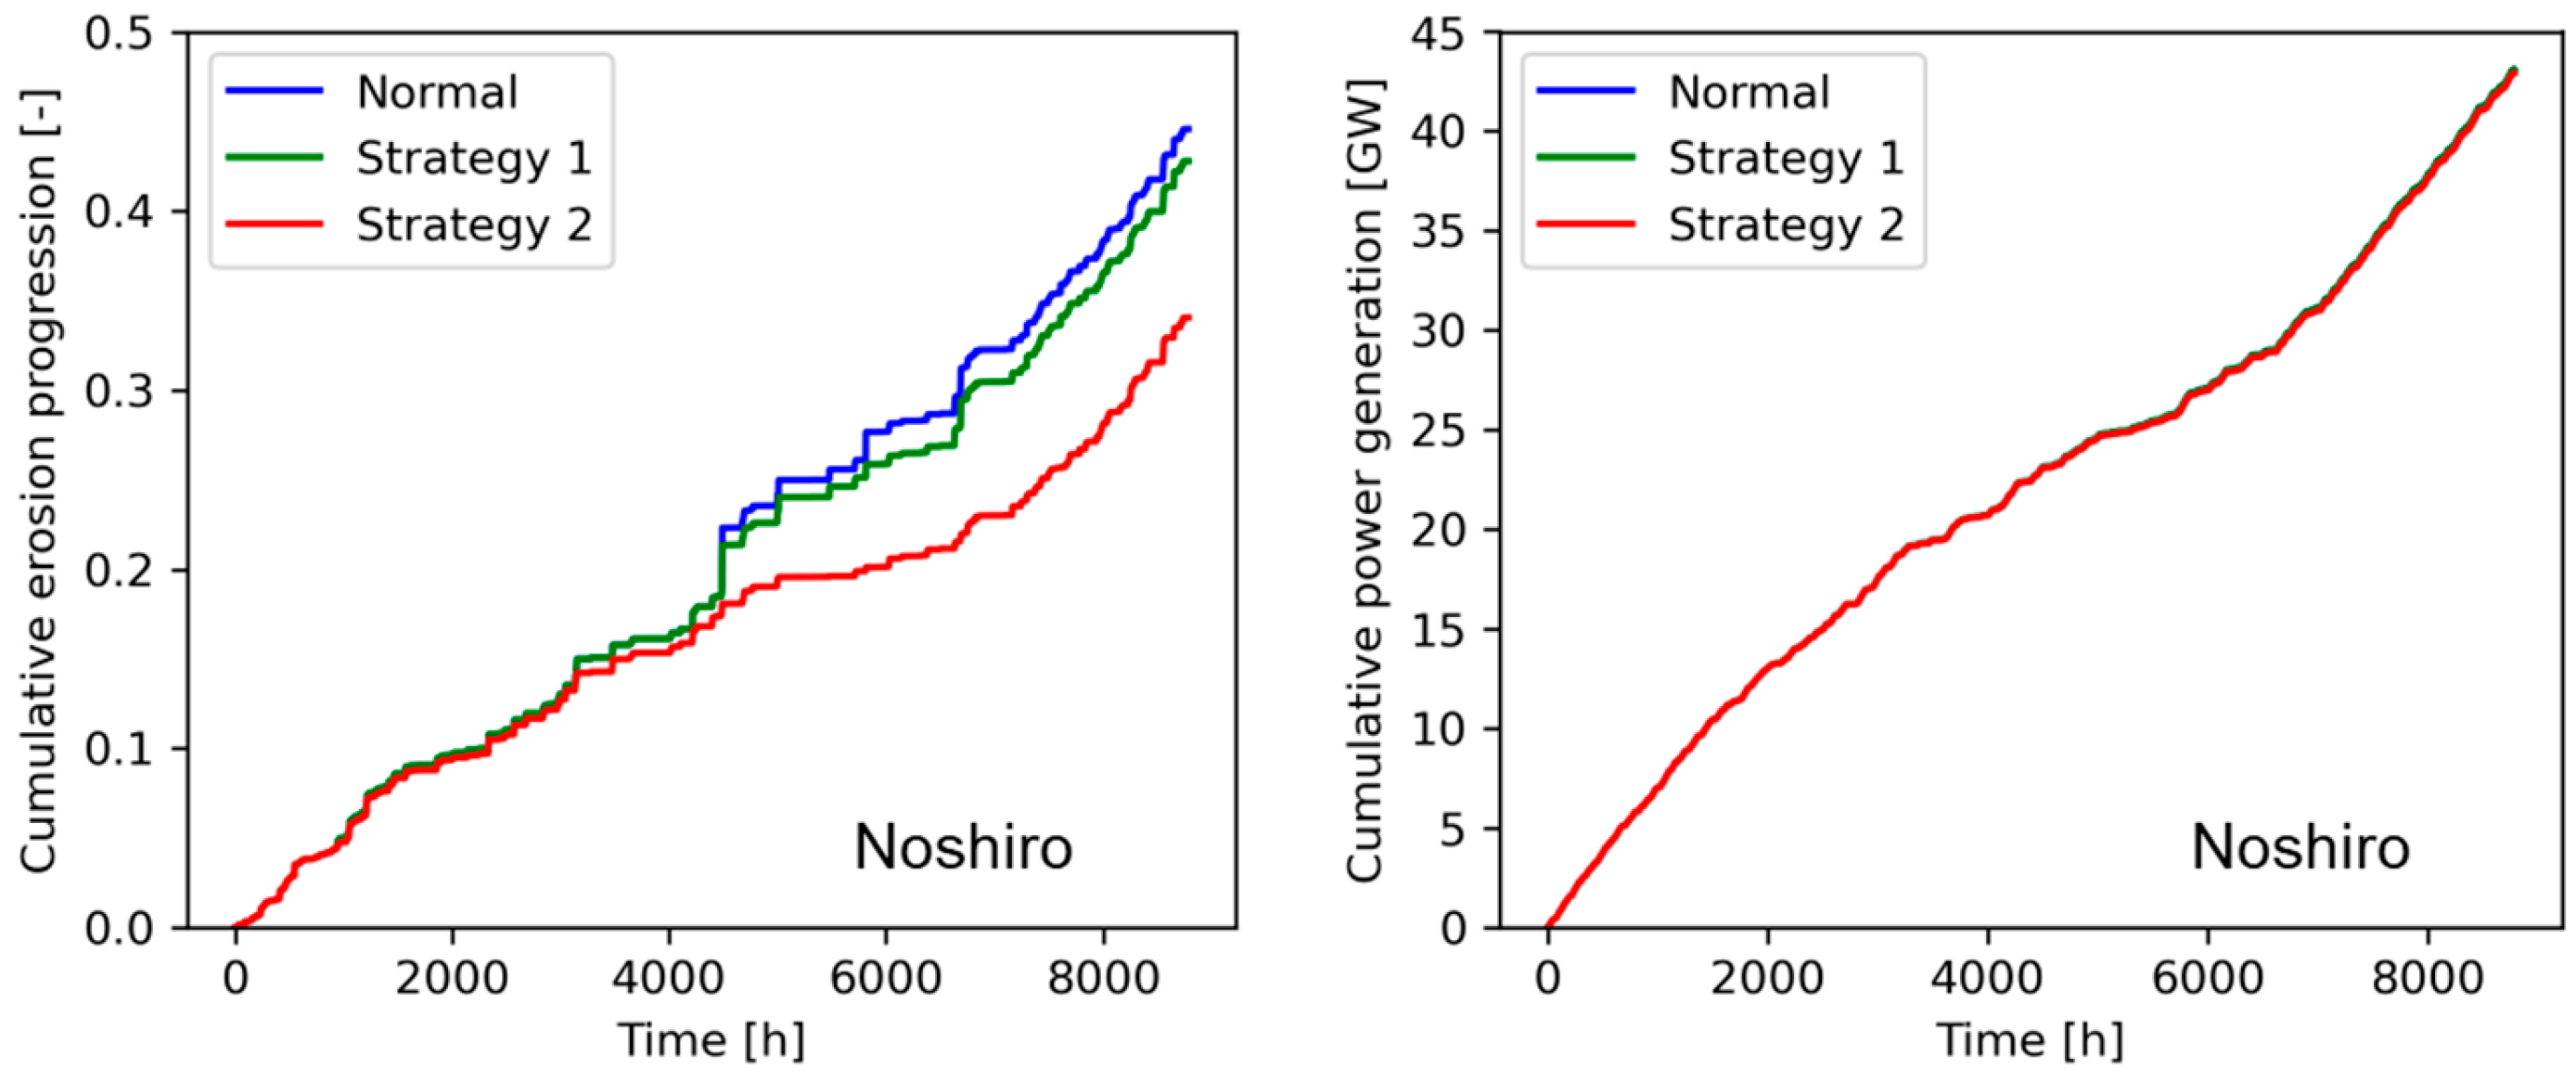
The effectiveness of the erosion-safe mode operation was further examined for Choshi and Noshiro using 2016 meteorological data. The rainfall intensity threshold was changed from 1 to 30 mm/h, and the rotor speed reduction was adjusted from 0.6 to 1.0 relative to the nominal speed. Figure 16 presents the ratios of incubation time enhancement and AEP reduction resulting from erosion-safe mode operation, relative to normal operation. The star and diamond symbols (★, ◆) represent two strategies shown in Figure 15. Figure 17 illustrates the cumulative erosion progression and power generation associated with these strategies throughout 2016, from January 1st to December 31st. Figure 17 clearly demonstrates that the erosion-safe mode operation significantly mitigates erosion progression, with only a slight reduction in annual power production. This suggests its potential to lower maintenance costs and increase annual revenue.
Figure 16 indicates that, at both sites, the erosion-safe mode operation is effective in suppressing rain erosion progression with only a minor decrease in AEP. The effectiveness of erosion-safe mode operation differs between the two sites. In Choshi, restricting rotor speed during rainfall intensities exceeding 1 mm/h results in up to an 80 % reduction in erosion progression, with an associated AEP loss of about 6%. In contrast, in Noshiro, the same safe-mode operational condition achieves up to a 60% reduction in erosion progression, while keeping power loss around 4%.
Figure 16.
Effect of erosion-safe mode operation (top: Choshi, bottom: Noshiro) (left: erosion progression, right: AEP, ★: strategy 1,◆: strategy 2).
Figure 16.
Effect of erosion-safe mode operation (top: Choshi, bottom: Noshiro) (left: erosion progression, right: AEP, ★: strategy 1,◆: strategy 2).
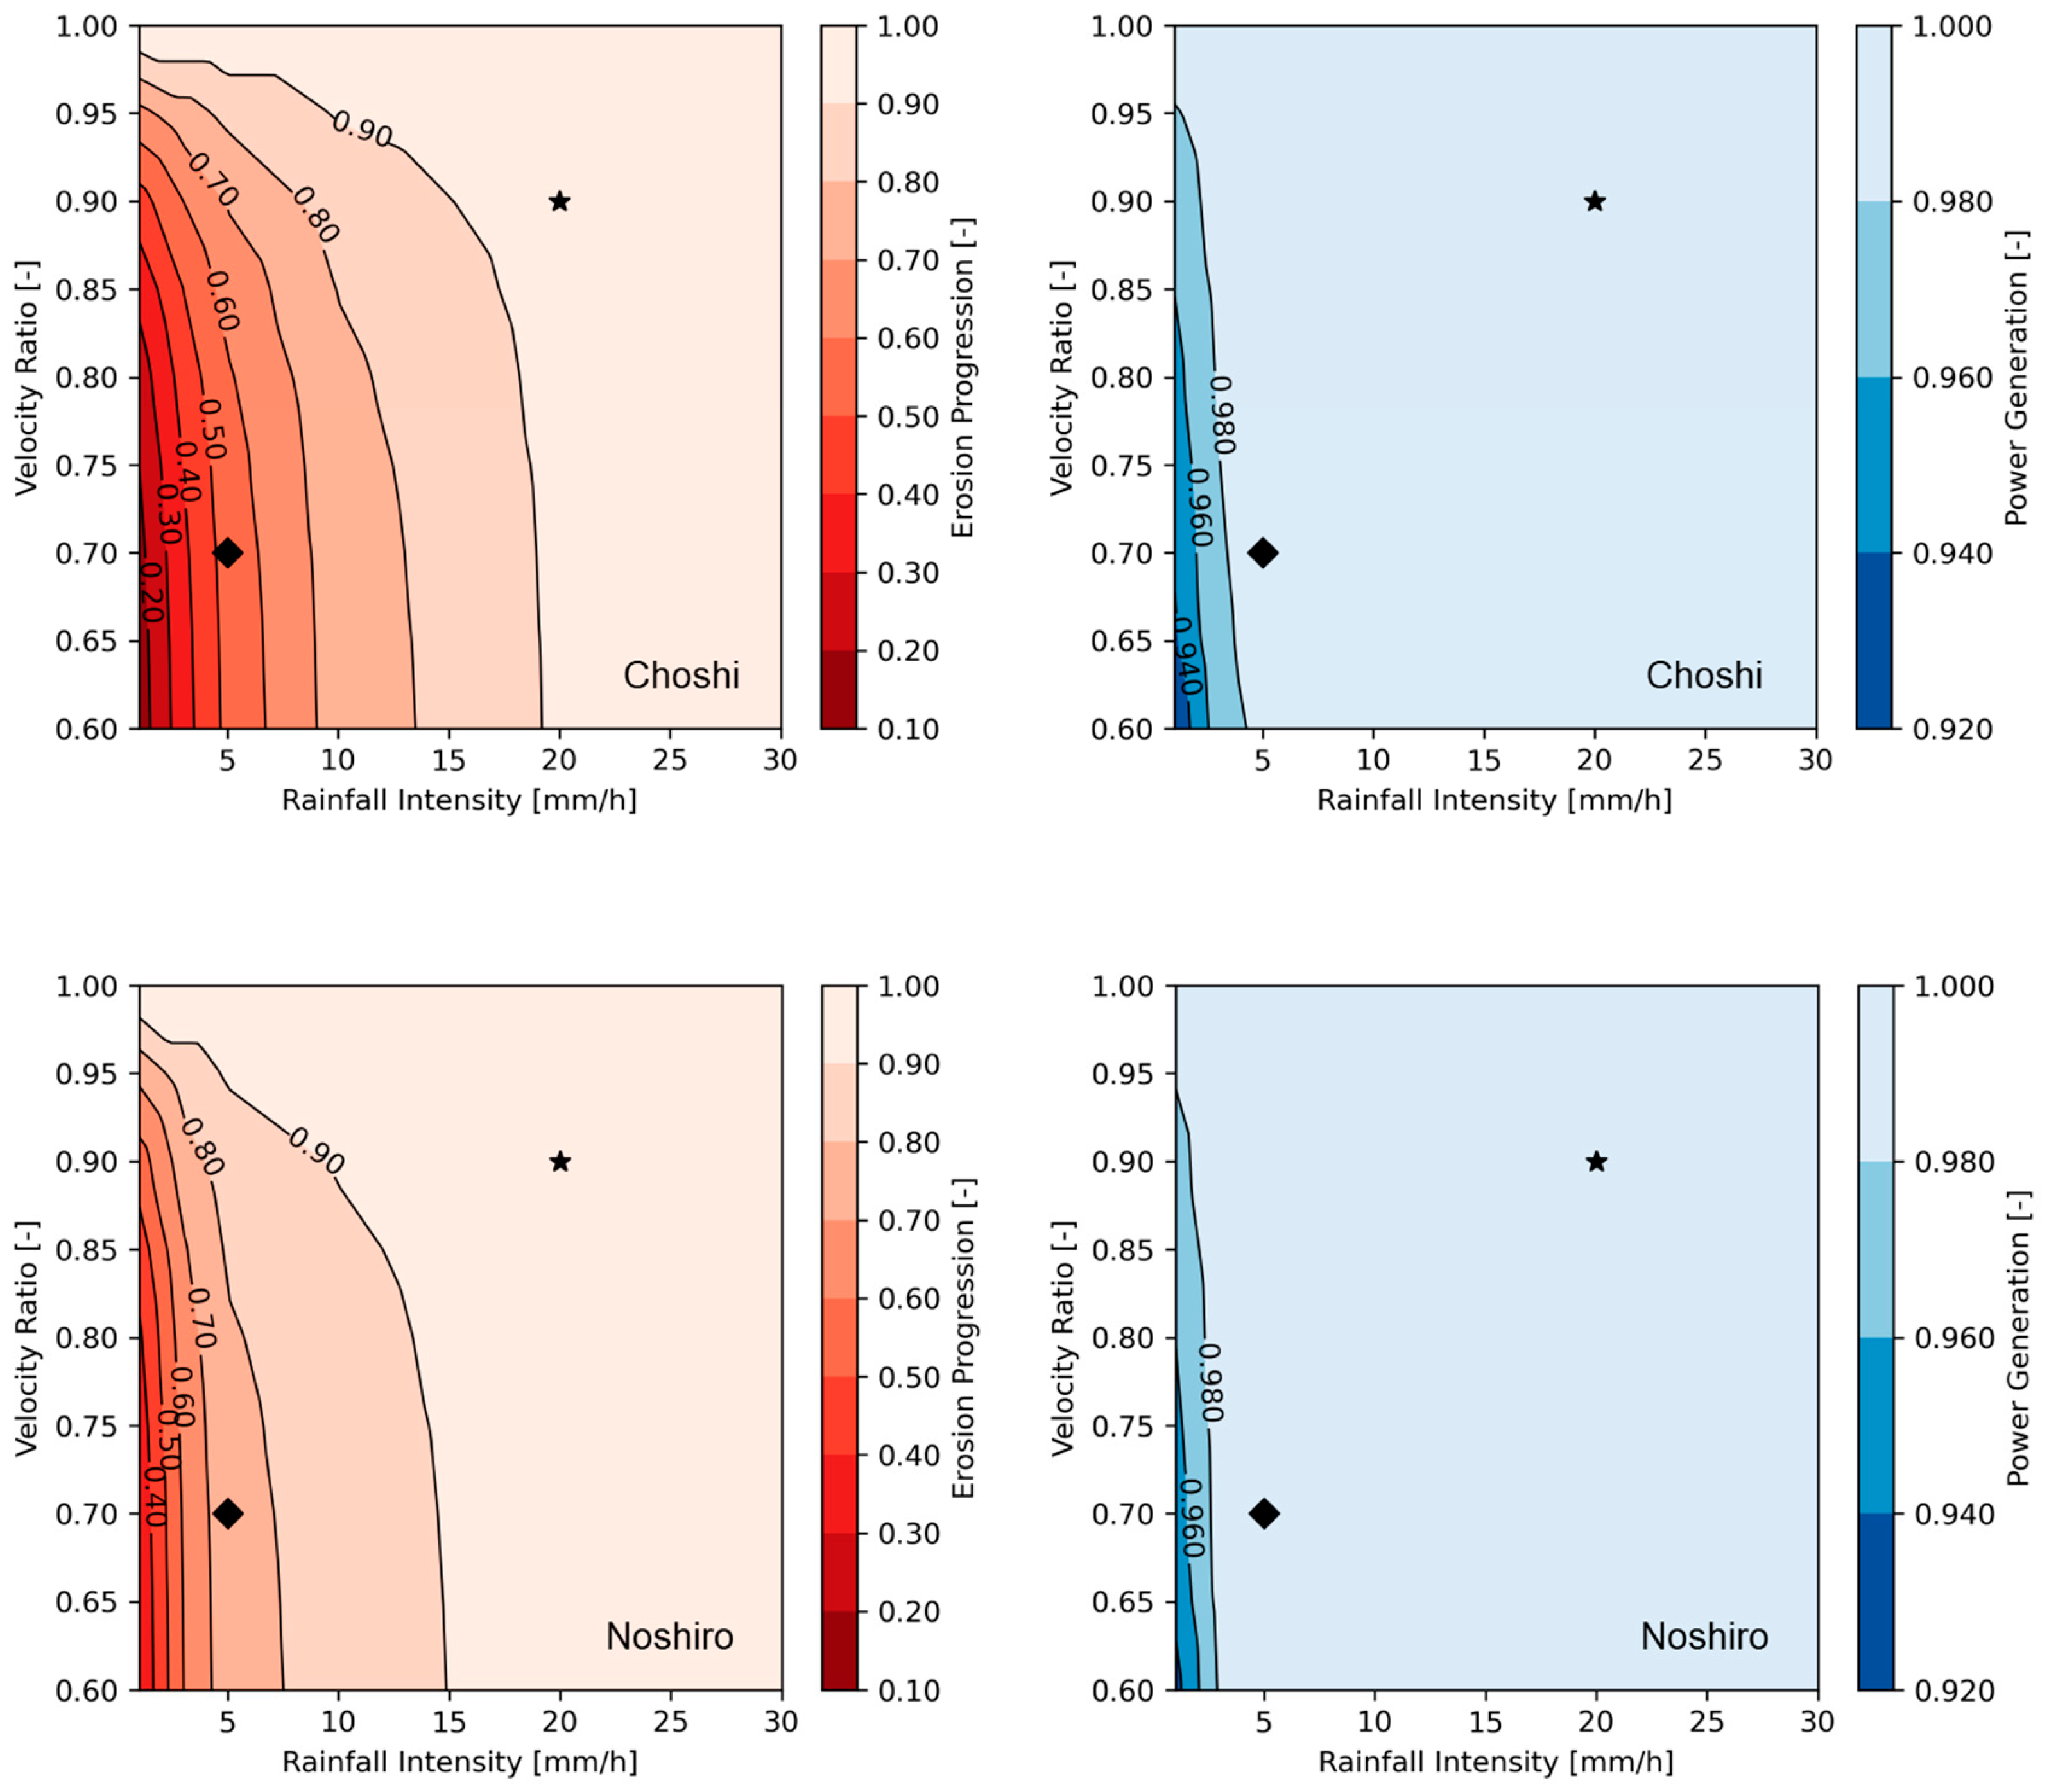
Figure 17.
Cumulative erosion progression and power generation (top: Choshi, bottom: Noshiro).
4. Discussion
Japan’s climate is shaped by its north-south geographic span and seasonal winds, rainy season, and typhoons, resulting in regionally diverse patterns of rainfall and wind speed. Accordingly, the developed rain erosion atlas presents both geospatial and seasonal differences in rain erosion progression. The Japanese government is actively promoting the expansion of offshore wind power within its Exclusive Economic Zone (EEZ), and this study evaluates rain erosion characteristics in these areas where observational data remain limited. The developed rain erosion atlas shows that regions in Japan where offshore wind power development is being promoted—such as Noshiro, Choshi, and Hokkaido—exhibit substantial differences in incubation times. Areas with shorter incubation times correspond to regions with higher annual precipitation, indicating that rainfall intensity plays a critical role in rain erosion progression.
Based on the kinetic energy model [1] and long-term rain rate and wind speed observations at 10-minute resolution at coastal stations around the North Sea, Baltic Sea, and inland areas, Hasager et al. [31] reported that the lifetime of leading-edge protection (LEP) for the IEA Wind 15MW turbine ranges from 1.4 to 2.8 years. Since the damage model adopted in this study differs from the kinetic energy model used in theirs, and because the relationship between incubation time and total time to failure (i.e., visible removal of the coating) is unclear (according to ref. [6], the total time to failure corresponds to three times the incubation time), a direct comparison of our results with the reported leading-edge lifetime [31] is challenging.
Using NORA 3 data, Hannesdottir et al. [7] assessed the incubation time of coating for the IEA 15 MW turbine with the same empirical damage model applied here (although they used the data of average drop diameter of 0.76 mm, and different reference velocity to calculate the impinged water column). Their results showed that the incubation time is, on average, 5 years for Baltic Sea wind farm sites and 3.2 years for North Sea sites [7]. In comparison, the incubation times obtained in this study for Japan for IEA 15 MW turbine are considerably shorter, ranging from 0.5 to 2 years. The higher precipitation levels in Japan relative to Europe underscore the risk of accelerated rain erosion progression and reduced incubation time when evaluated for the same wind turbine size.
In this study, the maximum relative velocity between the blade tip and falling raindrops was used to calculate rain erosion progression (see Equation (8)), following the approach in ref. [6], for a safety-oriented assessment. However, the relative velocity varies depending on the blade position (azimuth angle). When the blade tip moves horizontally, the relative velocity corresponds to the blade’s rotational speed, assuming the raindrops fall vertically to the ground. Moreover, wind speed alters the trajectory of falling raindrops, which in turn affects their relative velocity upon impacting the blade surface. Enhancing the accuracy of impingement velocity estimation is therefore essential for improving the reliability and precision of the rain erosion atlas.
Although this study calculated the rain erosion progression based on hourly rainfall intensity and wind speed on 5 km resolution grids, higher temporal [8,31] and spatial resolutions [7] are required to improve the accuracy and reliability of the erosion atlas. It should be noted that the tendency for wind speed overestimation in the CRIEPI-RCM-Era2 dataset compared to the AMeDAS measurements (see Figure 5) may affect incubation time, underscoring the need for further investigations, including the development of more advanced climate reproduction datasets.
As previously noted, satellite observations of raindrops [27] showed that their size is generally larger over land than over the sea, and that raindrops around Japan tend to be larger in winter than in summer. These variations in raindrop size warrant detailed investigation, since the size distribution directly influences rain erosion progression, as illustrated in Figure 10.
The reduced incubation time in Japan for larger wind turbines (10MW or 15MW) highlights the necessity of implementing erosion mitigation strategies. These strategies include new protective coatings or tapes, blade shells, and erosion-safe mode operation. Consistent with previous studies [1,8,30,31], erosion-safe mode operation has proven effective in significantly mitigating rain erosion progression—particularly on the Pacific Ocean Side—without causing substantial reductions in AEP. To enable erosion-safe mode operation, real-time measurement of rainfall intensity is required. This could be achieved using a Micro Rain Radar [32] that would allow control much faster than at 10-minute intervals for initiation and completion of erosion-safe mode operation for each rain event [31]. Adoption of erosion-safe mode operation may impose additional stress on the blade root as a result of frequent pitch control, thereby raising concerns about fatigue damage. Consequently, further investigation is required to evaluate the long-term impact of these stress variations on blade structural integrity and fatigue life.
In this study, degradation of the power curve due to rain erosion progression was not considered, with the focus placed on evaluating the incubation time during which the aerodynamic performance of the blade remains unchanged. However, if erosion progresses severely, it would affect the AEP by deteriorating the blade’s aerodynamic performance. Reported AEP losses of eroded blades range from 2% to 3.7% [33], 1.8% to 4.9% [34] and 5% [35]. Standard LEP tape also induces an AEP loss of 2% to 3%, whereas tapered LEP tapes can mitigate this loss [36]. To thoroughly examine the impact of safe-mode operation on power generation, it is essential to consider the effects of erosion progression as well as the influence of LEP coatings or tapes on blade aerodynamic performance.
Adoption of UV-resistant protective coatings is particularly desirable on the Pacific Ocean side, where annual solar radiation is comparatively higher than in Hokkaido region. In this study, only the effect of ultraviolet radiation on material degradation was considered; however, temperature and sea salt (corrosion) can also contribute to the deterioration of protective materials and influence the progression characteristics of rain erosion [9]. Future studies should take these additional factors into account.
A lack of knowledge regarding the effects of snow and sleet on erosion progression necessitates the development of methods to distinguish between rain and snow. Further discussion and investigation are required. The effect of hail was not considered in this study because hail occurs far less frequently than rain. However, the kinetic impact of hail can be significant [37], and thus the risk of hail impingement should be addressed in future studies.
5. Conclusions
In this study, the first Rain Erosion Atlas for Japan was developed using the simulation-based long-term meteorological dataset CRIEPI-RCM-Era2 and an empirical damage model. The Atlas reveals significant geographic and seasonal variability in rain erosion progression, reflecting Japan’s distinctive climate—characterized by four seasons, a humid rainy period in early summer, and frequent typhoons from late summer to autumn. The findings are summarized as follows:
- Larger wind turbines with higher blade tip speeds exhibit a markedly reduced incubation time for rain erosion initiation: approximately 3–12 years for the NREL 5 MW turbine, 1–4 years for the DTU 10 MW turbine, and 0.5–2 years for the IEA 15 MW turbine.
- Rain erosion tends to progress more rapidly on the Pacific Ocean side than on the Sea of Japan side or Hokkaido, owing to its higher annual precipitation.
- On the Pacific Ocean side, rain erosion primarily progresses during the rainy season and autumn rain/typhoon season, whereas on the Sea of Japan side, it tends to occur in winter. However, in order to accurately assess rain erosion progression during winter on the Sea of Japan side, it is essential to employ a reliable technique for differentiating between rainfall and snowfall.
- One year of ultraviolet exposure is estimated to reduce the incubation time by 20–25 % in Hokkaido, approximately 30 % in northern Japan, and around 35 % along the Pacific Ocean side.
- Erosion-safe mode operation is considered feasible in Japan, particularly along the Pacific coast, where infrequent but intense rainfall events account for a substantial portion of the annual rain erosion progression. This operational strategy demonstrates the potential to alleviate rain erosion with only a relatively minor reduction in annual power output.
Our findings reveal the shorter incubation time than that in northern Europe, primarily due to Japan’s higher annual precipitation. This study lays the groundwork for Japan’s wind energy sector, particularly in advancing erosion risk assessment, selecting optimal protective measures, and optimizing maintenance planning and strategies in erosion-prone regions.
Author Contributions
Conceptualization, E.S.; methodology, E.S.; validation, E.S.; formal analysis, E.S.; T.T. and H.N. investigation, E.S.; resources, A.H.; K.N.; H.T.; Y.H. and Y.K.; data curation, E.S.; A. H. and K.N.; writing—original draft preparation, E.S.; writing—review and editing, E.S.; A.H.; K.N.; T.T.; H.N.; H.T.; H.Y. and Y.K. visualization, E.S.; supervision, E.S.; project administration, E.S.; funding acquisition, E.S.; T.T. and H.T. All authors have read and agreed to the published version of the manuscript.
Conflicts of Interest
The authors declare no conflicts of interest.
References
- Bech, J.I.; Hasager, C.B.; Bak, C. Extending the life of wind turbine blade leading edges by reducing the tip speed during extreme precipitation events. Wind Energy 2018, 3, 729–748. [Google Scholar] [CrossRef]
- Mishnaevsky, L.; Hasager, C.B.; Bak, C.; Tilg, A-.M.; Bech, J.I.; Rad, S.D.; Fæster, S. Leading edge erosion of wind turbine blades: understanding, prevention and protection. Renewable Energy 169, 953–969. [CrossRef]
- Slot, H.M.; Gelinck, E.R.M.; Rentrop, C.; Heide, E. Leading edge erosion of coated wind turbines: Review of coating life models. Renewable Energy 80, 837–848. [CrossRef]
- Rad, S. D.; Mishnaevsky, L., Jr. Rain erosion of wind turbine blades: computational analysis of parameters controlling the surface degradation. Mecanicca 55, 725–743.
- Pugh, K.; Stack, M.M. Rain erosion maps for wind turbines based on geographical locations: A case study in Ireland and Britain. Journal of Bio- and Tribo-Corrosion 7, 34. [CrossRef]
- Verma, A.S.; Jiang, Z.; Ren, Z.; Caboni, M.; Verhoel, H.; Mijle-Meijer, H.V.D; Castro, S.G.P.; Teuwen, J.J.E. A probabilistic long-term framework for situ-specific erosion analysis of wind turbine blades: A case study of 31 Dutch sites. Wind Energy 24, 1315–1336. [CrossRef]
- Hannesdottir, A.; Kral, S.T.; Reuder, J.; Hasager, C.B. Rain erosion atlas for wind turbine blades based on ERA5 and NORA3 for Scandinavia. Results in Engineering 22, 102010. [CrossRef]
- Pryor, S.; Coburn, J.J.; Barthelmie, R.J. Spatiotemporal Variability in Wind Turbine Blade Leading Edge Erosion. Energies 2025, 18, 425–***. [Google Scholar] [CrossRef]
- Nash, J.W.K.; Zekos, I.; Stack, M.M. Mapping of meteorological observations over the Island of Ireland to enhance the understanding and prediction of rain erosion in wind turbine blades. Energies 14, 4555. [CrossRef]
- Keegan, M. H. Wind Turbine Blade Leading Edge Erosion: An investigation of rain droplet and hailstone impact induced damage mechanisms. PhD thesis, University of Strathclyde, UK, 2014. [Google Scholar]
- Hersbach, H.; Bell, B.; Berrisford, P.; Hirahara, S.; Horányi, A.; Muñoz-Sabater, J.; Nicolas, J.; Peubey, C.; Radu, R.; Schepers, D.; Simmons, A.; Soci, C.; Abdalla, S.; Abellan, X.; Balsamo, G.; Bechtold, P.; Biavati, G.; Bidlot, J.; Bonavita, M.; Chiara, G.; Dahlgren, P.; Dee, D.; Diamantakis, M.; Dragani, R.; Flemming, J.; Forbes, R.; Fuentes, M.; Geer, A.; Haimberger, L.; Healy, S.; Hogan, R.J.; Hólm, E.; Janisková, M.; Keeley, S.; Laloyaux, P.; Lopez, P.; Lupu, C.; Radnoti, G.; Rosnay, P.; Rozum, I.; Vamborg, F.; Villaume, S. The ERA 5 global reanalysis. Q. J. R. Meteorol/ Soc. 146(730), 1999–2049. [CrossRef]
- Haakenstad, H.; Breivik, Ø.; Furevik, B.R.; Reistad, M.; Bohlinger, P.; Aarnes, O.J. NORA3: a nonhydrostatic high-resolution hindcast of the North Sea, the Norwegian Sea, and the Barents Sea. J. Appl. Meteorol. Climatol. 60(10), 1443–1464. [CrossRef]
- NEDO wind map. Available online: https://appraw1.infoc.nedo.go.jp/nedo/index.html (accessed on 8 December 2025).
- Lightning library in Japan. Available online: https://www.franklinjapan.jp/raiburari/data/ (accessed on 8 December 2025).
- Hashimoto, A.; Hiraguchi, H.; Tamura, H.; Hattori, Y.; Matsunashi, S. A 53-year reproduction run over Japan using a regional climate mode. CRIEPI report (in Japanese). N13004.
- Jonkman, J.; Butterfield, S.; Musial, W.; Scott, G. Technical Report NREL/TP-500-38060; Definition of a 5-MW Reference Wind Turbine for Offshore System Development.
- DTU 10MW reference wind turbine. Available online: https://nrel.github.io/turbine-models/DTU_10MW_178_RWT_v1.html (accessed on 8 December 2025).
- Gaertner, E. Definition of the IEA Wind 15-Megawatt Offshore Reference Wind Turbine. IEA Wind TCP Task 37 Technical Report.
- Bech, J.I.; Johansen, N.F-J.; Madsen, M.B.; Hannesdottir, A.; Hasager, C.B. Experimental study on the effect of drop size in rain erosion test and on lifetime prediction of wind turbine blades. Renewable Energy 197, 776–789. [CrossRef]
- Hashimoto, A.; Hiraguchi, H.; Toyoda, Y.; Nakaya, K. Prediction of regional climate change over Japan due to global warming (Part 1)- Evaluation of Numerical Weather Forecasting and Analysis System (NuWFAS) applied to a long-term climate simulation -. CRIEPI report (in Japanese). N10044.
- Skamarock, W.C.; Klemp, J.B.; Dudhia, J.; Gill, D.O. NCAR Technical note 2008, NCAR/TN-475+STR; A description of the advanced research WRF version 3.
- ERA40 atlas. Available online: https://sites.ecmwf.int/era/40-atlas/docs/ (accessed on 8 December 2025).
- ERA interium. Available online: https://cds.climate.copernicus.eu/stac-browser/collections/reanalysis-era-interim?.language=en (accessed on 8 December 2025).
- Nanko, K.; Hotta, N.; Suzuki, M. Evaluating the influence of canopy species and meteorological factors on throughfall drop size distribution. J. Hydrology 329, 422–431. [CrossRef]
- Best, A.C. The size of distribution of raindrops. Quart. J. R. Met. Soc. 1950, 76, 16. [Google Scholar] [CrossRef]
- for natural resources and energy (METI). Available online: https://www.enecho.meti.go.jp/category/saving_and_new/saiene/yojo_furyoku/dl/saiene_kaiiki_gaiyou.pdf (accessed on 26 Nov 2025).
- Yamaji, M. 4-year climatology of global drop size distribution and its seasonal variability observed by spaceborne dual-frequency precipitation radar. J. Meteorological Soc. Japan. Ser. II 98-4, 755–773. [CrossRef]
- Iino, T.; Tanaka, M.; Baba, Y.; Nishida, Y.; Kawagoe, M.; Hinata, A.; Aihara, A.; Tanaka, H. Evaluation of ultraviolet radiation effects on the erosion resistance of wind turbine blade coatings. The 46th Symposium on Wind Energy Utilization., (in Japanese). 2024; pp. A2–03. [Google Scholar]
- Solar spectrum. Available online: https://solarphys.com/observation/line/ (accessed on 8 December 2025).
- TNO news. Available online: https://www.tno.nl/en/newsroom/2025/03/damage-prediction-wind-turbine-blades/ (accessed on 9 Nov 2025).
- Hasager, C.B.; Vejen, F.; Skrzypinski, W.R.; Tilg, A.-M. E. Rain erosion load and its effect on leading-edge lifetime and potential of erosion-safe mode at wind turbines in the North Sea and Baltic Sea. Energies 14, 1959. [CrossRef]
- Tilg, A.-M.; Hasager, C.B.; Kirtzel, H.-J.; Hummelshoj, P. Brief communication: Nowcasting of precipitation for leading-edge-erosion-safe mode. Wind Energ. Sci. 2020, 5, 977–981. [Google Scholar] [CrossRef]
- Han, W.; Kim, J.; Kim, B. Effects pf contamination and erosion at the leading edge of blade tip airfoils on the annual energy production of wind turbines. Renew. Energy 2018, 115. [Google Scholar]
- Law, H.; Koutsos, V. Leading edge erosion of wind turbines: Effect of solid airborne particles and rain on operational wind farms. Wind Energy 2020, 23, 10–1955. [Google Scholar] [CrossRef]
- Sareen, A; Sapre, C.A.; Selig, M.S. Effects of leading edge erosion on wind turbine blade performance: Effects of leading edge erosion. Wind Energy 2014, 17, 1531–1542. [Google Scholar] [CrossRef]
- Major, D.; Palacious, J.; Maughmer, M.; Schmitz, S. Aerodynamics of leading-edge protection tapes for wind turbine blades. Wind Engineering 2021, 45(5), 1296–131. [Google Scholar] [CrossRef]
- Leston, F.; Barthelmie, R.J.; Pryor, S.C. Rader-derived precipitation climatology for wind turbine blade leading edge erosion. Wind Energy Sci. 2020, 5, 331–347. [Google Scholar]
Figure 1.
Raindrop size distribution (a: measurements at 4 locations, b: Best’s eq. [25]).
Figure 1.
Raindrop size distribution (a: measurements at 4 locations, b: Best’s eq. [25]).

Disclaimer/Publisher’s Note: The statements, opinions and data contained in all publications are solely those of the individual author(s) and contributor(s) and not of MDPI and/or the editor(s). MDPI and/or the editor(s) disclaim responsibility for any injury to people or property resulting from any ideas, methods, instructions or products referred to in the content. |
© 2025 by the authors. Licensee MDPI, Basel, Switzerland. This article is an open access article distributed under the terms and conditions of the Creative Commons Attribution (CC BY) license.
Copyright: This open access article is published under a Creative Commons CC BY 4.0 license, which permit the free download, distribution, and reuse, provided that the author and preprint are cited in any reuse.


