Submitted:
19 December 2025
Posted:
22 December 2025
You are already at the latest version
Abstract
Nuclear power plants must be safe, reliable and ensure the planned supply of electricity. The metal of the equipment operates in conditions of high pressure values and fluid tem-peratures, in radiation and in corrosive working environments. These factors cause deg-radation of the metal mechanical properties. Defects appear in the structure and this leads to a decrease in the operability of the equipment and to compromise the NPP safety. In the "worst case", the facilities could be torn apart and a nuclear accident could occur. The mechanical characteristics of the metal should be periodically examined. The topic in this article is the study of stress intensity factor for defects on the inner surface of the reactor vessel. The metals on the inner surfaces of the vessels of two nuclear reactors were studied by a visual method. Stress intensity coefficients have been calculated at the site of defects, taking into account the influence of the embrittlement factors. The results are compared with the requirements of the strength standards. The purpose of the investigation is to check whether the facility can continue to be operated safely. The algorithm can be used as a methodology for periodically examining defects detected during the operation of the unit.
Keywords:
nuclear power plant
; metal embrttlement
; ageing
1. Introduction
Nuclear power plants must be safe, reliable and ensure the planned supply of electricity. Many nuclear units are operated for a period of several decades. The design period of the NPP vessels is estimated at 30-35 years. According to the IAEA, 29 numbers of reactors have been operating for 40 years, and another 160 numbers - for more than 40 years [1]. These nuclear units are operating beyond the warranty period. The metal of the equipment operates in conditions of high pressure values and fluid temperatures along the primary and secondary circuits, in radiation and in corrosive working environments. These factors cause degradation of the mechanical properties of the metal and a decrease in the bearing capacity of the vessels. In the “worst-case scenario”, it could lead to metal rupture and a nuclear accident, which – undoubtedly – means the loss of human lives and many resources. This is absolutely unacceptable, forbidden, unthinkable! Here is the role of scientists, educators, energy engineers and government regulators – society relies on their knowledge, competencies, professionalism and morals, but this is a separate and very long topic. Therefore, it is important to periodically investigate the mechanical characteristics of the metal of the equipment of a nuclear unit. The mechanisms of degradation of mechanical properties of WWER plants are neutron and thermal aging, fatigue, corrosion and erosion wear, mechanical wear [2]. RPV metal is subject to the most aggressive environmental impact due to nuclear chain decay processes [3÷6]. The neutrons in the reactor are of high energy (over 1.5 MeV) and low mass; they penetrate the metal crystal lattice of the metals of the internal housing devices and cause point and volumetric defects in the structure. During the processes of nuclear decay, an amount of heat is released. The radiation working environment causes neutron and thermal brittleness of the metal. The metal from the internal surfaces of the equipment is corroded by contact with fluids (general and local corrosion), thermohydraulic loads (stress corrosion) and by radiation environment (intergranular corrosion). Contacting metal surfaces can cause metal wear defects. So, on the one hand of the aging process of equipment, we have many mechanisms of degradation of the mechanical properties of the metal, and on the other side - testing of the metal of the equipment is carried out through “standard” methods of control (testing), there is a periodicity, technological procedures and regulations, etc. It seems that everything is fine with aging and there will be no “worst-case scenario”. My 33 years of practice in the field of technical diagnostics of nuclear power plants shows, however, that the “standard” test methods “cover” the destruction of the metal only in the first 15-20 years of the operation of the nuclear unit. Later in time, the metal ages under the influence of the synergistic action of degradation mechanisms, defects develop, sometimes very quickly, and the methods remain the same as at the beginning of the unit’s operation. In order for the control (testing, monitoring) of the metal to be effective, it must be clarified: 1) Whether the methods applied are sensitive to the effects of aging; 2) Are these characteristics measured (calculated) that will lead to the destruction of the metal. The subject of research in this article is the metal on the inner surface of the reactor vessel, type WWER, Figure 1. Defects were found on the metal surface.
The cause of the defects is mechanical wear, and their growth is under the influence of environmental factors - high pressures and temperatures of fluids, radiation, corrosion and erosion. Violation of the integrity of the RPV surface is an extremely undesirable phenomenon. Safety is a top priority for any nuclear power plant – it is an unconditional requirement. In order for the operation of the nuclear unit to continue, it is required to prepare analyses of the admissibility of defects. The practical study is through a visual inspection method that is regularly applied to the inner surface of the reactor vessel every 4 years. After 15-20 years of operation of the unit, defects in the metal appear and develop, which can be observed, determine their location and measure the parameters of defects. Theoretical research is to calculate the mechanical characteristics of the metal. Since in this case real metals of real nuclear power plants are examined (it is not a laboratory facility), a conservative approach should be applied to the assessments – i.e. to consider the worst case. A priori, it is assumed that there is an embrittlement of metals due to neutron and thermal aging and from the presence of defects. This article discusses the process of evaluating defects in metal by the criterion of brittle fracture resistance; only three mechanisms of base metal degradation are evaluated – neutron and thermal aging and embrittlement due to surface defects.. Тhe main aim of the work is to present an approach (a methodology) for periodically examining defects during the operation of the unit. In principle, nuclear units can operate safely only if the requirements of the strength standards are met. For the specific test case, it is proven that the strength requirements are met and the unit can be operated safely – at least during the next test in 4 years.
2. Materials and Methods
The focus of the current study is based on RPV metal. The reactor materials are austenitic steels and ferrite-pearlite steels with austenitic surfacing coating. Austenitic steels are corrosion-resistant, have appropriate technological properties and operate up to temperatures of 700 °C. Steels of type 08X18H10T are radiation-resistant. Alloyed pearlite chromium-molybdenum-vanadium steel 15X2NMFA has two layers of austenitic overlay. Steels of the type 15X2MFA, 15X2NMFA, A542, A543, A508 have resistance to radiation brittleness, high strength and good ductility, but are not corrosion-resistant [7]. The reactor vessels have an internal diameter of 3580 mm and a wall thickness of 140 mm. The metal of the reactor vessel is controlled by a visual test method [8]; surface defects on the inner surface of the reactor vessel are detected. The monitored parameters are the type, size and location of the defects. In the presence of a group of defects, their mutual location is traced and the distances between the individual single defects are measured. The equipment used is a remote visual control system Figure 2a, which scans the inner surface of the entire body step by step, Figure 2b.
The underwater television surveillance system of the hull has specialized software for storing the location of indications, sizing, comparing with previous data, etc. Visual testing of the RPV metal is carried out periodically, according to technological regulations. The period is once every 4 years. The current study covers a period of 26 years. Defects on the inner surface of nuclear reactor casings have been registered. The place of defects is in the area of strengthening the Core barrel, Figure 1. Therefore, it is assumed that the initial cause of the defects is mechanical scuffing from the internal housing devices. The application of a visual method makes it possible to determine characteristics – the type and size of the defects, as well as the coordinates of their location. A study of the defects through a physics-mathematical model of calculations is forthcoming. Surface defects are schematized in the form of semi-ellipses, Figure 3.
The model for estimating the resistance to brittle fracture of the metal is deterministic. This means that the measured / calculated mechanical characteristics (in the application of the model) are compared with the normative permissible values. Specifically for this study, the calculated values of the stress intensity factor are compared with the critical factor (limit values of the coefficients), which are taken from the strength norms, [7]. In case several defects are found, closely located, these defects are schematized as one large defect - it is called “cluster” [9]. A cluster unites two or several inclusions (pores, slag or tungsten inclusions) with the maximum size over 0,2 mm and the minimum distance between their edges less than the distance specified for singular inclusions, but not less than the maximum width of any two adjacent inclusions under consideration. When assessing the distances between the clusters and inclusions the cluster shall be considered as a singular inclusion, Figure 4.
Stress intensity factor KI for a surface semi-elliptical crack is determined by the expression, [7]:

The dimensions of the defects on the inner surface of the housing are taken from the readings of the visual testing method equipment, Figure 5.
The values of at the defect site are determined, as well the values are calculated. The calculations are made for selected defects that are of the largest size. For these defects, their location is tracked, considered as the distance from the inner surface of the reactor vessel. The location factor is important because the values of fluence and thermo-hydraulic loads vary at different points on the RPV. Тhe values are compared with the critical ones , [7]. The criterion for evaluating metal with defects in terms of brittle fracture resistance is that the following condition is met:
For metals from the inner surface of the reactor vessel, the limit values constitute a function of of RPV metal, Figure 6.
In order to determine the values of critical stress intensity factors , it is need to find the values of Two methods are known for determining . The first method is a theoretical one - calculations using certain numerical models adopted in normative and methodological documents. The second method is a practical one - through analysis of surveillance specimens’ material. The theoretical method for analysis of is based on calculations. The values of fast neutron fluence with energy greater than 1,5 MeV, reaching the inside of the RPV wall are monitored through the neutron detector readings positioned around the reactor pressure vessel. Data sampling is performed once a year.

In the last 15 years, it has been assumed that the brittleness of the metal, irradiated for many years with neutron streams with an energy greater than 0,5 MeV is due to neutron and thermal aging. The embrittlement contributions of both components should not be considered separately. The embrittlement process depends on the chemical composition of the alloys, but also on the values of neutron fluence, operating temperature and running hours, which can be expressed as shown below [4]. The value added to the temperature shift has two components: one of the components is due to the neutron fluence , and the other one is due to the thermal embrittlement .
The practical (experimental) method for analysis of is based on the results from surveillance specimens impact strength tests. For the purpose of this study, the value of (F, t) has been calculated, the formulas (6, 9, 10, 11). Calculations were made of the embrittlement critical temperature on two RPVs with WWER-1000 reactors (referred to as “a” and “b”). The input data for defects from the inner surface of the reactor vessel are: type of inconsistencies, location, relative location, coordinates; sizes; orientations. An explanation of the meaning of the data is given in Table 1.
It is investigated which are the stressful environmental factors in the location of the identified defects; the influence of the factors is assessed. The operating conditions for the metal from the inner surface of the casing are characterized by intense neutron fluxes with neutron energy above 1,5 МeV; high pressure values (17,5 MPa) and the temperatures of the fluid along the primary circuit (323 ⁰С). Data on the effective stresses in the RPV metal can be obtained in two ways: from passport data and from the manufacturer’s strength analyses, or by strain gauge.
The input data for assessments of the ageing effects are:
- Datasheets with the composition of the reactor pressure vessels (passport data).
- Data of the fluence on the RPV in the course of each fuel cycle (campaign).
- Data from NPP logbooks about the running hours in each fuel cycle.
- Data from the surveillance specimens testing.
3. Results
The results of a visual test of the inner surface of the reactor vessel are presented on Figure 7.
The observed defects of the inner surface is entered into the database and systematized. After 15-17 years of operation of the unit, the first inconsistencies are found, which can be indicated by the test methods. There are corrosion and erosion foci concentrated in the zone of bullying by the reinforcing units of the internal casing devices. Clusters of surface defects in the shell surfacing are observed and their parameters are determined - coordinates and dimensions.
In order to calculate the , it is necessary to have data on the circular stresses at the location of the defect cluster. Relative stress distribution as a function of the distance X from the boundary of the overlay with the base metal is presented on Figure 8, for three different points in time since the beginning of the “Big Primary Leak” mode.
Using formula (1) are calculated the values of the stress intensity coefficients at three different points in time after the start of the “Big Primary Leak” mode, Table 2.
Further in this study, the values for the metal, in the location of the defects, are to be calculated. To determine it, we first need to calculate the shift of the critical metal temperature in the location of the defects. The results of the calculations are given in Table 3.
The values of the quantities ∆Tinf , bt, tОТ for the pressure vessel metal are summarized in Table 4.
Function for the base metal of the RPV metals, calculated according to (6) are presented in Figure 9.
Figure 9 shows a pronounced direct proportional relationship between the shift of critical temperatures and the neutron fluence. The base metal embrittlement of the reactor vessel increases with increasing fluence values. The embrittlement functions of the base metal for the two blocks coincide.
Function of the RPV base metals, calculated according to (11) are presented in Figure 10.
Figure 9 shows a nonlinear relationship between the shift of critical temperatures and the time worked. Thermal embrittlement for the base metal of the reactor vessel is maximum for the period of time between the 3-rd and 5-th year from the start of unit operation. After this period, thermal embrittlement decreases exponentially.
Function of the RPV base metals, calculated according to (9) are presented in Figure 11. Data from the experimental base metal tests of the surveillance specimens are also presented in Figure 11.
The lines in Figure 11 (BMa and BMb) show the embrittlement of the base metal of nuclear casings “a” and “b”, which is due to the two influencing factors – neutron embrittlement and thermal embrittlement. It is observed that in the first 8-9 years of operation, thermal aging makes the greatest contribution to an increase in the critical temperature of the base metal, and subsequently thermal aging decreases. After 10-11 years, he begins to feel neutron aging.
The resulting values for the RPV metal are presented in Table 5.
The values of the stress intensity coefficients are calculated (3), using the highest value of the shift of the critical temperature of the RPV metal.

4. Discussion
The defects detected by visual inspection have stress intensity factors , much smaller than the critical factors . Any analysis in nuclear energy should be done using a conservative approach. This means that the most unfavorable values should be taken into account in the calculations. In this particular case, this approach was followed at the following stages of the analyses: 1) Critical temperature values are taken , which is twice as high as the value obtained from the witness samples ). The confirmation of the model is the calculated critical values of coincide with the range of values defined in the strength norms [7].
This article discusses only three mechanisms of base metal degradation – neutron and thermal aging and embrittlement due to surface defects. The mechanisms of material fatigue degradation, fatigue, as well as the chemical processes of surface corrosion are not considered.
5. Conclusions
The conclusion is RPV metals with the identified defects have resistance to brittle fracture. The RPV can continue to be operated safely. This algorithm can be used as a methodology for periodically examining defects detected during the operation of the unit.
Abbreviations
The following abbreviations are used in this manuscript:
| WWER | Water-water energy reactor |
| NPP | Nuclear power plant |
| RPV | Reactor pressure vessel |
| IAEA | International Atomic Energy Agency |
| MeV | Mega electron volts |
| “Big Primary Leak” mode | Large leakage mode of primary circuit fluid, emergency design mode associated with loss of heat release and danger of heating and melting of the RPV metal |
| NOC | Normal Operation Condition |
| NNOC | Not Normal Operation Condition |
| HT | Hydraulic Test |
| EC | Emergency Condition |
| SS | Surveillance specimens |
| SS_BMa | Surveillance specimens, base metal of unit “a” |
| SS_BMb | Surveillance specimens, base metal of unit “b” |
| BM | Base metal |
| BMa | Base metal of unit “a” RPV |
| BMb | Base metal of unit “b” RPV |
| Depth of semi-elliptical crack | |
| Half-axle ratio of semi-elliptical crack | |
| Area of schematized defect | |
| Stress intensity factor | |
| Critical stress intensity factor | |
| Calibration function | |
| Circular stresses at the defect site | |
| Coefficient | |
| t | Running hours/years of the reactor metal |
| Material constants | |
| Radiation-induced embrittlement factor | |
| Double standard deviation of | |
| The metal critical temperature following a period of irradiation | |
| The metal initial critical temperature that corresponds to non-irradiated condition | |
| The critical temperature shift | |
| The critical temperature shift, due to thermal aging | |
| The critical temperature shift, due to metal’s fatigue | |
| or | The critical temperature shift, resulting from neutron irradiation due to the neutron fluence F |
| The critical temperature shift, resulting from thermal ageing | |
| The critical temperature shift, due to neutron fluence and time | |
| The critical temperature shift at t= | |
| The neutron fluence of neutrons whose energy exceeds 0.5 MeV, hitting the pressure vessel | |
| 1022 n/m2 | Standardized factor |
References
- https://pris.iaea.org/pris/home.aspx.
- Ageing Management for Nuclear Power Plants: International Generic Ageing Lessons Learned (IGALL), Safety Reports Series 2020, No. 82 (Rev.1) https://www-pub.iaea.org/MTCD/Publications/PDF/PUB1895_web.pdf.
- Dimova, G.T. Methodology for lifetime characteristics assessment of mechanical equipment in nuclear power plants. Ageing management of NPP mechanical equipment, IOP Conference Series: Earth and Environmental Science 2023, 1128 012020 https://iopscience.iop.org/article/10.1088/1755-1315/1128/1/012020/pdf.
- Dimova, G.T. Evaluation of metal ageing of Reactor Pressure Vessels in a Nuclear Power Plant under the influence of ageing mechanisms and environmental conditions, Proceedings of the Bulgarian Academy of Sciences 2023, 76 (11) https://proceedings.bas.bg/index.php/cr/article/view/425.
- Dimova, G.T. Ageing of Nuclear Power Plant’s Equipment. Assessment of Reactor Pressure Vessel ageing effect, Global Journal of Science Frontier Research 2023, 23, ISSN Online: 1947-3818 https://e-university.tu-sofia.bg/ETUS/publikacii/files/12050_Ageing_of_NPP_equipment._Assessment_of_RPV_ageing_.pdf.
- Dimova, G.T. Reactor Pressure Vessel Internals: Research on the Effects of Aging Caused by Operating Conditions, Journal of Power and Energy Engineering 2025, 13 (5), ISSN Online: 2327-5901 https://e-university.tu-sofia.bg/e-publ/files/19095_Reactor_Pressure_Vessel_Internals.pdf.
- PN AE G 7-002-86 Rules of equipment and pipelines strength calculation of Nuclear Power Plants USSR, State Committee for supervision over safe work practices in the Nuclear Power Industry, Gosatomnadzor, Russia 1987 http://docs.secnrs.ru/documents/pnaes/%D0%9F%D0%9D%D0%90%D0%AD_%D0%93-7-002-86/%D0%9F%D0%9D%D0%90%D0%AD-%D0%93-002-86e.htm.
- GOST R.50.05.08-2018 Conformity assessment in the form of control. Unified methods. Visual and Measuring Control, Gosatomnadzor, Russia 2018 https://meganorm.ru/Data2/1/4293732/4293732599.pdf.
- NP 105-18 Federal norms and rules in the field of the use of atomic energy “Rules for the control of metal equipment and pipelines of nuclear power plants in the manufacture and installation”, Gosatomnadzor, Russia 2018 https://www.russiangost.com/p-354538-np-105-18.aspx.
- IAEA NULIFE VERLIFE – Procedure for integrity and lifetime assessment of components and piping in WWER NPPs during operation – Tool for LTO International Conference on Nuclear Power Plant Life Management (PLiM) for Long Term Operations (LTO) 2012 https://inis.iaea.org/records/b9kbr-bb175.
- Brumovsky, M.; Martin, O. VERLIFE Guidelines for Integrity and Lifetime Assessment of Components and Piping in WWER Nuclear Power Plants - Appendices A-F, Publications Office of the European Union, Luxembourg, 2024, DOI:10.2760/58605, JRC138451.
- https://publications.jrc.ec.europa.eu/repository/handle/JRC138451.
Figure 1.
Reactor Pressure Vessel Internals, area with detected defects is shown in red.
Figure 2.
Visual control equipment and scheme for scanning the RPV inner surface: (a) Underwater system for RPV visual testing; (b) Scheme of visual testing of the RPV metal.
Figure 2.
Visual control equipment and scheme for scanning the RPV inner surface: (a) Underwater system for RPV visual testing; (b) Scheme of visual testing of the RPV metal.
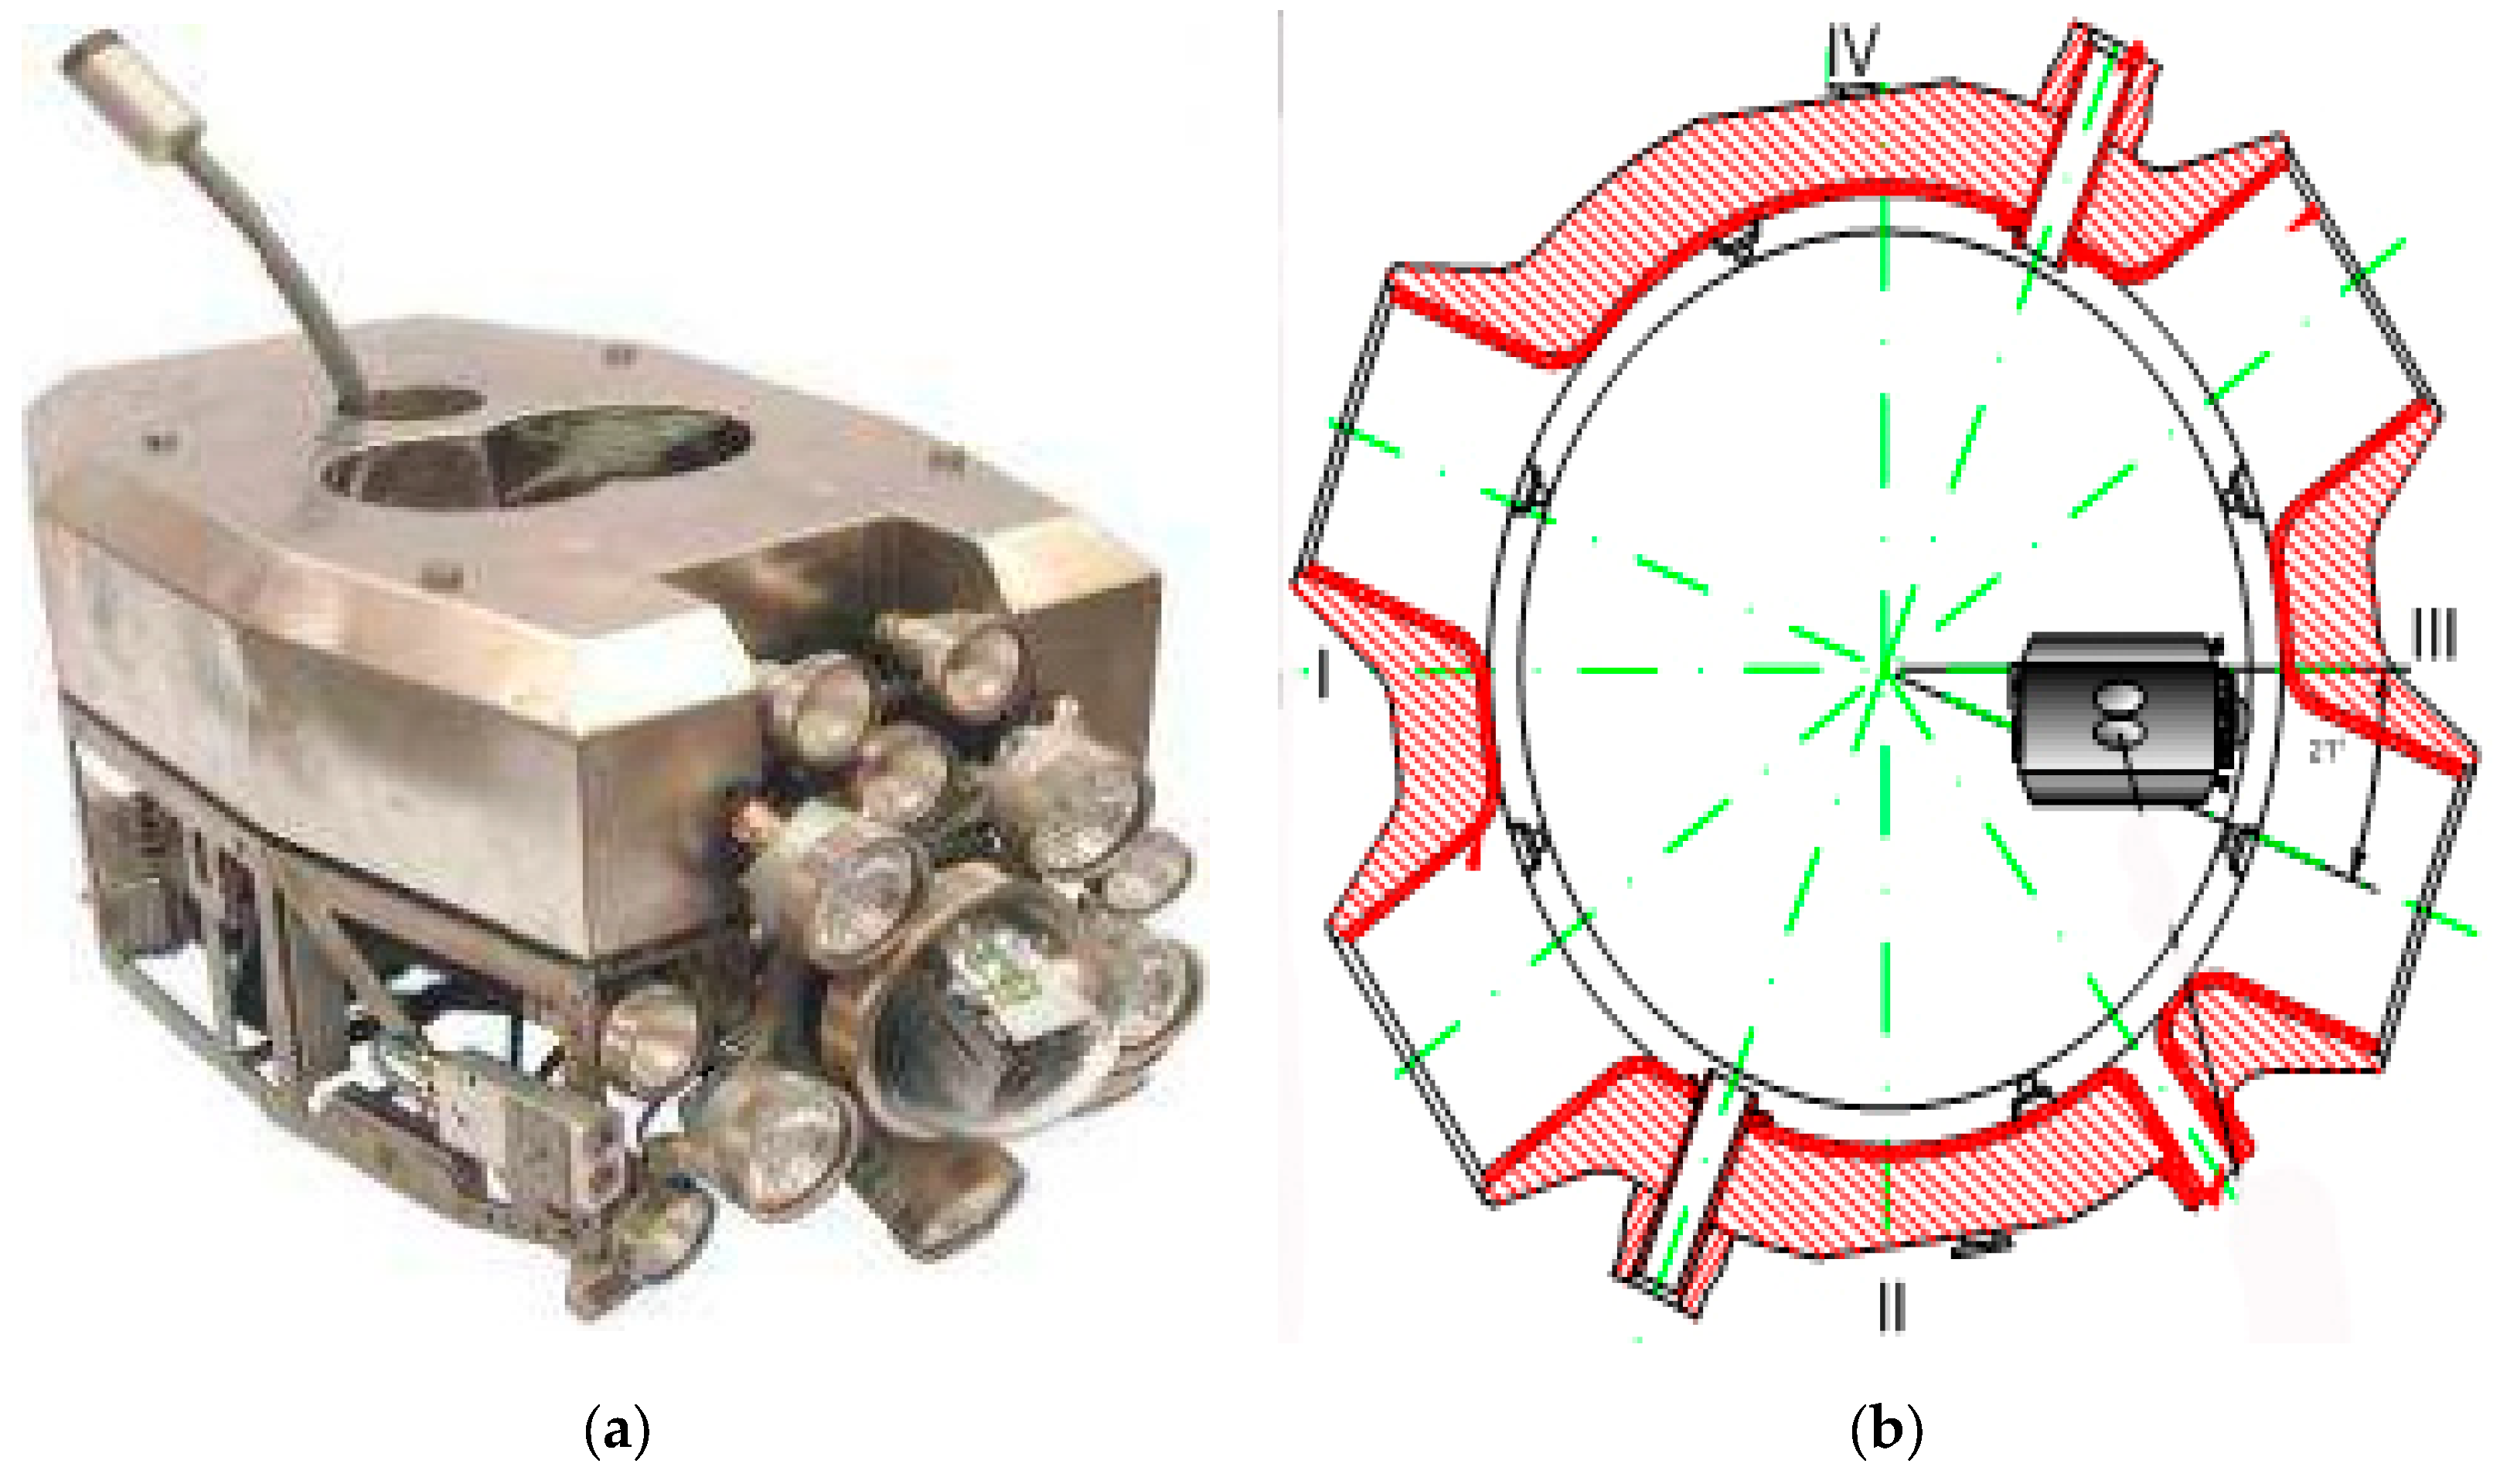
Figure 3.
Surface defect diagram (Semi-ellipse with a semi-major axis “a” and a semi-minor axis “c”.
Figure 3.
Surface defect diagram (Semi-ellipse with a semi-major axis “a” and a semi-minor axis “c”.
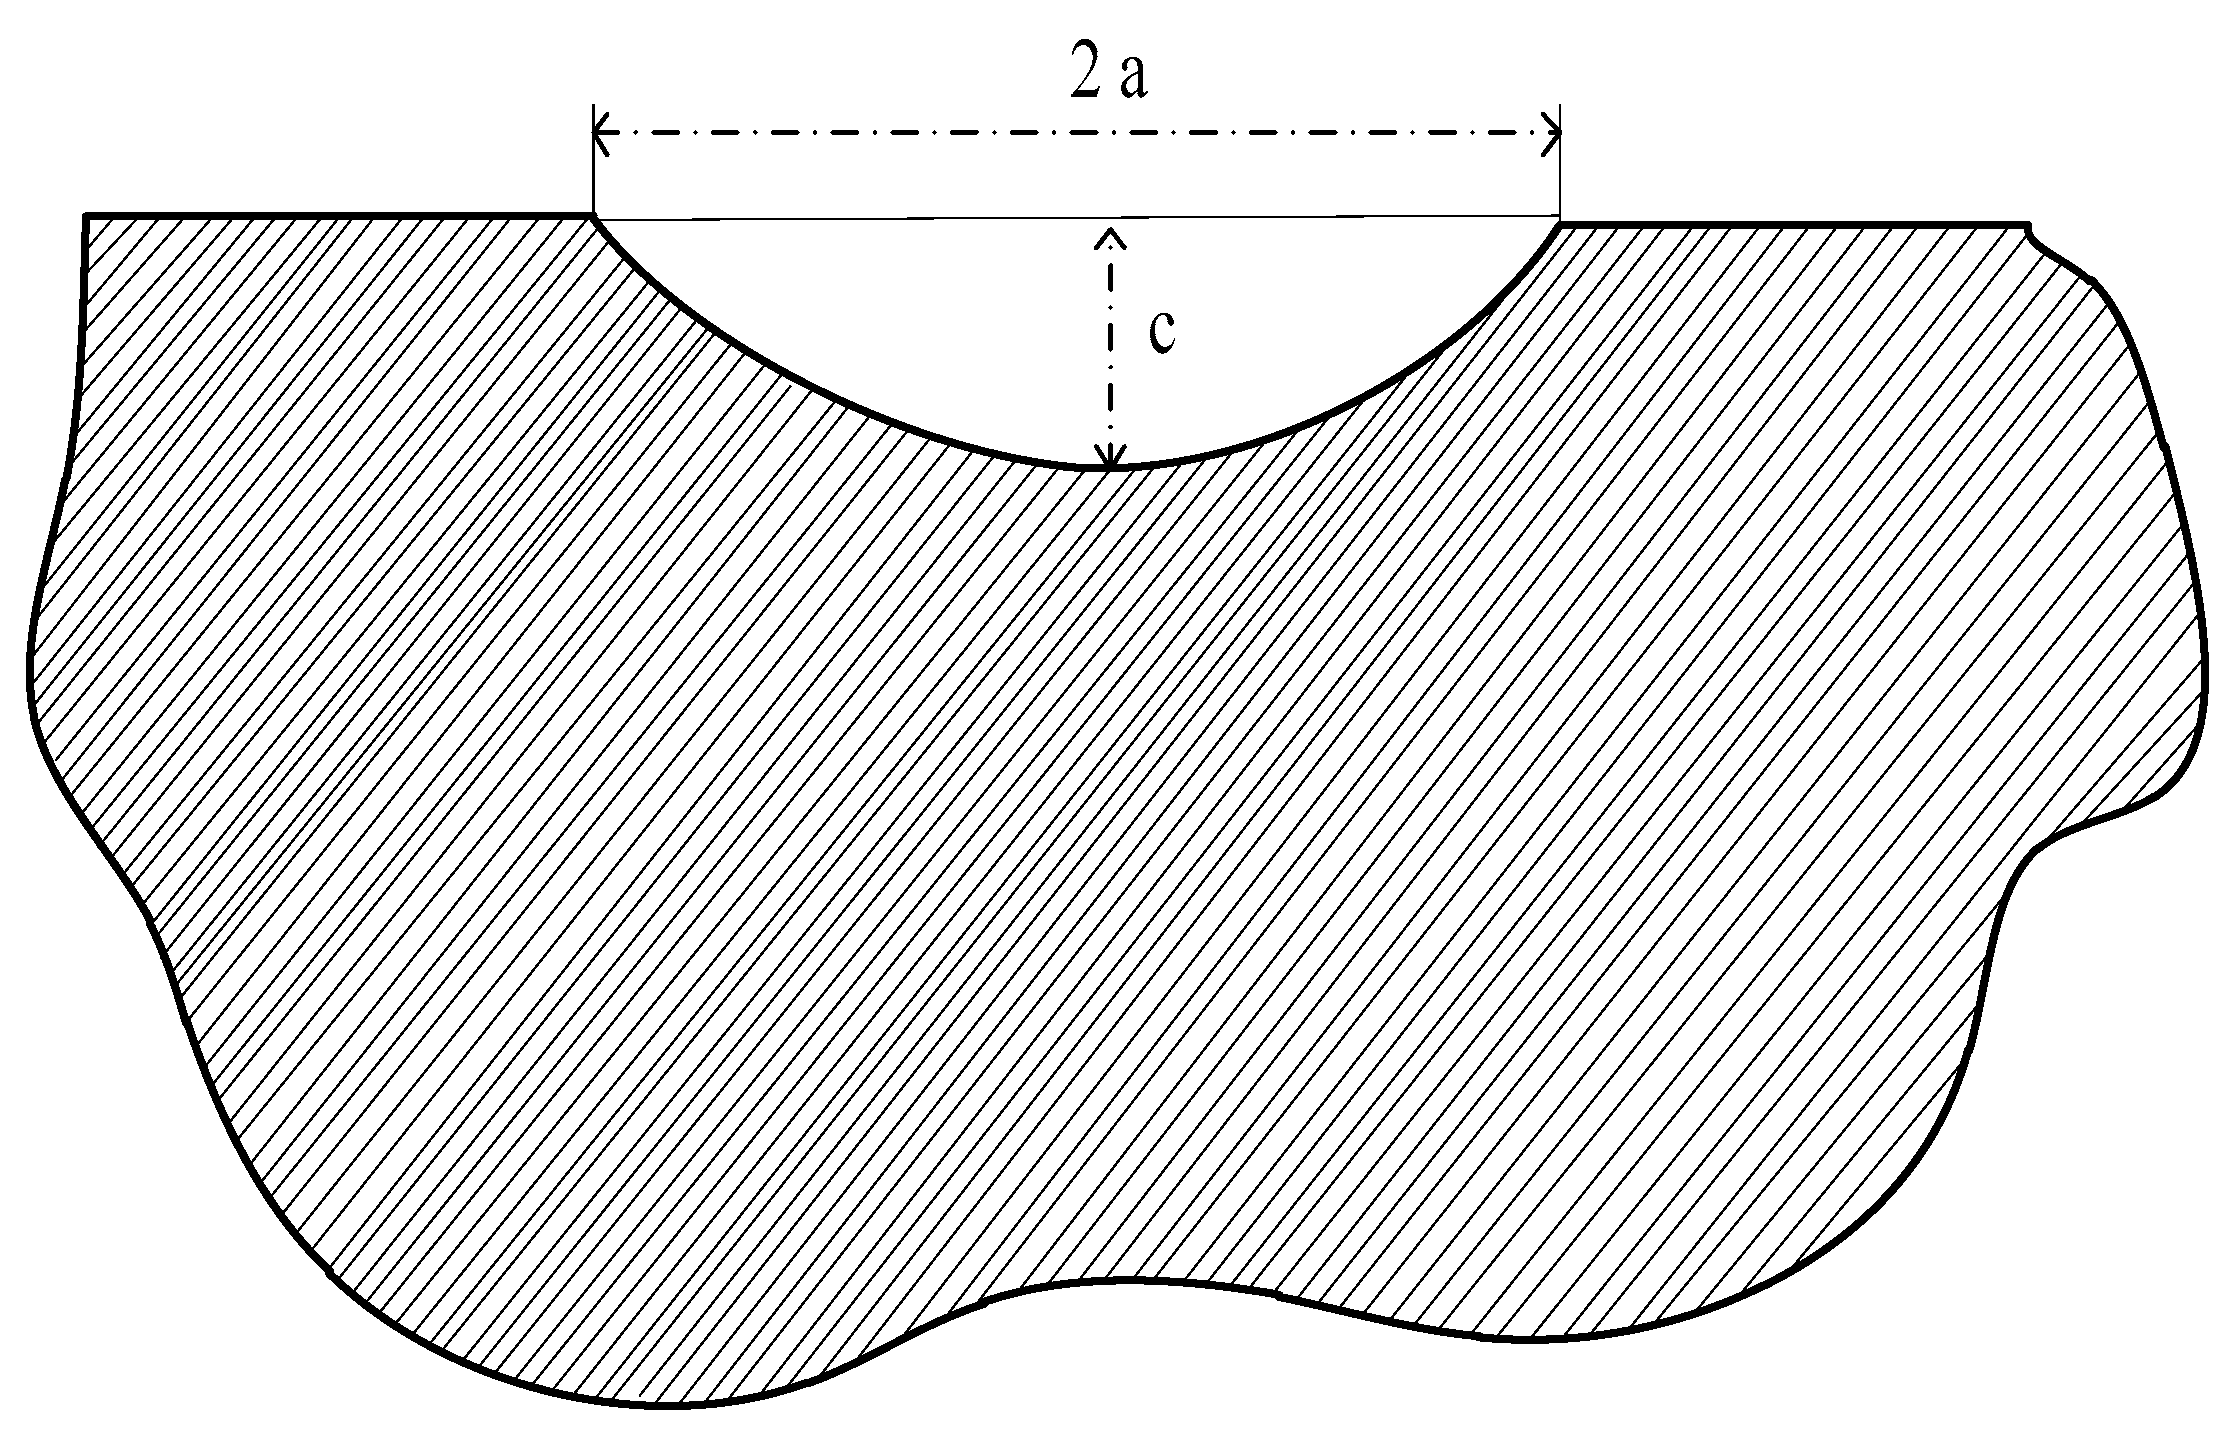
Figure 4.
Scheme of a cluster of defects; A, B - cluster dimensions.
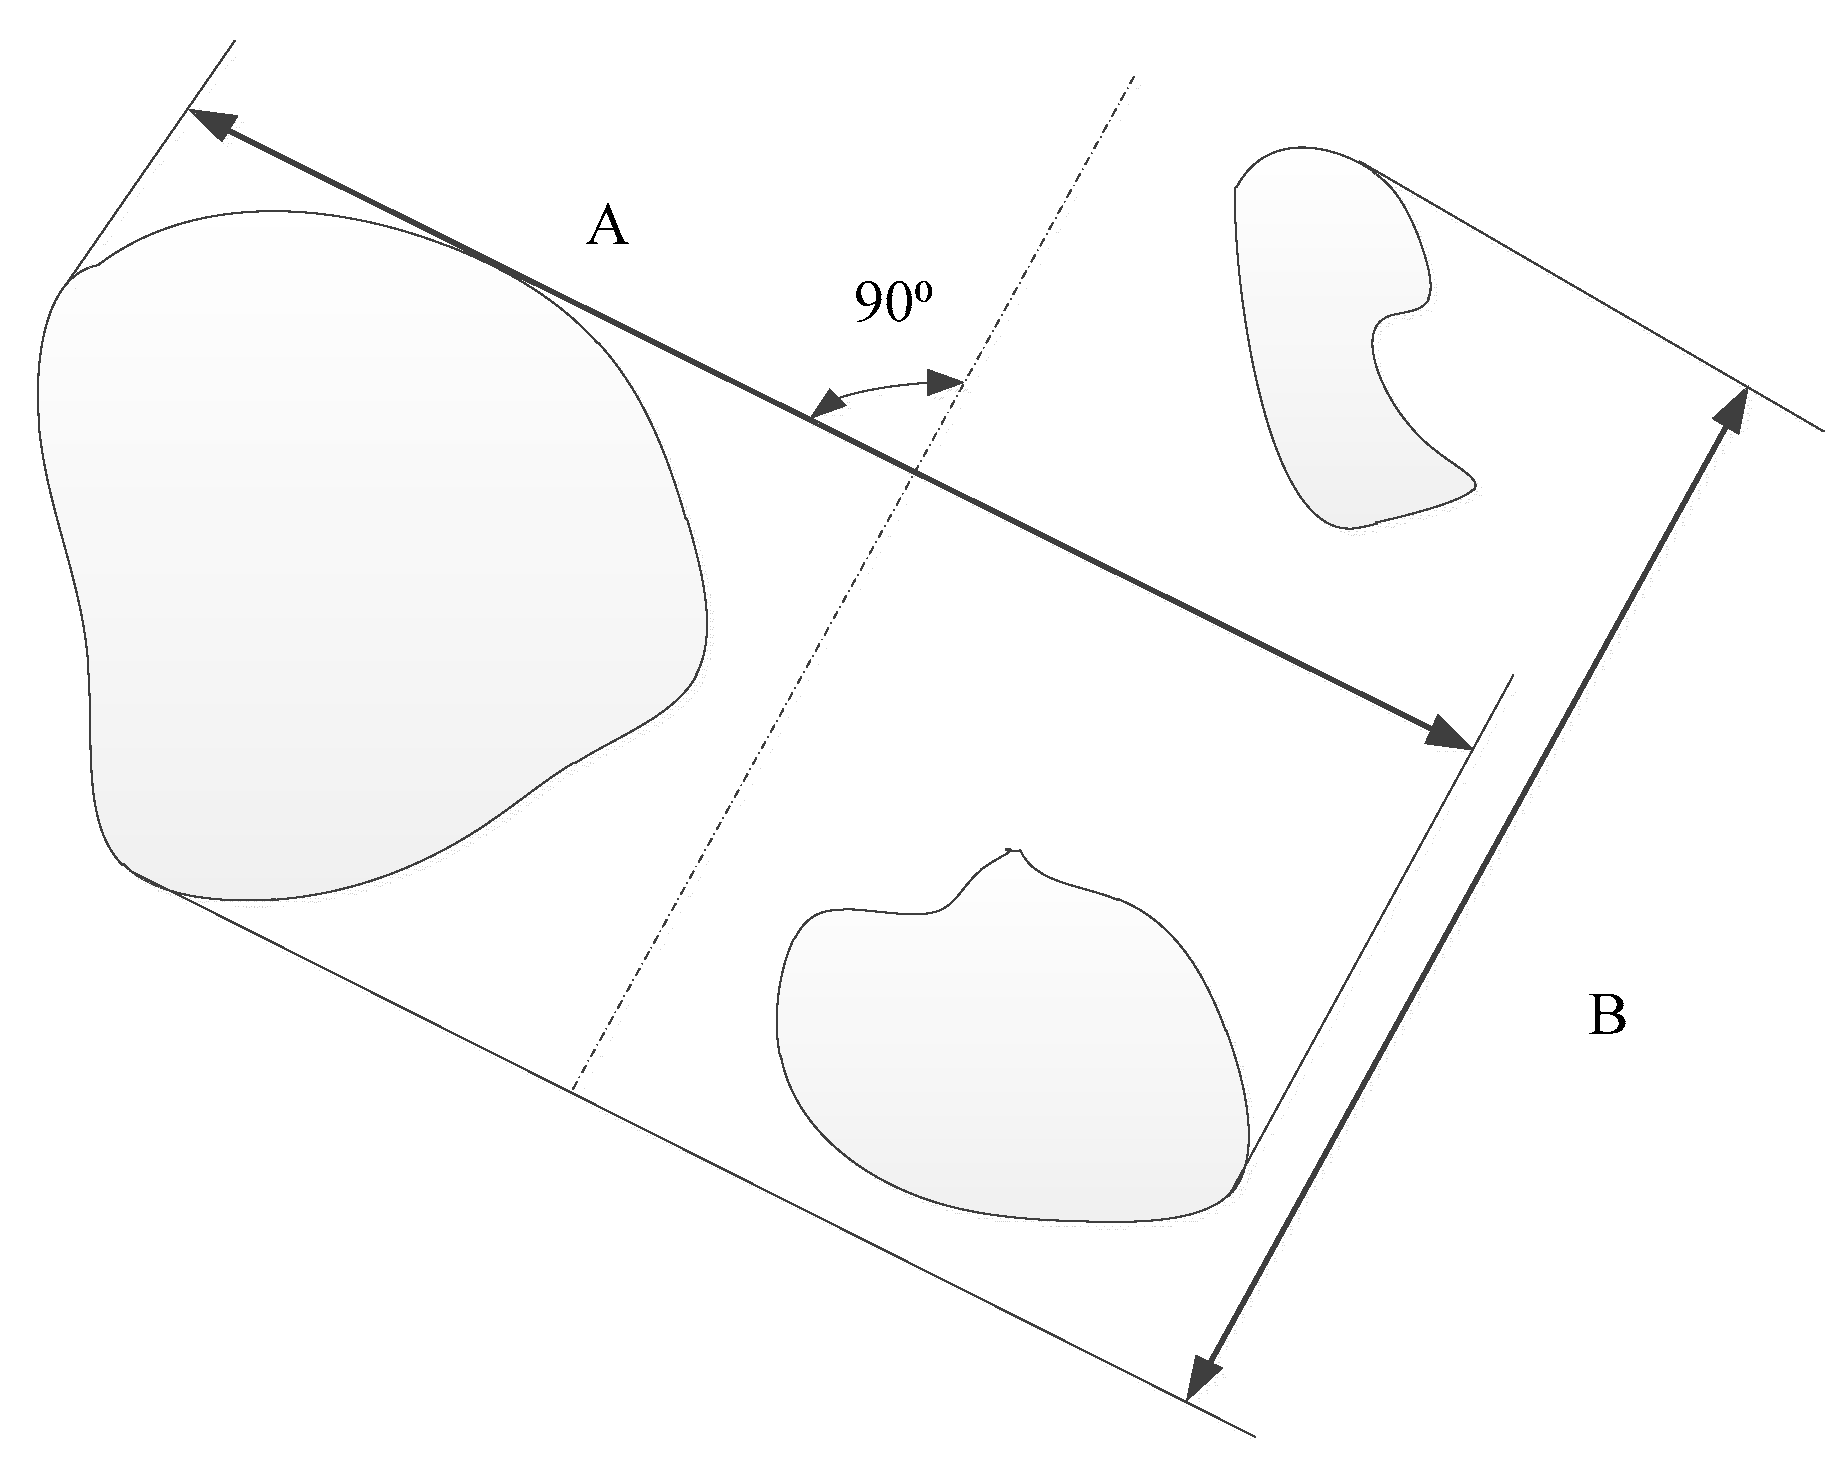
Figure 5.
Planning and Conducting Visual control of Reactor Metal.
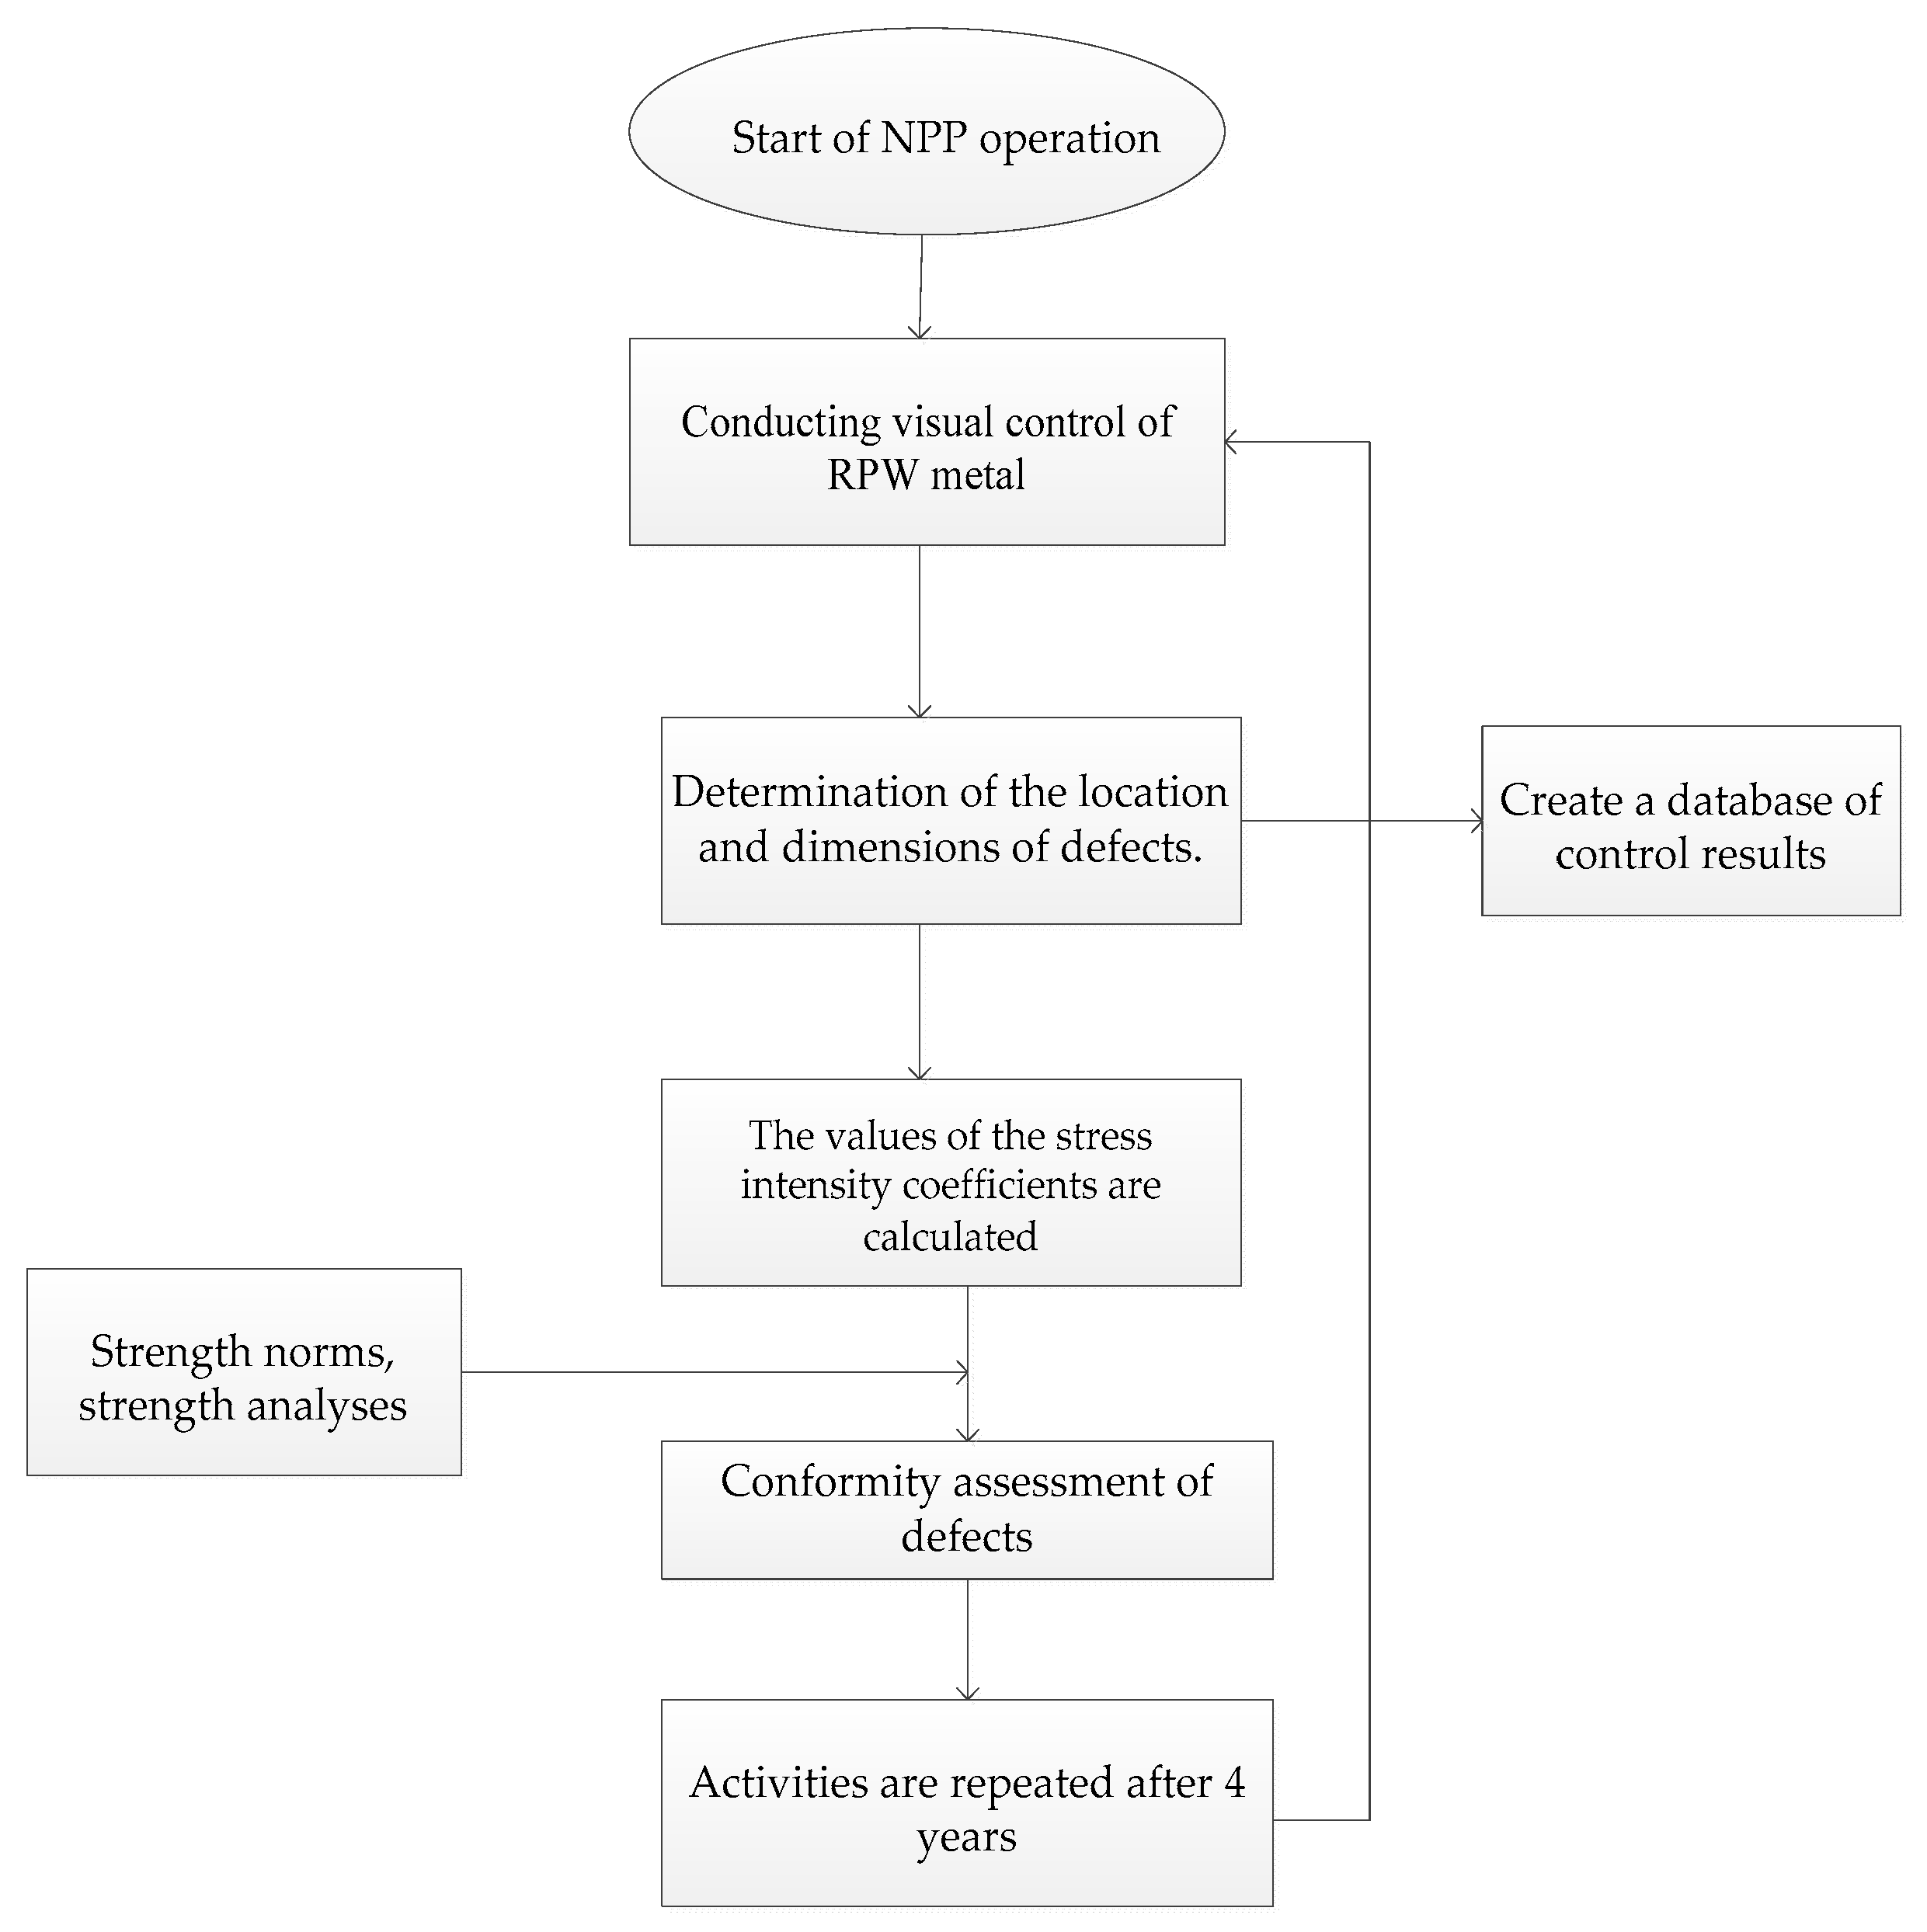
Figure 6.
is a function of of RPV metal, [7]. Curve 1 – NOC of the unit; curve 2 – NNOC&HT if the unit; curve 3 – EC of the unit.
Figure 6.
is a function of of RPV metal, [7]. Curve 1 – NOC of the unit; curve 2 – NNOC&HT if the unit; curve 3 – EC of the unit.
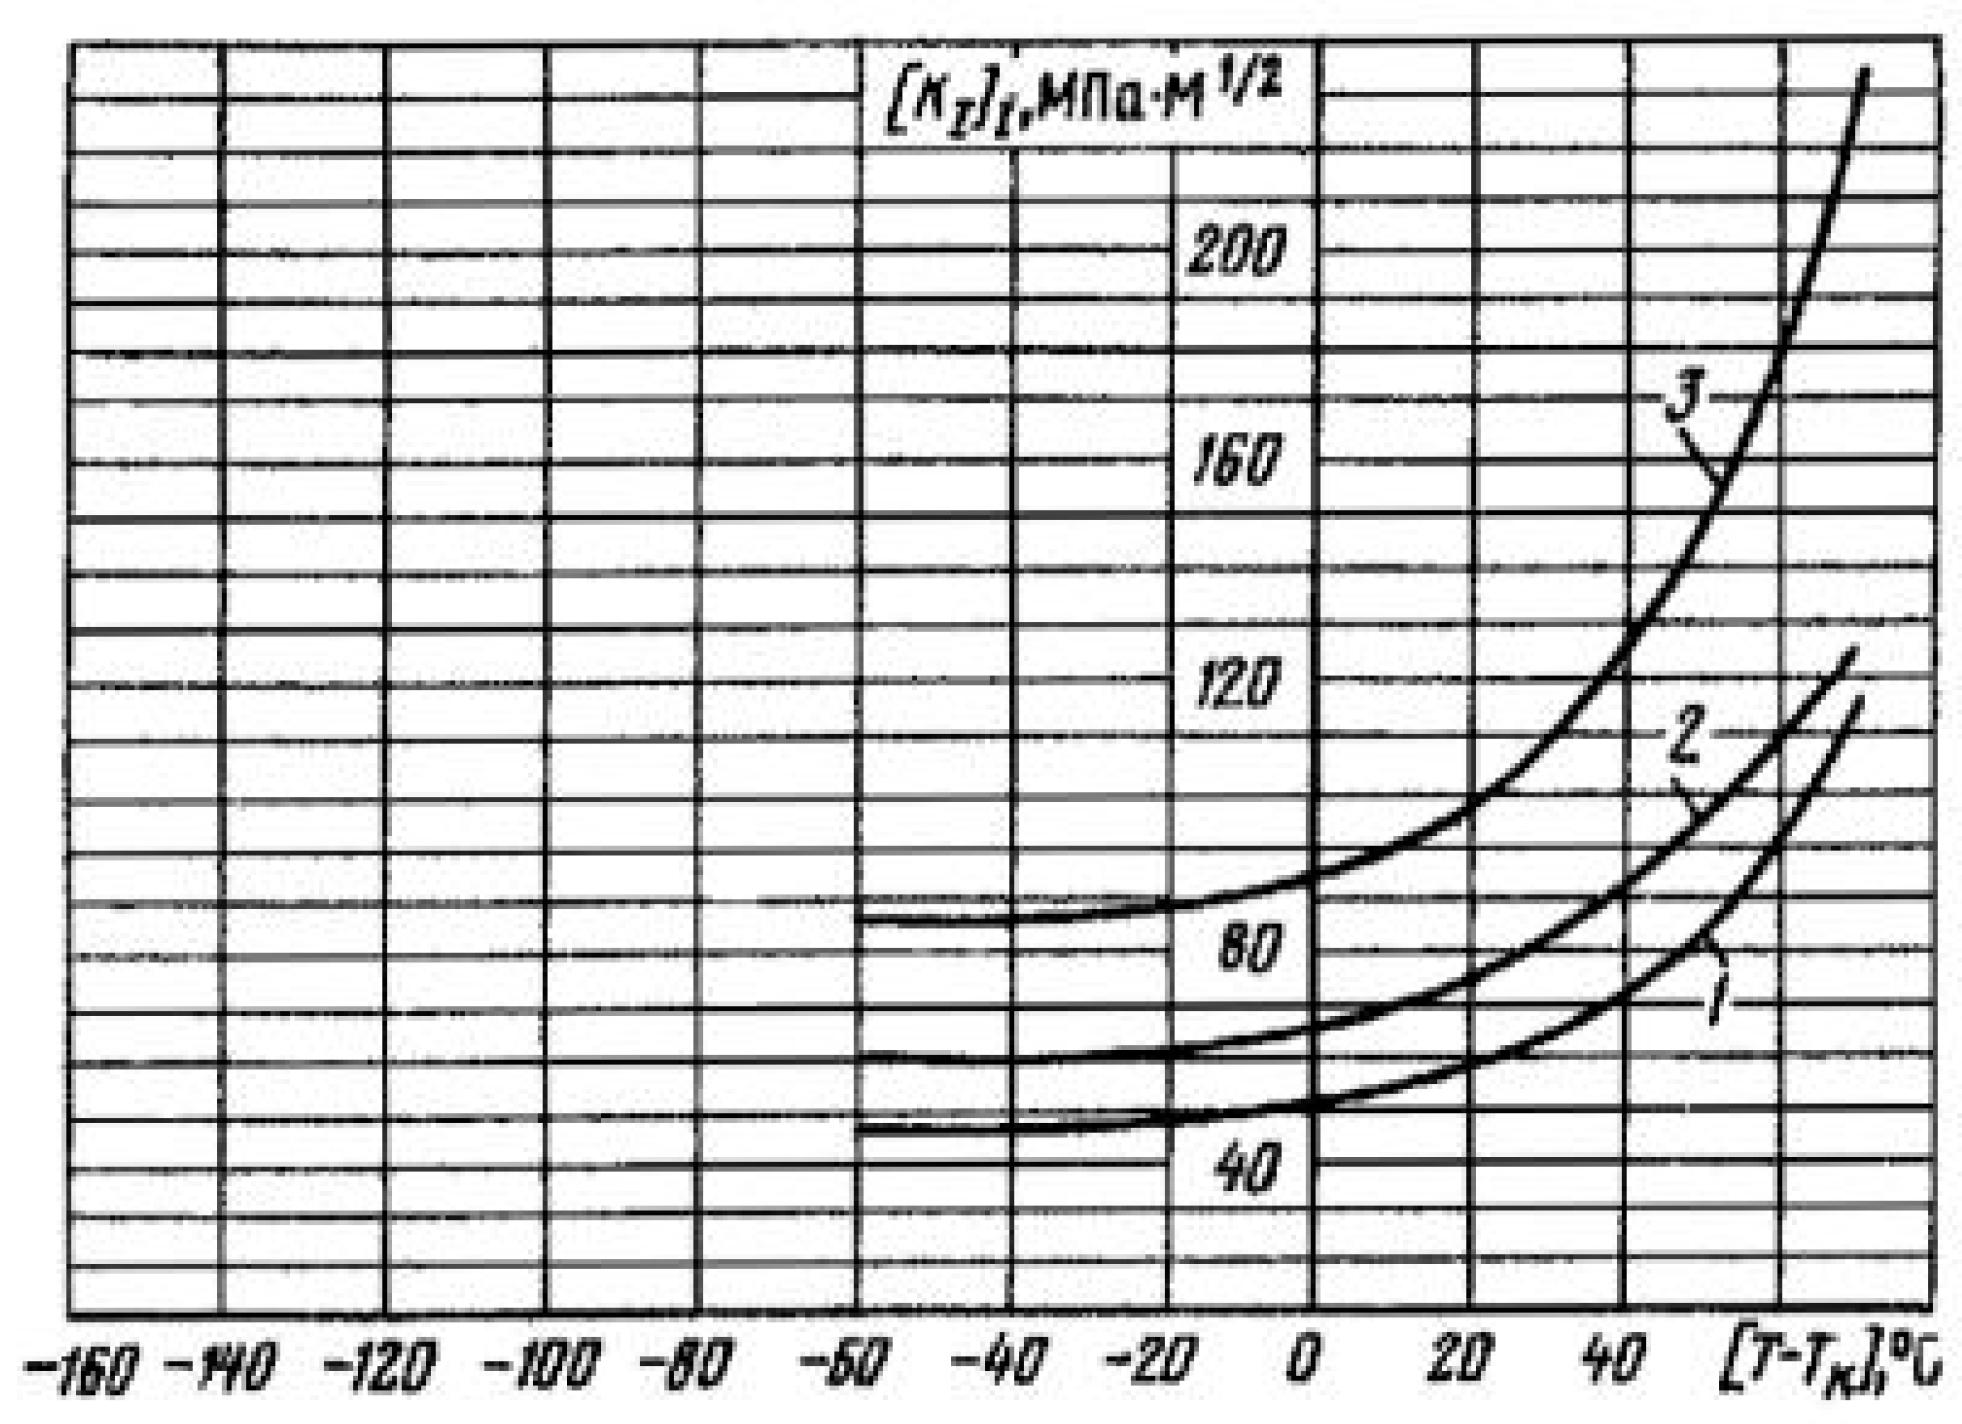
Figure 7.
Cluster of defects on the inner surface of the reactor vessel.
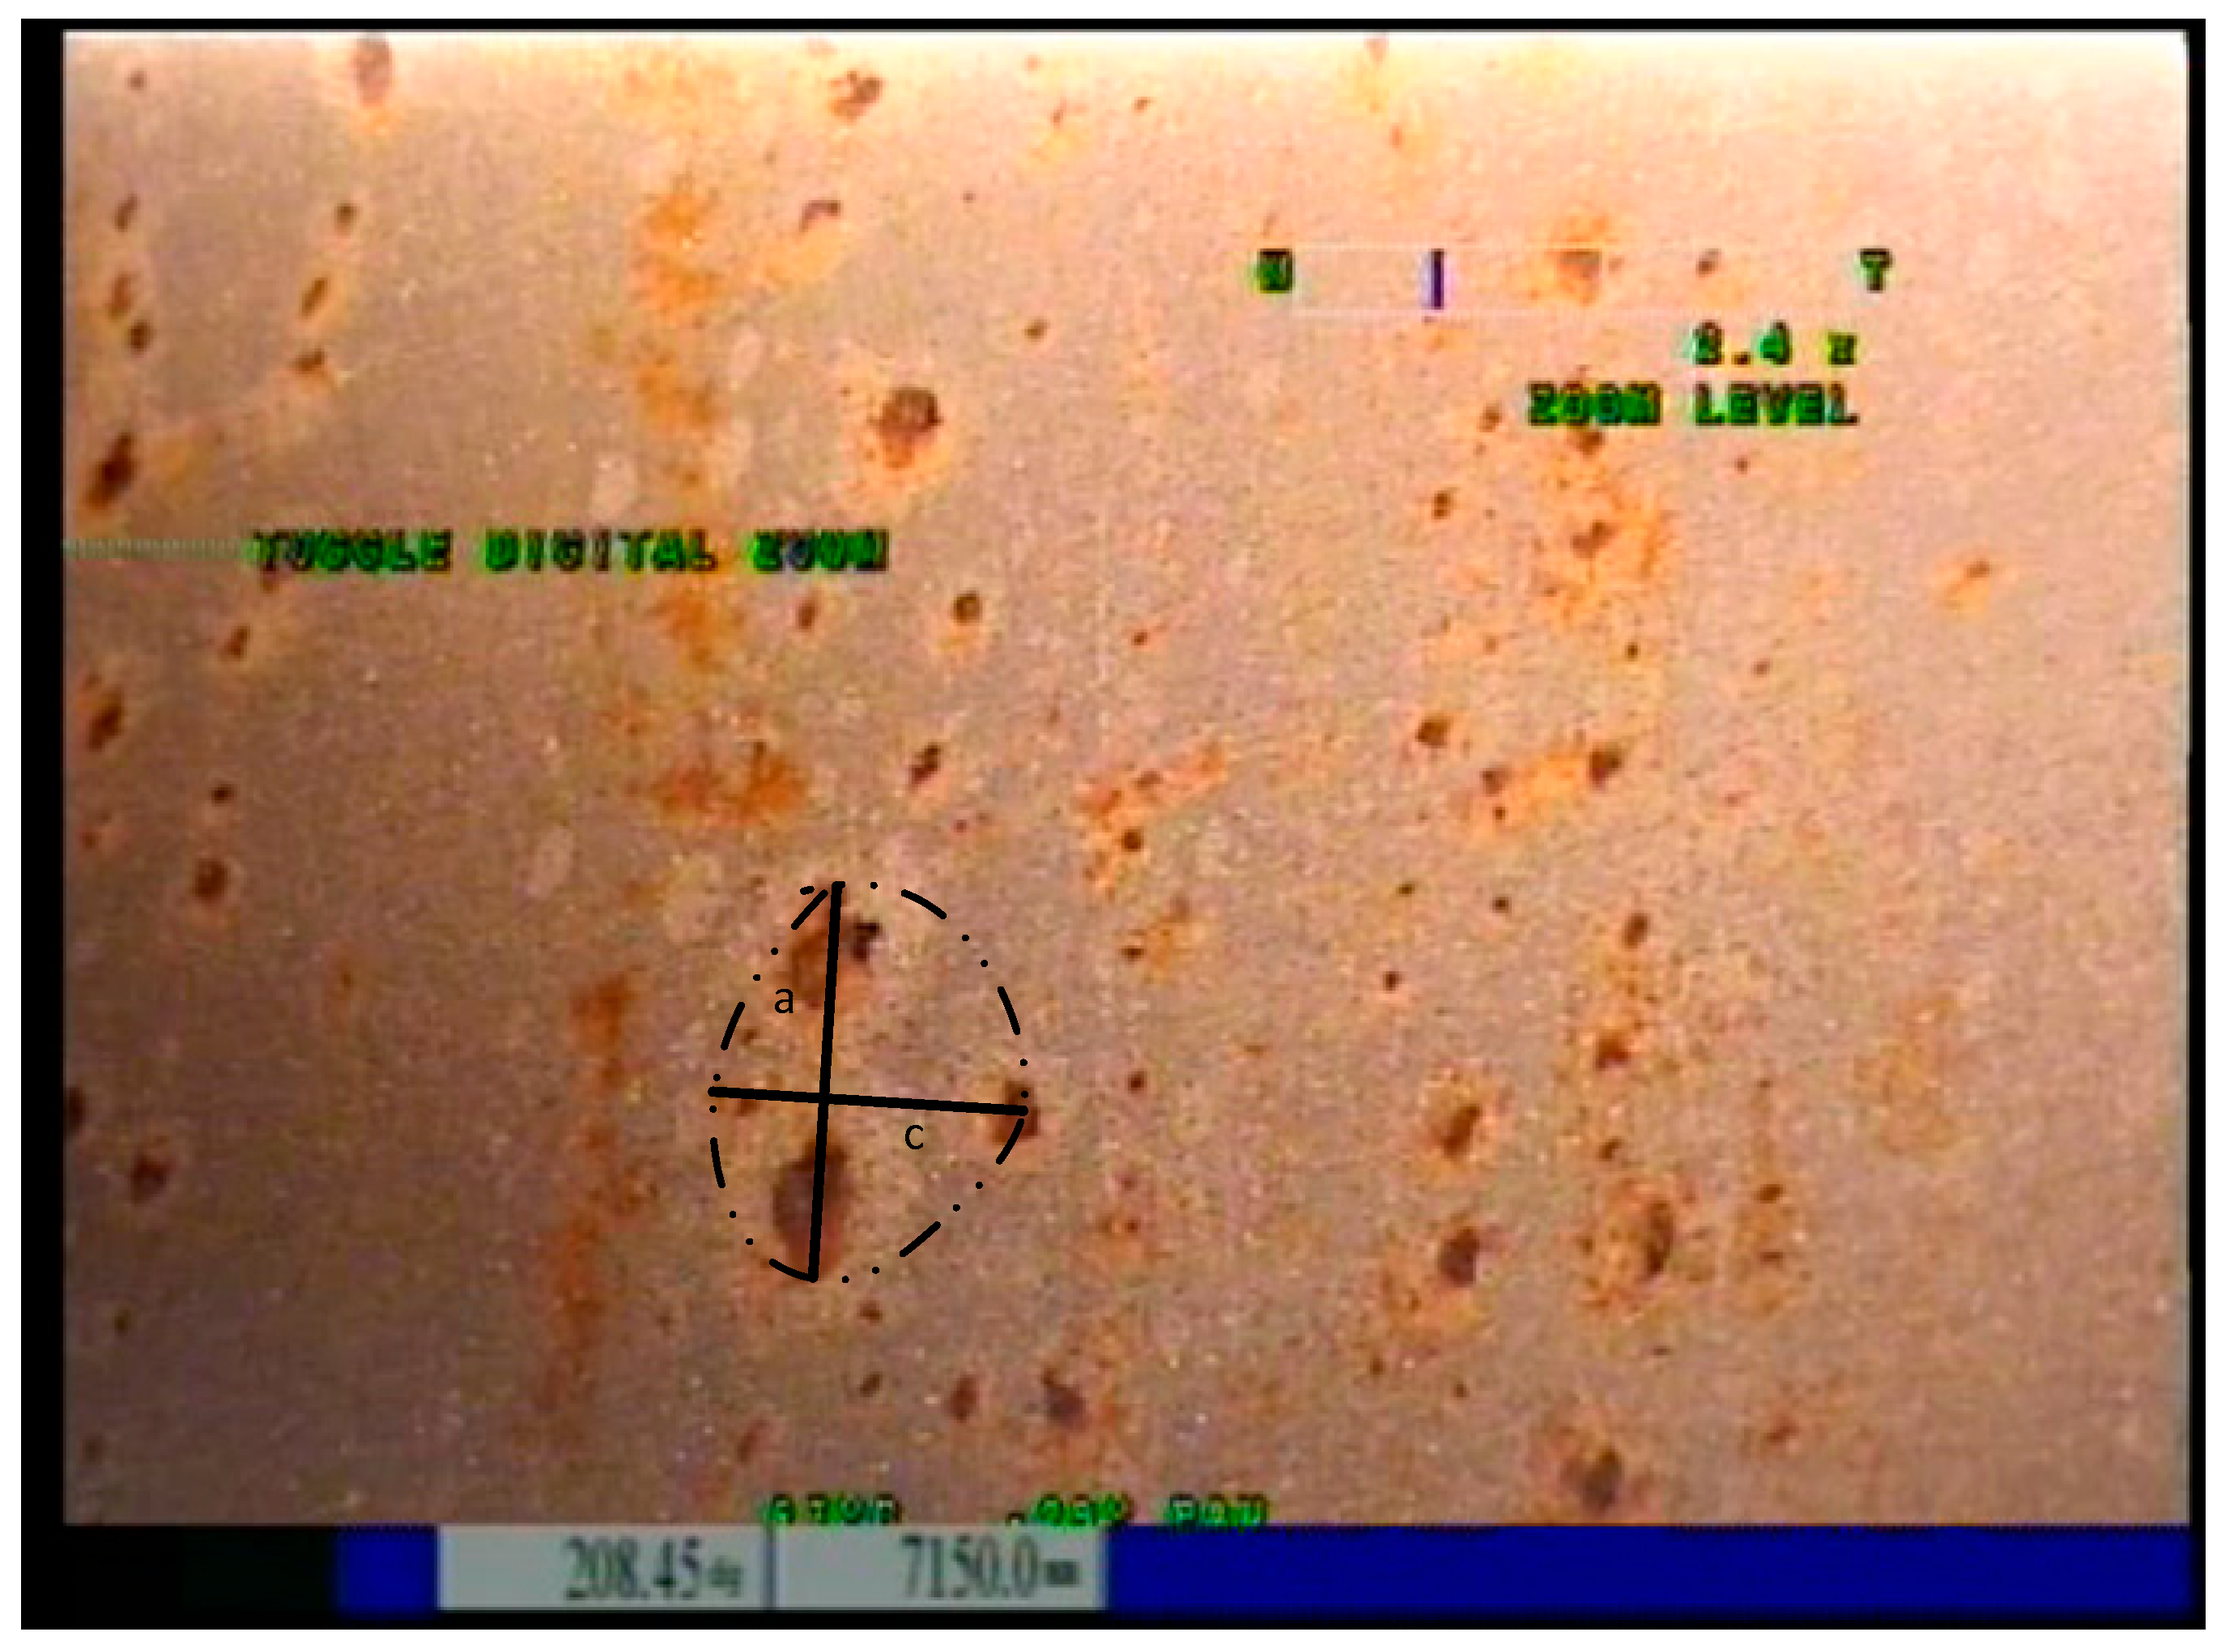
Figure 8.
Relative Stress Distribution as a Function of the Distance X from the Boundary of the Overlay with the Base Metal. ( e position closest to the inner surface of the Reactor vessel. The current loads have maximum values). Curve 1 – currently 0,2 hours from the time interval of the “Big Primary Leak” mode; Curve 2 – at 0.4 hours; Curve 3 – at 0.6 hours.
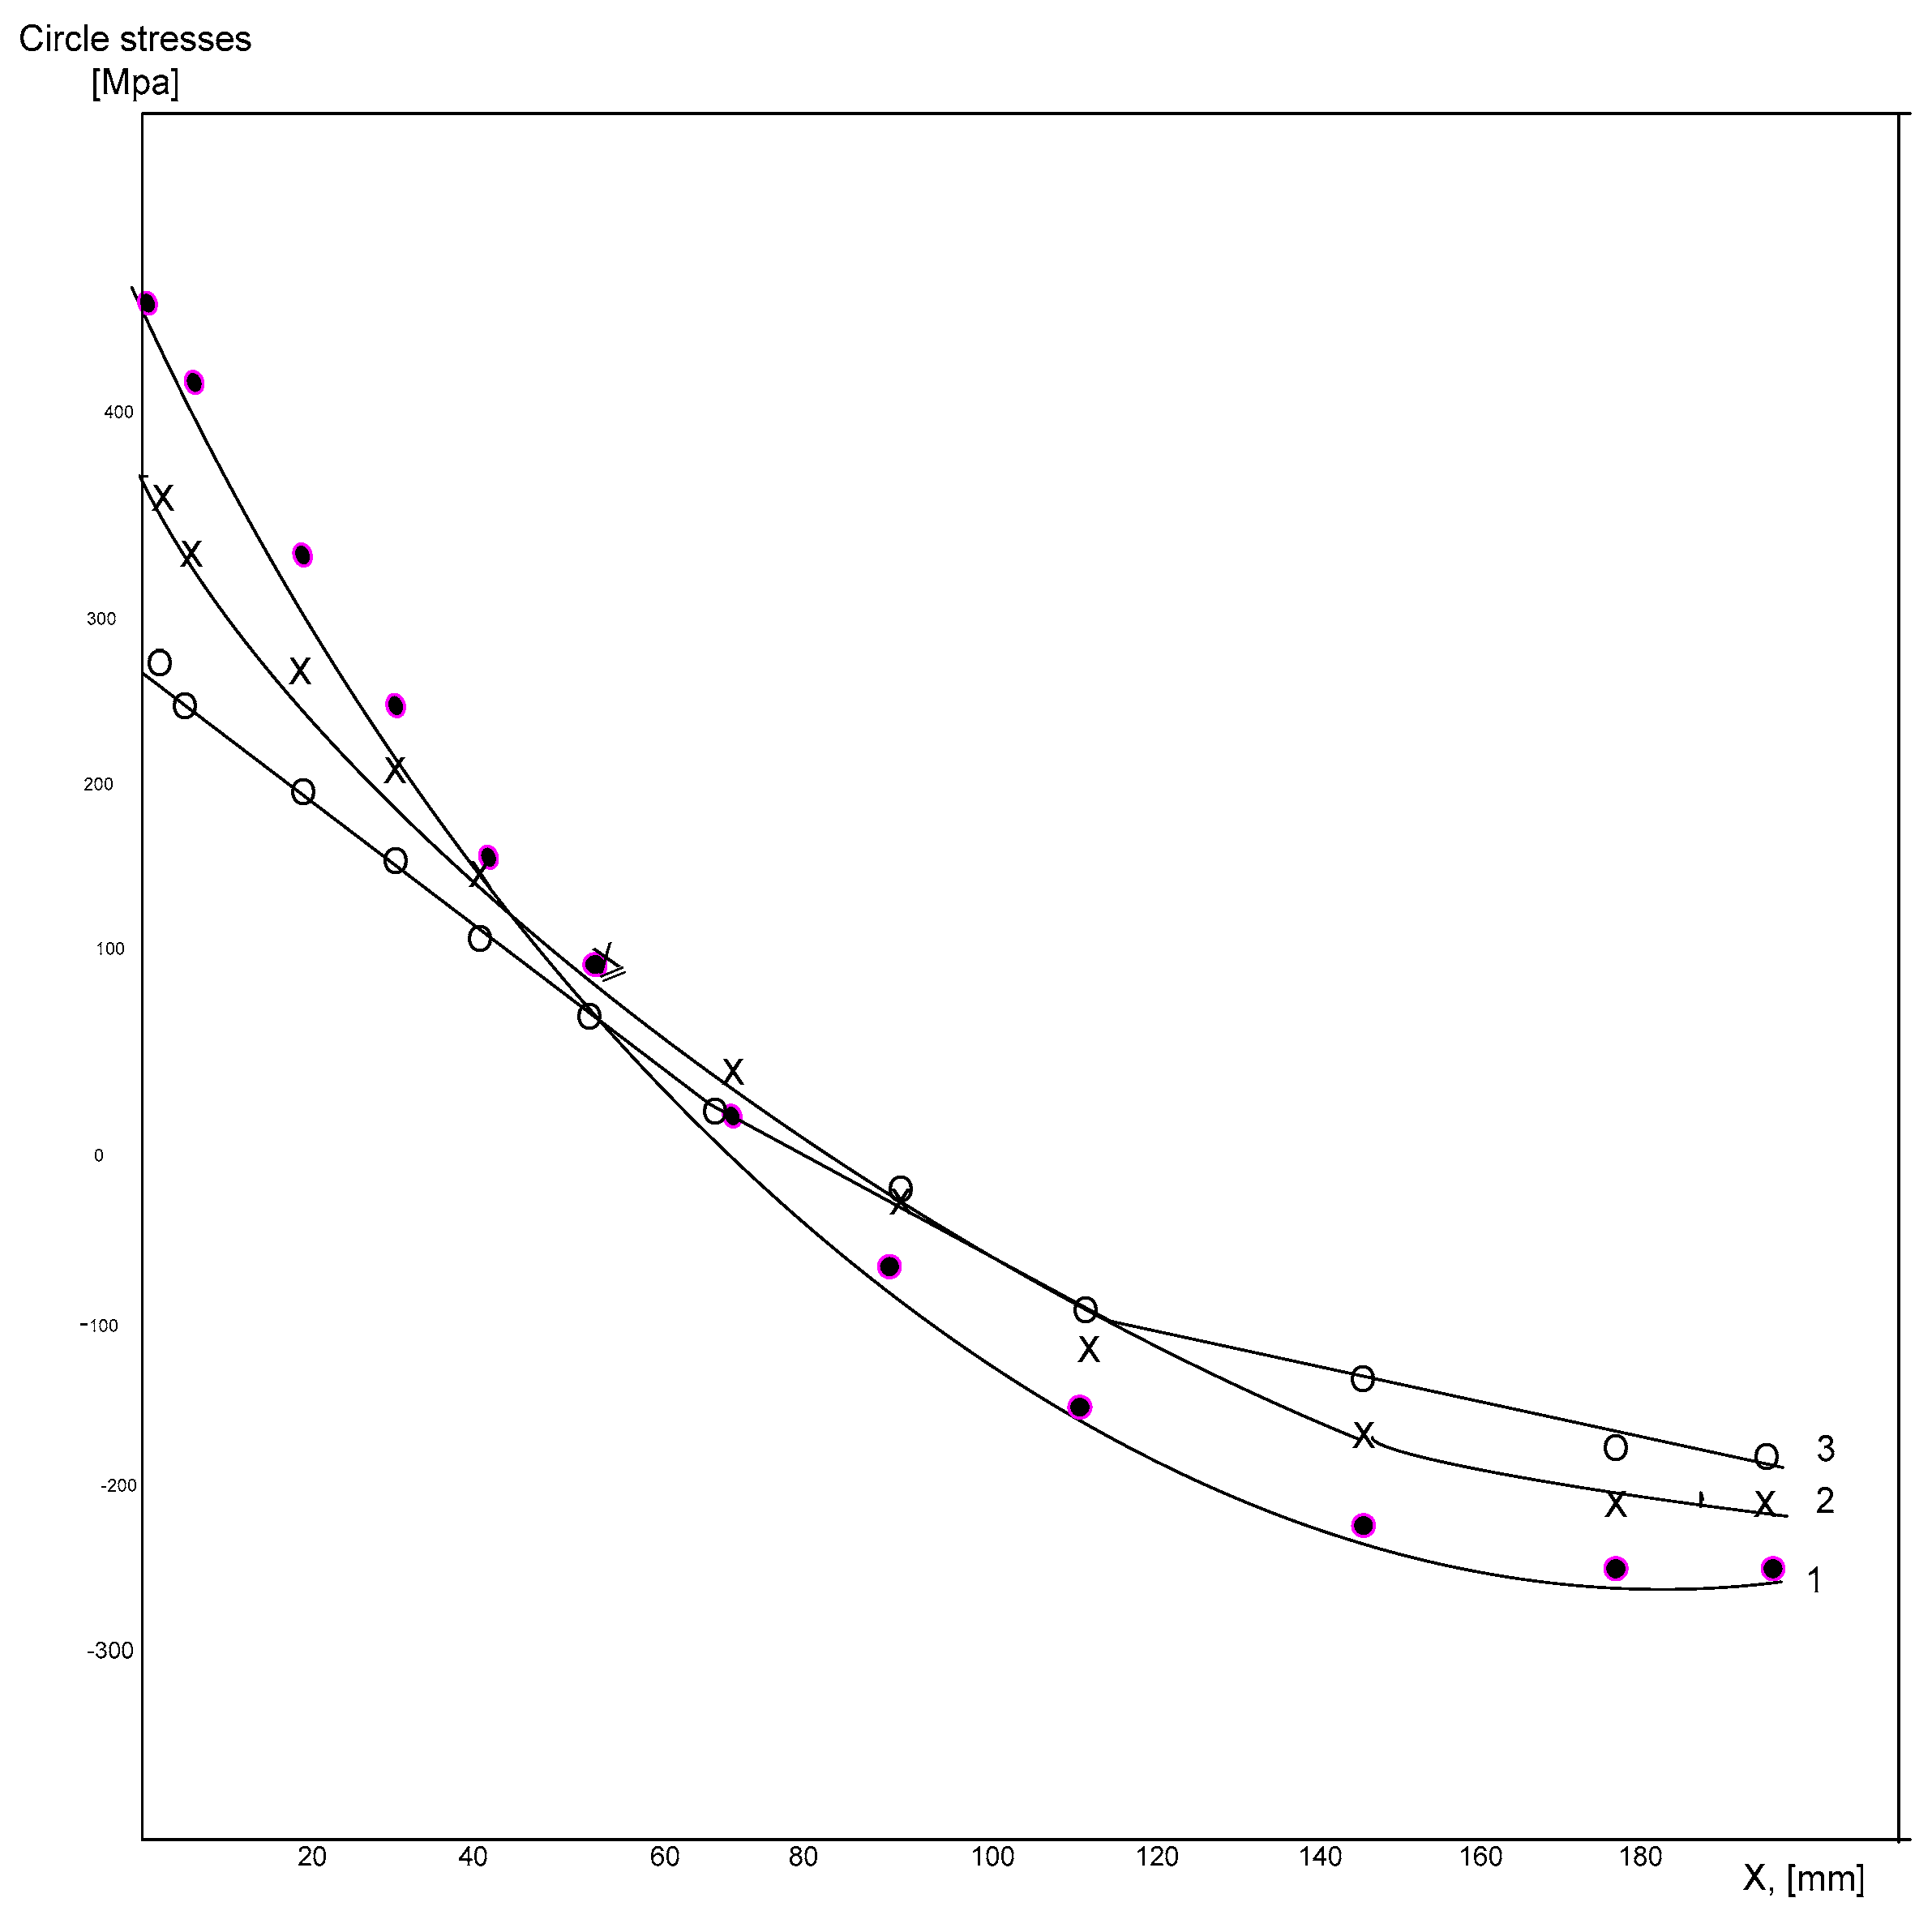
Figure 9.
Function ∆TK(F) for base metal BM of the RPV metals.
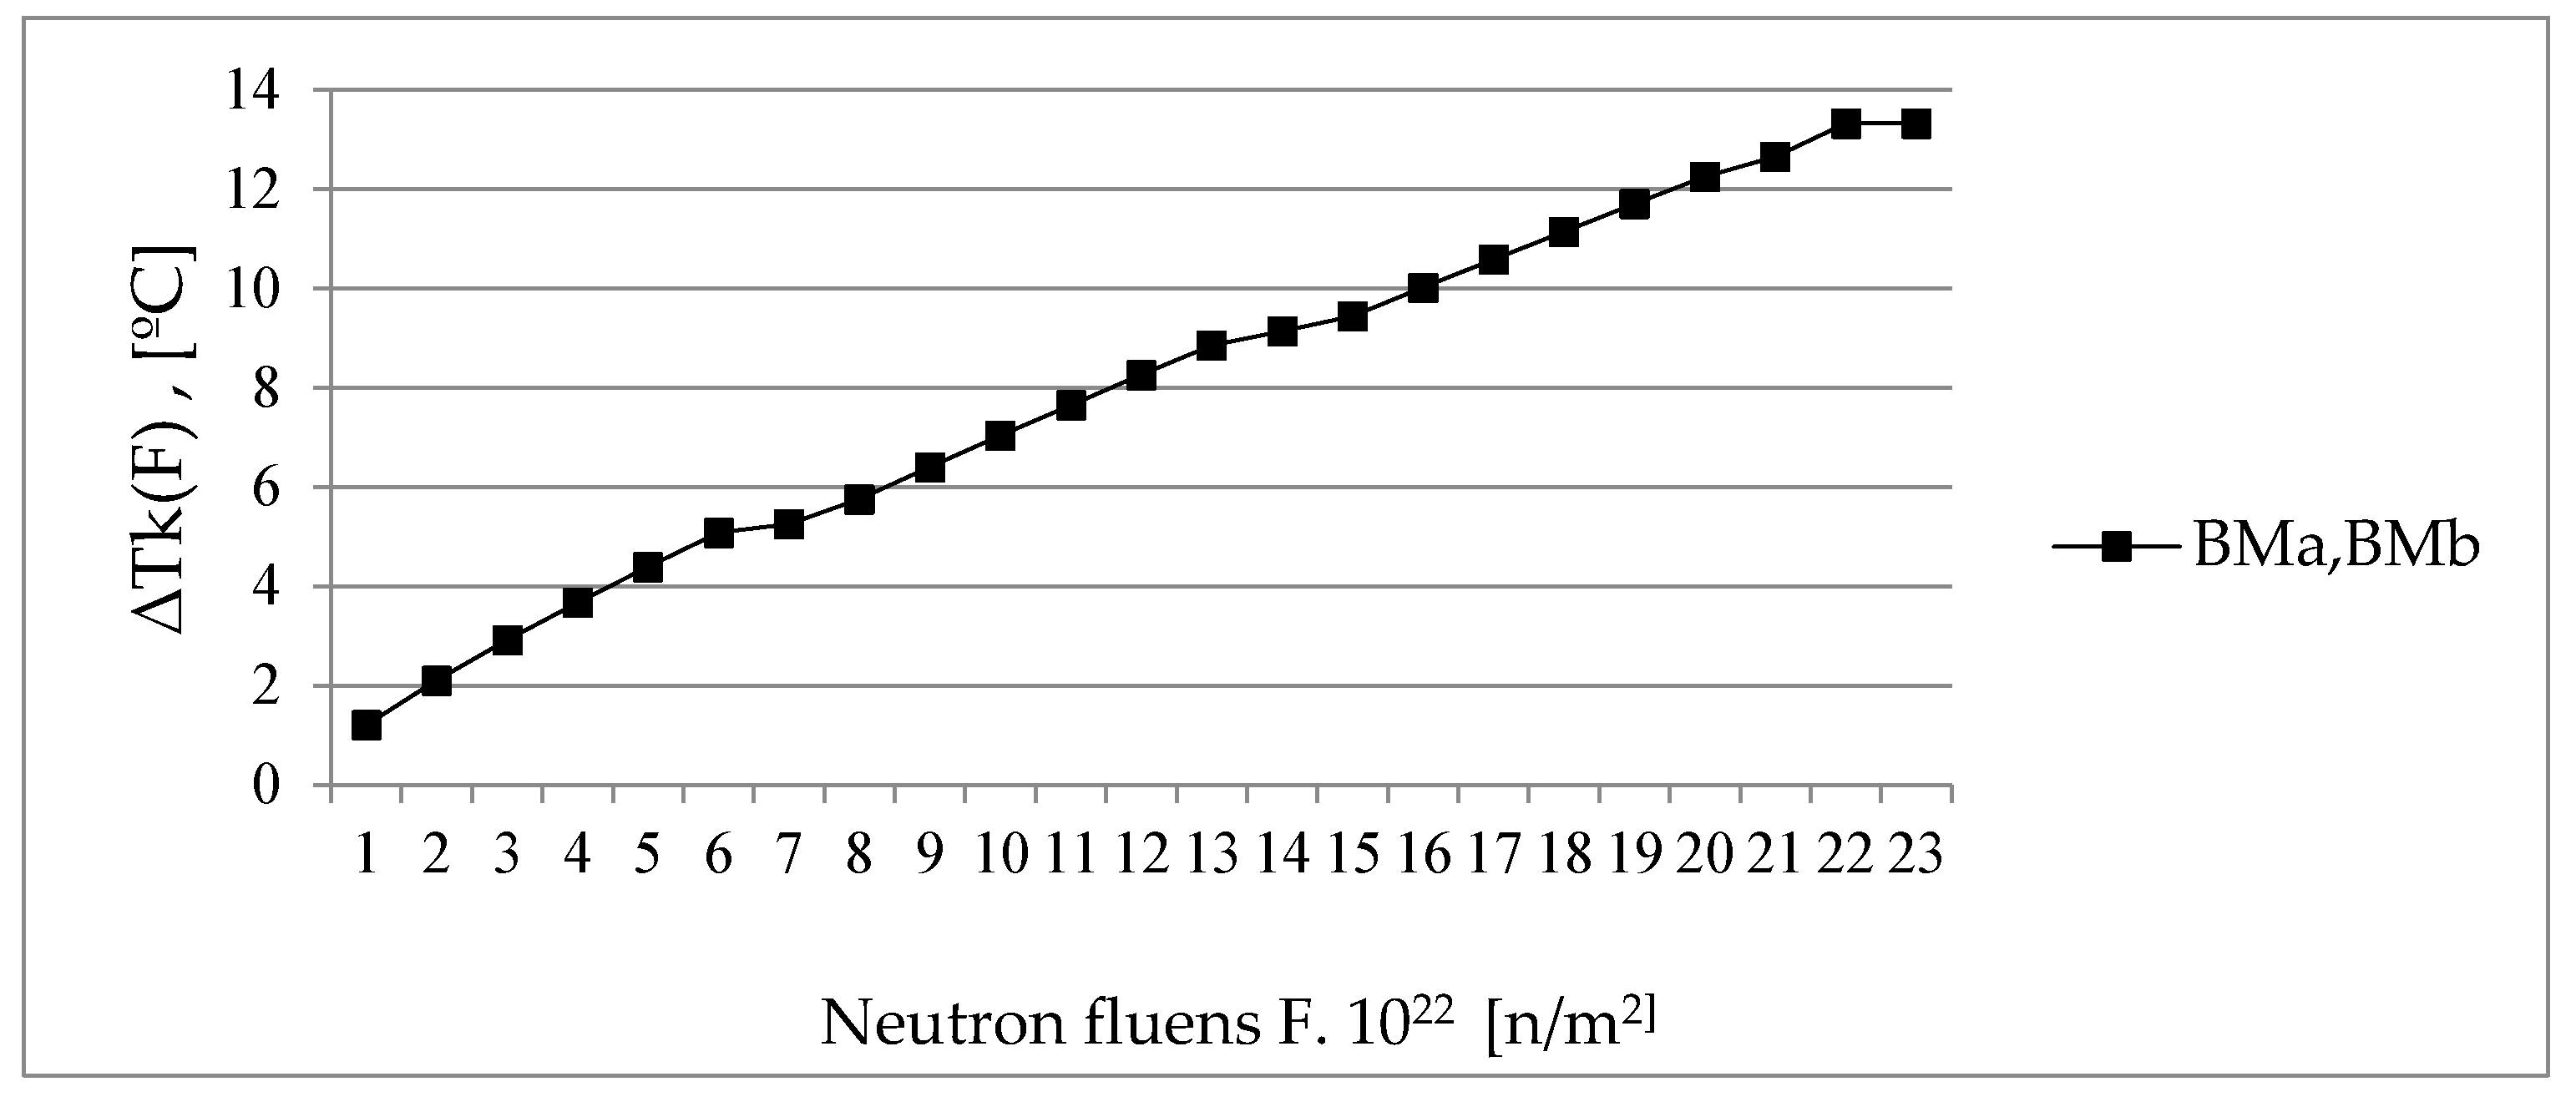
Figure 10.
Function of the RPV base metals BM.
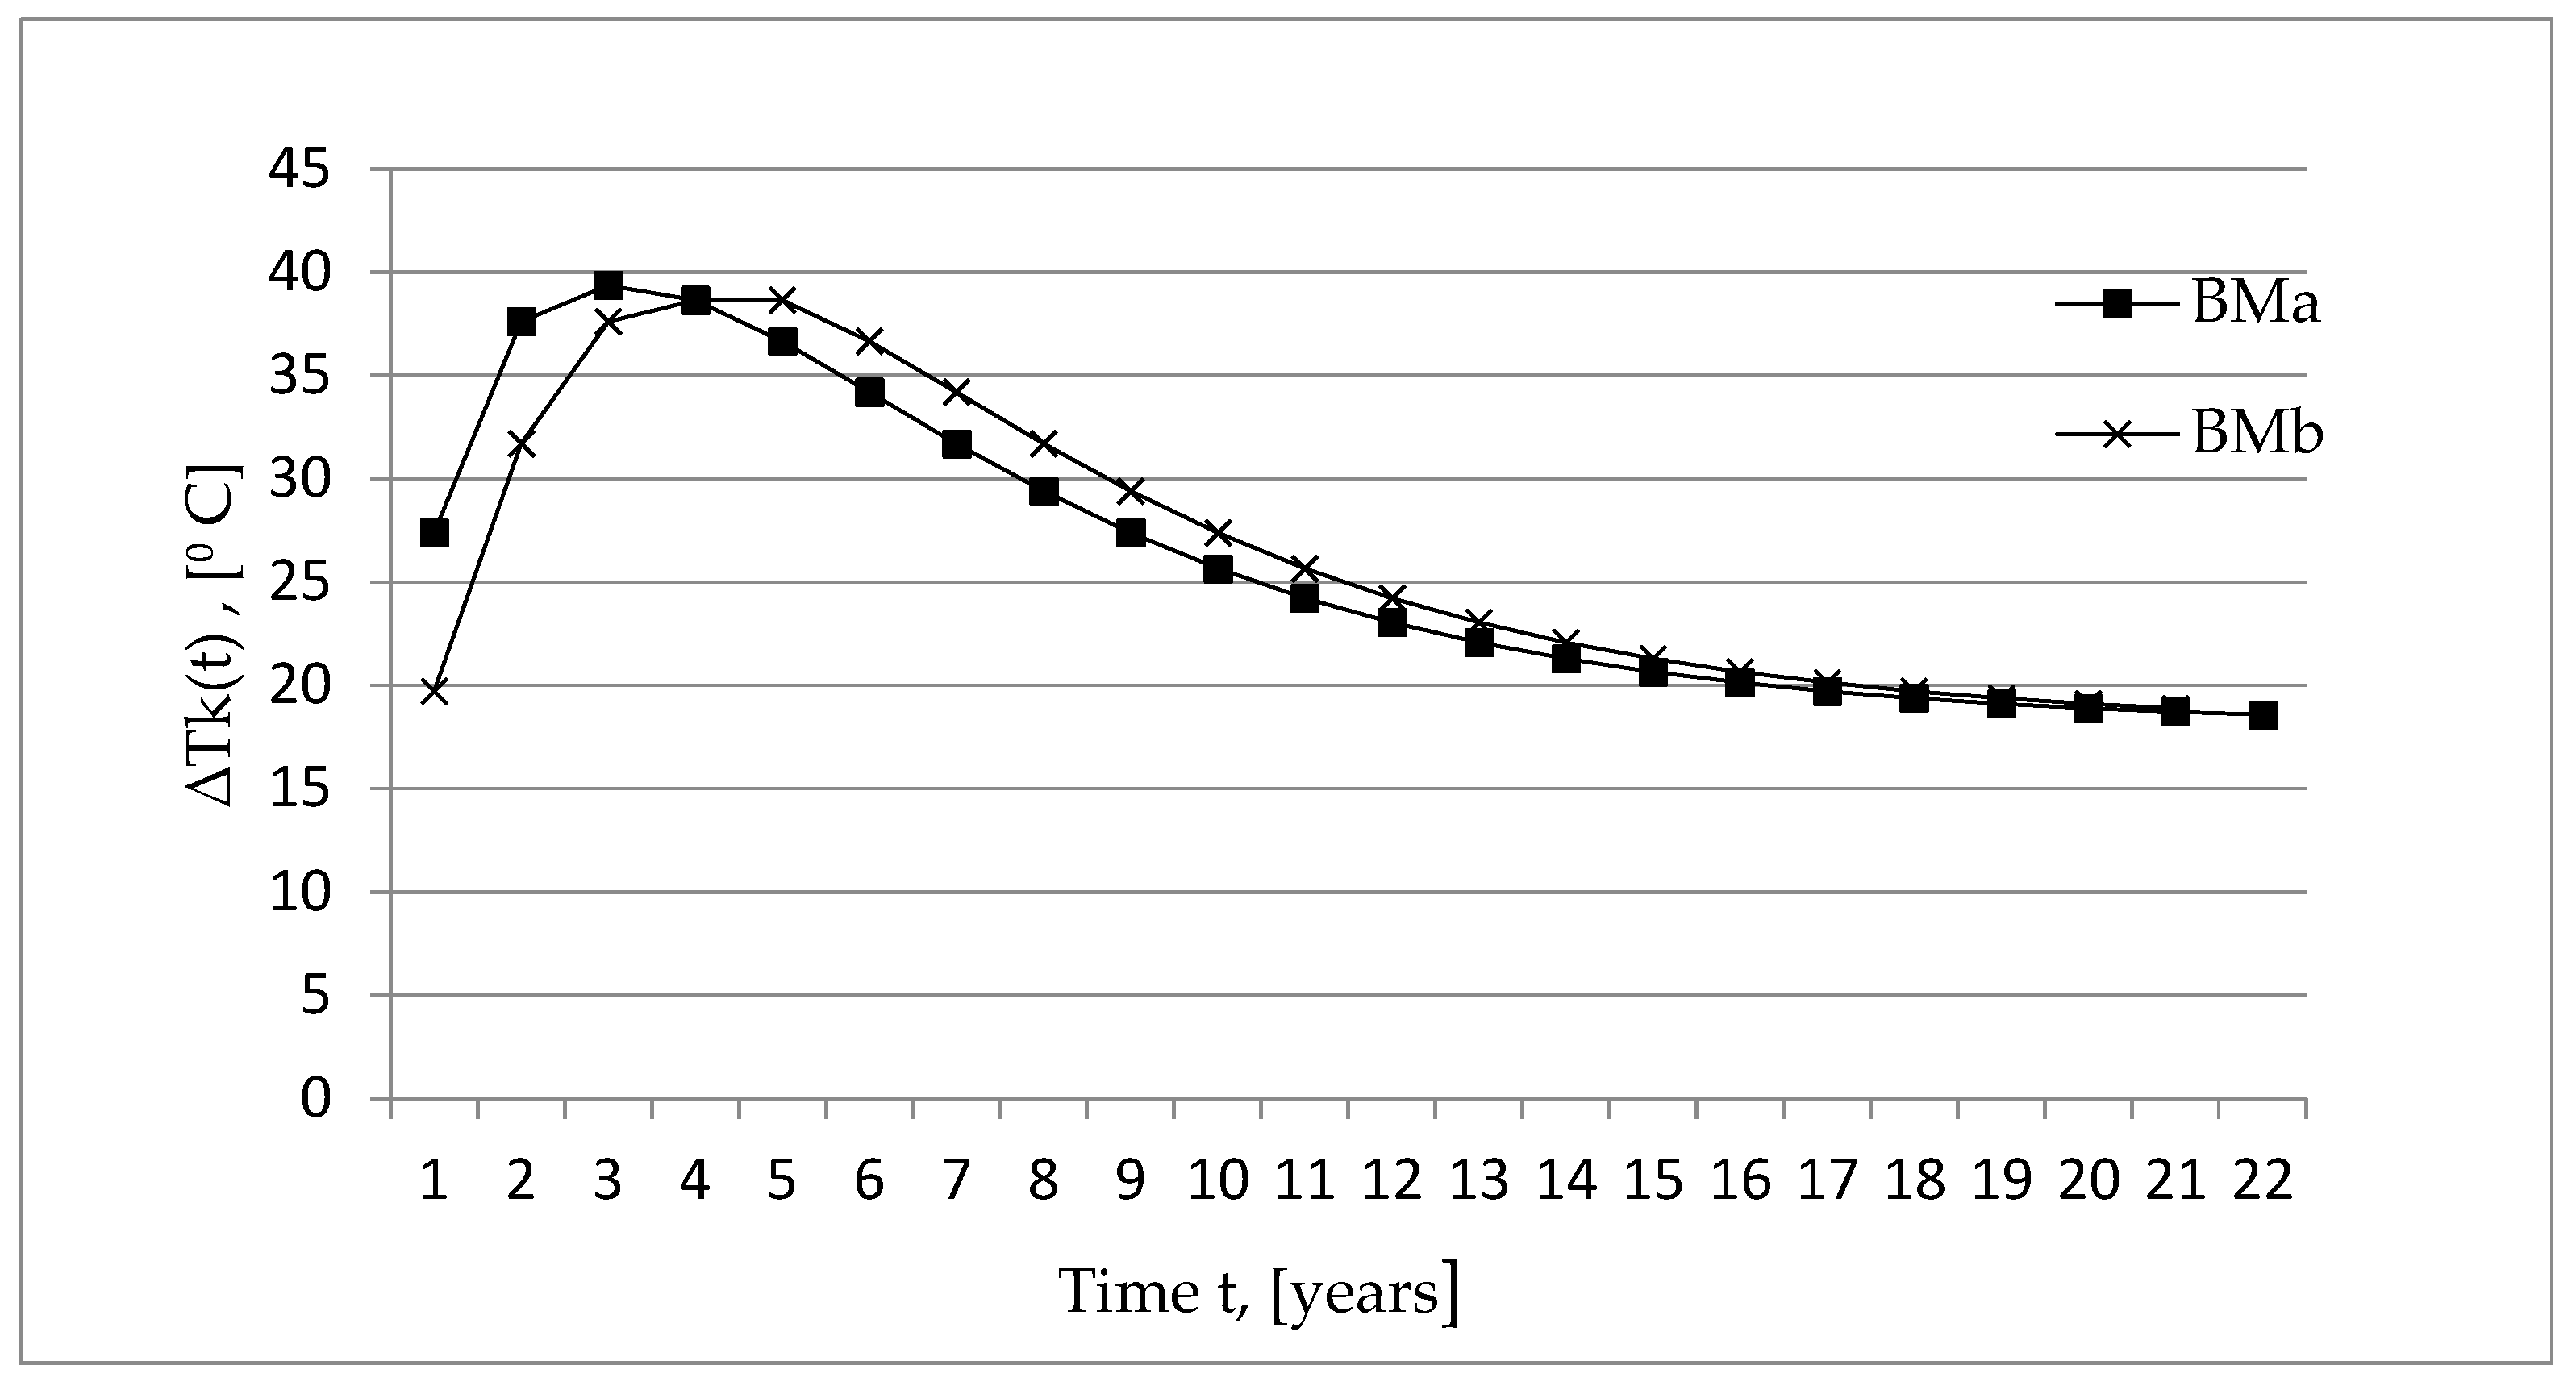
Figure 11.
Function of the time t for the base metal BM. A mediated line of experimental data from the surveillance specimens SS for the base metal BM.
Figure 11.
Function of the time t for the base metal BM. A mediated line of experimental data from the surveillance specimens SS for the base metal BM.
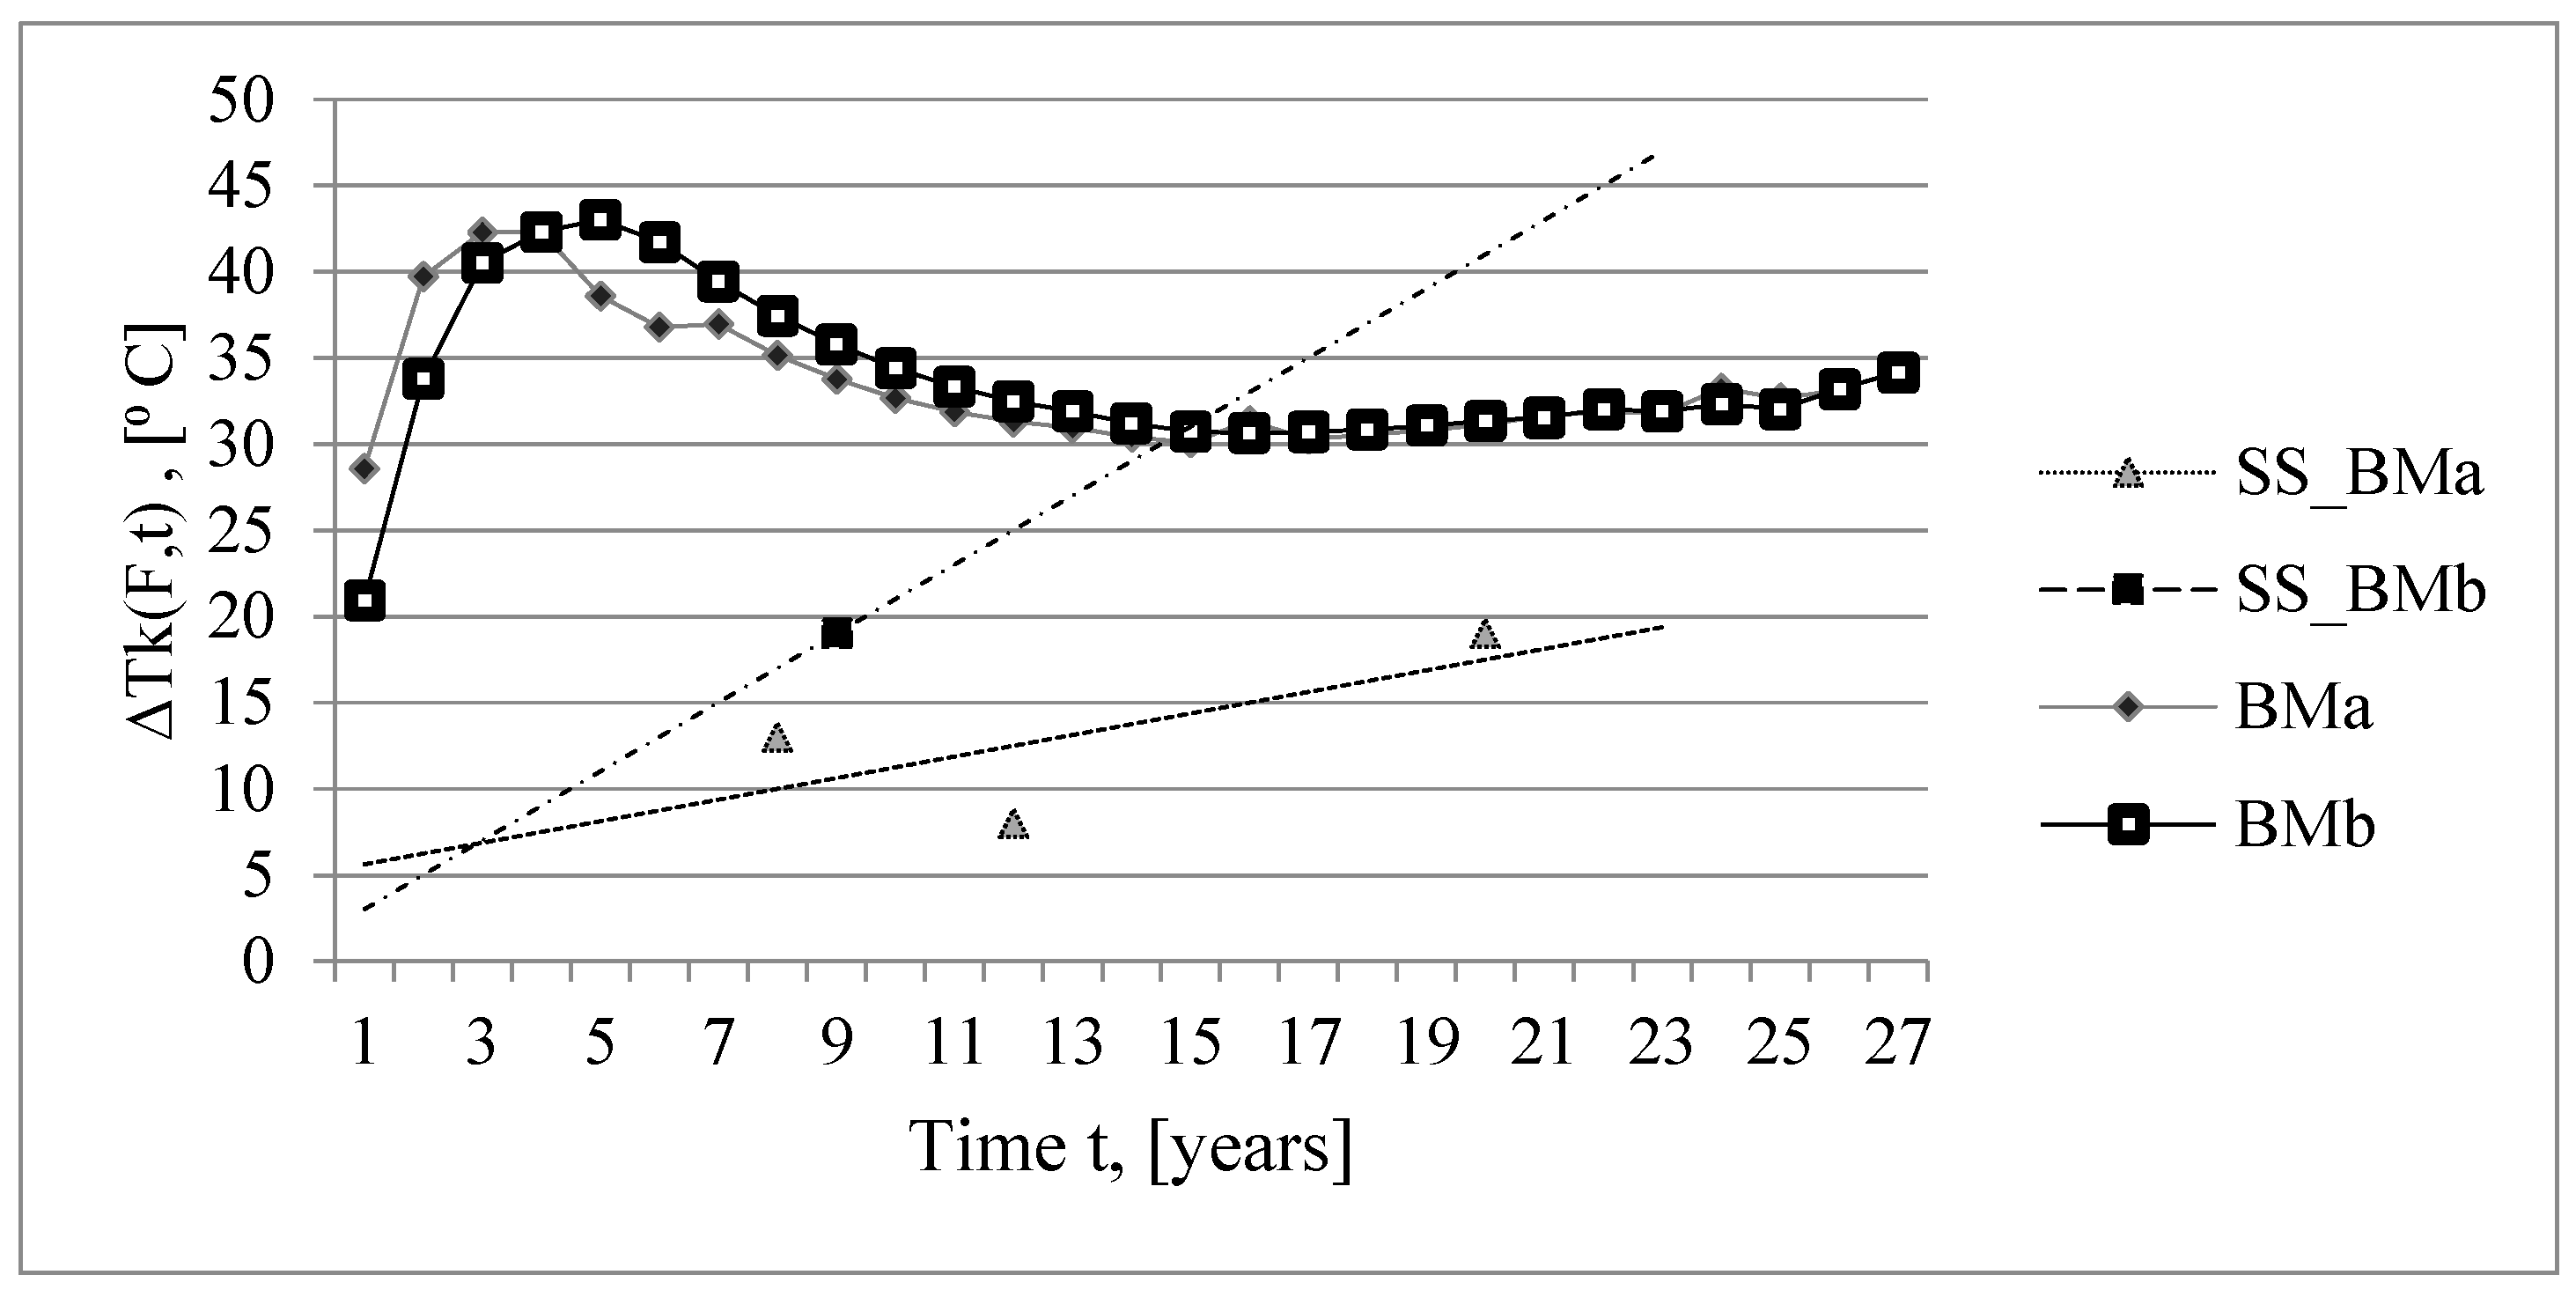
Figure 12.
Critical values of the stress intensity factors at , steels 12Х2МФА, 15Х2МФА, 15Х2МФА-А, [7].
Figure 12.
Critical values of the stress intensity factors at , steels 12Х2МФА, 15Х2МФА, 15Х2МФА-А, [7].
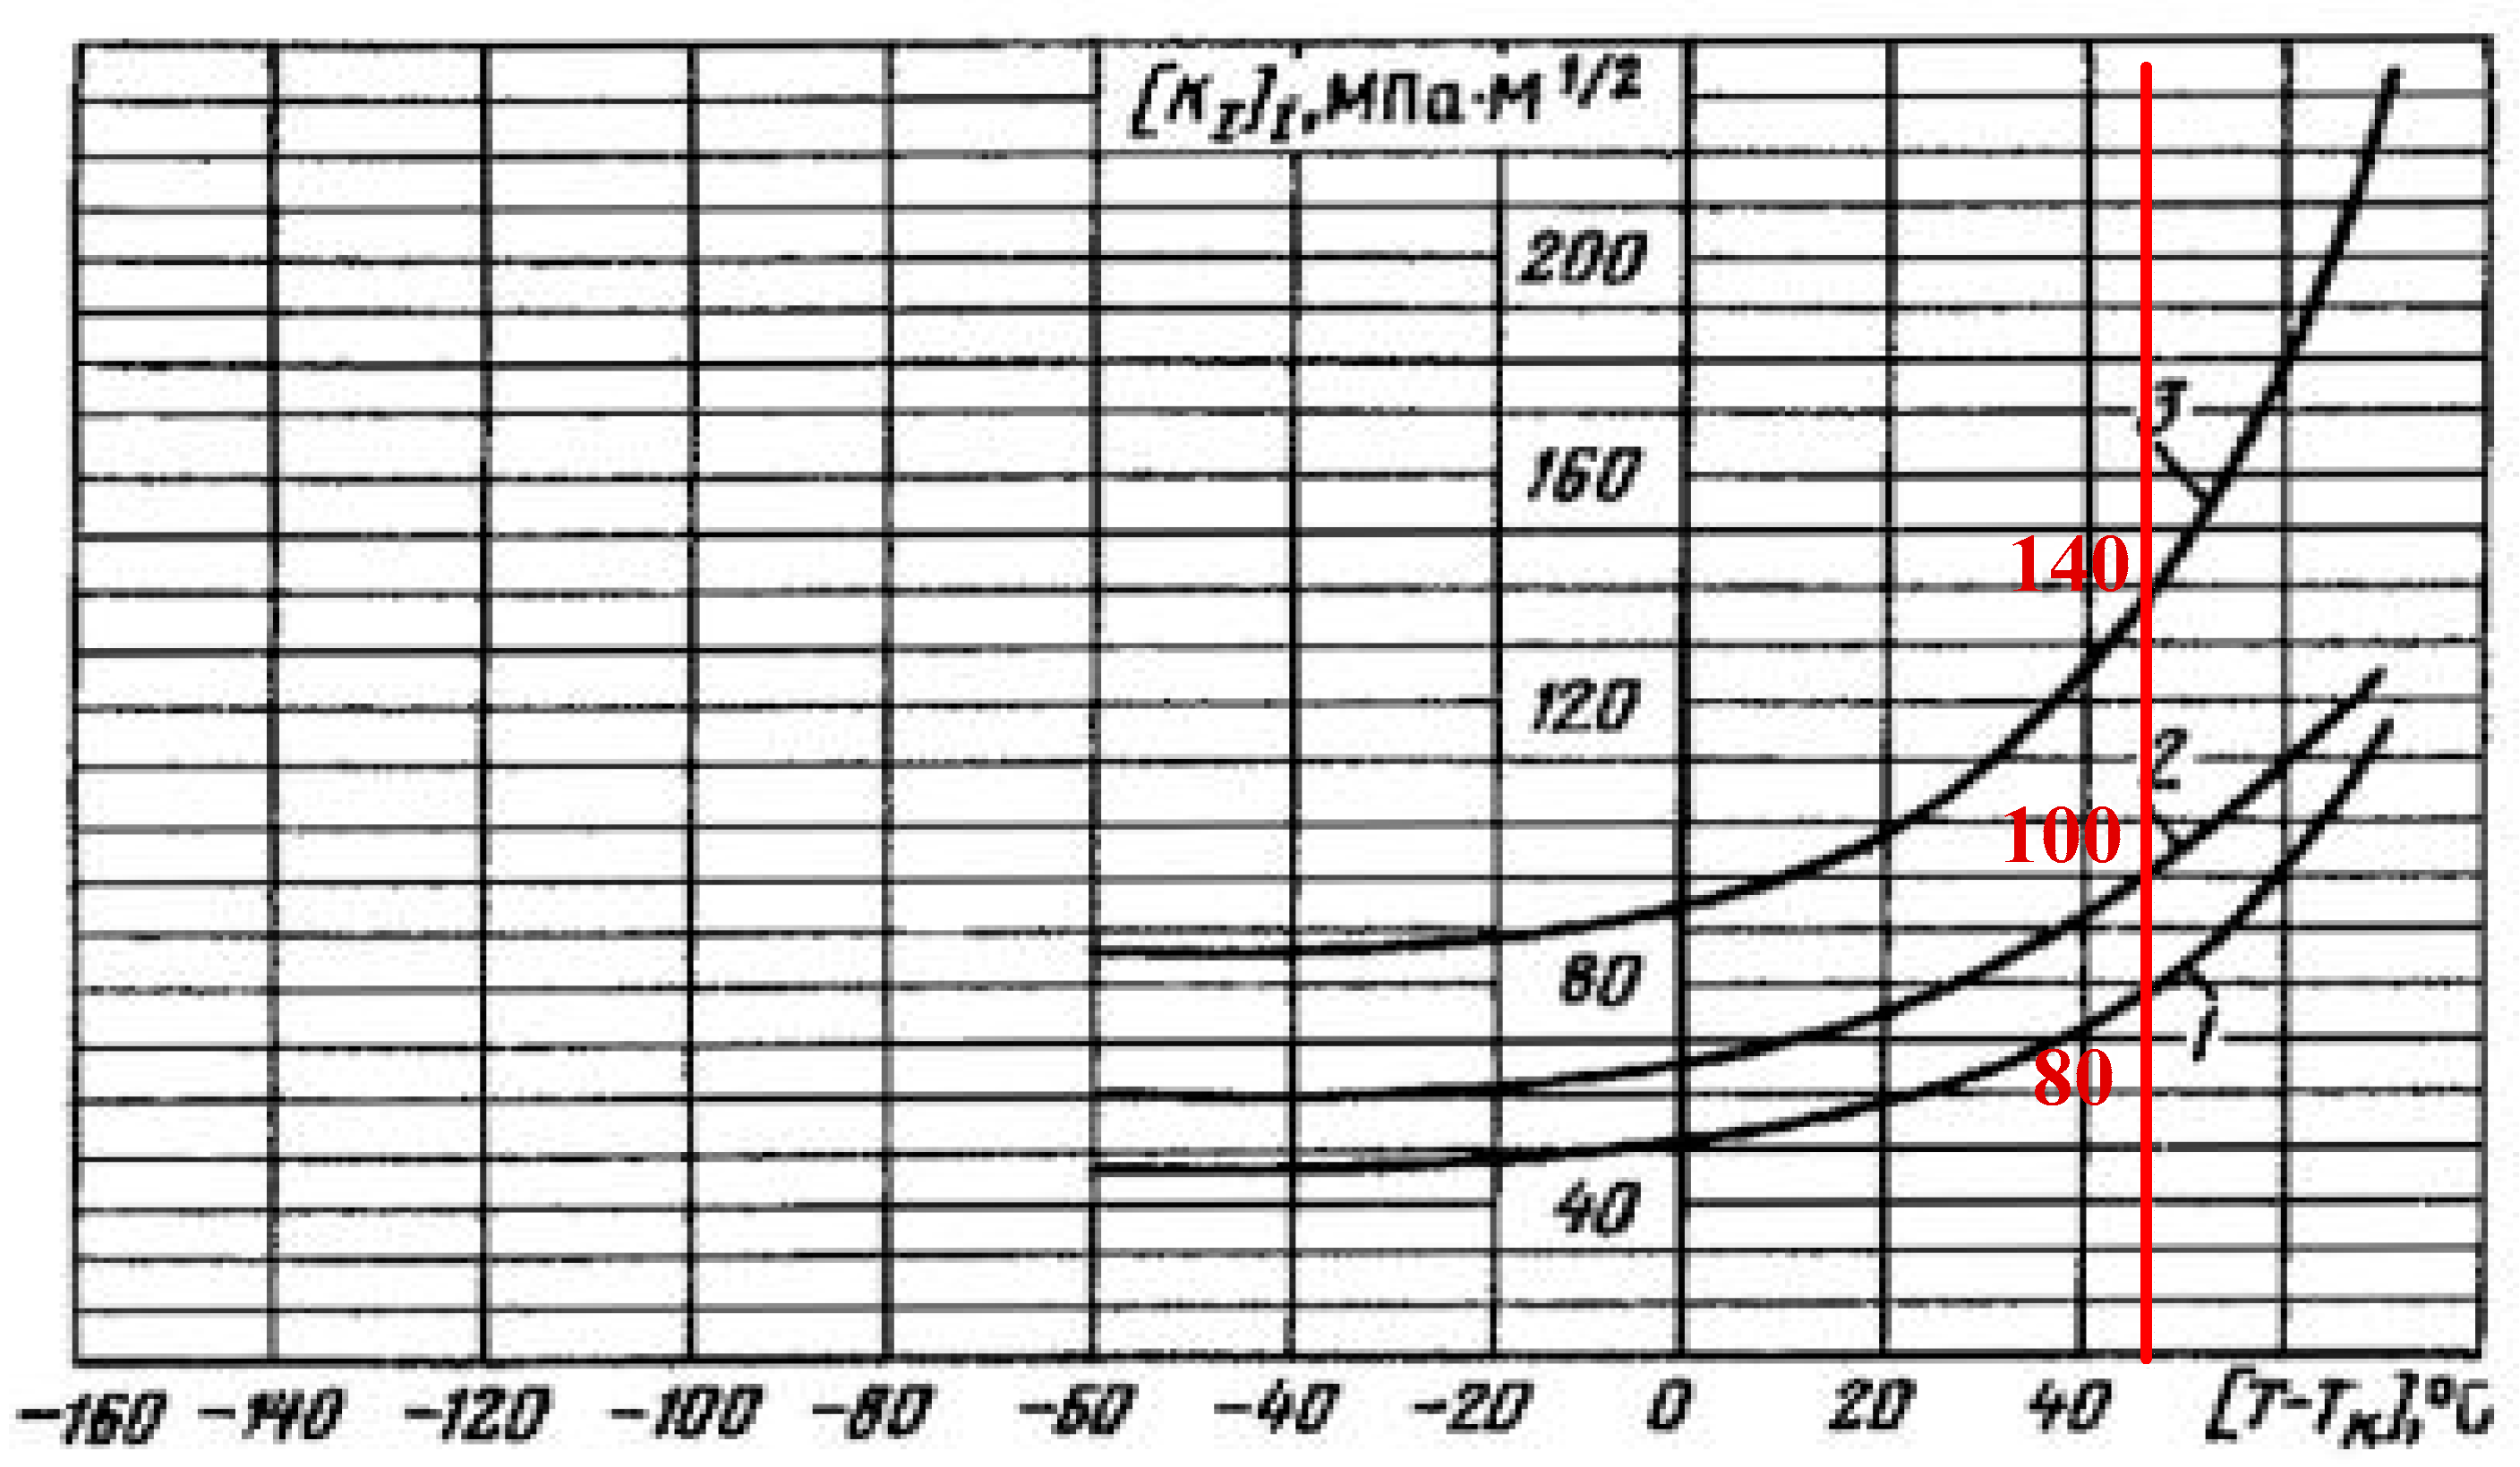

Table 1.
Input data on defects and their importance for estimates of brittle fracture resistance.
| Input data | Importance for estimates of brittle fracture resistance |
|---|---|
| Type of defects. | Pores, corrosion ulcers, abrasions on the surface of the metal. The type of defects found is an indicator of degradation mechanisms. |
| Location of defects. | The location of defects is important for determining the influencing factors and for the assessments. |
| Mutual placement of a group of defects. | If the defects are closely located, they are evaluated as a group of defects; and if not - as single defects. |
| Defect coordinates. | Through the coordinates of the defects, they can be detected by subsequent inspection of the site and their development during the operational period is tracked. |
| Defect dimensions. | The size of the defects is decisive for their admissibility according to normative indicators. |
| Orientation of defects in relation to the direction of the acting stresses. | Orientation is important and is taken into account in strength analyses. If the acting stresses are perpendicular to the plane of propagation of the defect, then this is a crack of the first kind, the most dangerous for the resource. |
Table 2.
Calculated values of the stress intensity coefficients at three different points in time after the start of the “Big Primary Leak” mode.
Table 2.
Calculated values of the stress intensity coefficients at three different points in time after the start of the “Big Primary Leak” mode.
| A moment in time after the start of the event | а [m] | c [m] | |||
|---|---|---|---|---|---|
| 0.2 hours |
0,057 |
0,036 |
450 |
|
2,41 |
| 0.4 hours | 370 | 1,98 | |||
| 0.6 hours | 280 | 1,5 |
Table 3.
Calculated values of the shift of the critical temperature
| Position | F [n / cm2] | , (7) | , (2, 10) |
|---|---|---|---|
| Base Metal, behind the surfacing, max | |||
| Block “a” | Af =23 | m=0,8; | |
| I fuel campaign | 1.060 . 1018 | 23,437 | 1,5191 |
| II fuel campaign | 2.181 . 1018 | 29,74 | 2,7057 |
| III fuel campaign | 3.16 . 1018 | 33,62 | 3,6401 |
| IV fuel campaign | 4.302 . 1018 | 37,22 | 4,6591 |
| V fuel campaign | 5.066 . 1018 | 39,28 | 5,3100 |
| VI fuel campaign | 5.742 . 1018 | 40,94 | 5,8697 |
| VII fuel campaign | 6.912 . 1018 | 43,53 | 6,8084 |
| VIII fuel campaign | 8.033 . 1018 | 45,74 | 7,6783 |
| IX fuel campaign | 9.088 . 1018 | 47,64 | 8,4750 |
| X fuel campaign | 10.325 . 1018 | 49,69 | 9,3859 |
| XI fuel campaign | 10.956 . 1018 | 50,67 | 9,8421 |
| XII fuel campaign | 11,582 . 1018 | 51,61 | 10,2895 |
| Block “b” | Af =23 | m=0,8; | |
| I fuel campaign | 1.020 . 1018 | 23,1523 | 1,4731 |
| II fuel campaign | 2.080 . 1018 | 29,3588 | 2,6050 |
| III fuel campaign | 3.012 . 1018 | 33,2146 | 3,5030 |
| IV fuel campaign | 4.012 . 1018 | 36,5450 | 4,4061 |
| V fuel campaign | 5.042 . 1018 | 39,4371 | 5,2899 |
| VI fuel campaign | 5.886 . 1018 | 41,5249 | 5,9872 |
| VII fuel campaign | 6.936 . 1018 | 43,8600 | 6,8273 |
| VIII fuel campaign | 7.946 . 1018 | 45,8931 | 7,6117 |
| IX fuel campaign | 8.557 . 1018 | 47,0403 | 8,0765 |
| X fuel campaign | 9.224 . 1018 | 48,2320 | 8,5763 |
| XI fuel campaign | 10.121 . 1018 | 49,7472 | 9,2373 |
Table 4.
Values of the quantities ∆Tinf, bt, tОТ.
| tОТ [hours] | ||
|---|---|---|
| 18 | 26.2 | 32 700 |
Table 5.
Values for the RPV metal.
| Calculation values | Test values of SS metal | |||
|---|---|---|---|---|
| According (6) | According (9) | Unit “a” | Unit “b” | |
| Unit “a” | ||||
| Unit “b” | ||||
Table 6.
Comparison of the calculated values of with the critical values of .
| ] | Comparison of the values | ||
|---|---|---|---|
| 2,41 |
|
|
80 |
| 1,98 | |||
| 1,5 |
Disclaimer/Publisher’s Note: The statements, opinions and data contained in all publications are solely those of the individual author(s) and contributor(s) and not of MDPI and/or the editor(s). MDPI and/or the editor(s) disclaim responsibility for any injury to people or property resulting from any ideas, methods, instructions or products referred to in the content. |
© 2025 by the authors. Licensee MDPI, Basel, Switzerland. This article is an open access article distributed under the terms and conditions of the Creative Commons Attribution (CC BY) license (http://creativecommons.org/licenses/by/4.0/).
Copyright: This open access article is published under a Creative Commons CC BY 4.0 license, which permit the free download, distribution, and reuse, provided that the author and preprint are cited in any reuse.


