
Submitted:
21 December 2025
Posted:
22 December 2025
You are already at the latest version
Abstract
Background: Tuberculosis (TB) outcomes remain suboptimal in high-burden, resource-constrained settings. Clinical and socioeconomic factors contribute to loss to follow-up, failure, and mortality; yet their relative importance remains underexplored. Methods: We analyzed a retrospective cohort of patients treated for pulmonary TB in the Eastern Cape, South Africa. Treatment outcomes were dichotomized as success (cured, treatment completed) versus unsuccessful (loss to follow-up, failure, death), excluding transfers and patients still on treatment. Predictors included age, gender, income, occupation, comorbidities, HIV status, previous treatment history, patient category, and drug resistance status. Regularized logistic regression was used to estimate odds ratios, while the highest decision tree model was applied to identify hierarchical risk profiles. Results: Logistic regression demonstrated high accuracy (86%) and identified drug susceptibility, age, income stability, and comorbidity burden as the strongest predictors of treatment success. The decision tree achieved lower accuracy (65%) but improved detection of unsuccessful outcomes, highlighting a clear hierarchy of risk: (1) drug resistance status, (2) age, (3) income source, and (4) comorbidities. Patients with drug-resistant TB, older age, no income or reliance on grants, and coexisting conditions were at most significant risk of poor outcomes. Conclusions: Drug resistance, age, income, and comorbidity burden shape a hierarchical risk profile for TB treatment outcomes in rural South Africa. Logistic regression offered robust overall classification, while the decision tree provided transparent stratification of at-risk groups. These findings underscore the need for integrated clinical and socio-economic support strategies to improve outcomes in high-burden settings.
Keywords:
tuberculosis
; treatment outcomes
; drug resistance
; age
; socio-economic status
; decision tree
; logistic regression
; South Africa
1. Introduction
Tuberculosis (TB) remains a leading infectious killer worldwide. In 2023, an estimated 10.8 million people fell ill with TB and 1.25 million died (including 161,000 among people living with HIV), with the WHO African Region contributing roughly a quarter of global incident disease [1,2]. Within this framework, the WHO treatment outcome classification, cured, treatment completed (together “treatment success”), treatment failure, died, lost to follow-up (LTFU), and not evaluated, provides a focal point for program performance and patient prognosis across drug-susceptible (DS-TB) and drug-resistant TB (DR-TB) cohorts. TB continues to pose a significant public health challenge, particularly in high-burden countries such as South Africa, where treatment success rates remain below the World Health Organization (WHO) target of 85% [3]. Despite widespread implementation of directly observed therapy (DOT) and community-based support programs, treatment failures, mortality, and LTFU persist [4]. Understanding the determinants of these outcomes is essential for tailoring interventions that are both clinically effective and socially responsive. Previous research has highlighted the adverse impact of DR-TB, HIV co-infection, and advanced age on treatment outcomes [5]. At the same time, socio-economic vulnerabilities such as unemployment, low income, and unstable living conditions undermine adherence and continuity of care [6]. Yet, the interaction between these clinical and social risk factors is complex and often under-analysed, particularly in rural contexts where resources are limited and health systems face additional barriers [7]. Conventional regression models are widely used to identify independent predictors of treatment outcomes, offering robust estimates of association. However, they often fail to capture the hierarchical or interactive nature of risks [8]. In contrast, machine-learning approaches such as decision trees provide interpretable pathways that show how combinations of patient characteristics influence outcomes [9]. Integrating these methods offers a more balanced understanding of both individual and structural determinants of TB success and failure. In this study, we examined a cohort of TB patients in the Eastern Cape Province of South Africa using both regularized logistic regression and decision tree modelling. We aimed to identify the central predictors of treatment outcomes and to delineate hierarchical risk profiles that combine clinical and socio-economic determinants.
2. Materials and Methods
2.1. Study Design and Setting
A retrospective cohort analysis was conducted on patients treated for pulmonary tuberculosis (PTB) in the Eastern Cape Province, South Africa. The Eastern Cape is a high-burden rural setting with persistent challenges of poverty, limited access to healthcare, and high prevalence of HIV co-infection.
2.2. Study Population
The dataset included patients registered for TB treatment between 2020 and 2024. Eligible participants were adults with bacteriologically or clinically confirmed pulmonary TB. Excluded were patients who had transferred out, moved away, or remained on treatment at the time of data extraction, as outcomes were not definitive.
2.3. Variables
Outcome: Treatment outcome was classified according to WHO definitions. Patients were grouped as:
Success: These are patients who have been cured or have completed their treatment.
Unsuccessful: These are patients who experienced treatment failure, died during treatment, or were LTFU.
2.4. Data Analysis
Treatment outcomes were dichotomized as successful versus unsuccessful. Patients who were transferred out, moved, or still on treatment were excluded from the modelling. Predictor variables included demographic (age, gender), socio-economic (income, occupation), clinical (HIV status, comorbidities, TB drug resistance), and behavioral (social history, previous treatment history, patient category) factors. Regularized logistic regression (L1 penalty, α = 0.1) was employed to address multicollinearity, and odds ratios were reported. In parallel, a decision tree classifier (maximum depth = 4, minimum 20 observations per leaf, class-weight balanced) was fitted to identify non-linear interactions and thresholds. Models were trained on 70% of the dataset and evaluated on a 30% hold-out set, with accuracy, ROC–AUC, confusion matrices, and classification reports generated.
2.5. Statistical Analysis
Data were cleaned, and categorical variables were recorded as dummy indicators. Continuous variables (e.g., age) were retained in numeric form. Missing values were minimal (<1% for gender and drug resistance status) and excluded from modelling.
Two complementary modelling approaches were used:
- Regularized Logistic Regression: We fitted a logistic regression model with L1 (LASSO) penalization to address collinearity and reduce overfitting. Results were expressed as odds ratios (OR) with exponentiated coefficients. Model performance was evaluated using a 70/30 train–test split, with accuracy and ROC–AUC metrics.
- Decision Tree Classifier: A classification tree was trained using a maximum depth of 4 and a minimum leaf size of 20, with class weighting to account for outcome imbalance. Feature importance values were extracted, and the tree was visualized to facilitate the interpretation of hierarchical risk profiles. Performance was assessed with accuracy, ROC–AUC, precision, recall, and F1-scores on the test set. Analyses were performed using Python (scikit-learn, stats models, matplotlib).
3. Results
3.1. Demographic Characteristics of the Study Population
The study included 382 patients with a mean age of 40.3 years (SD, 16.8; range, 6–95 years). Males accounted for 60.2% (n = 230), yielding a male-to-female ratio of 1.5:2. Most patients were new TB cases (81.4%, n = 311), while 15.7% (n = 50) were previously treated, 0.5% (n = 2) were PT2, and 2.4% (n = 9) had an unknown treatment history. This distribution reflects a predominantly young-to-middle-aged, male-leaning cohort, with a substantial minority representing retreatment cases.
3.2. TB Treatment Outcomes Predictors
Table 1 presents the odds ratios (ORs) from the regularized logistic regression model. Predictors with ORs greater than 1.0 indicate increased likelihood of treatment success, while ORs below 1.0 indicate reduced likelihood. Social history categories and patient category variables showed high ORs. However, the wide range of ORs reflects model regularization, which penalizes less informative predictors and highlights the most influential ones. In regularized logistic regression, the overall accuracy was 86% (ROC–AUC = 0.66), with high precision and recall for successful outcomes but limited sensitivity for unsuccessful outcomes due to class imbalance. Strong positive predictors of successful outcomes included favorable social history categories and being classified as new patients, while relapse and adverse social histories were associated with lower odds of success. In contrast, the decision tree classifier (depth = 4, class-weight balanced) achieved an accuracy of 65% and ROC–AUC of 0.69, performing better at identifying unsuccessful outcomes. Key predictors driving splits were drug resistance status (DR vs DS), patient age, income source, and presence of any comorbidity. Table 2 compares the findings of our study with previous studies.
3.3. Logistic Regression—Test Set Classification Report
The logistic regression model demonstrated high accuracy (86%) and strong recall for successful outcomes (95%) (Table 3). However, performance for unsuccessful outcomes was limited (recall 18%), reflecting the class imbalance in the dataset. The model therefore reliably identified patients who completed or were cured, but under-detected those who defaulted, failed, or died.
3.4. Decision Tree—Test Set Classification Report
The decision tree achieved 65% accuracy with a ROC–AUC of 0.69. Compared to logistic regression, the tree performed better at identifying unsuccessful outcomes (recall rate of 45%) (Table 4), although with a reduced overall accuracy. This highlights the trade-off between precision for the majority class (success) and improved detection of the minority class (unsuccessful outcomes). Clinically, this makes the decision tree valuable for flagging at-risk patients, even if some successful cases are misclassified.
3.5. Decision Tree—Feature Importance
In Table 5, the most critical predictors identified by the decision tree were drug resistance status (DR vs DS), which was the dominant predictor of treatment outcome. With age, younger patients were more likely to succeed. Regarding income sources, salaried income was associated with treatment success, while no income/grant support predicted poorer outcomes. The presence of any comorbidity slightly reduced the probability of treatment success. Other features contributed minimally to classification.
3.6. Key Predictors—Logistic Regression
The strongest predictors (based on OR thresholds) reinforced findings from the decision tree. Social history variables, patient category (e.g., new vs relapse), and occupation/income measures were associated with increased odds of treatment success. In contrast, specific categories (e.g., no income or unemployment) were protective against success, aligning with the role of socio-economic vulnerability. These results demonstrate consistency between the regression and tree-based models in highlighting both clinical (DR-TB, patient category) and socio-economic (income, occupation) determinants of outcome.

Table 6.
Key predictors—logistic regression.
| Predictor | OR (regularized) |
| Social History (1=Smoking; 2=Drinking; 3=Hard Drugs; 4=Smoking & Drinking; 5=Smoking & Drugs; 6= Smoking &Drinking & Drugs; 7=None)_5 | 687.006 |
| Occupation (1=Unemployed; 2=Student; 3=Pensioner; 4=Grant; 5=Govt. Dept.; 6=Private Sector; 7=Minors)_6 | 14.707 |
| Patient category (1=New; 2=Relapse; 3=Tal; 4=TF1; 5=TF2_4 | 14.461 |
| Patient category (1=New; 2=Relapse; 3=Tal; 4=TF1; 5=TF2_1900-01-01 00:00:00 | 14.305 |
| Social History (1=Smoking; 2=Drinking; 3=Hard Drugs; 4=Smoking & Drinking; 5=Smoking & Drugs; 6= Smoking &Drinking & Drugs; 7=None)_6 | 6.675 |
| Type of TB (1=DR, 2= DS)_2.0 | 6.423 |
| Patient category (1=New; 2=Relapse; 3=Tal; 4=TF1; 5=TF2_3 | 3.962 |
| Previous drug history (1=New; 2=PT1; 3=PT2; 4=UNK)_4 | 3.826 |
| HIV status {1=Positive, 2=Negative_2 | 3.462 |
| any comorbidity | 3.212 |
| Income (1=Salary or Wages; 2.=Casual; 3=UIF; 4=SG; 5=No income; 6=Self-employed)_4 | 0.624 |
| Social History (1=Smoking; 2=Drinking; 3=Hard Drugs; 4=Smoking & Drinking; 5=Smoking & Drugs; 6= Smoking &Drinking & Drugs; 7=None)_4 | 0.548 |
| Gender (M=1/ F= 2)_2.0 | 0.436 |
| Const | 0.364 |
| Occupation (1=Unemployed; 2=Student; 3=Pensioner; 4=Grant; 5=Govt. Dept.; 6=Private Sector; 7=Minors)_2 | 0.278 |
| Social History (1=Smoking; 2=Drinking; 3=Hard Drugs; 4=Smoking & Drinking; 5=Smoking & Drugs; 6= Smoking &Drinking & Drugs; 7=None)_none | 0.238 |
| Income (1=Salary or Wages; 2.=Casual; 3=UIF; 4=SG; 5=No income; 6=Self-employed)_6 | 0.066 |
| Income (1=Salary or Wages; 2.=Casual; 3=UIF; 4=SG; 5=No income; 6=Self-employed)_2 | 0.006 |
The decision tree model (with a maximum depth of 4) identified drug resistance status and age as the most influential determinants of treatment outcomes.
Primary split: Patients with DR-TB were substantially more likely to experience unsuccessful outcomes (loss to follow-up, failure, or death) compared to those with drug-susceptible TB (DS-TB).
Age effect: Among DS-TB patients, younger age (<40 years) was associated with higher success rates (cure or treatment completion), whereas older age groups showed progressively lower success rates. This reflects the known clinical challenge of comorbidities, frailty, and adherence barriers in older populations.
Socio-economic predictors: For older DS-TB patients, income source further stratified outcomes. Patients reporting salaried or wage income tended to have higher success, while those with no income or dependent on grants had poorer outcomes, highlighting the role of socio-economic security in treatment adherence.
Comorbidities: The presence of any comorbidity (particularly HIV or hypertension/diabetes combinations) appeared in lower branches, modestly reducing the probability of success. However, the impact was minor compared to DR-TB status and age.
Overall, the decision tree (Figure 1) presents a hierarchical risk profile in descending order, beginning with drug resistance status (the highest risk determinant), followed by age, income stability, and comorbidity burden.
4. Discussion
This study identified drug resistance status, age, income stability, and comorbidity burden as the key factors influencing TB treatment outcomes in a rural South African cohort. Logistic regression achieved high overall accuracy and confirmed strong links between these predictors and treatment success. The decision tree, while somewhat less accurate, offered clearer hierarchical pathways of risk, illustrating that DR-TB, older age, lack of income, and comorbidity sequentially contributed to stratifying patients at the highest risk of failure, death, or loss to follow-up.
The finding that drug resistance status is the most influential predictor is well supported by studies in South Africa and other high-burden settings, where rifampicin-resistant and multidrug-resistant TB (MDR-TB) patients experience lower success rates and higher mortality. Seloma et al. reported poor DR-TB outcomes linked to resistance pattern, previous treatment, and HIV co-infection in Limpopo Province [10]. Similarly, Nxumalo et al. observed that DR-TB, low BMI, and delayed diagnosis were significantly associated with poor outcomes in Eastern Cape rural clinics [11]. These findings align with the decision tree’s first split on DR-TB in this study. Furthermore, Osman et al. [12], using an individual patient-based national electronic TB treatment register of DS-TB in South Africa, reported that older age, male gender, previous TB treatment, and HIV infection (with or without ART) were associated with an increased risk of mortality. A study conducted in Cape Town found that patients initially lost to follow-up (LTFU) after diagnosis had very high early mortality, especially when co-infected with HIV, which highlighted how comorbidity and delays in care worsen outcomes [13]. Older age and the burden of comorbidities were also significant predictors. Evidence from other African countries such as Ethiopia, Nigeria, and Uganda, as well as from Asia, aligns with our results, indicating that older age, HIV, and other comorbidities predicted mortality among DR-TB patients [14,15,16,17,18]. For DR-TB, coexisting HIV, diabetes, hypertension, and harmful alcohol use further increase the risks of mortality and treatment failure. Our model’s identification of comorbidity burden as a significant risk node supports current evidence emphasizing the need for integrated care for TB patients with chronic diseases. The study’s finding that income stability is an important predictor highlights the critical role of socioeconomic vulnerability in TB outcomes. In Ethiopia, Mengesha et al. found that low income, food insecurity, and lack of social support increased the risk of poor treatment outcomes [19]. Socioeconomic deprivation has also been linked to worse TB treatment outcomes and higher incidence rates in South Africa and globally [20,21]. Machine-learning studies from Uganda and Kenya similarly show that unemployment, food insecurity, and housing instability predict non-adherence and treatment interruption [22,23]. These findings reinforce that social determinants substantially influence TB outcomes and should be considered core components of TB control programs. Finally, logistic regression outperformed the decision tree in predictive accuracy, consistent with the literature, which shows that regression models tend to be more robust and stable. In contrast, tree-based models offer better interpretability but sometimes less precision. Recent modeling studies in China and Southeast Asia have found similar patterns: regression-derived clinical scores achieved high discrimination. At the same time, decision trees provided intuitive pathways that are useful for stratified care planning [24,25]. The decision tree framework uniquely illustrates how socioeconomic disadvantage amplifies clinical risks, reinforcing the importance of integrated social and health interventions. Our use of both approaches highlights the complementary value of statistical and machine-learning methods in TB prediction research.
4.1. Limitations
Some limitations need to be acknowledged. First, the dataset included relatively few unsuccessful outcomes, which limited sensitivity for poor prognosis in logistic regression and may affect generalizability. Although class weighting improved the performance threefold, imbalance still poses a methodological challenge. The performance threefold was coded broadly, restricting insights into the effects of specific conditions like hypertension or diabetes when combined with HIV. Thirdly, as a retrospective analysis, unmeasured confounders (e.g., adherence, health system barriers) could influence the outcomes.
4.2. Implications for Policy and Practice
These results underscore the need for targeted interventions. The strong influence of drug resistance and comorbidity burden on treatment outcomes suggests that current TB programs may insufficiently differentiate care based on patient risk profiles. This highlights the need for policies that prioritize early risk identification and integrated management of TB with HIV and non-communicable diseases (NCDs), particularly in resource-limited rural settings. The role of income instability emphasizes that social determinants are central to treatment success, indicating a need for policies that integrate social protection into TB programs. The effectiveness of predictive modelling demonstrates the potential value of data-driven decision-making for program planning and resource allocation.
5. Conclusions
This study demonstrates that drug resistance, age, income, and comorbidity burden define a hierarchical risk profile for TB treatment outcomes. While logistic regression offers robust overall prediction, decision trees provide an interpretable framework for risk stratification. Integrating socio-economic and clinical support remains essential to improving TB outcomes in high-burden, resource-constrained settings. Integrating risk prediction into TB programs and addressing comorbidities and social needs could significantly improve treatment success and reduce TB-related mortality in rural communities.
6. Recommendations
Based on the study findings, TB programs should implement risk-stratified patient management using key predictors such as drug resistance, age, income stability, and comorbidity burden to identify patients at high risk of poor outcomes early and provide intensified follow-up and support. Strengthening integrated TB–HIV–NCDs care is essential, with emphasis on early screening and management of comorbidities. Given the influence of socioeconomic vulnerability, social protection interventions should be expanded for patients without stable income to improve adherence and reduce LTFU. In addition, routine TB data systems must be strengthened at the district level to support accurate data capture and enable predictive modelling. Prediction models should be validated and refined across multiple provinces to support scalability and inform the implementation of national TB programs.
Author Contributions
Conceptualization, N.N., and M.C.H.; methodology, M.C.H and L.M.F.; software, L.M.F., and M.C.H.; validation, L.M.F., and M.C.H.; formal analysis, N.N., L.M.F., and M.C.H.; investigation, N.N., and M.C.H.; resources, T.A., and M.C.H.; data curation, L.M.F., N.D., and M.C.H.; writing—original draft preparation, N.N., L.M.F., and M.C.H.; writing—review and editing, L.M.F., N.D., T.A., and M.C.H.; supervision, M.C.H.; project administration, M.C.H.; funding acquisition, T.A. All authors have read and agreed to the published version of the manuscript.
Funding
This research was funded by the School of Pathology, Faculty of Medicine and Health Sciences. Walter Sisulu University funded Walter Sisulu University, Mthatha, and the APC.
Institutional Review Board Statement
The study was conducted in accordance with the Declaration of Helsinki and approved by the Walter Sisulu University Health Sciences Research Ethics Committee (protocol code WSU.HREC 150/2025 and date of approval 01 July 2025) and Eastern Cape Department of Health (EC_202510_023).
Informed Consent Statement
Not applicable as this study only reviewed patient files.
Data Availability Statement
Data can be requested upon reasonable request from the corresponding author.
Acknowledgments
The authors are grateful to the facility managers, healthcare professionals, and data capturers in the healthcare facilities for giving access to patient files. We appreciate the contributions and assistance of the WSU-TB research group mentors and 2025 honors students during data collection.
Conflicts of Interest
The authors declare that they have no conflicts of interest. The funders had no role in the design of the study, in the collection, analysis, or interpretation of data, in the writing of the manuscript, or in the decision to publish the results.
Abbreviations
The following abbreviations are used in this manuscript:
| ART | Antiretroviral therapy |
| DOT | Directly observed treatment |
| DRTB | Drug-resistant tuberculosis |
| DSTB | Drug-sensitive tuberculosis |
| LTFU | Drug-resistant tuberculosis |
| NCD | Non-communicable disease |
| OR | Odds ratios |
| PTB | Pulmonary TB |
| PT1 | Previously treated with the first-line anti-TB drug. |
| PT2 | Previously treated with second line anti-TB drugs. |
| WHO | World Health Organisation |
References
- Global Tuberculosis Report 2024. Geneva. World Health Organization (WHO). Available online at: https://iris.who.int/server/api/core/bitstreams/7292c91e-ffb0-4cef-ac39-0200f06961ea/content (Accessed 26 Sep. 2025).
- World Health Organization (WHO) (2025) Tuberculosis: fact sheet (updated 14 March 2025). Geneva: WHO.
- Lei, Y.; Wang, J.; Wang, Y.; Xu, C. Geographical evolutionary pathway of global tuberculosis incidence trends. BMC Public Health 2023, 23(1), 755. [CrossRef]
- Daneshi, S.; Mehni, E.B.; Kamali, M.; Barfar, E.; Barahouei, F.B.; Hushmandi, K.; Raesi, R. Prevalence and contributing factors of drug-resistant tuberculosis (DR-TB) in Iran: a systematic review. BMC Infect. Dis. 2025, 25(1), 1004. [CrossRef]
- Tusho, A.R.; Mokoboto-Zwane, S.T. Treatment completion of drug-resistant tuberculosis in Ethiopia: A perspective from healthcare users. PLOS Glob Public Health 2025, 5(2), e0004110. [CrossRef]
- Evelina, L.; Adriana, N.; Serghei, C.; Liliya, T. Predictive factors associated with low tuberculosis treatment outcome: a cross-sectional study. Moldovan Med. J. 2017, 60(2), 7-12.
- Nagarajan, K.; Kumarsamy, K.; Begum, R.; Panibatla, V.; Reddy, R.; Adepu, R.; Munjattu, J.F.; Sellapan, S.; Arangba, S.; Goswami, A.; Swamickan, R. A dual perspective of psycho-social barriers and challenges experienced by drug-resistant TB patients and their caregivers through the course of diagnosis and treatment: findings from a qualitative study in Bengaluru and Hyderabad Districts of South India. Antibiotics, 2022, 11(11), 1586. [CrossRef]
- Alene, K.A.; Viney, K.; McBryde, E.S.; Clements, A.C. Spatial patterns of multidrug resistant tuberculosis and relationships to socio-economic, demographic and household factors in northwest Ethiopia. PLoS One, 2017, 12(2), e0171800. [CrossRef]
- Balogun, O.S.; Olaleye, S.A.; Mohsin, M.; Toivanen, P. Investigating machine learning methods for tuberculosis risk factors prediction: a comparative analysis and evaluation. Proceedings of the 37th International Business Information Management Association (IBIMA). 2021 May 18.
- Seloma, N.M., Makgatho, M.E., Maimela, E. Evaluation of drug-resistant tuberculosis treatment outcome in Limpopo province, South Africa. Afr J Pri Health Care Fam Med, 2023, 15(1), 3764. [CrossRef]
- Nxumalo, E.L., Sineke, N., Dlatu, N., Apalata, T. and Faye, L.M. Treatment Outcomes of Tuberculosis in the Eastern Cape: Clinical and Socio-Demographic Predictors from Two Rural Clinics. Int. J. Environ. Res. Public Health, 2025, 22(12), 1804. [CrossRef]
- Osman, M.; van Schalkwyk, C.; Naidoo, P.; Seddon, J.A.; Dunbar, R.; Dlamini, S.S.; Welte, A.; Hesseling, A.C.; Claassens, M.M. Mortality during tuberculosis treatment in South Africa using an 8-year analysis of the national tuberculosis treatment register. Sci Rep 2021, 11, 15894 (2021). [CrossRef]
- Osman, M.; Meehan, S.A.; von Delft, A.; Du Preez, K.; Dunbar, R.; Marx, F.M.; Boulle, A.; Welte, A.; Naidoo, P.; Hesseling, A.C. Early mortality in tuberculosis patients initially lost to follow up following diagnosis in provincial hospitals and primary health care facilities in Western Cape, South Africa: PLoS One, 2021, 16(6), e0252084. [CrossRef]
- Hiluf, S.B.; Abera, A.; Bahiru, M.; Kassie, B. Determinants of unsuccessful tuberculosis treatment outcome in Southwest Ethiopia regional state public hospitals, 2022: a multi-center case control study. Front Public Health, 2024, 12, 1406211. [CrossRef]
- Oyefabi, A.M.; West, C.T.; Ameh, S.; Jiya, E.N.; Sadiq, A.; Dauda, H.; Onoh, M. Predictors of Mortality among Drug-Resistant Tuberculosis Patients in Kaduna State, Nigeria. Nig J Clin Practice, 26(6), 2023, 825-831. [CrossRef]
- Barteka, G.; Bwayo, D.; Matovu, J.K.; Wanume, B.; Alunyo, J.P.; Sseguya, R.; Masaba, J.P.; Obbo, J.S. Treatment outcomes and predictors of success for multidrug-resistant tuberculosis MDR TB in Ugandan regional referral hospitals. Sci Rep, 2025, 15(1), 14144. [CrossRef]
- Nowiński, A.; Wesołowski, S.; Korzeniewska-Koseła, M. The impact of comorbidities on tuberculosis treatment outcomes in Poland: a national cohort study. Front Public Health, 11, 2023, 1253615. [CrossRef]
- Teka, D., Assegid, S., Ahmed, J., Debella, A., Amentie, E., Wami, G., Eyeberu, A. Determinants of unsuccessful TB treatment outcomes among patients on directly observed treatment short course in Jimma town health facilities, Southwest Ethiopia: A Case-Control study. Infect. Drug Resist. 2023; 15 (2): 6427-6435. [CrossRef]
- Mengesha, M.M., Gebremichael, M.A., Watumo, D., Hallström, I.K. and Jerene, D. Poor adult tuberculosis treatment outcome and associated factors in Gibe Woreda, Southern Ethiopia: An institution-based cross-sectional study. PLOS Glob Public Health, 2022, 2(3), e0000161. [CrossRef]
- Dlatu, N., Longo-Mbenza, B., and Apalata, T. Predictors of tuberculosis incidence and the effects of multiple deprivation indices on tuberculosis management in OR Tambo district over 5 years. PLoS One, 2022, 17(3), e0264811. [CrossRef]
- Ngah, V.D., Rangoanana, M., Fwemba, I., Maama, L., Maphalale, S., Molete, M., Ratikoane, R., Ogunrombi, M., Daramola, J., Nyasulu, P.S. Evaluating determinants of treatment outcomes among tuberculosis patients in the mining district of Butha Buthe, Lesotho. IJID regions, 2023, 6:62-67. [CrossRef]
- Gichuhi, H.W., Magumba, M., Kumar, M., and Mayega, R.W. A machine learning approach to explore individual risk factors for tuberculosis treatment non-adherence in Mukono district. PLOS Glob Public Health, 2023, 3(7), e0001466. [CrossRef]
- Anley, D.T., Akalu, T.Y., Dessie, A.M., Anteneh, R.M., Zemene, M.A., Bayih, W.A., Solomon, Y., Gebeyehu, N.A., Kassie, G.A., Mengstie, M.A., and Abebe, E.C. Prognostication of treatment non-compliance among patients with multidrug-resistant tuberculosis in the course of their follow-up: a logistic regression–based machine learning algorithm. Front Digit. Health, 2023, 5:1165222. [CrossRef]
- Lu, B., Shi, Y., Wang, M., Jin, C., Liu, C., Pan, X., and Chen, X. Development of a clinical prediction model for poor treatment outcomes in the intensive phase in patients with initial treatment of pulmonary tuberculosis. Front Med, 2025, 12:1472295. [CrossRef]
- Phat, N.K., Lee, Y., Vu, D.H., Long, N.P., and Park, S. Risk factors for tuberculosis treatment outcomes: a statistical learning-based exploration using the SINAN database with incomplete observations. BMC Med Inform Decis Mak. 2025; 25 (1): 301. [CrossRef]
Figure 1.
Decision tree.
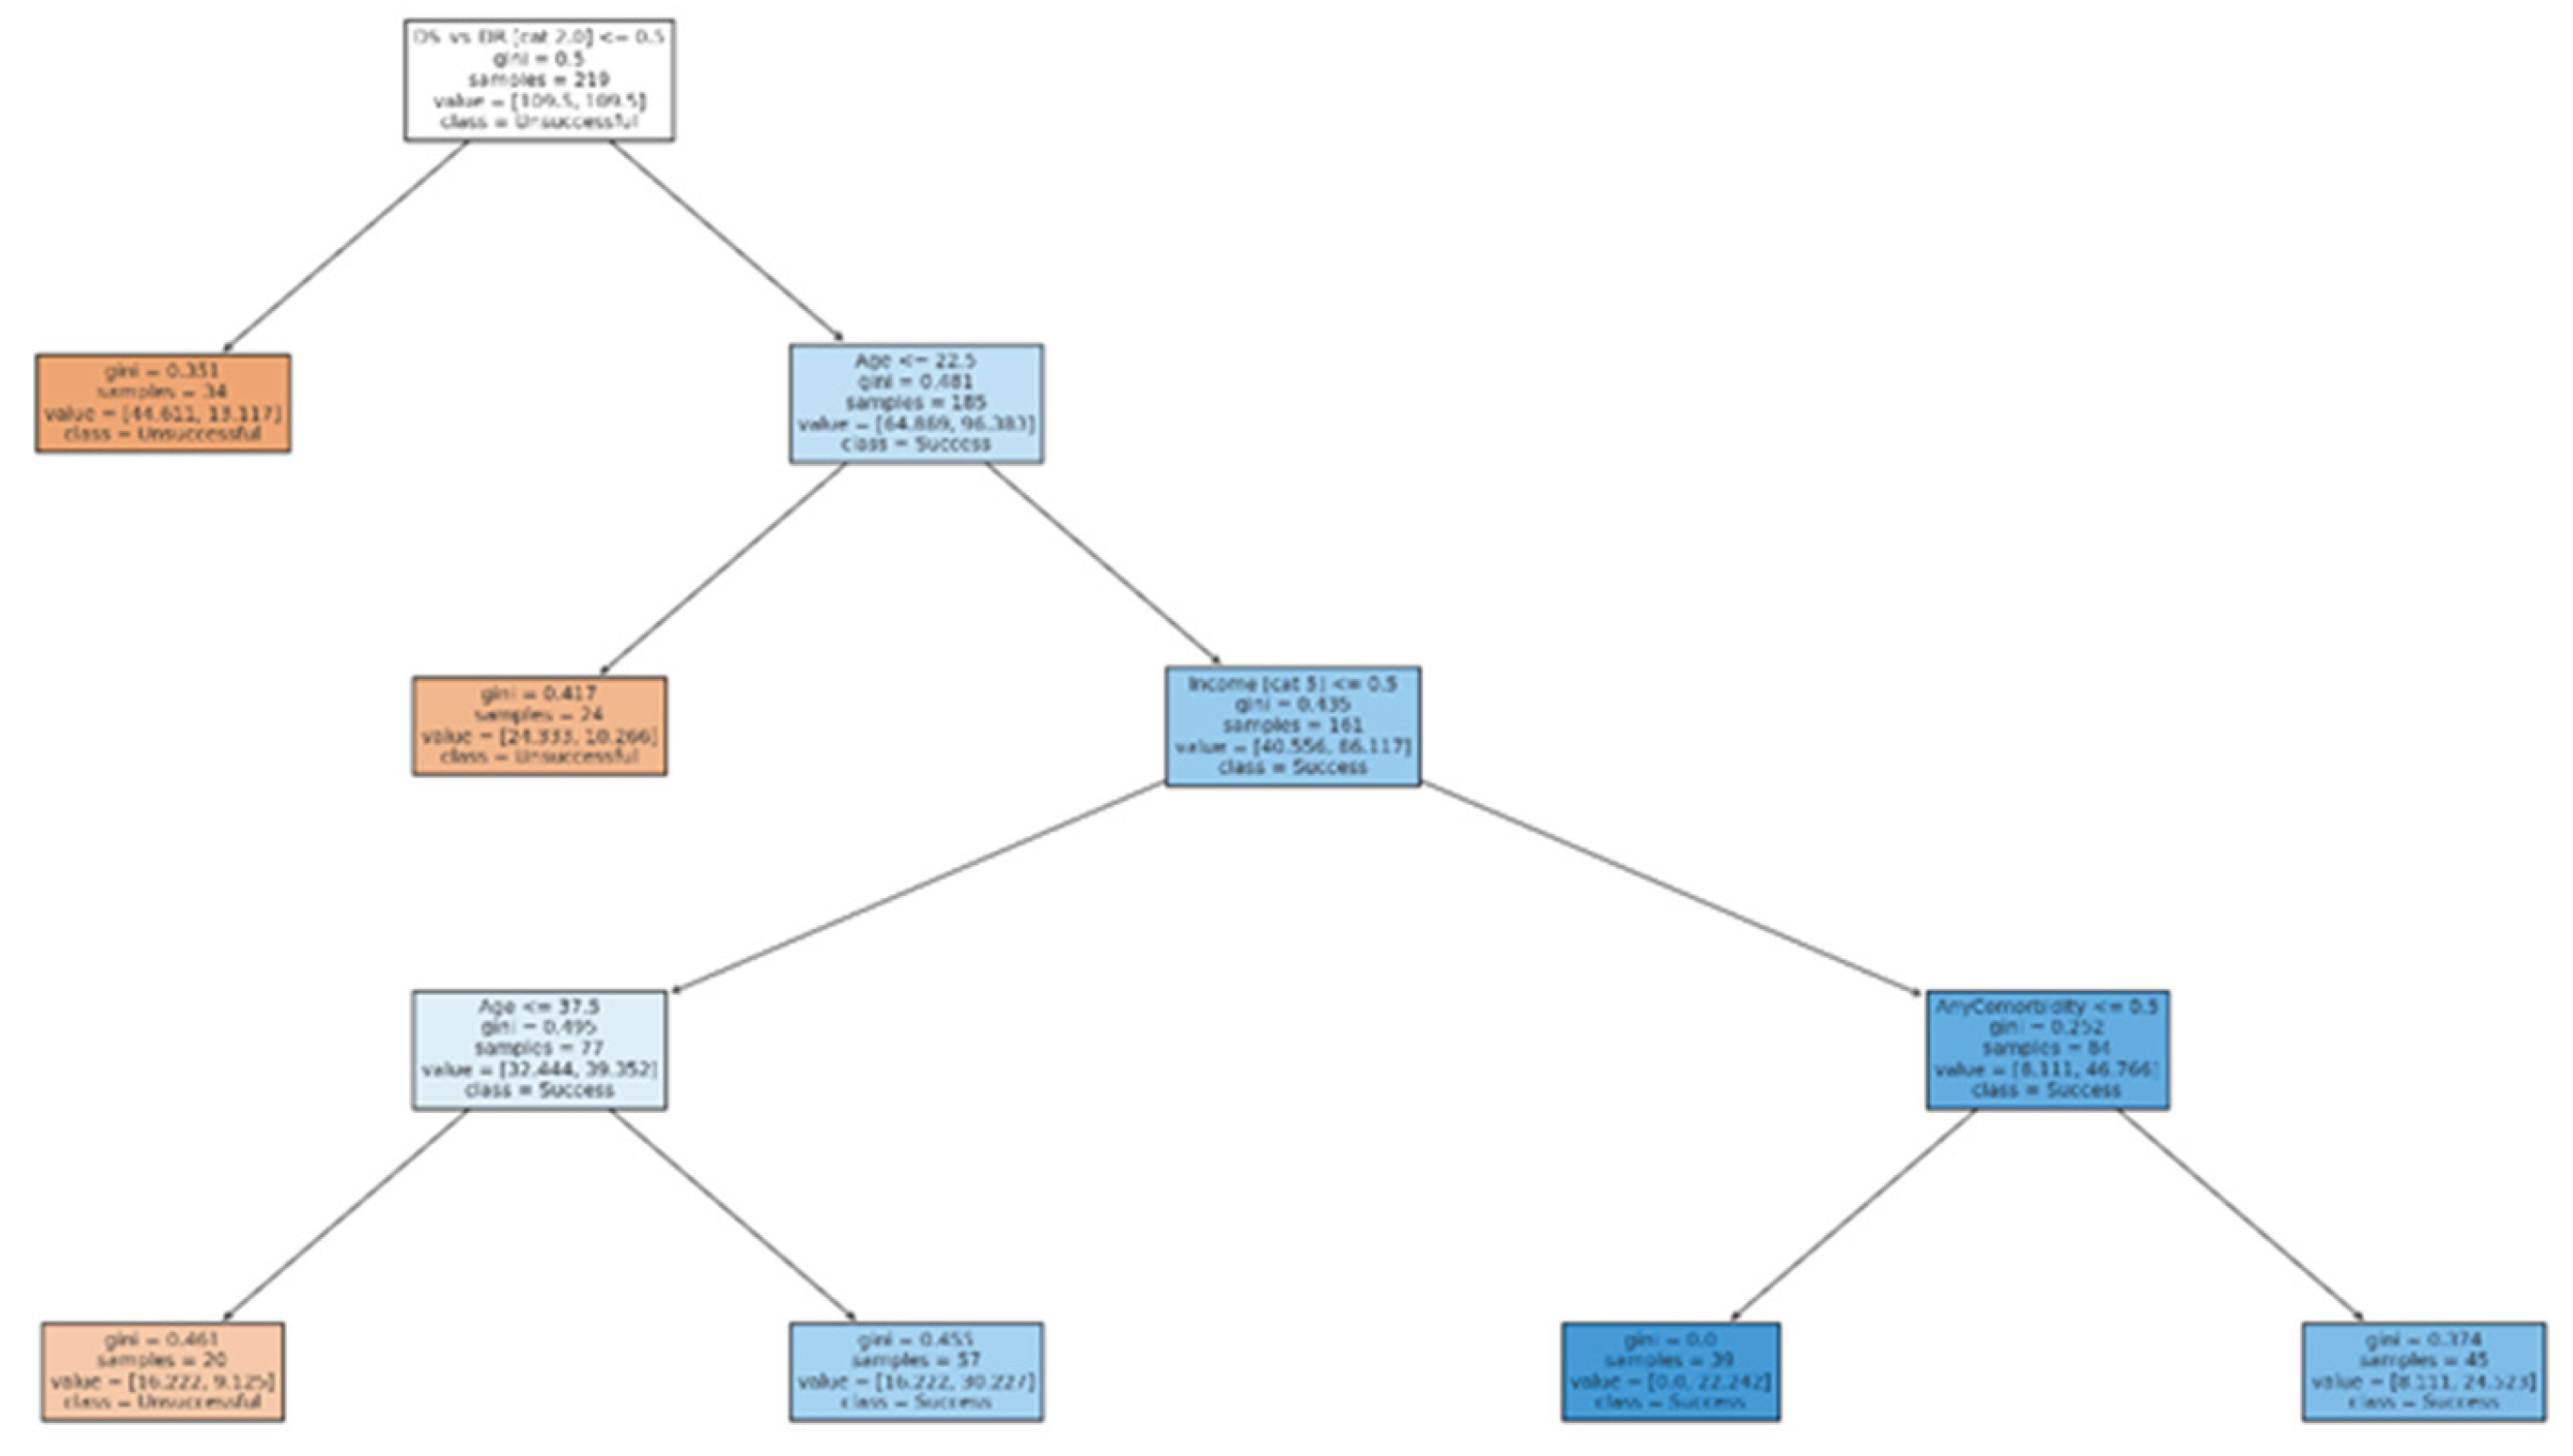
Table 1.
Regularized Logistic Regression—Odds Ratios.
| Predictor | OR (regularized) |
| Social History (1=Smoking; 2=Drinking; 3=Hard Drugs; 4=Smoking & Drinking; 5=Smoking & Drugs; 6= Smoking &Drinking & Drugs; 7=None)_5 | 687.006 |
| Occupation (1=Unemployed; 2=Student; 3=Pensioner; 4=Grant; 5=Govt. Dept.; 6=Private Sector; 7=Minors)_6 | 14.707 |
| Patient category (1=New; 2=Relapse; 3=Tal; 4=TF1; 5=TF2_4 | 14.461 |
| Patient category (1=New; 2=Relapse; 3=Tal; 4=TF1; 5=TF2_1900-01-01 00:00:00 | 14.305 |
| Social History (1=Smoking; 2=Drinking; 3=Hard Drugs; 4=Smoking & Drinking; 5=Smoking & Drugs; 6= Smoking &Drinking & Drugs; 7=None)_6 | 6.675 |
| Type of TB (1=DR, 2= DS)_2.0 | 6.423 |
| Patient category (1=New; 2=Relapse; 3=Tal; 4=TF1; 5=TF2_3 | 3.962 |
| Previous drug history (1=New; 2=PT1; 3=PT2; 4=UNK)_4 | 3.826 |
| HIV status {1=Positive, 2=Negative_2 | 3.462 |
| any comorbidity | 3.212 |
| Patient category (1=New; 2=Relapse; 3=Tal; 4=TF1; 5=TF2_1900-01-02 00:00:00 | 3.169 |
| Social History (1=Smoking; 2=Drinking; 3=Hard Drugs; 4=Smoking & Drinking; 5=Smoking & Drugs; 6= Smoking &Drinking & Drugs; 7=None)_2 | 2.486 |
| Social History (1=Smoking; 2=Drinking; 3=Hard Drugs; 4=Smoking & Drinking; 5=Smoking & Drugs; 6= Smoking &Drinking & Drugs; 7=None)_3 | 1.990 |
| Income (1=Salary or Wages; 2.=Casual; 3=UIF; 4=SG; 5=No income; 6=Self-employed)_5 | 1.530 |
| Social History (1=Smoking; 2=Drinking; 3=Hard Drugs; 4=Smoking & Drinking; 5=Smoking & Drugs; 6= Smoking &Drinking & Drugs; 7=None)_7 | 1.182 |
| Age | 1.013 |
| Previous drug history (1=New; 2=PT1; 3=PT2; 4=UNK)_2 | 1.007 |
| Occupation (1=Unemployed; 2=Student; 3=Pensioner; 4=Grant; 5=Govt. Dept. 6=Private Sector; 7=Minors)_4 | 1.000 |
| Patient category (1=New; 2=Relapse; 3=Tal; 4=TF1; 5=TF2_5 | 1.000 |
| Gender (M=1/ F= 2)_nan | 1.000 |
| Patient category (1=New; 2=Relapse; 3=Tal; 4=TF1; 5=TF2_2 | 1.000 |
| Previous drug history (1=New; 2=PT1; 3=PT2; 4=UNK)_3 | 1.000 |
| Occupation (1=Unemployed; 2=Student; 3=Pensioner; 4=Grant; 5=Govt. Dept. 6=Private Sector; 7=Minors)_5 | 1.000 |
| Occupation (1=Unemployed; 2=Student; 3=Pensioner; 4=Grant; 5=Govt. Dept.; 6=Private Sector; 7=Minors)_3 | 0.780 |
| Income (1=Salary or Wages; 2.=Casual; 3=UIF; 4=SG; 5=No income; 6=Self-employed)_4 | 0.624 |
| Social History (1=Smoking; 2=Drinking; 3=Hard Drugs; 4=Smoking & Drinking; 5=Smoking & Drugs; 6= Smoking &Drinking & Drugs; 7=None)_4 | 0.548 |
| Gender (M=1/ F= 2)_2.0 | 0.436 |
| Const | 0.364 |
| Occupation (1=Unemployed; 2=Student; 3=Pensioner; 4=Grant; 5=Govt. Dept.; 6=Private Sector; 7=Minors)_2 | 0.278 |
| Social History (1=Smoking; 2=Drinking; 3=Hard Drugs; 4=Smoking & Drinking; 5=Smoking & Drugs; 6= Smoking &Drinking & Drugs; 7=None)_none | 0.238 |
| Income (1=Salary or Wages; 2.=Casual; 3=UIF; 4=SG; 5=No income; 6=Self employed)_6 | 0.066 |
| Income (1=Salary or Wages; 2.=Casual; 3=UIF; 4=SG; 5=No income; 6=Self employed)_2 | 0.006 |
Table 2.
Comparison of Treatment outcomes with other published studies.
| Study | Setting / Methods | Key findings | Comparison with the current study |
|---|---|---|---|
| Alene et al. [8] | Ethiopia, spatial analysis of MDR-TB | MDR-TB clustered in border regions; poverty & migration key drivers | Supports our finding that socio-economic vulnerability drives poor TB outcomes |
| Balogun et al. [9] | Nigeria, machine learning analysis | Age, education, HIV status, and comorbidity predicted outcomes | Consistent with our results showing older age & comorbidities worsen prognosis |
| Daneshi et al. [4] | Iran, retrospective analysis | Retreatment ↑ MDR-TB risk; diabetes & HIV worsen outcomes | Aligns with our comorbidity findings; DR-TB is the strongest predictor of poor outcome |
| Lei et al. [3] | Global Geotree model of TB incidence | Socioeconomic development, GDP, education, and urbanization have been shown to reduce TB incidence. | Echoes our finding that income stability protects against poor outcomes |
| Nagarajan et al. [7] | India, qualitative study | DR-TB patients face psycho-social barriers: stigma, hopelessness, pill burden, poor support | Adds qualitative depth to our findings on socio-economic and psychosocial vulnerability |
Table 3.
Logistic regression—Test set classification report.
| Class | precision | Recall | f1-score | Support |
|---|---|---|---|---|
| 0 | 0.333 | 0.182 | 0.235 | 11.000 |
| 1 | 0.899 | 0.952 | 0.925 | 84.000 |
| Accuracy | 0.863 | 0.863 | 0.863 | 0.863 |
| macro avg | 0.616 | 0.567 | 0.580 | 95.000 |
| weighted avg | 0.833 | 0.863 | 0.845 | 95.000 |
Table 4.
Decision Tree—Test set classification report.
| Class | precision | Recall | f1-score | support |
|---|---|---|---|---|
| 0 | 0.156 | 0.455 | 0.233 | 11.000 |
| 1 | 0.905 | 0.679 | 0.776 | 84.000 |
| Accuracy | 0.653 | 0.653 | 0.653 | 0.653 |
| macro avg | 0.531 | 0.567 | 0.504 | 95.000 |
| weighted avg | 0.818 | 0.653 | 0.713 | 95.000 |
Table 5.
Decision Tree—Feature Importances.
| Feature | Importance |
| Type of TB (1=DR, 2= DS)_2.0 | 0.391 |
| Age | 0.361 |
| Income (1=Salary or Wages; 2.=Casual; 3=UIF; 4=SG; 5=No income; 6=Self employed)_5 | 0.193 |
| any_comorbidity | 0.055 |
| Social History (1=Smoking; 2=Drinking; 3=Hard Drugs; 4=Smoking & Drinking; 5=Smoking & Drugs; 6= Smoking &Drinking & Drugs; 7=None)_6 | 0.000 |
| Patient category (1=New; 2=Relapse; 3=Tal; 4=TF1; 5=TF2_5 | 0.000 |
| Patient category (1=New; 2=Relapse; 3=Tal; 4=TF1; 5=TF2_4 | 0.000 |
| Patient category (1=New; 2=Relapse; 3=Tal; 4=TF1; 5=TF2_3 | 0.000 |
| Patient category (1=New; 2=Relapse; 3=Tal; 4=TF1; 5=TF2_2 | 0.000 |
| Patient category (1=New; 2=Relapse; 3=Tal; 4=TF1; 5=TF2_1900-01-02 00:00:00 | 0.000 |
| Patient category (1=New; 2=Relapse; 3=Tal; 4=TF1; 5=TF2_1900-01-01 00:00:00 | 0.000 |
| Previous drug history (1=New; 2=PT1; 3=PT2; 4=UNK)_4 | 0.000 |
| Previous drug history (1=New; 2=PT1; 3=PT2; 4=UNK)_3 | 0.000 |
| Previous drug history (1=New; 2=PT1; 3=PT2; 4=UNK)_2 | 0.000 |
| Social History (1=Smoking; 2=Drinking; 3=Hard Drugs; 4=Smoking & Drinking; 5=Smoking & Drugs; 6= Smoking &Drinking & Drugs; 7=None)_none | 0.000 |
| Social History (1=Smoking; 2=Drinking; 3=Hard Drugs; 4=Smoking & Drinking; 5=Smoking & Drugs; 6= Smoking &Drinking & Drugs; 7=None)_7 | 0.000 |
| Social History (1=Smoking; 2=Drinking; 3=Hard Drugs; 4=Smoking & Drinking; 5=Smoking & Drugs; 6= Smoking &Drinking & Drugs; 7=None)_4 | 0.000 |
| Social History (1=Smoking; 2=Drinking; 3=Hard Drugs; 4=Smoking & Drinking; 5=Smoking & Drugs; 6= Smoking &Drinking & Drugs; 7=None)_5 | 0.000 |
| Social History (1=Smoking; 2=Drinking; 3=Hard Drugs; 4=Smoking & Drinking; 5=Smoking & Drugs; 6= Smoking &Drinking & Drugs; 7=None)_3 | 0.000 |
| Social History (1=Smoking; 2=Drinking; 3=Hard Drugs; 4=Smoking & Drinking; 5=Smoking & Drugs; 6= Smoking &Drinking & Drugs; 7=None)_2 | 0.000 |
| Occupation (1=Unemployed; 2=Student; 3=Pensioner; 4=Grant; 5=Govt. Dept.; 6=Private Sector; 7=Minors)_6 | 0.000 |
| Occupation (1=Unemployed; 2=Student; 3=Pensioner; 4=Grant; 5=Govt. Dept.; 6=Private Sector; 7=Minors)_5 | 0.000 |
| Occupation (1=Unemployed; 2=Student; 3=Pensioner; 4=Grant; 5=Govt. Dept.; 6=Private Sector; 7=Minors)_4 | 0.000 |
| Occupation (1=Unemployed; 2=Student; 3=Pensioner; 4=Grant; 5=Govt. Dept.; 6=Private Sector; 7=Minors)_3 | 0.000 |
| Occupation (1=Unemployed; 2=Student; 3=Pensioner; 4=Grant; 5=Govt. Dept.; 6=Private Sector; 7=Minors)_2 | 0.000 |
| Income (1=Salary or Wages; 2.=Casual; 3=UIF; 4=SG; 5=No income; 6=Self employed)_6 | 0.000 |
| Income (1=Salary or Wages; 2.=Casual; 3=UIF; 4=SG; 5=No income; 6=Self employed)_4 | 0.000 |
| Income (1=Salary or Wages; 2.=Casual; 3=UIF; 4=SG; 5=No income; 6=Self employed)_2 | 0.000 |
| Gender (M=1/ F= 2)_nan | 0.000 |
| Gender (M=1/ F= 2)_2.0 | 0.000 |
| HIV status {1=Positive, 2=Negative}_2 | 0.000 |
Disclaimer/Publisher’s Note: The statements, opinions and data contained in all publications are solely those of the individual author(s) and contributor(s) and not of MDPI and/or the editor(s). MDPI and/or the editor(s) disclaim responsibility for any injury to people or property resulting from any ideas, methods, instructions or products referred to in the content. |
© 2025 by the authors. Licensee MDPI, Basel, Switzerland. This article is an open access article distributed under the terms and conditions of the Creative Commons Attribution (CC BY) license.
Copyright: This open access article is published under a Creative Commons CC BY 4.0 license, which permit the free download, distribution, and reuse, provided that the author and preprint are cited in any reuse.


