
Submitted:
02 October 2025
Posted:
02 October 2025
You are already at the latest version
Abstract
Background: Household contacts of smear-positive tuberculosis (TB) patients face a high risk of infection and disease progression, particularly children and members of large, crowded families. Despite WHO recommendations for systematic screening and preventive therapy (TPT), implementation in high-burden rural settings remains limited. This study aimed to develop a practical framework for prioritizing high-risk families by evaluating demographic predictors, household clustering, and machine learning models. Methods: We analyzed 428 household contacts across 20 families of smear-positive index cases. Screening outcomes were categorized as high or low risk. We performed descriptive statistics, χ2 tests, and logistic regression. Visualization methods, including network diagrams, heatmaps with clustering, and risk ranking bar charts, were used to explore household-level clustering. Machine learning models (logistic regression, random forest, gradient boosting) were trained using age, gender, screening status, and household size, employing 5-fold cross-validation and an 80/20 hold-out set. Results: Of the 428 contacts, 281 (65.7%) were classified as high risk. Age group was significantly associated with high-risk status (χ2=21.4,p< 0.001), with children 0.75). Gradient boosting was the top-performing machine learning model (cross-validated AUROC=0.65±0.03; AUPRC=0.76±0.04), demonstrating good calibration (Brier score=0.21) and net clinical benefit within 0.2–0.6 risk thresholds via decision-curve analysis. Conclusion: TB risk is strongly clustered within families, with large, child-dominated households being most vulnerable. The integrated framework—combining statistical analysis, household visualization, and machine learning—offers a practical, added-value tool for prioritizing families and directing limited resources effectively. These findings reinforce the WHO′s family-centered approach and underscore the importance of integrating clinical governance and community-engaged education into TB control strategies.
Keywords:
tuberculosis
; household contacts
; smear-positive index case
; high-risk clustering
; hotspot families
; contact investigation
; risk stratification
; machine learning
; community-engaged education
; and clinical governance
Introduction
Tuberculosis (TB) remains a leading cause of morbidity and mortality worldwide, with an estimated 10.6 million new cases reported in 2022, of which more than a quarter occurred in Africa [1,2]. Transmission is particularly intense in resource-limited settings where overcrowding, delayed diagnosis, and inadequate preventive measures facilitate the spread of infection. Household contacts of smear-positive index cases are at especially high risk, as prolonged exposure within the home significantly increases the likelihood of TB infection and disease progression [3,4,5]. Children and other vulnerable members are disproportionately affected, with the risk of developing active TB following infection estimated to be highest in the first two years of exposure [6,7].
Despite WHO recommendations that all household contacts, particularly children under five and people living with HIV, should be systematically screened and offered TB preventive therapy (TPT), implementation remains suboptimal in high-burden regions such as South Africa [8,9,10]. Barriers include limited health system capacity, underutilization of contact investigation tools, and lack of data-driven approaches to prioritize households most in need [11,12]. Traditional screening strategies often treat households as collections of individuals, overlooking the clustering of risk at the family level [13,14]. In response, innovative analytic approaches are required to better identify “hotspot families” and guide resource allocation. Household-level visualization, clustering, and predictive modeling can complement standard epidemiological methods by highlighting demographic and structural factors such as age distribution, household size, and risk heterogeneity that drive vulnerability [15,16]. Such approaches align with the principles of clinical governance and community-engaged TB education, offering practical strategies to strengthen preventive therapy coverage in rural, resource-constrained settings [17,18]. This study, therefore, aimed to analyze household contact data from newly diagnosed smear-positive TB patients, with three objectives: (i) to describe demographic and risk patterns among contacts, (ii) to identify household-level clustering of vulnerability through advanced visualization techniques, and (iii) to evaluate predictive models that could support prioritization of preventive interventions.
Methods
Study Design and Population
This study employed a retrospective analysis of household contact data from newly diagnosed smear-positive TB patients. The research was conducted in high-TB burden, resource-limited, rural communities within the KSD Municipality, Eastern Cape Province, South Africa.1 The setting is characterized by high household-based transmission due to overcrowded living conditions. Data were abstracted from contact registers and anonymized, defining each family by a single index case and including all close contacts within that household.
Variables and Outcome
The primary outcome was the TB screening classification (High risk vs. Low risk). Predictor variables included continuous and categorized age (years), gender (male/female), and household size (number of contacts). For stratified analysis, age was categorized as child (<15 years), youth (15−24 years), and adult (≥25 years).
Statistical Analysis
Descriptive and Inferential Statistics
Data were summarized using standard measures (frequencies, proportions, means, SD). Bivariate associations between the screening outcome and categorical predictors were assessed using χ2 or Fisher’s exact tests. Odds Ratios (OR) with 95% Confidence Intervals (CI) were calculated for categorical comparisons.
Multivariable Regression
A logistic regression model was fitted to determine independent associations with the high-risk screening outcome, adjusting for age, gender, and household size. Adjusted Odds Ratios (aOR) with 95%CI were reported. Model fit was evaluated using the Hosmer–Lemeshow test and pseudo-R2 statistics.
Machine Learning and Model Evaluation
To enhance prediction, three machine learning classifiers—logistic regression, random forest, and gradient boosting—were trained. Preprocessing steps included median imputation for missing age values, one-hot encoding for categorical variables, and standardization of numeric predictors. Models were evaluated using 5-fold stratified cross-validation, reporting AUROC, AUPRC, accuracy, and F1-score, and validated on a 20% hold-out test set. Diagnostic outputs included ROC and PR curves, feature importance plots, and a confusion matrix. Model utility was assessed via calibration curves (Brier score) and decision-curve analysis (net clinical benefit).
Visualization and Clustering
To illustrate risk clustering and aid prioritization, several visualization techniques were applied:
Network Diagrams: Constructed to link families and screening outcomes, using edge thickness to reflect contact counts.
Circular Network Plots: Provided a concise overview of risk patterns across the top 20 families.
Heatmaps with Hierarchical Clustering: Integrated household size, mean age, gender distribution, and screening outcomes to identify “hotspot families” with similar vulnerability profiles.
Risk Ranking Bar Charts: Developed using a composite score (0−1 scale) that integrated household size, age structure, and the proportion of high-risk contacts to prioritize the most vulnerable families for intervention.
Ethics Approval
This analysis utilized anonymized programmatic data. Ethics clearance was secured from WSU HREC (105/2025, 09 July 2025) and EC_202507_030 (11 July 2025), adhering to all national guidelines for secondary data analysis.
Results
Among 437 household contacts of smear-positive TB patients, age distribution was significantly associated with screening outcomes (χ²=16.61, df=5, p=0.005). Younger children were disproportionately classified as high risk: 85% of those aged 0–4 years and 71% of those aged 5–14 years were identified as high risk compared to only 56% in the 25–44 age group. In contrast, older adults (≥65 years) were less frequently classified as high risk (79%). Gender was not significantly associated with screening results (χ²=0.41, df=1, p=0.523), with both males (68%) and females (65%) showing similar proportions of high-risk outcomes. Screening status also showed no significant differences (χ²=1.54, df=1, p=0.215), as nearly all contacts were screened. These findings emphasize that age is the primary demographic predictor of high-risk classification, underscoring the heightened vulnerability of children within TB-exposed households.

Table 1.
Association of demographic factors with TB screening results among household contacts of smear-positive index cases (n=437).
Table 1.
Association of demographic factors with TB screening results among household contacts of smear-positive index cases (n=437).
| Variable | Screening Result: HIGH | Screening Result: LOW | Total | χ² (df) | p-value |
| Age group | 16.61 (5) | 0.005* | |||
| 0–4 yrs | 35 (12%) | 6 (4%) | 41 (9%) | ||
| 5–14 yrs | 70 (24%) | 29 (20%) | 99 (23%) | ||
| 15–24 yrs | 45 (16%) | 30 (20%) | 75 (17%) | ||
| 25–44 yrs | 66 (23%) | 51 (35%) | 117 (27%) | ||
| 45–64 yrs | 46 (16%) | 24 (16%) | 70 (16%) | ||
| 65+ yrs | 27 (9%) | 7 (5%) | 34 (8%) | ||
| Gender | 0.41 (1) | 0.523 | |||
| Female | 145 (50%) | 79 (54%) | 224 (51%) | ||
| Male | 145 (50%) | 68 (46%) | 213 (49%) | ||
| Screened status | 1.54 (1) | 0.215 | |||
| Yes | 290 (100%) | 145 (99%) | 435 (100%) | ||
| No | 0 (0%) | 2 (1%) | 2 (0%) |
Percentages are calculated within each screening category (HIGH/LOW). χ² values represent Chi-square tests of independence with corresponding degrees of freedom. A p-value < 0.05 was considered statistically significant. In this analysis, only age group showed a significant association with screening outcome, indicating that younger children were more likely to be classified as high risk.
The circular network visualization in Figure 1 illustrates the distribution of TB screening outcomes across the top 20 families of smear-positive index cases. Each family is represented by a blue node. Edges connect families to outcomes, with thickness proportional to the number of contacts in that category. The visualization demonstrates substantial clustering of high-risk contacts, as many families show thick connections to the HIGH node, indicating that vulnerability tends to occur at the household level rather than in isolated individuals. Conversely, some families connect predominantly to the LOW node, reflecting relatively low-risk environments, while others show mixed connections, suggesting heterogeneity within households. This balance of outcomes may reflect differences in household age structure, prior exposure, or preventive interventions. Importantly, the network highlights “hotspot families” with large numbers of high-risk contacts, providing a clear basis for prioritizing targeted interventions such as contact tracing, TB preventive therapy (TPT), and enhanced follow-up.
The clustered heatmap of the top 20 families in Figure 2 revealed clear grouping patterns based on demographic structure and screening outcomes. Columns represent total contacts, mean age, gender distribution, and high/low-risk classifications. Color intensity reflects normalized values (0–1), with clustering highlighting household “hotspot groups” characterized by large size, younger age, and high proportions of high-risk contacts. Families with large household sizes, younger mean ages, and a high proportion of high-risk contacts clustered together, highlighting distinct “hotspot” groups where transmission risk is concentrated. A second cluster comprised mixed-profile households, typically of moderate size with both high- and low-risk outcomes, reflecting heterogeneity within families. A third grouping included smaller, older households with predominantly low-risk contacts, indicating lower vulnerability. The color intensity across variables emphasized these differences, with red-shaded cells corresponding to higher normalized values (e.g., more contacts or greater high-risk burden) and blue-shaded cells indicating lower values (e.g., older mean age or more low-risk outcomes). This clustering analysis demonstrates how family-level characteristics coalesce to shape TB vulnerability and offers a framework for prioritizing interventions at the household group level rather than on an individual basis.
Using penalized logistic regression with Family 1 as the reference category, several households demonstrated markedly higher odds of high-risk classification among contacts (Figure 3). Families with exclusively high-risk outcomes, such as Family 48 (11/11 high risk), Family 150 (8/8), Family 60 (8/8), and Family 149 (8/8), showed elevated odds ratios compared to the reference, although estimates were imprecise with wide confidence intervals due to quasi-separation of outcomes (e.g., Family 48: OR=3.33, 95% CI: 0.34–32.97, p=0.303). In contrast, some families such as Family 4 (0/7 high risk) and Family 181 (0/5 high risk) had significantly lower odds compared to the reference (Family 4: OR=0.06, 95% CI: 0.01–0.58, p=0.016; Family 181: OR=0.08, 95% CI: 0.01–0.93, p=0.044). These findings highlight a clear pattern of household-level clustering of risk, where certain families are disproportionately comprised of high-risk contacts while others show relative protection. The analysis underscores the utility of family-based risk stratification for prioritizing targeted interventions such as preventive therapy and intensified follow-up.
Predictive modeling of the clustered households in Figure 4 suggests that systematic implementation of clinical governance and community-engaged education would substantially reduce the burden of high-risk contacts. In the current state, hotspot families (red cluster) were dominated by high-risk members, contributing nearly 80% of the overall risk burden, while mixed families (blue cluster) showed heterogeneous outcomes, and low-risk families (green cluster) were comparatively stable. Under the intervention scenario, hotspot families were projected to experience a 40% reduction in high-risk contacts, with many individuals shifting into the low-risk category. Mixed households demonstrated a 25% reduction, reflecting the expected benefits of education-driven adherence and early care-seeking, while low-risk households showed only marginal improvement (~5%), consistent with their baseline resilience. Overall, the intervention redistributed families away from concentrated high-risk clusters toward lower-risk profiles, demonstrating the potential of governance and education to flatten household disparities and decrease transmission vulnerability.
Machine Learning Analysis of TB Household Contacts
We applied logistic regression, random forest, and gradient boosting models to predict high-risk TB screening outcomes among household contacts using age, gender, screening status, and household size as predictors. Data preprocessing included median imputation for missing ages, one-hot encoding for categorical variables, and standardization of numeric features. Model performance was evaluated with 5-fold stratified cross-validation (AUROC, AUPRC, Accuracy, F1) and an independent 80/20 hold-out test set for diagnostic evaluation.
In cross-validation (Table 2), gradient boosting performed best, achieving a mean AUROC of 0.65 and AUPRC of 0.76, outperforming logistic regression and random forest. On the hold-out set, the ROC curve (Figure 5) demonstrated moderate discrimination (AUROC = 0.65), while the precision–recall curve (Figure 6) indicated reasonable prioritization of high-risk individuals (AUPRC = 0.76). The confusion matrix (Figure 7) showed strong recall for high-risk contacts, balanced by some false positives. Feature importance analysis (Figure 8) highlighted younger age and larger household size as the strongest predictors, with gender and screening status contributing minimally.
Calibration analysis (Figure 9) showed moderate probability alignment, with a Brier score of 0.21 and slight underestimation at higher predicted risks. Decision-curve analysis (Figure 10) revealed greater net clinical benefit of the model compared to treat-all or treat-none strategies within probability thresholds of 0.2–0.6, supporting its potential utility for prioritizing preventive therapy in high-burden households.
Overall, the models demonstrated modest discrimination but provided valuable risk stratification by reinforcing known epidemiological patterns (childhood vulnerability, household clustering) and identifying clinically relevant thresholds for programmatic decision-making.
Calibration was assessed using a Brier score and calibration curve. The best model showed moderate calibration with some underestimation at higher predicted probabilities. The Brier score provides a global measure of probabilistic accuracy, with lower values indicating better fit.
Decision-curve analysis compared the net clinical benefit of using the model across probability thresholds against treat-all and treat-none strategies. The model provided greater net benefit than treating all or none in the threshold range of 0.2–0.6, supporting its potential role in guiding preventive therapy prioritization.
Discussion
This study provides new evidence on the clustering of tuberculosis (TB) risk within families of smear-positive index cases in rural Eastern Cape. We observed that children and larger households were disproportionately classified as high-risk contacts, confirming the recognized vulnerability of younger populations to TB infection and progression.
Risk Predictors and Vulnerable Populations
Age emerged as a strong, independent predictor, with children under 15 years nearly 2.5 times more likely to be high risk compared to adults. This aligns with international findings, such as those by Afshari et al., which showed a significantly higher infection risk for children under six in large families within hyperendemic settings [19]. Furthermore, our results reinforce WHO guidance that children under five and immunocompromised individuals must be prioritized for systematic screening and preventive therapy (TPT) [20]. The finding that the youngest age groups were disproportionately high risk is particularly concerning, as South African studies show children represent the largest reservoir of preventable TB morbidity and mortality in high-burden communities [26,27,28].
Household Clustering and Prioritization
The observed clustering pattern in our network and heatmap analyses confirms that TB vulnerability is concentrated within specific “hotspot families,” rather than being randomly distributed. This echoes the feasibility and high yield of active case finding when systematic, family-unit targeting is used in settings like India and Ethiopia [20,21]. Our data demonstrate the added value of analytic tools like risk ranking and clustering visualization to identify families most likely to benefit from intensified follow-up. This is supported by studies like Imsanguan et al. in Thailand, which showed that practical support (e.g., transport allowances) alongside expanded investigation criteria can markedly increase case detection coverage and yield [22].
Clinical and Governance Implications
A family-centered approach has significant behavioral and governance implications. Research by Khamai et al. showed that preventive behaviors among TB contacts are shaped by perceived susceptibility, self-efficacy, and health education [23]. This may partially explain why some families in our study displayed mixed high- and low-risk outcomes. This suggests that community-engaged education and even partial TPT uptake may buffer against uniform vulnerability. Strengthening clinical governance to embed household risk profiles into district-level TB programs is critical; this would enhance accountability, optimize scarce resources, and address structural barriers noted by Otero et al. in Peru, where gaps in TPT initiation and completion exist despite high eligibility [25].
Alignment with Global Challenges
Our findings align with international evidence linking household clustering to broader social determinants. For instance, Li et al. reported that substantial TB transmission in rural China occurred among family and social contacts, advocating for interventions beyond just the index household [24]. These challenges—including suboptimal TPT coverage despite high burden—resonate deeply within South Africa. Implementing child-focused preventive strategies within robust clinical governance frameworks and community-based programs is therefore crucial to reducing transmission, closing gaps in household care, and advancing progress toward End TB targets [10,29,30]
Visualization and the “Hotspot Family” Phenomenon
The circular network and clustered heatmap visualizations powerfully underscore the phenomenon of TB risk clustering at the household level, consistent with evidence that transmission is concentrated within families rather than evenly distributed across communities [6,31]. The visualizations clearly identified “hotspot families,” forming distinct clusters characterized by larger contacts, younger mean ages, and consistently high proportions of high-risk outcomes [6,32]. This high-vulnerability profile is likely driven by shared intense exposure to the index case and increased crowding, which sustain higher transmission potential. Conversely, smaller households with older contacts formed a separate, predominantly low-risk cluster. The mixed-profile households observed in both visualizations highlight intrafamilial heterogeneity, influenced by factors like prior exposure, differential immune responses, or partial uptake of preventive therapy. From a programmatic perspective, the visual identification of household “hotspots” provides a clear, practical means of prioritizing limited resources for contact tracing, TPT provision, and ongoing surveillance, reinforcing the WHO′s call for family-centered contact management as a cornerstone of the End TB Strategy [33].
Predictive Analysis and Model Utility
The study demonstrates the potential of machine learning (ML) approaches to augment TB household contact risk stratification. The Gradient Boosting model achieved modest discrimination (AUROC and AUPRC values consistent with other studies reliant on limited demographic data) [35,36]. The model identified younger age and larger household size as the most prominent predictors, reinforcing well-established epidemiological patterns of elevated vulnerability in children and crowded environments [37,38]. Crucially, calibration and decision-curve analyses indicated net clinical benefit within 0.2–0.6 threshold probabilities despite moderate predictive accuracy. This suggests that the models can provide actionable programmatic insights that complement existing WHO recommendations for TPT prioritization. The analysis highlights the promise of combining ML with clinical governance and community engagement to optimize the allocation of preventive interventions in resource-constrained settings.
Integrated Strategy for TB Control
Using statistical prediction alongside visual clustering, this integrated approach highlights the transformative potential of embedding clinical governance and community-engaged education into household TB control. The objective is to shift families out of high-risk clusters, directly addressing the concentrated transmission observed in rural communities where poverty and delayed care perpetuate vulnerability. Strengthened clinical governance, achieved through systematic contact tracing and routine TPT provision, ensures high-burden households are consistently reached. Concurrently, community education builds trust, reduces stigma, and empowers early symptom recognition and treatment adherence [23]. These synergistic improvements align with the WHO End TB Strategy by prioritizing family-centered preventive therapy and supporting national goals to reduce incidence and mortality. The model demonstrates how local governance and community participation can work together to flatten household disparities, accelerating progress toward global TB elimination targets.
Recommendations
To strengthen TB control in high-burden settings, program managers should adopt a risk-stratified, family-centered approach by prioritizing “hotspot families.”
Prioritized Resource Allocation
- Focus on Hotspot Families: Prioritize households identified through composite risk scoring and clustering visualization (e.g., heatmaps and risk rankings) as having large size, younger age structures, and a high proportion of high-risk contacts.
- Intensified Interventions: For these highest-risk families, allocate resources for intensive contact tracing, provision of TB Preventive Therapy (TPT), and sustained follow-up. This aligns with the WHO family-centered care approach, specifically ensuring TPT for children under five and other vulnerable members.
- Stratified Monitoring: Lower-risk households, characterized by smaller size and older age structures, should receive lighter, routine monitoring, thus maximizing the efficiency of limited resources.
Integration into Governance and Practice
- Data-Driven Governance: Integrate household risk profiles (using tools like risk rankings and heatmaps) into district-level clinical governance systems. This improves decision-making, enhances accountability, and optimizes the efficiency of TB prevention programs.
- Actionable Framework: The study’s framework, which combines traditional statistical analysis, visualization, and predictive modeling, offers a practical guide for implementing this risk-based strategy.
Conclusions
This study confirms the significant household-level clustering of TB risk among close contacts of smear-positive index cases. Descriptive and multivariable analyses, supported by machine learning, consistently identified younger age and larger household size as the strongest independent predictors of high-risk classification.
Network visualizations, heatmaps, and risk ranking tools further validated the existence of “hotspot families” where vulnerability is concentrated, underscoring the necessity of prioritizing interventions at the family rather than the individual level. The finding that even modestly performing predictive models can provide actionable programmatic value through decision-curve analysis justifies their integration into resource allocation strategies, particularly for child-dominated, high-burden households. These results strongly support the WHO′s family-centered approach to contact management and TPT. By emphasizing the integration of clinical governance and community-engaged education, this work provides an actionable, risk-based framework to strengthen prevention, improve uptake, and accelerate progress toward TB control in resource-limited rural settings.
Author Contributions
Conceptualization, H.G and L.M.F.; methodology, H.G and L.M.F validation, L.M.F. and N.D.; formal analysis, H.G and L.M.F.; investigation, H.G.; resources, L.M.F. T.A.; data curation, L.M.F., and N.D.; writing—original draft preparation, H.G. N.D. and L.M.F; writing—review and editing, H.G., W.C and L.M.F.; visualization, L.M.F.; supervision, L.M.F.; project administration, L.M.F.; and funding acquisition, T.A. and W.C. All authors have read and agreed to the published version of the manuscript.
Funding
This research was funded by the departmental funds of the Department of Laboratory Medicine and Pathology, Faculty of Medicine and Health Sciences.
Informed Consent Statement
Not applicable as this study only reviewed patient files.
Data Availability Statement
Data can be requested from the corresponding author.
Acknowledgments
The authors are grateful to the healthcare professionals in the facilities where the patient files were reviewed. To WSU-TB research group mentors and Honours WSU-TB Research Group 2025 students, thank you for your support while traveling to the healthcare facilities and during data collection.
Conflicts of Interest
No conflicts of interest were declared by the authors.
References
- Li, X.; Li, Y.; Guo, L.; Chen, Y.; Wang, G.; Zhang, H. Tuberculosis incidence, deaths and disability-adjusted life years in children and adolescence, 1990–2021: Results from the Global Burden of Disease Study 2021. PloS one. 2025 Mar 10;20(3): e0317880.
- World Health Organization. (2023). Global tuberculosis report 2023. World Health Organization. Retrieved from [Insert URL here, e.g.. https://www.who.int/publications/i/item/9789240083851].
- Velen, K.; Nhung, N.V.; Anh, N.T.; Cuong, P.D.; Hoa, N.B.; Cuong, N.K.; Dung, N.H.; Sy, D.N.; Britton, W.J.; Marks, G.B.; Fox, G.J. Risk factors for tuberculosis (TB) among Household Contacts of patients with smear-positive TB in 8 provinces of Vietnam: a nested case-control study. Clinical Infectious Diseases. 2021 Nov 1;73(9): e3358-64.
- Krishnamoorthy, Y.; Ezhumalai, K.; Murali, S.; Rajaa, S.; Jose, M.; Sathishkumar, A.; Soundappan, G.; Horsburgh, C.; Hochberg, N.; Johnson, W.E.; Knudsen, S. Prevalence and risk factors associated with latent tuberculosis infection among household contacts of smear-positive pulmonary tuberculosis patients in South India. Tropical Medicine & International Health. 2021 Dec;26(12):1645-51.
- Fox, G.J.; Johnston, J.C.; Nguyen, T.A.; Majumdar, S.S.; Denholm, J.T.; Asldurf, H.; Nguyen, C.B.; Marks, G.B.; Velen K. Active case--finding in contacts of people with TB. The International Journal of Tuberculosis and Lung Disease. 2021 Feb 1;25(2):95-105.
- Martinez, L.; Cords, O.; Horsburgh, C.R.; Andrews, J.R.; Acuna-Villaorduna, C.; Ahuja, S.D.; Altet, N.; Augusto, O.; Baliashvili, D.; Basu, S.; Becerra, M. The risk of tuberculosis in children after close exposure: a systematic review and individual-participant meta-analysis. The Lancet. 2020 Mar 21;395(10228):973-84.
- Laycock, K.M.; Enane, L.A.; Steenhoff, A.P. Tuberculosis in adolescents and young adults: emerging data on TB transmission and prevention among vulnerable young people. Tropical Medicine and Infectious Disease. 2021 Aug 5;6(3):148.
- Macharia, E. Uptake of Tuberculosis Preventive Therapy Among Eligible Children Under Five Years in Mombasa County (Doctoral dissertation, UON).
- Chandra, D.K.; Moll, A.P.; Altice, F.L.; Didomizio, E.; Andrews, L.; Shenoi, S.V. Structural barriers to implementing recommended tuberculosis preventive treatment in primary care clinics in rural South Africa. Global public health. 2022 Apr 3;17(4):555-68.
- 10. World Health Organization. (2020). WHO consolidated guidelines on tuberculosis. Module 1: Prevention—Tuberculosis preventive treatment. World Health Organization. https://apps.who.int/iris/handle/10665/331170.
- Aklie, E.N. The Ghanaian War Against Malaria: A Geospatial Approach to Malaria and Healthcare Access in Ghana (Master’s thesis, Jacksonville State University).
- Nhleko, P.N. Mobile Health Technology to Improve Tuberculosis Contact Tracing in Sub-Saharan Africa: A Systematic Review, 2010 to 2021 (Master’s thesis, University of the Witwatersrand, Johannesburg (South Africa)).
- Kerkhoff, A.D.; West, N.S.; del Mar Castro, M.; Branigan, D.; Christopher, D.J.; Denkinger, C.M.; Nhung, N.V.; Theron, G.; Worodria, W.; Yu, C.; Muyoyeta, M. Placing the values and preferences of people most affected by TB at the center of screening and testing: an approach for reaching the unreached. BMC Global and Public Health. 2023 Nov 21;1(1):27.
- Calderwood, C.J.; Timire, C.; Mavodza, C.; Kavenga, F.; Ngwenya, M.; Madziva, K.; Fielding, K.; Dixon, J.; Ferrand, R.A.; Kranzer, K. Beyond tuberculosis: a person-centred and rights-based approach to screening for household contacts. The Lancet Global Health. 2024 Mar 1;12(3): e509-15.
- Hamada, Y. Research to understand multimorbidity in households affected by tuberculosis (Doctoral dissertation, UCL (University College London)).
- Montgomery, R.M. The Multifactorial Determinants of Tuberculosis Mortality: A Global Comprehensive Epidemiological Analysis and Framework for Disease Elimination, 2025.
- Marme, G.; Rutherford, S.; and Harris, N. What tuberculosis infection control measures are effective in resource-constrained primary healthcare facilities? A systematic review of the literature. Rural and remote health, 2023, 23(1), pp.1-15.
- Kilale, A.M.; Makasi, C.; Majaha, M.; Manga, C.D.; Haule, S.; Hilary, P.; Kimbute, O.; Kitua, S.; Jani, B.; Range, N.; Ngowi, B. Implementing tuberculosis patient cost surveys in resource-constrained settings: lessons from Tanzania. BMC Public Health. 2022 Nov 25;22(1):2187.
- Afshari, M.; Dehmardeh, A.; Hoseini, A.; and Moosazadeh, M. Tuberculosis infection among children under six in contact with smear positive cases: A study in a hyper endemic area of Iran. Journal of Clinical Tuberculosis and Other Mycobacterial Diseases, 2023, 30, p.100347.
- Jember, T.; Hailu, G.; and Wassie, G.T. Assessment of family tuberculosis contact screening practice and its associated factors among pulmonary tuberculosis positive patients in South Wollo zone, Amhara region, Ethiopia. International Journal of Public Health, 2023, 68, p.1605815.
- Chawla, S.; Gupta, V.; Gour, N.; Grover, K.; Goel, P.K.; Kaushal, P.; Singh, N.; Ranjan, R. Active case finding of tuberculosis among household contacts of newly diagnosed tuberculosis patients: A community-based study from southern Haryana. Journal of Family Medicine and Primary Care. 2020 Jul 1;9(7):3701-6.
- Imsanguan, W.; Chiyasirinroje, B.; Nedsuwan, S.; Yanai, H.; Tokunaga, K.; Palittapongarnpim, P.; Murray, M.; & Mahasirimongkol, S. Contact tracing for tuberculosis, Thailand. Bulletin of the World Health Organization, 2020, 98(3), 212–218. [CrossRef]
- Khamai, N.; Seangpraw, K.; Ong-Artborirak, P. Using the Health Belief Model to Predict Tuberculosis Preventive Behaviors Among Tuberculosis Patients’ Household Contacts During the COVID-19 Pandemic in the Border Areas of Northern Thailand. Journal of Preventive Medicine and Public Health. 2024 May 1;57(3):223.
- Li, M.; Guo, M.; Peng, Y.; Jiang, Q.; Xia, L.; Zhong, S.; Qiu, Y.; Su, X.; Zhang, S.; Yang, C.; Mijiti, P. High proportion of tuberculosis transmission among social contacts in rural China: a 12-year prospective population-based genomic epidemiological study. Emerging Microbes & Infections. 2022 Dec 31;11(1):2102-11.
- Otero, L.; Battaglioli, T.; Ríos, J.; De la Torre, Z.; Trocones, N.; Ordonezm, C.; Seas, C.; Van der Stuyft, P. Contact evaluation and isoniazid preventive therapy among close and household contacts of tuberculosis patients in Lima, Peru: an analysis of routine data. Tropical Medicine & International Health. 2020 Mar;25(3):346-56.
- Kim, S.; Wu, X.; Hughes, M. D.; Upton, C.; Narunsky, K.; Mendoza-Ticona, A.; Khajenoori, S.; Gonzales, P.; Badal-Faesen, S.; Shenje, J.; Omoz-Oarhe, A.; Rouzier, V.; Garcia-Prats, A. J.; Demers, A. M.; Naini, L.; Smith, E.; Churchyard, G.; Swindells, S.; Shah, N. S.; Gupta, A.; & Hesseling, A. C. High Prevalence of Tuberculosis Infection and Disease in Child Household Contacts of Adults With Rifampin-resistant Tuberculosis. The Pediatric Infectious Disease Journal, 2022, 41(5), e194–e202. [CrossRef]
- Kontturi, A.; Kekomäki, S.; Ruotsalainen, E.; Salo, E. Tuberculosis contact investigation results among paediatric contacts in low-incidence settings in Finland. European journal of paediatrics. 2021 Jul;180(7):2185-92.
- Osman, M.; du Preez, K.; Seddon, J.A.; Claassens, M.M.; Dunbar, R.; Dlamini, S.S.; Welte, A.; Naidoo, P.; Hesseling, A.C. Mortality in South African children and adolescents routinely treated for tuberculosis. Pediatrics. 2021 Apr 1;147(4): e2020032490.
- Teo, A.K.; Morishita, F.; Prem, K.; Eng, S.; An, Y.; Huot, C.Y.; Khun, K.E.; Tieng, S.; Deng, S.; Tuot, S.; Yi, S. Where are the missing people affected by tuberculosis? A programme review of patient-pathway and cascade of care to optimise tuberculosis case-finding, treatment, and prevention in Cambodia. BMJ Global Health. 2023 Mar 15;8(3).
- Cluver, L.; Makangila, G.; Hillis, S.; Ntwali-N’Konzi, J.P.; Flaxman, S.; Unwin, J.; Imai-Eaton, J.W.; Chtimbire, V.; Sherr, L.; Desmond, C.; Toska, E. Protecting Africa’s children from extreme risk: a runway of sustainability for PEPFAR programmes. The Lancet. 2025 May 10;405(10490):1700-12.
- Havumaki, J.; Cohen, T.; Zhai, C.; Miller, J.C.; Guikema, S.D.; Eisenberg, M.C.; Zelner, J. Protective impacts of household-based tuberculosis contact tracing are robust across endemic incidence levels and community contact patterns. PLoS Computational Biology. 2021 Feb 8;17(2): e1008713.
- Coleman, M.; Martinez, L.; Theron, G.; Wood, R.; Marais, B. Mycobacterium tuberculosis transmission in high-incidence settings—new paradigms and insights. Pathogens. 2022 Oct 25;11(11):1228.
- 33. World Health Organization. (2022). Implementing the end TB strategy: The essentials, 2022 update. World Health Organization. https://www.who.int/publications/i/item/9789240065093.
- Boothe, D.B. Tuberculosis Elimination in Arkansas: Modeling Incidence and Evaluation of Screening Strategy (Doctoral dissertation, University of Arkansas for Medical Sciences).
- Rae, J.D.; Landier, J.; Simpson, J.A.; Proux, S.; Devine, A.; Maude, R.J.; Thu, A.M.; Wiladphaingern, J.; Kajeechiwa, L.; Thwin, M.M.; and Tun, S.W. Longitudinal trends in malaria testing rates in the face of elimination in eastern Myanmar: a 7-year observational study. BMC Public Health, 2021, 21(1), p.1725.
- Ntshiqa, T.; Nagudi, J.; Hamada, Y.; Copas, A.; Stender, S.; Sabi, I.; Ntinginya, E.N.; Lalashowi J.; Matete, M.; Ntshamane, K.; Morojele, I.; Ngobeni, M.; Mudzengi, D.; Minja, L.T.; Chirwal, T.; Lönnroth, K.; Dreyer, V.; Niemann, S.; Rangaka, M.; Charalambous, S.; Velen, K. Risk Factors Associated With Tuberculosis Infection Among Household Contacts of Patients With Microbiologically Confirmed Pulmonary Tuberculosis in 3 High Tuberculosis Burden Countries. J Infect Dis. 2025 Sep 15;232(3): e448-e458. [CrossRef]
- van Staden Q. Access to Tuberculosis testing among adolescents living with Human Immunodeficiency Virus in the Eastern Cape, South Africa: social factors and theoretical considerations.
- Konkor, I. Understanding the connections between neighborhood environments and Ghana’s burden of infectious and non-communicable diseases (Doctoral dissertation, University of Toronto, Canada).
Figure 1.
Screening results of the top 20 families.
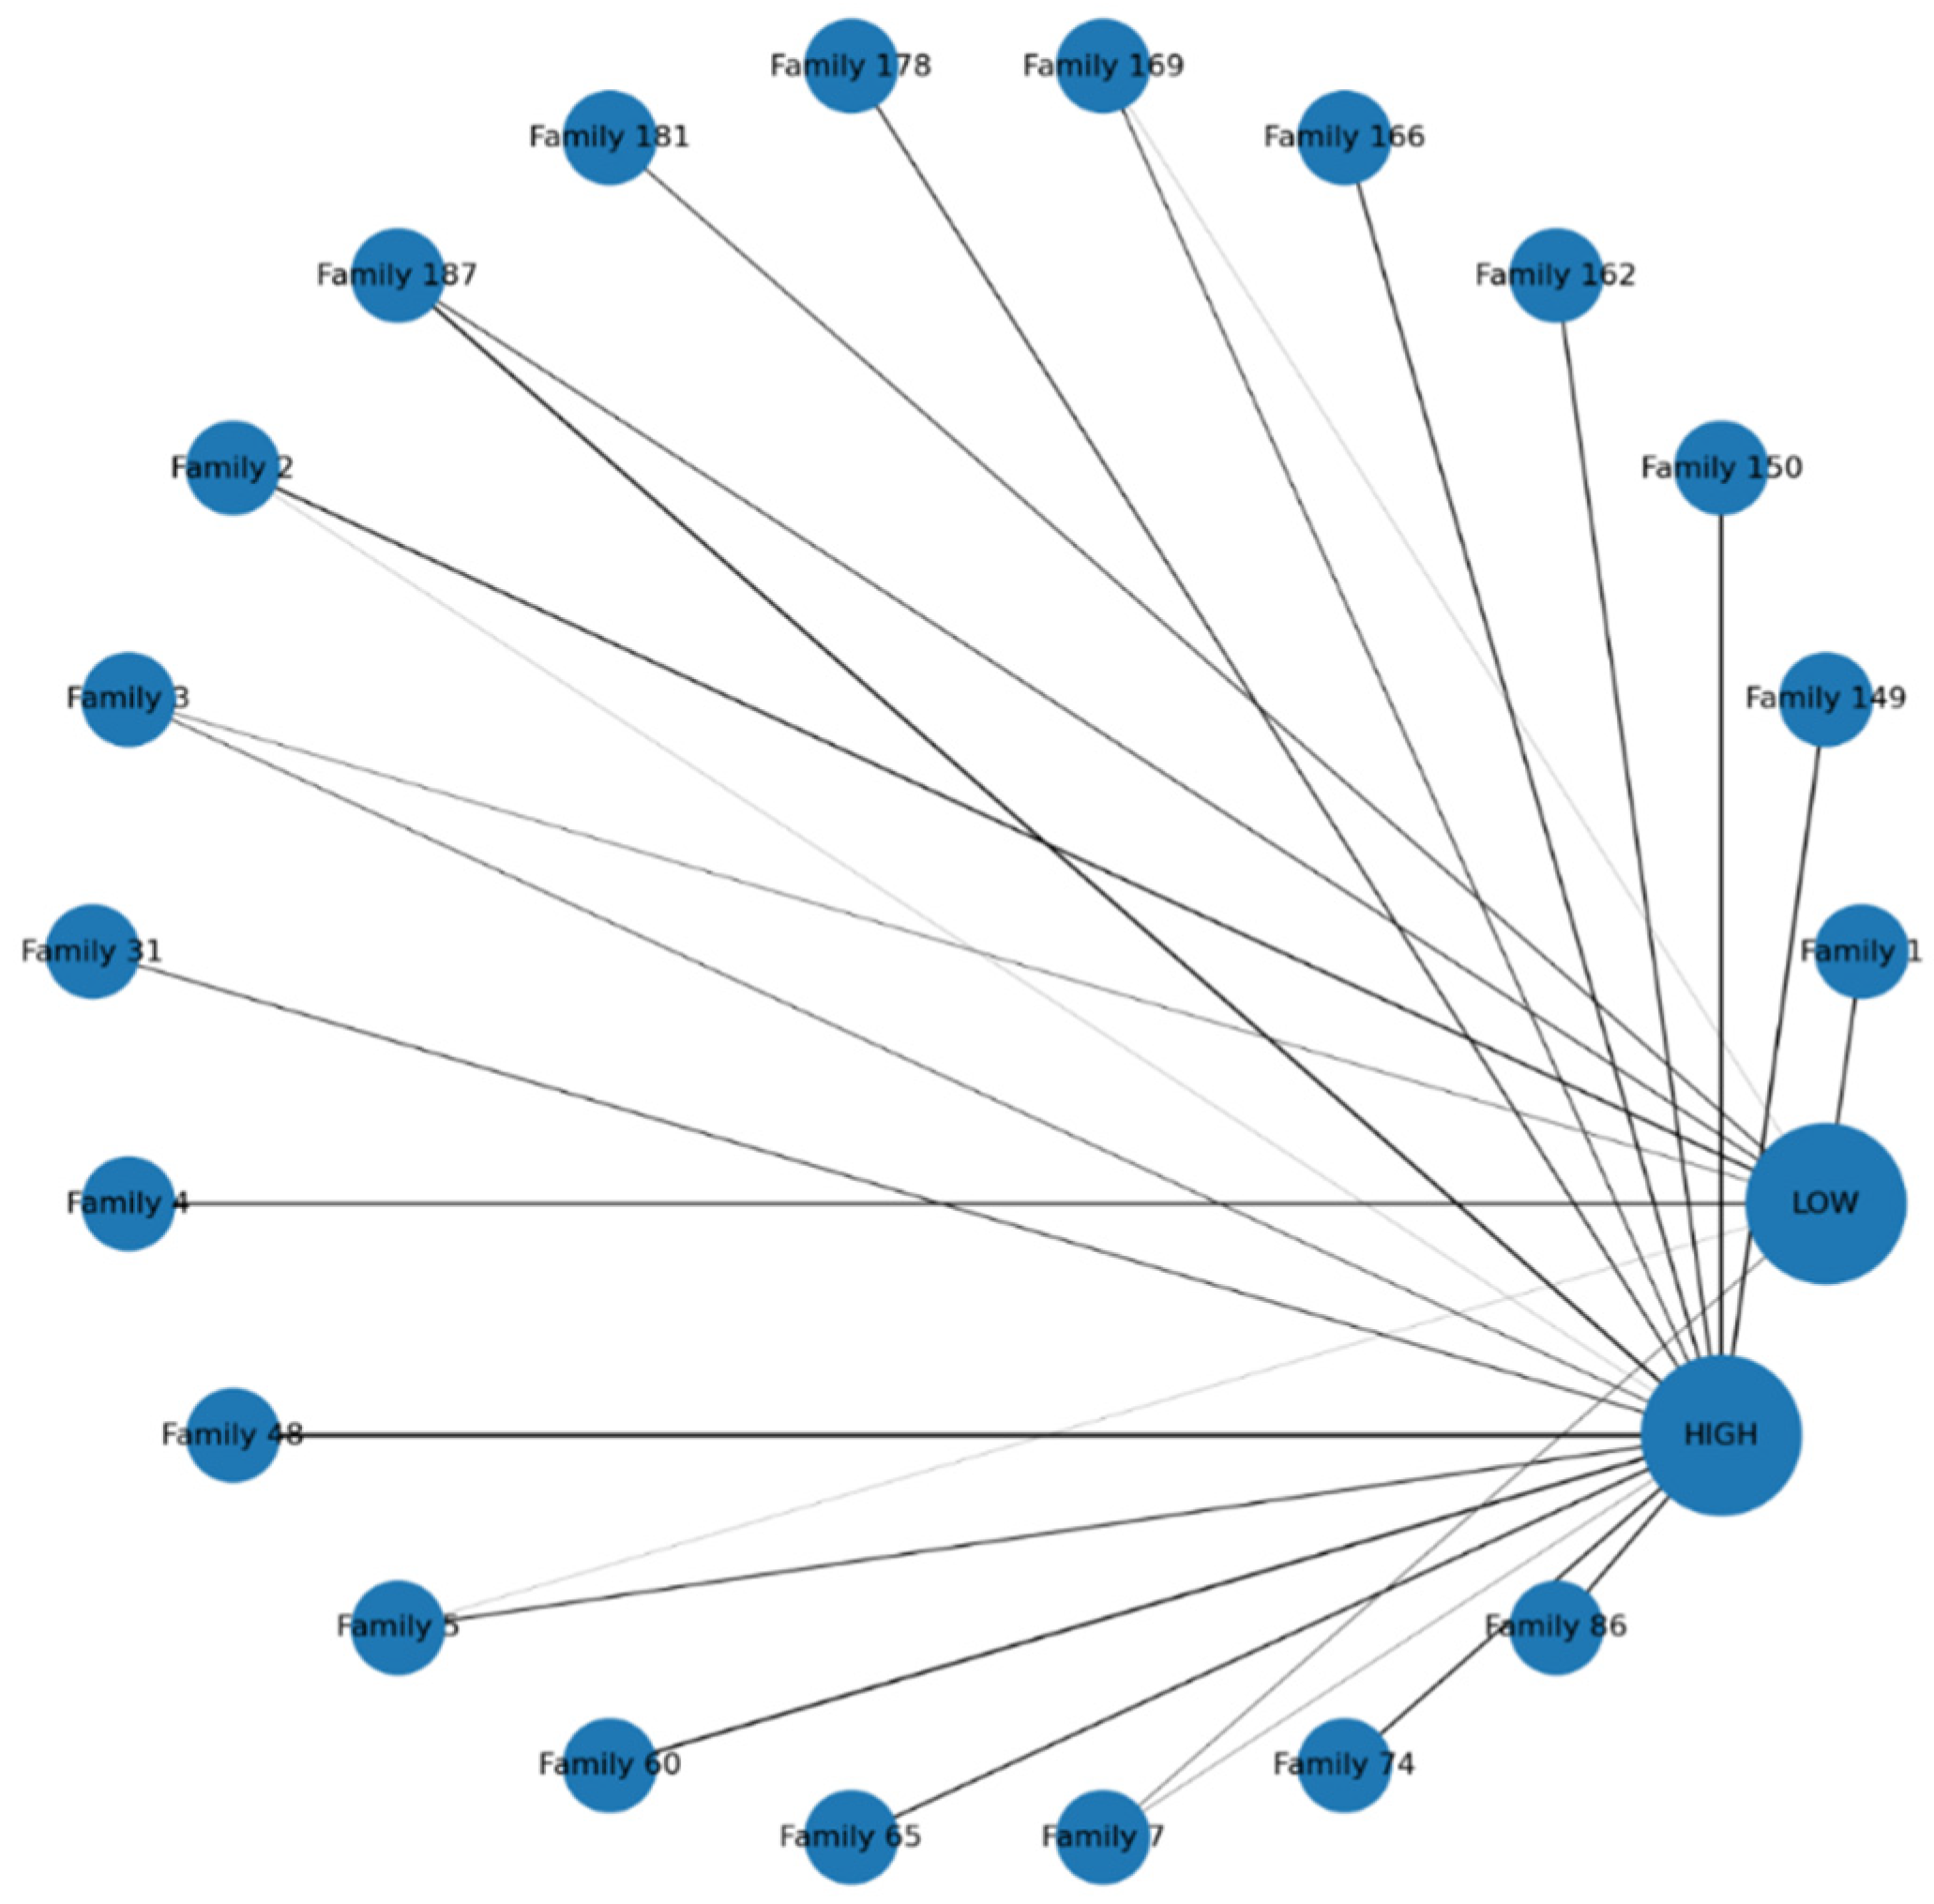
Figure 2.
Clustered heatmap of the top 20 families of smear-positive TB index cases, grouped by demographics and screening outcomes.
Figure 2.
Clustered heatmap of the top 20 families of smear-positive TB index cases, grouped by demographics and screening outcomes.
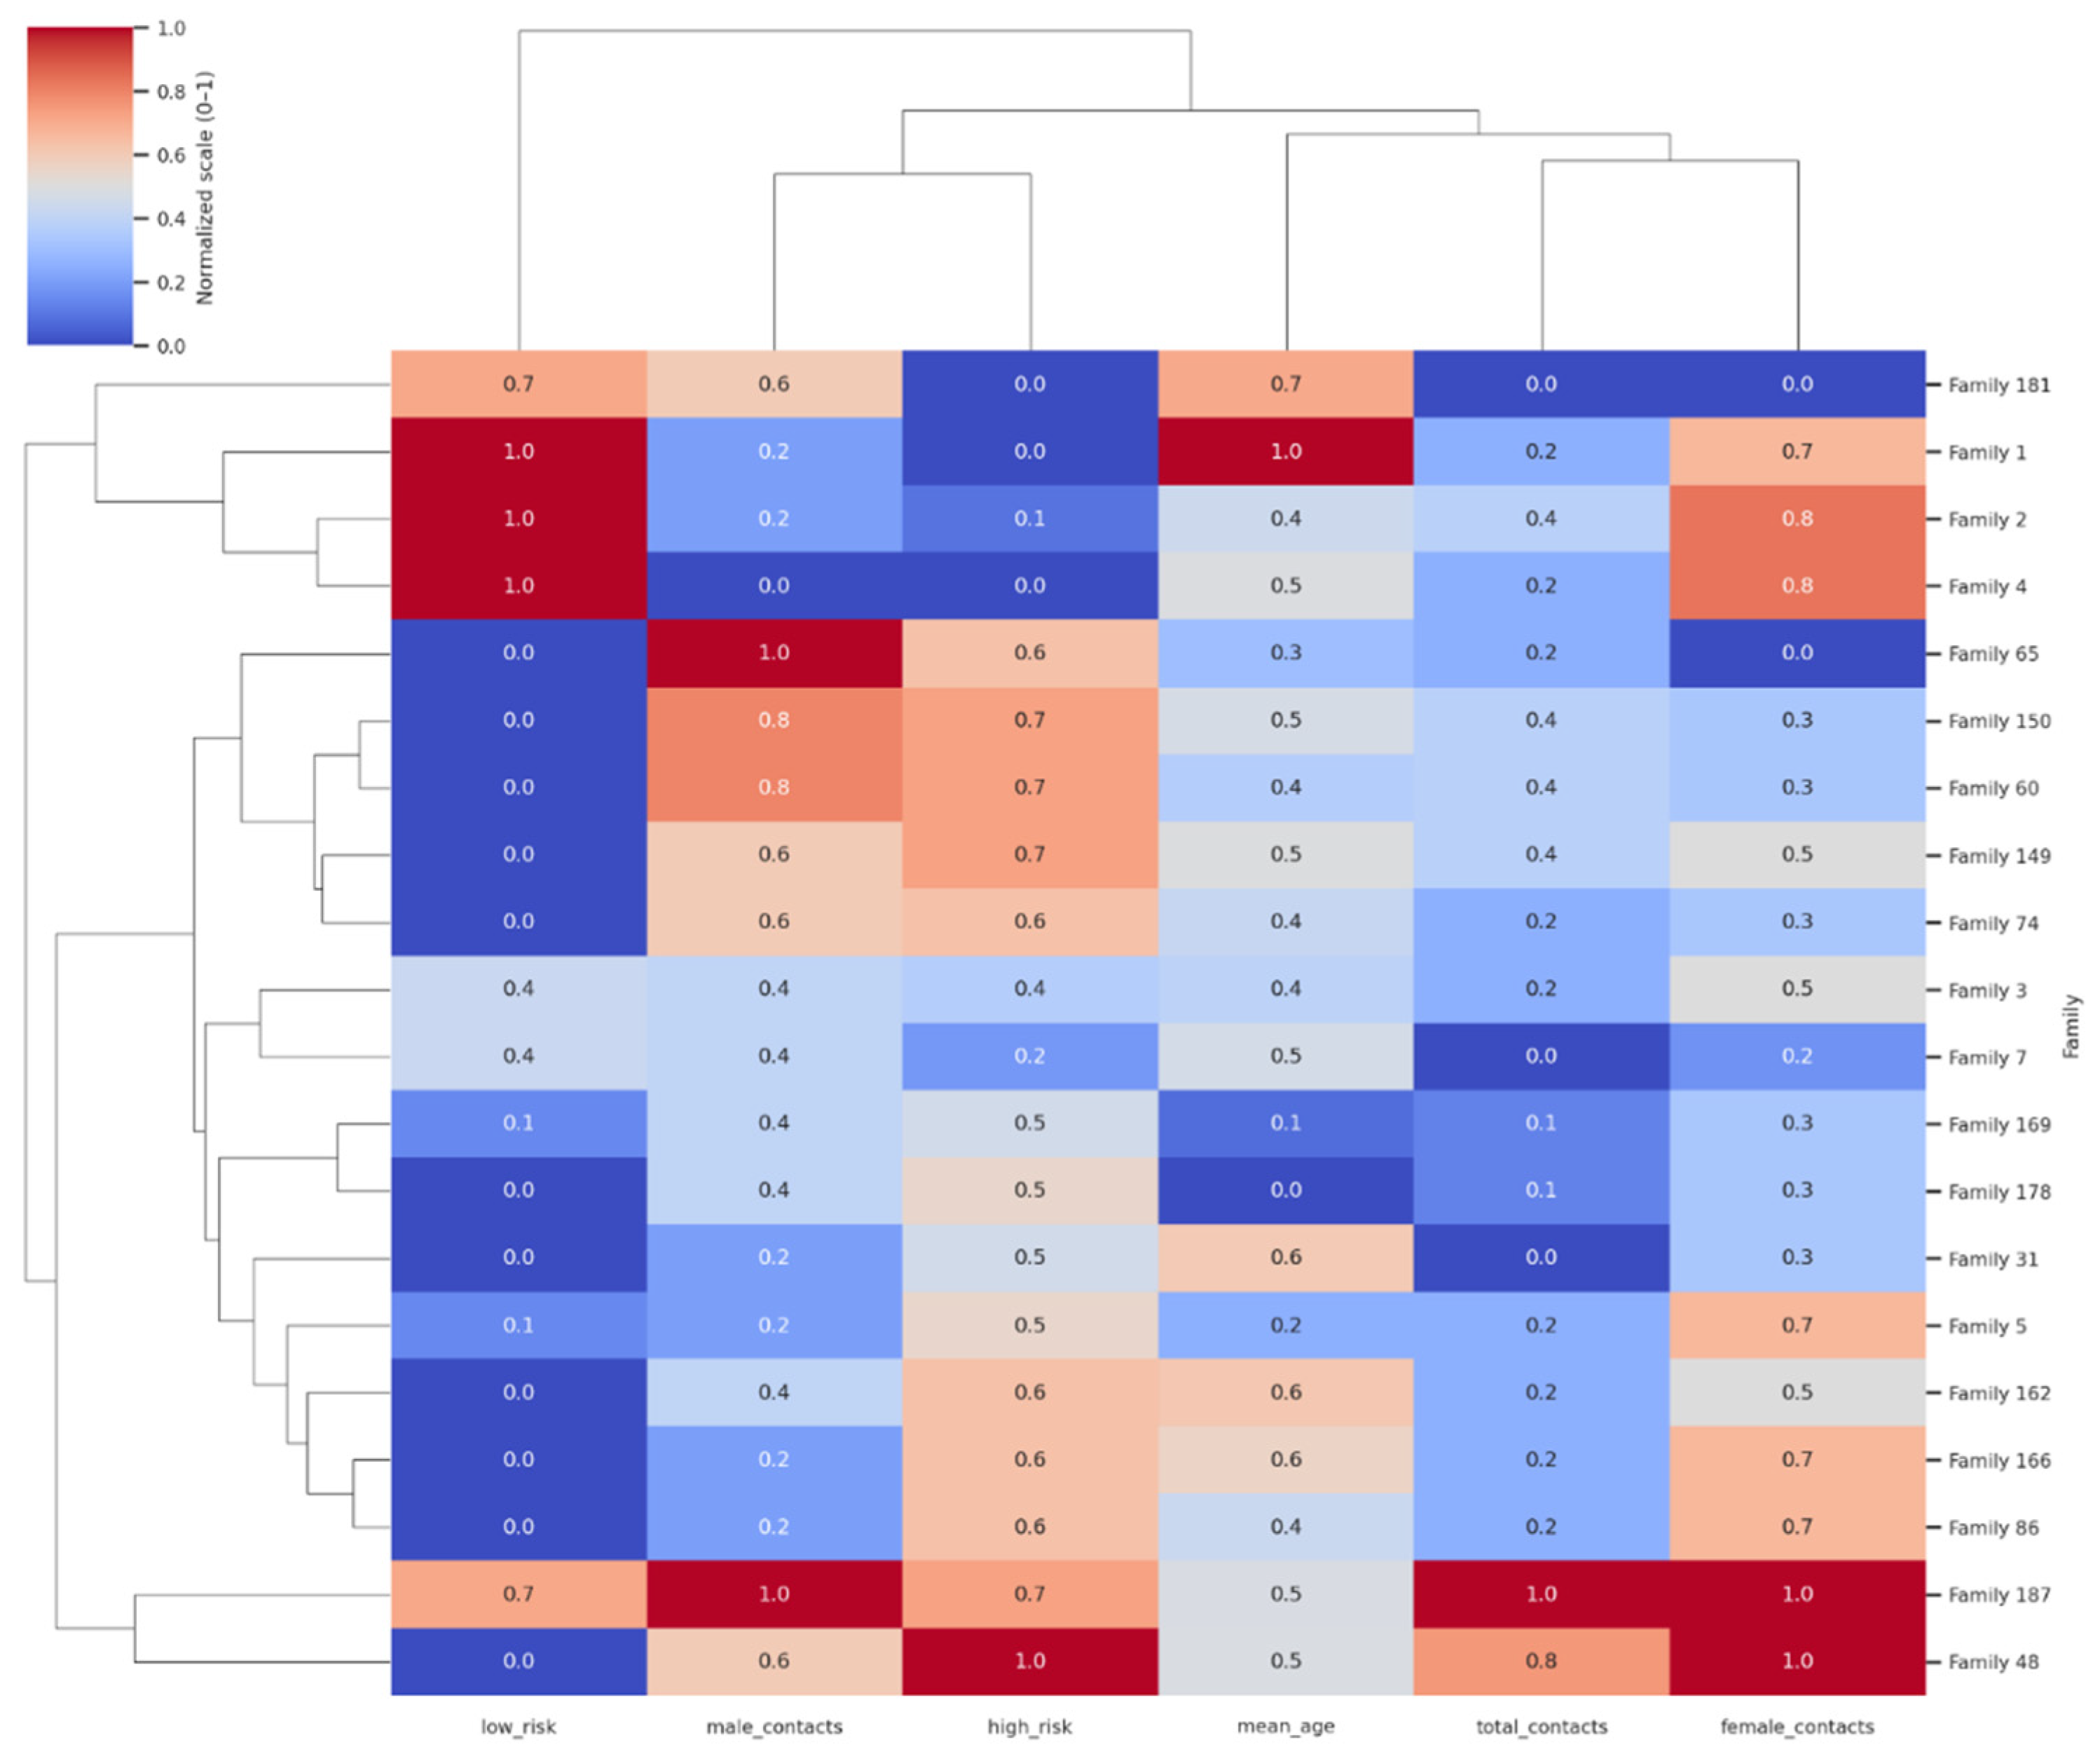
Figure 3.
Risk ranking with family level OR.
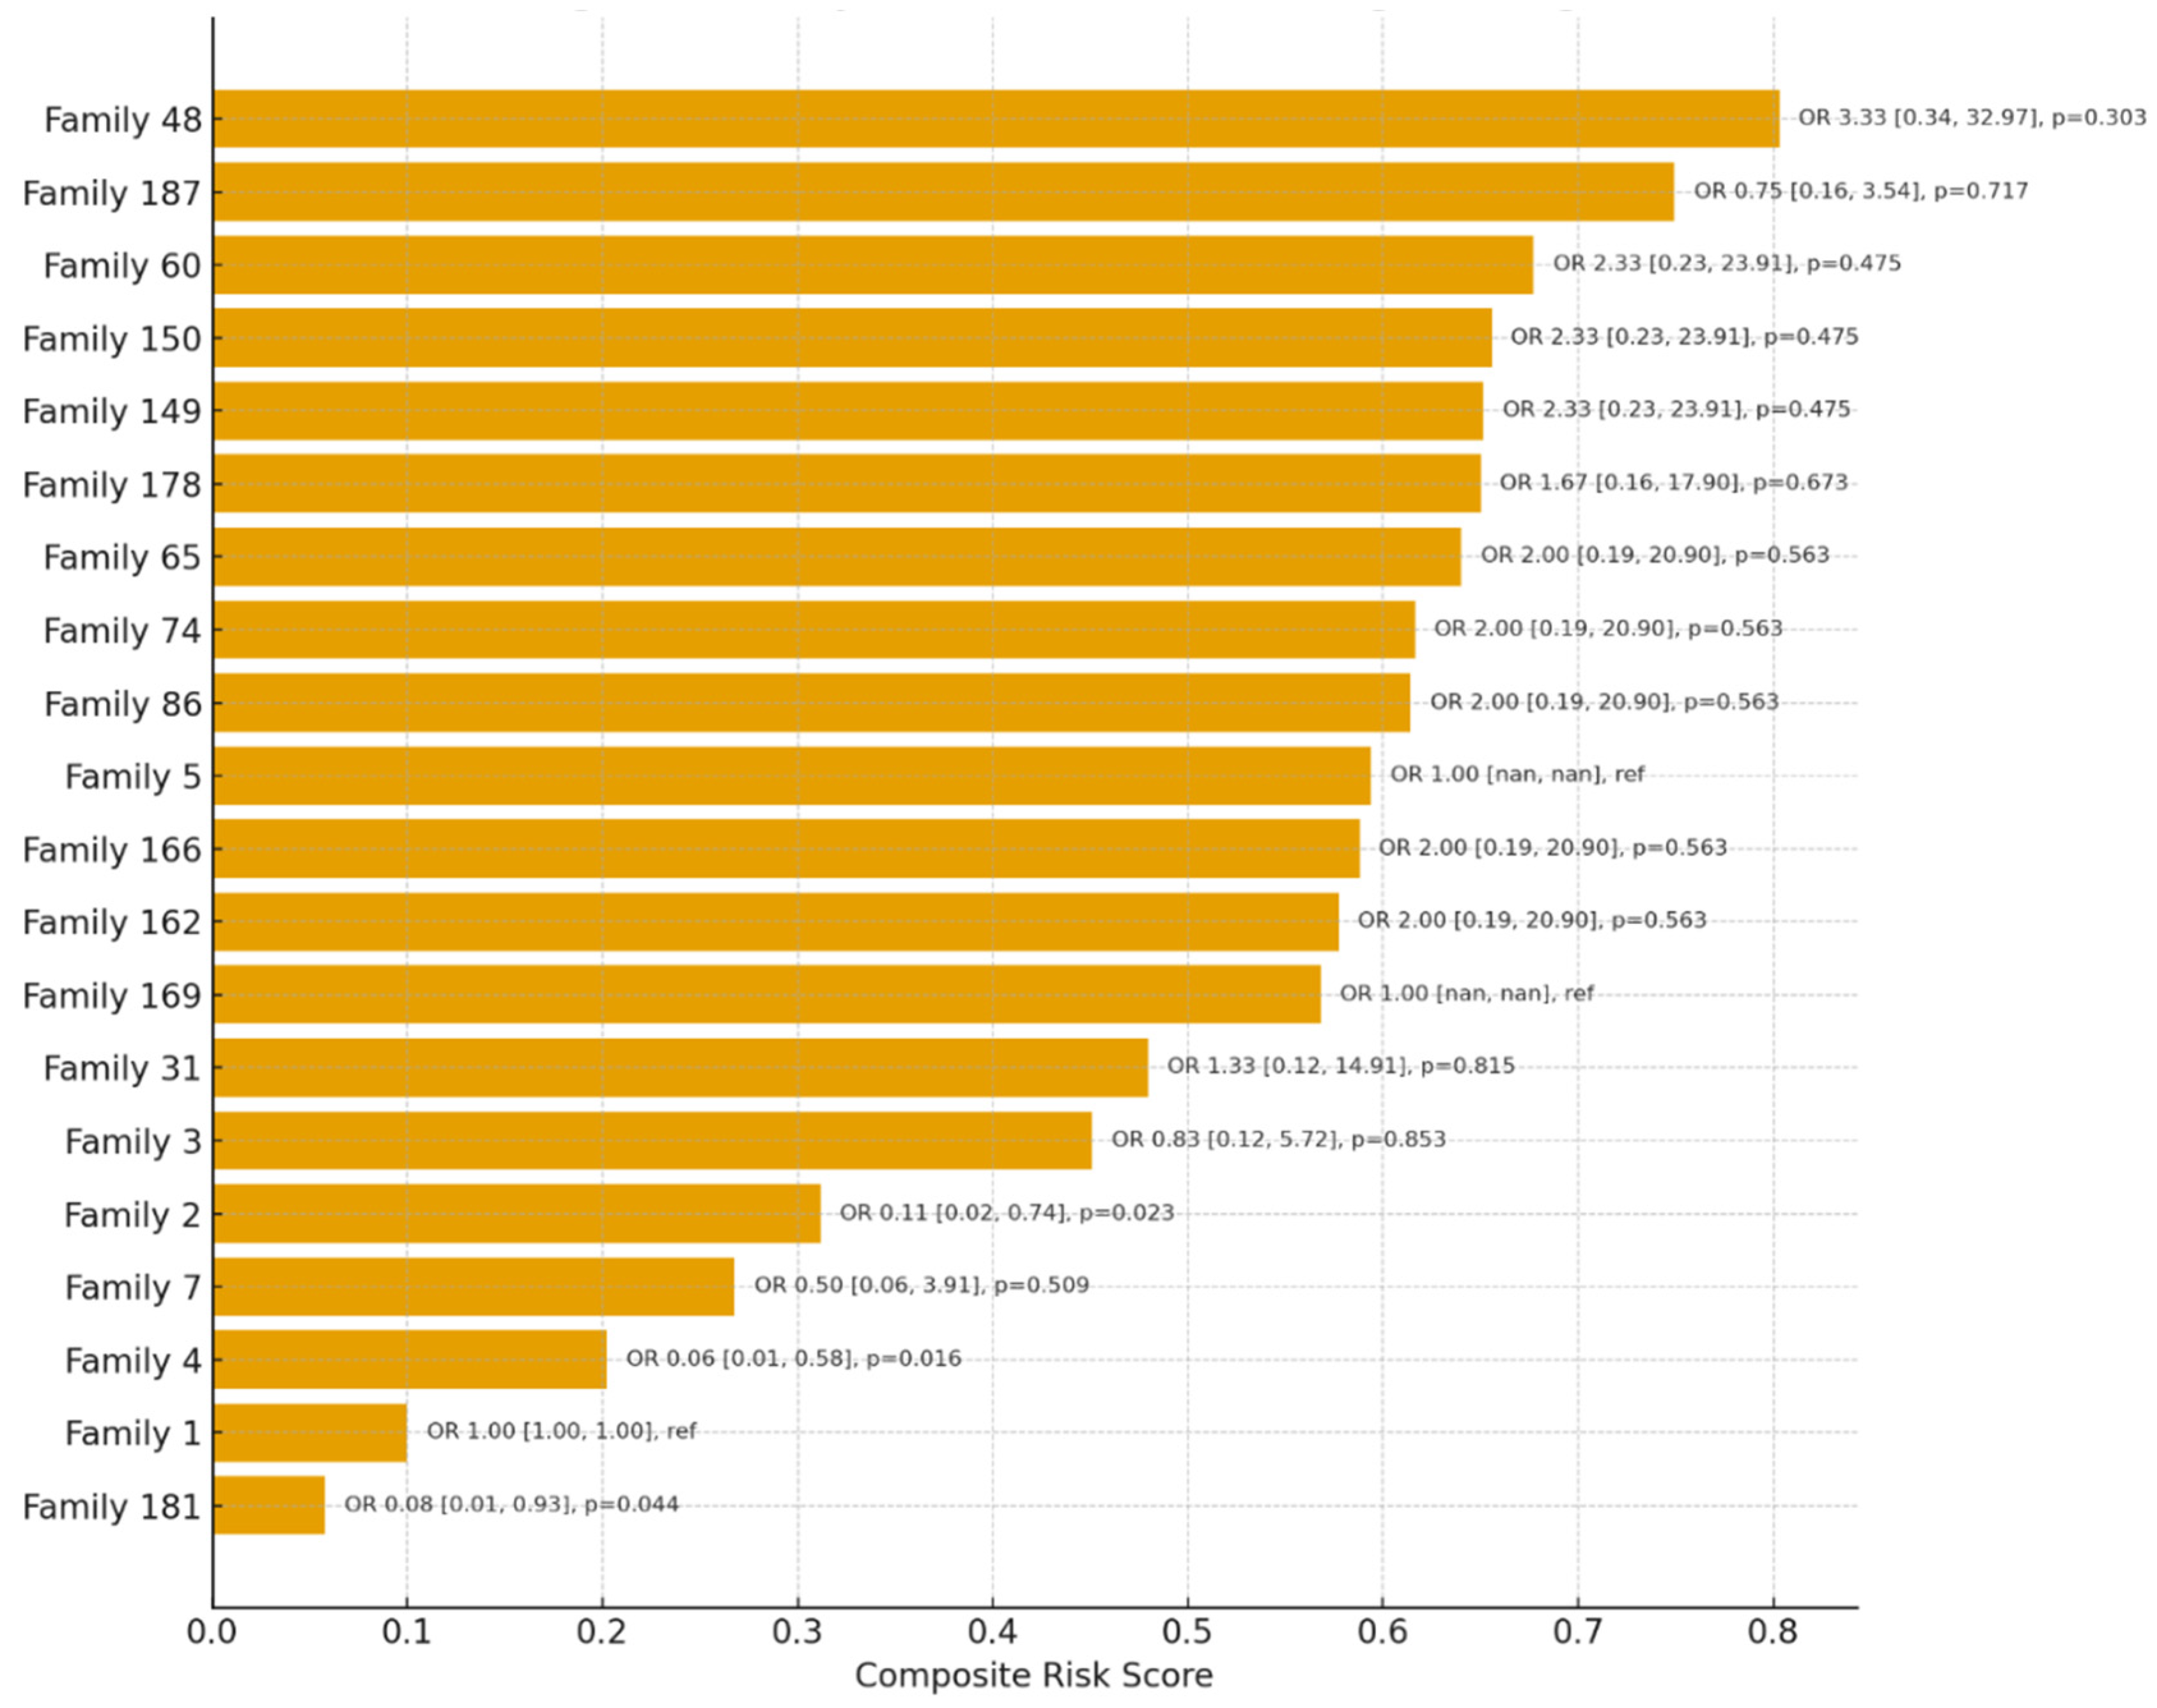
Figure 4.
Impact of clinical governance and community-engaged education on household TB risk.
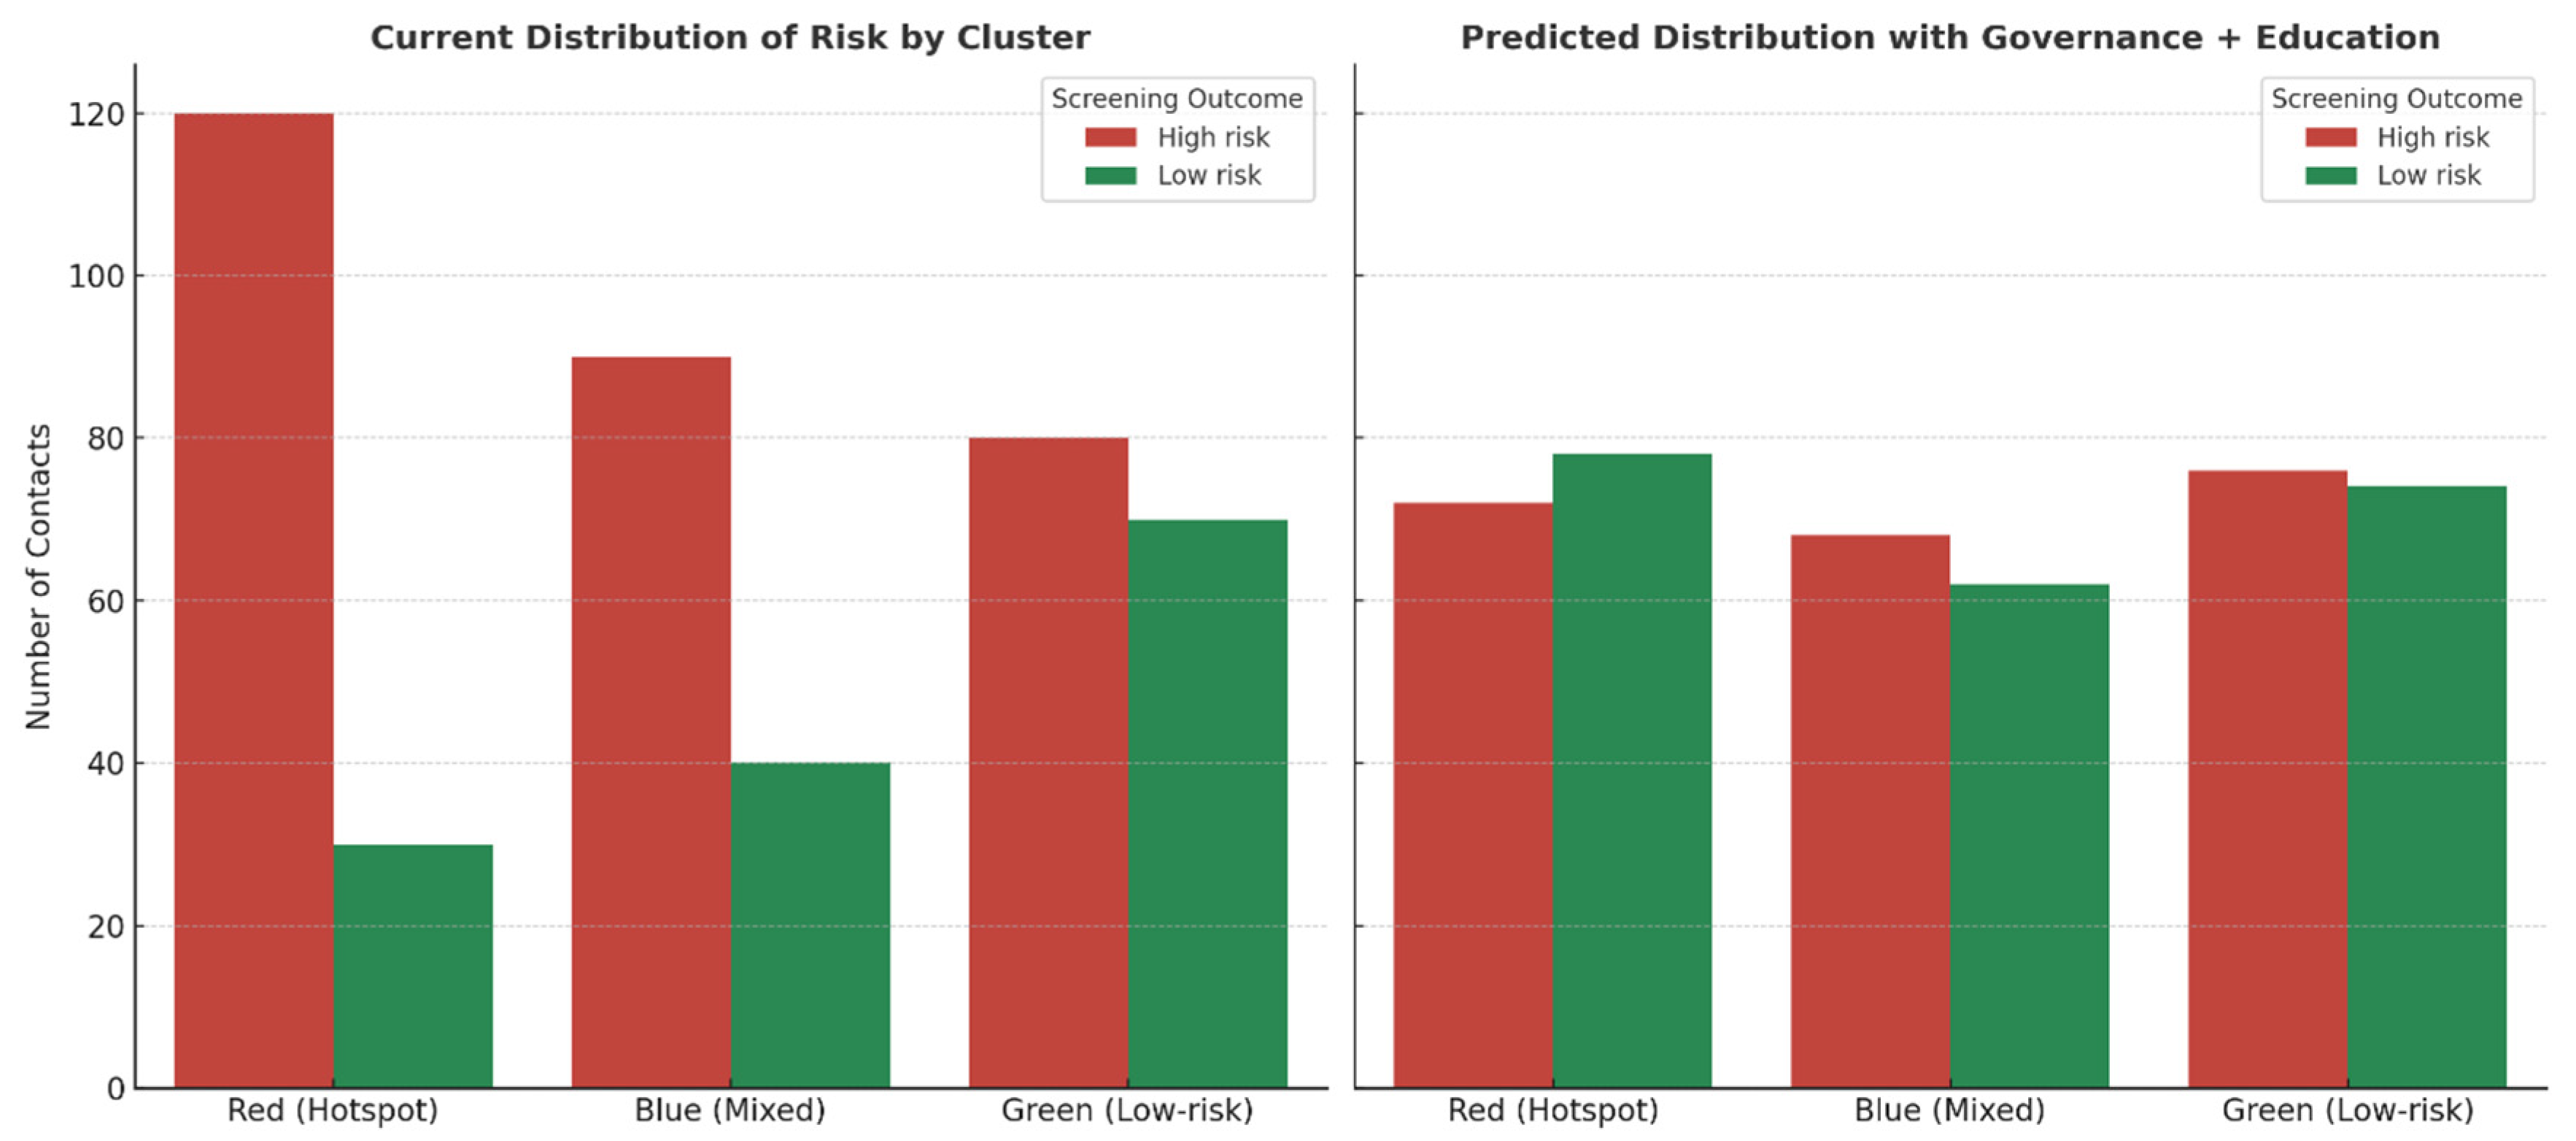
Figure 5.
Receiver operating characteristic (ROC) curve of the best-performing gradient boosting model on the 20% hold-out test set (AUROC = 0.65), demonstrating moderate discrimination between high- and low-risk household contacts.
Figure 5.
Receiver operating characteristic (ROC) curve of the best-performing gradient boosting model on the 20% hold-out test set (AUROC = 0.65), demonstrating moderate discrimination between high- and low-risk household contacts.
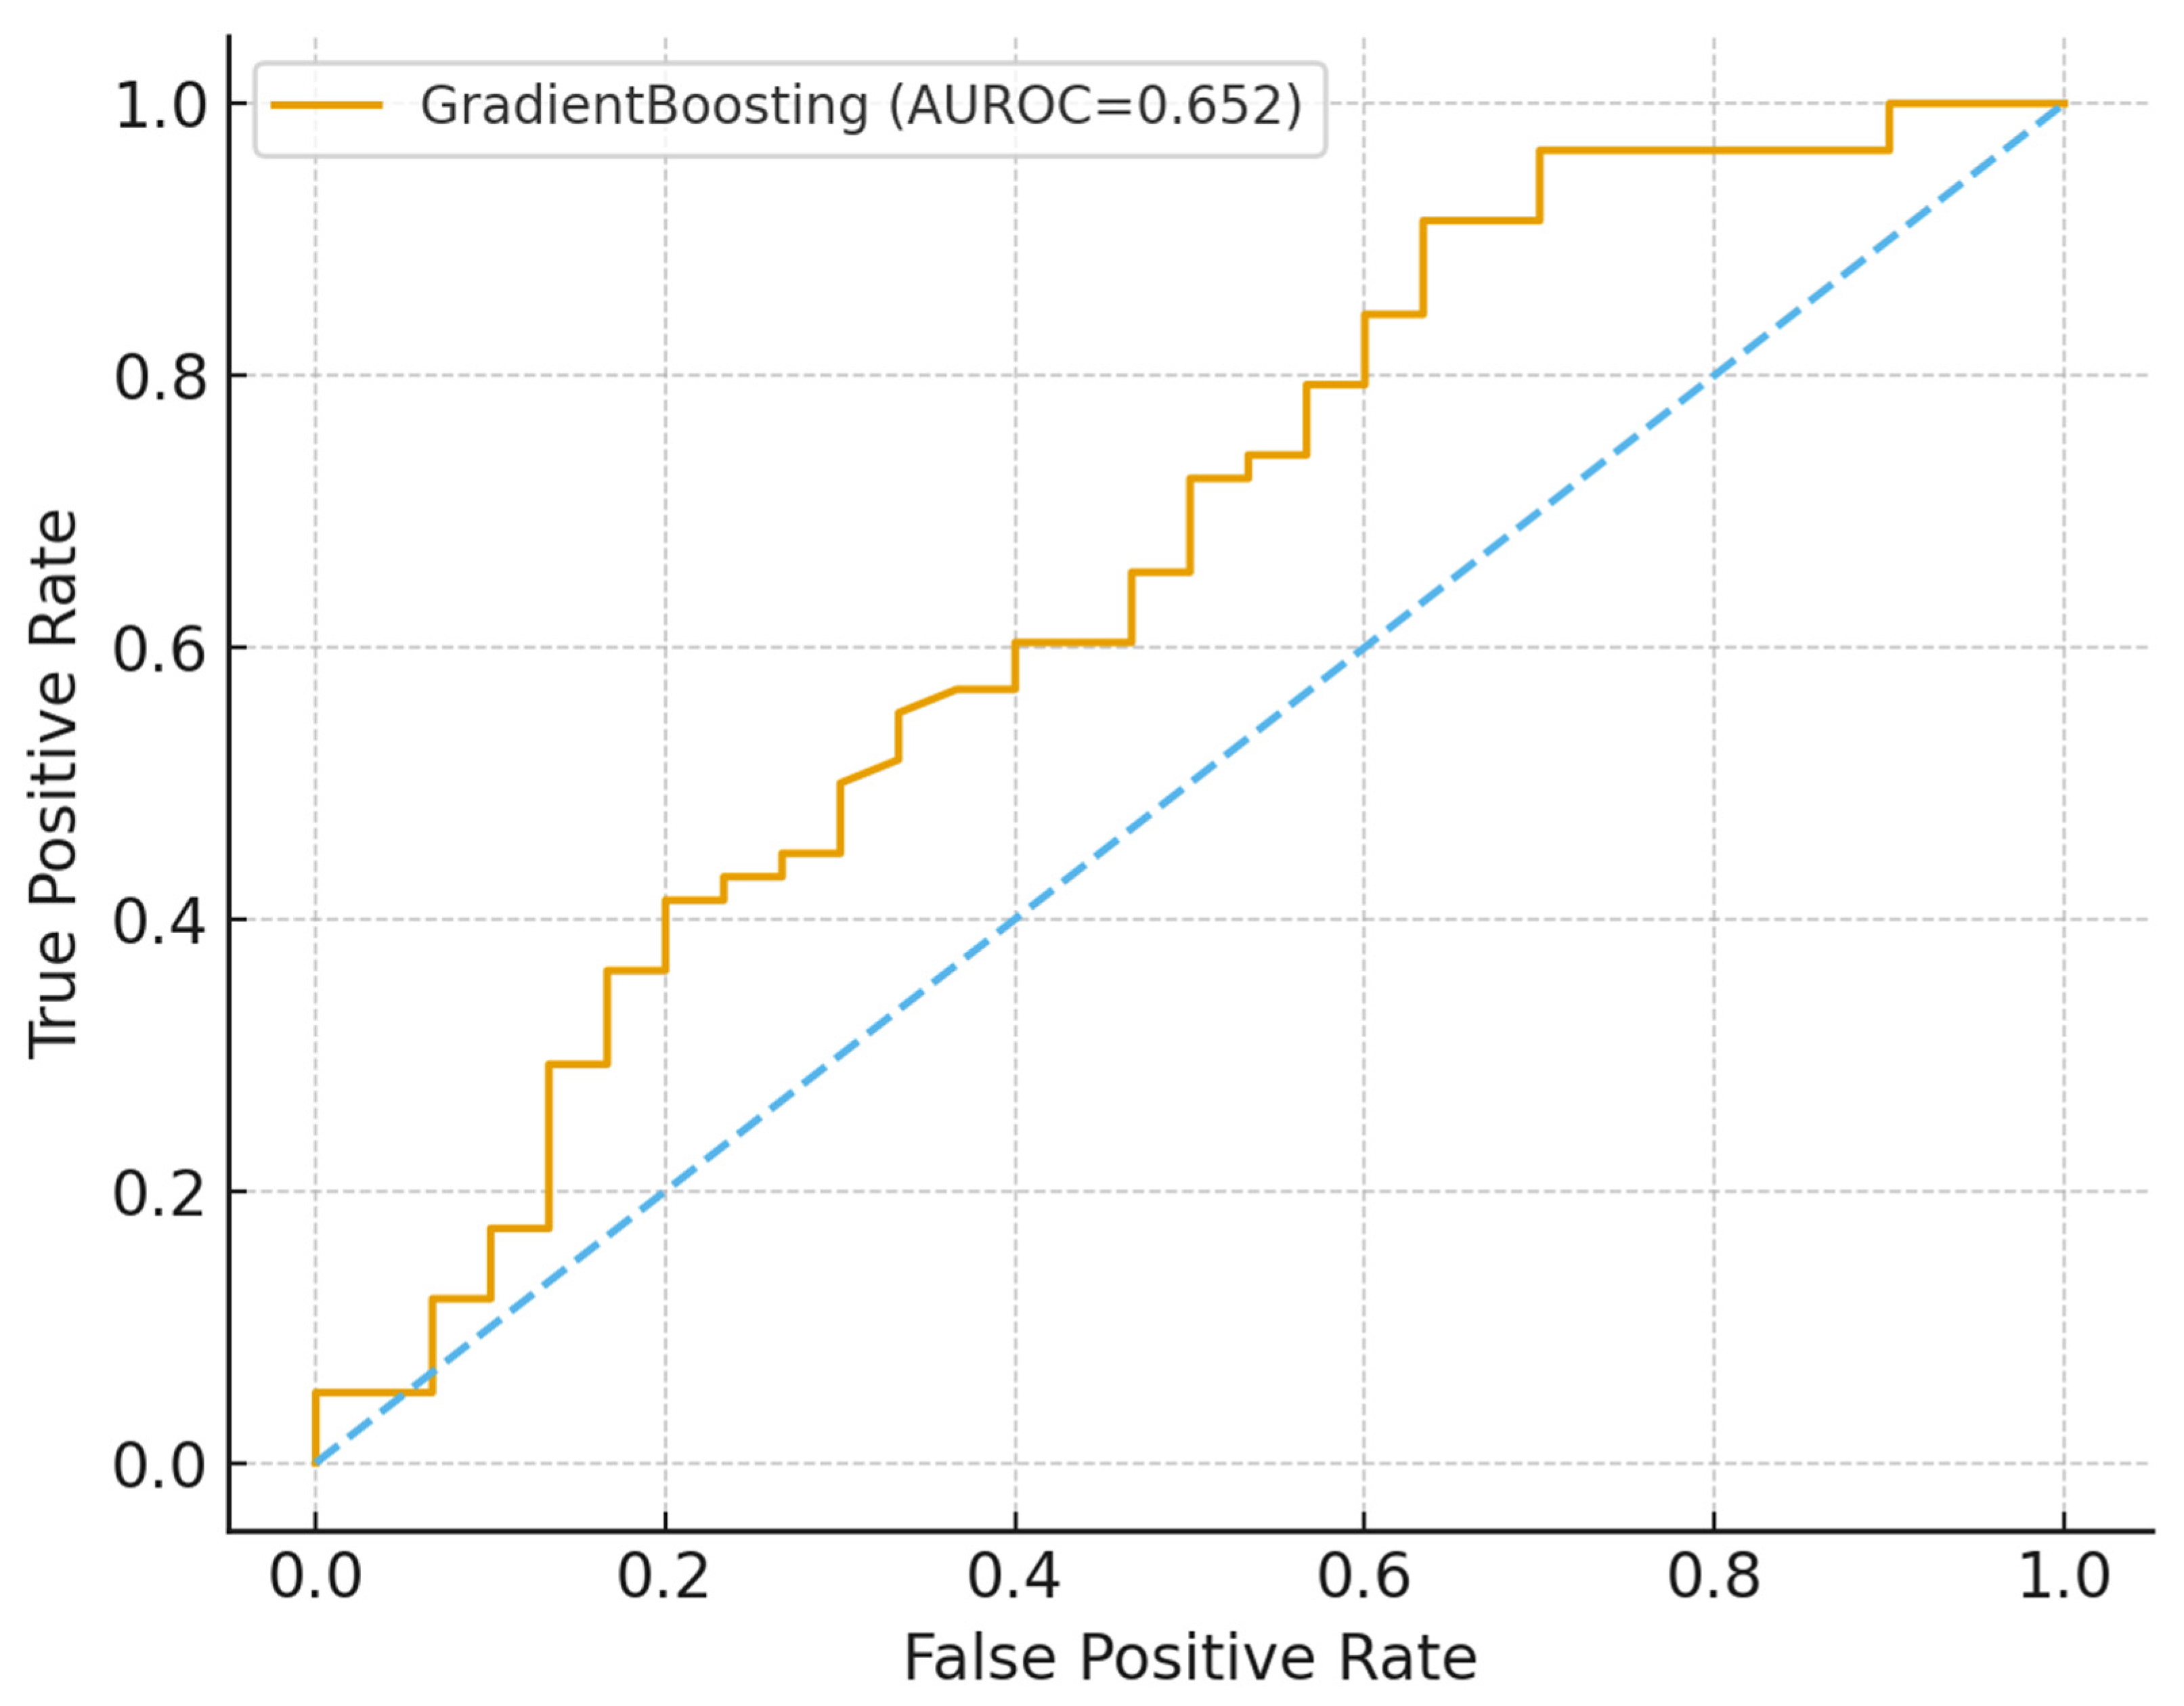
Figure 6.
Precision–recall (PR) curve of the gradient boosting model on the hold-out set (AUPRC = 0.76), showing the ability to prioritize high-risk individuals despite class imbalance.
Figure 6.
Precision–recall (PR) curve of the gradient boosting model on the hold-out set (AUPRC = 0.76), showing the ability to prioritize high-risk individuals despite class imbalance.
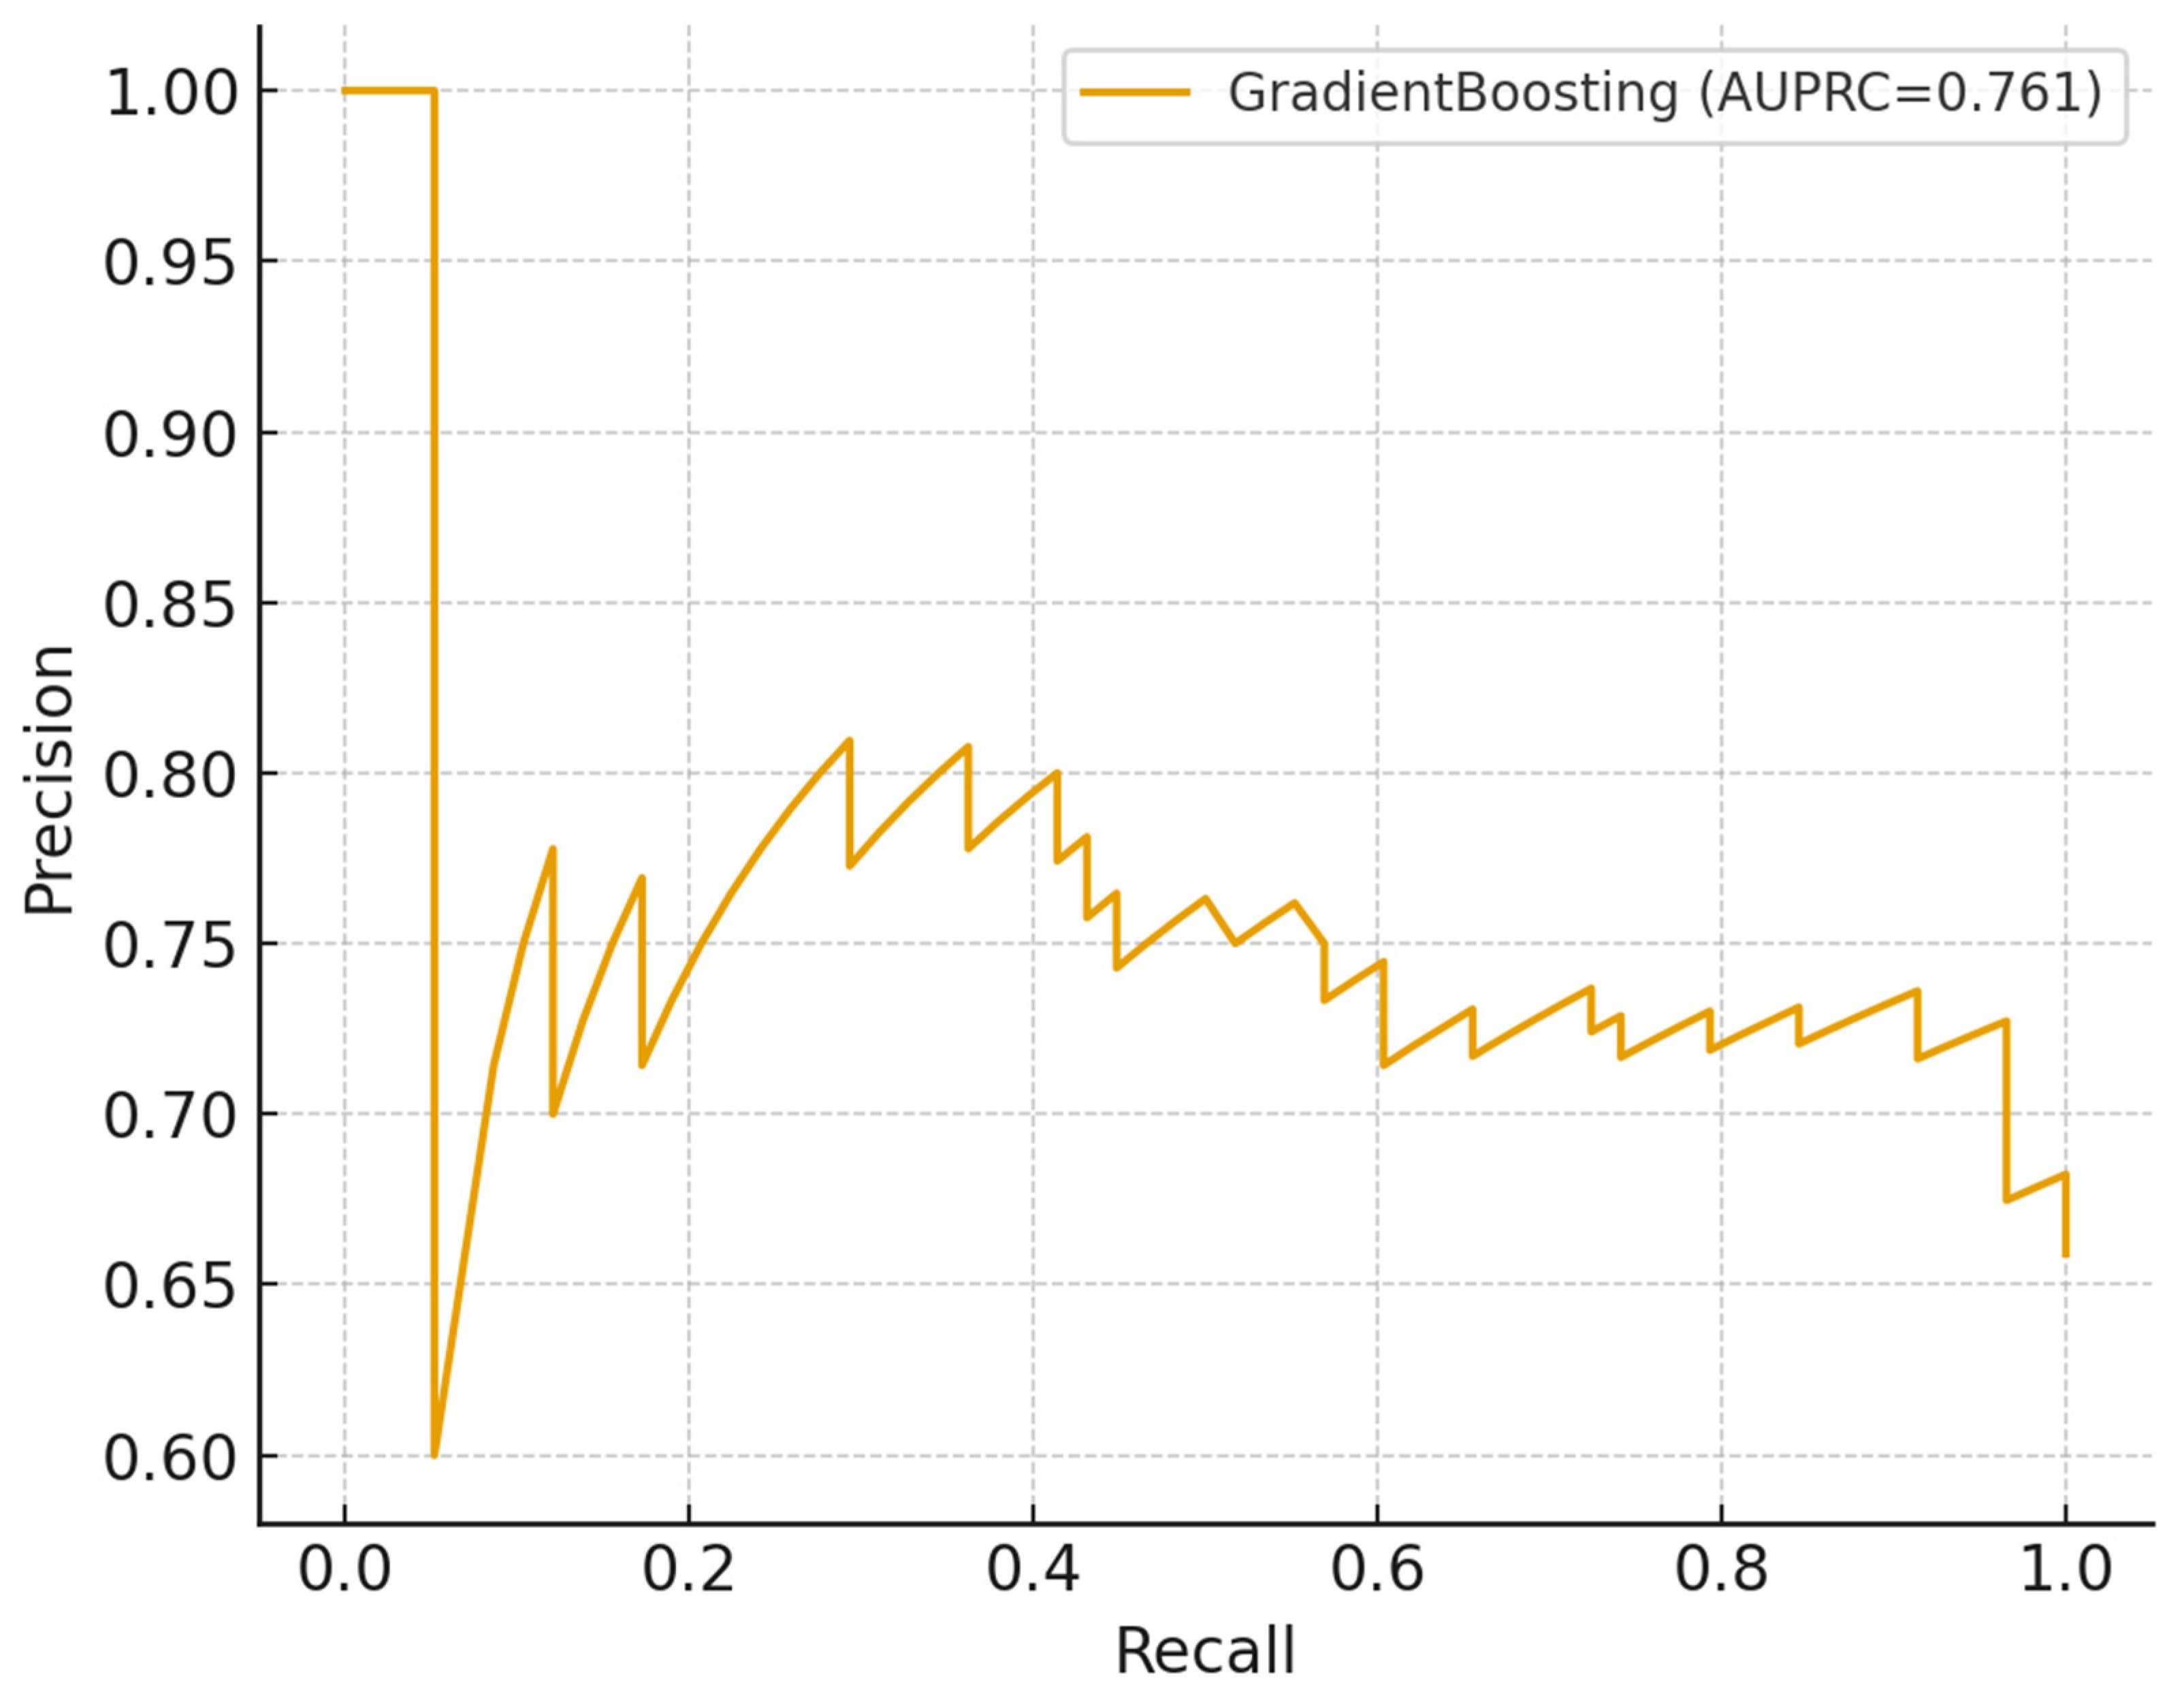
Figure 7.
Confusion matrix at the 0.5 probability threshold for the gradient boosting model on the hold-out set, illustrating high sensitivity for high-risk contacts alongside some false positives.
Figure 7.
Confusion matrix at the 0.5 probability threshold for the gradient boosting model on the hold-out set, illustrating high sensitivity for high-risk contacts alongside some false positives.
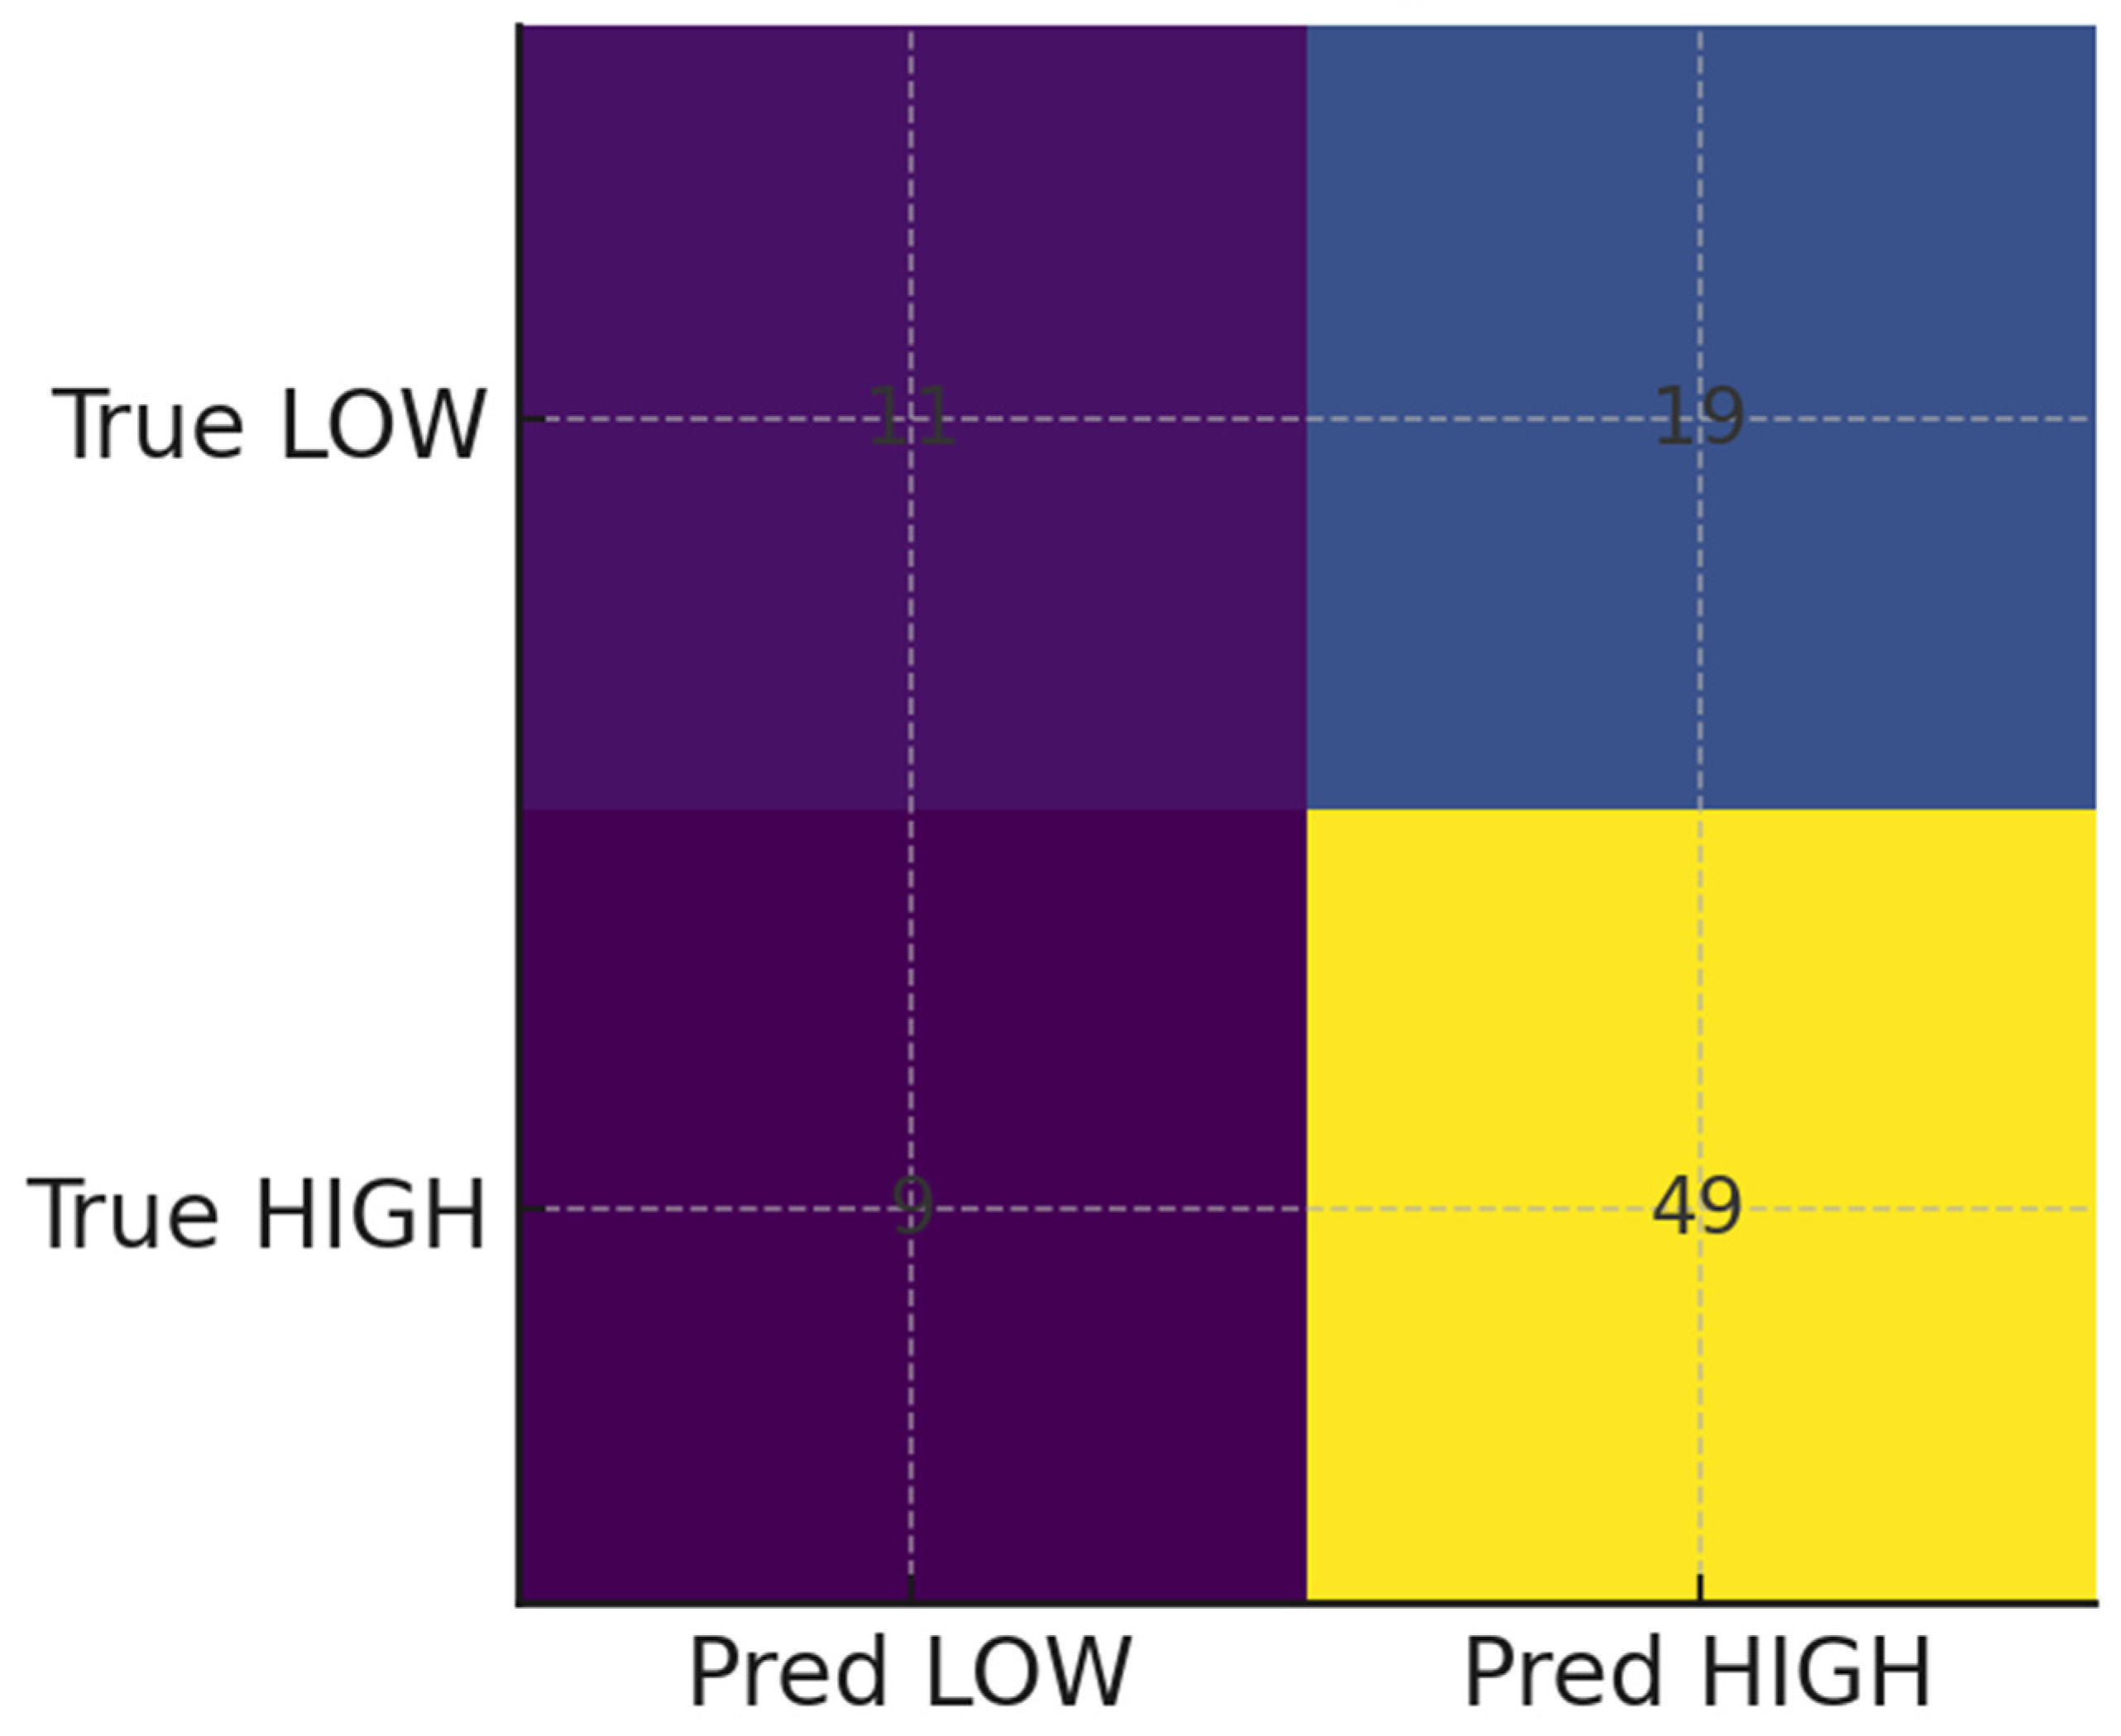
Figure 8.
Feature importance plot from the best-performing tree-based model, highlighting age and household size as the strongest predictors of high-risk classification, with minimal contribution from gender and screening status.
Figure 8.
Feature importance plot from the best-performing tree-based model, highlighting age and household size as the strongest predictors of high-risk classification, with minimal contribution from gender and screening status.
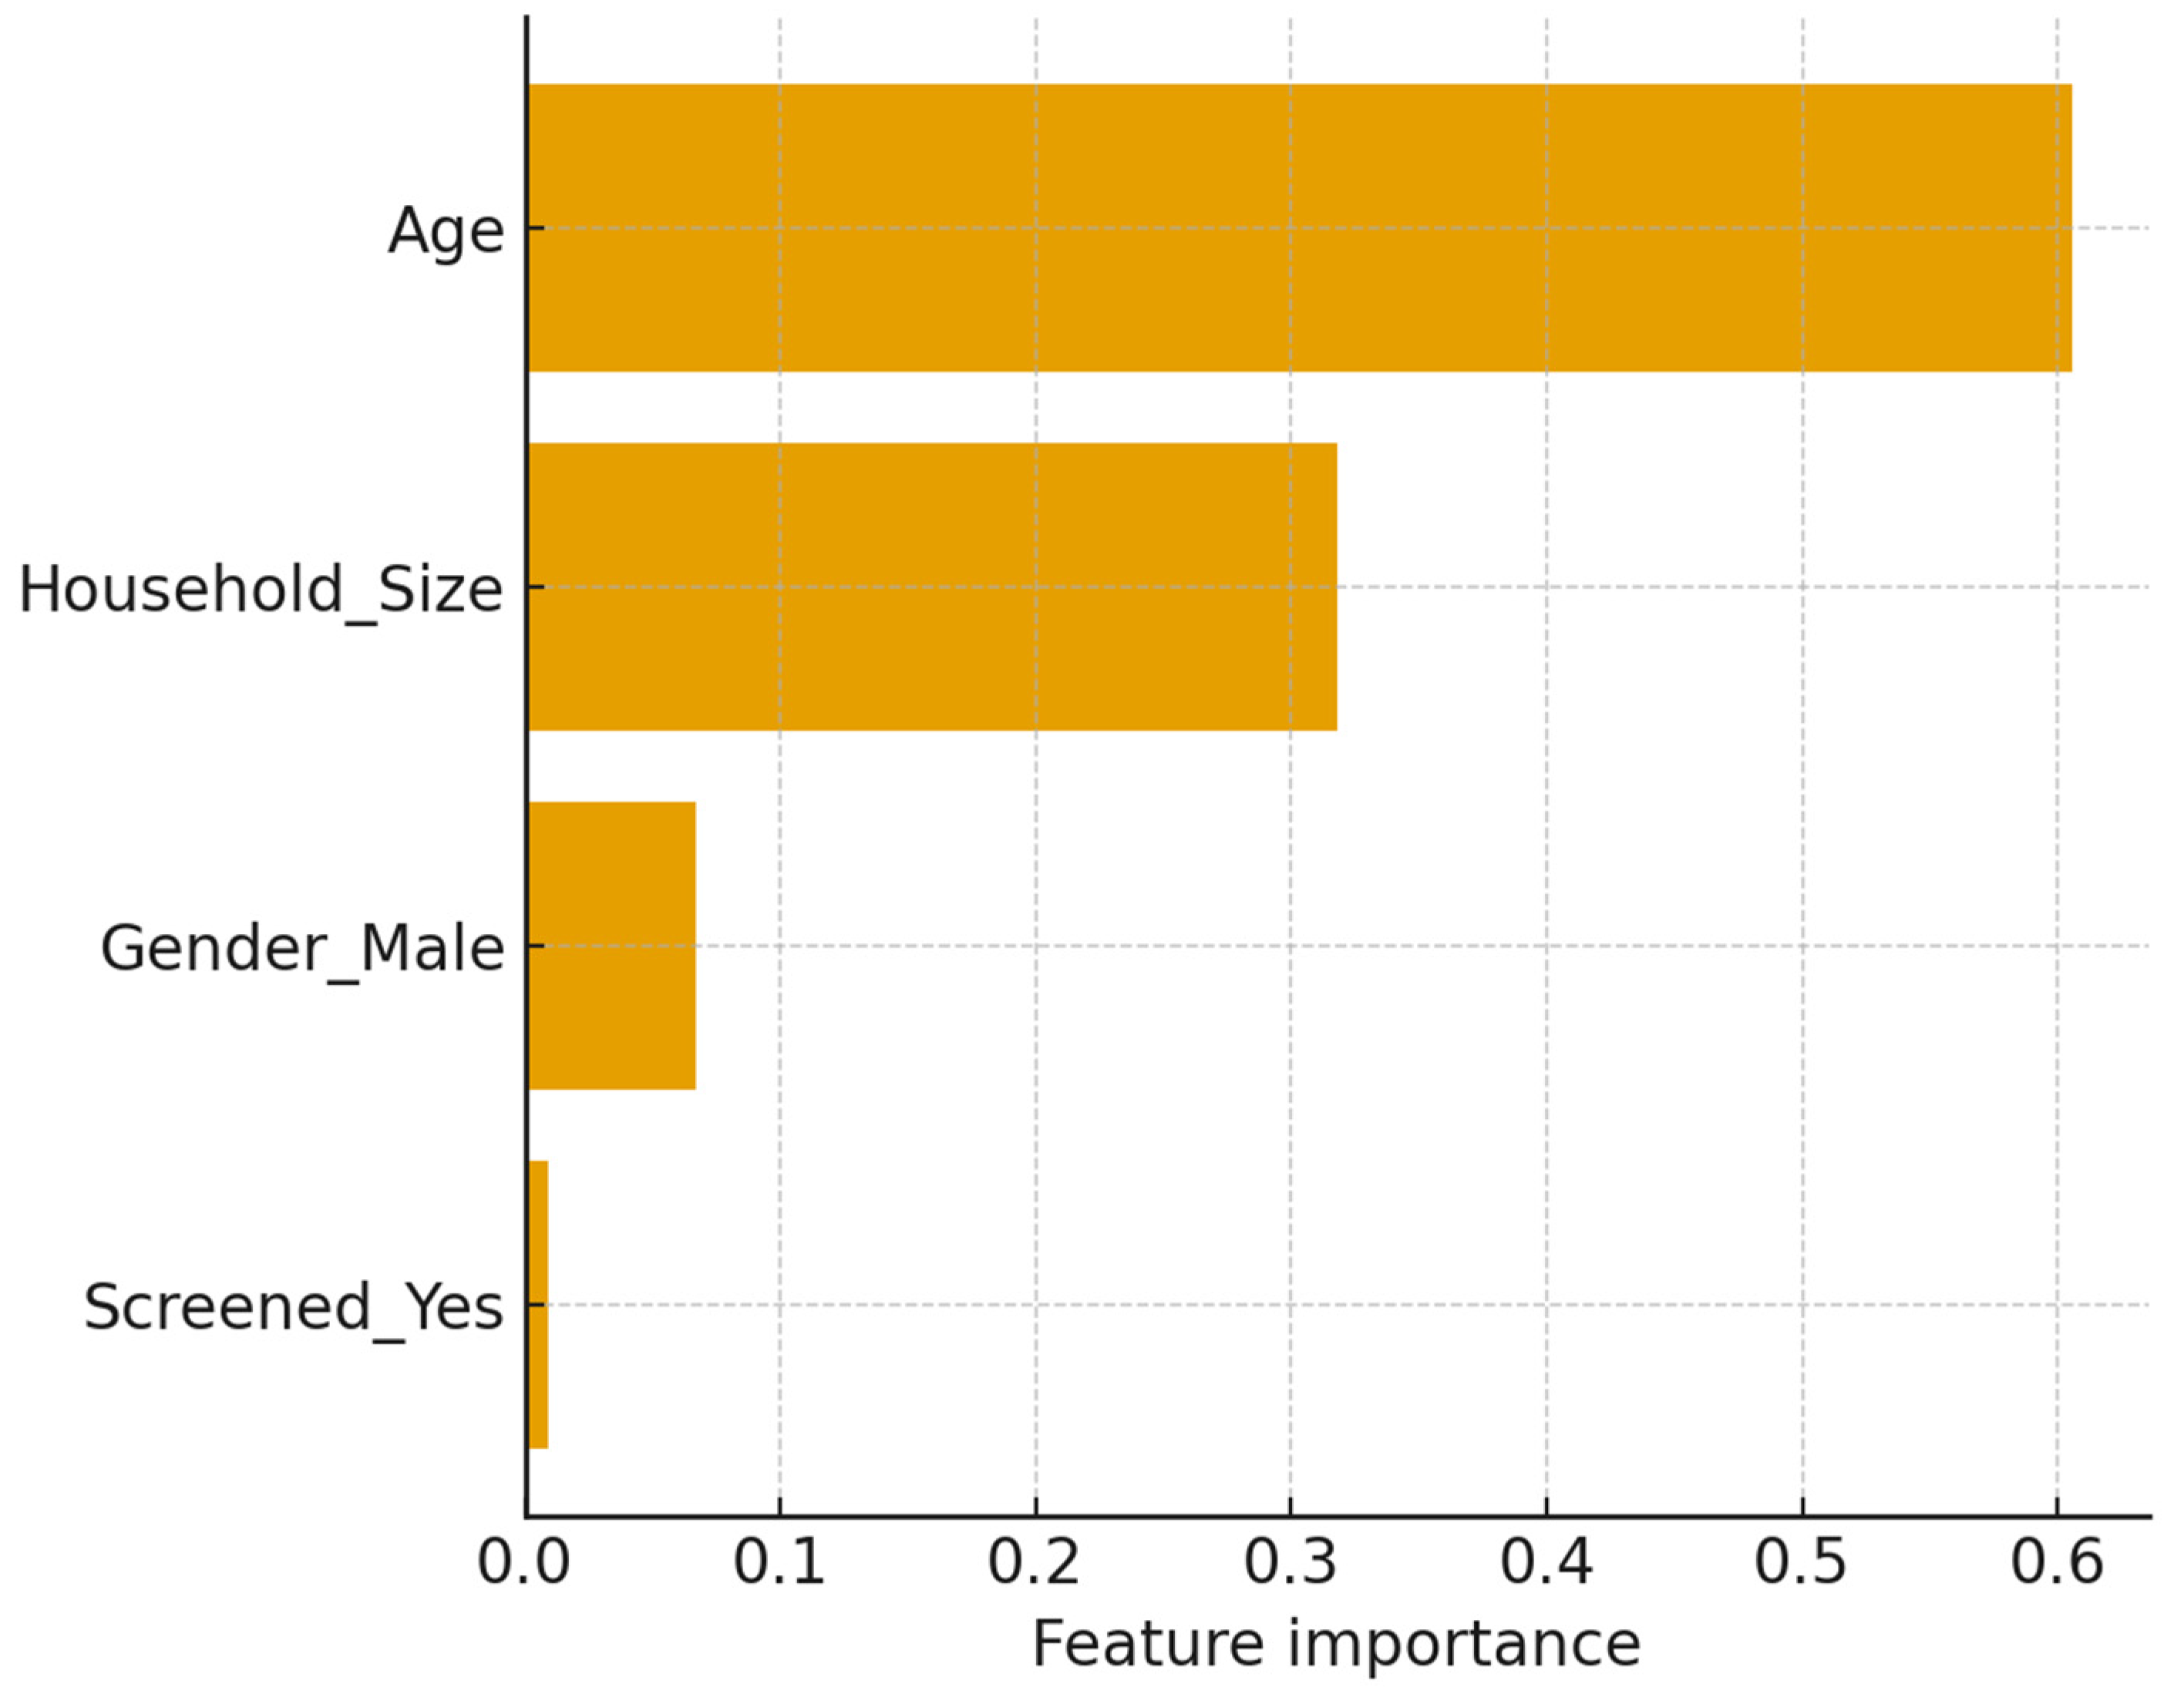
Figure 9.
Calibration curve with Brier score (0.21), showing moderate alignment between predicted probabilities and observed outcomes, with slight underestimation at higher risk levels.
Figure 9.
Calibration curve with Brier score (0.21), showing moderate alignment between predicted probabilities and observed outcomes, with slight underestimation at higher risk levels.
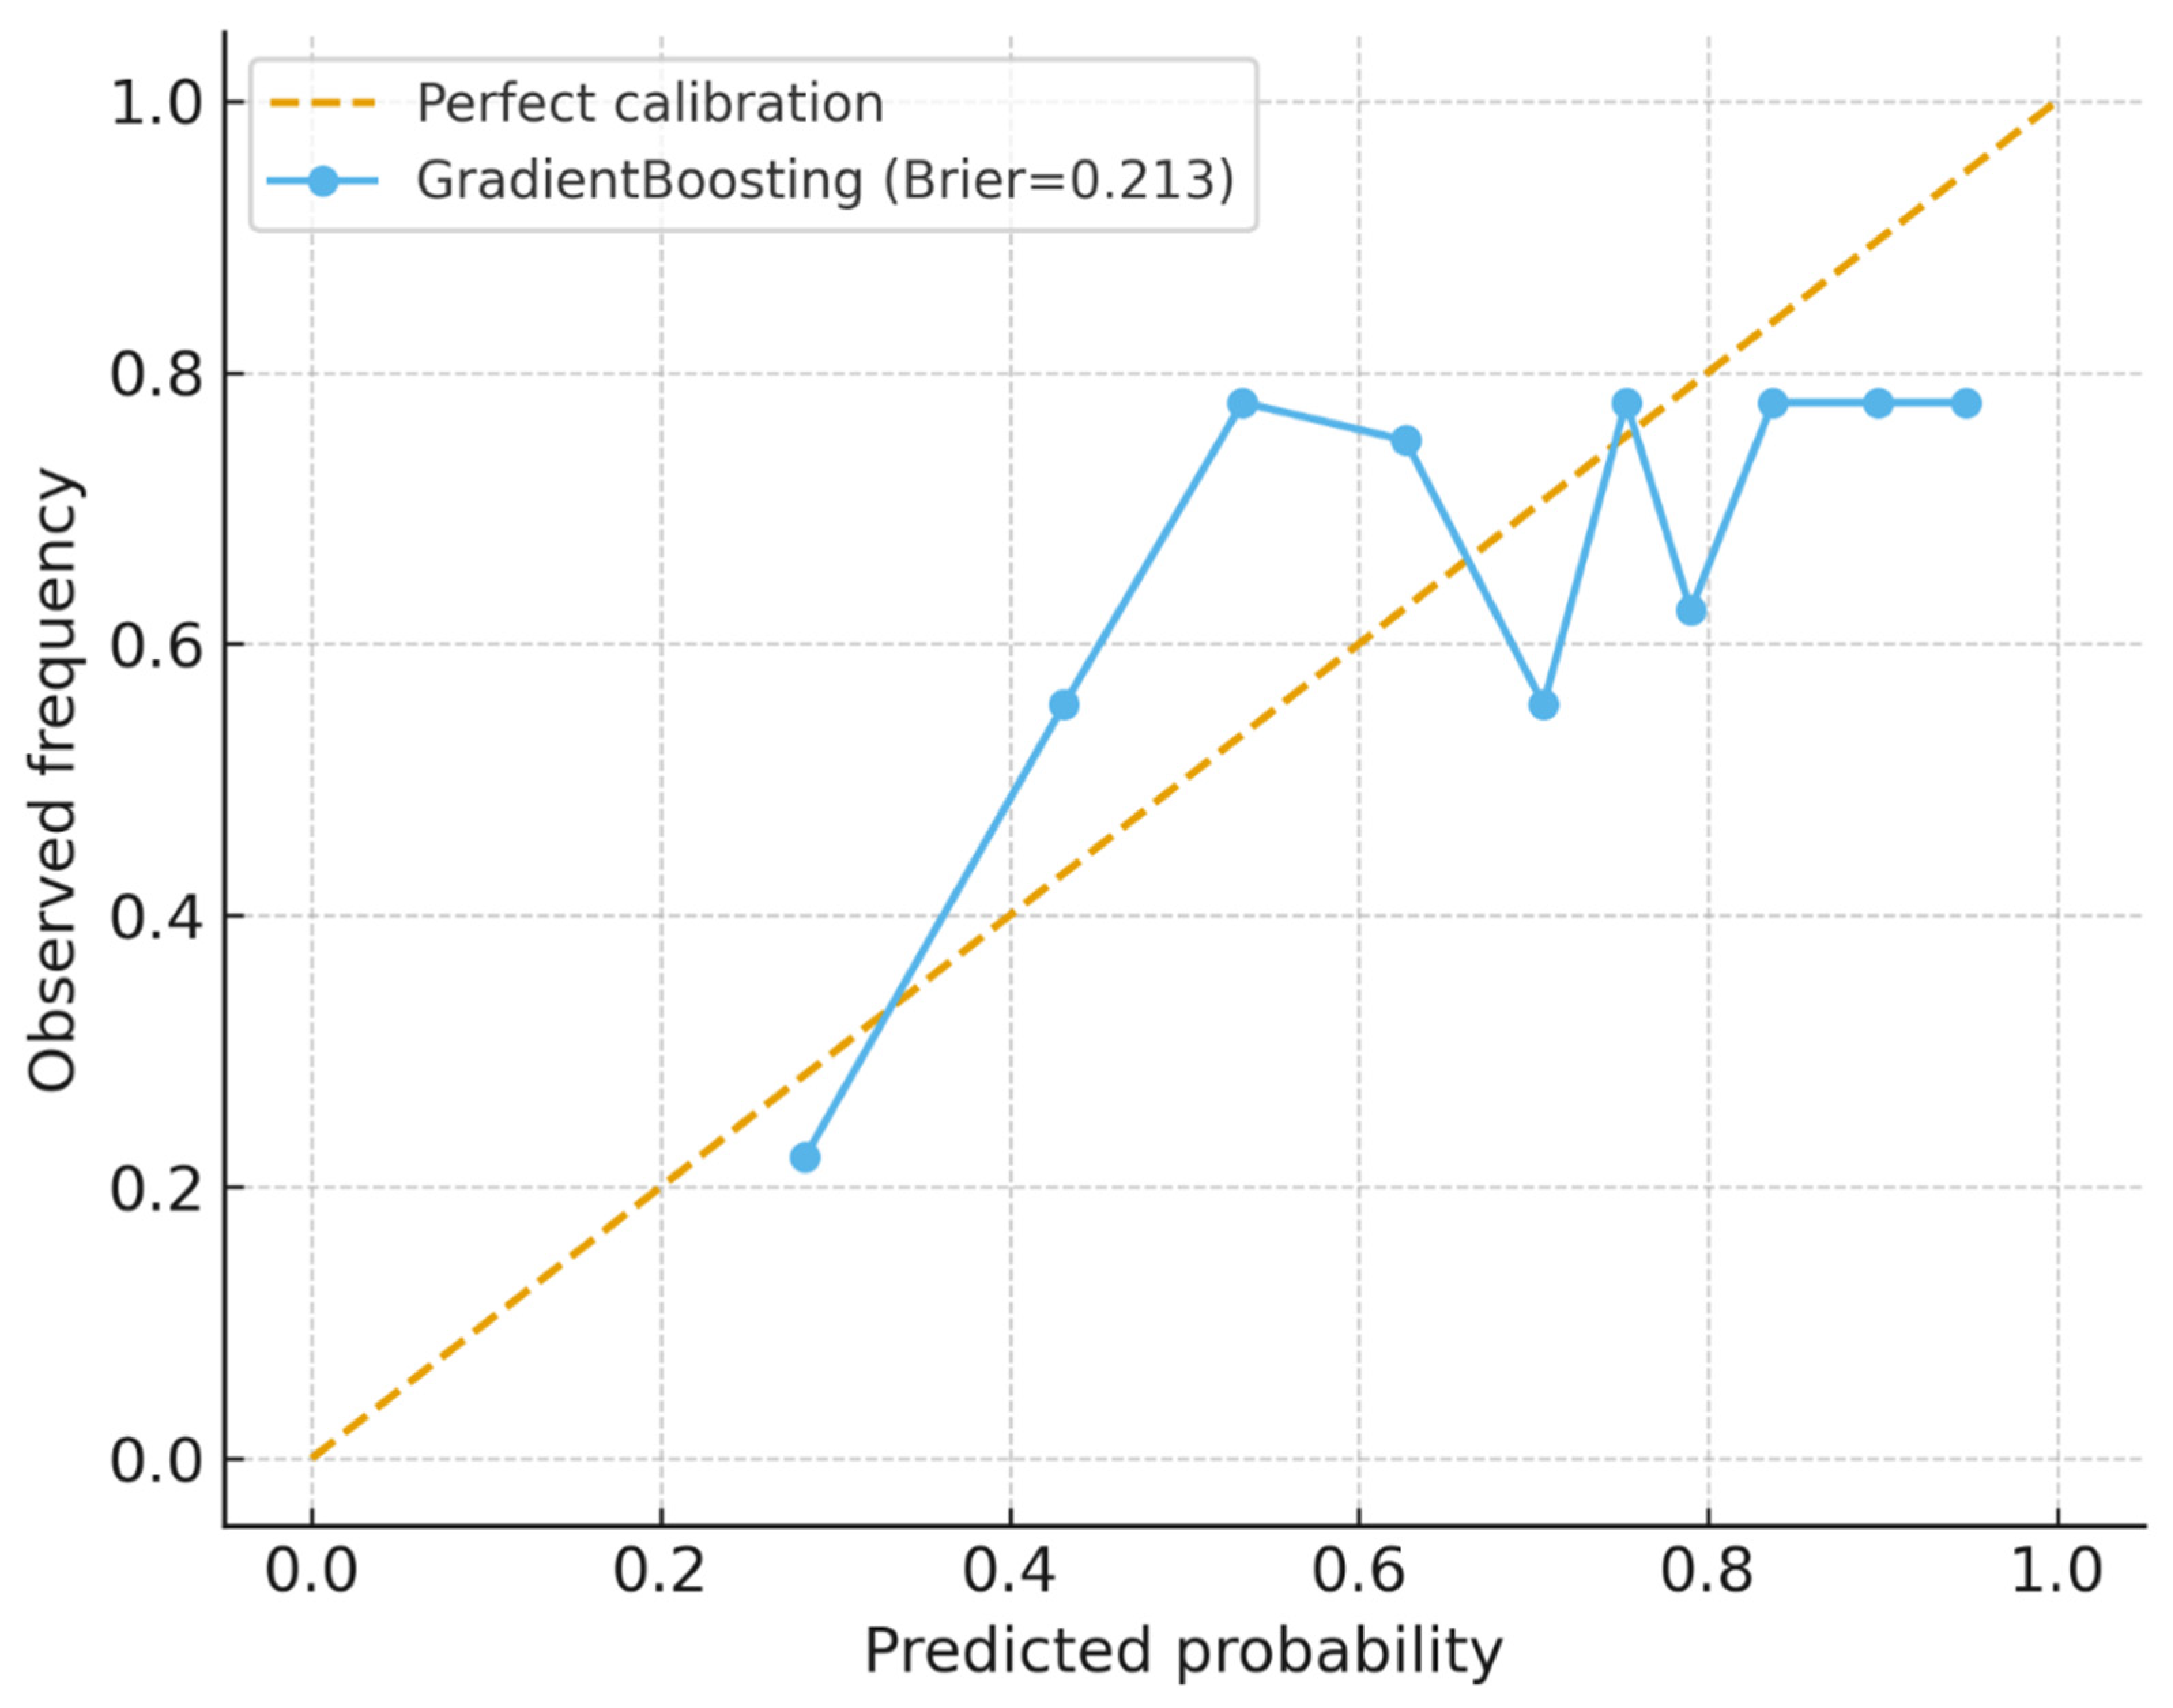
Figure 10.
Decision-curve analysis comparing the model with treat-all and treat-none strategies. The model yielded greater net clinical benefit within probability thresholds of 0.2–0.6, supporting its utility for preventive therapy prioritization.
Figure 10.
Decision-curve analysis comparing the model with treat-all and treat-none strategies. The model yielded greater net clinical benefit within probability thresholds of 0.2–0.6, supporting its utility for preventive therapy prioritization.
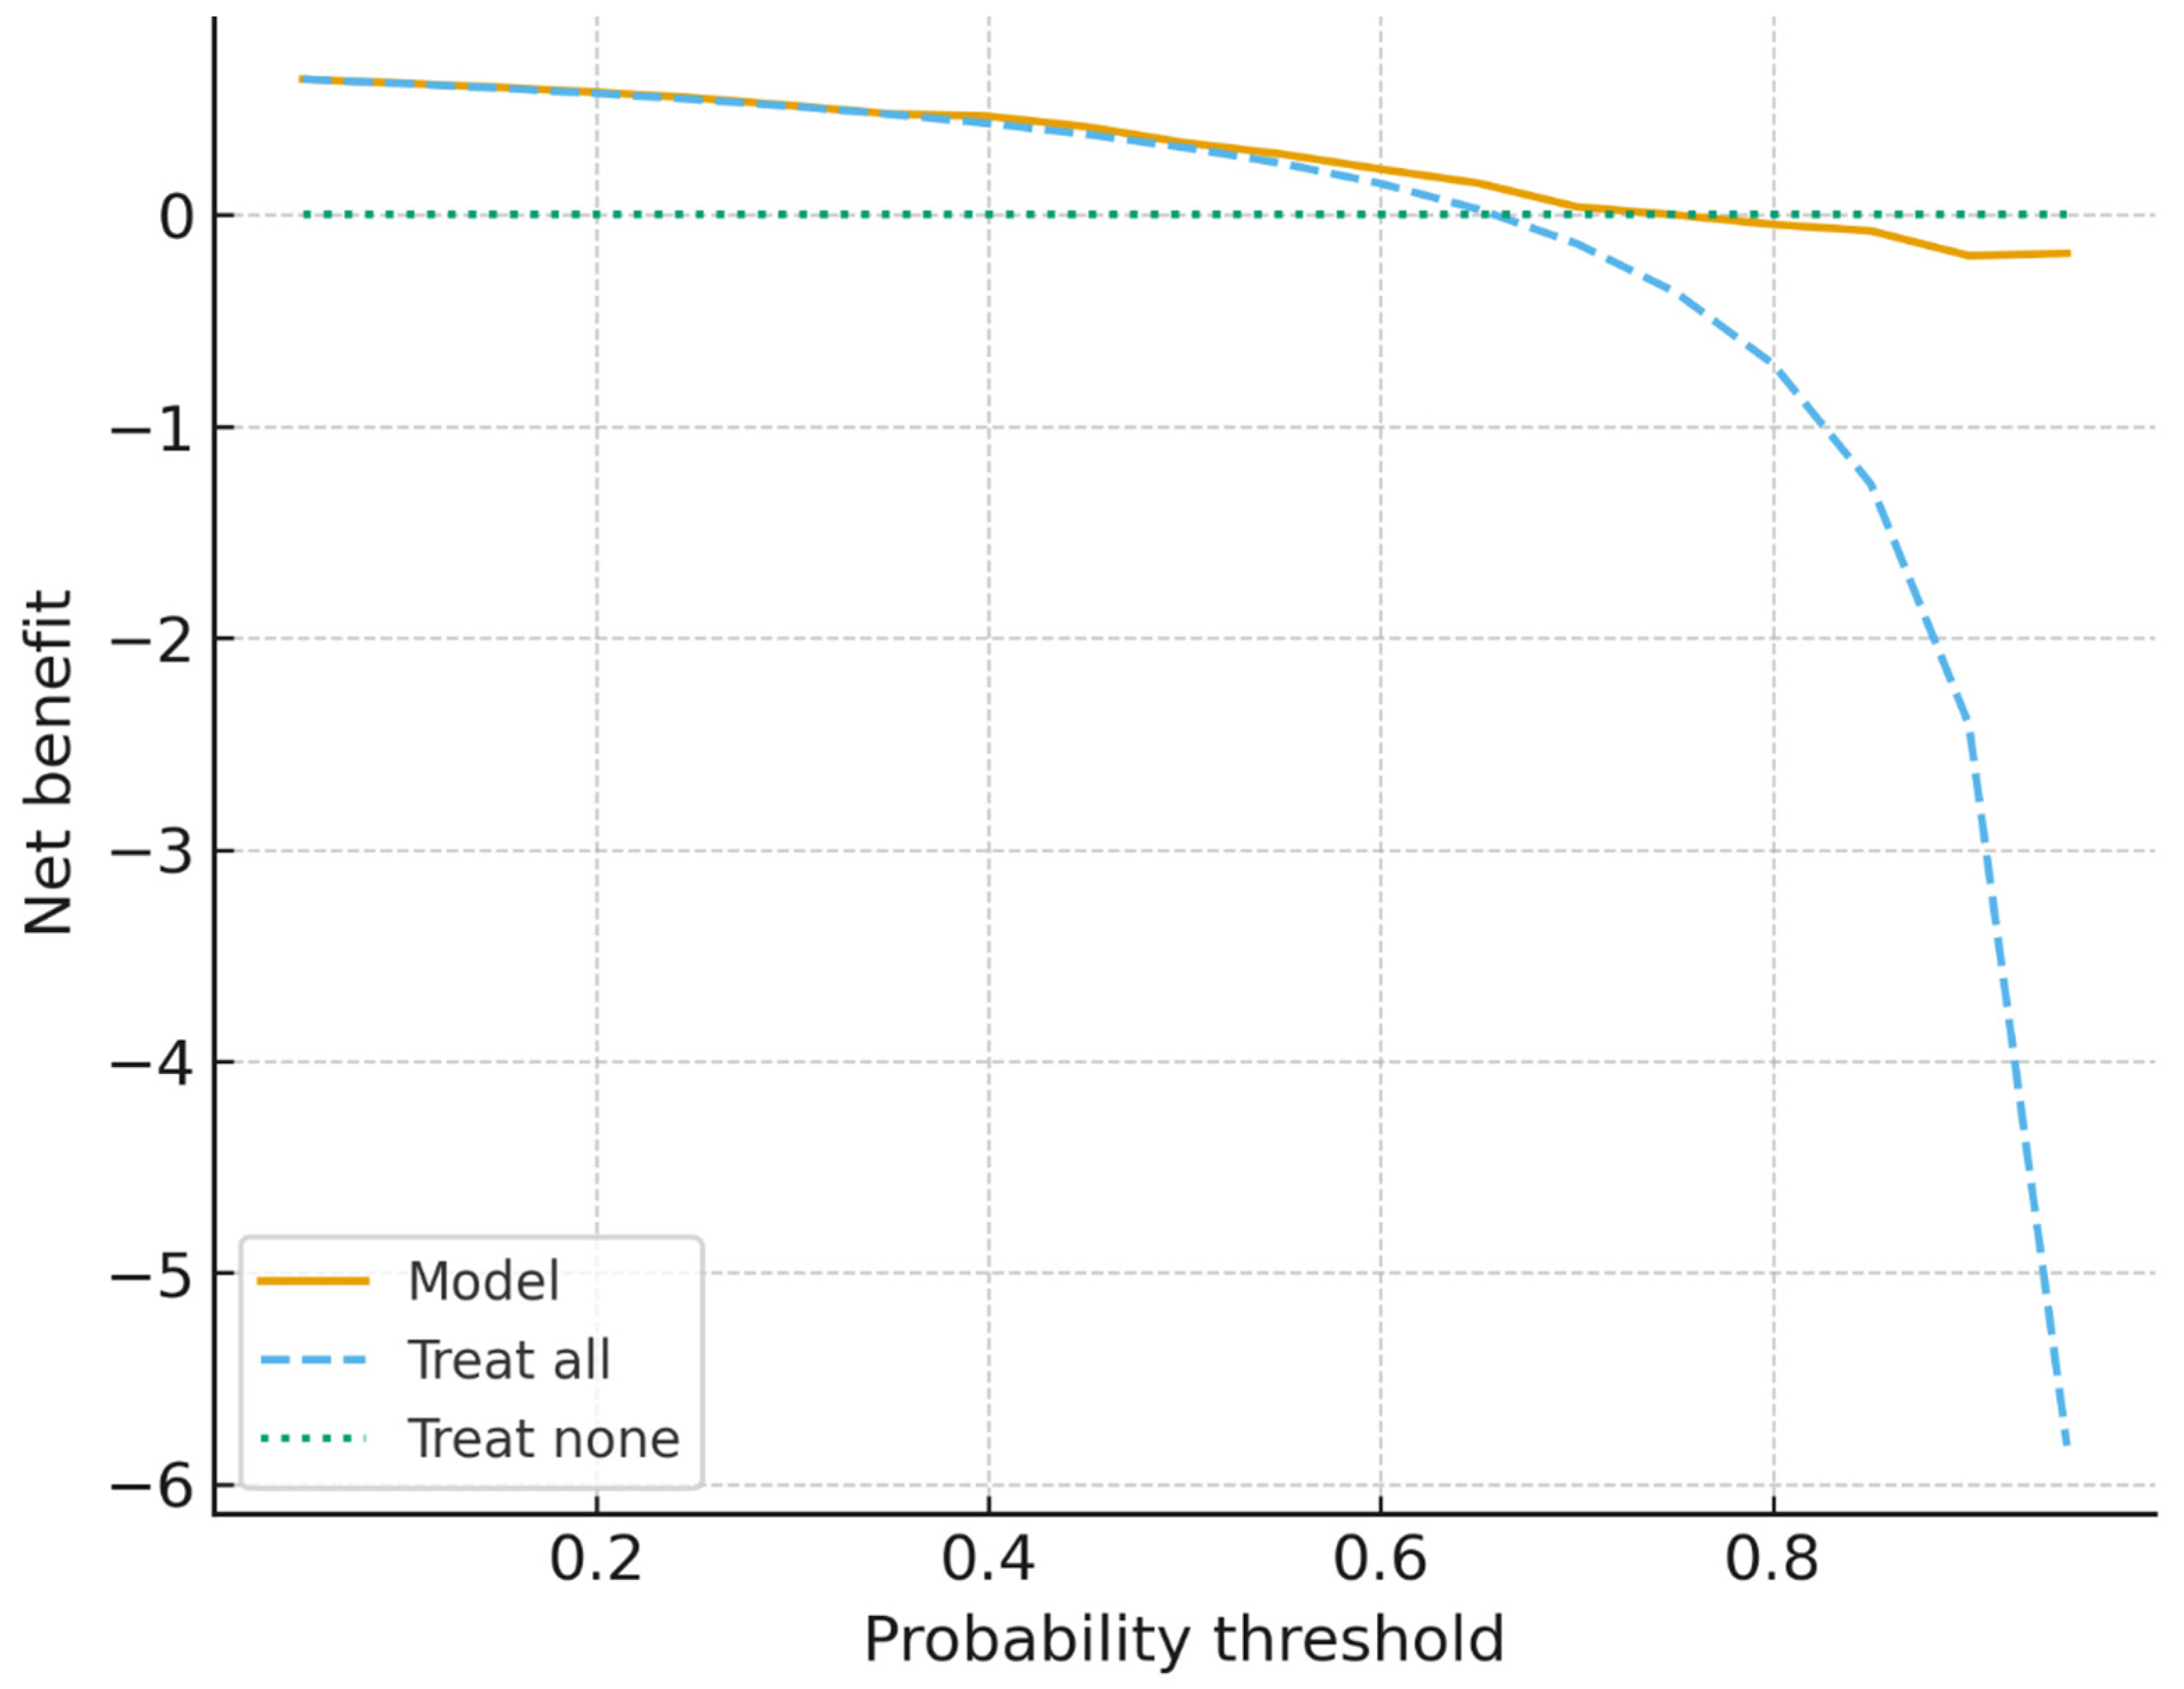
Table 2.
Cross-validated performance (5-fold).
| Model | AUROC (mean±sd) | AUPRC (mean±sd) | Accuracy (mean±sd) | F1 (mean±sd) |
| LogisticRegression | 0.572 ± 0.034 | 0.716 ± 0.040 | 0.666 ± 0.007 | 0.799 ± 0.004 |
| RandomForest | 0.632 ± 0.031 | 0.753 ± 0.018 | 0.634 ± 0.027 | 0.732 ± 0.029 |
| GradientBoosting | 0.657 ± 0.052 | 0.785 ± 0.042 | 0.675 ± 0.026 | 0.776 ± 0.024 |
Disclaimer/Publisher’s Note: The statements, opinions and data contained in all publications are solely those of the individual author(s) and contributor(s) and not of MDPI and/or the editor(s). MDPI and/or the editor(s) disclaim responsibility for any injury to people or property resulting from any ideas, methods, instructions or products referred to in the content. |
© 2025 by the authors. Licensee MDPI, Basel, Switzerland. This article is an open access article distributed under the terms and conditions of the Creative Commons Attribution (CC BY) license (http://creativecommons.org/licenses/by/4.0/).
Copyright: This open access article is published under a Creative Commons CC BY 4.0 license, which permit the free download, distribution, and reuse, provided that the author and preprint are cited in any reuse.


