
Submitted:
21 December 2025
Posted:
22 December 2025
You are already at the latest version
Abstract
Background Force plate–derived measures are increasingly used to assess performance and monitor musculoskeletal injury (MSKI) risk, yet the mechanisms connecting jump-mechanics patterns to injury risk remain unclear, particularly when using proprietary, algorithmically derived risk scores. Clarifying these relationships is important for improving screening practices, training design, and load management in athletic populations. Methods A total of 233 collegiate athletes completed countermovement vertical jump (CMVJ) testing on a commercial force plate that produced 26 force-time variables and proprietary composite metrics. LASSO regression identified influential predictors of CMVJ height and MSKI risk, and Partial Least Squares (PLS) models characterized multivariate patterns across performance-, control-, and stability-related variables. Sex-stratified analyses and post-hoc modeling examined potential mechanisms. Results Higher MSKI risk was associated with a coordinated pattern of greater concentric output, including higher power, velocity, and impulse, combined with reduced braking capacity. Braking rate of force development (Load) showed a strong inverse association with MSKI risk across sexes, and females in the elevated-risk category displayed significantly lower braking values. Postural control measures contributed differently by sex. PLS models indicated that both CMVJ height and MSKI risk reflected interactions among multiple variables, while proprietary composite scores showed inconsistent alignment with mechanistic predictors. Conclusion Multivariate force-time profiling offers practical value for identifying athletes whose high-output movement strategies may elevate injury risk when braking control is insufficient. Because proprietary, algorithmically derived risk metrics show inconsistent associations with underlying mechanics, further independent validation is needed before such scores are used in clinical or training decisions.
Keywords:
force plates
; countermovement vertical jump
; injury risk
1. Introduction
Musculoskeletal injuries are highly prevalent among college athletes (1). Over time, research has demonstrated the reliability and validity of the countermovement vertical jump (CMVJ) in assessing lower-body performance and is routinely used by strength and conditioning coaches, as well as sports scientists (2). Vertical jumping assessment is an essential aspect of athletic performance and is linked to success in sports involving lower-body explosiveness, such as basketball, volleyball, and football. It is also associated with performance factors, such as strength, speed, and agility (3). CMVJ performance can be measured using various tools, including contact mats, force plate platforms, accelerometers, high-speed cameras, and infrared platforms, all of which have been shown to provide valid and reliable measures of CMVJ performance (2).
Recent technological advances have led to the development of commercially available force plates that are increasingly used and studied in sports and military environments (4). Commercial force plates that provide force-time curve variables are often used to monitor neuromuscular fatigue and to manage workloads throughout training cycles or sport seasons (5,6). Force plates are generally considered the gold standard for assessing CMVJ performance, providing essential measures such as the reactive strength index (RSI) or the modified reactive strength index (mRSI), which are associated with lower-body performance and sports injuries (7-9). RSI is a measure used to evaluate an individual’s ability to transition from an eccentric to a concentric contraction rapidly, often used to monitor, assess, and reduce the risk of injury in athletes (10). Maximal strength, especially relative to body mass, appears to have a strong relationship with RSI, indicating that stronger athletes tend to have better reactive strength (10). Evidence suggests interlimb RSI asymmetries during the drop jump may better predict future injury than vertical jump height alone (8,9). Inter-limb asymmetry may increase the risk of injury in sports, as the stronger leg may sustain excessive stress due to greater reliance and loading. Conversely, the weak leg may be compromised to maintain even an average load (11). Furthermore, asymmetries may result in unequal force absorption or a loss of multi-plane stability, both of which are essential for sustaining the impacting forces (11).
The equipment and procedural demands of the drop jump test may limit its practicality for field-based assessment of jumping and landing function. In contrast, commercial force plates offer a more streamlined approach for evaluating deficits in lower-body function. However, studies utilizing CMVJ on a force plate to assess ground reaction forces in relation to injury are few (8). Some new force plate systems attempt to quantify injury risk by deriving metrics from jump performances to create composite scores (12). For example, the Sparta Science force plate platform provides multifaceted, proprietary performance metrics derived from the force-time curve. The Sparta Score is a composite score algorithmically calculated from three proprietary metrics and their balance, including Load (the average braking rate of force development), Explode (the average relative vertical concentric force), and Drive (the average relative vertical concentric impulse). Higher Sparta scores indicate a better balance between the component measures (4). Sparta Force Plate also provides an MSKI risk category based on the musculoskeletal health score, where higher scores indicate lower injury risk (4).
Given the novelty of this emerging technology and the increasing likelihood of widespread adoption, more research is needed to clarify the relationships between force plate–derived metrics, proprietary composite scores, and injury risk, as data-driven insights may offer additional utility for coaches, athletes, and clinicians. Moreover, given the large number of measures generated by commercial force plates such as the Sparta system, systematic methods for filtering and identifying the most relevant predictors of injury risk and vertical jump performance should be further explored. Therefore, the objectives of this study were to: (1) demonstrate methods for filtering force plate measures based on their predictive importance for CMVJ height and MSKI risk category in male and female athletes; (2) evaluate the contribution of algorithmically derived composite scores to the prediction of CMVJ performance and MSKI risk; and (3) analyze patterns in Sparta force plate measures associated with elevated MSKI risk and CMVJ height.
2. Materials and Methods
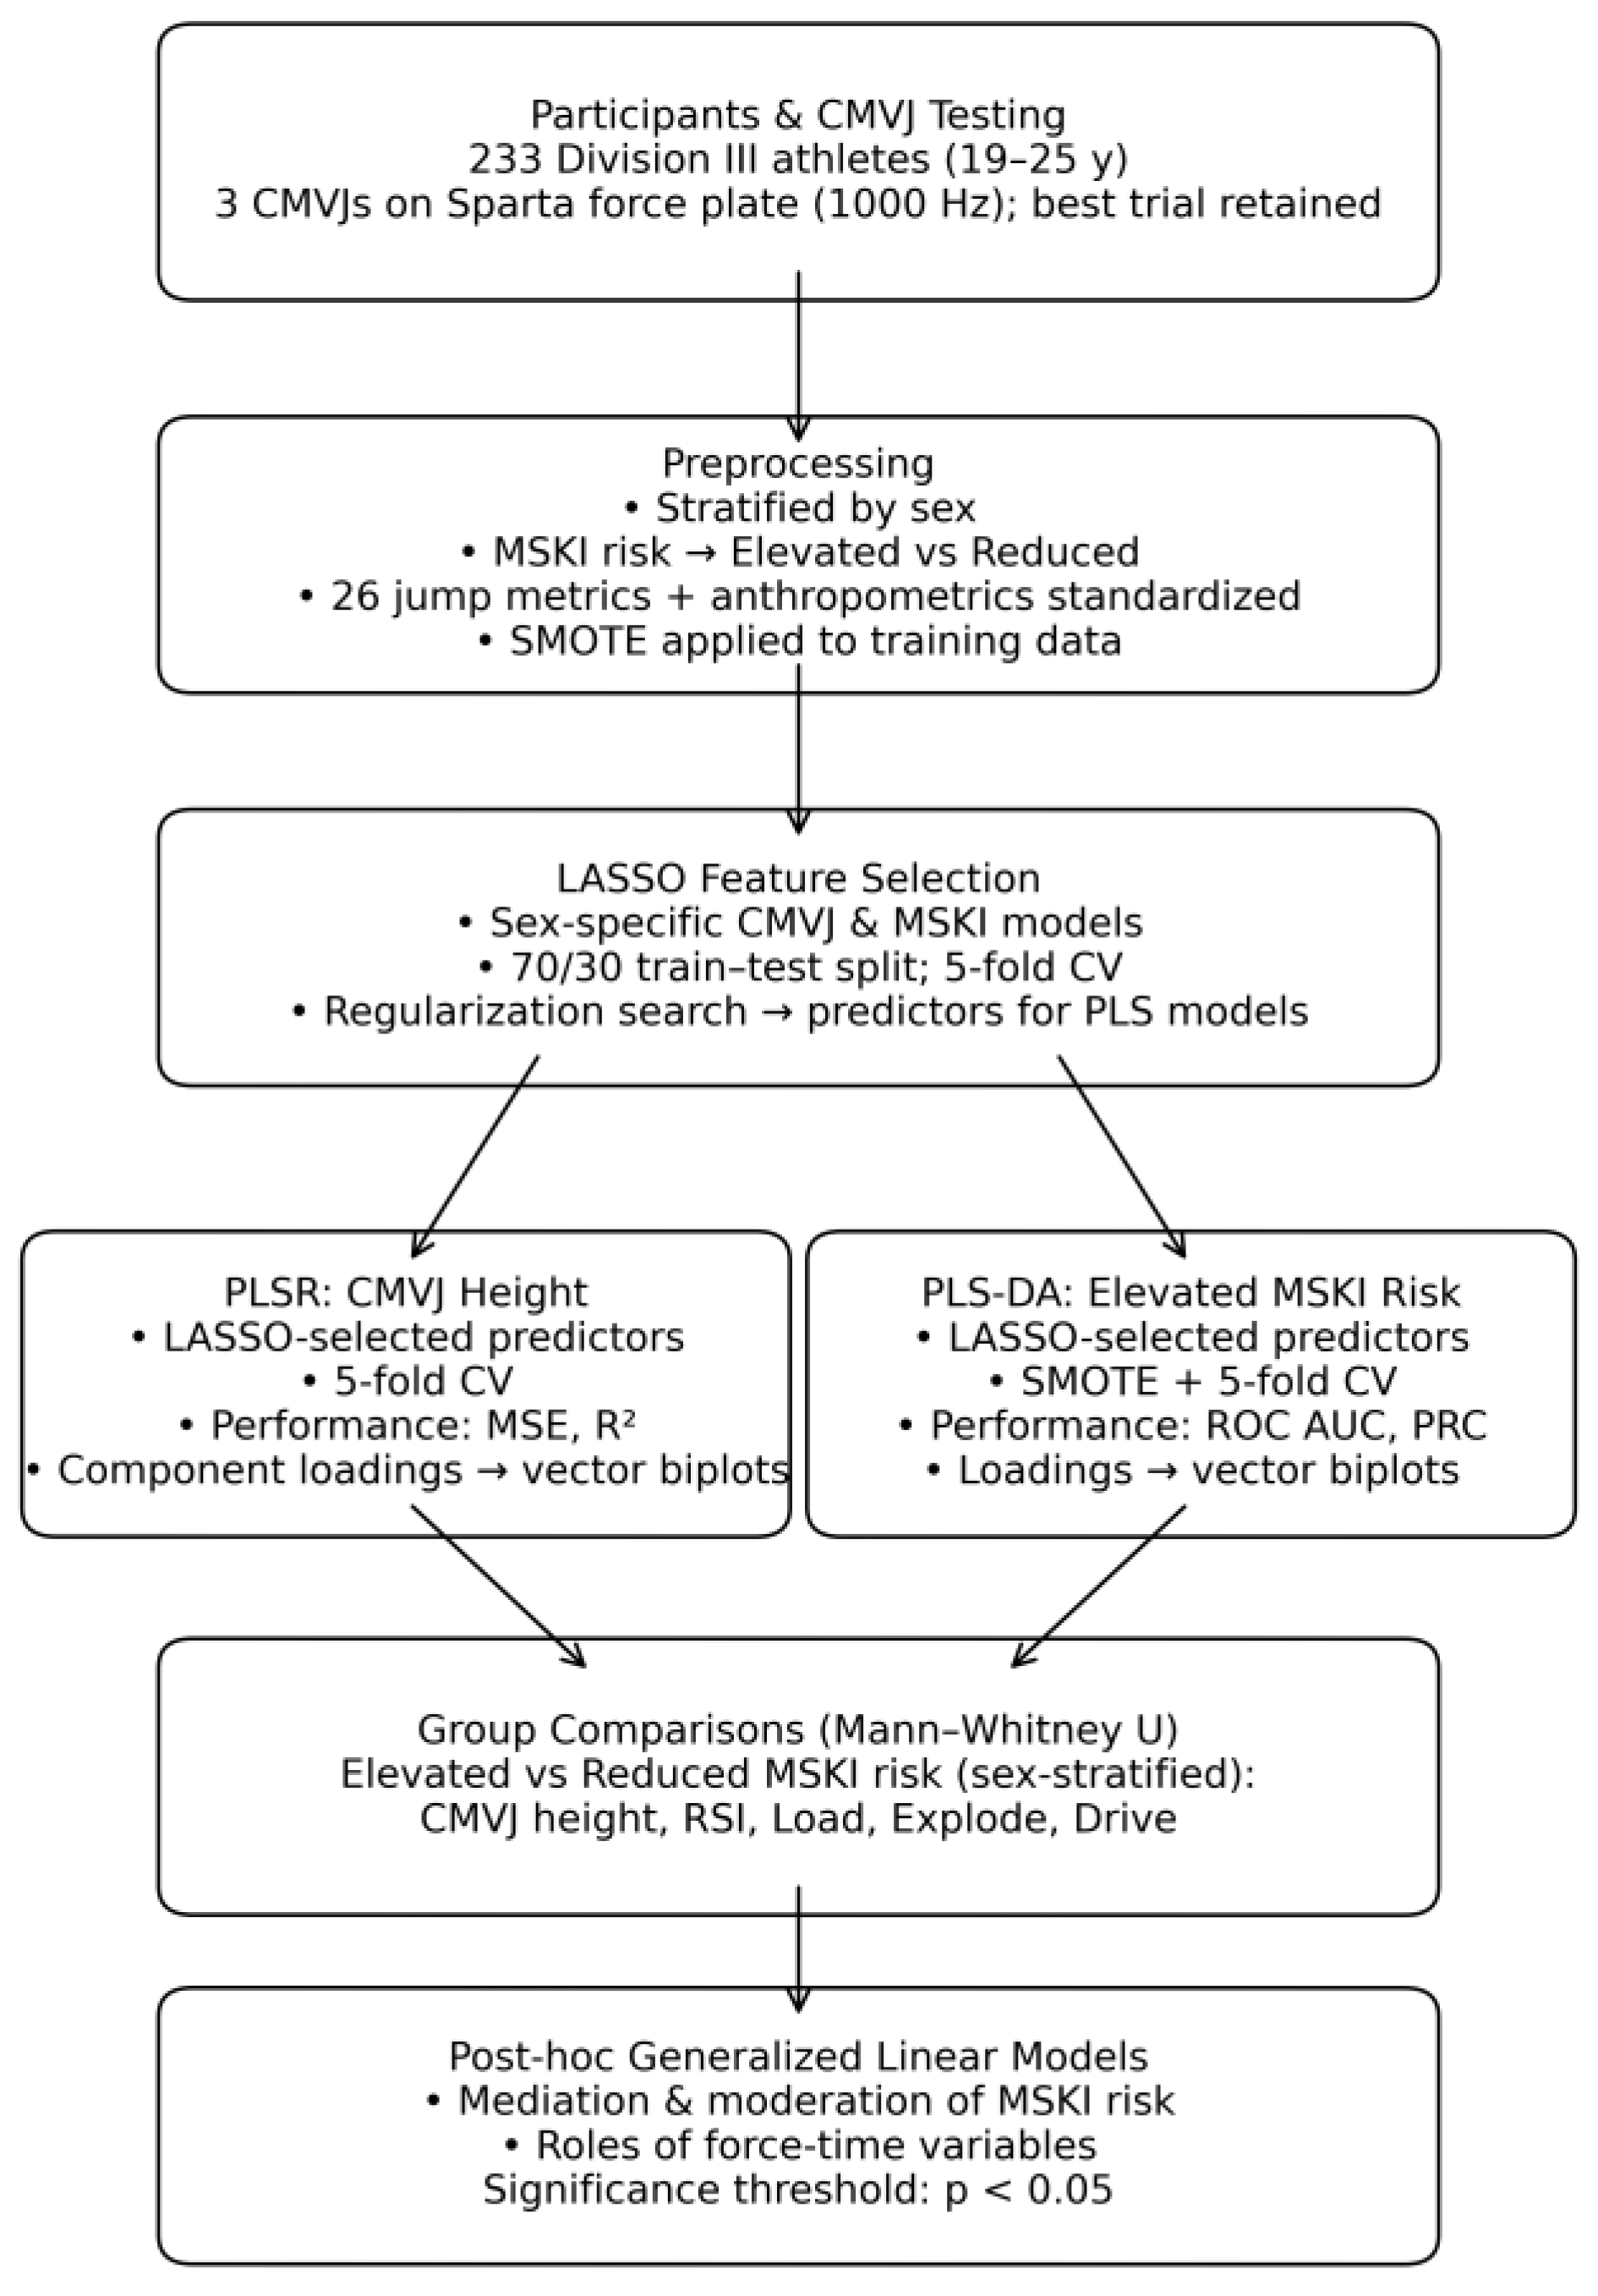
This secondary analysis of 233 Division III collegiate athletes included male (n=132) and female athletes (n=101) between the ages of 19 and 25 years from 11 different sports who participated in a single testing session. Athletes were included if they were free of injury, had no other contraindications to exercise, and were medically cleared to participate. Each participant performed 3 CMVJs on the Sparta Force plate at a sampling frequency of 1000 Hz, with a minimum of 30 seconds between trials (Sparta Science, v1.9.31; Sparta Software Corp, San Francisco). The best trial was retained for analysis. All data were de-identified and extracted by the sports medicine team after completion of team physicals. This study was reviewed, deemed exempt under 45 CFR 46.104(d)(4)(ii), and approved by the college’s Institutional Review Board (IRB # 24-081506).
2.1. Statistical Analyses
Statistical analysis was conducted using IBM SPSS Statistics (Version 30; Armonk, NY: IBM Corp) and Python (Version 3.13.5; Delaware, USA: PSF). Normality was tested using the K-S test (p<0.05), and descriptive statistics were presented as standardized scores.
Before the analysis, the dataset was stratified by sex. Algorithmic injury risk categories were condensed into a dichotomous variable: Elevated Risk and Reduced Risk. “High”, “Average”, and “Above Average” risk categories were grouped as “Elevated Risk,” while “Below Average” and “Low” risk categories were grouped as “Reduced Risk.” To account for strong predictor relationships, feature selection was performed using LASSO models, which were separately fitted for each outcome and sex. The LASSO algorithm was trained and tested on 70% and 30% of the data, respectively. Twenty-six different jump measures, provided as output measures from the Sparta force plate platform, along with height, weight, body mass index (BMI), and age, were standardized using parameters derived from the training set and then applied to training sample splits and test data. The Synthetic Minority Oversampling Technique (SMOTE) was used to balance the MSKI risk classes in the training dataset. LASSO models were optimized via 5-fold cross-validation on a predefined regularization grid. Robust feature selection was conducted separately for CMVJ and MSKI risk categories. CMVJ model performance was evaluated using mean squared error (MSE) and R2. Whereas the MSKI risk model was assessed using the receiver operating characteristic area under the curve (ROC AUC) and precision-recall curve (PRC).
2.2. Differences in Derived Measures
Differences between Elevated and Reduced MSKI risk for CMVJ, RSI, and across Sparta force plate-derived measures (Load, Explode, and Drive) were analyzed separately for males and females using the Mann-Whitney U test (p<0.05).
2.3. Partial Least Squares – Discriminant Analysis
Due to the high number of predictors and the potential for high collinearity, pattern analysis for the elevated MSKI risk category, as determined by the Sparta force plate algorithm, was conducted using Partial Least Squares Discriminant Analysis (PLS-DA) with 5-fold cross-validation. PLS-DA is a supervised learning method that projects samples into a new space defined by latent variables (linear combinations of the original predictors) optimized for class separation. Pattern analysis was also performed for CMVJ height using Partial Least Squares Regression (PLSR) with 5-fold cross-validation. Both the PLS-DA and PLSR models were refit using only the LASSO-selected features, and SMOTE was applied to the LASSO-selected PLS-DA model before cross-validation. Vector biplots were generated to visualize the relative contributions of each predictor to both CMVJ height and elevated MSKI risk, as quantified by their loadings from the PLSR and PLS-DA, respectively.
2.4. Post-Hoc Analyses
Following the primary analyses, generalized linear modeling was conducted to examine further potential mechanisms underlying the relationships among force plate variables and MSKI risk. Mediation and moderation analyses were performed to test whether the force-time curve variables served compensatory or efficiency-based roles in modulating MSKI risk. Significance was set to p<0.05.
Figure 1.
Data Processing and Analytical Workflow.
3. Results
3.1. Injury Risk
A total of 53 (23%) athletes were classified as having elevated injury risk. Of those in the elevated risk category, 31 were male (58%), and 22 were female (42%). In males, CMVJ, Drive, Explode, RSI, mRSI, and the Sparta Score were significantly higher in the Elevated-risk group (p < 0.01) (Table 1). Similarly, in females, CMVJ, Drive, RSI, and mRSI were significantly higher in the Elevated-risk group (p ≤0.01). However, Load was significantly lower in the female Elevated-risk group. There were no significant differences for Load in males, or for Explode and the Sparta Score in females.
Lasso Logistic Regression retained 28 measures for females and 22 measures for males (Table 2). In the male model, coefficients for height, average maximum force, unweighting time, time to take off, Explode, antero-posterior center of pressure (COPy) unweighting displacement, mRSI, and Sparta Score were reduced to zero, suggesting low relevance for predicting risk category. In the female model, fewer predictors were eliminated, which included height and unweighting time.
ROC curve analysis demonstrated excellent discrimination (AUC 0.96 in males and females) and accuracy (PRC Males: 0.93; PRC Females: 0.88) in both males and females (Figure 2). The PLS-DA models achieved 80% accuracy and similar precision in males (0.53) and females (0.54), although recall was slightly higher in females (1.00) than in males (0.89). In males and females, respectively, the first two PLS-DA components explained 38% and 30% of the variance across component predictors and 70% and 53% of the variance in elevated injury risk (Table 3).
3.2. PLS-DA Models
PLS-DA showed slight differences between sexes in Component 1 loadings. In males, jump height, concentric impulse (Drive), maximum velocity, and maximum power had the largest positive loadings on component 1 (Figure 3). COPy sway velocity, BMI, and average braking RFD (Load) had the largest negative loadings. In females, concentric impulse (Drive), jump height, maximum velocity, and counter-movement depth had the most substantial positive loadings. At the same time, COPy eccentric displacement, Load, and BMI had the most substantial negative loadings (Figure 3). Scatterplots of the first two PLS-DA components revealed substantial separation between Elevated- and Reduced-risk subjects, particularly along Component 1, with Elevated-risk individuals clustering at higher Component 1 scores (Figure 3). This pattern was consistent in both the male and female cohorts.
3.3. CMVJ Height
Lasso Regression retained 23 measures for males (R2 = 0.987; MSE = 0.007) and 26 measures for females (R2 = 0.99; MSE = 0.002) (Table 2). In the male model, coefficients for age, Drive, concentric time, time to take-off, COPy unweighting displacement, and BMI were reduced to zero, suggesting low importance in predicting CMVJ. While in females, eccentric impulse, eccentric time, and Explode were reduced to zero.
In the PLSR, the first two components explained 38% and 32% of the variance across the two component predictors and 96% and 97% of the variance in CMVJ height in males and females, respectively (Figure 4).
In males, the top positive loadings on Component 1 included concentric impulse (Drive), maximum velocity, maximum power, mRSI, and relative concentric force (Explode). The top negative loadings included concentric time, BMI, time-to-take-off, and COPx (mediolateral) unweighting displacement. In females, the top positive loadings on Component 1 included concentric impulse (Drive), maximum velocity, RSI, maximum power, and mRSI. Whereas the top negative loadings included BMI, concentric time, time-to-take-off, and COPy unweighting displacement.
Figure 5 shows the top 10 predictors, ranked by combined importance vector, and patterns of association for each outcome (MSKI risk and CMVJ). In males, most predictors had a balanced association with higher CMVJ and elevated injury risk. Load and COPy sway velocity were associated with lower MSKI risk and higher CMVJ, and BMI was associated with lower MSKI and lower CMVJ risk. As in males, many predictors in the female cohort showed a balanced association with higher CMVJ and elevated injury risk. However, BMI, COPy eccentric displacement, and COPy unweighting displacement had a more balanced association between lower MSKI risk and lower CMVJ. Load was associated with lower MSKI risk and higher CMVJ height.
3.4. Male Post Hoc Effects
Braking RFD (Load) exhibited a significant inverse association with injury risk (β = −1.13, p = 0.002). Load was also positively associated with jump power, which strongly predicted higher injury risk, yielding a significant positive indirect effect (β = 0.46, 95% CI [0.03, 0.96]). The Load × Power interaction was not significant.
COPy sway velocity demonstrated a significant inverse association with injury risk (β = −0.72, p = 0.037). The indirect effect via power was positive but not statistically significant (β = 0.29, 95% CI [0.08, 0.72]). No significant interaction with power was observed.
BMI showed no significant direct (β = 0.47, p = 0.086) or interaction effects (β = −0.25, p = 0.25) with MSKI injury risk. BMI was negatively associated with jump power, and because power predicted higher risk, BMI produced a significant protective indirect effect (β = −0.66, 95% CI [−1.22, −0.22]).
The Sparta Score showed a nonsignificant direct association with injury risk (β = 0.75, p = 0.09) but was positively associated with jump power, resulting in a significant positive indirect effect (β = 1.09, 95% CI [0.57, 1.83]). No significant moderation of the power–risk association was detected.
3.5. Female Post Hoc Results
COPy eccentric displacement showed no significant direct (β = −0.21, p = 0.53) or interaction effects (β = −0.27, p = 0.41). The indirect effect was also nonsignificant (β = −0.21, 95% CI [−0.51, 0.02]).
BMI demonstrated no significant direct (β = 0.11, p = 0.68) or interaction effects (β = 0.01, p = 0.96). BMI was negatively associated with jump power, and this relation yielded a significant protective indirect effect (β = −0.34, 95% CI [−0.72, −0.04]).
Braking RFD (Load) exhibited a significant negative direct effect on injury risk (β = −4.14, p < 0.001). A significant Load × Power interaction was observed (β = 2.24, p = 0.008), though the indirect effect was not significant (β = 0.25, 95% CI [−0.12, 0.65]).
The Sparta Score demonstrated no significant direct effect (β = −0.44, p = 0.057) but was strongly associated with jump power, producing a significant positive indirect effect (β = 0.61, 95% CI [0.26, 1.08]). The interaction with power was not statistically significant.
4. Discussion
In this investigation, we analyzed performance and injury risk profiles, and sex differences in force-time curve variables that predict CMVJ height and algorithmically derived MSKI risk using a commercial force plate. In this mixed-sport cohort of males and females, there appears to be a trade-off between power and MSKI risk. This conflicts with a recent analysis that reported an association between higher MSKI risk and lower CMVJ, performed within 3 months before injury (13). However, a recent systematic review questions the predictive value of jump performance measures for injury (8), finding that only 30% of studies using jump height measures showed an association with injury risk. Whereas 89% of the studies using kinetic and/or kinematic measures found associations with injury. Taken together, jump height or power alone might not be optimal for predicting injury risk.
The Sparta Score is calculated by factoring Load, Explode, and Drive, and the balance among these measures (4), which assumes the importance of this metric for jump height and MKSI risk. Few studies are available, although some suggest limited utility in using algorithmically derived composite scores (14). In a retrospective military trainee cohort study, no significant associations were found between composite scores (Sparta Score and MSK Health score) and increased MSKI risk, despite excellent test-retest reliability (4). Moreover, there were no significant associations between injury rate and vertical jump, or proprietary component scores, including Load, Explode, and Drive. In contrast, a prospective study in a similar cohort found a significant association between the MSK Health score and an increased injury rate (12). No associations were found for the Sparta Score.
In contrast, a recent prospective study on the association between Sparta-derived metrics and ACL injury found significantly lower Explode values and significantly higher Drive values among those who sustained an ACL injury during the follow-up period after the CMVJ test (15). Furthermore, Load:Expode and lower Explode:Drive ratios were found for those who sustained an ACL injury, suggesting that the bivariate relationships among Load, Explode, and Drive may be valid predictors of injury. There were no significant differences between the injured and non-injured groups for Load. In contrast to the previous study, we found significantly higher values for Drive and Explode in the male and female elevated-risk groups. We also found significantly lower Load values in the female elevated-risk group.
In both males and females, lower braking rate of force development (Load) was an independent predictor of MSKI risk. Our findings are consistent with the mechanistic aspects of injury. Load (the average braking rate of force development) represents an athlete’s ability to adequately manage decelerative forces, which has implications for injury risk. Deficits in decelerative ability, as measured by ground reaction forces, are indicative of neuromuscular fatigue or maladaptive control strategies, which expose the lower limbs to greater mechanical loads and heighten the risk of tissue failure (16).
Our findings support a recent analysis reporting a paradoxical relationship in which increases in vertical jump were associated with significantly lower values for Sparta’s proprietary MSK Health Score. This contradicts the conventional understanding of the injury-protective effect of greater power and strength and further questions the validity of Sparta’s algorithmically derived injury risk metric (14). Alternatively, higher MSKI risk scores may be the result of the strong association between power and Load, with relatively higher Load values decreasing MSKI risk.
The PLS analysis revealed that dynamic balance and postural control variables, COPy sway velocity in males and COPy eccentric displacement in females, were inversely associated with MSKI risk, but only COPy sway velocity in males was significant. Evidence is mixed concerning the importance of postural sway in predicting injuries (17-20). Some studies utilizing standing postural sway error or functional assessments like the Y-Balance Test show increased ankle and knee injury risk with higher balance errors or lower Y-Balance scores (19-22). In general, however, functional assessments have been shown to lack discriminatory power, owing to the lack of anthropometric, sport, force, kinematic, and workload measures (21). The discrepancies between our findings and the extant literature might be due to differences in how postural sway is measured or due to the test’s sensitivity relative to the population of interest, the movement/sport context, or the region of injury (21).
Additionally, many studies have shown that differences in postural control and balance performance are attributable to sport-specific training adaptations, sport- and activity-specific experience, or overall physical activity rather than to neuromuscular proficiency alone (23). For example, one study involving 51 professional and youth soccer players found significant moderate correlations between dynamic and static balance performance, as measured by COP displacement (24). However, professional players exhibited a smaller sway area than players at lower levels of competition.
Other evidence suggests that phase-specific ground reaction force (GRF) characteristics during dynamic balance tasks are better at discriminating between high- and low-injury-risk groups. For instance, early-phase COP displacement during a dynamic balance test (shifting from a double-leg stance to a single-leg stance) was associated with an increased risk of non-contact ACL injury at 1-year follow-up, indicating an inability to overcome the initial perturbation caused by the dynamic task (25). Similarly, low mediolateral stability in the early phase and higher horizontal GRF in the later phase of stabilization during drop-jump landings were associated with a 4.4-fold increase in subsequent ankle sprain risk in elite soccer players (18). On the other hand, in activity-specific contexts where high perturbation is commonplace, such as trampoline events, elite athletes display higher COP sway and speed, but time-series entropy is lower than that of sub-elite athletes, suggesting more efficient motor control strategies (33). These studies, in conjunction with our results, indicate that not all postural excursions signal risk-increasing instability. Higher COP excursions may index a more adaptive strategy to dynamically stabilize or absorb loads during high-impact activities or may reflect context-specific experience.
Consistent with prior research, we found that BMI was inversely associated with CMVJ height and power (26). Although BMI attenuated the power-risk pathway, this effect should not be interpreted as a protective mechanism, due to the strong link between BMI and increased injury risk (27, 28). The connection between BMI and increased injury risk is multifactorial, as higher BMI is often indicative of lower fitness levels, greater susceptibility to injuries due to increased external loads, impaired neuromuscular coordination, and blunted adaptive responses (28). Excess fat tissue may also contribute to reduced explosive output by negatively impacting the efficiency of the stretch-shorten cycle via increased ‘dead’ mass, differences in viscoelastic properties between muscle and fat, and impaired muscle energy metabolism (29, 30).
Interestingly, RSI and mRSI were significantly lower in the Reduced-Risk group for both males and females. However, lower RSI values are typically associated with higher injury risk, as reported in prospective analyses (31,32). The conflict between our findings and those of previous studies may relate to differences in how RSI is derived. RSI and mRSI are commonly derived from drop jump performances in which participants initially jump from an elevated surface, land, and then immediately jump vertically. Drop jumps expose the lower body to greater decelerative forces when compared to a standard vertical jump test, which may be a crucial aspect of the drop jump test’s validity. More research is needed to clarify the importance of the drop jump test relative to other methods for deriving RSI.
5. Conclusions
This study sought to identify the multivariate jump-mechanics profiles most strongly linked to algorithmically derived musculoskeletal injury risk using a multi-stage analytic approach in which LASSO facilitated variable screening, and PLS provided the primary framework for interpreting the underlying structure of risk. By vectorizing PLS component scores from both the CMVJ and MSKI models, we were able to contextualize the relative importance of each biomechanical variable across outcomes. Collectively, the findings indicate that injury risk is not driven by any single jump characteristic, but rather by the interplay among performance-, control-, and stability-related factors. Although some individual predictors showed no significant univariate differences between injury-risk groups, the multivariate analyses revealed meaningful conditional effects that only became apparent when accounting for the shared variance among correlated CMVJ variables.
Athletes exhibiting higher jump-performance outputs, particularly those with greater concentric power, velocity, and related explosive metrics, consistently demonstrated elevated injury risk, suggesting that high mechanical output may impose greater demands on musculoskeletal tissues or reflect movement strategies that increase vulnerability. In contrast, braking-control capacity, indexed by the Load variable, showed a strong inverse association with injury risk despite its nonsignificant univariate group differences. This pattern emphasizes the protective value of eccentric control and force-modulation strategies, which may mitigate the risks associated with high-output movement profiles.
Taken together, these findings highlight the utility of multivariate modeling for capturing the complex biomechanical interactions that contribute to injury. Injury risk appears to emerge from the balance, or imbalance, between an athlete’s performance capacity and their ability to modulate and decelerate the forces they generate. Athletes who achieve greater jump heights and power outputs may be at heightened risk if not paired with sufficient braking and deceleration control.
Overall, although CMVJ-derived performance and braking-control metrics offer practical insights for training and injury-risk management, coaches and clinicians should interpret them cautiously in light of ongoing questions about the ecological validity and generalizability of algorithmically derived composite scores. Prioritizing validated, mechanism-based measures remains essential when developing interventions aimed at enhancing performance while reducing injury risk.
Author Contributions
Conceptualization: AE; Data curation: AE, PSG; Formal Analysis: AE; Investigation: AE; Methodology: AE; Project administration: PSG; Software: AE; Validation: AE; Visualization: AE; Writing – original draft: AE, PSG; Writing – review & editing: PSG.
Funding
None.
Institutional Review Board Statement
The study was conducted in accordance with the Declaration of Helsinki and approved by the Institutional Review Board of Kean University for studies involving humans (IRB #24-081506).
Informed Consent Statement
Informed consent was waived by the Kean University IRB in accordance with 45 CFR 46.104(d)(4)(ii) regarding secondary use of data for which consent is not required.
Data Availability Statement
We encourage all authors of articles published in MDPI journals to share their research data. In this section, please provide details regarding where data supporting reported results can be found, including links to publicly archived datasets analyzed or generated during the study. Where no new data were created, or where data is unavailable due to privacy or ethical restrictions, a statement is still required. Suggested Data Availability Statements are available in section “MDPI Research Data Policies” at https://www.mdpi.com/ethics.
Acknowledgments
None.
Conflicts of Interest
No conflicts of interest to declare.
Definitions
| CMVJ height (in). The maximal vertical displacement achieved during the countermovement jump. |
| Jump maximum change in acceleration (m/s³). The greatest instantaneous change in vertical acceleration recorded across the jump. |
| Eccentric impulse (Ns/kg). The total impulse generated during the eccentric (downward) phase of the jump, normalized to body mass. |
| Concentric impulse (Ns/kg; Drive). The total impulse generated during the concentric (upward) phase, normalized to body mass. |
| Maximum velocity (m/s). The peak vertical velocity attained during the concentric phase. |
| Average maximum force (N). The mean of the maximal vertical ground reaction forces recorded across the jump. |
| Maximum power (W/kg). The highest instantaneous power output generated during the concentric phase, normalized to body mass. |
| Unweighting time (s). The duration between movement initiation and the minimum force point that precedes downward acceleration. |
| Eccentric time (s). The total duration of the eccentric phase. |
| Concentric time (s). The total duration of the concentric phase. |
| Time to take-off (s). The elapsed time from movement onset to departure from the force plate. |
| Time to maximum acceleration (s). The time from movement initiation to the peak vertical acceleration. |
| Countermovement depth (m). The maximum downward displacement of the center of mass during the eccentric phase. |
| Average braking rate of force development (N/s; Load). The mean rate at which force increases during the eccentric braking phase. |
| Average relative concentric force (N/kg; Explode). The average concentric force output normalized to body mass. |
| COPx unweight displacement (m). Mediolateral center-of-pressure displacement during the unweighting phase. |
| COPy unweighting displacement (m). Anteroposterior center-of-pressure displacement during the unweighting phase. |
| COPx eccentric displacement (m). Mediolateral center-of-pressure displacement during the eccentric phase. |
| COPy eccentric displacement (m). Anteroposterior center-of-pressure displacement during the eccentric phase. |
| COPx sway velocity (m/s). The mean mediolateral sway velocity across the jump phases. |
| COPy sway velocity (m/s). The mean anteroposterior sway velocity across the jump phases. |
| Average landing rate of deceleration (m/s³). The mean rate at which vertical velocity decreases during landing. |
| Relative force at zero velocity (N/kg). The concentric force output at the instant center-of-mass velocity passes through zero. |
| Modified Reactive Strength Index (mRSI). A measure of explosive reactive ability calculated as jump height divided by ground-contact time. |
| Reactive Strength Index (RSI). A measure of plyometric performance calculated as flight time divided by ground-contact time. |
| Sparta Score. A composite score integrating Load, Explode, and Drive variables derived from Sparta’s proprietary force-plate algorithm. |
References
- Kelley, E.A.; Hogg, J.A.; Gao, L.; Waxman, J.P.; Shultz, S.J. Demographic Factors and Instantaneous Lower Extremity Injury Occurrence in a National Collegiate Athletic Association Division I Population. J. Athl. Train. 2023, 58, 393–400. [Google Scholar] [CrossRef]
- Li, Z.; Ma, W.; Zhang, L.; Zhu, W.; Xie, Q.; Sun, Y. The Validity and Reliability of the Force Plates and the Linear Position Transducer in Measuring Countermovement Depth and Velocity During Countermovement Jump. Sensors 2025, 25, 6542. [Google Scholar] [CrossRef]
- Whitmer, T.D.; Fry, A.C.; Forsythe, C.M.; Andre, M.J.; Lane, M.T.; Hudy, A.; Honnold, D.E. Accuracy of a Vertical Jump Contact Mat for Determining Jump Height and Flight Time. J. Strength Cond. Res. 2015, 29, 877–881. [Google Scholar] [CrossRef] [PubMed]
- Hando, B.R.; Scott, W.C.; Bryant, J.F.; Tchandja, J.N.; Angadi, S.S. The Use of Force Plate Vertical Jump Scans to Identify Special Warfare Trainees at Risk for Musculoskeletal Injury: A Large Cohort Study. Am. J. Sports Med. 2022, 50, 1687–1694. [Google Scholar] [CrossRef]
- Williams, C.; Sullivan, K.; Kim, C.; Winchester, L.J.; Fedewa, M.V. Using Force Plates to Monitor the Recovery of Vertical Jump Performance After Strenuous Exercise: A Systematic Review and Meta-Analysis. J. Funct. Morphol. Kinesiol. 2025, 10, 230. [Google Scholar] [CrossRef]
- Badby, A.J.; Ripley, N.J.; McMahon, J.J.; Mundy, P.D.; Comfort, P. Scoping review of methods of monitoring acute changes in lower body neuromuscular function via force plates. PLOS ONE 2025, 20, e0322820. [Google Scholar] [CrossRef] [PubMed]
- Jarvis, P.; Turner, A.; Read, P.; Bishop, C. Reactive Strength Index and its Associations with Measures of Physical and Sports Performance: A Systematic Review with Meta-Analysis. Sports Med. 2021, 52, 301–330. [Google Scholar] [CrossRef] [PubMed]
- Pedley, J.S.; Lloyd, R.S.; Read, P.J.; Moore, I.S.; Croix, M.D.S.; Myer, G.D.; Oliver, J.L. Utility of Kinetic and Kinematic Jumping and Landing Variables as Predictors of Injury Risk: A Systematic Review. J. Sci. Sport Exerc. 2020, 2, 287–304. [Google Scholar] [CrossRef]
- Ohji, S.; Aizawa, J.; Hirohata, K.; Ohmi, T.; Kawasaki, T.; Koga, H.; Yagishita, K. Relationship Between Single-Leg Vertical Jump and Drop Jump Performance, and Return to Sports After Primary Anterior Cruciate Ligament Reconstruction Using Hamstring Graft. Int. J. Sports Phys. Ther. 2024, 19, 1204–1215. [Google Scholar] [CrossRef]
- Rebelo, A.; Pereira, J.R.; Martinho, D.V.; Duarte, J.P.; Coelho-e-Silva, M.J.; Valente-dos-Santos, J. How to improve the reactive strength index among male athletes? A systematic review with meta-analysis. Healthcare 2022, 10, 593. [Google Scholar] [CrossRef]
- Guan, Y.; Bredin, S.S.D.; Taunton, J.; Jiang, Q.; Wu, N.; Warburton, D.E.R. Association between Inter-Limb Asymmetries in Lower-Limb Functional Performance and Sport Injury: A Systematic Review of Prospective Cohort Studies. J. Clin. Med. 2022, 11, 360. [Google Scholar] [CrossRef]
- Bird, M.B.; Koltun, K.J.; Mi, Q.; Lovalekar, M.; Martin, B.J.; Doyle, T.L.A.; Nindl, B.C. Predictive utility of commercial grade technologies for assessing musculoskeletal injury risk in US Marine Corps Officer candidates. Front. Physiol. 2023, 14, 1088813. [Google Scholar] [CrossRef] [PubMed]
- Merrigan, J.J.; Stone, J.D.; Kraemer, W.J.; Vatne, E.A.; Onate, J.; Hagen, J.A. Female National Collegiate Athletic Association Division-I Athlete Injury Prediction by Vertical Countermovement Jump Force-Time Metrics. J. Strength Cond. Res. 2024, 38, 783–786. [Google Scholar] [CrossRef] [PubMed]
- Butler, C.R.; Scott, W.C.; Hando, B.; Angadi, S.S. Algorithmic Audits in Sports Medicine: An Examination of the SpartaScience™ Force Plate System. Med. Sci. Sports Exerc. 2024, 57, 710–715. [Google Scholar] [CrossRef]
- Pontillo, M.; Hines, S.M.; Sennett, B.J. Prediction of ACL Injuries from Vertical Jump Kinetics in Division 1 Collegiate Athletes. Int. J. Sports Phys. Ther. 2021, 16, 156–161. [Google Scholar] [CrossRef]
- Harper, D.J.; McBurnie, A.J.; Santos, T.D.; Eriksrud, O.; Evans, M.; Cohen, D.D.; Rhodes, D.; Carling, C.; Kiely, J. Biomechanical and Neuromuscular Performance Requirements of Horizontal Deceleration: A Review with Implications for Random Intermittent Multi-Directional Sports. Sports Med. 2022, 52, 2321–2354. [Google Scholar] [CrossRef] [PubMed]
- Wang, H.-K.; Chen, C.-H.; Shiang, T.-Y.; Jan, M.-H.; Lin, K.-H. Risk-Factor Analysis of High School Basketball–Player Ankle Injuries: A Prospective Controlled Cohort Study Evaluating Postural Sway, Ankle Strength, and Flexibility. Arch. Phys. Med. Rehabilitation 2006, 87, 821–825. [Google Scholar] [CrossRef]
- Fransz, D.P.; Huurnink, A.; Kingma, I.; de Boode, V.A.; Heyligers, I.C.; van Dieën, J.H. Performance on a Single-Legged Drop-Jump Landing Test Is Related to Increased Risk of Lateral Ankle Sprains Among Male Elite Soccer Players: A 3-Year Prospective Cohort Study. Am. J. Sports Med. 2018, 46, 3454–3462. [Google Scholar] [CrossRef]
- Witchalls, J.; Blanch, P.; Waddington, G.; Adams, R. Intrinsic functional deficits associated with increased risk of ankle injuries: a systematic review with meta-analysis. Br. J. Sports Med. 2011, 46, 515–523. [Google Scholar] [CrossRef]
- Olli, K.; Mari, L.; Pekka, K.; Kathrin, S.; Tommi, V.; Tanja, K.; Jari, P.; Kati, P. Postural Control as a Risk Factor for Noncontact Anterior Cruciate Ligament Injury in Youth Female Basketball and Floorball Athletes. Scand. J. Med. Sci. Sports 2025, 35, e70081. [Google Scholar] [CrossRef]
- Eckart, A.C.; Ghimire, P.S.; Stavitz, J.; Barry, S. Predictive Utility of the Functional Movement Screen and Y-Balance Test: Current Evidence and Future Directions. Sports 2025, 13, 46. [Google Scholar] [CrossRef] [PubMed]
- Mason, J.; Kniewasser, C.; Hollander, K.; Zech, A. Intrinsic Risk Factors for Ankle Sprain Differ Between Male and Female Athletes: A Systematic Review and Meta-Analysis. Sports Med. - Open 2022, 8, 1–14. [Google Scholar] [CrossRef] [PubMed]
- Zemková, E.; Kováčiková, Z. Sport-specific training induced adaptations in postural control and their relationship with athletic performance. Front. Hum. Neurosci. 2023, 16, 1007804. [Google Scholar] [CrossRef]
- Pau, M.; Arippa, F.; Leban, B.; Corona, F.; Ibba, G.; Todde, F.; Scorcu, M. Relationship between static and dynamic balance abilities in Italian professional and youth league soccer players. Phys. Ther. Sport 2015, 16, 236–241. [Google Scholar] [CrossRef] [PubMed]
- Dingenen, B.; Malfait, B.; Nijs, S.; Peers, K.H.; Vereecken, S.; Verschueren, S.M.; Janssens, L.; Staes, F.F. Postural Stability During Single-Leg Stance: A Preliminary Evaluation of Noncontact Lower Extremity Injury Risk. J. Orthop. Sports Phys. Ther. 2016, 46, 650–657. [Google Scholar] [CrossRef]
- Atik, B.; Badilli, F.S. Is there any correlation between anaerobic performance and vertical jump height in female volleyball athletes? J. Bodyw. Mov. Ther. 2024, 40, 11–15. [Google Scholar] [CrossRef]
- Bi, W.; Yang, M.; Jiang, C. Causal effect of body mass index and physical activity on the risk of joint sports injuries: Mendelian randomization analysis in the European population. J. Orthop. Surg. Res. 2023, 18, 1–9. [Google Scholar] [CrossRef]
- Lan, W.; Shu, J.; Liu, Y.; Xie, C.; Sun, J.; Yuan, L. Body mass index and physical training-related injuries in military personnel: a systematic review and meta-regression analysis. BMJ Mil. Heal. 2025, 171, 483–491. [Google Scholar] [CrossRef]
- Reiter, D.A.; Bellissimo, M.P.; Zhou, L.; Boebinger, S.; Wells, G.D.; Jones, D.P.; Ziegler, T.R.; Alvarez, J.A.; Fleischer, C.C. Increased adiposity is associated with altered skeletal muscle energetics. J. Appl. Physiol. 2023, 134, 1083–1092. [Google Scholar] [CrossRef]
- Cesanelli, L.; Minderis, P.; Degens, H.; Satkunskiene, D. Passive mechanical properties of adipose tissue and skeletal muscle from C57BL/6J mice. J. Mech. Behav. Biomed. Mater. 2024, 155, 106576. [Google Scholar] [CrossRef]
- Brumitt, J.; Dorociak, R.; Dunn, S.; Critchfield, C.; Benner, J.; Cuddeford, T. Lower preseason reactive strength index scores are associated with injury in female collegiate volleyball players but not male collegiate basketball players. J. Sci. Med. Sport 2021, 24, 549–554. [Google Scholar] [CrossRef] [PubMed]
- Niksic, S.R.; Buchanan, C.A.; Dalleck, L.C. Relationship between single leg reactive strength index and overuse injuries in collegiate middle-distance and distance runners. Int. J. Res. Ex. Phys. 2019, 15, 50–63. [Google Scholar]
- Sun, M.; Zhang, F.; Zhou, X.; Qu, F.; Mao, W.; Li, L. Postural Control Adaptations in Trampoline Athletes of Different Competitive Levels: Insights from COP Linear and Nonlinear Measures. Entropy 2025, 27, 1181. [Google Scholar] [CrossRef] [PubMed]
Figure 2.
ROC and PR Curves for the PLS-DA Injury Risk Model. ROC curve (left) and PR curve (right) for the PLS-DA injury risk model.
Figure 2.
ROC and PR Curves for the PLS-DA Injury Risk Model. ROC curve (left) and PR curve (right) for the PLS-DA injury risk model.
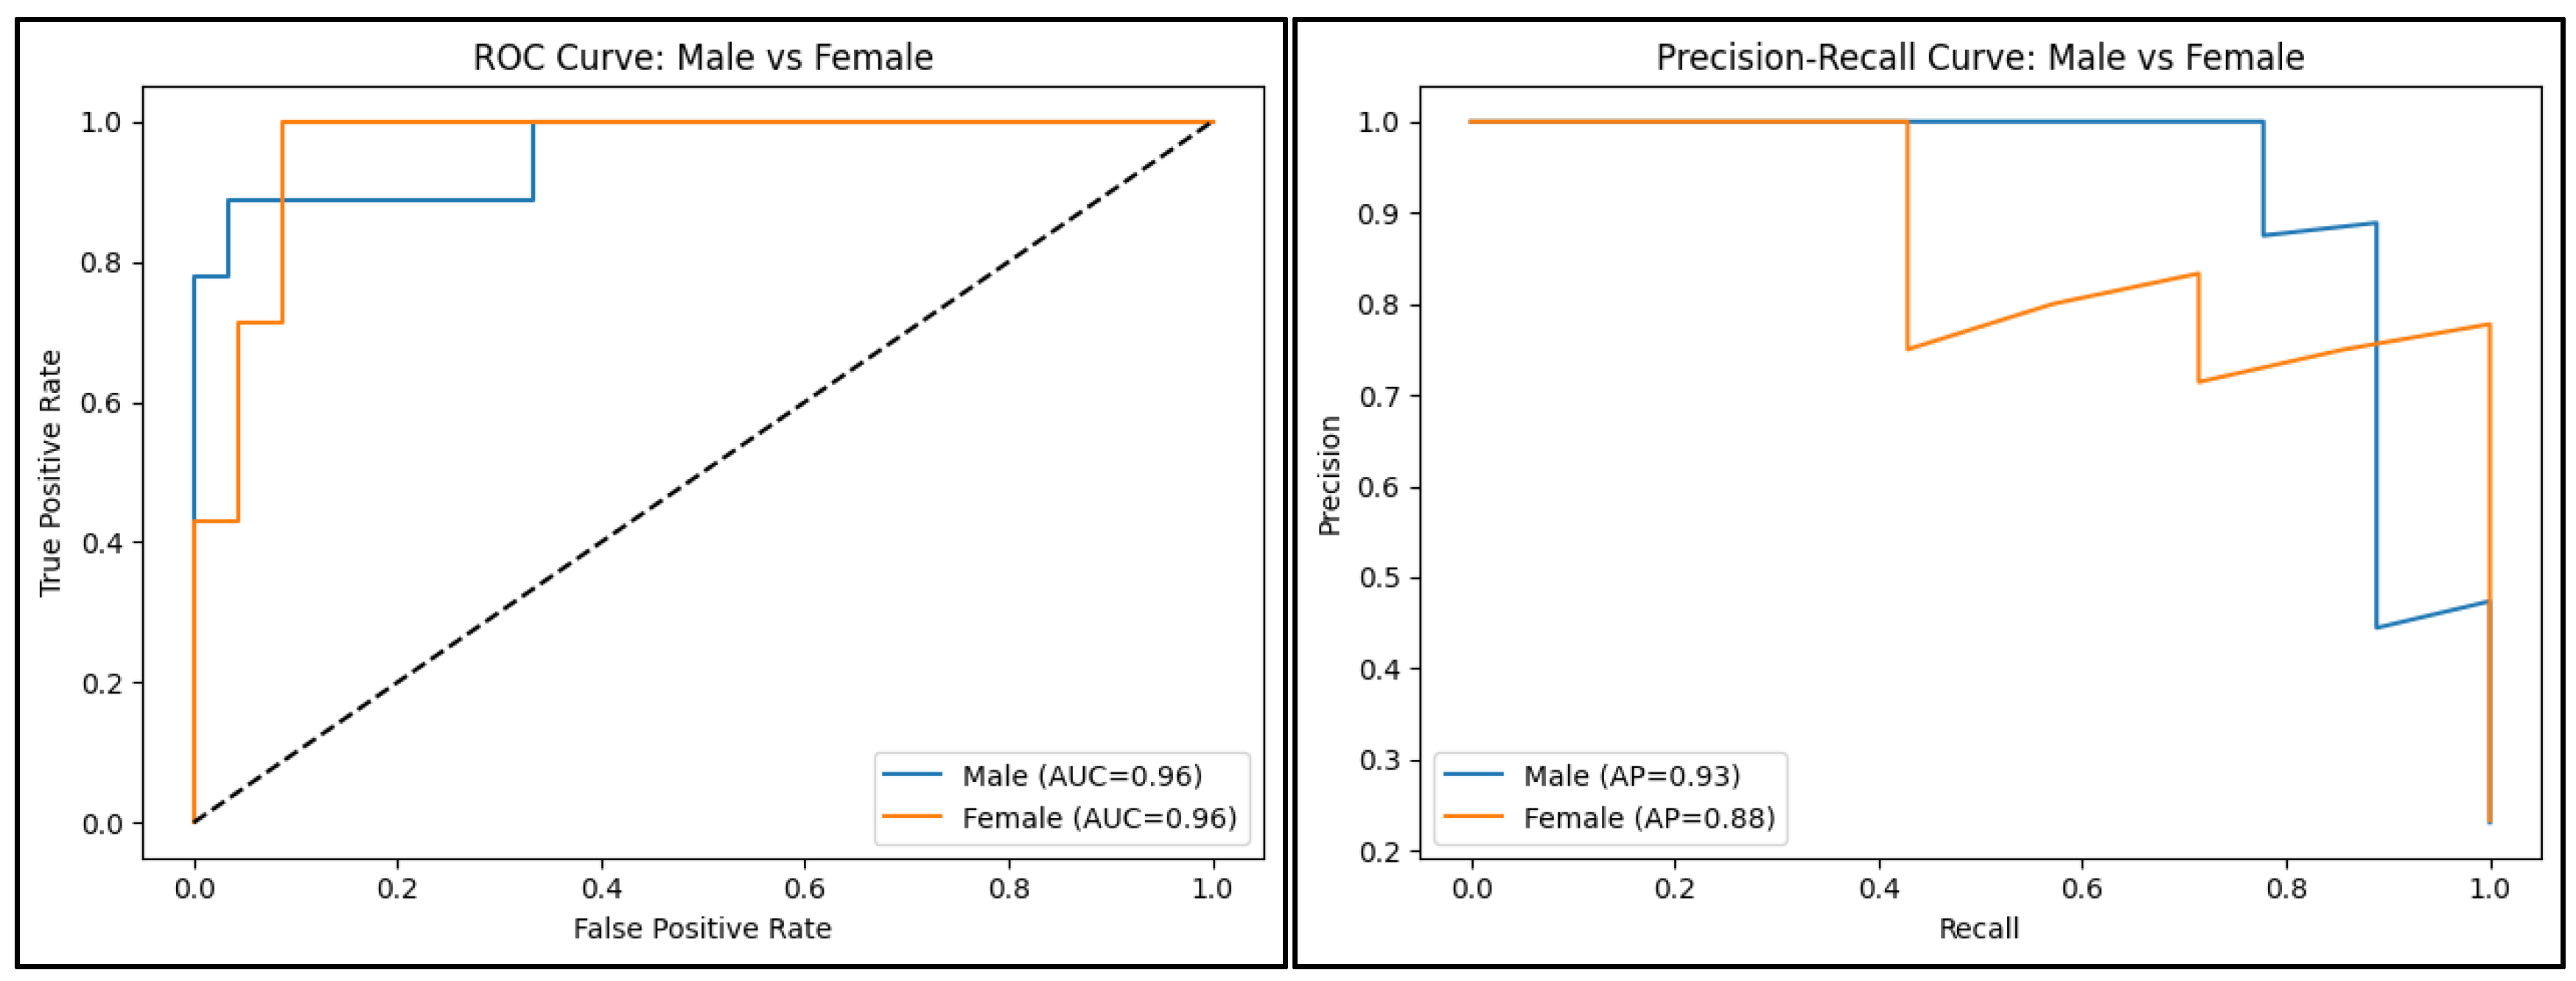
Figure 3.
PLS-DA Component Loading Heatmaps and Scatterplots. Male and female loadings for PLS-DA Component 1 (Top). Scatterplots by sex of PLS-DA Component 1 and 2 (Bottom), differentiated by injury risk status.
Figure 3.
PLS-DA Component Loading Heatmaps and Scatterplots. Male and female loadings for PLS-DA Component 1 (Top). Scatterplots by sex of PLS-DA Component 1 and 2 (Bottom), differentiated by injury risk status.
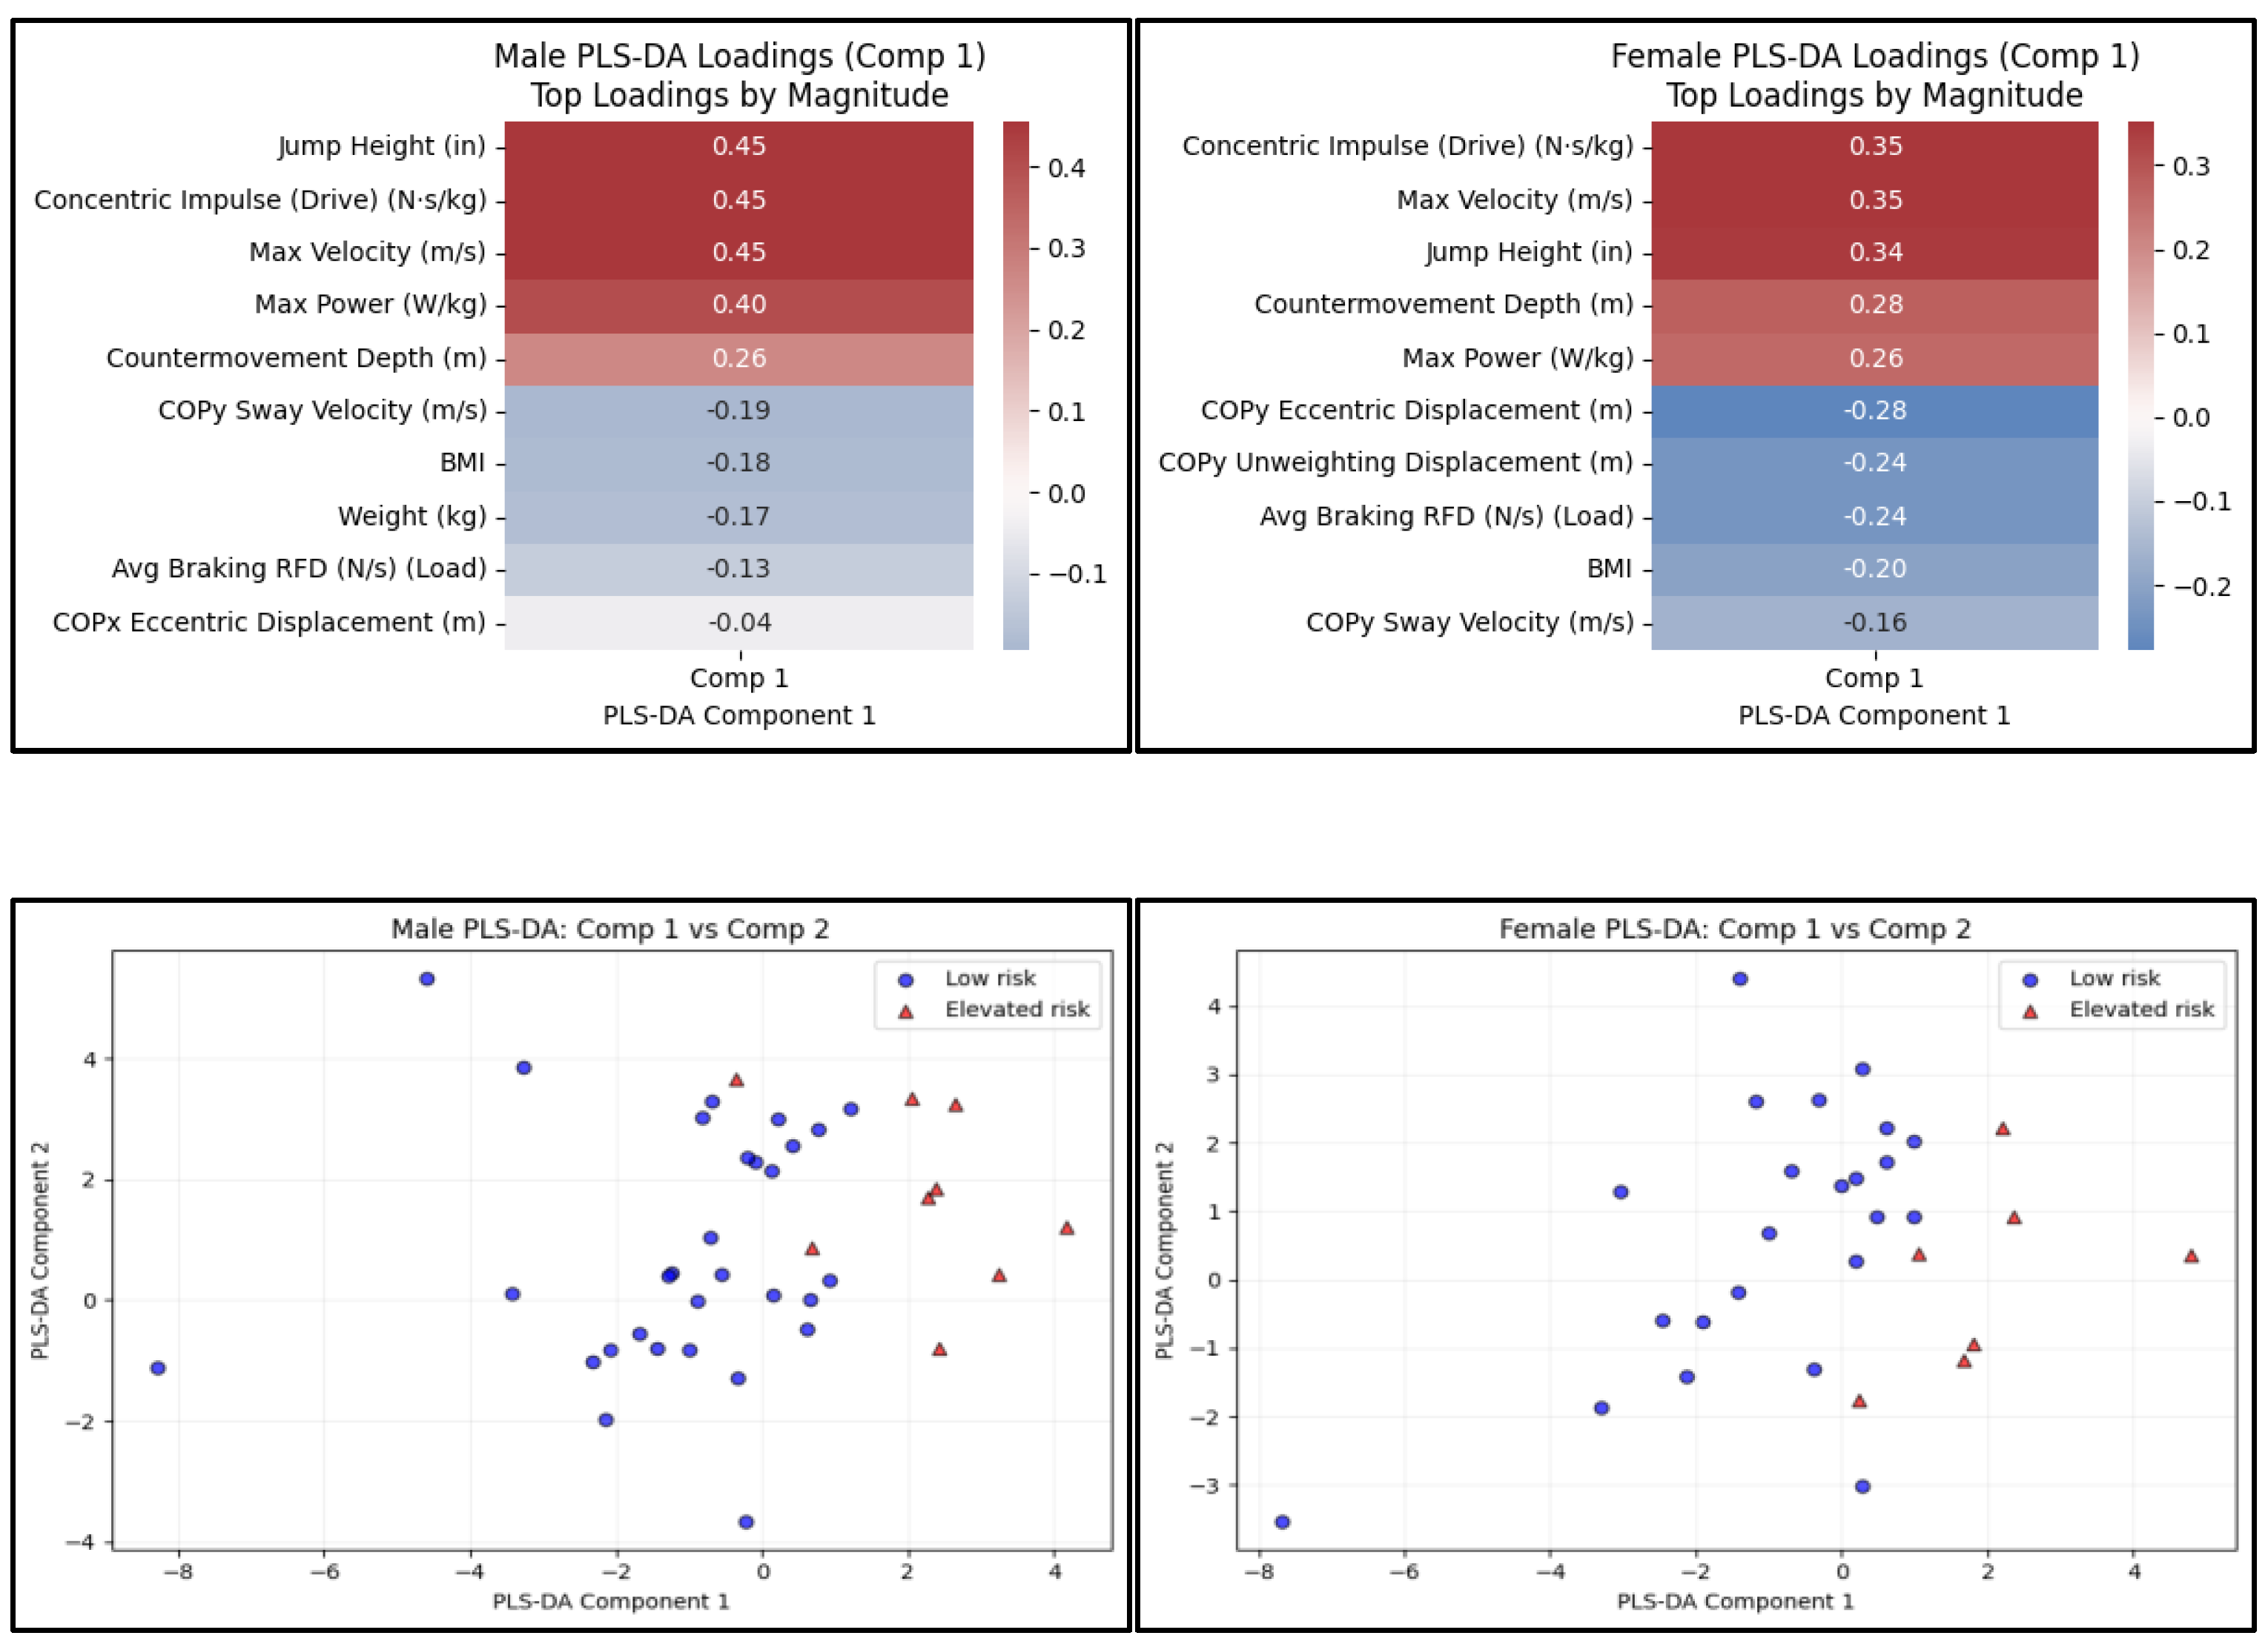
Figure 4.
PLSR Component Loading Heatmaps and Scatterplots. Male and female loadings for PLSR Component 1(Top). Scatterplots by sex of PLSR Component 1 and 2 (Bottom), differentiated by high or low jump height. The median was used as the cutoff to determine higher or lower CMVJ height.
Figure 4.
PLSR Component Loading Heatmaps and Scatterplots. Male and female loadings for PLSR Component 1(Top). Scatterplots by sex of PLSR Component 1 and 2 (Bottom), differentiated by high or low jump height. The median was used as the cutoff to determine higher or lower CMVJ height.
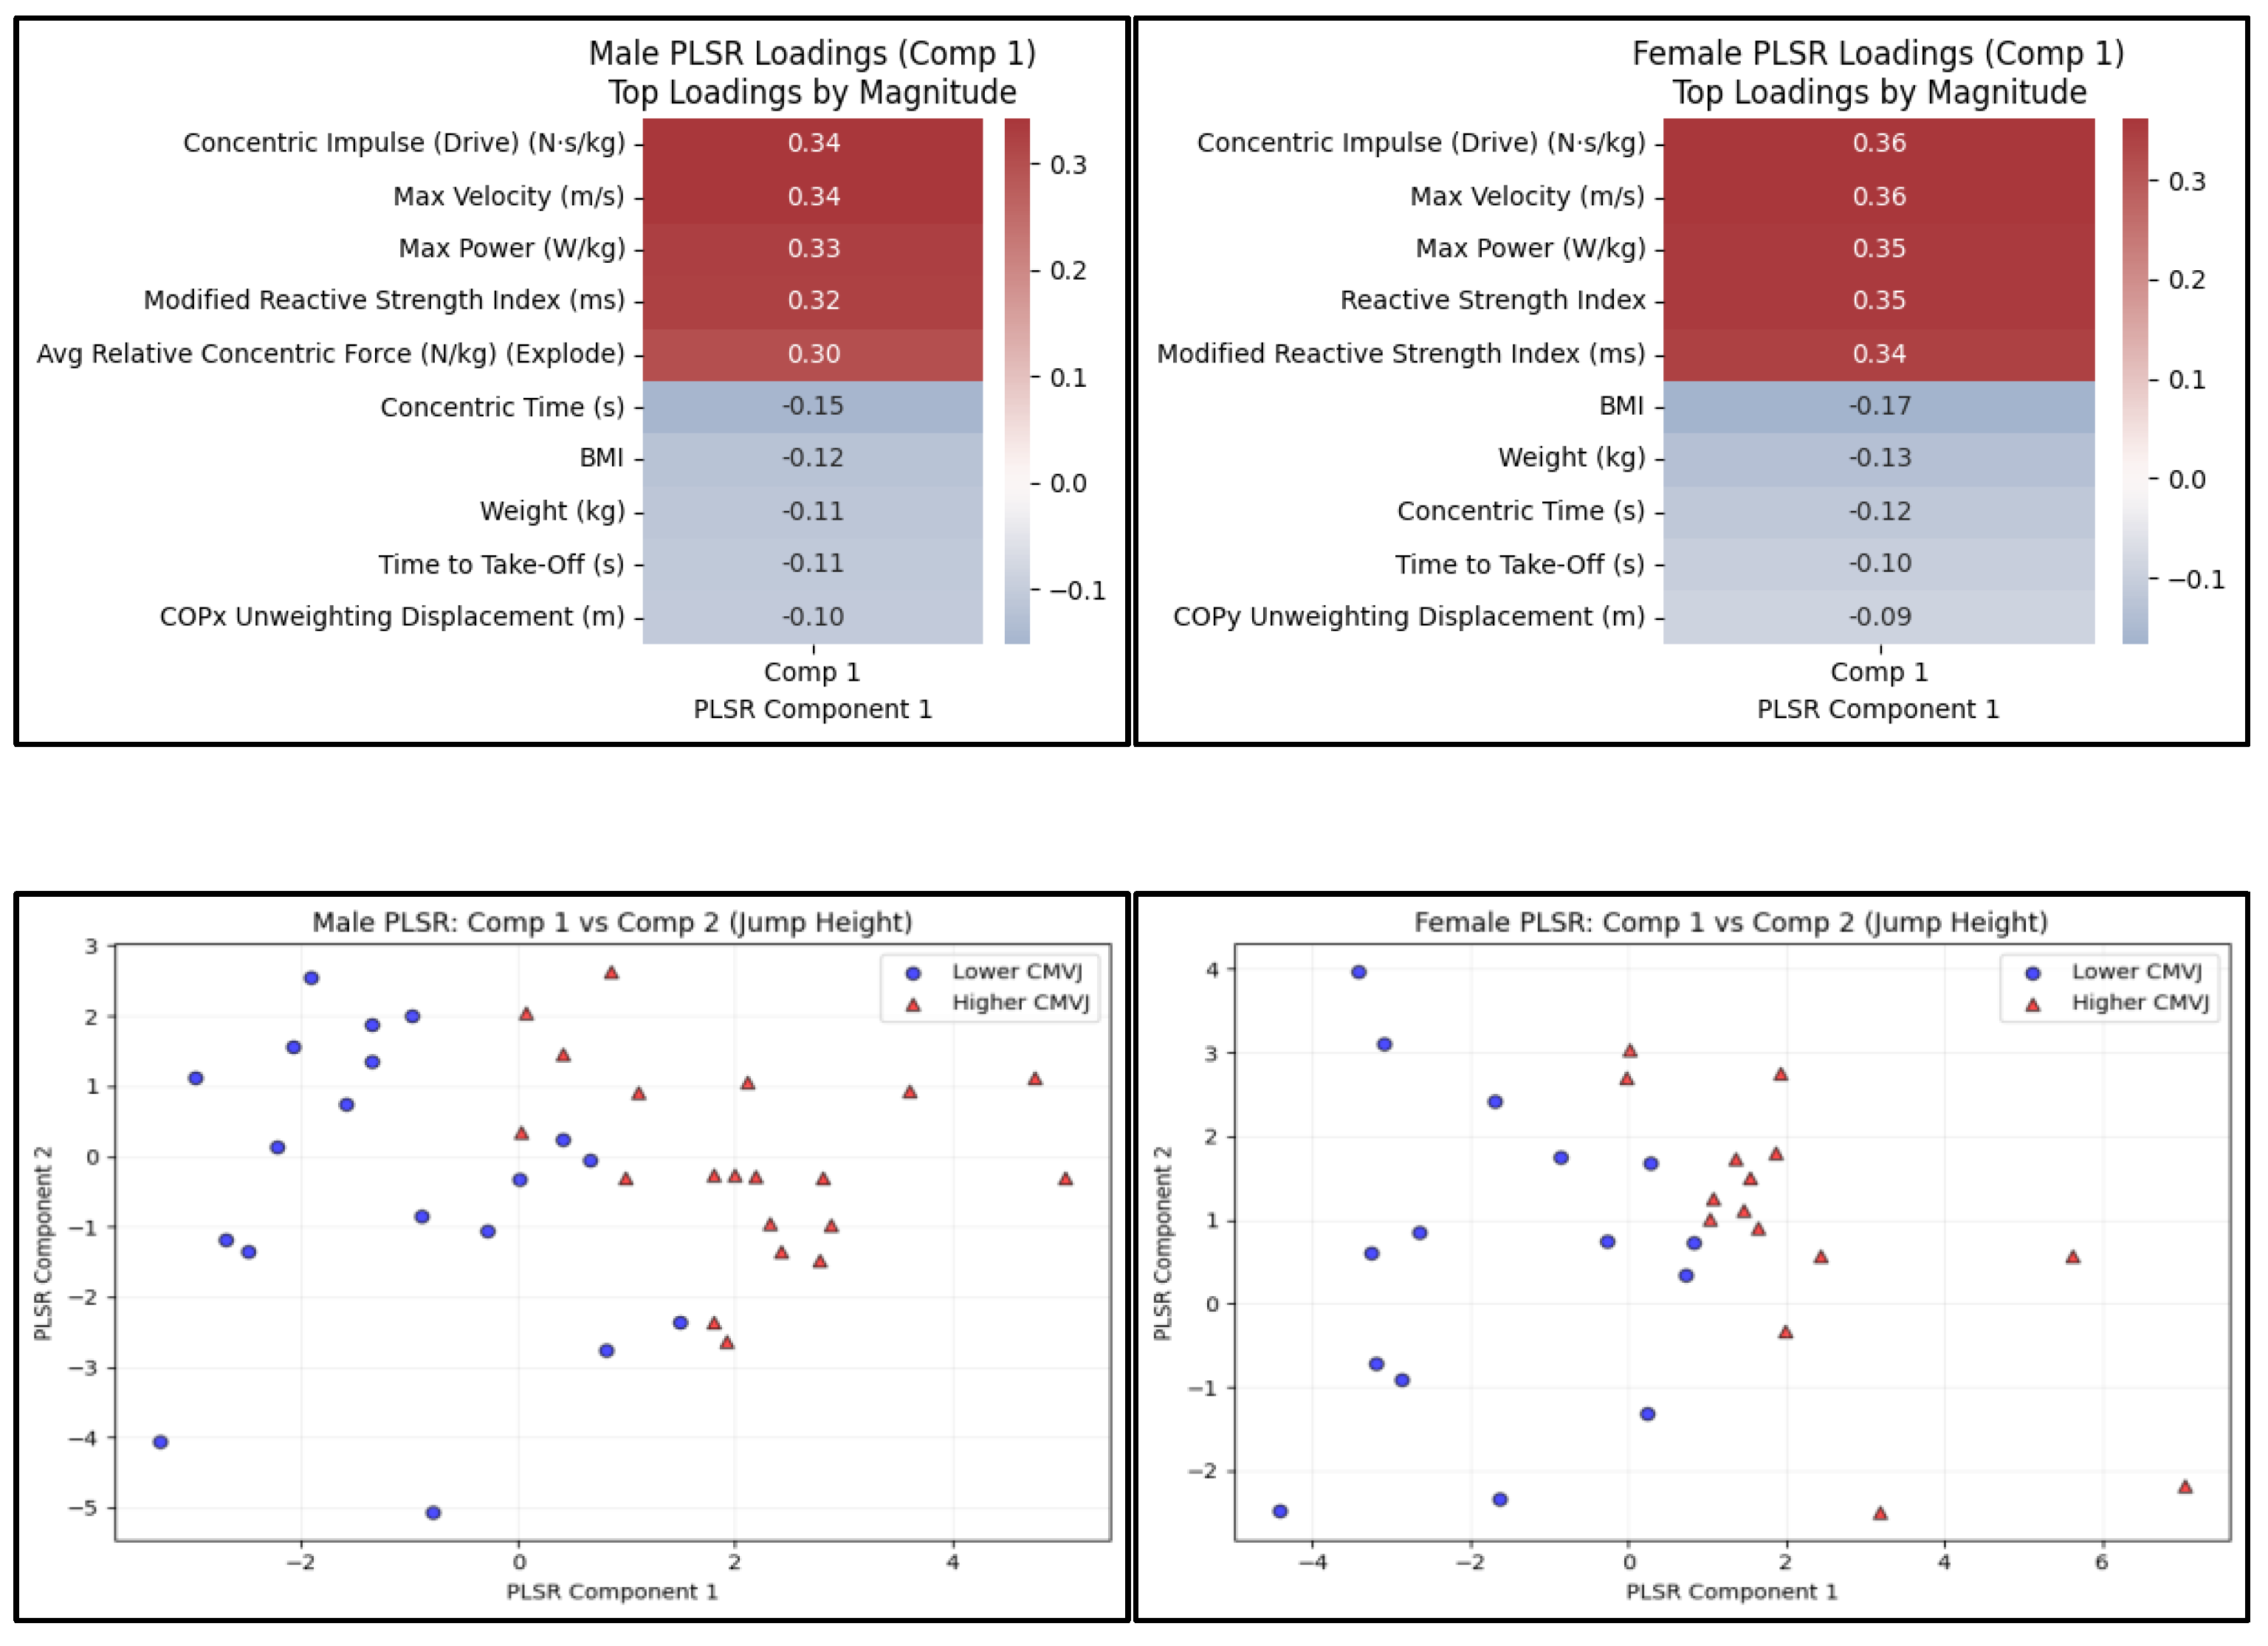
Figure 5.
Vector Biplots for MSKI Risk vs. CMVJ Height by Sex. Each predictor is shown as a vector, using its Component 1 loadings for MSKI risk and CMVJ height as coordinates. The vector’s direction indicates the pattern of association with each outcome, and its length (Euclidean norm) represents the combined importance.
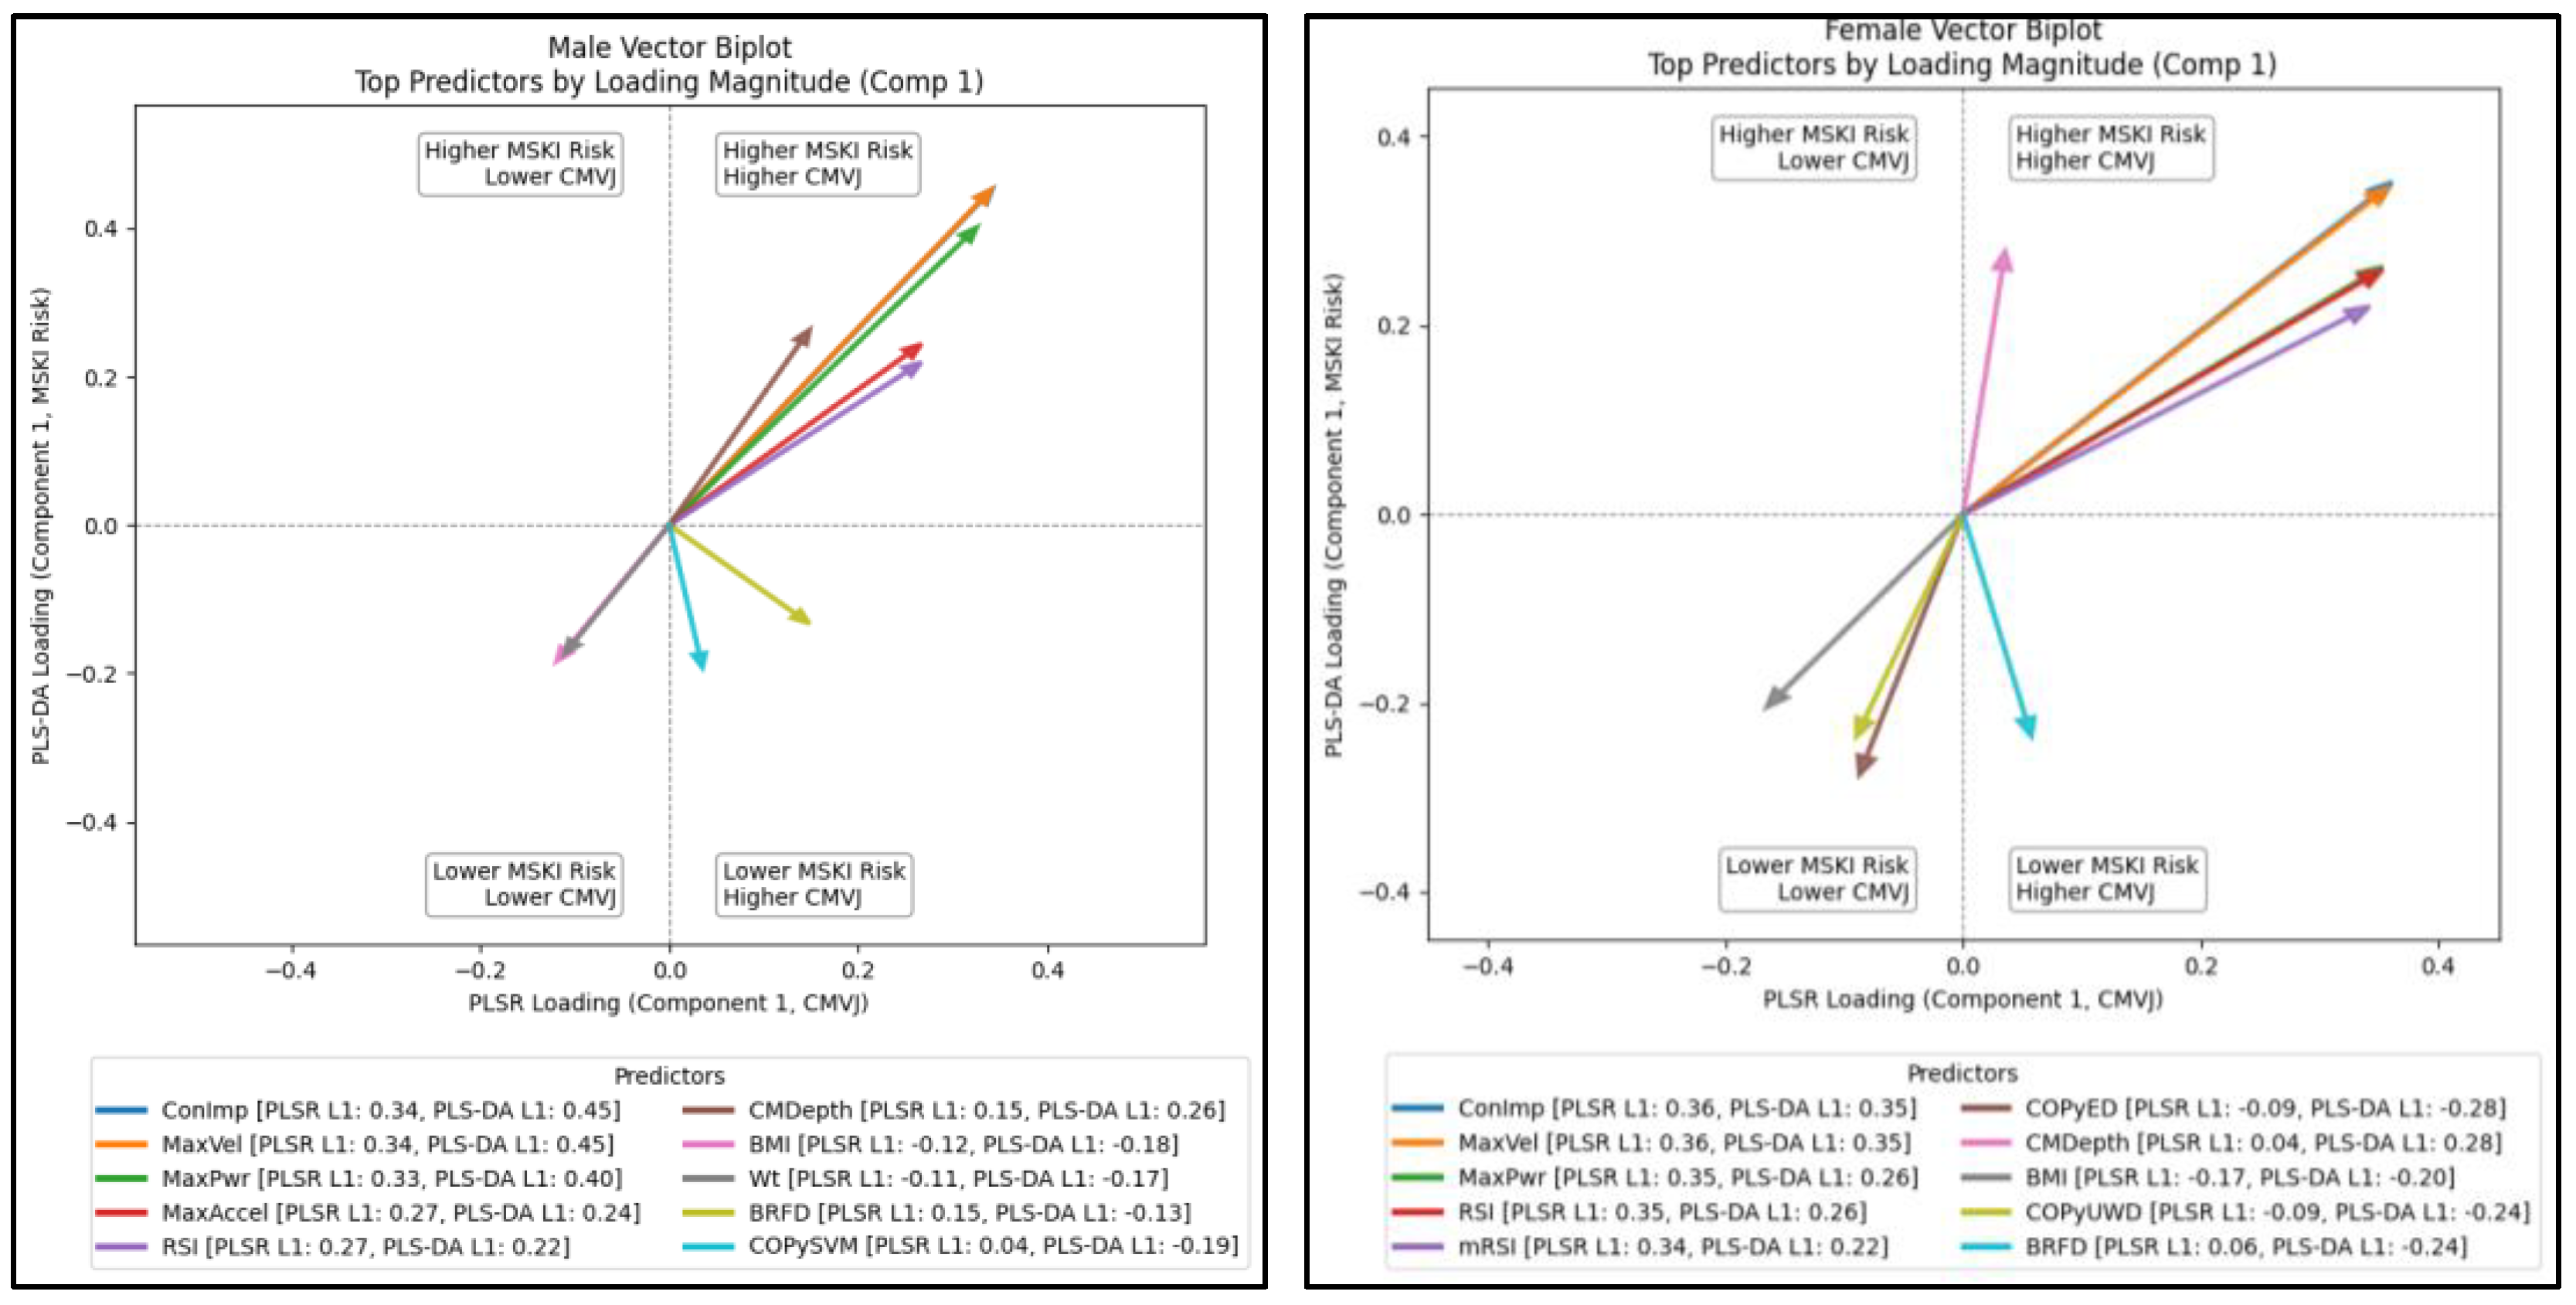

Table 1.
Differences in Sparta Force Plate Measures: Elevated vs. Reduced Injury Risk.
| Feature | Mean – Elevated Risk | SD | Mean – Reduced Risk | SD | P-value (aFDR-adj.) |
|---|---|---|---|---|---|
| Males | |||||
| CMVJ Height | 1.495 | 0.496 | 0.349 | 0.720 | <0.001** |
| Concentric Impulse (Drive) (N·s/kg) | 1.398 | 0.409 | 0.351 | 0.747 | <0.001** |
| Avg Relative Concentric Force (Explode) (N/kg) | 0.855 | 0.647 | 0.336 | 0.918 | 0.009* |
| Average Braking RFD (Load) (N/s) | 0.076 | 0.766 | 0.498 | 0.932 | 0.090 |
| Reactive Strength Index | 1.061 | 0.867 | 0.383 | 0.912 | 0.001* |
| Modified Reactive Strength Index (mRSI) | 1.080 | 0.818 | 0.401 | 0.878 | 0.001* |
| Sparta Score | 0.841 | 0.921 | -0.153 | 1.168 | <0.001** |
| Females | |||||
| CMVJ Height | -0.389 | 0.518 | -0.925 | 0.432 | <0.001** |
| Concentric Impulse (Drive) (N·s/kg) | -0.292 | 0.535 | -0.915 | 0.557 | <0.001** |
| Avg Relative Concentric Force (Explode) (N/kg) | -0.604 | 1.013 | -0.596 | 0.746 | 0.556 |
| Average Braking RFD (Load) (N/s) | -0.984 | 0.553 | -0.392 | 0.895 | <0.001** |
| Reactive Strength Index | -0.338 | 0.652 | -0.812 | 0.410 | 0.001* |
| Modified Reactive Strength Index (ms) | -0.433 | 0.677 | -0.815 | 0.456 | 0.010* |
| Sparta Score | -0.054 | 0.577 | -0.119 | 0.694 | 0.980 |
Values are standardized. a Benjamin-Hochberg false discovery rate correction. *Significant at p<0.01; **Significant at p<0.001.
Table 2.
Lasso-Retained Predictors of MSKI Risk and CMVJ by Sex.
| MSKI Elevated Risk | CMVJ | |||
| Predictor (units) | Male | Female | Male | Female |
| Age (years) | ü | ü | – | ü |
| Average Braking RFD (Load) (N/s) | ü | ü | ü | ü |
| Average Max Force (N) | – | ü | ü | ü |
| Avg Landing Rate of Deceleration (m/s³) | ü | ü | ü | ü |
| Avg Relative Concentric Force (Explode) (N/kg) | – | ü | ü | – |
| BMI (kg/m²) | ü | ü | – | ü |
| Concentric Impulse (Drive) (N·s/kg) | ü | ü | – | ü |
| Concentric Time (s) | ü | ü | – | ü |
| COPx Eccentric Displacement (m) | ü | ü | ü | ü |
| COPx Sway Velocity Mean (m/s) | ü | ü | ü | ü |
| COPx Unweight Displacement (m) | ü | ü | ü | ü |
| COPy Eccentric Displacement (m) | ü | ü | ü | ü |
| COPy Sway Velocity Mean (m/s) | ü | ü | ü | ü |
| COPy Unweighting Displacement (m) | – | ü | – | ü |
| Countermovement Depth (m) | ü | ü | ü | ü |
| Eccentric Impulse (N·s/kg) | ü | ü | ü | – |
| Eccentric Time (s) | ü | ü | ü | – |
| Height (in) | – | – | ü | ü |
| Jump Height (in) | ü | ü | – | – |
| Jump Max Acceleration (m/s²) | ü | ü | ü | ü |
| Jump Max Δ Acceleration (m/s³) | ü | ü | ü | ü |
| Max Power (W/kg) | ü | ü | ü | ü |
| Max Velocity (m/s) | ü | ü | ü | ü |
| Modified Reactive Strength Index (ms) | – | ü | ü | ü |
| RSI | ü | ü | ü | ü |
| Relative Force at 0 Velocity (N/kg) | ü | ü | ü | ü |
| Sparta Score | – | ü | ü | ü |
| Time to Take-Off (s) | – | ü | – | ü |
| Unweighting Time (s) | – | – | ü | ü |
| Weight (kg) | ü | ü | ü | ü |
(-) Indicates the predictor was not selected for the model.
Table 3.
PLS Models - Variance Explained.
| Group | Component | Component Variance Explained | Component Cumulative Variance Explained | Elevated Risk Cumulative Variance Explained (R2) |
| MSKI Elevated Risk | ||||
| Male | 1 | 0.18 | 0.18 | 0.62 |
| 2 | 0.19 | 0.38 | 0.70 | |
| Female | 1 | 0.16 | 0.16 | 0.45 |
| 2 | 0.13 | 0.30 | 0.53 | |
| CMVJ Height | ||||
| Male | 1 | 0.28 | 0.28 | 0.86 |
| 2 | 0.10 | 0.38 | 0.96 | |
| Female | 1 | 0.23 | 0.23 | 0.88 |
| 2 | 0.09 | 0.32 | 0.97 | |
Disclaimer/Publisher’s Note: The statements, opinions and data contained in all publications are solely those of the individual author(s) and contributor(s) and not of MDPI and/or the editor(s). MDPI and/or the editor(s) disclaim responsibility for any injury to people or property resulting from any ideas, methods, instructions or products referred to in the content. |
© 2025 by the authors. Licensee MDPI, Basel, Switzerland. This article is an open access article distributed under the terms and conditions of the Creative Commons Attribution (CC BY) license (http://creativecommons.org/licenses/by/4.0/).
Copyright: This open access article is published under a Creative Commons CC BY 4.0 license, which permit the free download, distribution, and reuse, provided that the author and preprint are cited in any reuse.


