
Submitted:
19 December 2025
Posted:
22 December 2025
You are already at the latest version
Abstract
The impact of climate change on marine bivalves, particularly on their reproductive processes, is a current issue of concern. The aim of this study was to investigate how seawater temperatures influenced the gonadal development and overall condition of the grooved carpet shell clam population in the Baldaio Lagoon (NW Spain) over the last 20 years. Adult clams were collected and biometric, histological and biochemical analyses were performed. Gonadal development phases were assessed, several condition indices were calculated, water temperatures were recorded and statistical analyses were carried out. Results indicated variations in reproductive timing, including changes in gonadal maturation, an earlier spawning period and prolonged maturation phases which contrasted with previous reproductive patterns described for this species. These findings coincided with thermal changes in the lagoon, where mean minimum temperatures increased and maximum temperatures decreased, and the annual thermal range was reduced in comparison with historical data (1998-1999). Biochemical composition and condition indices also reflected variations linked to temperature fluctuations, suggesting that warmer water temperatures may alter energy storage and reproduction. This highlights the importance of continuous environmental monitoring to better understand the effects of climate change on marine invertebrate populations and to improve management strategies that could help to restore natural populations.
Keywords:
climate change
; grooved carpet shell clam
; gametogenic development
; Baldaio lagoon
1. Introduction
Climate change is one of the most pressing challenges of our time, with several consequences that affect ecosystems, human health, and economies. The increase in greenhouse effect gases is one of the main problems affecting many aspects of human life, such as weather, agriculture and food availability and also impact on the ocean. This is mostly due to changes in rainfall patterns and water resources. Higher temperatures and droughts reduce freshwater supplies and accelerate sea level rise[1]. A recent study showed that the Atlantic Ocean has been experiencing constant warming and its surface temperature has suffered an increasing rate of 0.25 ± 0.03 °C each decade since the 1980s; an increase that is especially notable in the northeastern Atlantic Ocean [2].The impact on the environment is particularly alarming, higher temperatures are causing damage to forests, coral reefs and wetlands; this damage includes an increase in the frequency and severity of wildfires that disrupt local ecosystems, the drying out of the wetlands and the death and bleaching of coral reefs, which affects marine biodiversity and threatens species like fish and marine invertebrates that depend on the reef structures for their habitat and re-production[3,4]. In 2022 and 2023 marine heatwaves intensified and their effects reached 60% of the north Atlantic Ocean [2], affecting the entire life cycle of marine organism. This increasing temperature affects the entire life cycle of marine organisms. As previously stated, this aspect is especially important on the north Atlantic Ocean and along its coast, where a tropicalization of the environment due to the anthropogenic elements, affects marine life and impacts the economy [5]. Furthermore, the increasing temperature affects the salinity and density of the water. About 30% of the anthropogenic carbon dioxide has been absorbed by the seabed, causing ocean acidification and changes in the carbonate chemistry which is unprecedented for 65 million years. This impacts in the oxygen and CO2 dissolution, which in turn causes changes in pH, that has been decreasing 0.017 ± 0.001 units per decade [2]. These changes in the pH are related to modifications of marine currents, metabolic processes, food availability and, inevitably, the reproduction and growth of marine organisms [1].
Marine invertebrate species, like clams and other bivalve species, are highly influenced by environmental conditions; in fact, they do not regulate their own body temperature, meaning their internal systems are directly affected by the water temperature of the sur-rounding water [6]. This dependence on external environmental conditions makes them especially vulnerable to changes in the marine ecosystem, such as those caused by climate change. Mannai et al., 2022 found that chronic warming stress produces disturbances in both biochemical and physiological parameters in the grooved carpet shell clam (Ruditapes decussatus, Linnaeus 1758)[7]. Temperature fluctuations can significantly affect their growth and reproduction, delaying the spawning period as a strategy associated with temperature fluctuations[8], producing abnormal oocytes [9], or changes in feeding behaviours with a negative energy balance that leads to loss of organic weight and mortality [10]. Macho et al. (2016) highlighted that heatwaves cause an elevation in the mortality rate of three species of clams, due to the alteration of their capacity to burrow into the sand, that acts as a thermal buffer [11]. Damage to their lipid membrane was detected by Velez et al., 2017 [12] in their study on the effects of seawater temperature increase on two clam species R. decussatus and Ruditapes philiphinarum (Adams and Reeve, 1850). They found changes in clams´ metabolic response inducing thermal protection mechanism and alterations in clam behaviour were recorded, in their valve closure time.
Other bivalve species like Ostrea edulis (Linnaeus 1758) show a temperature-dependent filter food rate as it was described by Fabra et al. [13]. When water temperature rises, the solubility of gases like oxygen decreases, leading to low-oxygen or hypoxic conditions which produce changes in their metabolic processes, such as the metabolic depression caused by a hypoxia episode in juveniles of the little clam Macoma balthica, (Linnaeus, 1758) de-scribed by Jannson et al. 2015 [14]. This factor makes it more difficult for organisms such as clams to survive, as they rely on enough oxygen levels to carry out essential physiological processes. Additionally, temperature changes can disrupt their reproductive cycles, affecting their ability to maintain stable populations [9]. Furthermore, it was also shown that ocean acidification affects the susceptibility of bivalves to infections due to lower immunity [15]. Thus, in the environments where temperatures are rising these species may struggle to survive, leading to a decline in their populations, and potentially affecting the entire food chain, as they are a crucial part of marine ecosystems.
The grooved carpet shell clam (R. decussatus) is one of the most valuable bivalves as a protein source and one of the most important commercial species along the Galician coast (N.W. Spain). Its geographical distribution extends primarily from the eastern Atlantic Ocean to the Mediterranean coasts, ranging from Norway to Senegal, including the United Kingdom, France, Spain, Portugal, and North Africa. Additionally, it was introduced to the Azores Islands in the 90s [16]. It is an intertidal species which lives buried or partially buried in the marine seabed composed of mud, sand or fine gravel that provides to the individuals shelter and protection from drying in low tide and from high temperatures [17]. Its food supply is provided by phytoplankton, composed of different microalgae species, the production of which is directly linked to the water primary production where they live is highly affected by climatic changes[18].
R. decussatus is a gonochoric species, male and female individuals cannot be distinguished by sight, because the shell shows no visual differences between both sexes. Only when they are fully mature it is possible to observe slight differences in the gonadal tissue inside the visceral mass, although to be certain of the sex it is necessary to perform smear tests or histological analyses. The reproductive cycle of the grooved carpet shell clam was previously studied in depth [19,20,21,22,23,24]; its spawning period lasts from the end of May until September. During this time, mature adults undergo a few spawning events until the end of the spawning season. In this bivalve species, males and females release sperm and oocytes, respectively, into the water when the appropriate conditions met; usually the temperature and the pH of the water are usually the keys that initiate the process, and fertilization occurs externally [17]. The development of gonadal tissue is directly related to water temperature [25,26], and with increasing ocean temperatures, some differences in the gonadal development of this clam could be expected.
The production of grooved carpet shell clams along the Galician coast has been suffering a decline over the last decade; its production has been dropped dramatically, raising concerns among scientists, fishers, and policymakers. In 2013, production levels reached 733 tons, generating a market value of almost 13.5 million euros. By 2023, harvesting data indicated an abrupt fall to 153 tons, with a market value of approximately 6.7 million euros, and last year 2024, catches fell even further to just 49 tons and 2.2 million euros in value [27]. This sharp decrease is believed to be influenced by several factors, including environmental changes due to climate change, overexploitation, rainfalls and droughts, predators, exotic invasive species and habitat degradation [28]. Climate change, through rising sea temperatures, sudden drops in salinity levels due to draughts and ocean acidification, can directly affect the reproduction, survival, and distribution of marine bivalves such as the grooved carpet shell clam. Understanding how these changes impact on these species´ reproductive cycle is critical for developing effective conservation and management strategies. This study aims to the understanding of how climate change affects the gametogenic development of the grooved carpet shell clam, by comparing the current gonadal development of a population of clams located in the Baldaio Lagoon (NW Spain) with previous data from approximately 20 years ago [25] and evaluating the changes that gonadal development may have undergone in this species as a result of environmental changes.
2. Materials and Methods
2.1. Sample Location and Collection
The selected sampling location was the Baldaio Lagoon, on the Atlantic coast of Galicia, in the northwest of Spain. The dimensions of the lagoon are approximately 4,000 meters in length and between 150 and 350 meters in width with a surface area of 10 km2. This lagoon has an average depth between 1-2 m depending on the tide and season of the year. The lagoon is separated from the open sea by a sand barrier, forming a beach barrier lagoon complex which significantly affects the tidal dynamics within the lagoon. High tide and low tide are attenuated by the sand channel and there is a mismatch from the open sea due to its special dynamics. This configuration regulates not only the water exchange but also influences temperature and salinity within the lagoon ecosystem. The freshwater input is provided by several small rivers which directly affect the salinity (especially during low tide) and drainage of the lagoon, when the supply of salt water is scarce [29].
The sampling period lasted from March 2023 to January 2025; between 5-20 adults of the grooved carpet shell clam were hand-collected by bivalve harvesters from the same location in the intertidal foreshore of the Baldaio lagoon in approximately monthly intervals. Due to the special tidal dynamic, logistic problems and adverse meteorological conditions some gaps occurred during the sampling period (October, November and December of 2023 and January and August of 2024). All individuals had the minimum commercial size of 40 mm, as established by local government regulations.
The clams were transported in a refrigerated container to hatchery facilities, where they were placed in 100-liter filtered seawater tanks and maintained for 24 h, at the local temperature of the hatchery, in a range of 12-20 °C, depending on the season. The tanks had constant aeration and an open water flow of approximately 100 litres per hour to allow the clams to purge their stomach and hepatopancreas and remove any residual sand from their tissues.
2.2. Biometric Measurements
For each specimen external measurements were recorded, using a digital calliper with a precision of ±0.01 mm (Mitutoyo IP67). The following dimensions were registered: total shell length (TSL), measured along the anterior–posterior axis; total shell width (TSW) that represents dorsal–ventral size and total shell thickness (TST), that refers to lateral thickness were registered.
Weight measurements were recorded for each sample using an analytical balance with ±0.01g precision (Radwag PS 4500.R2). These included total fresh body weight (FBW), including shell; shell weight (SW), only shell weight without visceral mass; fresh soft tissue weight (STW) excluding the shell and gonadal-hepatopancreas tissue weight (GW). Due to the difficulty in separating the gonadal tissue from the visceral mass or hepatopancreas, both tissues were considered as a single unit for weighing, in order to avoid potential errors during dissection.
2.3. Condition Indices
Biometric measurements were used to calculate the monthly means and several condition indices commonly applied in bivalve studies, to assess the physiological state of the clams during the study period. These indices are a useful tool for evaluating reproductive status, energy reserves, and overall health of the clams.
- -
- CI: The condition index was calculated as the ratio between the soft tissue weight and the total weight expressed as a percentage. This index serves as an indicator of the clam’s nutritional and reproductive condition [30].
- -
- BCI: Body condition index derived from DCI (Dry Condition Index, defined as the dry weight of the soft body tissue relative to the dry weight of the shell expressed as a percentage). In our case due to logistical constraints, wet tissue weight was used instead of dry weight, and the index was adapted accordingly, being calculated as a relation between soft tissue weight and shell weight expressed as a percentage [31].
- -
- GCI: The gonadal condition index relates gonadal-visceral mass weight with total body weight (excluding the shell) expressed as a percentage, it provides an idea of the gonadal development stage [32].
2.4. Laboratory Processing and Histology
After measurements, clams were freshly dissected, and tissues were processed using traditional histological techniques [33]. The tissue of the gonad-visceral mass was separated from the rest of the flesh using a scalpel, and then longitudinally divided into two parts. One half was used for a tissue smear on a glass slide for a fresh microscopic examination and then was stored in a sample container and frozen for later biochemical analysis of the gonads. The other half was stored in a biopsy cassette and fixed in aqueous Davidson´s fixing mixture, during 24-48 h. After fixation, samples were stored in 70% alcohol until further processing. The cassettes with samples were processed using an automatic benchtop tissue processor (Leica TP1020 Automatic Benchtop Tissue Processor) where they went through a multi-phase process. First step was dehydration using increasing alcohol concentration, then they were clarified in xylene and finally embedded in paraffin at 60° and hardened samples were used for the formation of paraffin blocks. Using a microtome (MICROM HM 340 E), thin serial sections of 5 µm were cut and placed on glass slides, then they were stained with haematoxylin-eosin standard staining method. Finally, the slides were mounted using a mounting solution (ClearVue Mountant XYL), following traditional histological methodology. Then slides were processed and visualized using optical microscope and photos were taken with a software Leica ICC 50W camera and stored to process later on.
2.5. Gonadal Histological Examination
The gonadal development of the grooved carpet shell clam was examined with the photos taken and classified, following a maturation six-stages scale proposed by Wilson & Seed (1974) [31], and modified by Ojea et al., 2003 [34]. Briefly, these stages are characterised as follows: sexual resting stage or E0, E1 stage or onset of gametogenesis, E2 or gametogenic development stage, E3 or morphological maturity stage, E4 or spawning stage and E5 or post-spawning stage (Table 1).
2.6. Biochemical Composition
Biochemical composition of the gonadal tissues was analysed following standard methodologies. All analyses were carried out using gonad-visceral mass tissue previously frozen and lyophilized and stored at -20 °C. Total protein composition was determined using the spectrophotometric method (spectrophotometer ONDA V-10 PLUS) proposed by Lowry (1951) and modified by Nóvoa 2007 [35] with bovine serum albumin (Sigma-Aldrich, St. Louis, MO, USA) as standard, with 2-3 mg of gonadal tissue, results were read at 750 nm [36] . Total carbohydrate quantity was determined following the anthrone (Merck, Darmstadt, Germany) spectrophotometric method proposed in 1956 by Fraga, using glycogen (Sigma-Aldrich, St. Louis, MO, USA) as standard and 2-3 mg of lyophilized tissue [37]. Total lipid composition was analysed in the samples using 200 mg of lyophilized gonadal tissue and by the gravimetric chloroform-methanol (Supelco, Bellefonte, PA, USA) method proposed by Folch, 1957 [38] and modified by Beninger and Lucas, 1984 [39] and Pazos et al., 1997 [40], absorbance was read at 625 nm. Results were expressed as mg of each biochemical component per g of dry gonadal tissue.
2.7. Environmental Parameters
2.8. Statistical Analysis
Statistical analyses were carried out using the IBM SPSS statistical package (software IBM SPSS Version 29.0.2). To analyse the association between different variables (temperature, morphometric measurements, gametogenic development stage, biochemical composition and condition indices) a Pearson correlation analysis was performed; to interpretate results r and p-value were analysed considering significant correlation with p <0.05 or p < 0.01. Variables were previously analysed to confirm that statistical conditions met the requirements of normality and homogeneity of variance.
3. Results
3.1. Biometric Measurements
The biometric measurements are shown in Table 2. The mean length was 42.47 ± 2.08 mm, width 30.76 ± 1.66 mm, and thickness 20.26 ± 1.35 mm. The mean total fresh weight was 17.78 ± 2.96 g, mean shell weight 9.78 ± 1.65 g, mean soft tissue weight 3.85 ± 0.69 g and mean gonad tissue weight was 1.01 ± 0.33 g. Maximum values of each measurement were recorded in June 2023. The minimum values were slightly different: the measurement of length, width and thickness reached minimum in March 2024, fresh body weight was the lowest in May 2024, shell weigh in June 2024, soft tissue weight in October 2024 and gonadal weight presented the lowest value in October 2024.
Pearson correlation analyses were carried out to evaluate patterns and relationship, or the absence of them, between sizes and weights. In Table 3 the results of these analyses are represented (r and p-value). There were three groups of correlations; very high significant correlations (red coloured) (r > 0.70, p < 0.001) these variables grew together and represented total size, including relationships between sizes (TSL, TSW, TST); sizes with FBW and SW and FBW-SW and STW-GW. Moderate correlations (orange coloured) were found between TSL-STW and STW-FBW (r ≈ 0.40 - 0.65, p < 0.001). Weak or non-significant correlations (green coloured, p > 0.05) mostly in STW with TSW, TST and SW. GW had non-significant correlations with all variables except with STW (p < 0.001). This is a proof that gonadal tissue growth was dependent of soft-tissue weight but independent of shell size, which is normal due to the seasonality of gonadal development.
3.2. Condition Indices
The results of condition indices were calculated using biometric measurements and are shown below in Table 4 with their individual standard deviation. IC values ranged from 16.7 to 30 (mean was 21.79 ± 3.59); BCI ranged from 30 to 60 (mean was 40.56 ± 8.21) and GCI which was the most relevant in this study because it relates directly the gonadal development to the stage of the individuals, ranged from 19 to 36 (mean was 25.75 ± 12.01).
3.3. Sex Distribution
The distribution of females and males in the sampling tended to be 50:50 but in some cases, this was not possible because of the immature stages of development, where sex could not be determined. The sampling of monthly distribution of females, males and undefined is shown in Figure 1. Two very different periods can be seen, a resting period between October and February and the gametogenesis period (including ripeness and spawning) between March and September.
3.4. Histological Study of Gametogenic Cycle
After observation with the optical microscope, all principal characteristics of development of the gonadal tissue were recorded paying special attention to connective tissue, size and number of follicles, provision of the cells, shape, then each one was classified using the qualitative scale of gonadal development (Table 1). In Figure 2, two images per month are shown, left image shows gonadal tissue from female clam, right one is from male. There were some months where sex could not be determined: September 2023, February, September-December 2024 and January 2025 in these cases the two images included only connective tissue because follicles were not present.
3.5. Gametogenic Cycle and Maturation Scale Distribution
The monthly percentage distribution of clams at each development stage is represented in Figure 3. When two stages were present in one sample, the predominant stage was considered for the classification of the sample.
In March, in the two sampling years, clams were in phase E1 (beginning of gametogenic development) or already E2 (gametogenic development); during April, May and June of 2023 they were in E3 (maturity) and E4 (spawning) stages, and in July some clams were already in E5 (post-spawning stage), although most of them were still in E4 (spawning period). Later in September and the following months, all clams had already spawned, and the predominant stage was sexual resting. In 2024, there were some slight differences. In April, some clams were already E2 (gametogenic development), but the most relevant result was that the spawning period started in April as in 2023, peaked in May and June and by July most of the clams were in post-spawning stage. In September, E1 (beginning of gametogenic development) was present in some specimens, while in the previous year there were not clams in this phase. In general, main spawning activity was observed from April to August in both years, having peaks in May-June, gametogenesis having begun in February-March. In 2024 the development of gonadal tissue started in September (Figure 3).
3.6. Biochemical Analyses
The mean biochemical composition of the gonadal tissue is shown in Figure 4., represented as a schematic diagram of the gonadal tissue and the proportion of each biomolecule. Proteins represented 19.79 % of the total, followed by carbohydrates 12.49 % and lipids which were only 8.66 %, rest of the tissue were non-solubilised proteins, mineral ashes, nucleic acids, vitamins, etc.
Monthly evolution of biochemical composition of gonadal tissue along the sampling period, is shown in Figure 5, each biomolecule expressed in mg/g tissue. Mean protein content was 197.90 mg protein/g tissue, had maximum in 299.18 mg protein/g tissue in June 2023 and minimum, 66.00 mg protein/g tissue in February 2024. These means of protein did not include non-solubilised proteins because the Lowry method only determines soluble proteins. Mean carbohydrates content was 124,95 mg carbohydrates/ g tissue, maximum was in 252.77 mg carbohydrates/g tissue in November 2024 and minimum 51.08 mg carbohydrates/g tissue July 2023. In the case of lipids mean was 86.66 mg lipids/g tissue, 127.85 was the maximum in July 2024 and 46.21 mg lipids/g tissue was the minimum in February 2024.
Biochemical composition was analysed in comparison with seawater temperature using Pearson correlation analyses. Results of these analyses are shown in Table 5. Correlation with carbohydrates were significant and negative indicating that, carbohydrates decreased with increase in temperature. In the case of proteins and lipids results showed no significative relationship with seawater temperature p-value > 0.05.
Pearson correlation analysis was applied to evaluate relation between condition indices and biochemical composition. Results showed in Table 6 indicated only correlation between gonadal condition index with protein and lipid concentration. CI and GCI had no correlation with proteins, carbohydrates and lipid concentration. GCI showed positive and significative correlations with proteins (r 0.517, p 0.028) and lipids (r 0.644, p 0.004) but no with carbohydrates (r -0.440, p 0.067).
3.7. Temperature in the Lagoon
Water temperature data from the Baldaio Lagoon were obtained by processing raw buoy sensor data. The surface temperature ranged from 19.01 °C to 13.49 ± 1.58 °C, with a mean of 15.67 ± 1.58 °C. Maximum temperature was reached in June 2023 and minimum in April 2024. Monthly mean temperature data are represented in Figure 6.
A series of Pearson correlation analyses were applied between each biometric variable and seawater temperature of the lagoon, paying attention to R and p-value. The results (Table 7) showed that in the cases of width and thickness measurements, water temperature had a significant positive effect, moderate effect in width and thickness had the strongest effect, p < 0.01. Only in SW, sea water temperature had a significant positive effect, p-value < 0.05. TBW, STW and GW had a different behaviour, p-value (> 0.05) temperature had no significant effect on these variables.
The effect of temperature in condition indices of the clams was analysed using simple Pearson correlation analysis (Table 8). It was observed a significant negative relationship between CI and temperature (p-value <0.05), indicating that an increase in temperature is associated with a decrease in CI.
4. Discussion
4.1. Effects of Lagoon Temperatures
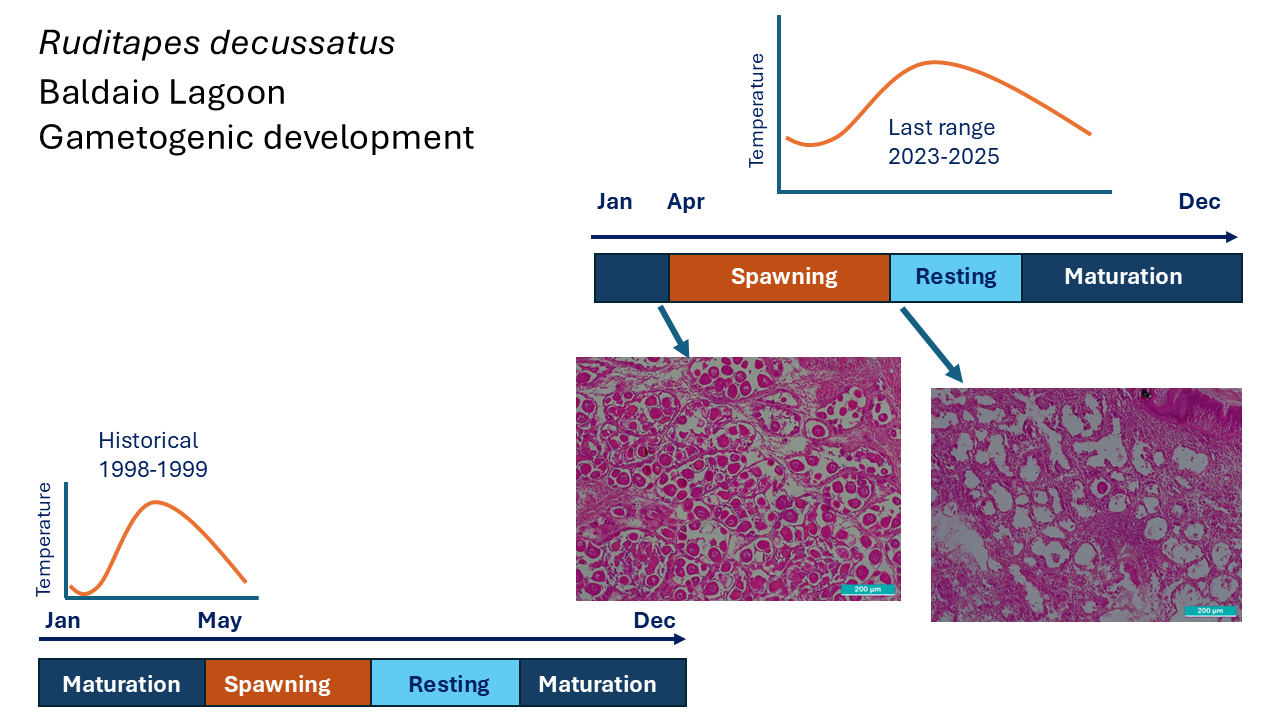
The evolution of temperature inside the lagoon is slightly different from that of the open sea due to the special shape and oceanic dynamic of the lagoon which is affected by rainstorms or strong land winds as well as by freshwater inputs and marine water inputs and outputs. These dynamics had been previously described by Simantiris and Theocharis, 2024 in their study about the seasonal variability of hydrological parameters in a Mediterranean coastal lagoon, where they found that water circulation in the lagoon varied due to the interaction between freshwater and marine water inputs, but the system maintains a neutral annual balance [42]. Baldaio lagoon was selected as a sampling location because of its special abiotic characteristics and due to the availability of previous studies that allow to compare and evaluate the evolution over the past 20 years [34,43]. In the period 1998-1999, temperature of the lagoon varied from 11.4 to 23.4°C [43] but the temperatures registered in the current study ranged between 13.5 to 19.01°C, this pattern is much smoother. High temperatures were not so high, and lower temperatures were neither so low. Minimum temperature varied from 11.4 °C in February 1999 to 13.49 °C in April 2024, and maximum temperature decreased from 23.4 °C in August 1999 to 19.01 °C in June 2023. Maximum temperature decreased almost 4 °C, while the minimum mean temperature increased by approximately 2 °C. Annual mean temperature of the lagoon varied from 16.13°C, 20 years ago to 15.55°C in the current study, a difference of near 1 °C. These results showed a different thermal pattern between the two analysed periods 1998-1999 and 2023-2025, although mean temperature had not a significant variation (16.13 °C → 15.67 °C ≈0,46°C), a marked reduction in thermal amplitude was observed in minimums ≈2,1 °C (11,4 → 13,49 °C) and maximums ≈4,4 °C (23,4 → 19,01 °C). Although global warming is usually associated with higher thermal means, local dynamics could have some differences and result in a reduced range of temperatures. The increase in minimum temperatures coincides with climate patterns of southern Europe, where global warming is causing smoother winters. However, the decrease in maximum temperatures could be related to other oceanographic factors like recent evidence of a slowdown in the Atlantic Overturning Meridional Circulation (AMOC), which has been widely documented in the last years [44,45,46]. McCarthy et al., 2017 [44] described the variability and mechanisms of AMOC, showing evidence that its intensity has changed in recent decades. Smeed et al., 2018 provided strong observational evidence that the AMOC is a major factor in decadal-scale variability of North Atlantic climate [45]. And Caesar et al., 2018 documented a weakening of the AMOC by about 3 ± 1 Sverdrups (around 15 per cent) since the mid-twentieth century [46]. This weakened AMOC reduces heat transport to the north-eastern Atlantic and decreases the thermal contrast between warm surface waters and cold deep waters. As a result, the probability of cooler water inputs into coastal areas, like the studied lagoon, increases during the summer months, which could explain the de-creasing in maximum temperatures observed in the recent period.
The recorded temperatures in the lagoon reflected a coastal thermal instability which has significant biological implications. For example, gametogenesis, as mentioned above, is high temperature-dependent in R. decussatus or condition indices and bio-chemical parameters. Furthermore, stock population of R. decussatus can be affected because larvae and juveniles are highly sensitive to temperature and salinity variations, in-creasing their mortality and directly affecting the recruitment and finally stock population [47]. However, to be able to confirm that these changes are due to global or regional climate change processes, a longer time sampling would be necessary.
4.2. Biometrics Measurements
Temporal patterns revealed a remarkable seasonal growing dynamic of R. decussatus. FBW and STW showed the most pronounced variations, with maximums during high temperature months especially June 2023, which agrees with data reported in other bi-valve species where raising temperature and abundance of food stimulated growth and biomineralization [23,47,48]. Posterior decreasing of FBW suggested a response to less favourable environmental conditions. In contrast STW showed stable values, indicating that the body of the animal kept a physiological range necessary to perform basic functions even under environmental fluctuating conditions, and could be maintained by the protecting effect of the shell. GW presented slightly increasing values which repeated during spring and at the end of the year, reflecting a seasonal reproductive cycle synchronized with environmental factors such as temperature and nutrients availability. Morphometric measurements confirm that patterns and length showed high seasonal variability while width and thickness were more stable, suggesting a higher sensibility of longitudinal dimensions to environmental changes. Similar results were found by Ojea et al. [34] on their study in the same lagoon, when they analysed seasonal variation in weight and biochemical composition of the tissues in relation to the gametogenic cycle, they found that variations in body and gonad growth may occur in response to changes in environmental conditions. Whole data indicated that R. decussatus adjusted its own growth and reproduction in response to seasonality and environmental conditions which may be relevant to management and conservation of the population.
4.3. Seasonal Variations of Gametogenic Cycle
Gonadal development evolution in the R. decussatus clams of the Baldaio lagoon showed a seasonal pattern related to water temperature; spawning period, which is the highest stage of gonadal development, occurred between April-August 2023 and April-July 2024, having peaks in May-June; coincident with peaks in seawater temperature (May 2023 and July 2024). Other authors described the relationship between temperature and gonadal development in bivalves such as Maneiro et al., 2016, 2017, reporting a difference of 4 weeks in the beginning of spawning period as a result of combined effect of temperature and photoperiod in O. edulis compared with control group at low temperature [26,49]. Previous studies demonstrated that temperature has a direct influence in reproductive processes. Toba et al. 1995, found that in Manila clams (R. philippinarum) gonadal development rate increased proportionally with temperature in a range between 10-27°C [50]. Velez et al., 1981 [51] showed that high temperatures of 28°C could inhibit gonadal development in tropical mussels, and Delgado et al., 2007 [22]revealed species-specific variations in reproductive behaviour of R. decussatus and R. philipinarum related to temperature. Especially interesting is the comparison of the present results with previous data reported by Ojea et al. 2004, [43] in the same species and lagoon, that stated that spawning period lasted from May to August, having a peak in July-August. The comparison with the results presented in the current study showed that, in 20 years, spawning pattern of R. decussatus in Baldaio lagoon changed both in the onset and in its duration, 20 years ago onset begun in May but in our study, it occurred in April, and the end was in August while before was in September even in October. The spawning peak was in July or August 20 years ago but in the current study was in June-July, all this shows a difference in the onset of the spawning period, in the starting of resting period and in the peak of the spawning occurred one month earlier. The missing data due to weather conditions or logistic circumstances were not expected to provide much information, because the clams were mainly in sexual resting period. Ecological implication of this finding is evident, if the spawning period is brought forward, larvae could have difficulties surviving because they are not adapted to different conditions and this may be one of the reasons for the population decline.
4.4. Condition Indices
Variations in condition indices were observed during all the year, CI and BCI showed similar patterns, they are indices that give us an idea of the stage of the clam’s nutritional and reproductive condition, in both cases they were maximum during springtime of 2024 and minimum during summer of 2023, which is related with the stage of gonadal development and temperature as in Manila clam [50]. During the spawning period recorded in May 2024, almost all the clams sampled were in E4 stage, at this time the nutrition and gonadal condition of the clams is the highest because of the abundance of nutrients and food provided by upwelling events very frequent during spring and summer. Besides, in July of 2023 some animals had recently spawned, and this could be the reason of such low condition index values. The gonadal condition index was the most relevant in this study because of its direct relationship with gonadal development; the minimum value was registered in October, instead of summer when gonadal tissue was depleted during resting period, although the maximum value was in May 2024 following the same pattern as the other indices.
4.5. Biochemical Composition
In the gonadal tissue of R. decussatus clams from the Baldaio lagoon, biochemical composition showed a clear seasonal pattern throughout the study period. Proteins were the most abundant biomolecules present in the tissue, with high peaks in early summer (June and July 2023) and spring 2024, followed by decreases during winter, which reflect periods of intense metabolic demand and possibly reduced feeding activity. Carbohydrates had more irregular patterns with sudden falls during spring and autumn suggesting short term energy storage events possibly related to food availability, recovery after spawning or thermal-salinity stress events. Lipid fractions were low and stable during all year except a peak during late summer 2024. These patterns showed that biochemical composition varied in response to environmental conditions and the reproductive cycle of gonadal development as it was stated by Pérez Camacho et al. 2003 [10]. Significant correlation between GCI and protein and lipid concentration is consistent and agrees with the findings of Ojea et al. [43], where the protein content and total lipid content were directly related to GCI, but not with the findings about total glycogen content (carbohydrates). However, other studies showed important role of carbohydrates in the reproduction of bivalves with maximum glycogen content immediately before and during gamete development [52,53], which is consistent with the current data. Similar results were found by Li et al., 2011 [54] they suggested that carbohydrates played the most important role in reproduction on the clam Mactra chinensis (Philippi, 1846) with lipid biosynthesis linked to glycogen breakdown and protein content with a synchronous increase with oocyte size and lipid concentration. Authors should discuss the results and how they can be interpreted from the perspective of previous studies and of the working hypotheses. The findings and their implications should be discussed in the broadest context possible. Future research directions may also be highlighted.
5. Conclusions
The present study evaluated the effects of climate change, especially seawater temperature on a population of R. decussatus clams of the Galician coast (NW Spain). The histological analysis of gonadal development showed a one-month advance in the spawning period of R. decussatus clams of the Baldaio lagoon compared with 20 years ago, starting in April instead May; and in fact, the entire annual cycle of gonadal development-resting phase has suffered changes.
Author Contributions
Conceptualization, S.N. and M.L.P.; methodology, D.L., S.N., J.O., A.J.P. and M.L.P.; software, D.L., S.N. and M.L.P.; validation, D.L., S.N., J.O., A.J.P. and M.L.P.; formal analysis, D.L., S.N., J.O., A.J.P. and M.L.P.; investigation, D.L., S.N., J.O., A.J.P. and M.L.P.; resources, S.N., J.O., A.J.P. and M.L.P.; data curation, D.L., S.N., A.J.P. and M.L.P.; writing—original draft preparation, D.L. and M.L.P.; writing—review and editing, D.L., S.N., J.O., A.J.P. and M.L.P.; visualization, D.L., S.N., J.O., A.J.P. and M.L.P.; supervision, S.N., J.O. and M.L.P.; project administration, A.J.P. and M.L.P.; funding acquisition, S.N., A.J.P. and M.L.P.. All authors have read and agreed to the published version of the manuscript.
Funding
This work was partially funded by the Galician Marine Science Program, which is part of the Complementary Science Plans of the Ministry of Science, Innovation and Universities included in the Recovery, Transformation and Resilience Plan (PRTR-C17.I1). It is funded through the Xunta de Galicia (Regional Government of Galicia) with funds from NextGenerationEU and the European Maritime, Fisheries and Aquaculture Fund of the European Union. D.L. was contracted as predoctoral researcher by this project.
Institutional Review Board Statement
This study was conducted using specimens of the grooved carpet shell clam (Ruditapes decussatus). In accordance with current Spanish and European legislation on animal experimentation (Directive 2010/63/EU and Royal Decree 53/2013), bivalves are not included among the animal species requiring authorization from an ethics committee.
Data Availability Statement
All data are contained within the article. Please contact the corresponding author for additional data requests.
Acknowledgments
We thank the Asociación de Mariscadoras Fonte de Santa Helena of Baldaio (Galicia, Spain) for their kindness and invaluable help during the sampling, the staff of the CIMA (Centro de Investigacións Mariñas de Galicia) in Ribadeo for their collaboration and technical support and Victoriano Gómez for his help in the lipid determination. We also thank .
Conflicts of Interest
The authors declare no conflicts of interest.
Abbreviations
| BCI | Body Condition index |
| CI | Condition index |
| CIMA | Centro de Investigacións Mariñas de Galicia |
| DCI | Dry condition index |
| FBW | Total fresh body weight |
| GCI | Gonadal condition index |
| GW | Gonadal-hepatopancreas tissue weight |
| NW | Northwest |
| SD | Standard deviation |
| STW | Fresh soft tissue weight |
| SW | Shell weight |
| TSL | Total shell length |
| TST | Total shell thickness |
| TSW | Total shell width |
References
- IPCC. Intergovernmental Panel on Climate Change) Global Warming of 1.5°C. An IPCC Special Report on the Impacts of Global Warming of 1.5°C above Pre-Industrial Levels and related Global Greenhouse Gas Emission Pathways, in the Context of Strengthening the Global Response to the Threat of Climate Change, Sustainable Development, and Efforts to Eradicate PovertyCambridge University Press; Masson-Delmotte, V., Zhai, P., Pörtner, H.O., Roberts, D., Skea, J., Shukla, P.R., Pirani, A., Mofouma-Okia, W., Péan, C., Pidcock, R., Connors, S., Matthews, J.B.R., Chen, Y., Zhou, X., Gomis, M.I., Lonnoy, E., Maycock, T., Tignor, M., Waterfield, T., Eds.; Cambridge, UK and New York, NY, USA, 2018; ISBN 978-1-009-15795-7. [Google Scholar]
- Copernicus Ocean State Report (OSR8), 8th ed.; Von Schuckmann, K., Moreira, L., Cancet, M., Gues, F., Autret, E., Aydogdu, A., Castrillo, L., Ciani, D., Cipollone, A., Clementi, E., et al., Eds.; Copernicus Publications, 2024; Volume 1.2. [Google Scholar] [CrossRef]
- Peñuelas, J.; Sardans, J.; Filella, I.; Estiarte, M.; Llusià, J.; Ogaya, R.; Carnicer, J.; Bartrons, M.; Rivas-Ubach, A.; Grau, O.; et al. Assessment of the Impacts of Climate Change on Mediterranean Terrestrial Ecosystems Based on Data from Field Experiments and Long-Term Monitored Field Gradients in Catalonia. Environ. Exp. Bot. 2017, 152, 49–59. [Google Scholar] [CrossRef]
- Ellwanger, J.H.; Ziliotto, M.; Kulmann-Leal, B.; Chies, J.A.B. Environmental Challenges in Southern Brazil: Impacts of Pollution and Extreme Weather Events on Biodiversity and Human Health Multidisciplinary. Int. J. Environ. Res. Public Health 2025, 22, 305. [Google Scholar] [CrossRef]
- Montoro-Mendoza, A.; Calvo-Sancho, C.; González-Alemán, J.J.; Díaz-Fernández, J.; Bolgiani, P.; Sastre, M.; Moreno-Chamarro, E.; Martín, M.L. Environments Conductive to Tropical Transitions in the North Atlantic: Anthropogenic Climate Change Influence Study. Atmos. Res. 2024, 310. [Google Scholar] [CrossRef]
- Kraeuter, J.; Beal, B. Molluscan Shellfish Aquaculture: A Practical Guide; Shumway, S.E., Ed.; 5m Publishing: Wallingford Oxfordshire, 2021; pp. 41–60. ISBN 9781789181470. [Google Scholar]
- Mannai, A.; Hmida, L.; Bouraoui, Z.; Guerbej, H.; Gharred, T.; Jebali, J. Does Thermal Stress Modulate the Biochemical and Physiological Responses of Ruditapes decussatus Exposed to the Progestin Levonorgestrel? Environ. Sci. Pollut. Res. Int. 2022, 29, 85211–85228. [Google Scholar] [CrossRef]
- Urrutia, M.B.; Ibarrola, I.; Iglesias, J.I.P.; Navarro, E. Energetics of Growth and Reproduction in a High-Tidal Population of the Clam Ruditapes decussatus from Urdaibai Estuary (Basque Country, N. Spain). J. Sea Res. 1999, 42, 35–48. [Google Scholar] [CrossRef]
- Vázquez, E.; Woodin, S.A.; Wethey, D.S.; Peteiro, L.G.; Olabarria, C. Reproduction Under Stress: Acute Effect of Low Salinities and Heat Waves on Reproductive Cycle of Four Ecologically and Commercially Important Bivalves. Front. Mar. Sci. 2021, 8, 685282. [Google Scholar] [CrossRef]
- Pérez Camacho, A.; Delgado, M.; Fernández-Reiriz, M.J.; Labarta, U. Energy Balance, Gonad Development and Biochemical Composition in the Clam Ruditapes decussatus. Mar. Ecol. Prog. Ser. 2003, 258, 133–145. [Google Scholar] [CrossRef]
- Macho, G.; Woodin, S.A.; Wethey, D.S.; Vázquez, E. Impacts of Sublethal and Lethal High Temperatures on Clams Exploited in European Fisheries. J. Shellfish Res. 2016, 35, 405–419. [Google Scholar] [CrossRef]
- Velez, C.; Figueira, E.; Soares, A.M.V.M.; Freitas, R. Effects of Seawater Temperature Increase on Economically Relevant Native and Introduced Clam Species. Mar. Environ. Res. 2017, 123, 62–70. [Google Scholar] [CrossRef]
- Fabra, M.; Morrall, Z.; Helmer, L.; Watson, G.; Preston, J. Filtration Behaviour of Ostrea edulis: Diurnal Rhythmicity Influenced by Light Cycles, Body Size and Water Temperature. Estuaries and Coasts 2025, 48. [Google Scholar] [CrossRef]
- Jansson, A.; Norkko, J.; Dupont, S.; Norkko, A. Growth and Survival in a Changing Environment: Combined Effects of Moderate Hypoxia and Low PH on Juvenile Bivalve Macoma balthica. J. Sea Res. 2015, 102, 41–47. [Google Scholar] [CrossRef]
- Schwaner, C.; Barbosa, M.; Connors, P.; Park, T.J.; de Silva, D.; Griffith, A.; Gobler, C.J.; Pales Espinosa, E.; Allam, B. Experimental Acidification Increases Susceptibility of Mercenaria mercenaria to Infection by Vibrio spp. Mar. Environ. Res. 2020, 154. [Google Scholar] [CrossRef]
- Mahé, M.; Aurelle, D.; Poggiale, J.C.; Mayot, N. Assessment of the Distribution of Ruditapes Spp. in Northern Mediterranean Sites Using Morphological and Genetic Data. J. Molluscan Stud. 2022, 88. [Google Scholar] [CrossRef]
- Hickman, C.; Roberts, L.; Larson, A. Integrated Principles of Zoology, 11th ed.; McGraw-Hill, International, 2001; Volume 16, pp. 325–355. ISBN 0–07–290961–7. [Google Scholar]
- Aranda-Burgos, J.A.; Da Costa, F.; Nóvoa, S.; Ojea, J.; Martínez-Patiño, D. Effects of Microalgal Diet on Growth, Survival, Biochemical and Fatty Acid Composition of Ruditapes decussatus Larvae. Aquaculture 2014, 420–421, 38–48. [Google Scholar] [CrossRef]
- Delgado, M.; Camacho, A.P. Histological Study of the Gonadal Development of Ruditapes decussatus (L.) (Mollusca: Bivalvia) and Its with Available Food*. Sci. Mar. 2005, 69, 87–97. [Google Scholar] [CrossRef]
- Villalba, A.; Carballal, M.J.; Lopez, M.C. Estudio Del Ciclo Gonadal de Tres Especies de Almeja, Ruditapes decussatus, Venerupis pullastra y Venerupis rhomboides, de Las Rías Gallegas. IV Congreso Nacional de Acuicultura, Vilanova de Arousa, Spain, January 1993; pp. 341–346. [Google Scholar]
- Smaoui-damak, W.; Mathieu, M.; Rebai, T.; Hamza-chaffai, A. Histology of the Reproductive Tissue of the Clam Ruditapes decussatus from the Gulf of Gabès (Tunisia). Invertebr. Reprod. Dev. 2007, 50, 117–126. [Google Scholar] [CrossRef]
- Delgado, M.; Pérez-Camacho, A. Comparative Study of Gonadal Development of Ruditapes philippinarum (Adams and Reeve) and Ruditapes decussatus (L.) (Mollusca: Bivalvia): Influence of Temperature. Sci. Mar. 2007, 71, 471–484. [Google Scholar] [CrossRef]
- Delgado, M.; Pérez-Camacho, A. A Study of Gonadal Development in Ruditapes decussatus (L.) (Mollusca, Bivalvia), Using Image Analysis Techniques: Influence of Food Ration and Energy Balance. J. Shellfish Res. 2003, 22, 435–441. Available online: http://hdl.handle.net/10261/313193.
- Matias, D.; Joaquim, S.; Matias, A.M.; Moura, P.; de Sousa, J.T.; Sobral, P.; Leitão, A. The Reproductive Cycle of the European Clam Ruditapes decussatus (L., 1758) in Two Portuguese Populations: Implications for Management and Aquaculture Programs. Aquaculture 2013, 406–407, 52–61. [Google Scholar] [CrossRef]
- Ojea, J.; Abad, M.; Pazos, A.J.; Martínez, D.; Novoa, S.; García-Martínez, P.; Sánchez, J.L. Effects of Temperature Regime on Broodstock Conditioning of Ruditapes decussatus. J. Shellfish Res. 2008, 27, 1093–1100. [Google Scholar] [CrossRef]
- Maneiro, V.; Silva, A.; Pazos, A.J.; Sánchez, J.L.; Pérez-Parallé, M.L. Effects of Temperature and Photoperiod on the Conditioning of the Flat Oyster (Ostrea edulis L.) in Autumn. Aquac. Res. 2017, 48, 4554–4562. [Google Scholar] [CrossRef]
- Xunta De Galicia; Consellería do Mar. Pesca de Galicia Anuario de pesca de Galicia 2024. Available online: https://www.pescadegalicia.gal/gl/publicacions (accessed on September 2025).
- Aranguren, R.; Gomez-León, J.; Balseiro, P.; Costa, M.M.; Novoa, B.; Figueras, A. Abnormal Mortalities of the Carpet Shell Clam Ruditapes decussatus (Linnaeus 1756) in Natural Bed Populations a Practical Approach. Aquac. Res. 2014, 45, 1303–1310. [Google Scholar] [CrossRef]
- Instituto Geológico y Minero de España. Estudio y Catalogación de Puntos de Interés Geológico-Minero En El Sector Occidental de Galicia. 1981. Available online: https://info.igme.es/SidPDF%5C016000%5C984%5C16984_0001.pdf (accessed on 10 September 2025).
- Duisan, L.; Salim, G.; Ransangan, J. Sex Ratio, Gonadal and Condition Indexes of the Asiatic Hard Clam, Meretrix meretrix in Marudu Bay, Malaysia. Biodiversitas 2021, 22, 4895–4904. [Google Scholar] [CrossRef]
- Walne, P.R. Experiments on the Culture in the Sea of the Butterfish Venerupis decussata L. Aquaculture 1976, 8, 371–381. [Google Scholar] [CrossRef]
- Lucas, A.; Beninger, P.G. The Use of Physiological Condition Indices in Marine Bivalve Aquaculture. Aquaculture 1985, 44, 187–200. [Google Scholar] [CrossRef]
- Howard, D.W.; Lewis, E.J.; Keller, B.J. Histological Techniques for Marine Bivalve Mollusks and Crustaceans NOAA Technical Memorandum NOS NCCOS, 2004; 5, 218 pp. Available online: https://repository.library.noaa.gov/view/noaa/1790/noaa_1790_DS1.pdf (accessed on 12 December 2022).
- Ojea, J.; Pazos, A.J.; Martínez, D.; Novoa, S.; Sánchez, J.L.; Abad, M. Seasonal Variation in Weight and Biochemical Composition of the Tissues of Ruditapes decussatus in Relation to the Gametogenic Cycle. Aquaculture 2004, 238, 451–468. [Google Scholar] [CrossRef]
- Nóvoa, S. Metabolismo Lipídico, Ácidos Grasos En El Cultivo Larvario De Almeja Babosa, Venerupis Pullastra (Montagu, 1803). “Calidad Ovocitaria, Larvaria Y Nutricional Con Una Aproximación Al Uso De La Microencapsulación Lipídica”. PhD. Thesis, Universidade de Santiago de Compostela, Santiago de Compostela, Spain, 29 February 2008. Available online: https://hdl.handle.net/10347/2397.
- Lowry, O.H.; Rosebrough, N.J.; Farr, A.L.; Randall, R.J. Protein Measurement With the folin phenol reagent*. J. Biol. Chem. 1951, 265–275. [Google Scholar] [CrossRef]
- Fraga, F. Determinación De Glucógeno En Moluscos Con El Reactivo De Antrona. Inv. Pesq. 1956, 3, 69–74. [Google Scholar]
- Folch, J.; Lees, M.; Sloane, G.H. A Simple Method for the Isolation and Purification of Total Lipides from Animal Tissues. J. Biol. Chem. 1956, 497–509. [Google Scholar] [CrossRef]
- Beninger, P.G.; Lucas, A. Seasonal Variations in Condition, Reproductive Activity, and Gross Biochemical Composition of Two Species of Adult Clam Reared in a Common Habitat: Tapes decussatus L. (Jeffreys) and Tapes philippinarum (Adams & Reeve). Mar. Biol. Ecol. 1984, 79, 19–37. [Google Scholar] [CrossRef]
- Pazos, A.J.; Román, G.; Acosta, C.P.; Abad, M.; Sánchez, J.L. Seasonal Changes in Condition and Biochemical Composition of the Scallop Pecten maximus L. from Suspended Culture in the Ria de Arousa (Galicia, N.W. Spain) in Relation to Environmental Conditions. J. Exp. Mar. Biol. Ecol. 1997, 211, 169–193. [Google Scholar] [CrossRef]
- Instituto Tecnolóxico para o Control do Medio Mariño de Galicia, X. de G. INTECMAR. Available online: https://www.intecmar.gal/ctd/ (accessed on 26 May 2025).
- Simantiris, N.; Theocharis, A. Seasonal Variability of Hydrological Parameters and Estimation of Circulation Patterns: Application to a Mediterranean Coastal Lagoon. J. Mar. Sci. Eng. 2024, 12. [Google Scholar] [CrossRef]
- Ojea, J.; Martínez, D.; Novoa, S.; Pazos, A.J.; Abad, M. Contenido y Distribución de Glucógeno En Relación Con El Ciclo Gametogénico de Ruditapes decussatus (L., 1758) En Una Población Natural de Las lagunas de Baldaio (Galicia, Noroeste de España). Bol. Inst. Esp. Oceanogr. 2002, 18, 307–313. Available online: http://hdl.handle.net/10261/313231.
- Mccarthy, G.D.; Smeed, D.A.; Cunningham, S.A.; Roberts, C.D. Atlantic Meridional Overturning Circulation. In Marine Climate Change Impacts Partnership: Science Review; 2017. [Google Scholar] [CrossRef]
- Smeed, D.A.; Josey, S.A.; Beaulieu, C.; Johns, W.E.; Moat, B.I.; Frajka-Williams, E.; Rayner, D.; Meinen, C.S.; Baringer, M.O.; Bryden, H.L.; et al. The North Atlantic Ocean Is in a State of Reduced Overturning. Geophys. Res. Lett. 2018, 45, 1527–1533. [Google Scholar] [CrossRef]
- Caesar, L.; Rahmstorf, S.; Robinson, A.; Feulner, G.; Saba, V. Observed Fingerprint of a Weakening Atlantic Ocean Overturning Circulation. Nature 2018, 556, 191–196. [Google Scholar] [CrossRef] [PubMed]
- Rato, A.; Joaquim, S.; Matias, A.M.; Roque, C.; Marques, A.; Matias, D. The Impact of Climate Change on Bivalve Farming: Combined Effect of Temperature and Salinity on Survival and Feeding Behaviour of Clams Ruditapes decussatus. Front. Mar. Sci. 2022, 9. [Google Scholar] [CrossRef]
- Walne, P.R. Factors Affecting the Relation Between Feeding and Growth in Bivalves quantity of food consumed. In Harvesting Polluted Waters; Devik, O., Ed.; Springer: Boston, MA, 1976; ISBN 978-1-4613-4328-8. [Google Scholar] [CrossRef]
- Liu, W.; Li, Q.; Kong, L. Reproductive Cycle and Seasonal Variations in Lipid Content and Fatty Acid Composition in Gonad of the Cockle Fulvia mutica in Relation to Temperature and Food. J. Ocean Univ. China 2013, 12, 427–433. [Google Scholar] [CrossRef]
- Maneiro, V.; Pérez-Parallé, M.L.; Pazos, A.J.; Silva, A.; Sánchez, J.L. Combined Effects of Temperature and Photoperiod on the Conditioning of the Flat Oyster (Ostrea edulis [Linnaeus, 1758]) in Winter. J. Shellfish. Res. 2016, 35, 137–141. [Google Scholar] [CrossRef]
- Toba, M.; Miyama, Y. Influence of Temperature on the Sexual Maturation in Manila Clam, Ruditapes philippinarum. Aquaculture Science 1995, 43, 305–314. [Google Scholar] [CrossRef]
- Vélez, A.; Epifanio, C.E. Effects of Temperature and Ration on Gametogenesis and Growth in the Tropical Mussel Perna perna (L.). Aquaculture 1981, 22, 21–26. [Google Scholar] [CrossRef]
- Ansell, A.D.; Frenkiel, L.; Moueza, M. Seasonal Changes in Tissue Weight and Biochemical Composition for the Bivalve Donax trunculus L. on the Algerian Coast. J. Exp. Mar. Biol. Ecol. 1980, 45, 105–116. [Google Scholar] [CrossRef]
- Ansell, A.D. Distribution, Growth and Seasonal Changes in Biochemical Composition for the Bivalve Donax vittatus (Da Costa) from Kames Bay, Millport. J. Exp. Mar. Biol. Ecol. 1972, 10, 137–150. [Google Scholar] [CrossRef]
- Li, Qi; Yang, Lin; Ke, Qiaozhen; Kong, Lingfeng. Gametogenic Cycle and Biochemical Composition of the Clam Mactra chinensis (Mollusca Bivalvia) Implications for Aquaculture and Wild Stock Management. Mar. Biol. Res. 2011, 7, 407–415. [Google Scholar] [CrossRef]
Figure 1.
Sampling sex distribution in the study period in percentage. Females (♀), Males (♂) and undefined (UND).
Figure 1.
Sampling sex distribution in the study period in percentage. Females (♀), Males (♂) and undefined (UND).
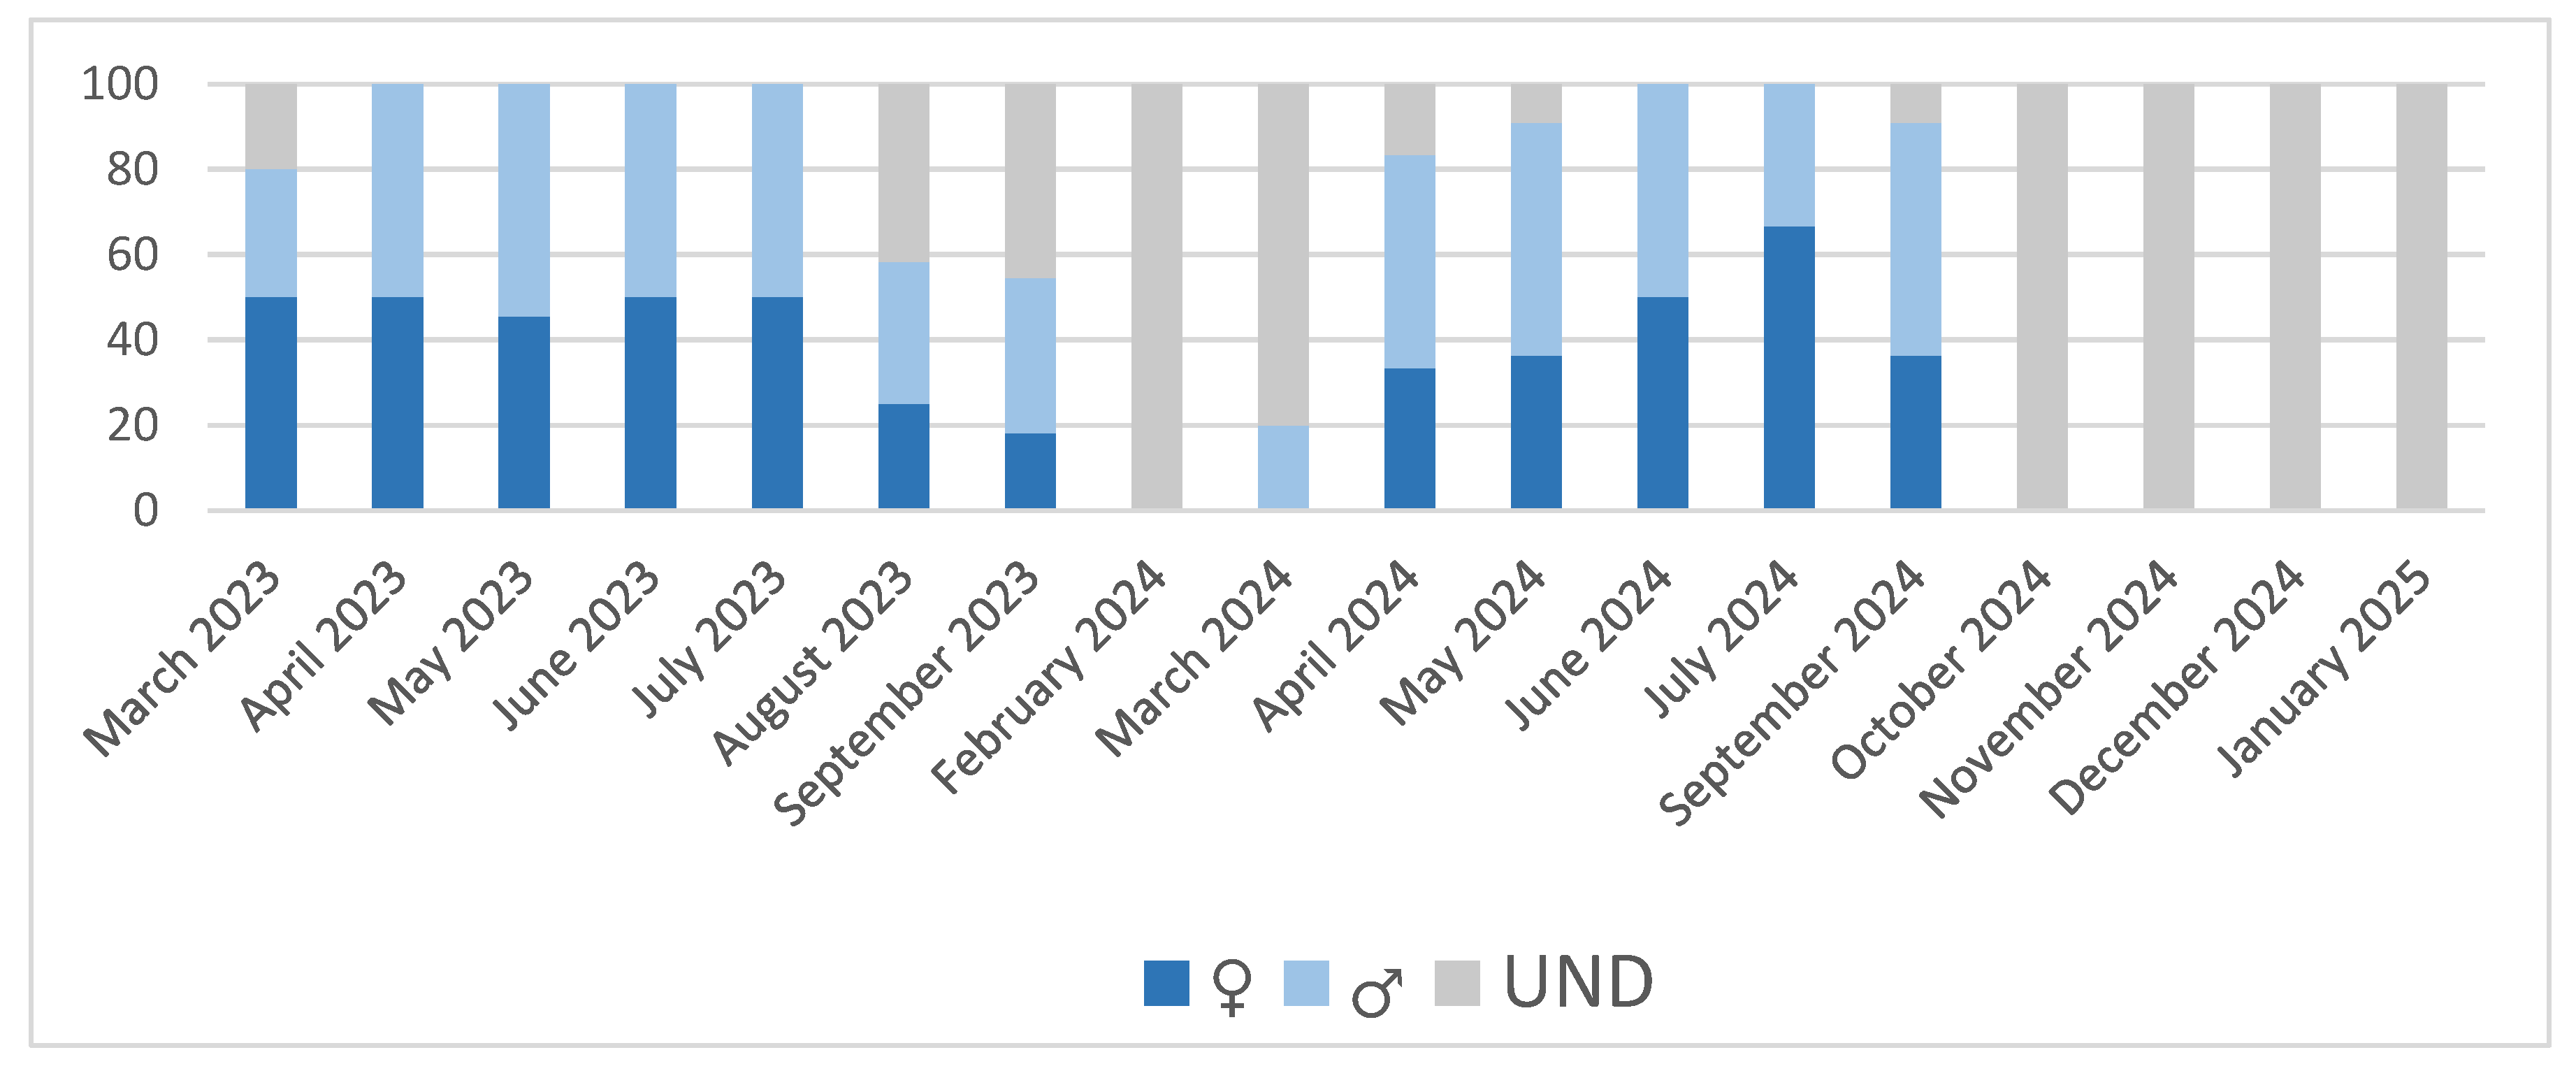
Figure 2.
Microscopic histological images of sampled gonadal tissue. Two images per month are shown. The left images correspond to female and right to male gonadal tissue. All the images were taken with 10x magnification optical microscope, the scale bar represents 200 µm. Representative structures corresponding to each phase are marked in the images. o: primordial oocytes in follicular wall; fw: follicular wall; m: male incipient follicle; p: pedunculated oocytes attached to the walls of the follicle; spz: spermatozoids; ph: polyhedral form of the ripe oocytes; ro: residual atretic oocyte; r: residuals from cytolysis after spawning d: radial arrangement of spermatogonia from the follicle periphery towards the lumen where mature spermatozoa accumulate and occasionally the gonadal duct; mo: mature oocyte in a gonad partially ripped; c: connective undifferentiated tissue; mt: muscular tissue; f: empty follicle.
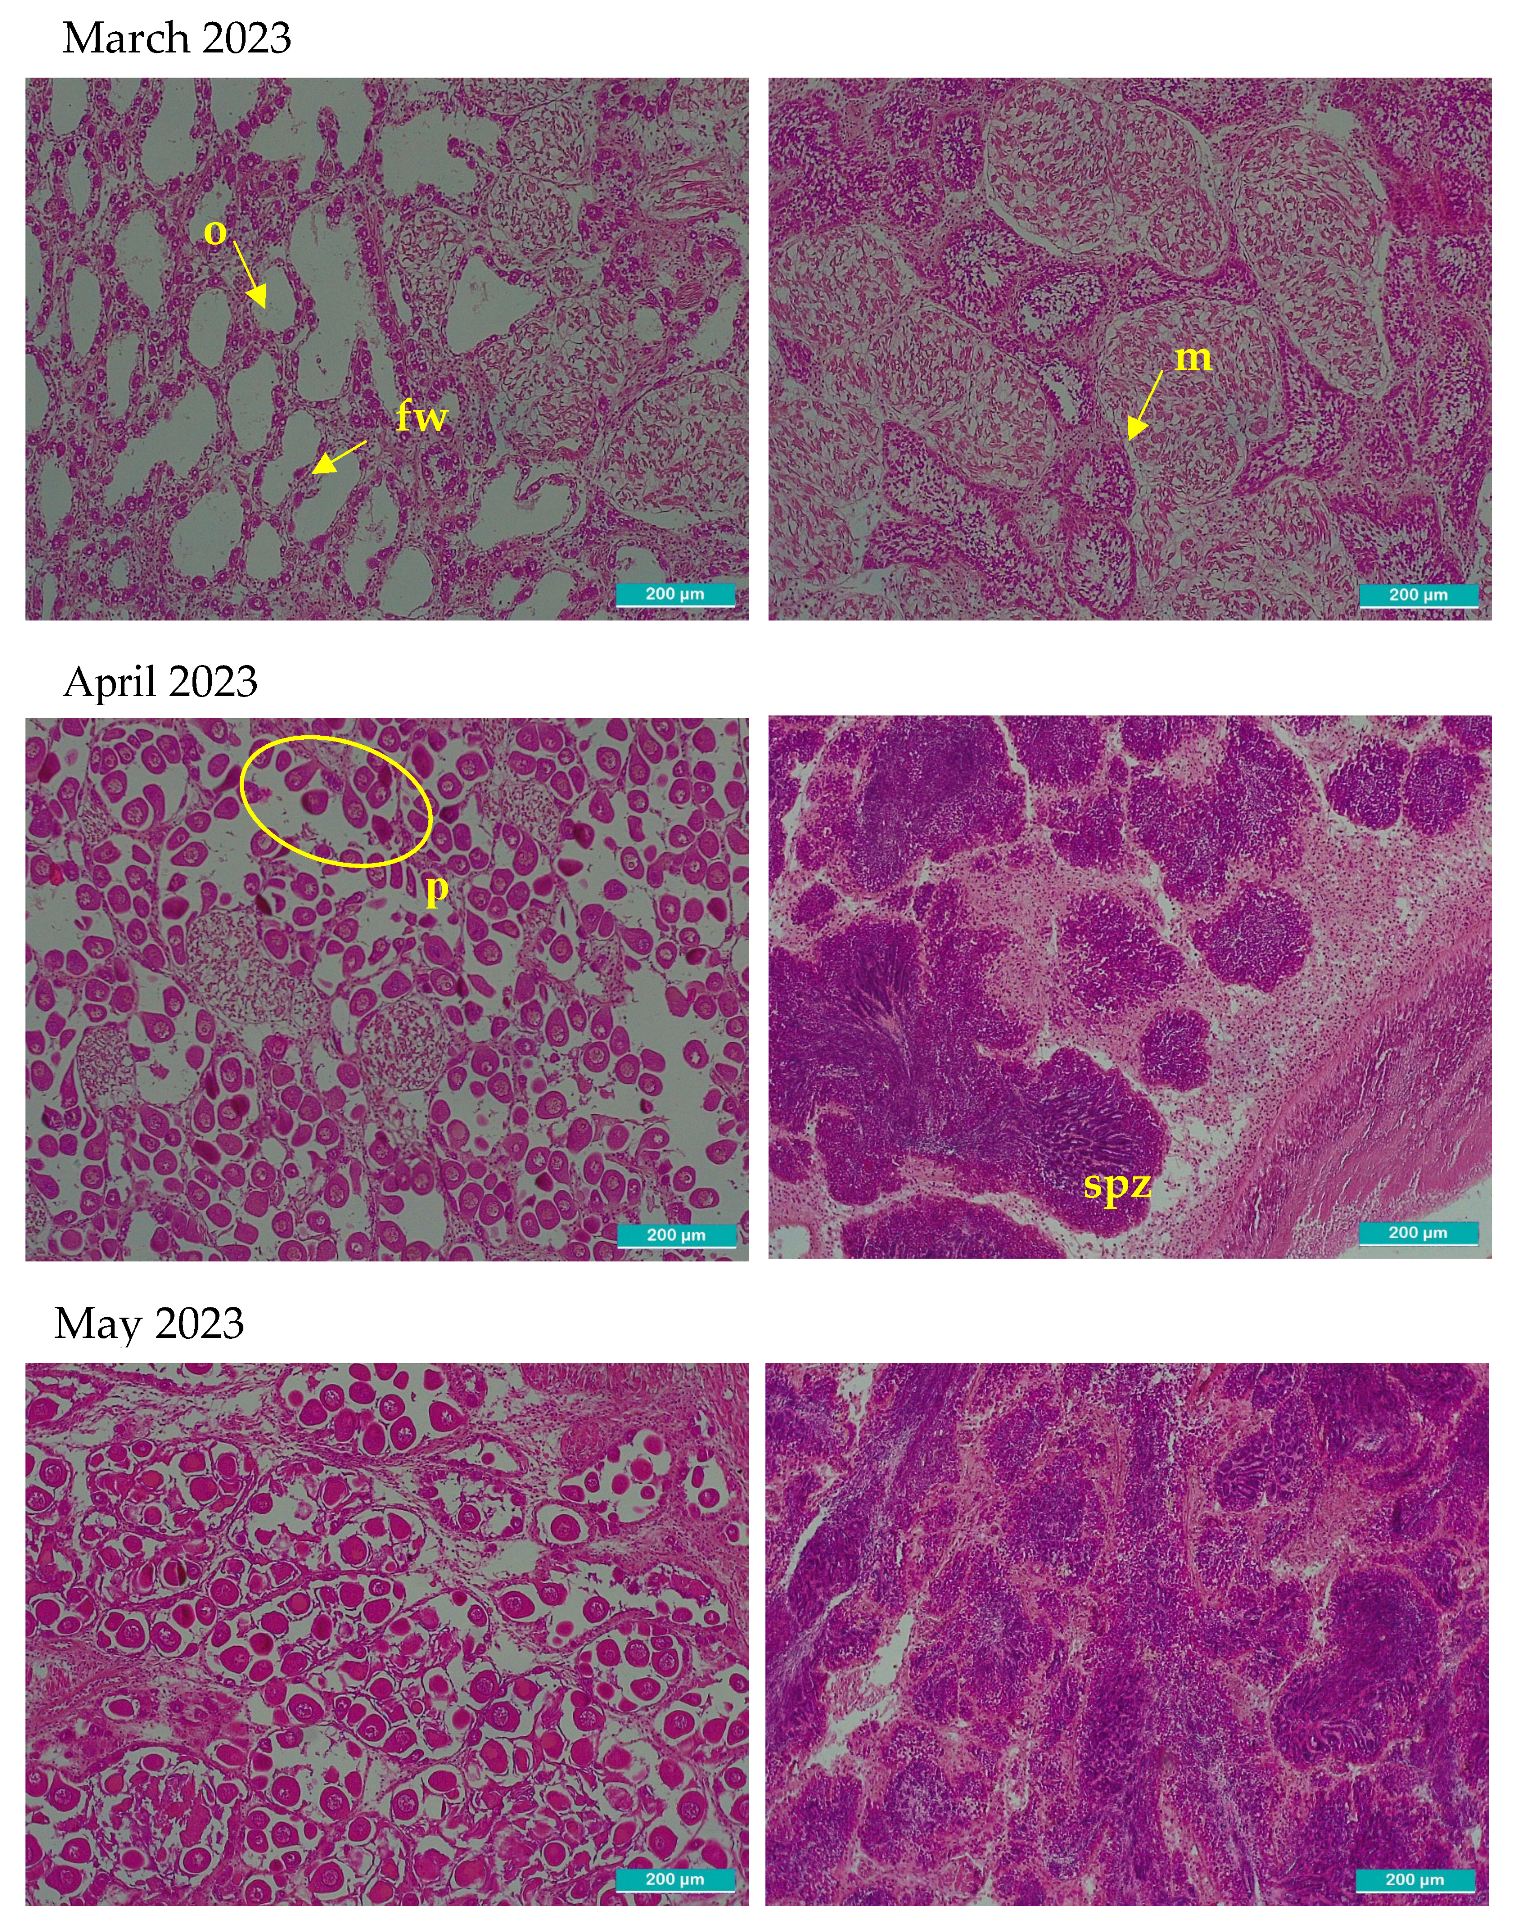
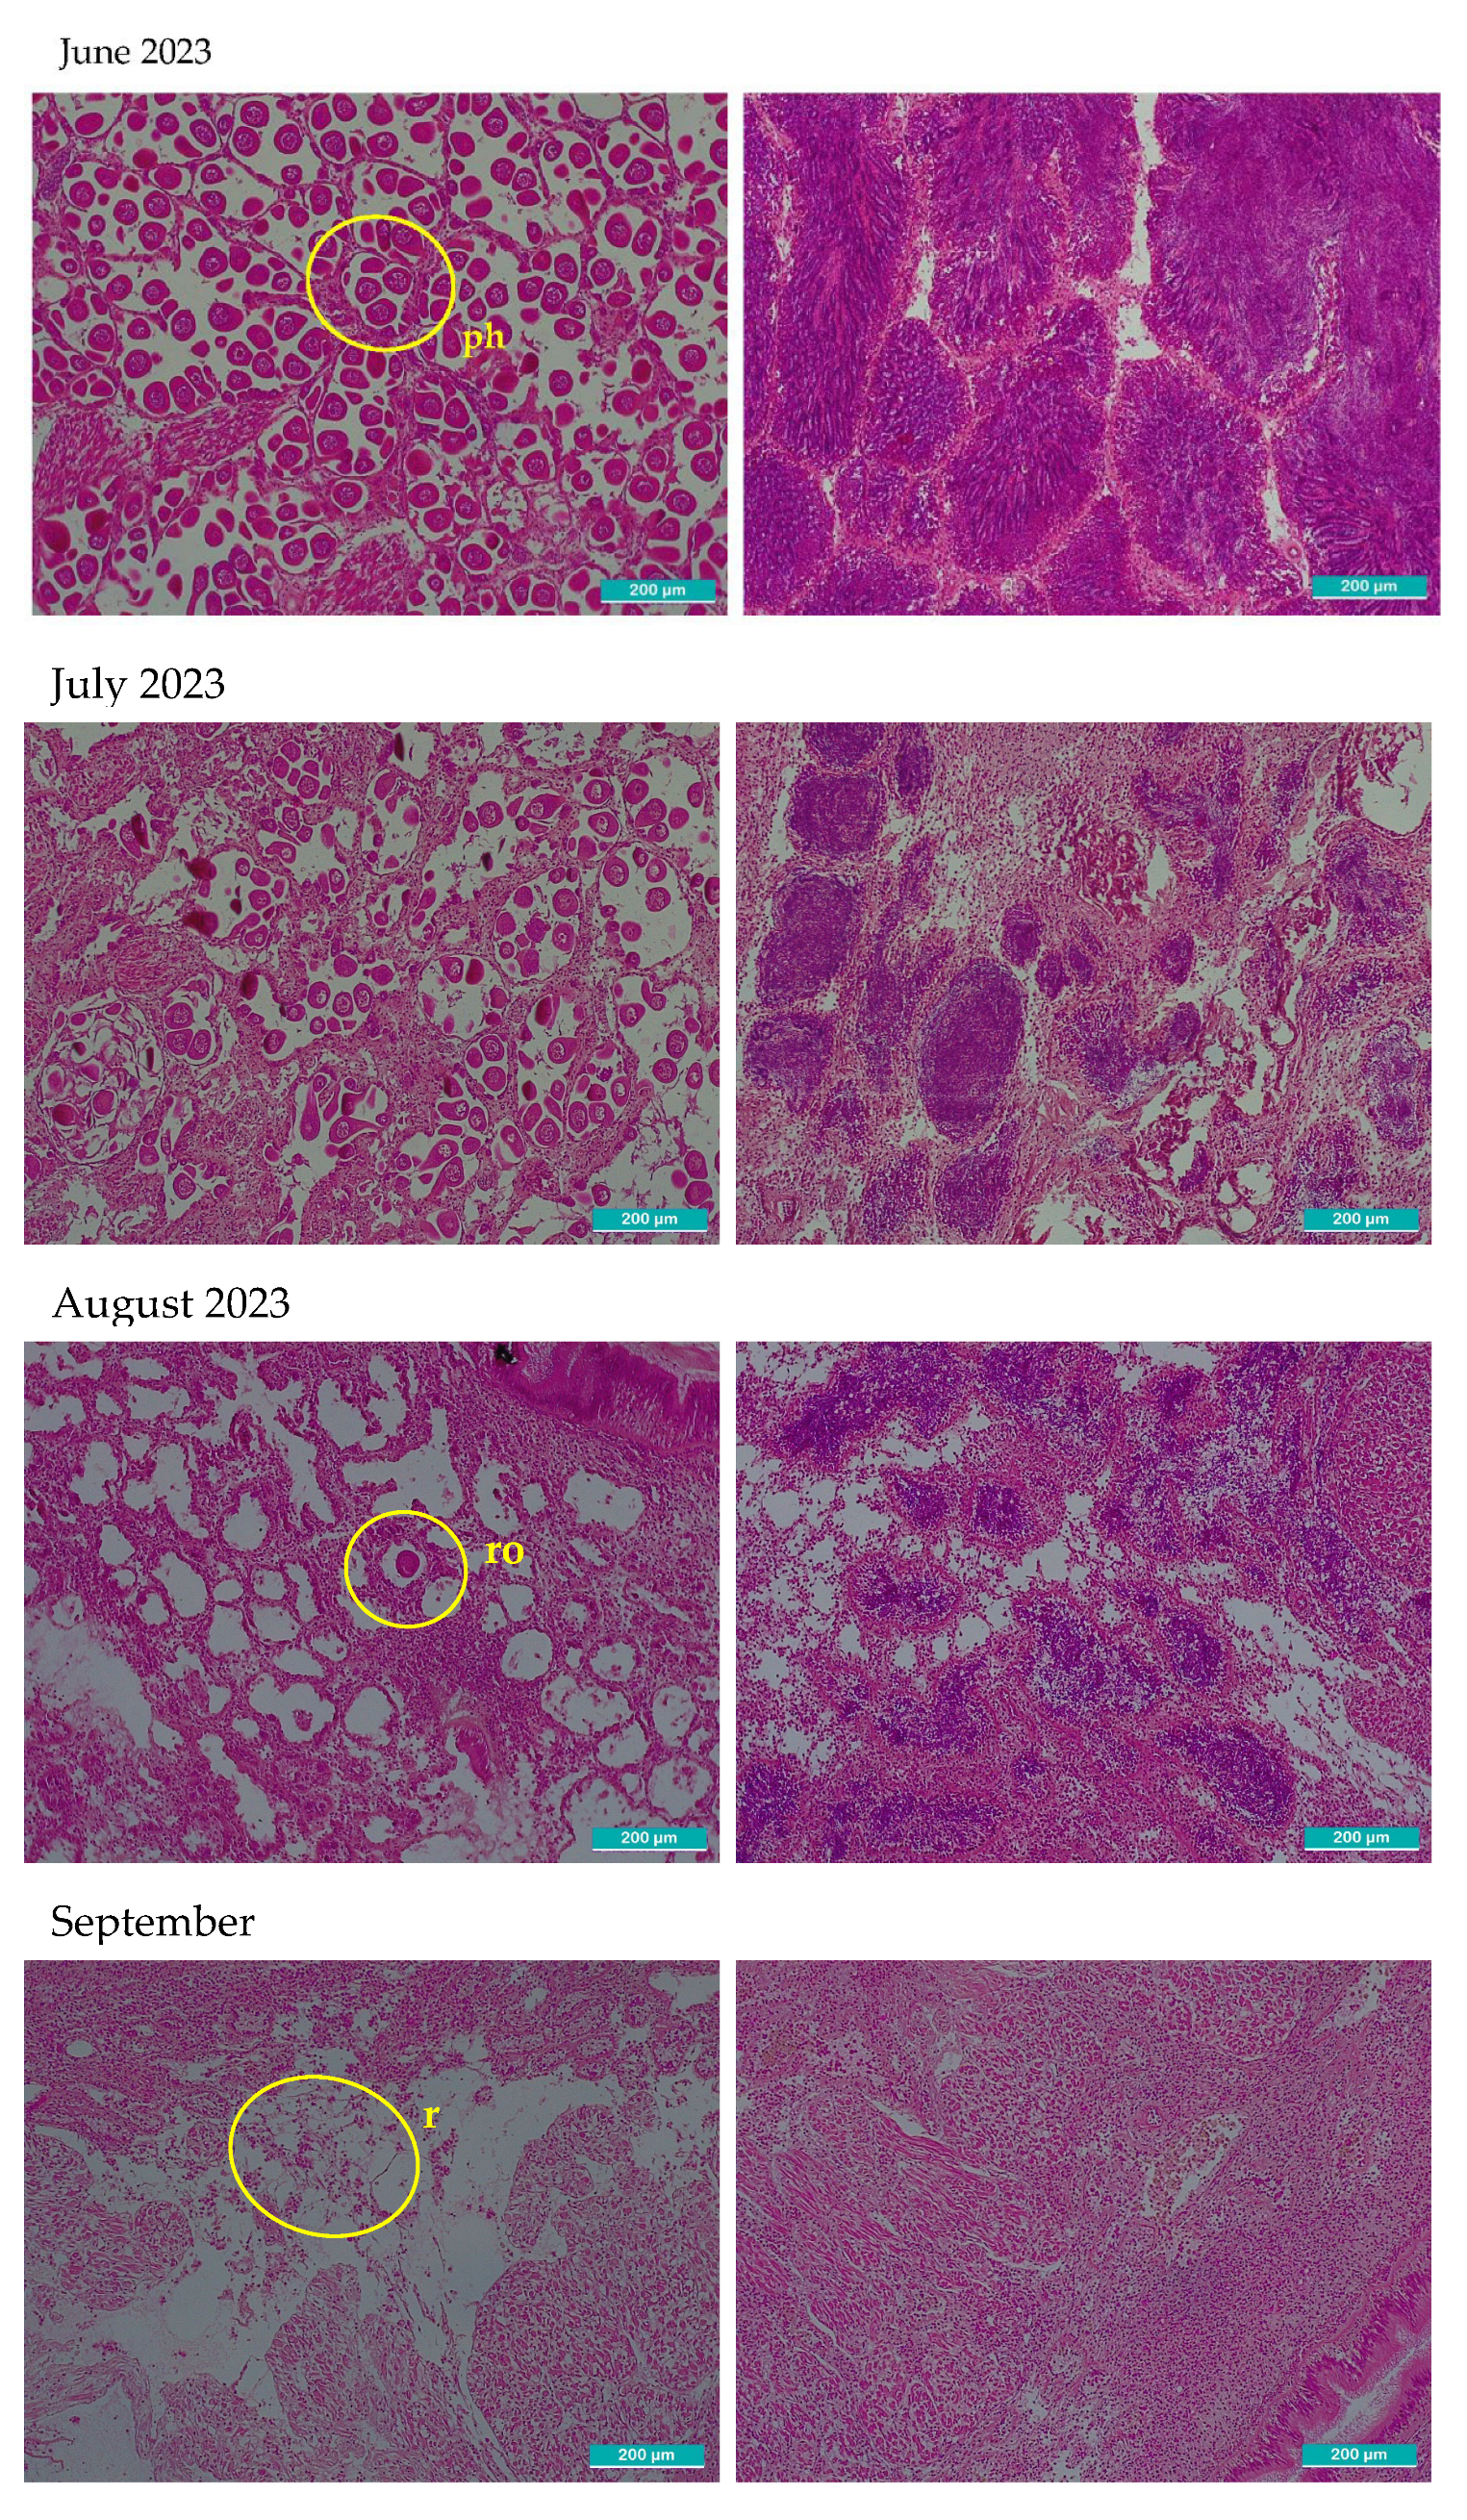
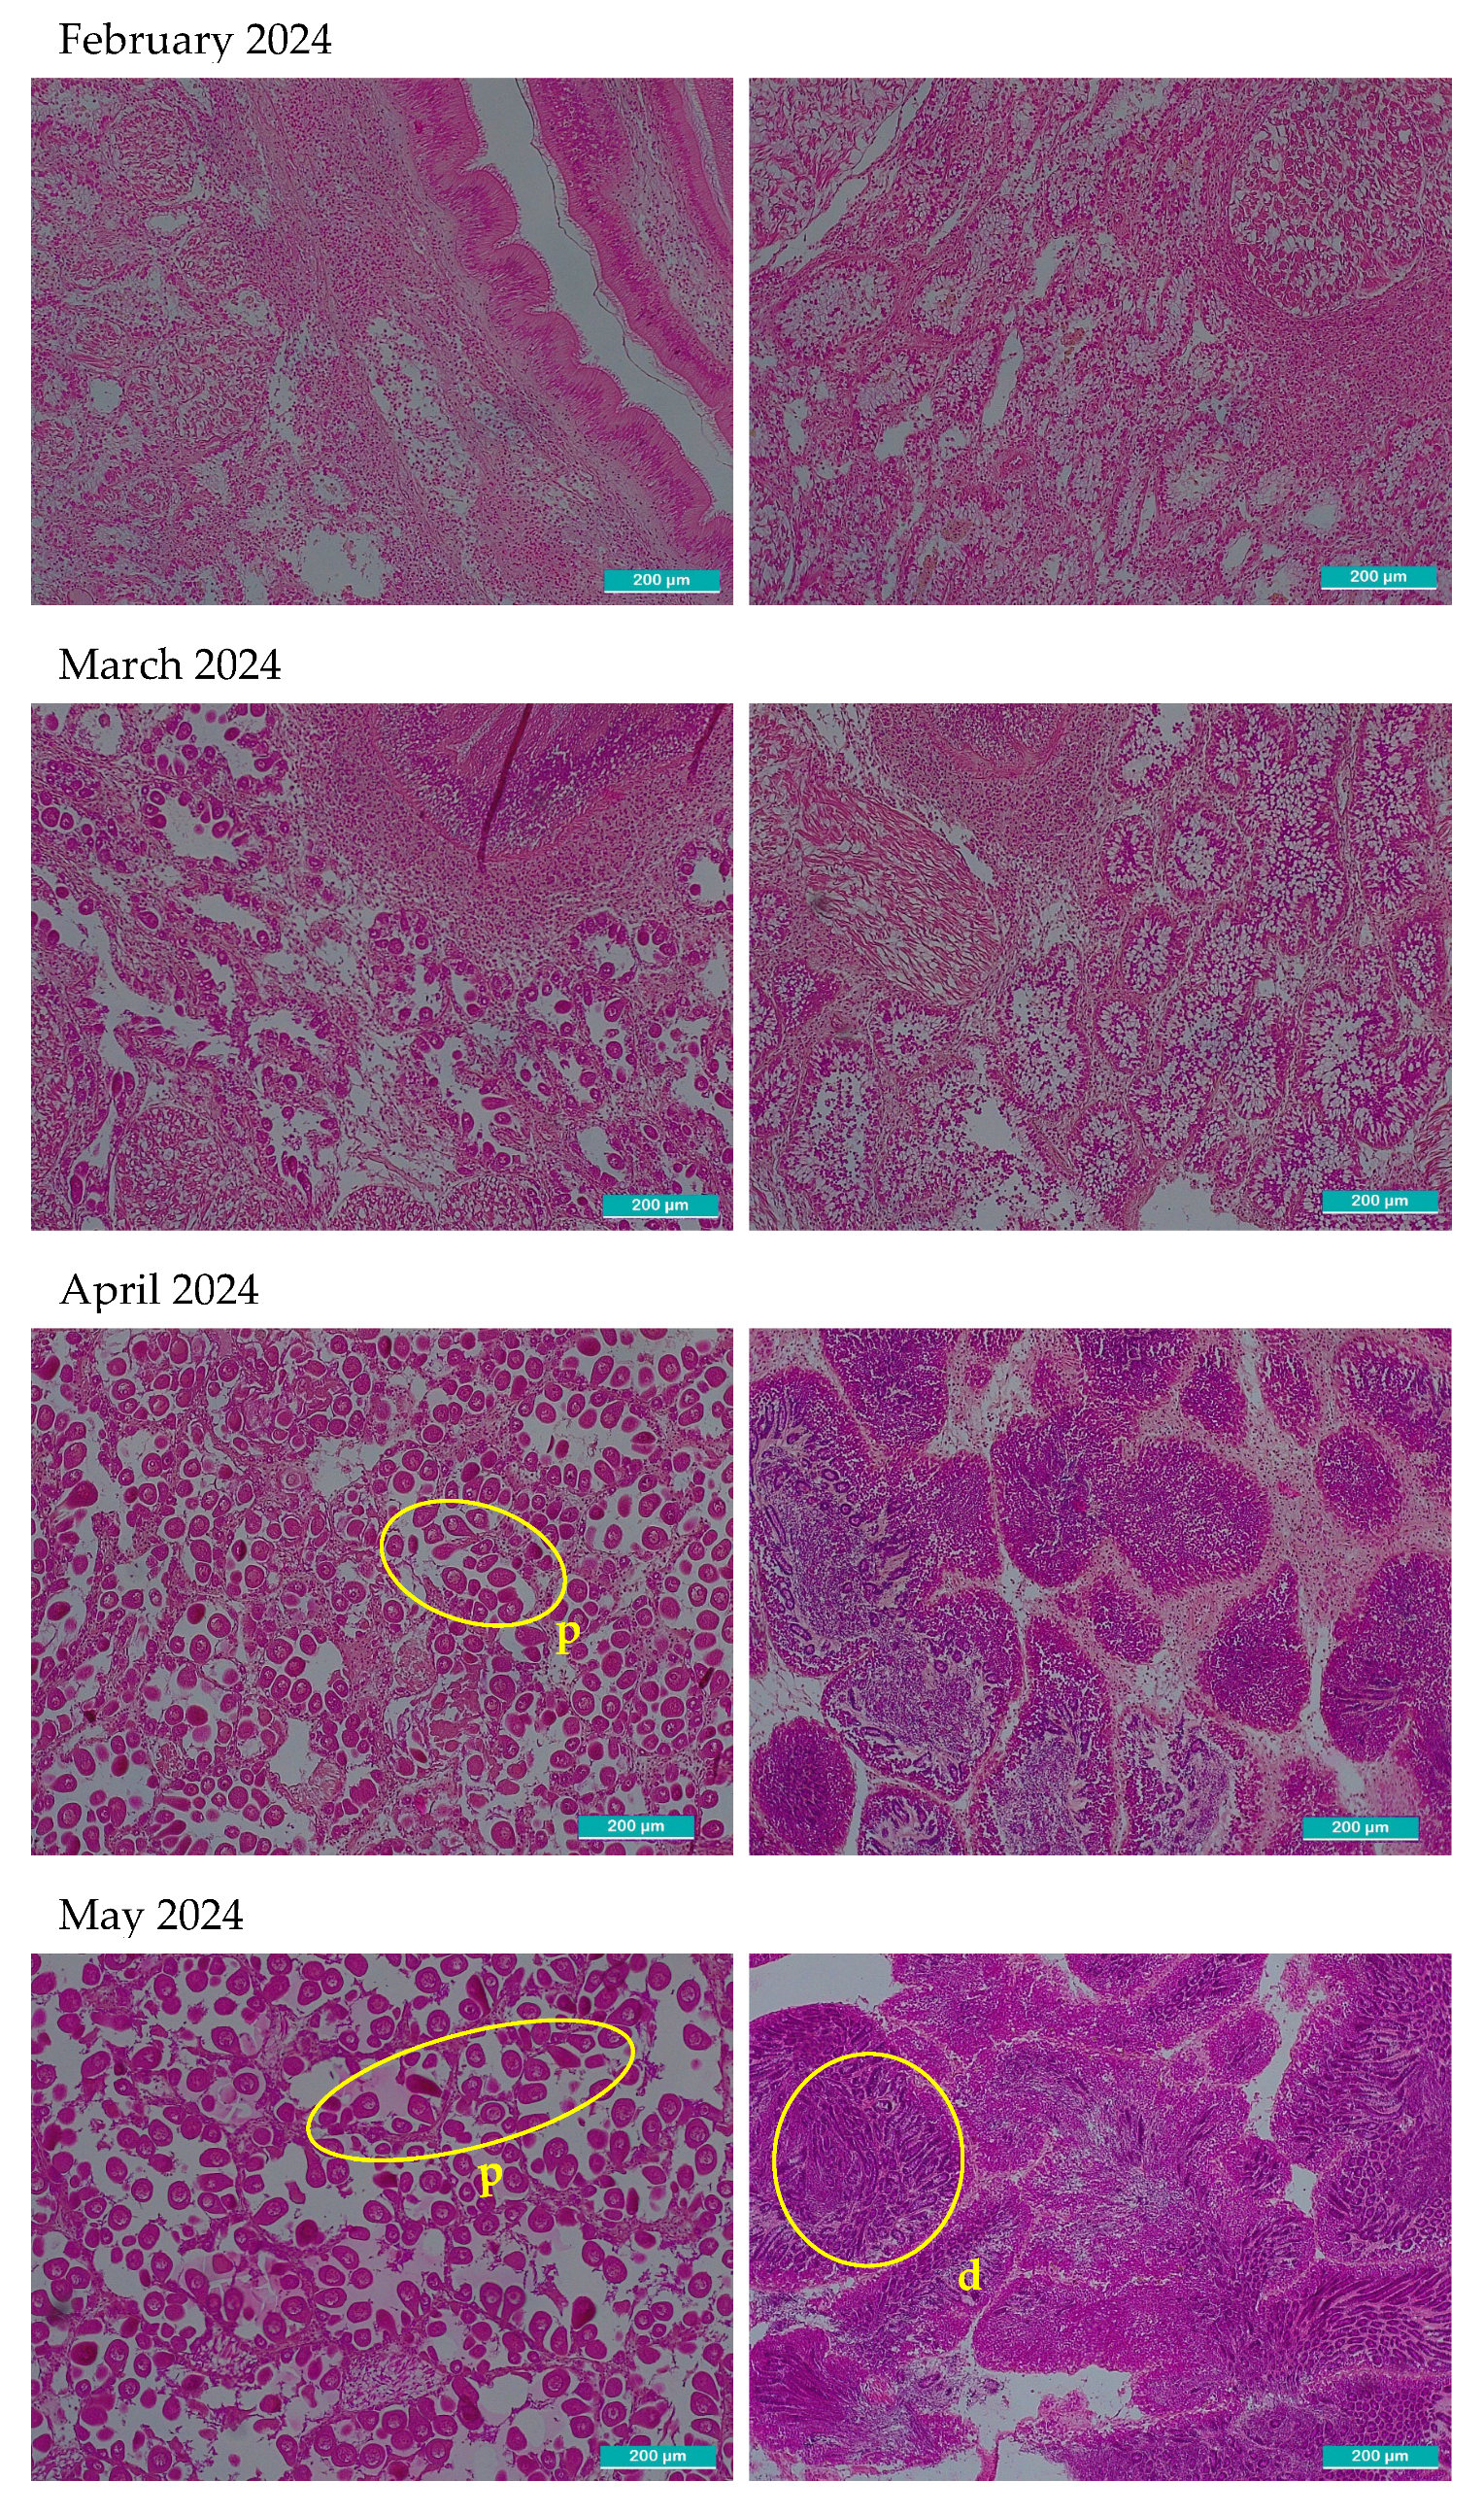
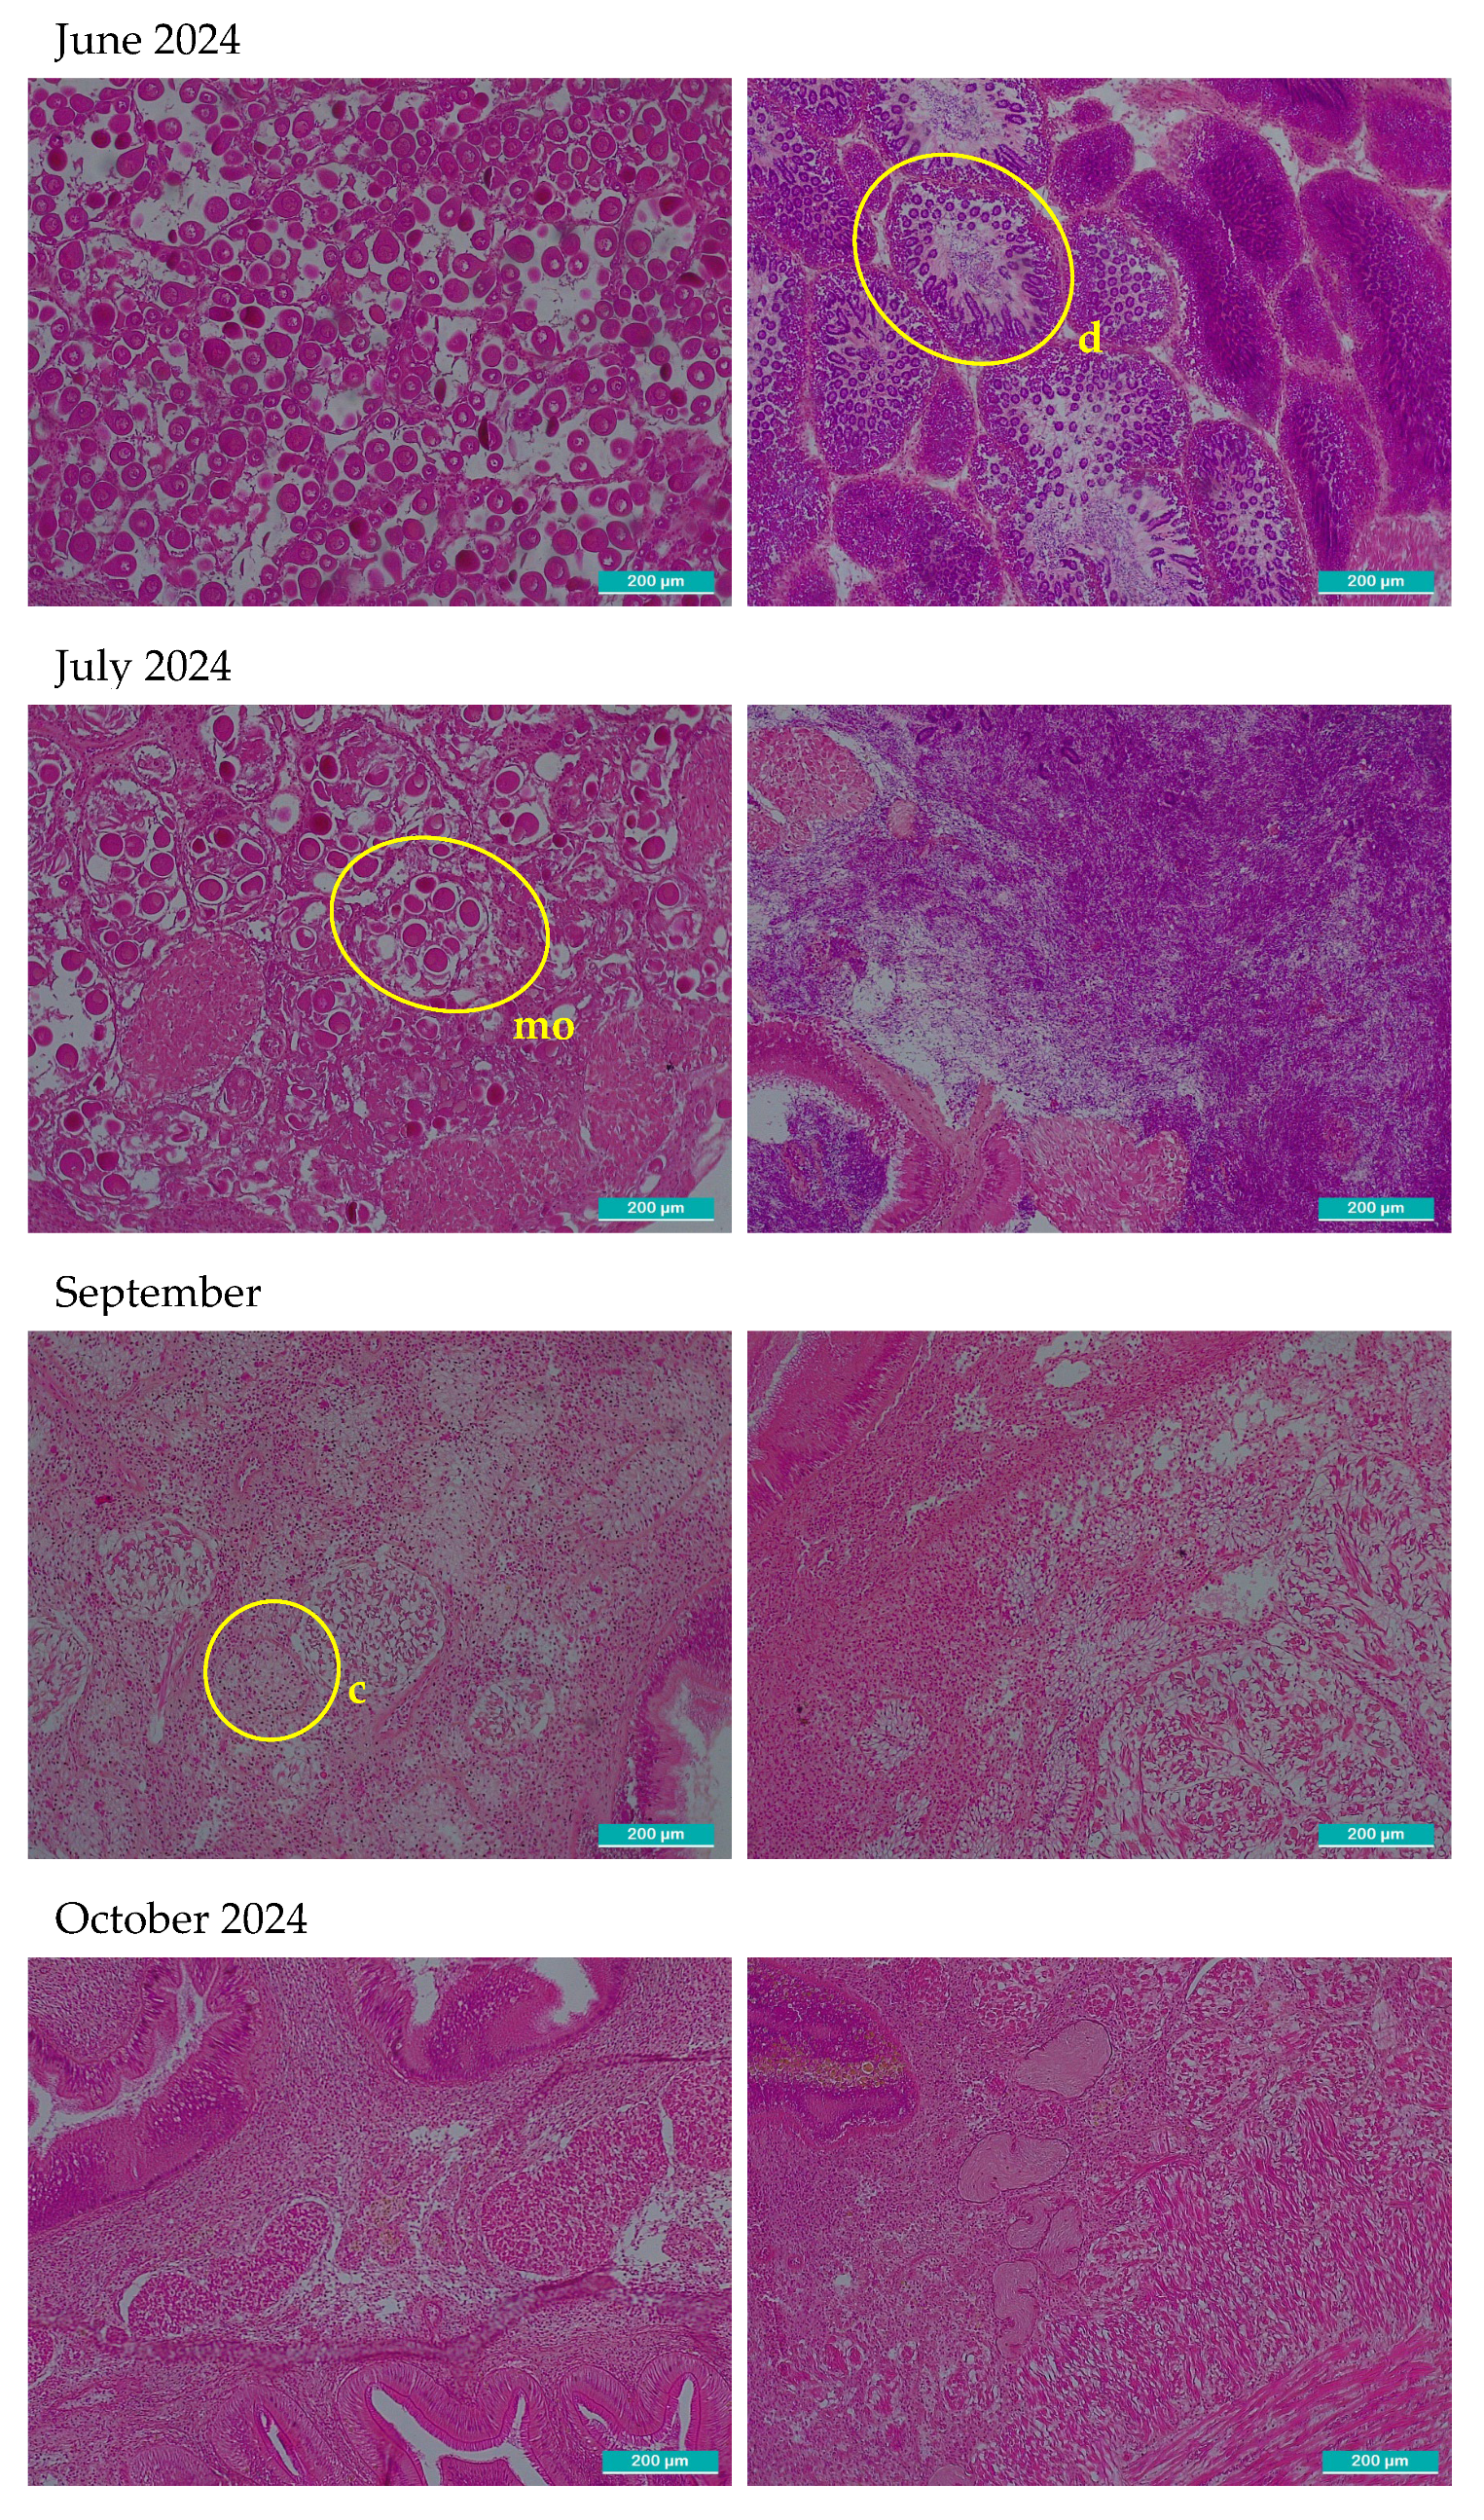
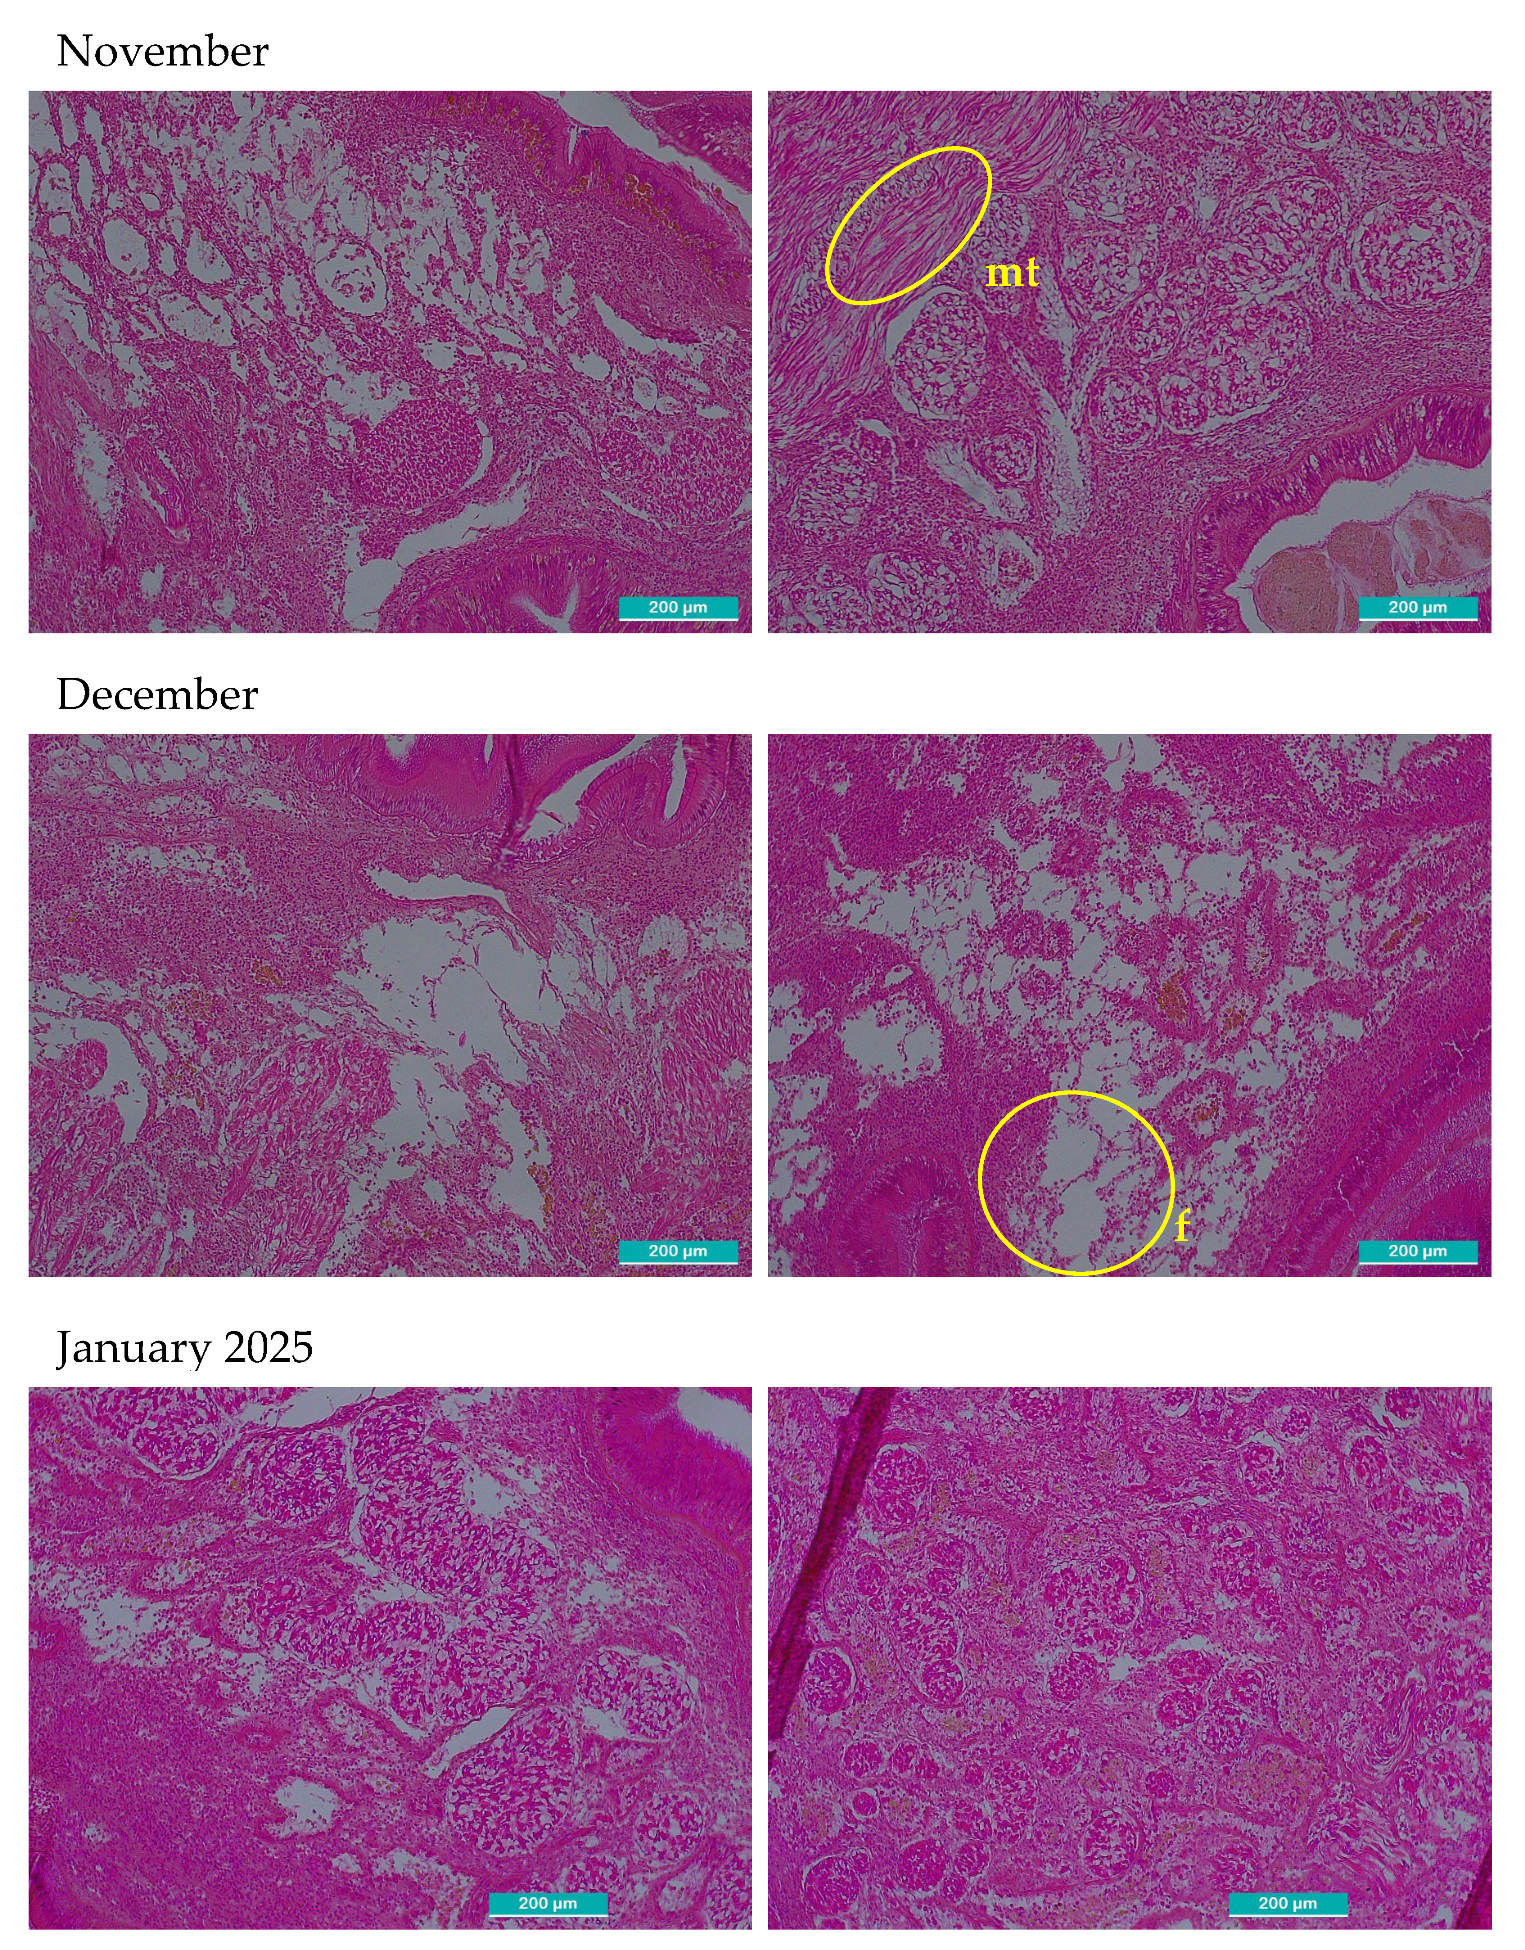
Figure 3.
Monthly percentages of developmental stages of the gonads.
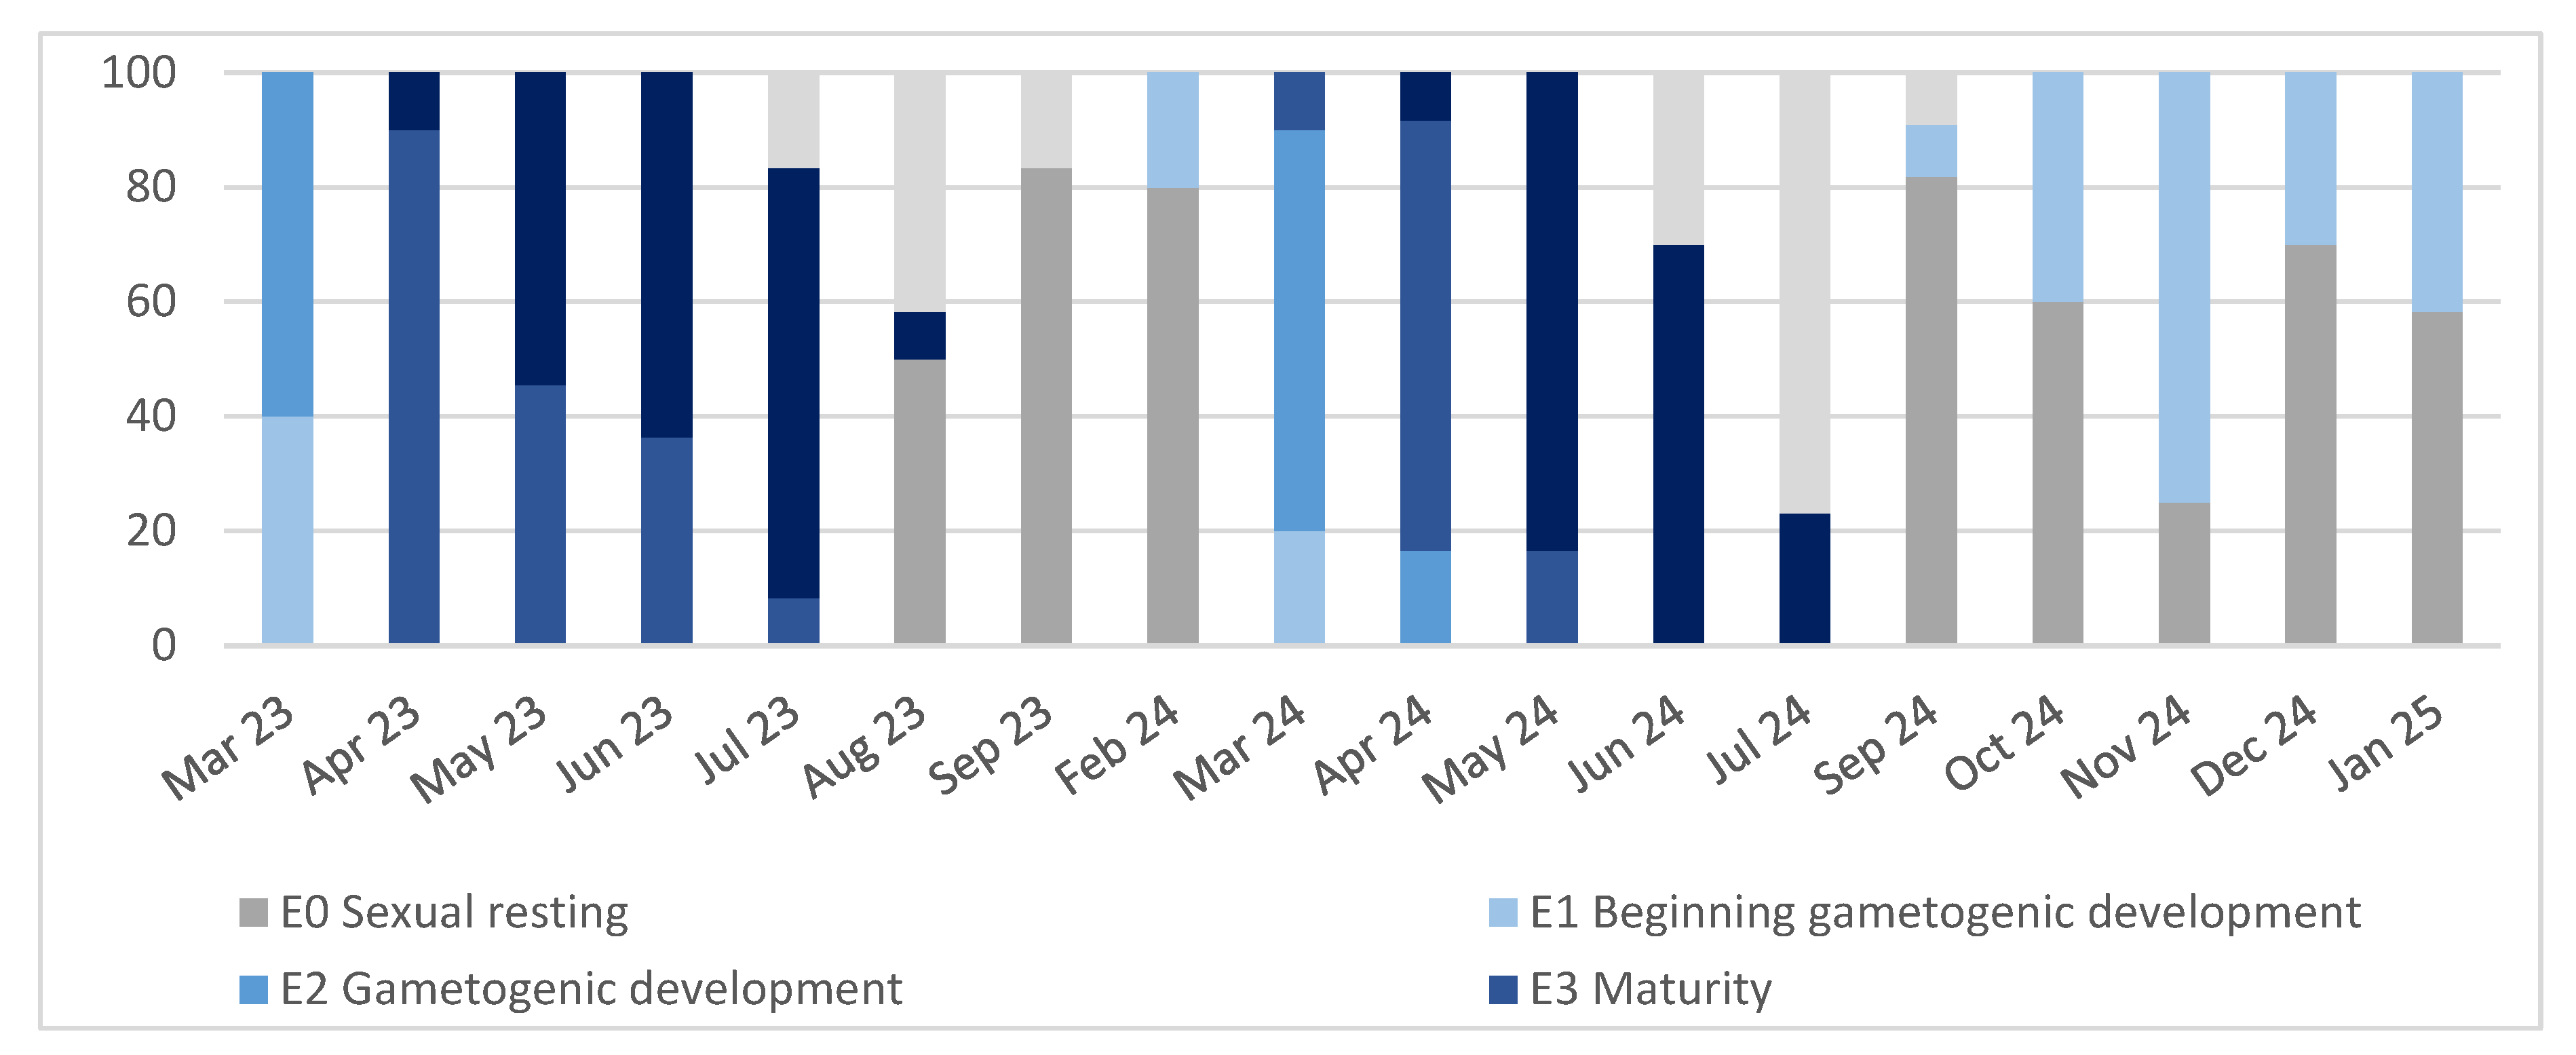
Figure 4.
Distribution of the mean biochemical composition of R. decussatus in the gonadal tissues expressed as percentages.
Figure 4.
Distribution of the mean biochemical composition of R. decussatus in the gonadal tissues expressed as percentages.
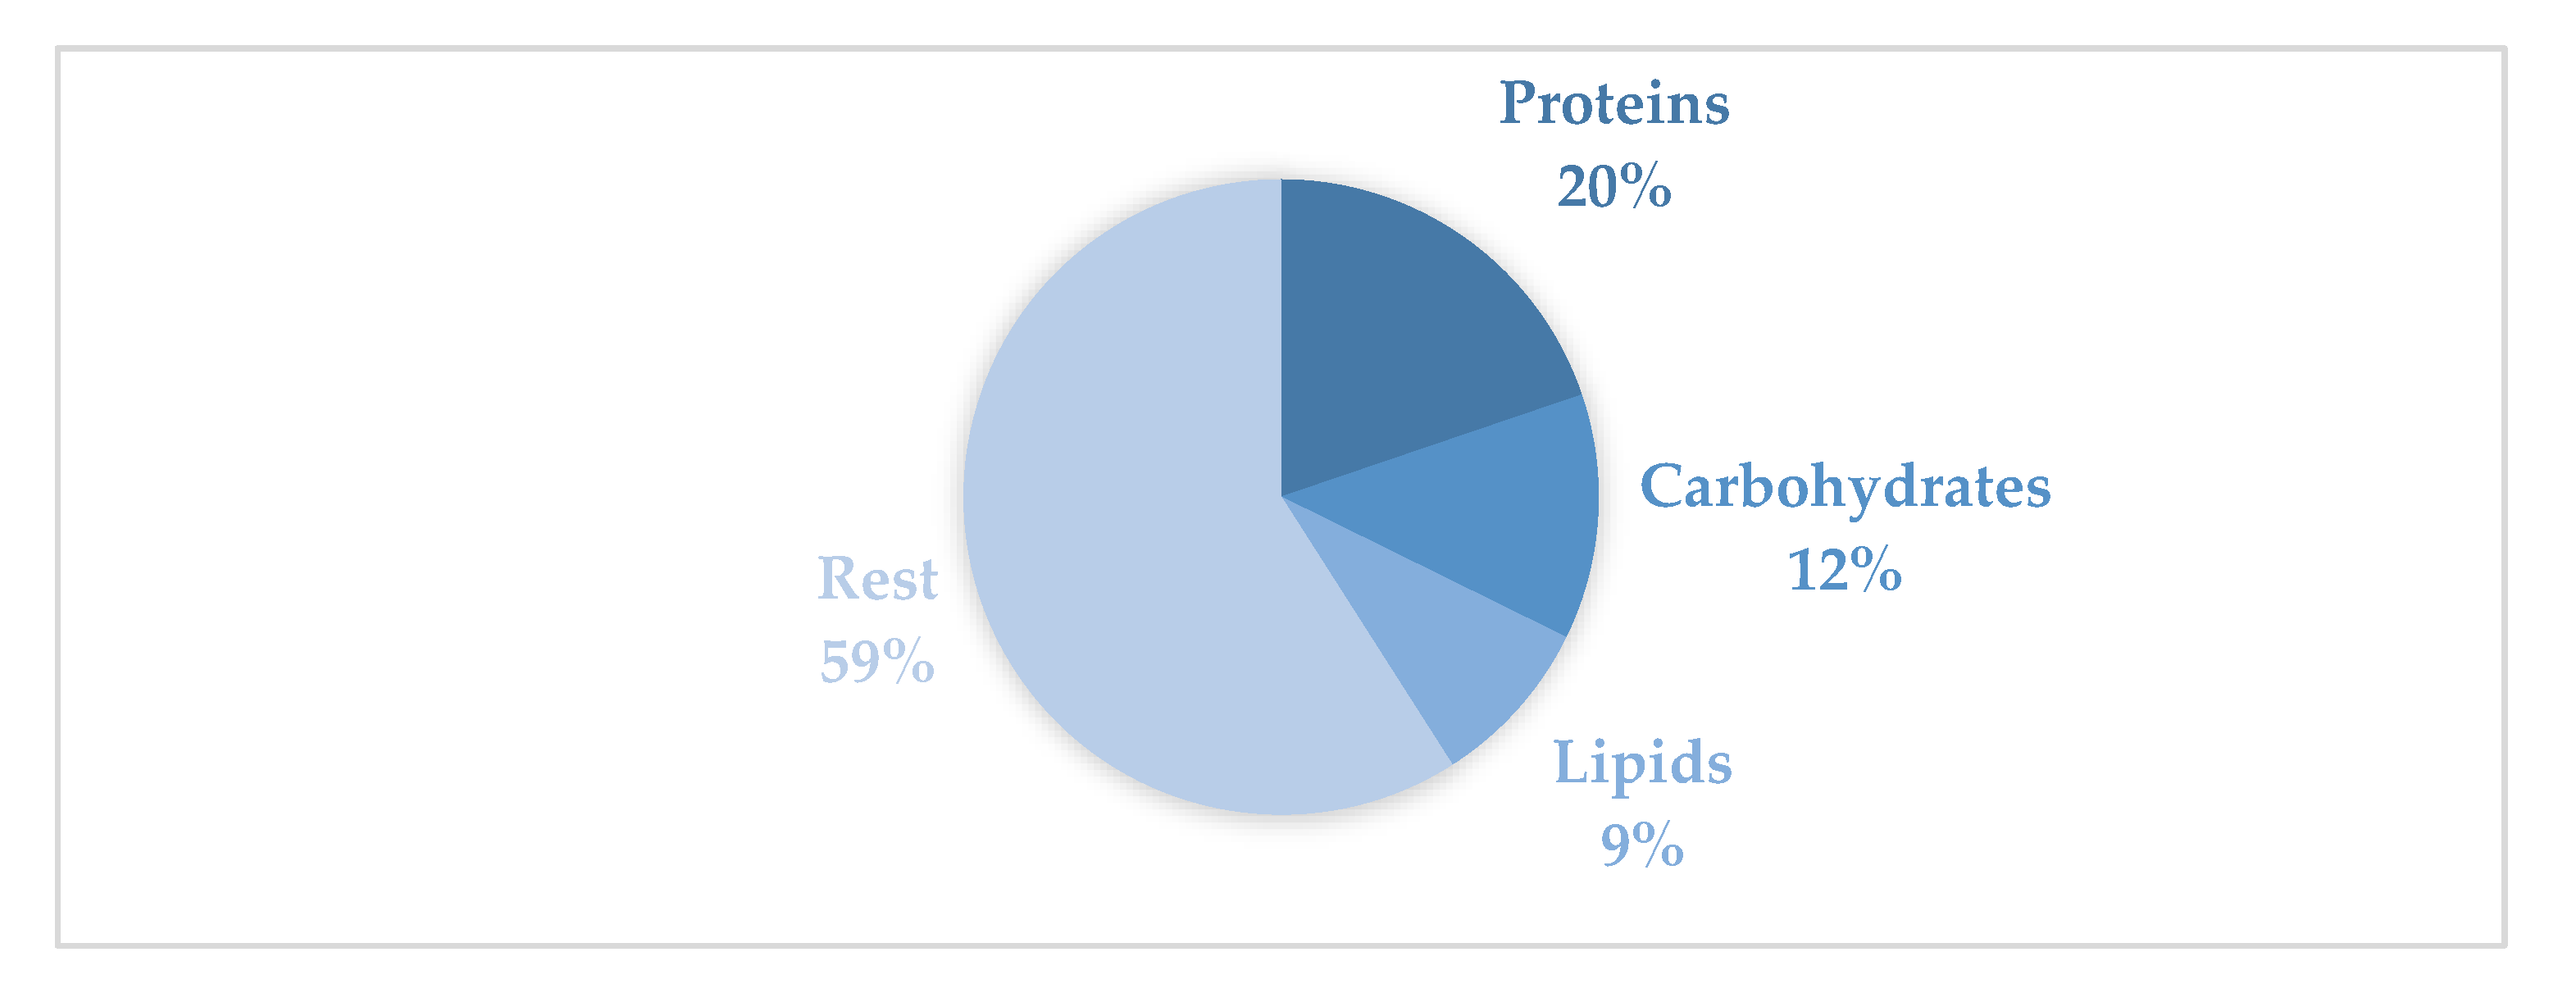
Figure 5.
Evolution of biochemical composition of R. decussatus clams during the sampling period. Represented as mg of total proteins/ carbohydrates/ lipids per g of gonadal tissue.
Figure 5.
Evolution of biochemical composition of R. decussatus clams during the sampling period. Represented as mg of total proteins/ carbohydrates/ lipids per g of gonadal tissue.
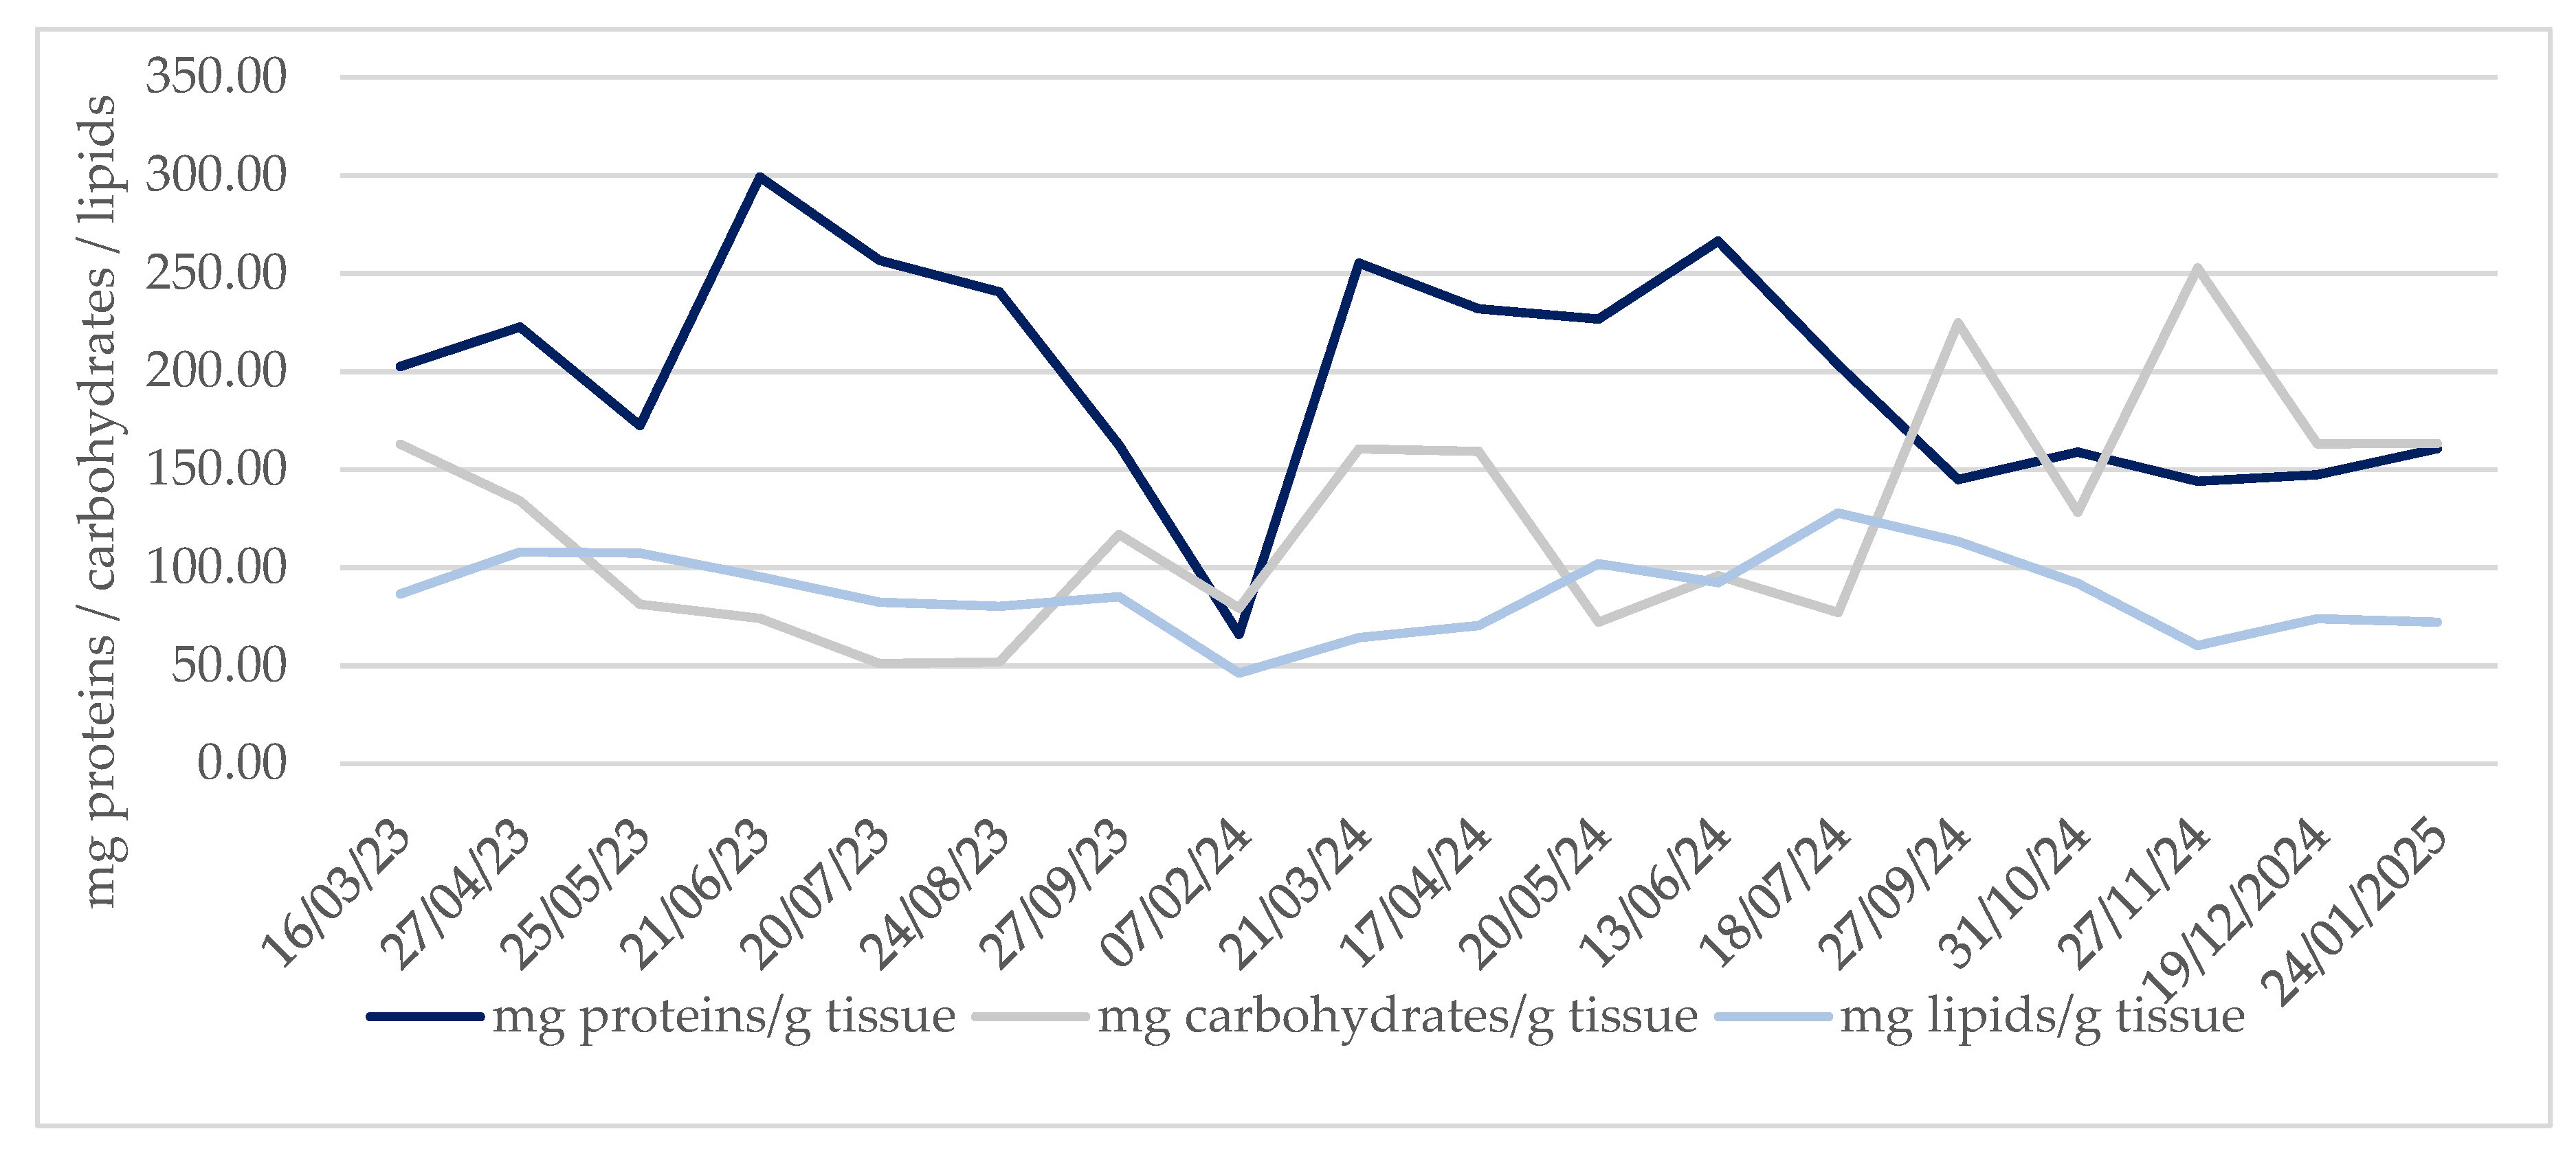
Figure 6.
Monthly mean water temperature of the lagoon during study period (°C).
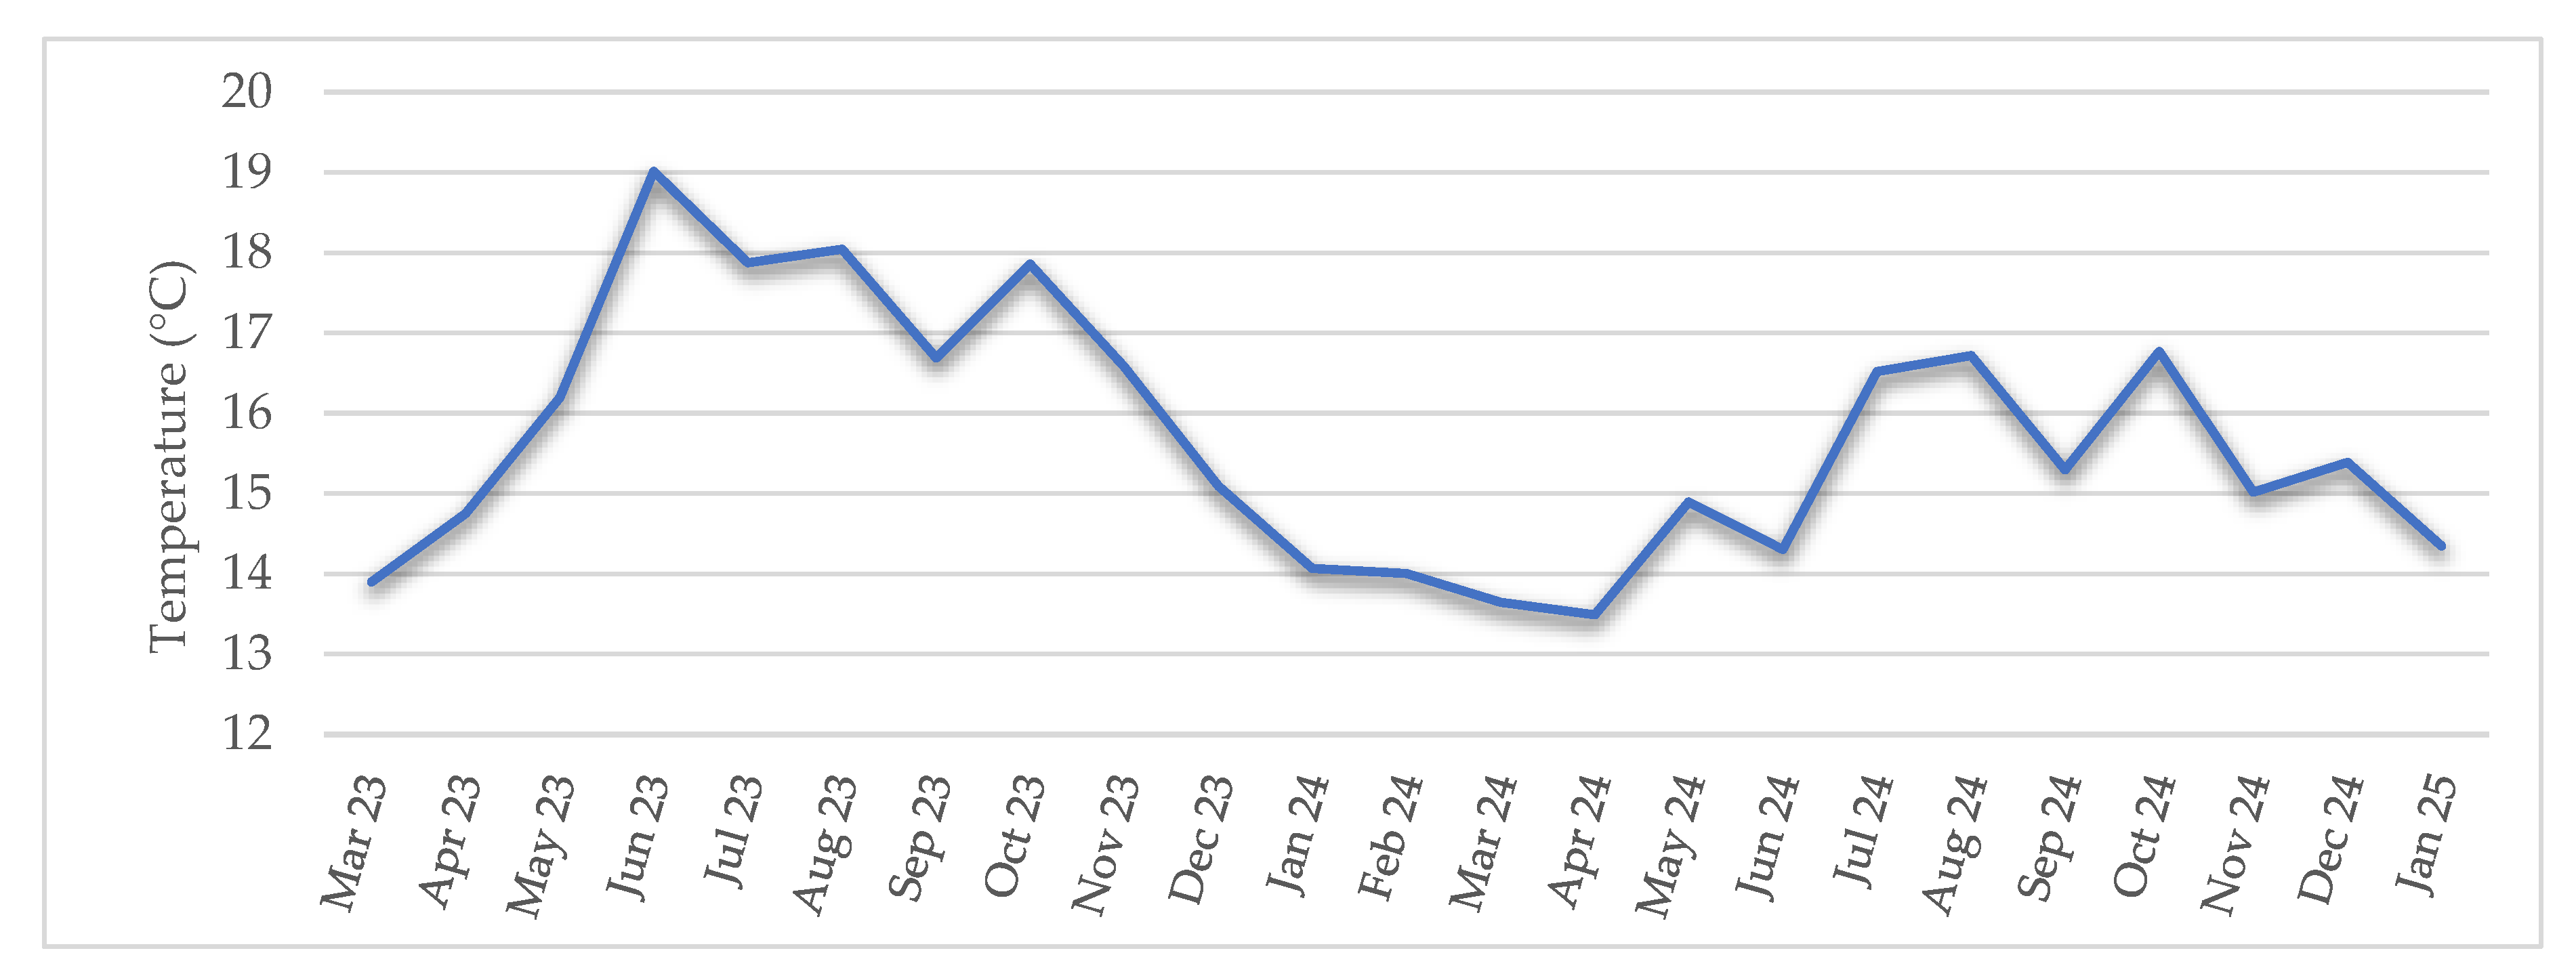

Table 1.
Description of the gonadal qualitative scale of development.
| Phases | Characteristics | Microscopic elements |
|---|---|---|
| Phase E0 | Sexual resting stage | Connective tissue fills the gonad, absence of gametes, sexual identification is no possible. |
| Phase E1 | Onset of gametogenesis |
Germinal cells are present, initial formation of follicles, is very difficult to determine the sex of individuals specially in the early phase of the stage |
| Phase E2 | Gametogenic development |
Follicles fill a large part of the tissue, oocyte in females have grown and spermatocytes fill the follicles; sex can be identified in almost all the specimens. |
| Phase E3 | Morphological maturity |
Gonad is filled with mature oocytes or spermatozoa arranged in sheets towards the centre of the follicles; in females the oocyte reach their largest size and the pressure on the follicles makes them polyhedral in shape. |
| Phase E4 | Spawning | In females, oocytes detach from the follicle walls, in males’ spermatozoa lose their radial arrangement. |
| Phase E5 | Postspawning | Follicles disintegrate and only remnants of gametes are present, the animal enters in a sexual resting phase follicle walls are broken. |
* When two or more phases are present in the same sample, the predominant stage was considered for the classification of the sample.
Table 2.
Monthly mean (± SD) of clam shell and tissue measurements and weights (mm, g).
| TSL (mm) |
TSW (mm) |
TST (mm) |
FBW (gr) |
SW (gr) |
STW (gr) |
GW (gr) |
|
|---|---|---|---|---|---|---|---|
| M±SD | M±SD | M±SD | M±SD | M±SD | M±SD | M±SD | |
| March 2023 | 45.38 ± 2.36 | 32.43 ± 1.72 | 21.65 ± 1.16 | 21.79 ± 3.14 | 11.43 ± 1.19 | 4.35 ± 0.48 | 0.96 ± 0.14 |
| April 2023 | 43.05 ± 1.24 | 31.12 ± 1.01 | 21.33 ± 0.99 | 18.37 ± 1.88 | 10.05 ± 1.1 | 4.56 ± 0.46 | 1.29 ± 0.24 |
| May 2023 | 44.39 ± 3.26 | 31.94 ± 1.98 | 21.63 ± 1.16 | 20.9 ± 3.23 | 11.89 ± 1.56 | 4.86 ± 0.7 | 1.37 ± 0.28 |
| June 2023 | 47.8 ± 2.45 | 34.24 ± 1.49 | 22.89 ± 1.04 | 25.21 ± 3.45 | 13.34 ± 1.46 | 5.26 ± 0.87 | 1.63 ± 0.33 |
| July 2023 | 42.83 ± 0.98 | 31.23 ± 0.9 | 21.46 ± 0.77 | 19.4 ± 1.61 | 11.05 ± 1.19 | 3.26 ± 0.64 | 1.03 ± 0.33 |
| August 2023 | 42.41 ± 0.85 | 31.13 ± 0.79 | 22 ± 2.55 | 18.38 ± 1.85 | 10.39 ± 0.96 | 3.42 ± 0.58 | 0.68 ± 0.14 |
| September 2023 | 42.37 ± 1.3 | 34.08 ± 1.94 | 19.86 ± 1.05 | 16.82 ± 2.45 | 8.88 ± 1.62 | 3.24 ± 0.39 | 0.75 ± 0.17 |
| February 2024 | 42.27 ± 1.4 | 30.22 ± 0.77 | 19.77 ± 0.75 | 17.72 ± 1.68 | 9.68 ± 1.22 | 3.59 ± 0.26 | 0.73 ± 0.06 |
| March 2024 | 38.58 ± 2.01 | 27.92 ± 1.49 | 18.26 ± 1.24 | 14.43 ± 2.56 | 7.78 ± 1.59 | 3.09 ± 0.47 | 0.65 ± 0.12 |
| April 2024 | 41.55 ± 0.92 | 30.08 ± 0.85 | 19.13 ± 0.75 | 16.24 ± 1.25 | 8.6 ± 0.93 | 4.19 ± 0.54 | 1.23 ± 0.27 |
| May 2024 | 40.15 ± 2.57 | 28.95 ± 1.67 | 18.19 ± 1.24 | 13.48 ± 2.87 | 7.69 ± 1.66 | 4.51 ± 0.6 | 1.61 ± 0.31 |
| June 2024 | 41.11 ± 0.82 | 28.8 ± 1.14 | 18.48 ± 0.81 | 13.54 ± 1.39 | 6.92 ± 0.89 | 3.72 ± 0.4 | 1.09 ± 0.2 |
| July 2024 | 40.63 ± 1.86 | 29.4 ± 1.4 | 19.64 ± 2.43 | 14.86 ± 2.13 | 8.27 ± 1.43 | 3.15 ± 0.51 | 1.12 ± 0.26 |
| September 2024 | 42.79 ± 2.46 | 30.83 ± 1.36 | 20.53 ± 1.51 | 18.17 ± 3.3 | 9.54 ± 1.82 | 4.48 ± 0.62 | 1.16 ± 0.27 |
| October 2024 | 41.19 ± 2.5 | 29.35 ± 1.82 | 19.85 ± 1.41 | 16.72 ± 3.38 | 10.04 ± 1.63 | 2.95 ± 0.58 | 0.59 ± 0.16 |
| November 2024 | 41.26 ± 2.25 | 30.02 ± 1.75 | 19.87 ± 1.58 | 16.56 ± 3.18 | 9.16 ± 1.95 | 3.32 ± 0.75 | 0.71 ± 0.18 |
| December 2024 | 42.72 ± 1.21 | 30.77 ± 0.86 | 20.63 ± 0.77 | 19.35 ± 1.62 | 11.37 ± 1.36 | 3.51 ± 0.59 | 0.75 ± 0.23 |
| January 2025 | 44 ± 1.87 | 31.18 ± 1.38 | 19.59 ± 1.88 | 18.01 ± 3.18 | 9.88 ± 2.09 | 3.81 ± 0.5 | 0.81 ± 0.15 |
* Values highlighted in bold blue (maximum) and orange (minimum) of the study period.
Table 3.
Statistical results of Pearson analyses of morphometric measurements.
| TSW | TST | FBW | SW | STW | GW | ||
|---|---|---|---|---|---|---|---|
| TSL | R | .844** | .823** | .933** | .858** | .648** | .365 |
| p-value | <.001 | <.001 | <.001 | <.001 | .004 | .137 | |
| N | 18 | 18 | 18 | 18 | 18 | 18 | |
| TSW | R | .745** | .795** | .714** | .433 | .214 | |
| p-value | <.001 | <.001 | <.001 | .073 | .395 | ||
| N | 18 | 18 | 18 | 18 | 18 | ||
| TST | R | .908** | .906** | .417 | .192 | ||
| p-value | <.001 | <.001 | .085 | .445 | |||
| N | 18 | 18 | 18 | 18 | |||
| FBW | R | .966** | .537* | .234 | |||
| p-value | <.001 | .022 | .35 | ||||
| N | 18 | 18 | 18 | ||||
| SW | R | .433 | .161 | ||||
| p-value | .072 | .524 | |||||
| N | 18 | 18 | |||||
| STW | R | .833** | |||||
| p-value | <.001 | ||||||
| N | 18 | ||||||
**Correlation is significant at the 0.01 level (two-tailed) (red). *Correlation is significant at the 0.05 level (two- tailed) (orange). Non significative correlation, > 0.05 (green).
Table 4.
Monthly mean (± SD) of clam indices: condition index (IC), dry condition index (BCI) and gonadal condition index (GCI).
Table 4.
Monthly mean (± SD) of clam indices: condition index (IC), dry condition index (BCI) and gonadal condition index (GCI).
| IC | BCI | GCI | |
|---|---|---|---|
| M ± SD | M ± SD | M ±S D | |
| March 2023 | 20.93 ± 1.63 | 38.21 ± 3.51 | 22.17 ± 2.16 |
| April 2023 | 25.92 ± 2.11 | 45.53 ± 3.21 | 28.13 ± 3.19 |
| May 2023 | 22.43 ± 2.42 | 41.14 ± 5.95 | 28.23 ± 3.94 |
| June 2023 | 21.7 ± 1.99 | 39.39 ± 4.35 | 31.18 ± 5.19 |
| July 2023 | 16.7 ± 2.73 | 29.55 ± 5.29 | 31.3 ± 6.57 |
| August 2023 | 18.31 ± 3.11 | 33.11 ± 5.93 | 19.98 ± 2.41 |
| September 2023 | 19.53 ± 3.63 | 37.56 ± 8 | 23.1 ± 4.08 |
| February 2024 | 20.29 ± 0.85 | 37.29 ± 2.44 | 20.43 ± 1.38 |
| March 2024 | 21.57 ± 1.6 | 40.31 ± 4.09 | 20.98 ± 2.16 |
| April 2024 | 25.7 ± 3.53 | 49.36 ± 8.57 | 29.07 ± 3.69 |
| May 2024 | 29.84 ± 1.66 | 59.53 ± 5.55 | 35.46 ± 2.85 |
| June 2024 | 26.54 ± 1.84 | 54.12 ± 5.43 | 29.25 ± 3.34 |
| July 2024 | 20.8 ± 2.72 | 38.56 ± 7.06 | 35.32 ± 4.13 |
| September 2024 | 25.21 ± 2.47 | 47.62 ± 5.61 | 25.55 ± 3.34 |
| October 2024 | 17 ± 2.75 | 29.69 ± 5.02 | 19.71 ± 2.03 |
| November 2024 | 20.25 ± 3.84 | 36.95 ± 8.09 | 21.37 ± 2.25 |
| December 2024 | 18.01 ± 1.78 | 30.89 ± 3.71 | 20.99 ± 3.44 |
| January 2025 | 21.54 ± 3.78 | 39.7 ± 7.82 | 21.26 ± 3.29 |
* Values highlighted in bold, blue (maximum) and orange (minimum).
Table 5.
Results of Pearson correlation analyses between mean temperature of the lagoon and biochemical composition of the gonadal tissue.
Table 5.
Results of Pearson correlation analyses between mean temperature of the lagoon and biochemical composition of the gonadal tissue.
| Proteins | Carbohydrates | Lipids | ||
|---|---|---|---|---|
| Temperature | R | .302 | -.515 | .340 |
| p-value | .224 | .029 | .168 | |
| N | 18 | 18 | 18 | |
* Data highlighted in bold showed significative correlation, (p < 0.05).
Table 6.
Results of Pearson correlation analysis between condition indices and biochemical composition of the clams.
Table 6.
Results of Pearson correlation analysis between condition indices and biochemical composition of the clams.
| INDEX | BIOMOLECULE | r | p-value | N |
|---|---|---|---|---|
| CI | Proteins | .246 | .326 | 18 |
| Carbohydrates | .081 | .750 | 18 | |
| Lipids | .333 | .176 | 18 | |
| BCI | Proteins | .259 | .300 | 18 |
| Carbohydrates | .040 | .875 | 18 | |
| Lipids | .298 | .230 | 18 | |
| GCI | Proteins | .517 | .028 | 18 |
| Carbohydrates | -.440 | .067 | 18 | |
| Lipids | .644 | .004 | 18 |
* Data highlighted in bold showed significative correlation, (p < 0.05).
Table 7.
Results of Pearson correlation analysis between mean temperature of the lagoon and biometric measurements of the clams.
Table 7.
Results of Pearson correlation analysis between mean temperature of the lagoon and biometric measurements of the clams.
| Temperature | ||
|---|---|---|
| Length | R | .403 |
| p-value | .098 | |
| N | 18 | |
| Width | R | .507* |
| p-value | .032 | |
| N | 18 | |
| Thickness | R | .637** |
| p-value | .004 | |
| N | 18 | |
| TBW | R | .469 |
| p-value | .05 | |
| N | 18 | |
| SW | R | .535* |
| p-value | .022 | |
| N | 18 | |
| STW | R | .018 |
| p-value | .945 | |
| N | 18 | |
| GW | R | .148 |
| p-value | .557 | |
| N | 18 | |
* Data highlighted in bold showed significative correlation, (p < 0.05). ** significative correlation, (p < 0.01).
Table 8.
Results of Pearson correlation analysis between mean temperature of the lagoon and condition indices.
Table 8.
Results of Pearson correlation analysis between mean temperature of the lagoon and condition indices.
| Temperature | ||
|---|---|---|
| CI | R | -.476 |
| p-value | .046 | |
| N | 18 | |
| BCI | R | -.468 |
| p-value | .050 | |
| N | 18 | |
| GCI | R | .204 |
| p-value | .417 | |
| N | 18 | |
* Data highlighted in bold showed significative correlation, (p < 0.05).
Disclaimer/Publisher’s Note: The statements, opinions and data contained in all publications are solely those of the individual author(s) and contributor(s) and not of MDPI and/or the editor(s). MDPI and/or the editor(s) disclaim responsibility for any injury to people or property resulting from any ideas, methods, instructions or products referred to in the content. |
© 2025 by the authors. Licensee MDPI, Basel, Switzerland. This article is an open access article distributed under the terms and conditions of the Creative Commons Attribution (CC BY) license (http://creativecommons.org/licenses/by/4.0/).
Copyright: This open access article is published under a Creative Commons CC BY 4.0 license, which permit the free download, distribution, and reuse, provided that the author and preprint are cited in any reuse.


