
Submitted:
19 December 2025
Posted:
22 December 2025
You are already at the latest version
Abstract
Indian metropolitan cities such as Mumbai grapple with urbanization, extreme urban density, high built-up areas, loss of green cover, and open spaces, leading to increased impermeable surfaces, urban heat, and flooding occurrences. Modern stormwater management has been characterized as a combination of grey-green approaches. However, the global north benefits from established policies, technical expertise, and funding, enabling large-scale and systematic integration of Blue-Green Infrastructure (BGI) based on district-wide geospatial assessment of BGI systems, in contrast to the global south. Despite this, there remains a dearth of geospatial empirical research from India examining the placement, distribution, performance, and functionality of BGI in integration with existing stormwater management regimes in cities such as Mumbai. Hydrological modelling using tools such as SWMM in the design, planning, and implementation of BGI in Indian cities remains largely unexplored. This study explores the role of BGI strategies in improving urban stormwater management within high-density Indian cities. Using an integrated approach that combines QGIS-based spatial analysis with EPA-SWMM hydrologic-hydraulic modelling, the research examines runoff behaviour, identifies flooding hotspots, and evaluates the effectiveness of Low Impact Development (LID)-based BGI measures—such as permeable pavements, infiltration trenches, and green roofs—applied at the ward level in Mumbai’s F/North and G/North Wards. Detailed land-use classification, spatial mapping, and rainfall simulation (25-year return period) were used to assess pre- and post-intervention conditions. The findings indicate that the applied BGI measures led to a 12.6% reduction in peak runoff (137.6 m³/s to 120.2 m³/s) and a 5.5% decrease in total runoff volume (783,510 m³ to 740,410 m³). More importantly, the flooding volume decreased by 45% (94,111 m³ to 51,707 m³), showing that even modest runoff reductions can substantially reduce flood risk. Less extreme events could see even higher relative reductions or prevent flooding altogether, while also easing downstream hydraulic loads. Overall, strategically placed BGI interventions can significantly reduce surface runoff and peak flow, enhancing stormwater resilience within spatially constrained urban environments. This study provides a replicable, data-driven framework for catchment-scale stormwater planning in dense Indian cities, offering practical insights for policymakers and urban planners to retrofit and adapt existing infrastructure under increasing hydrologic stress and climate variability.
Keywords:
BGI
; EPA-SWMM
; hydrological modelling
; Mumbai
; ward-scale application
; Indian cities
; urban density
; flood reduction
Introduction
Urbanisation has been highlighted as the key trend in the 21st century globally estimated to increase from 55% to 68% by 2050 (Rai and Kookana, 2020). Globally there is a concerted trend in shifts from rural to urban areas. According to the (News, n.d.) 90% of this increase in urban population will take place in Asia and Africa. India, China and Nigeria will account for 35% of the projected growth with India alone adding 416 million urban dwellers. While, this is the case, urbanization patterns in India differ significantly in comparison to other countries. “As of 2025, 35% of India’s population lives in urban areas which is projected to grow to 50% by 2050 whereas China’s urbanization is much higher which was 61% in 2021 projected to rise to 70% by 2035” (Dobbs and Sankhe, 2010) depicting the slower pace of India’s urbanization incomparison to China. Countries of the global north such as the United States, United Kingdom and those in the European Union have urbanization rates above 80% for decades. Megacities such as Mumbai, Delhi, Bengaluru, Chennai, Kolkata account for the bulk of urbanization in India followed by technology and educational hubs such as Pune, Hyderabad and Ahmedabad. Secondary and smaller cities comparatively remain underutilized to absorb urban inflows. Disparities in statewise urbanization rates remain stark in India with Maharashtra, Gujarat, Tamil Nadu and Kerala having over 40% incomparison to considerably lower rates of urbanization in Uttar Pradesh, Bihar and Rajasthan. Unplanned urban expansion in India has resulted in flooding occurrences across all major cities, pollution, congestion, increased urban heat and climate change related vulnerabilities.
Over the last few decades, Blue-Green Infrastructure (BGI) has emerged as a promising approach to combining stormwater management, restoring natural ecosystems and enhancing green open spaces (Kelkar et al., 2025) highlight how varied challenges and strategies across the Global North and Global South shape the way BGI is designed, planned and implemented. Their study draws lessons from international cases with a focus on applicability in developing nations like India. After reviewing 797 articles worldwide regarding BGI planning and implementation, their study finds that only 26% addressed the context of developing countries predominantly focused on China and none on India. Their review finds that countries in the Global North benefit from established policies, technical expertise and funding enabling large-scale and systematic integration of BGI with city case examples focused on implementation of green roofs, permeable pavements and district-wide geospatial assessment of BGI systems.
Modern stormwater management has been characterized as a combination of grey-green stormwater management. Strong evidence has emerged showing a global shift from conventional stormwater management towards BGI approaches with numerous peer-reviewed scientific articles analyzing their effectivess and emergence in response to climate change and urbanization pressures. (Kaur et al., 2022) argue that there is a need to develop approaches to identify BGI in developing countries and present a geospatial approach to identify BGI. (Tamar Almaaitah, 2021) provide modelling and field-data comparisons worldwide, demonstrating that BGI such as permeable pavements, bio-retention ponds, swales and green roofs consistently outperform conventional grey infrastucture in reducing peak flows and flooding. Global urban planning now increasingly prioritizes BGI. Thus, geospatial assessment and analysis has become important to ascertain feasibility of BGI. Despite this, there remains a dearth of geospatial empirical research from India which examines the placement, distribution, performance and functionality of BGI in Indian cities.
Context and Rationale: Greater Mumbai in India
The Mumbai Metropolitan Region lies on the western coastline of India comprising of an area of 6328 Sq.km. and consists of nine municipal corporations. The Greater Mumbai city area under the Municipal Corporation of Greater Mumbai is the largest municipality in the region and is also the capital of the state of Maharashtra. With an area of 437 Sq.km, comprising 24 wards and a population density of over 12.44 million people as per the 2011 census “ (MMRDA), Greater Mumbai or generally called as Mumbai for the last few decades has emerged and is often referred to as the financial capital of India. While, a much awaited census is yet to happen in India, today the population of Mumbai is estimated to greatly exceed over 20 million people.
“Mumbai is a coastal city consisting of a narrow peninsula and a linear urban form which has the Arabian Sea on its west, Thane creek on the east and Vasai creek on its north. It consists of two distinct regions of Mumbai City and Mumbai Suburban. The City portion is also referred to as the Island City as historically this area comprised of islands” (Mhaske et al., 2022). The lead author being the resident of the city highlights the general knowledge on the city’s biophysical form and history comprising an original prevalence of seven Islands in the present day “ City” area named Colaba, Old Woman’s Island, Bombay Island, Mazgaon, Parel, Worli and Mahim which were separate, marshy pieces of land under several rulers (the Gujarat Sultanate, Protuguese and British rules) reclaimed into the Mumbai City area of today. However, (Mhaske et al., 2022), highlight that while it is widely understood that prior to the first phase of reclamation from 1711-1728 CE there were seven islands, this is challenged due to a lack of thorough scientific analysis. Thus, their study has used historical maritime cartographic records to geospatially identify and map the spatial evolution of the islands that has formed the present day Island City of Mumbai. Thus, they conclude that at the time of the Portuguese to English control in 1661, the region comprised four islands of Worli, Mahim, Bombay and Colaba. Much of the Island City as a result of these historical reclamation practices of the islands is low-lying in nature.
In 1991, India initiated economic liberalization by opening its economy to the global markets which are often termed as the liberalization, privatisation and globalization policies (LPG). These policies accelerated industrial devleopment, foreign direct investment and trade liberalization tranforming urban centres. Class-I cities of India have experienced a rise in urbanization rates from 65% in 1991 to 69% in 2001 with urban growth concentrating in metropolitan and large cities contirbuting to the expansion of mega-urban regions (Chadchan, 2012). The state of Maharashtra has experienced severe urbanization patterns with 38.6% in 1991 rising upto 45.22% in 2011. In particular, Mumbai and suburban areas have experienced a 100% rate of urbanization. The LPG policies in India have neglected planned urbanization and coordinated development in Mumbai resulting in extreme urban density, rapid mass urban expansion, increase in construction and built-up areas and, vast growth in informal settlements outpacing formal sector urban planning (Zhang, 2017). Mumbai is a combination of formal and informal settlements. The built-up area of Mumbai has increased dramatically with 30000 people per Sq.Km. in certain wards of the city with more than half of the city’s 20 million plus population residing in over 3000 informal settlements (Jha et al., 2025). These ward level densities comprise a dense mix of both formal structures and informal settlements. As per current estimates 50-60% of Mumbai’s residents live in informal settlements on merely 15-20% of the city’s urban land contributing to high urban density, proliferation highlighting the need for planned development (Goyal et al., 2024).
Urbanization, extreme urban density, high built-up areas, land use changes, loss of green cover and open spaces have lead to increased impermeable surfaces, increase in urban heat and increase flooding occurrences in Mumbai. From 1988 to 2018, Mumbai lost 45.2% of its green cover with the major decrease of over 22.6% in the decade following the year 2000. The proportion of green spaces relative to Mumbai’s total area fell from 46.7 % in 1988 to 26.67% in 2018 (Shantaram et al., 2020). This built-area increase and depletion of green spaces has resulted in a three-fold increase in local land surface temperatures (Shantaram et.al. 2020). As per the report of the Brihanmumbai Municipal Corporation or the MCGM, notable increase has been found in impermeable area such as asaphalt, concrete and built-up surfaces. Their report highlights a run-off coefficient of around 0.5 before the city’s rapid urban development now mentions it to be as high as 1.0 emphsizing on increased impermeability due to urbanization. This report mentions that the percentage increase in catchment areas contributing to draingae has increased dramatically with in some parts rising from 20% to 70 - 90% contibuting to substantially higher run-off during rains (Municipal Corporation of Greater Mumbai, 2017). These conditions, have increase the prevalence of urban flooding annully in Mumbai. Historically reclaimed and low lying areas along with impacts of climate change in terms of changes in rainfall patterns and sea level rise contribute to Mumbai being at extreme perpetual risk of high levels of urban flooding. As per the MCGM data, annual average rainfall of Mumbai during the four months of monsoon from June to September is 2300mm highlighting the high rainfall received by the city in a short span of four months. Further, on 26 July 2005, Mumbai experienced a major flooding disaster as a result of 900 mm rainfall in a 24 hour time period coinciding with high-tide conditions jeopardising drainage of rainwater into the sea due to closure of flood gates. This incident lead to catastropic loss of life, property and livestock. There are days in a monsoon season when high-tide and heavy rainfall periods coincide risking flooding occurrences. Owing to such conditions, Mumbai has been experiencing flooding for over 3 to 4 decades.
Mumbai’s stormwater drain system is a separate system and is independent from the sewerage system to manage surface run-off during rainfall events. The Brihanmumbai Stormwater Disposal System (Municipal Corporation of Greater Mumbai, 2017) project was initiated for the augmentation of the SWD system in the year 1993. As per the (Municipal Corporation of Greater Mumbai, n.d.) of the MCGM, the original drainage geography of the area comprises of a network of creeks, rivers and system of drains which play the major role in stormwater drainage (Municipal Corporation of Greater Mumbai, n.d.). BRIMSTOWAD I and II are major initiatives by the MCGM aimed at upgrading Mumbai’s stormwater drainage system following catastrophic flooding events of 1985 and 2005 in Mumbai. The BRIMSTOWAD-I was aimed at upgrading the city’s 150 year-old stormwater drainage system. This system was planned to handle capacities of 50-60mm of rainfall per hour incomparison to the previous capacity 25mm/hr. The BRIMSTOWAD-II is the follow-up, updates and expanded version of the original BRIMSTOWAD-I project to cover a broader area of Greater Mumbai, sychronize with urban expansion and integrate modern GIS, flood modelling technologies (Municipal Corporation of Greater Mumbai, n.d.). This project comprises updated rainfall records, updated land use as well as city’s existing drainage networks. The project recognizes vital information such as catchment boundaries, conduit paths, node location, invert levels, drianage capcities and discharge locations. This document identifies flooded areas alongside any drains being under capacity or current priority area of the MCGM for intervention. The stormwater drain network of Mumbai comprises a ctiy-wide network of open and closed drains, pumping stations and in recent efforts holding tanks and underground tunnels are being explored to augment the flood carrying capacities further as per the knowledge of lead author after consultation with the municipal authorities. The value of BGI lies as a concrete supplementary stormwater management approach incombination with the primary grey infrastructure approach. It supports conventional flood-risk approaches and is important to be integrated with city-wide stormwater engineering and urban planning to tackle urban heat, social well-being and micro-climate.
Literature Review
Global scientific reviews have demonstrated the effectiveness of BGI for reducing urban flooding runoff volumes. Recent reviews such as that of (Liu et al., 2025) have argued that BGI such as parks, wetlands, rain gardens and permeable pavements can reduce runoff by 20 to 40% in stormwater scenarios when implemented at sufficient scales. They highlight international examples such as Amsterdam’s Canal Network, Singapore’s ABC Waters Program and Kazan’s ‘ Resilient Belt’ to demonstrate successful integration of natural and engineered systems to enhance flood resilience. In some cases, the authors argue that 60 to 95% reduction is attained with benefits seen during frequent, low to moderate intensity rainfall events. There is limited evidence from countries in the Global South on the measurements to evaluate the effectiveness of BGI in urban settings. In the South East Asian context, peak flow reductions have been found upto 95% in the case of bioretention setups though effectiveness can drop when extremely intense flood events or when soil saturation limits are reached. Additionally, their study also highlights that successful implementation of BGI in South East Asian cases decreased inundated urban areas by upto 59% and reduced disaster losses by 29% (17) South East Asia’s tropical climate, high rainfall, dense population and informal settlements with low urban water infrastructure integration present unique challenges for the inclusion, adaptation and implementation of BGI (Hamel et al., 2022). Similarly, there is limited empirical evidence base from India with few studies quantifying runoff and flood reductions at city scales. Gangawar and Biswas (2025) find that in the Indian cities of Pune and Bengaluru, spatio-temporal analysis using remote sensing indices confirmed that effect BGI corelates with measurable decreases in urban flood risk at catchment scales reinforcing the interplay between densification, BGI loss and elevated flood hazard. (Hamel et al., 2022) find that through modelling and field monitoring both engineered and natural BGI reduce total runoff and peak discharge addressing stormwater management in urban areas. Despite these findings, countries in the global south are challenged with insufficient primary hydrological and socio-environmental data hampering robust, generalized recommendations for BGI design and scaling. This is combined by insufficient research combining BGI with grey infrastructure, inclusion of climate change impacts on BGI performance, lack of information on BGI application in informal settlements and high-density urban settings.
(Kelkar et al., 2025) in their systematic global review on BGI for its design, planning and implementation strongly support ‘Spatial Configuration’ as an essential dimension for introducing and integrating BGI in India. Their study finds global scientific coverage on BGI from North America, Europe and, South America among Global South countries yet with severe lack of scientific coverage from India. Their study strongly emphasizes on ‘ Spatial configuration and Analysis’ as being central to the development and implementation of BGI, particularly in assessing location, feature diversity, placement, design, distribution, quantity, quality, and geometry, alongside methodologies for classifying urban surface parameters. They assert on the importance of spatial science in BGI planning through information assessment, planning approaches, and urban infrastructure design. (Kelkar et al., 2025) highlight that while uptake of urban green infrastructure (UGI) has accelerated in the Global North, its promotion remains limited in the Global South due to informal settlements, infrastructural gaps, and unplanned urban development. They conclude on two major challenges that emerge: balancing urban expansion with conservation, and reconnecting cities with ecological systems. They highlight that San Jose, Costa Rica, and Mexico City demonstrate how Urban Green Infrastructrue can reduce urban footprints, enhance locally produced ecosystem services, and support stormwater management through careful spatial design and multifunctionality. To address these needs, their review finds proposals based on multicriteria methodologies for selecting and spatially distributing UGI features, though they stress that guidelines tailored for developing countries are still lacking. Lessons from global case studies, such as superblock implementations in Switzerland and Spain, highlight transferable insights for developing contexts like India, where urban density and neighborhood forms differ but offer potential opportunities for adapting UGI planning strategies.
Thus, systematic empirical research is needed on Indian cities to attain spatial knowledge, design feasibilities and possibilities for the introduction and integration of BGI with existing grey stormwater management systems emphasizing the importance of geospatial and hydrological modelling in design, planning and implementation of BGI in Indian cities. Hydrological modelling tools such as SWMM, semi-distributed models and, hybrid machine learning models have gained prominence to simulate and manage stormwater and formuate flood risk solutions in urban areas. Despite this, their application in Indian cities faces notable research and implementation gaps. Hydrological modelling frameworks such as the EPA SWMM ( Storm Water Management Model) is a dynamic, widely validated model designed for urban run-off quantity and quality simulations suitable for heterogenous catchments and able to handle variable input data and complex drainage networks. It allows for sub-catchment based spatial representation, integration of real rainfall data, simulation of pollutant transport and, flood control infrastructure. SWMM’s flexibility enables adaptation to available data and integration with climate scenarios making it a robust tool for both planning and emergency flood response (United States Environmental Protection Agency, Storm Water Management Model).
Research Gap
International studies have explored coupled SWMM-2D hydrodynamics or hybrid Machine Learning approaches but their application in Indian contexts are rare. Mumbai and other Indian cities involve extremely complex catchment characteristics comprising informal settlements and rapidly changing land use. SWMM’s ability to integrate stormwater drainage, land surface heterogeneity and, two-dimensional overland flooding makes it uniquely capable for addressing Mumbai’s flood risk where both extreme precipitation and localized drainage failures intersect. Its proven track record globally, flexibility in data inputs, and compatibility with coupled modelling frameworks allow detailed risk analysis even where data is incomplete. SWMM also allows for future scenario testing in terms of climate, urban development and, infrastructure changes helping planners identify critical vulnerabilities to propose inteventions. Indian megacities such as Mumbai call for urgent research that integrate data, develop scalable models and demostrate need for hybrid modelling approaches as a result of scarce data and complex urban situation. Despite a global transition to Blue-Green Infrastructure (BGI) as a sustainable storm water management intervention, there is a lack of empirical and spatial research specifically concerned with Indian megacities such as Mumbai. The vast majority of studies are either general or rely on metropolitan scales rather than ward-level implementations; there is an even greater absence of studies concerned with implementing ward level BGI stormwater strategies in developed cities such as Mumbai. As discussed above models such as SWMM used to assess Low Impact Development (LID) strategies exist internationally, similarly, integrating these into geospatial tools such as QGIS in urban Indian catchment areas has yet to be implemented. The literature also pinpoints a gap in assessing the feasibility and spatial suitability of BGI interventions by applying actual drainage data, rainfall data, and appropriate land use data in line with Indian Urban Morphology.
Thus, various biophysical constraints need to be empirically evaluated and assessed in Mumbai at the ward-level to understand the potential of introducing BGI and ascertain its actual feasibility. Highly urbanized context of Mumbai presents unique local conditions in combination with its coastal city nature and conditions which warrant systematic investigation of BGI across variables such as soil, groundwater, land use and rainfall. This study seeks to fill the identified knowledge gaps by providing a location-specific, data-driven analysis to simulate and assess BGI interventions for the Wards of F-North and G-North within the city of Greater Mumbai in India.
Objective
Owing to the introduction, context and rationale of Greater Mumbai, the objective of this study is to use SWMM-based hydrological modelling to evaluate the planning and design potential of BGI in the F-North and G-North wards of Greater Mumbai. Figure 1 shows the conceptual framework undertaken for this study.
Methodology
Study Area Description
The study area comprises Ward F/N (F-North) and Ward G/N (G-North) of Mumbai, both governed by the Municipal Corporation of Greater Mumbai Municipal Corporation of Greater Mumbai. (n.d.) (See Figure 2). These centrally located wards are vital to the city's urban and infrastructural framework, comprising a dense mix of residential, commercial, industrial, and informal settlements. Ward F/N encompasses key localities such as Sion, Matunga, Antop Hill, Pratiksha Nagar, Sangam Nagar and Wadala East, while Ward G/N includes prominent areas like Dadar, Mahim, and the informal settlement of Dharavi. The latter being one of the largest informal settlements in Asia. (Figure 5). Ward F/N (F North) encompasses around 12.98 km² and has an approximate population of 529,034, as per the Census 2011. Ward G/N (G North) covers around 9.07 km² and has an approximate population of 537,032, as per the census 2011 Municipal Corporation of Greater Mumbai. (n.d.). As per the Municipal Corporation of Greater Mumbai (2017) which serves as the primary stormwater drain design, plan and system of the city of Mumbai, we select the catchments 506, 507 and 410 for our study. The Catchments 506 & 507 fall within the administrative boundary of Ward F/N, while Catchment 410 is located in Ward G/N. The catchment 506 & 507 comprises important areas such as King Circle, 5 Gardens and Antop Hill. Whereas, 410 catchment comprises areas around the Matunga railway station, Sion and notable informal settlement of Dharavi.
Figure 2.
MCGM Ward boundaries, Source: Mumbai Wards Map, ARCGIS Online.
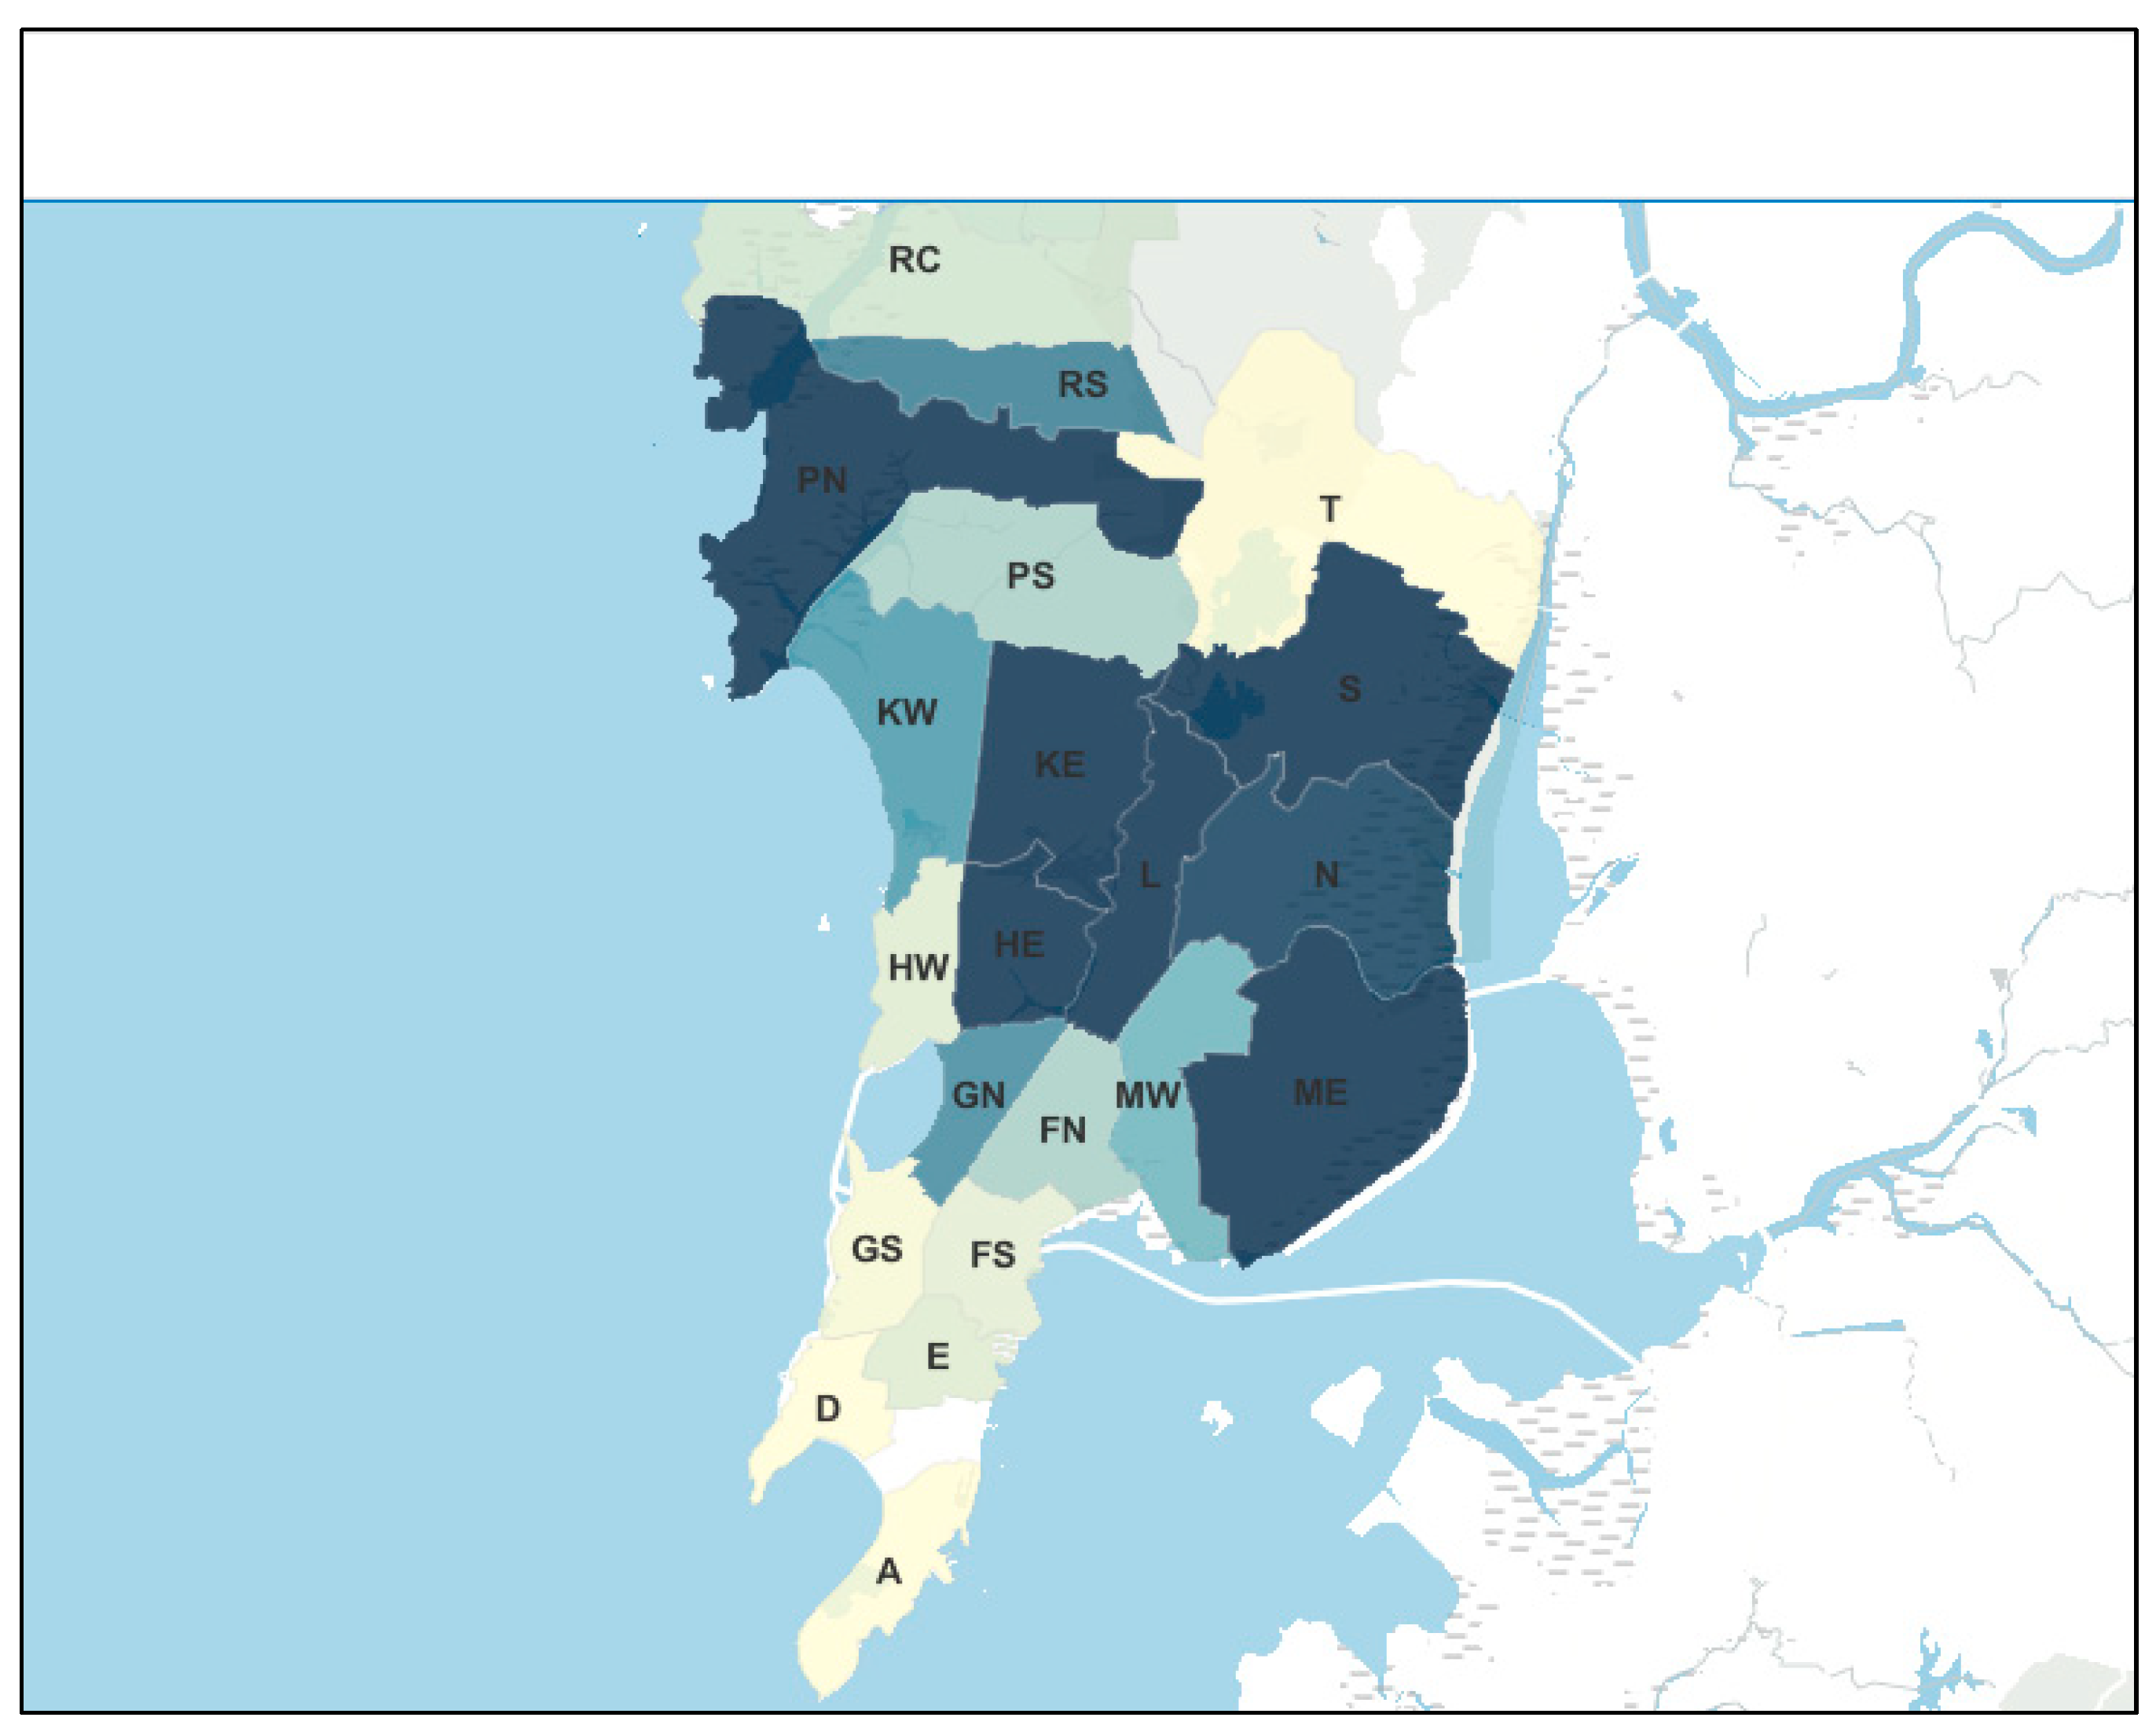
Figure 3.
Ward F/N and G/N boundary, Source: Open Street Map.
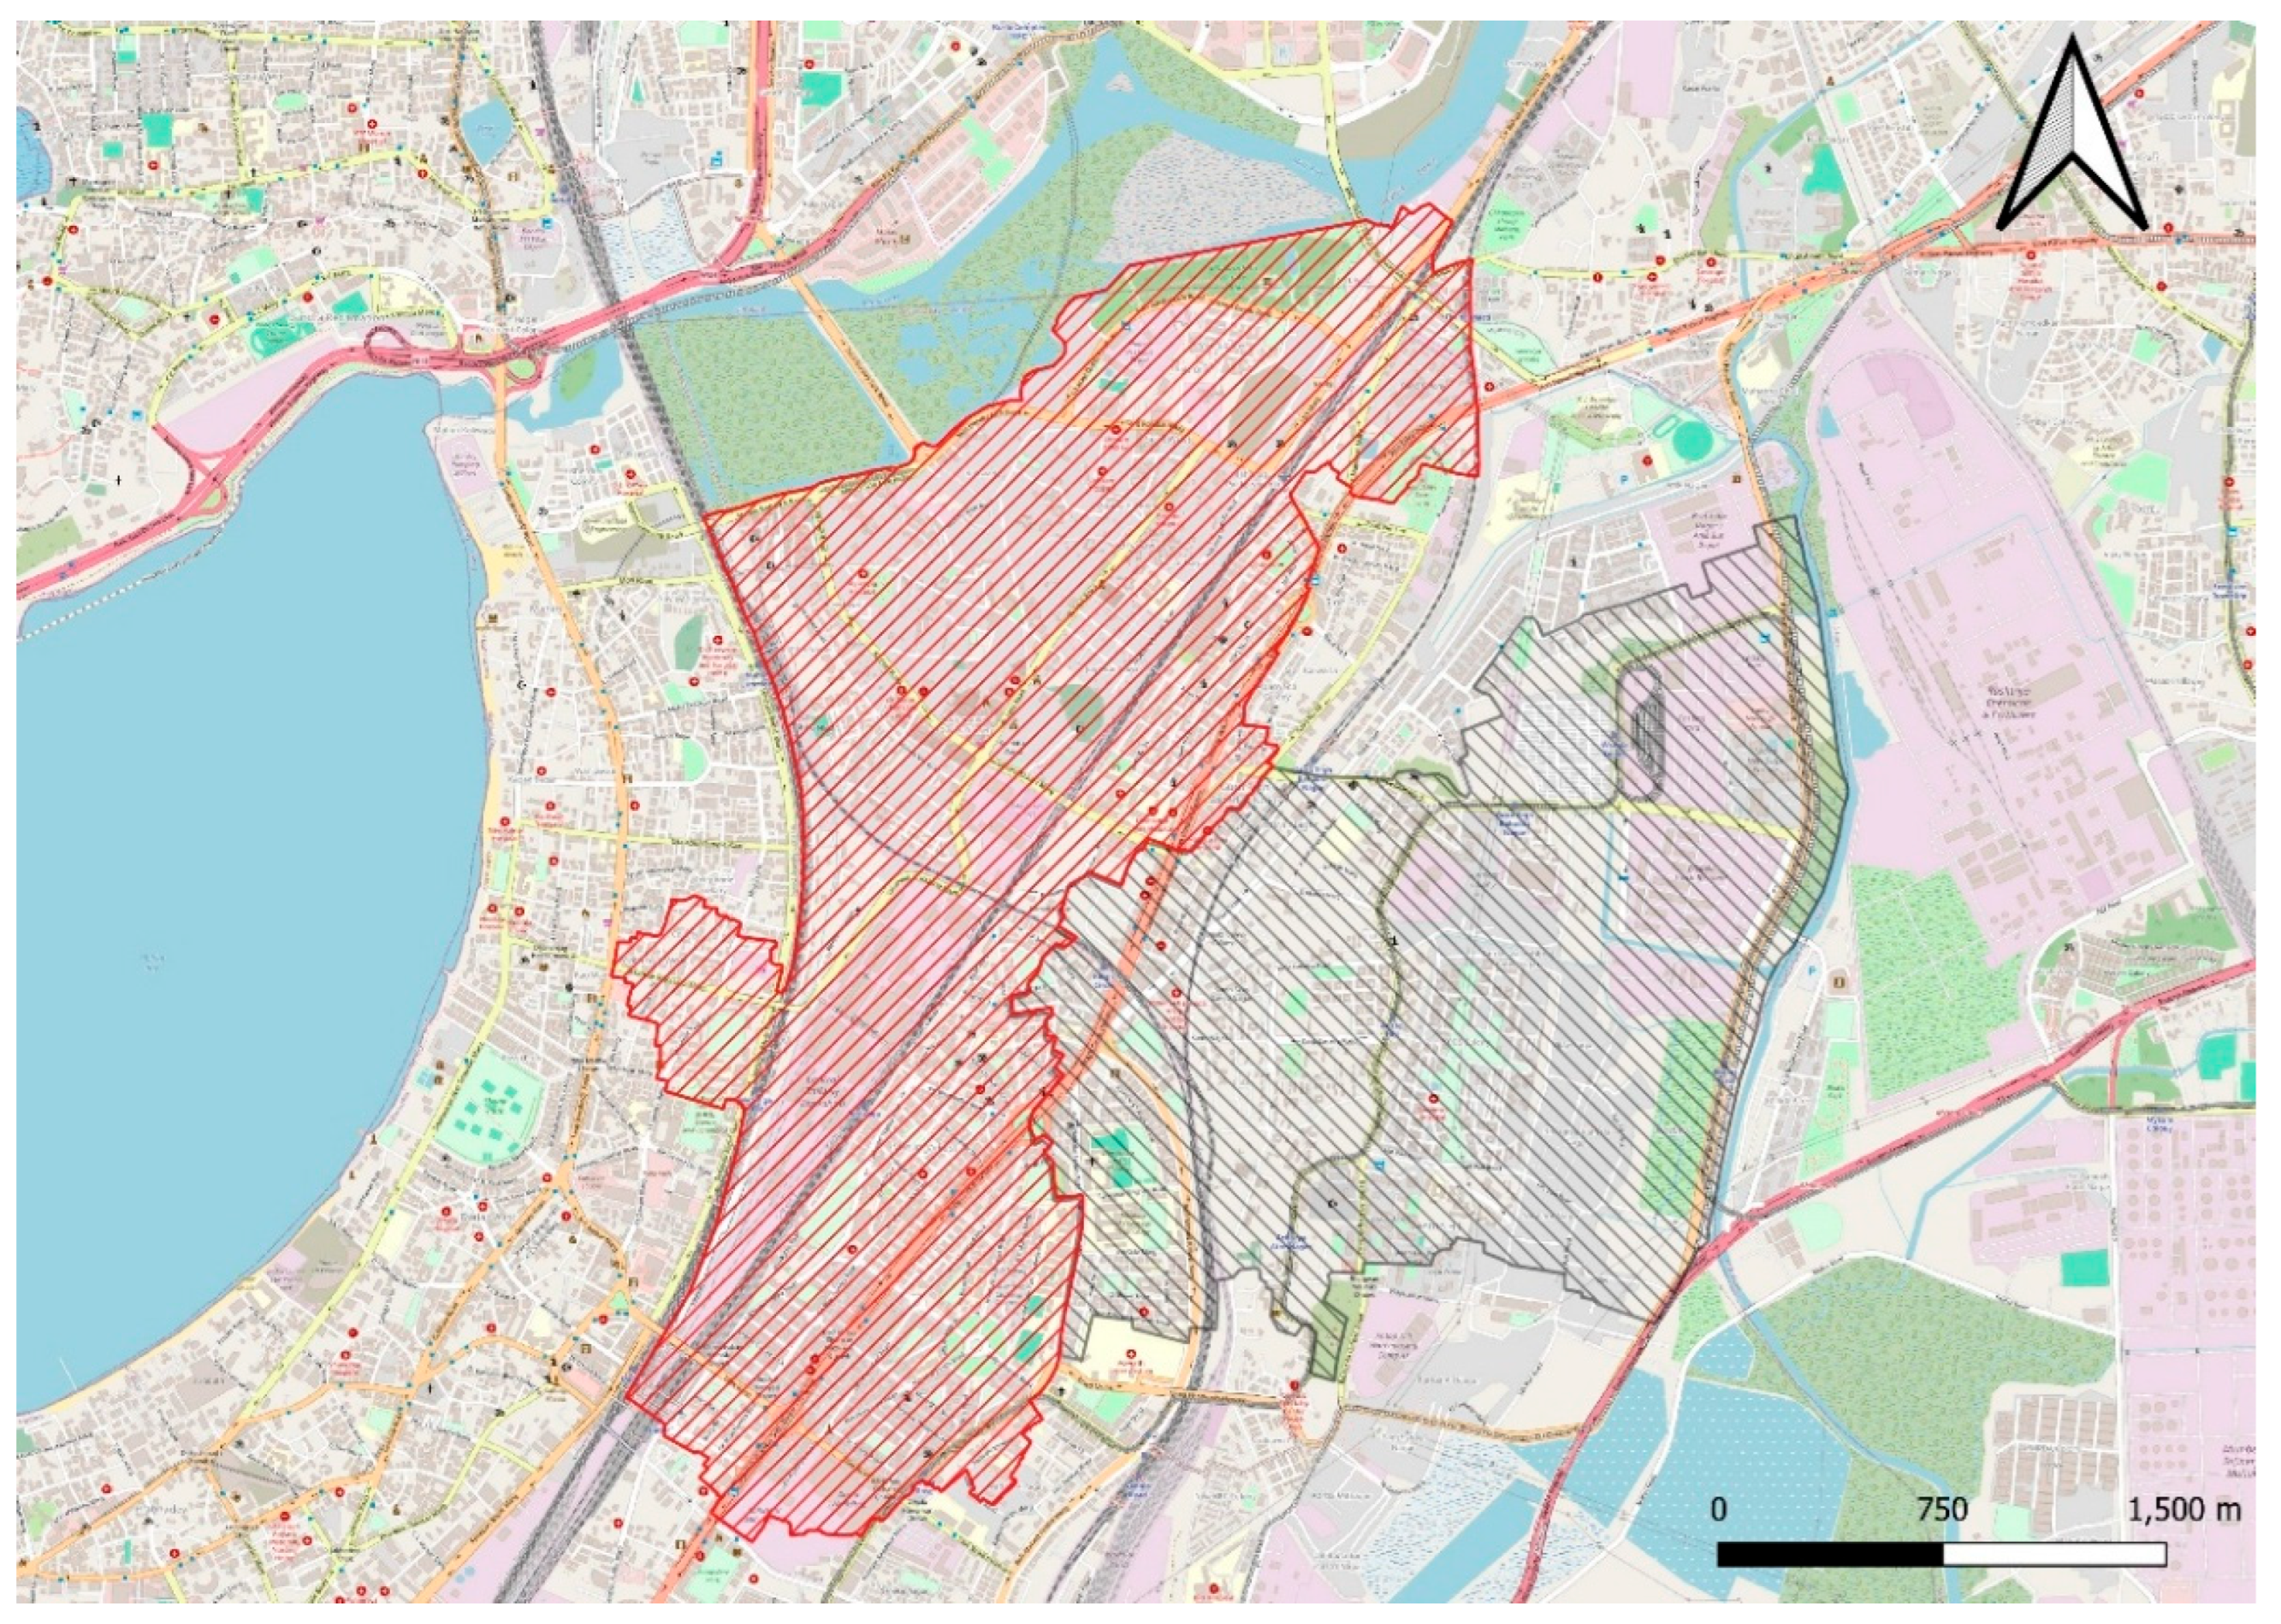
Both wards are well-connected through major transportation infrastructure. As shown in Figure 3, the nearest major railway stations are Dadar, Matunga, Sion, and Mahim, all part of Mumbai’s suburban railway network, which plays a critical role in daily commuter movement. Additionally, these areas are accessible via the Eastern Express Highway and Western Express Highway which serve as the major highway and vehicular networks connecting the north-south axis of the city. The Chhatrapati Shivaji Maharaj International Airport is located approximately 10–12 km from these wards, serves as the nearest air transit hub, ensuring regional and international connectivity. Historically, this region has been significant and have served as hubs of commerce and culture. Notably, the 2005 Mumbai floods had a profound impact on both F/N and G/N wards, particularly due to their low-lying nature and proximity to the Mithi River and Arabian Sea coastline. During the flood event on 26 July 2005, these areas experienced severe waterlogging, property damage, and disruption of essential services, highlighting the urgent need for resilient storm water management.
The catchments 506, 507 and 410 in the F/N and G/N wards respectively were selected by the authors due to the prevalence of higher rate of gardens, open spaces and, as the neighbourhoods comprise adequate level of planning and formal settlement. This ward and neighbourhoods of King Circle, 5 Gardens and areas around Matunga station were equally recommended by the senior executive engineers of the Stormwater Drains Department of MCGM due to chronic annual flooding patterns. While both the wards and the respective catchments comprise formal and substantial informal settlements; for this study, we limit to the application of our study objectives to formal settlements only. The unique mix of dense urbanization, strategic location, historical vulnerability, and transport connectivity makes Ward F/N and G/N critical zones for assessing the performance and planning of urban drainage systems. These characteristics provide a suitable context for evaluating storm water management models such as SWMM and the integration of sustainable solutions like BGI practices. Additionally, Mumbai is undergoing comprehensive slum redevelopment processes and redevelopment of older formal housing stock. Exploring BGI planning potential in the selected study areas will serve as evidence as to how BGI can be introduced and integrated within the existing grey stormwater management system of the city within a formal settlement and thereby serve as a model to further scale and replicate the simulation methods to other formal settlements across the remaining 24 wards and catchment areas within the city. Further, as redevelopment processes take shape and momentum, such methodology for broader introduction of BGI can be applied when more land, space and development potential is generated.
Both wards experience the tropical climate typical of Mumbai, which is marked by three distinct seasons: a hot and humid summer (March to May) with temperatures ranging from 30°C to 35°C; a monsoon season (June to September) characterized by heavy rainfall exceeding 600 mm per month; and a mild winter (December to February), during which temperatures remain between 15°C and 30°C. These climatic conditions influence urban planning, infrastructure resilience, and public health measures in the region. (India Meteorological Department)
Rain Gauge Station in the City
The MCGM has installed 26 automatic gauges across fire stations citywide, transmitting hourly rainfall data to a central control room. This helps with early warning triggers for heavy rainfall (e.g., >20 mm/hr) (Singh et al., 2017). In the context of Wards F/N and G/N in Mumbai, several rain gauge stations are located nearby to provide localized rainfall data critical for urban flood management. One of the nearest rain gauge stations to Ward
F/N is situated at the Wadala Fire Station, which falls well within the F/N jurisdiction. It provides real-time rainfall intensity measurements that are centrally monitored during the monsoon season. For Ward G/N, one of the closest rain gauge stations is located at the Dadar Fire Station, which is situated near
Shivaji Park and falls within the boundaries of G/N as shown in Figure 4. In addition to these, both wards are supported by a broader network of Automatic Weather Stations (AWS) and IoT-enabled rain sensors, particularly installed in low-lying or flood-prone pockets such as Pratiksha Nagar (F/N) and the Dadar West underpass (G/N). These gauges are vital for monitoring rainfall at 15-minute intervals and issuing early warnings for potential waterlogging or urban flooding, which is crucial during peak monsoon months, aiding the BMC's disaster preparedness and response mechanisms (Anti-theft, hit sensor upgrades for rainwater logging detection systems, 2024).
Data Collection and Preparation
The BRIMSTOWAD II Master Plan Report (Brihanmumbai Storm Water Disposal System), is the primary document that describes both the current situation and the planned future of storm water systems in Mumbai. This report was produced by the Municipal Corporation of Greater Mumbai (MCGM) and is an updated and expanded version of the original BRIMSTOWAD I project, incorporating updated rainfall records, updated land use, as well as city’s existing drainage networks. The system is designed as a separate storm water drainage network, independent from the sewerage system, to manage surface runoff during rainfall events. Further, it recognizes vital information as catchment boundaries, conduit paths, node location, invert levels, drainage capacities and discharge location. This document highlights flooded areas alongside any drains being under capacity or current priority area of the MCGM for intervention. Thus, the BRIMSTOWAD II report was referenced in our storm water modelling and undertaken for this study, and the BRIMSTOWAD II data for catchments 410 and 506&507 within Wards G/N and F/N were used for constructing the SWMM model. This BRIMSTOWAD II report and data was attained by the lead author directly from MCGMs Stormwater Drains Department.
Natural Watercourses (Open Drains)
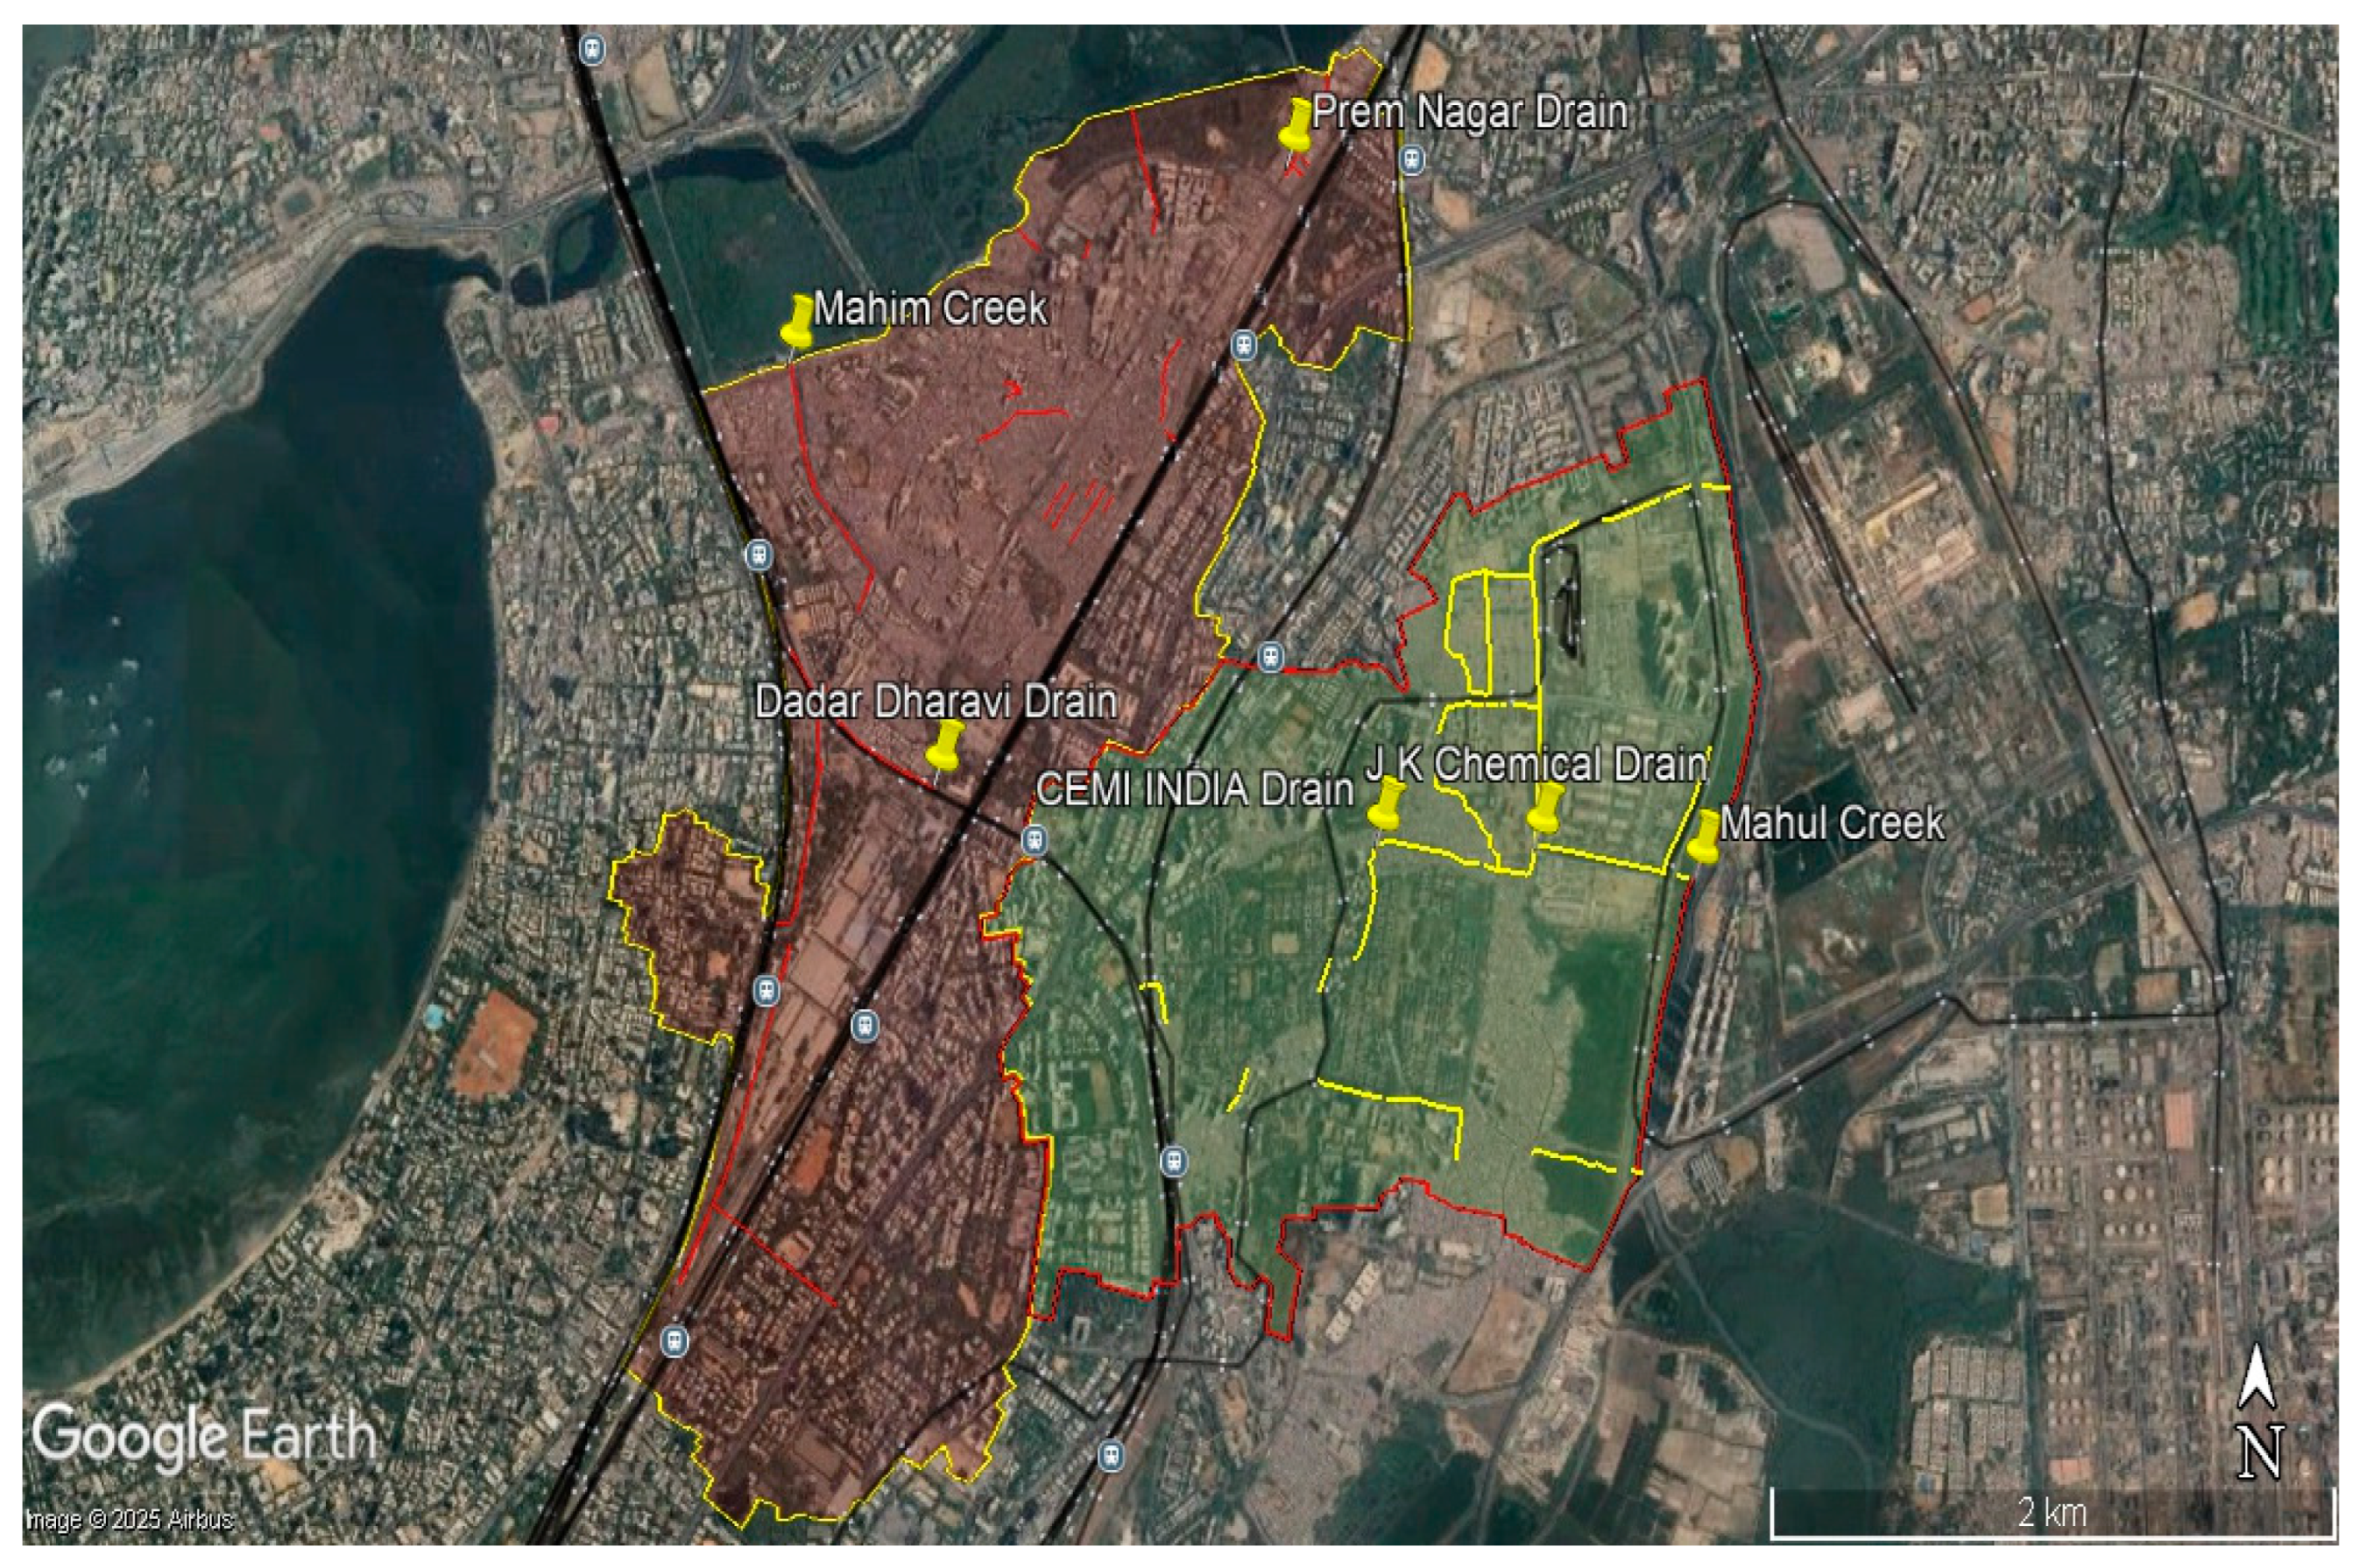
The study area comprising Wards F/N and G/N features several natural watercourses, mostly open drains, which play a vital role in the storm water drainage system. In Ward F/N, two prominent natural streams include the J.K. Chemical Drain and the Cemindia drain, both of which ultimately discharge into Mahul Creek (See Figure 4). These Drains serve as major carriers of runoff during monsoon and have historically contributed to surface drainage in low-lying areas. Significant upgrades have been proposed and partially implemented, such as the widening and training of the Cemindia drain to 4.0 × 3.0 m and the lower portion of the J.K. Chemicals drain to a width of 8.0–10.5 m × 4.5 m depth, to increase capacity and reduce flooding risk (BRIMSTOWAD-II Master Plan report for Catchment 506-507, 2017).
In Ward G/N, within Catchment 410, the drainage system relies heavily on the Dadar Dharavi drain and the Prem Nagar drain, which form natural drainage paths eventually discharging into Mahim Creek (See Figure 5). These Drains traverse through highly urbanized zones such as Dharavi, Sion, and Dadar, receiving both storm water and, in some locations, untreated domestic inflows. Despite their critical function, these watercourses suffer from issues such as unregulated and unplanned formation of informal settlements on vacant lands along the watercourses, siltation, and backflow due to tidal ingress, which severely affect their hydraulic performance. Historic flooding events along these drains, including the notable 2005 Mumbai floods, underscore their limitations under high-intensity rainfall conditions (BRIMSTOWAD-II Master Plan report for Catchment 410, 2017).Overall, the natural drain systems in the study area form the backbone of local storm water management, but their effectiveness is compromised by rapid urban development and lack of consistent maintenance. Strategic interventions such as deepening, desilting, and channel realignment, combined with pumping and micro-tunneling solutions, have been proposed under the BRIMSTOWAD II Master Plan to test.
Figure 5.
Open Drain and Discharge Location.
Existing Storm Water Drainage System in Study Area
The existing storm water drainage system in Wards F/N and G/N of Mumbai is a mix of open drains and underground drains, forming part of the larger city-wide BRIMSTOWAD II network. In Ward F/N, drainage is primarily managed through Catchments 506 & 507, which discharge into Mahul Creek (see Figure 4). These catchments include key drainage components such as the J.K. Chemicals drain and Cemindia drain, supported by a network of open and closed drains with diameters ranging from 0.30 m to 12.00 m. The length of the network (shown in Figure 6) is approximately 32.9 km, and upgrades have included widening and deepening of key channels to mitigate flooding risks (BRIMSTOWAD-II Master Plan report for Catchment 506-507, 2017).
Ward G/N includes Catchment 410, which drains from the southern shore of Mahim Creek to Dadar and fully encompasses the Dharavi area. This catchment discharges through two major systems: the Dadar Dharavi drain and the Prem Nagar drain, eventually out falling into Mahim Creek. The total length of the drainage network (see Figure 6) here is over 72 km, with drain dimensions ranging from 0.30 m to 18.00 m. Despite its scale, this system is hindered by hydraulically inadequate culverts, especially under the railway lines, and heavy siltation. These limitations have historically resulted in flooding at several locations, including Lal Bahadur Shastri Road, 90 Feet Road in Dharavi, and Dadar T.T., as documented in multiple flood years 1993 and 2009–2011 [19]. To address these issues, multiple improvement proposals have been recommended under BRIMSTOWAD II, including pumping stations at Mahim Nature Park and King Circle (see Figure 6), and micro-tunneling to bypass congested sections and improve flow conveyance. However, many of these improvements remain constrained by informal settlements and land acquisition challenges. Overall, the drainage systems in both wards are under stress due to ageing infrastructure, rapid urbanization, and climate-induced extreme rainfall, necessitating continued investment in sustainable upgrades and storm water management strategies Municipal Corporation of Greater Mumbai (2017).
Data Collection Methods and Sources
Extreme short-duration rainfall data is required to evaluate the design intensity. As a feed into SWMM to simulate wet-weather flow information in the system. For estimating the runoff value, characteristics of the drainage basins such as shape of the area, topographical data, imperviousness of the catchment area, data on the capacity of the disposal water body and of the existing storm water drains already constructed in area are required as boundary conditions in SWMM. Thematic maps are produced, such as slope and contour map of the study area based on Digital Elevation Model (DEM). Details of data collected for the present study is presented in Table 1.
Extreme short-duration rainfall data is required to evaluate the design intensity As a feed into SWMM to simulate wet-weather flow information in the system. For estimating the runoff value, characteristics of the drainage basins such as shape of the area, topographical data, imperviousness of the catchment area, data on the capacity of the disposal water body and of the existing storm water drains already constructed in area are required as boundary conditions in SWMM. Thematic maps are produced, such as slope and contour map of the study area based on Digital Elevation Model (DEM). Details of data collected for the present study is presented in Table 1.
Model Setup and Calibration
Sub-Catchment Delineation
Sub catchment delineation in SWMM is the process of dividing the study area into smaller, hydrologically homogeneous units called sub catchments to simulate runoff generation and routing. Each sub catchment represents a portion of land that drains to a single outlet point, such as an inlet, manhole, or channel segment (United States Environmental Protection Agency, Storm Water Management Model).
The methods of delineation are as follows:
i.Manual Delineation: Based on engineering judgment, local drainage patterns, and physical boundaries like roads or land use types.
ii.GIS-Based Delineation: Uses Digital Elevation Models (DEMs) and hydrologic tools (e.g., ArcGIS, QGIS) to automate and refine the process.
Key Parameters for Delineation
When delineating sub catchments in SWMM, several physical and hydrologic characteristics must be defined as shown in Figure 7.
- Area (ha or ac): The surface area of the sub catchment, which directly influences the volume and flow of runoff.
- Width (m or ft): An idealized flow path width that affects the timing of runoff; it is not the physical width but a parameter used to compute overland flow.
- Slope (%): Average slope of the sub catchment, which impacts velocity and flow rate of surface runoff.
- Imperviousness (%): The percentage of the area covered by impervious surfaces (like roads, roofs), influencing runoff quantity and delay.
- Roughness (Manning’s n): Separate values for surface categories (e.g. pervious and impervious areas) that affect flow resistance, runoff velocity and timing.
- Depression Storage (mm or in): Storage depth that must be filled before runoff begins, representing surface ponding and interception.
- Infiltration Parameters: Values based on the selected infiltration method (Horton, 1940), (Green and Ampt, 1911) used to estimate infiltration losses.
- Supplementary materials contain the section on thematic mapping using QGIS comprising figures from 8 to 13.
Supplementary material contains the section on thematic mapping using QGIS comprising figures from 8 to 13
Flood Point Analysis and Identification of Hotspots
Flooding in the study area, encompassing Catchments 410, 506&507 (BRIMSTOWAD-II Master Plan report for Catchment 410, 2017), (BRIMSTOWAD-II Master Plan report for Catchment 506-507, 2017) within Wards F/N and G/N, has been a recurring issue due to inadequate drainage capacity, silted drains, low-lying terrain, and tidal influence. Historical flood data obtained from the BRIMSTOWAD II Master Plan were used to validate model results and identify flood-prone zones. In Catchment 410 (G/N Ward), severe waterlogging has been reported at multiple locations including Lal Bahadur Shastri Road near Dharavi, 90 Feet Road, Dadar T.T. (Khodadad Circle), and Guru Nanak School, with flood records dating back to 1993 and recurring up to 2011 as shown in Figure 14. These hotspots correlate with hydraulically inadequate culverts, backflow from Mahim Creek, and encroachments along the Dadar Dharavi drain (BRIMSTOWAD-II Master Plan report for Catchment 410, 2017).
Similarly, in Catchments 506&507 (F/N Ward), flooding has been consistently observed in areas such as Gandhi Market, Mangal Society, Govari Cemetery, and the Suleman Compound, primarily due to limited capacity and untrained sections of the J.K. Chemicals Drain and Cemindia drain as shown in Figure 14 (BRIMSTOWAD-II Master Plan report for Catchment 506-507, 2017).
Despite improvements like drain widening and realignment proposed under BRIMSTOWAD II, several locations continue to experience flooding under high-intensity rainfall combined with high tide, necessitating enhanced pumping and storage interventions. These flood-prone areas have been mapped and considered critical for further hydraulic modeling and infrastructure upgrades.
BGI Scenario Modelling
Integration of Blue-Green Infrastructure (BGI) Features
In this study, Blue-Green Infrastructure (BGI) is modelled through the Low Impact Development (LID) controls available in SWMM, which simulate decentralized storm water management techniques within urban drainage systems. LID is an alternative sustainable urban water management approach that uses natural resources to manage storm water runoff as a part of BGI. There are various BGI practices being developed in the past decade such as green roof (GR), vegetative swale (VS), infiltration trench (IT), and permeable pavement (PP). In the present study, select BGI strategies have been proposed for implementation within Wards F/N and G/N.
Permeable Pavement (PP): Proposed along existing pedestrian footpaths, permeable pavements allow storm water to infiltrate through surface layers and reduce surface runoff.This intervention has proposed along the well-developed sidewalk network in Wards F/N and G/N and can be implemented with minimal disruption to traffic or urban services. As shown in the Table 2, the proposed dimensions for Permeable Pavement (PP) have been used as input parameters in the SWMM model to simulate its hydrologic performance.
Green Roof (GR): Green roofs are suggested based on flat rooftops of public buildings like schools, government offices, and institutions. They serve the purpose of retaining rainfall where it falls to delay runoff peak and improve urban thermal conditions while adding green cover in development-intensive urban concentration. As shown in the Table 3, the proposed dimensions for Green Roof (GR) have been used as input parameters in the SWMM model to simulate its hydrologic performance.
Infiltration Trench (IT): Infiltration trenches are suggested in a select few open spaces depending on suitability of subsurface conditions. These trenches are shallow excavated trenches filled with gravel that serve the purpose of intercepting and infiltrating storm water runoff from impervious surfaces where it is possible. As shown in the Table 4, the proposed dimensions for Infiltration Trench (IT) have been used as input parameters in the SWMM model to simulate its hydrologic performance.
These targeted BGI strategies aim to enhance the storm water management capacity of the existing drainage system, especially in areas where conventional infrastructure improvements are challenging due to space constraints.
Model Building
Relevant base data, including drainage layout, road networks, land use patterns, and natural drainage paths (Drains), are extracted from BRIMSTOWAD II project drawings and other MCGM sources. These files, initially in PDF and CAD formats, are geo-referenced and converted into compatible .shp and .map file formats for use within SWMM as a backdrop.
The model building work flow is shown in Figure 15 (Supplementary material), while the details on importing nodes, links and outfalls as well as on sub-catchment delineation are presented in the supplementary material.
Rainfall Intensity Series Generation for SWMM Simulation
To simulate storm water runoff under design storm conditions, rainfall intensity values were derived from Intensity-Duration-Frequency (IDF) data corresponding to a 25-year return period event. The IDF curve was used to generate a synthetic rainfall hyetograph with uniform time intervals of 10 minutes, suitable for SWMM input. These values represent the temporal distribution of rainfall intensity over the selected storm duration and were used to create a time series file in SWMM. A 25-year return period storm was selected to evaluate the performance of the existing storm water drainage system under extreme rainfall conditions and to assess the effectiveness of proposed Blue-Green Infrastructure (BGI) interventions in mitigating urban flooding during high-return-period events. The Table 5 below presents the rainfall intensities computed for each time interval, forming the basis of the design storm applied in the hydrologic-hydraulic simulation.
Results
Storm Water Drainage Model Outputs
The simulation of the existing storm water drainage network was carried out to evaluate both its hydrological and hydraulic response under selected rainfall events. In SWMM, the hydrological response is simulated at the sub catchment level, where runoff is computed based on land surface characteristics such as area, slope, imperviousness, and infiltration to simulate wet weather conditions, the model utilized a time series of rainfall data obtained from the nearest rain gauge station within the study area. This precipitation input serves as the primary driver for runoff generation and is critical for reproducing the real-world performance of the system under storm conditions.
The time series was formatted and input into SWMM to initiate the wet weather flow simulation. The model then routed the generated runoff through the existing drainage network, allowing for assessment of system performance, identification of surcharged nodes, and prediction of potential flooding locations. This simulation framework is essential for evaluating the adequacy of current infrastructure and for proposing targeted improvements based on flooding nodes and system capacity.
Flooding at the manhole or node level, even in modelling applications such as EPA SWMM, is defined in a general sense when the computed water surface elevation is higher than the ground elevation (the node rim). However, not all modelled flooding events have the same level of importance. Flooding events that last for very short durations may not show up as visible surface ponding nor practical disruption, and may simply represent numerical noise, instability in the model, or very short surcharge, meaning flooding is limited in time and drops off quickly. To help with the clarity and relevance of model results, a minimum duration of flooding is generally established. Thus, flooding events that lasted for less than a certain time 15 minutes can be excluded from reporting and analysis (Gizewski, 2022).
The total runoff volume generated from all sub catchments during the simulation was approximately 783510 m³, with the highest contributing sub catchment being Sub catchment ID 410_6, generating 46,560 m³ of runoff (see Figure 20 for sub catchment ID location).
Flooding Nodes Recorded After Simulation
The flooding nodes identified were primarily located within the sub-catchments of Wards F/N and G/N, showing a strong spatial correlation with previously mapped flooding hotspots derived from the 25-year return period rainfall hyetograph (Refer: Figure 21). The longest flooding duration occurred at Node 1082, which remained inundated for approximately 1.98 hours (119 minutes). The highest peak runoff rate was observed at Node A1052/29J, reaching 6.13 m³/s during the simulation (Refer: Table 6)
Figure 21 shows the rainfall (mm/hr) and runoff quantity in LPS for the study area during the duration of 01.07.2024 to 31.07.2024. Several significant rainfall events during the month of July, particularly significant rainfall events around 5th, 11th, and 20th of July, corresponded with runoff spikes with maximum flows just below 80,000 LPS. The direct time-based relationship of rainfall to the peaks in the runoff quantity shows how reactive the system is being to the intense rainfall events.
Validation of Storm Water Model
For this study, actual discharge data at the outfall was not available from the Municipal Corporation of Greater Mumbai (MCGM), nor the agency responsible for the BRIMSTOWAD II Master Plan. Therefore, model validation was undertaken by comparing the simulated flooding nodes from SWMM to actual flooding hotspots observed in previous events of high-intensity rainfall in year 2009-2011.
After running the model with the maximum rainfall 270.96 mm, recorded on 01.07.2024, a sensitivity analysis was performed to understand how different parameters influence model output. This analysis revealed that the impervious area percentage ranging from 25% to 43% and surface slope ranging from 2% to 4% had the greatest impact on runoff volume and node flooding. The model was calibrated by varying these parameters within plausible ranges, resulting in a calibrated configuration that predicted flooding at 5 out of 7 observed flood-prone locations (see Figure 14 for all flooding nodes as per BRIMSTOWAD II). In particular, major hotspots in Ward G/N at Node ID A153, A1052/29J and Ward F/N at Node ID A115, 851/8J, 506/53H, 620 were correctly identified as flooded which are located near to the flooding nodes as per BRIMSTOWAD II master plan (Figure 22).
Impact of Blue-Green Infrastructure (BGI) Features
The simulation results indicate that several junction nodes within the storm water drainage network experience surcharging and flooding during high-intensity rainfall events. To mitigate these issues, the integration of Blue-Green Infrastructure (BGI) in the form of Low Impact Development (LID) practices is proposed. In the context of Wards F/N and G/N, widespread urban development has led to a substantial increase in impervious surface coverage, further intensifying runoff generation. As both wards contain extensive slum settlements, the implementation of BGI in these areas poses practical challenges due to space constraints, irregular land use, and limited infrastructure access. Moreover, as per the Mumbai Development Plan, many of these informal settlements are scheduled for redevelopment, making immediate intervention through BGI less feasible. Consequently, Ward G/N is identified as the primary focus area for BGI implementation, given its better spatial configuration, feasible right-of-way availability, and well-structured footpath and road network.
Permeable Pavement (PP), Infiltration Trenches (IT), and Green Roofs (GR) have been proposed as BGI measures. Catchment 410, located within ward G/N, has a well-developed footpath network, making it suitable for converting these footpaths into permeable pavements. The footpath widths range from 1.0 to 2.5 meters and connect both sides of the roads effectively. Figure 23 illustrates the layout for the proposed permeable pavement. Additionally, certain areas in ward F/N within catchments 506&507 are also considered for permeable pavement installation due to the availability of footpath networks.
Given the study area, the broad applicability of green roofs is limited by two major barriers: a lack of adequate flat-roofed buildings and the fact that many of the flat rooftops that exist, have already been occupied by solar panels, leaving little viable or usable area to retrofit into green infrastructure. For this reason, green roofs are limited to a small number of buildings, namely the government facilities and public schools that have a flat unobstructed rooftop that could be potentially utilised in large enough area for implementation. Figure 24 shows the locations of the rooftops within wards F/N and G/N. These site-specific solutions can provide modestly reduced rooftop runoff, but during high-intensity rainfall and short duration, could potentially reduce measurable amounts of runoff. This measure can also be integrated into the broader BGI strategy, as it enhances on-site storm water retention and, although indirectly, contributes to strengthening urban resilience. Infiltration trenches have been primarily proposed in Ward G/N due to the availability of open space, particularly along wide road medians and central dividers, making them ideal for decentralized storm water management interventions. As illustrated in Figure 25, these trenches are strategically located at Five Gardens, Dadar T.T. Circle Bridge, Lakhamsi Napoo Road, and Bhandarkar Road, where footpaths and road geometry support implementation without significant disruption to traffic or pedestrian movement. Green Infrastructure measures were selectively applied to specific sub catchments based on spatial feasibility, land use, and available public right-of-way. As a result, not all sub catchments within the study area were modified in the BGI scenario.
The simulation was re-run after incorporating the proposed BGI features, and a noticeable reduction in total runoff volume was observed. Additionally, several nodes that previously exhibited flooding showed a significant decrease in peak runoff, and the overall number of flooded nodes was reduced compared to the pre-BGI scenario.
Consequently, certain nodes particularly those located downstream of sub catchments without BGI interventions exhibited minimal or no change in peak runoff rate, flood volume, or inundation depth between the baseline and post-BGI simulations. These nodes maintained identical runoff responses due to the absence of upstream hydrologic alteration. This outcome underscores the spatially localized nature of BGI benefits, where runoff mitigation is primarily observed in areas directly treated with infiltration or detention-based interventions. It also highlights the importance of strategic placement and wider coverage of BGI to generate systemic improvements in drainage performance.
Table 7 and Figure 24 present the results of flooding nodes obtained from the SWMM simulation before and after incorporating BGI measures. Most of the interventions resulted in a reduction in both the maximum flow rates and the flood volumes compared to the pre-BGI scenario. However, in some nodes, in whose related areas the implementation of BGI measures was not feasible, no significant effect can be achieved.
Table 8 presents a comparison of sub catchment runoff characteristics before and after the implementation of BGI interventions. It is evident that the sum of all peak runoffs decreased from 137.6 m3/s (pre-BGI) to 120.2 m3/s (post-BGI). These values can be seen as an indicator for flow peak reduction. However, in individual sub-catchments, the reduction can be more significant. For sub-catchment 410_2, the reduction of the peak flow rates from 7.40 m3/s to 3.59 m3/s refers to a relative reduction of 51.5 %. Additionally, the total runoff volume reduced from 783,510 m³ to 740,410 m³, indicating the effectiveness of the proposed strategies in reducing storm water discharge.
Figure 25 illustrates the locations of flooding nodes observed after incorporating Blue-Green Infrastructure (BGI) features within the respective sub-catchments. These nodes are directly influenced by the implementation of BGI measures and are primarily situated at the downstream end of the contributing sub-catchments. As shown in Table 9, the application of BGI has led to noticeable changes in key hydraulic parameters, particularly a reduction in the maximum flooding rate (in LPS) and a decrease in total flood volume at the affected nodes.
The BGI Performance Summary Table 9 provides detailed hydrologic metrics such as inflow, total outflow, evaporation, and infiltration losses for each implemented BGI, enabling a quantitative assessment of their individual runoff reduction effectiveness. It offers critical insights into the hydrologic behaviour of each implemented BGI strategy across sub catchments. The infiltration trenches (IT) showed consistently high infiltration losses, with sub catchments like 410_3 and 410_4 achieving over 1,0 mm of infiltration, indicating their strong capacity for subsurface percolation under high inflow conditions. Permeable pavements (PP), while having lower inflow volumes, also contributed to runoff reduction, though infiltration values remained below 40 mm in most cases due to limited area or lower hydraulic conductivity. Green roofs (GR), implemented primarily in sub catchments with limited flat roof area, exhibited negligible infiltration losses, likely due to either under sizing or soil media properties, as reflected in zero infiltration across all GR sites. The variation in surface outflows further emphasizes how BGI type and placement significantly influence runoff dynamics, with combined strategies (e.g., IT and PP in 410_1) showing better integrated performance than individual applications. These findings suggest that BGI effectiveness is strongly governed by both the extent of LID area and local hydrological context.
Discussion
As highlighted in the introductory sections of this article, Mumbai comprises a combination of highly dense formal and informal settlements. Formal settlements in Mumbai are characterized by organized planning, legal recognition, and access to formal services like water, sewage, and electricity. These neighbourhoods feature older yet formal residential buildings to emerging higher-quality housing developments with structured layouts, supported with better public services and a regulated urban environment. In contrast, informal settlements—slums—develop organically outside the formal regulatory process, resulting in crowded spaces, poor housing quality, and limited access to public utilities (O'Hare. et.al., 1998). “Over 40% of Mumbai’s population resides in these informal settlements, which are densely packed but occupy only about 11% of city land” (Deshmukh, 2013). Informal settlements are highly dense, with limited open space, making it extremely difficult to introduce Blue-Green Infrastructure (BGI) like parks or stormwater management systems. Additionally, informal settlements frequently experience governance challenges, with land tenure that is quasi-legal or illegal and a lack of integration with formal city planning systems. These conditions result in exposure to flooding, poor sanitation, and environmental risks. However, as Mumbai moves towards slum redevelopment, much of the current dense informal settlement landscape is expected to be transformed, typically through high-rise residential projects. However, the authors of this article argue that this transition presents little opportunity for integrating BGI in areas with minimal open space and complex socio-political dynamics. Consequently, formal neighbourhoods—with identifiable flooding problems, existing open spaces, and structured layouts—offer more practical pilot sites for BGI experimentation.
To choose an appropriate pilot study area for BGI introduction and integration in Mumbai, the authors prioritized the following criteria:
- o Areas with ongoing flooding problems, where BGI could make a significant impact on stormwater management. Such sites were also recommended by MCGM’s SWD department officials.
- o Formal settlements with a substantial share of open and green space, increasing the feasibility for BGI components like rain gardens or permeable surfaces.
- o Neighbourhoods where BGI design can align with the prevailing urban fabric and complement existing stormwater regimes, ensuring both technical effectiveness and social acceptance.
Owing to this, the catchments of 506 and 410 were selected in Mumbai’s F/N and G/N wards as study sites. Owing to their strategic and central location in the city emphasizing their importance as key commercial, residential and transportation hubs as well as the prevalence of popular city gardens in F/N ward such as 5 Gardens and the King Circle landmark offered good opportunity to test the introduction and integration of BGI in these neighbourhoods. This BGI design and planning proposal will provide a baseline to replicate, retrofit and transform such neighbourhoods. The extreme urban density of Mumbai severely limits the feasibility of converting open spaces into detention or retention ponds, as these spaces are already contested for recreation and public use. Likewise, the scarcity of available land hinders the introduction of swales and infiltration trenches, though modifications to existing roadside open stormwater drains may provide partial alternatives in certain wards. However, high groundwater levels also constrain infiltration-based solutions, emphasizing the need to maintain sufficient stormwater drainage (SWD) capacity to ensure effective discharge into marine outfalls during intense rainfall events.
We have developed a flood risk hydrological model primarily using municipal and government datasets, supplemented with satellite data from Google Earth to address missing or unclear spatial information. The BGI feasibility assessment incorporated local contextual variables such as the prevalence of rooftop rainwater harvesting (RWH) systems, solar panels, and the structural limitations of older buildings that restrict retrofitting options like green roofs (GR). Roof coverage diversity also influences potential interventions—while high-rise residential buildings have limited roof areas, institutional and industrial buildings present larger opportunities for GR integration.
The existing storm water management system in Wards F/N and G/N was initially assessed using SWMM, then tested for various flooding conditions particularly high return period rainfall (25-year rainfall event). Spatial data including land use, slope, and imperviousness were developed in QGIS and the sub catchments were delineated based on the DEM and drainage pattern. Flood-prone areas were identified through simulation of the existing drainage system, indicating critical and emergence areas with runoff collection and ponding on the surface.
Applying the test rain event with a return period of 25 years, the applied BGI measures resulted in a 12.6% decrease of the sum of the peak runoffs from all sub-catchments from 137.6 m3/s to 120.2 m3/s, and a total runoff volume decrease of 5.5% from 783,510 m³ to 740,410 m³. While the relative overall runoff volume reduction might not appear that impressive, the reduction of the flooding volume from 94,111 m3 to 51,707 m3 for the 25-years event is more significant with 45 %. The reason for this is that the reduction in absolute total runoff volume of 43,100 m3 is almost fully beneficial for the flooding volume reduction. With that effect in mind, it becomes clear that somewhat less extreme events will result in a higher relative reduction of flooding volume through BGI measures, or even completely avoid flooding. Moreover, these reductions will assist in not only node level flood reductions, but further reduce the hydraulic loading on downstream facilities as well.
Our results indicate that BGI measures can improve storm water capture and retention with less runoff while improving urban storm water management practices and reducing flood risk. Sub catchments equipped with infiltration trenches showed the highest infiltration losses, validating their potential in areas with available space along dividers and open corridors. Permeable pavements were effective in zones with connected footpath networks, while green roofs contributed minimally due to space constraints and rooftop conditions. The simulation findings verified that appropriate dimensions and the percentage of BGI covering are essential for attaining significant runoff reduction.
All BGI types were simulated as implemented within the drainage system (i.e. real-world approach), and resulted in reductions for total runoff volume, number of flooded nodes, and peak discharge for key outfalls with BGI strategies. Some nodes continued to flood despite the installation of Blue-Green Infrastructure (BGI) in certain sub-catchments for a variety of reasons. The main causes include hydraulic constraints such as undersized pipes or junctions, the restricted spatial coverage of BGI, and the presence of untreated upstream areas that continue to contribute large runoff volumes. Additionally, particularly in areas with shallow groundwater heavy rainfall events may surpass the BGI features capability for penetration or storage. These circumstances underscore the necessity of more extensive and well-located BGI in addition to the required improvements to the current drainage system. Due to the shallow groundwater levels across the study area at about 2 Meter below ground level, BGI and infiltration-based practices (in particular, infiltration trenches or permeable pavements) can help support local groundwater recharge. Because the distance to the water table is minimal, infiltrated storm water will have a greater potential to be a source of aquifer replenishment (particularly coinciding with monsoon). However, the subsurface conditions need to be appropriately managed to design the BGI properly. Shallow groundwater may result in groundwater mounding or prolonged saturation of the soil profile.
Conclusion
This study contributes to the field of urban storm water management by showcasing the applicability of Blue-Green Infrastructure strategies in a high-density urban context with hydrologic-hydraulic modelling and spatial analysis techniques. This study develops an approach to establish a methodology that blends QGIS-based spatial analysis with EPA-SWMM modelling to learn about runoff patterns, flooding hotspots, and the effects of the potential introduction of LID-based BGI options like permeable pavement, infiltration trenches, and green roofs into the existing municipal storm water management system. The concurrent use of QGIS and SWMM was an effective approach for the catchment scale planning approach and evaluating the performance of the storm water management system, providing a replicable and scalable approach to enhancing urban storm water management. Unlike a lot of the existing literature that either focuses on either the macro-scale planning or international case studies, this study provides near empirical, ward-scale, insight into how BGI interventions could improve draining resiliency in Indian cities such as Mumbai. In addition, this study contributes a ward-level, data-driven framework tailored to the context of Mumbai’s high-density urban fabric. By applying GIS-based spatial analysis, detailed land-use classification, and EPA-SWMM hydrologic-hydraulic modelling, the research enables the identification of flood-prone nodes and critical sub catchments within Wards F/N and G/N. It demonstrates how targeted integration of LID-based BGI measures such as permeable pavements along pedestrian corridors, infiltration trenches within road dividers, and green roofs on select public buildings—can significantly reduce surface runoff and peak flow rates. This localized approach builds upon knowledge of BGI feasibility for urban built-up Indian areas that traditionally have flat roofs often occupied by solar infrastructure and areas where open space is limited. By simulating realistic rainfall scenarios (25-year return period), and examining runoff responses before and after BGI implementation, the approach creates a model that can assist decision-makers determine retrofitting strategies that are technically feasible and spatially appropriate given existing limitations.
As outlined in the introductory sections of this article, between 1988 and 2018, Mumbai underwent rapid urbanization characterized by dense construction, loss of open spaces, and major land use change. The city lost 45.2% of its green cover, declining from 46.7% in 1988 to 26.67% in 2018 [12]. The largest drop, over 22.6%, occurred after 2000, accompanied by a three-fold rise in local land surface temperatures. According to MCGM, impermeable surfaces such as asphalt and concrete have significantly increased, raising the run-off coefficient from about 0.5 to nearly 1.0, indicating near-total surface impermeability. Catchment areas contributing to drainage have risen from 20% to as high as 70 – 90%, leading to heightened flood run-off during monsoon rains. Urban flooding has thus become an annual occurrence, worsened by historical land reclamation, low-lying topography, and climate change impacts like altered rainfall patterns and sea level rise.
Mumbai’s increasing flood risk and high-rainfall underscores the urgency of enhancing stormwater drainage capacities, improving desilting operations, preventing solid waste clogging, expanding pumping stations, stormwater tunnels and integrating BGI measures across all 24 wards. Conservation and restoration of mangroves and other natural buffers remain vital ecological priorities within the city’s flood management landscape. Managing urbanization through density control, augmenting permeable surfaces, and introducing hybrid grey-green systems are essential towards holistic approaches.
Ultimately, an effective flood management strategy for Mumbai must integrate robust grey stormwater infrastructure with comprehensive BGI systems, enabling synergistic environmental protection and urban sustainability. This hybrid approach would not only improve hydraulic performance but also enhance urban liveability by reintroducing ecological networks, reducing heat island effects, and reconnecting the city with its natural hydrological cycles. Thus, this pilot study and its methodology then can be replicated towards other such formal neighbourhoods in the city where immediately a data-driven and evidence-based approach can initiate grey-green stormwater management to address complete flood reduction, urban heat challenges and social or mental well-being of citizens by increasing greenery in the city.
The feasibility and cost-effectiveness of nature-based flood mitigation measures in Mumbai require a critical ward-by-ward and catchment-level analysis due to the city’s complex biophysical and socio-spatial conditions. Given the heterogeneity of soil profiles, groundwater levels, and land uses across wards, boundary conditions vary significantly and consequently alter both opportunities and constraints for implementing Blue-Green Infrastructure (BGI) interventions. From a cost perspective, wide-scale deployment of permeable pavements entails significant financial investment and maintenance, requiring comparative evaluation with other grey and green options. While detention and retention ponds, coupled with permeable pavements, are found to be conceptually effective for flood regulation, their land and cost requirements pose challenges within the Mumbai context. Similarly, the feasibility of stormwater tunnel infrastructure must be assessed considering the city's simultaneous high-tide and heavy rainfall occurrences, questioning the operability of tunnels during critical events.
Planning and Policy Recommendations, Limitations of the Study and Future Research Work
Our research and study highlight the significance of successful integration of BGI into local municipal level planning based on modelling approaches in a highly urbanized and metropolitan Indian city such as Mumbai. The SWMM and QGIS based combination modelling approach can serve as a mechanism to develop data driven, realistic simulations for citywide BGI systems by linking the city’s hydrology and urban landscape dynamics with real municipal and field-level data across various variables as utilized in this study to obtain realistic results on the placement, functionality and effectiveness of proposed BGI interventions to tailor their actual design, planning and implementation within neighbourhoods and sites in the city.
Our methodology and workflow layering GIS spatial datasets along with SWMM model outputs supports a transparent, scalable planning framework for municipal level officers, urban planners and urban designers which can be applied across Mumbai’s diverse urban wards. The results of our empirical method’s application for the wards F/N and G/N can be used as best practice pilot studies demonstrating the drainage, run-off, and flood mitigation benefits of permeable pavements, infiltration trenches and, green roofs. This can be scaled towards other wards within Mumbai strongly highlighting opportunities for future research. This methodology has equal potential to be applied for other Indian cities by incorporating similar and relevant data along with appropriate contextual considerations. The research and planning concept, method and empirical research approach formulated by the authors of this article serves as a robust and highly evidence-based approach to attain sound knowledge of BGI opportunities for cities across India.
The BRISMSTOWAD I & II reports have served as the official stormwater drain plan and system for the 24 wards of Mumbai which are undergoing further upgradation with provisions for holding tanks, stormwater tunnels and increased capacities of stormwater drains as conveyed to the first author of this article by the additional municipal commissioner of the MCGM in a separate informal interview undertaken. Owing to these improvements and upgradations, provision for BGI in the BRIMSTOWAD plans must be made a mandatory aspect of the city-wide stormwater management regime of Mumbai. At the state-level political leadership and decision-making, a grey-green stormwater management approach must be adopted to accelerate city wide policies, plans and implementation regulations. Empirical research results from modelling approaches can serve as the basis to develop municipal guidelines for BGI design and planning alongside grey stormwater management. Mumbai’s Development Plan (DP) 2030 consists of a brief reference to augment BGI across all wards of Mumbai. The approach undertaken in this study must lead to concrete incorporation of rules, laws and regulations for BGI implementation within the DP 2030 utilizing informed decision making based on modelling and realistic simulations. Further QGIS plugins can enable seamless import and export of SWMM input and output files enabling direct links between modelling analysis and, management and maintenance of city records. Such plug-ins can support the MCGMs stormwater drains department to monitor system upgrades, evaluate pre-post interventions of hydraulic responses and communicate such results to policymakers and the public. Additionally, an important aspect in our study has been to utilize the 25-year rainfall scenario by identifying critical flood-prone nodes and sub-catchments. This can serve as a technical basis for upgrading local building codes, upgrade local level stormwater management priorities and also address budgeting for BGI infrastructure for the public works policies of the MCGM such as in areas with limited open spaces or rooftops with solar panels. Finally, scientists such as the authors of this article can use the modelling results to formulate workshops and capacity building programs to disseminate the right knowledge and provide the accurate technical assistance to local government such as that of the MCGMs stormwater engineers and senior officials so that a technically sound grey-green stormwater regime can successfully be introduced, integrated and implemented in Mumbai’s urban planning practice.
Lastly, this research encountered significant data gaps resulting in model uncertainties such as spatial data constraints. Incomplete and outdated drainage network maps such as missing inlets, nullahs, manholes and culverts compromising accurate model development. In terms of land use classifications, impervious surface fractions derived from satellite imagery may not perfectly reflect ground reality such as rooftop gardens, informal pavements and such. Additionally, tidal and boundary conditions such as SWMM outfall models may not fully capture dynamic tidal backflow and sea-level variations influencing Mumbai’s coastal drains. Also, limited calibration and validation data due to unavailability of measured discharge at the outfall does not allow for the calibration of the model. Further, in terms of the BGI evaluation, infiltration and storage capacities of BGI measures are assumed ideal and do not account for long-term clogging, maintenance neglect or sediment accumulation. Given this, the development, collection and storage of accurate stormwater data along with that of related variables is necessary. Therefore, development of spatially explicit data in Indian cities such as Mumbai and likewise other cities must be given high priority.
In conclusion, this study is based on investigating SWMM-QGIS based modelling to ascertain the design and planning potential of BGI in the F/N and G/N wards of Mumbai in India- By integrating such ward-scale, data driven analysis into municipal systems, this study provides a robust, climate-resilient planning approach to enhance the resilience of stormwater drainage systems and encouraging evidence-based investments in BGI for sustainable urban planning for the city of Mumbai in India.
Supplementary Materials
The following supporting information can be downloaded at the website of this paper posted on Preprints.org.
Funding
The lead author gratefully acknowledges the Maria Reiche Doctoral Fellowship of the TUD Dresden University of Technology, funded by the Federal Ministry of Research, Technology and Space (BMFTR) and the Free State of Saxony as part of the Excellence Strategy of the Federal and State Government, for the financial support that resulted in the production of this publication as part of her doctoral project.
Data Availability Statement
We thank the Municipal Corporation of Greater Mumbai; its commissioners and chief engineers of the Stormwater Drain Department and Disaster Cell to provide municipal data such as the BRIMSTOWAD-II report and its supplementary data along with rainfall data from the Indian Meteorological Department.
Acknowledgments
We acknowledge the contribution of Robin Singh in undertaking certain mathematical and technical aspects of the paper. .
Conflicts of Interest
Declare conflicts of interest or state “The authors declare no conflicts of interest.” “The funders had no role in the design of the study; in the collection, analyses, or interpretation of data; in the writing of the manuscript; or in the decision to publish the results”.
References
- Rai, S.; Kookana, P. D. Urbanisation and emerging economies: Issues and potential solutions for water and food security. In Science of the Total Environment; 2020. [Google Scholar] [CrossRef]
- News, U. N. United Nations Department of Economic and Social Affairs. Available online: https://www.un.org/development/desa/en/news/population/2018-revision-of-world-urbanization-prospects.html.
- Dobbs, R.; Sankhe, S. Comparing urbanization in China and India; McKinsey & Company, 1 July 2010; Available online: https://www.mckinsey.com/featured-insights/urbanization/comparing-urbanization-in-china-and-india.
- Kelkar, V.; Helm, B.; Krebs, P. A semi-systematic global review to understand the key components essential for advancing the actual design, planning, and implementation of blue–green infrastructure in Indian cities. Land 2025, 14(11), 2287. [Google Scholar] [CrossRef]
- Kaur, R.; Gupta, K. Blue-green infrastructure (BGI) network in urban areas for sustainable storm water management: A geospatial approach. City and Environment Interactions 16 2022, 100087. [Google Scholar] [CrossRef]
- Tamar Almaaitah, M. A. The potential of blue-green infrastructure as a climate change adaptation strategy: A systematic literature review. In Blue-Green Systems; 4 December 2021. [Google Scholar] [CrossRef]
- Mhaske, A.; Rajani, M. B. Analysing topographical transformation of Bombay Islands and Bombay Fort using geospatial analysis and historical records. Proc. Indian Natl. Sci. Acad 88 2022, 345–356. [Google Scholar] [CrossRef]
- Chadchan, R. J. Analysis of urban growth trends in the post-economic reforms period in India. International Journal of Sustainable Built Environment 2012. [Google Scholar] [CrossRef]
- Zhang, Y. Building a slum-free Mumbai? State and informal urbanization in India [Conference paper]. Conference on the Political Economy of Contemporary India, Indira Gandhi Institute of Development Research, Mumbai; 2017. Available online: https://www.igidr.ac.in/indiapolecon/temp/Paperstobepresented/Yue%.
- Jha, M. K.; Chaskin, R. J.; Vyas, M. Slum resettlement, built environment, and socio-spatial dynamics: Lived experiences in Mumbai’s resettlement colonies. Journal of Urban Affairs 2025. [Google Scholar] [CrossRef]
- Goyal, A.; de Mesquita Lima, J. Finding space for water in informal settlements in Dharavi and Dili. Urbanisation 2024, 9(2), 167–185. [Google Scholar] [CrossRef]
- Shantaram, P.; Pushparaj, A.; Rajasekaran, A. Spatial analysis of green cover change in Mumbai City, India. Arboricultural Research and Education Academy (AREA) 2020, 15(4), 5–8. [Google Scholar]
- Municipal Corporation of Greater Mumbai. BRIMSTOWAD II master plan [Report]; MCGM, 2017. [Google Scholar]
- Municipal Corporation of Greater Mumbai. Greater Mumbai report on draft development plan 2034 [Report]. n.d. Available online: https://portal.mcgm.gov.in/irj/go/km/docs/documents/MCGM%20Department%20List/Chief%20Engineer%20(Development%20Plan)/Docs/Draft%20DP%202034/DATA%20RELATED%20TO%20DRAFT%20DP2034/5.%20Draft%20DP%20Report/DRAFT%20DP%20REPORT%20-%202034%20Final.pdf.
- Municipal Corporation of Greater Mumbai. Stormwater drain department [Report]. n.d. Available online: https://www.mcgm.gov.in/irj/go/km/docs/documents/Tenders/ETH/ETH_8000055743_221123.pdf.
- Liu, N.; Zhang, F. Urban green spaces and flood disaster management: Toward sustainable urban design. In Frontiers in Public Health; 11 April 2025. [Google Scholar] [CrossRef]
- Hamel, P.; Trinh, L. T. Blue–green infrastructure for flood and water quality management in Southeast Asia: Evidence and knowledge gaps. In Environmental Management; 2022. [Google Scholar] [CrossRef]
- Gangawar, D.; Bansal, A. Navigating urban floods: Spatio-temporal analysis of blue-green infrastructure and urban densification in Indian cities. In EGU General Assembly 2025; 2025. [Google Scholar] [CrossRef]
- BRIMSTOWAD-II Master Plan report for Catchment 410. In MWH India Pvt Ltd; 2017.
- BRIMSTOWAD-II Master Plan report for Catchment 506-507. In MWH India Pvt Ltd; 2017.
- Gizewski, M. Evaluating design rainstorm durations for urban flood control. In Earth; 2022. [Google Scholar] [CrossRef]
- Deshmukh, M. S. Conditions of slum population of major sub-urban wards of Mumbai in Maharashtra. Voice of Research 2013, 2(2). Available online: https://voiceofresearch.org/doc/sep-2013/sep-2013_9.pdf.
- Green, W. H.; Ampt, G. A. Studies on soil physics, I. The flow of air and water through soils. Journal of Agricultural Science 9 1911, 1–24. [Google Scholar]
- Singh, J.; Sekharan, S.; Karmakar, S.; Ghosh, S.; Zope, P. E.; Eldho, T. I. Spatio-temporal analysis of sub-hourly rainfall over Mumbai, India: Is statistical forecasting futile? Journal of Earth System Science 2017, 126(3), 38. [Google Scholar] [CrossRef]
- Horton, R. E. An approach toward physical interpretation of infiltration capacity. American Soil Science Society, Proceedings 5 1940, 399–417. [Google Scholar] [CrossRef]
- Mhaske, S. Y.; D., C. GIS–GPS based map of soil index properties for Mumbai. In Geo-Frontiers 2011: Advances in Geotechnical Engineering; 2012. [Google Scholar]
- Department of Water Resources; Ministry of Jal Shakti. Ground water year book of Maharashtra and Union Territory of Dadra and Nagar Haveli [Report]. In Ministry of Jal Shakti; 2019–2020. [Google Scholar]
- O’Hare, Greg; D., A. A review of slum housing policies in Mumbai. In Cities; 25 November 1998. [Google Scholar] [CrossRef]
Figure 1.
Conceptual Framework for this study.
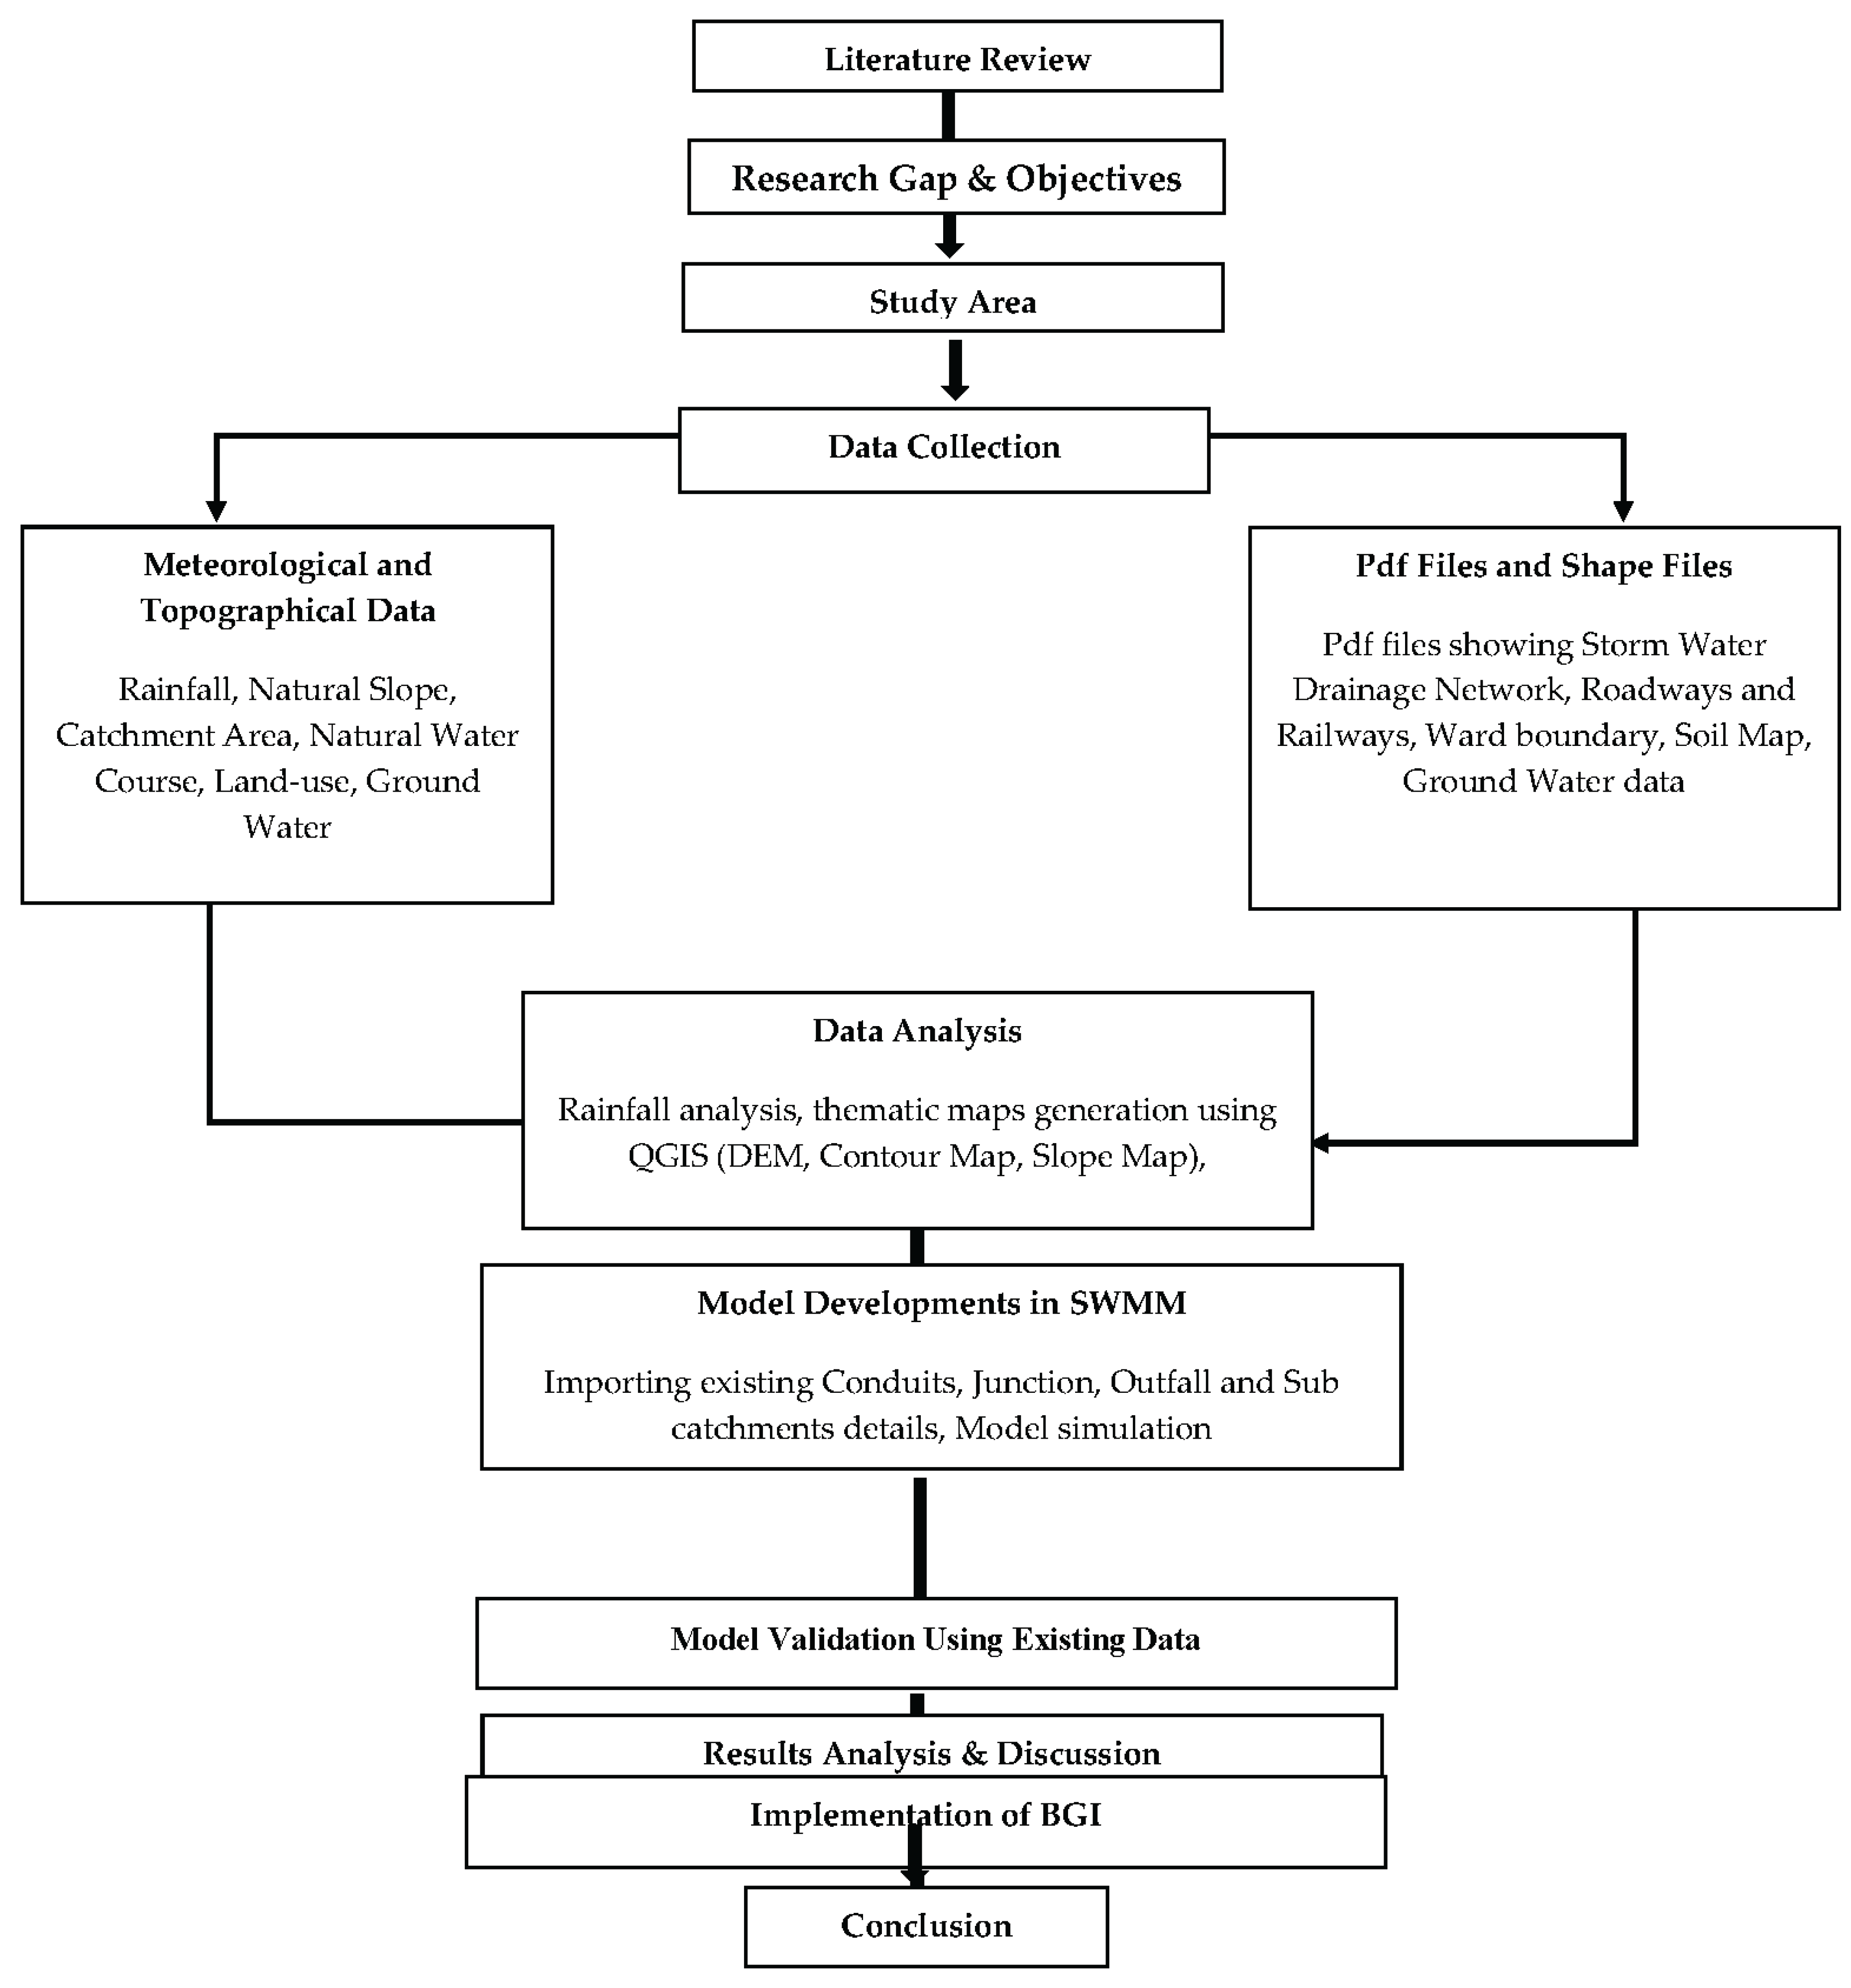
Figure 4.
Rainguage location within the wards of F-North and G-North.
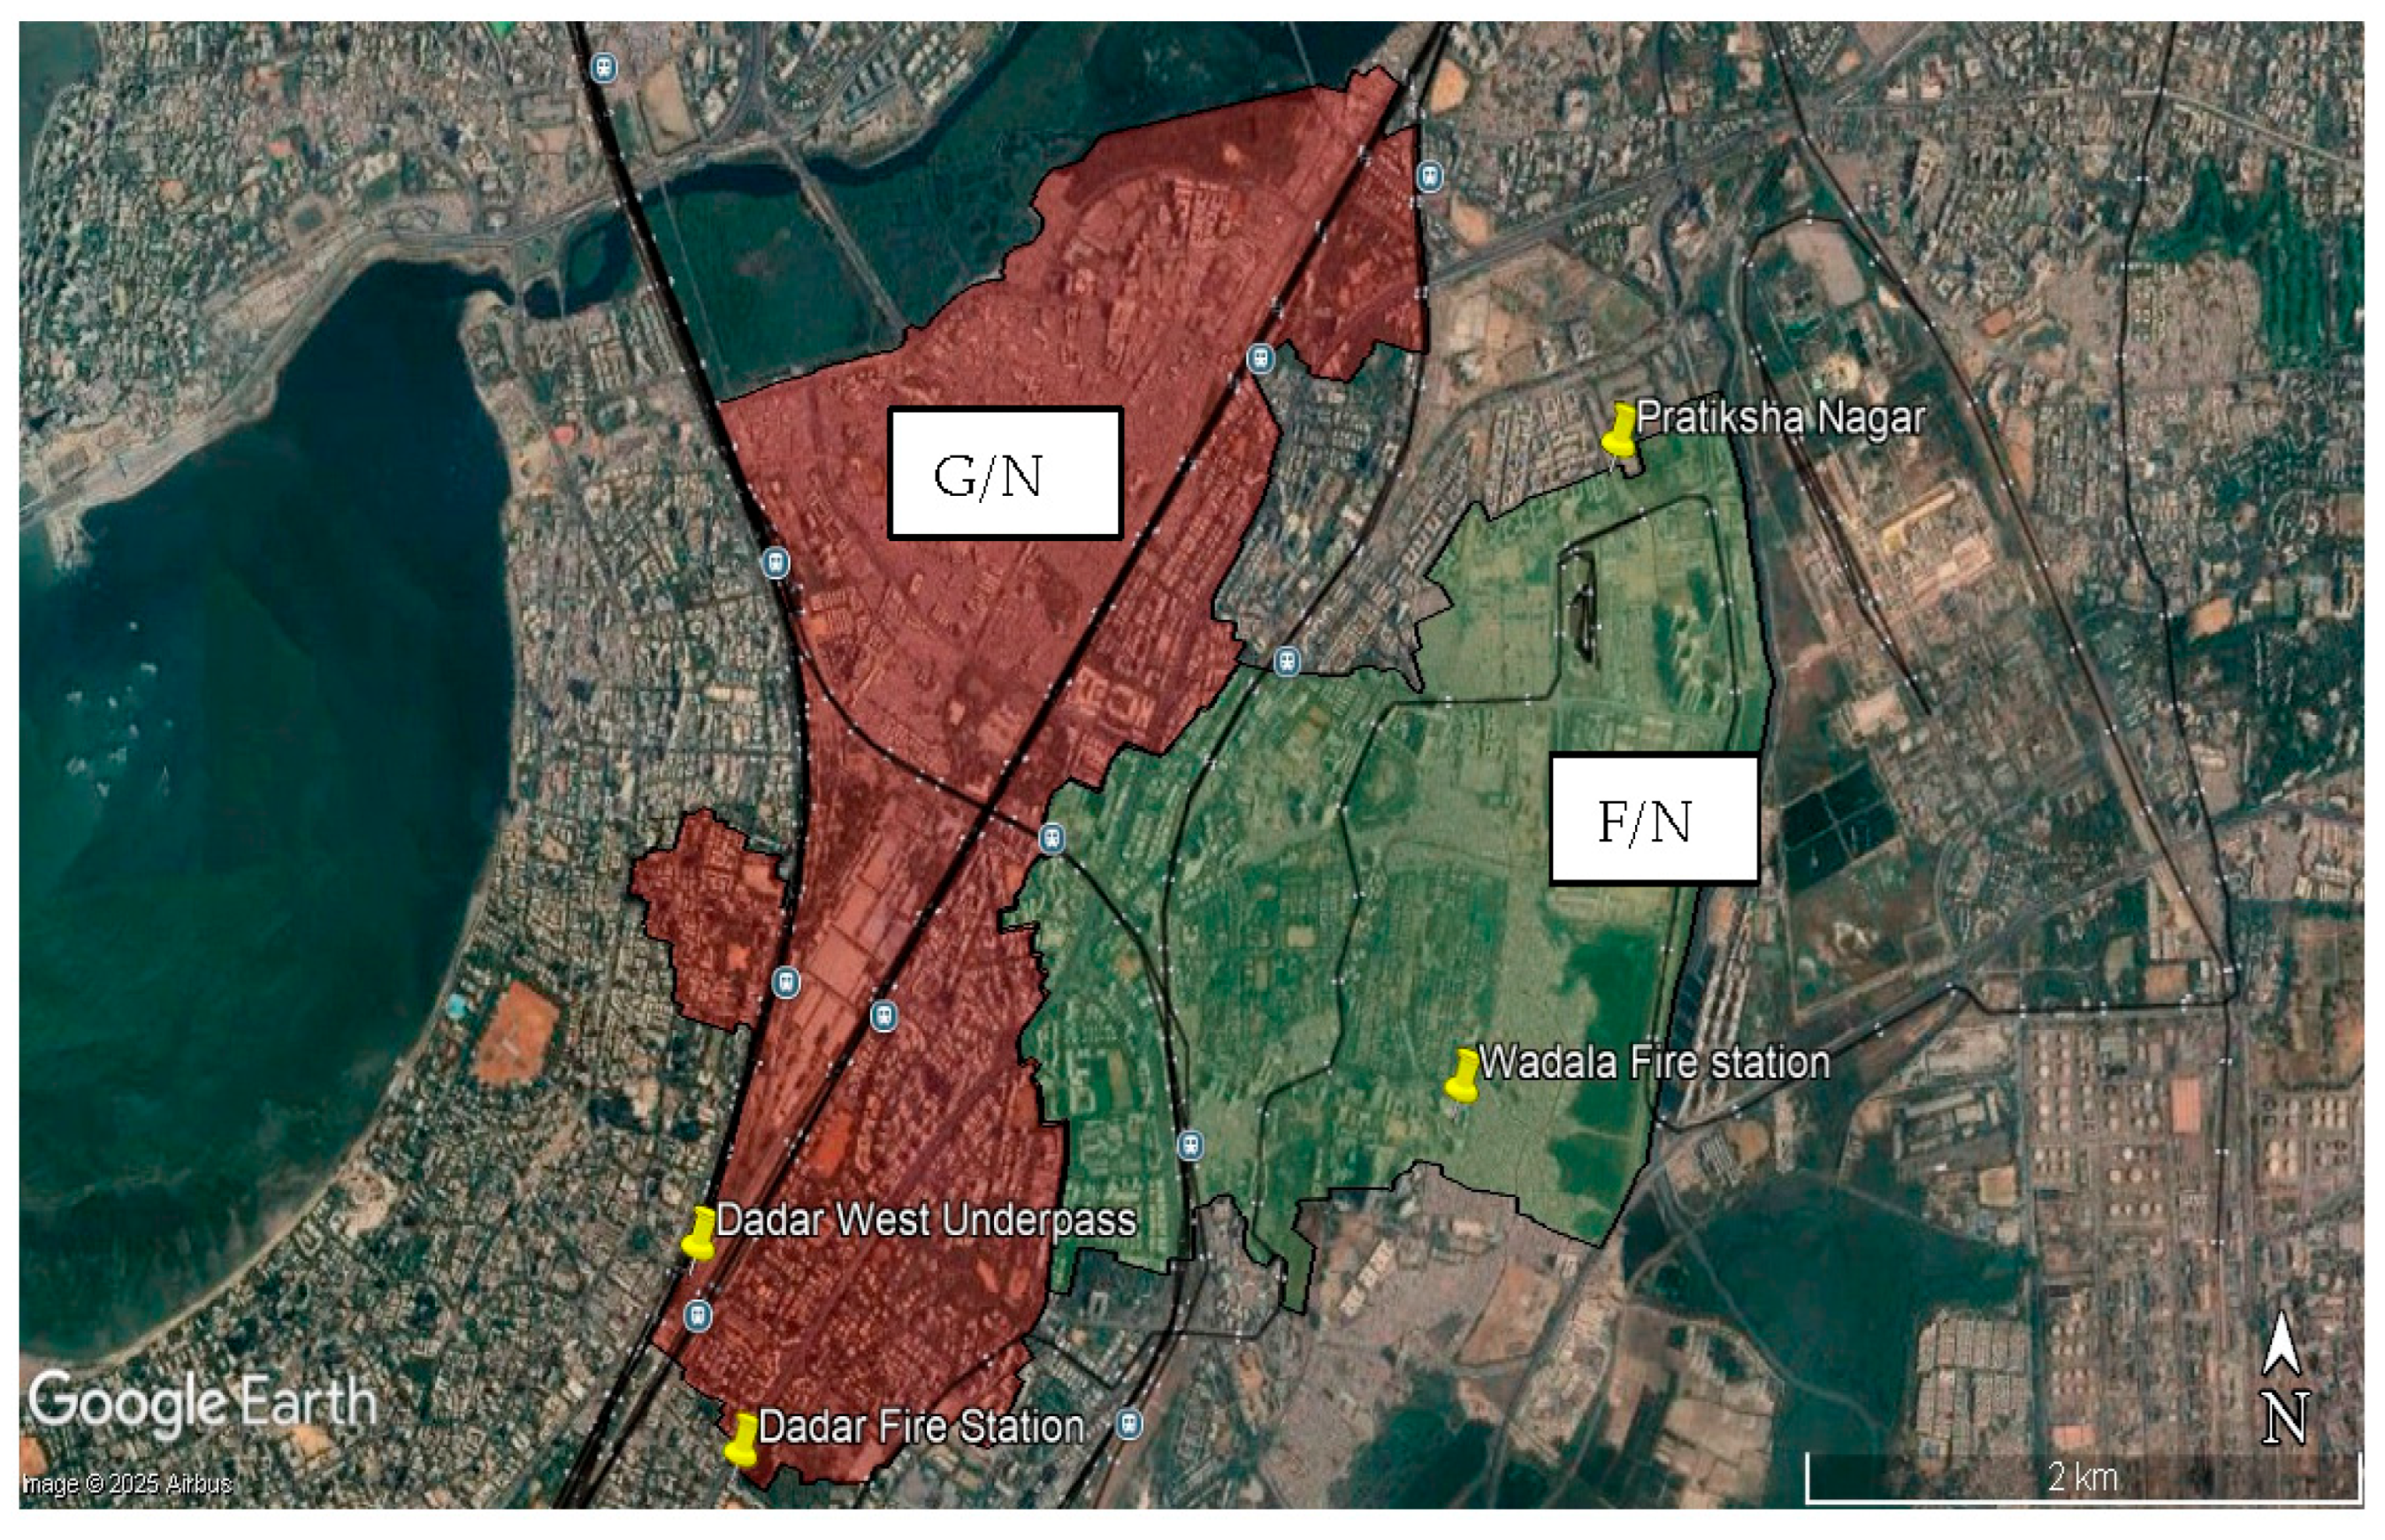
Figure 6.
Existing Storm Water Network in Ward G/N and F/N.
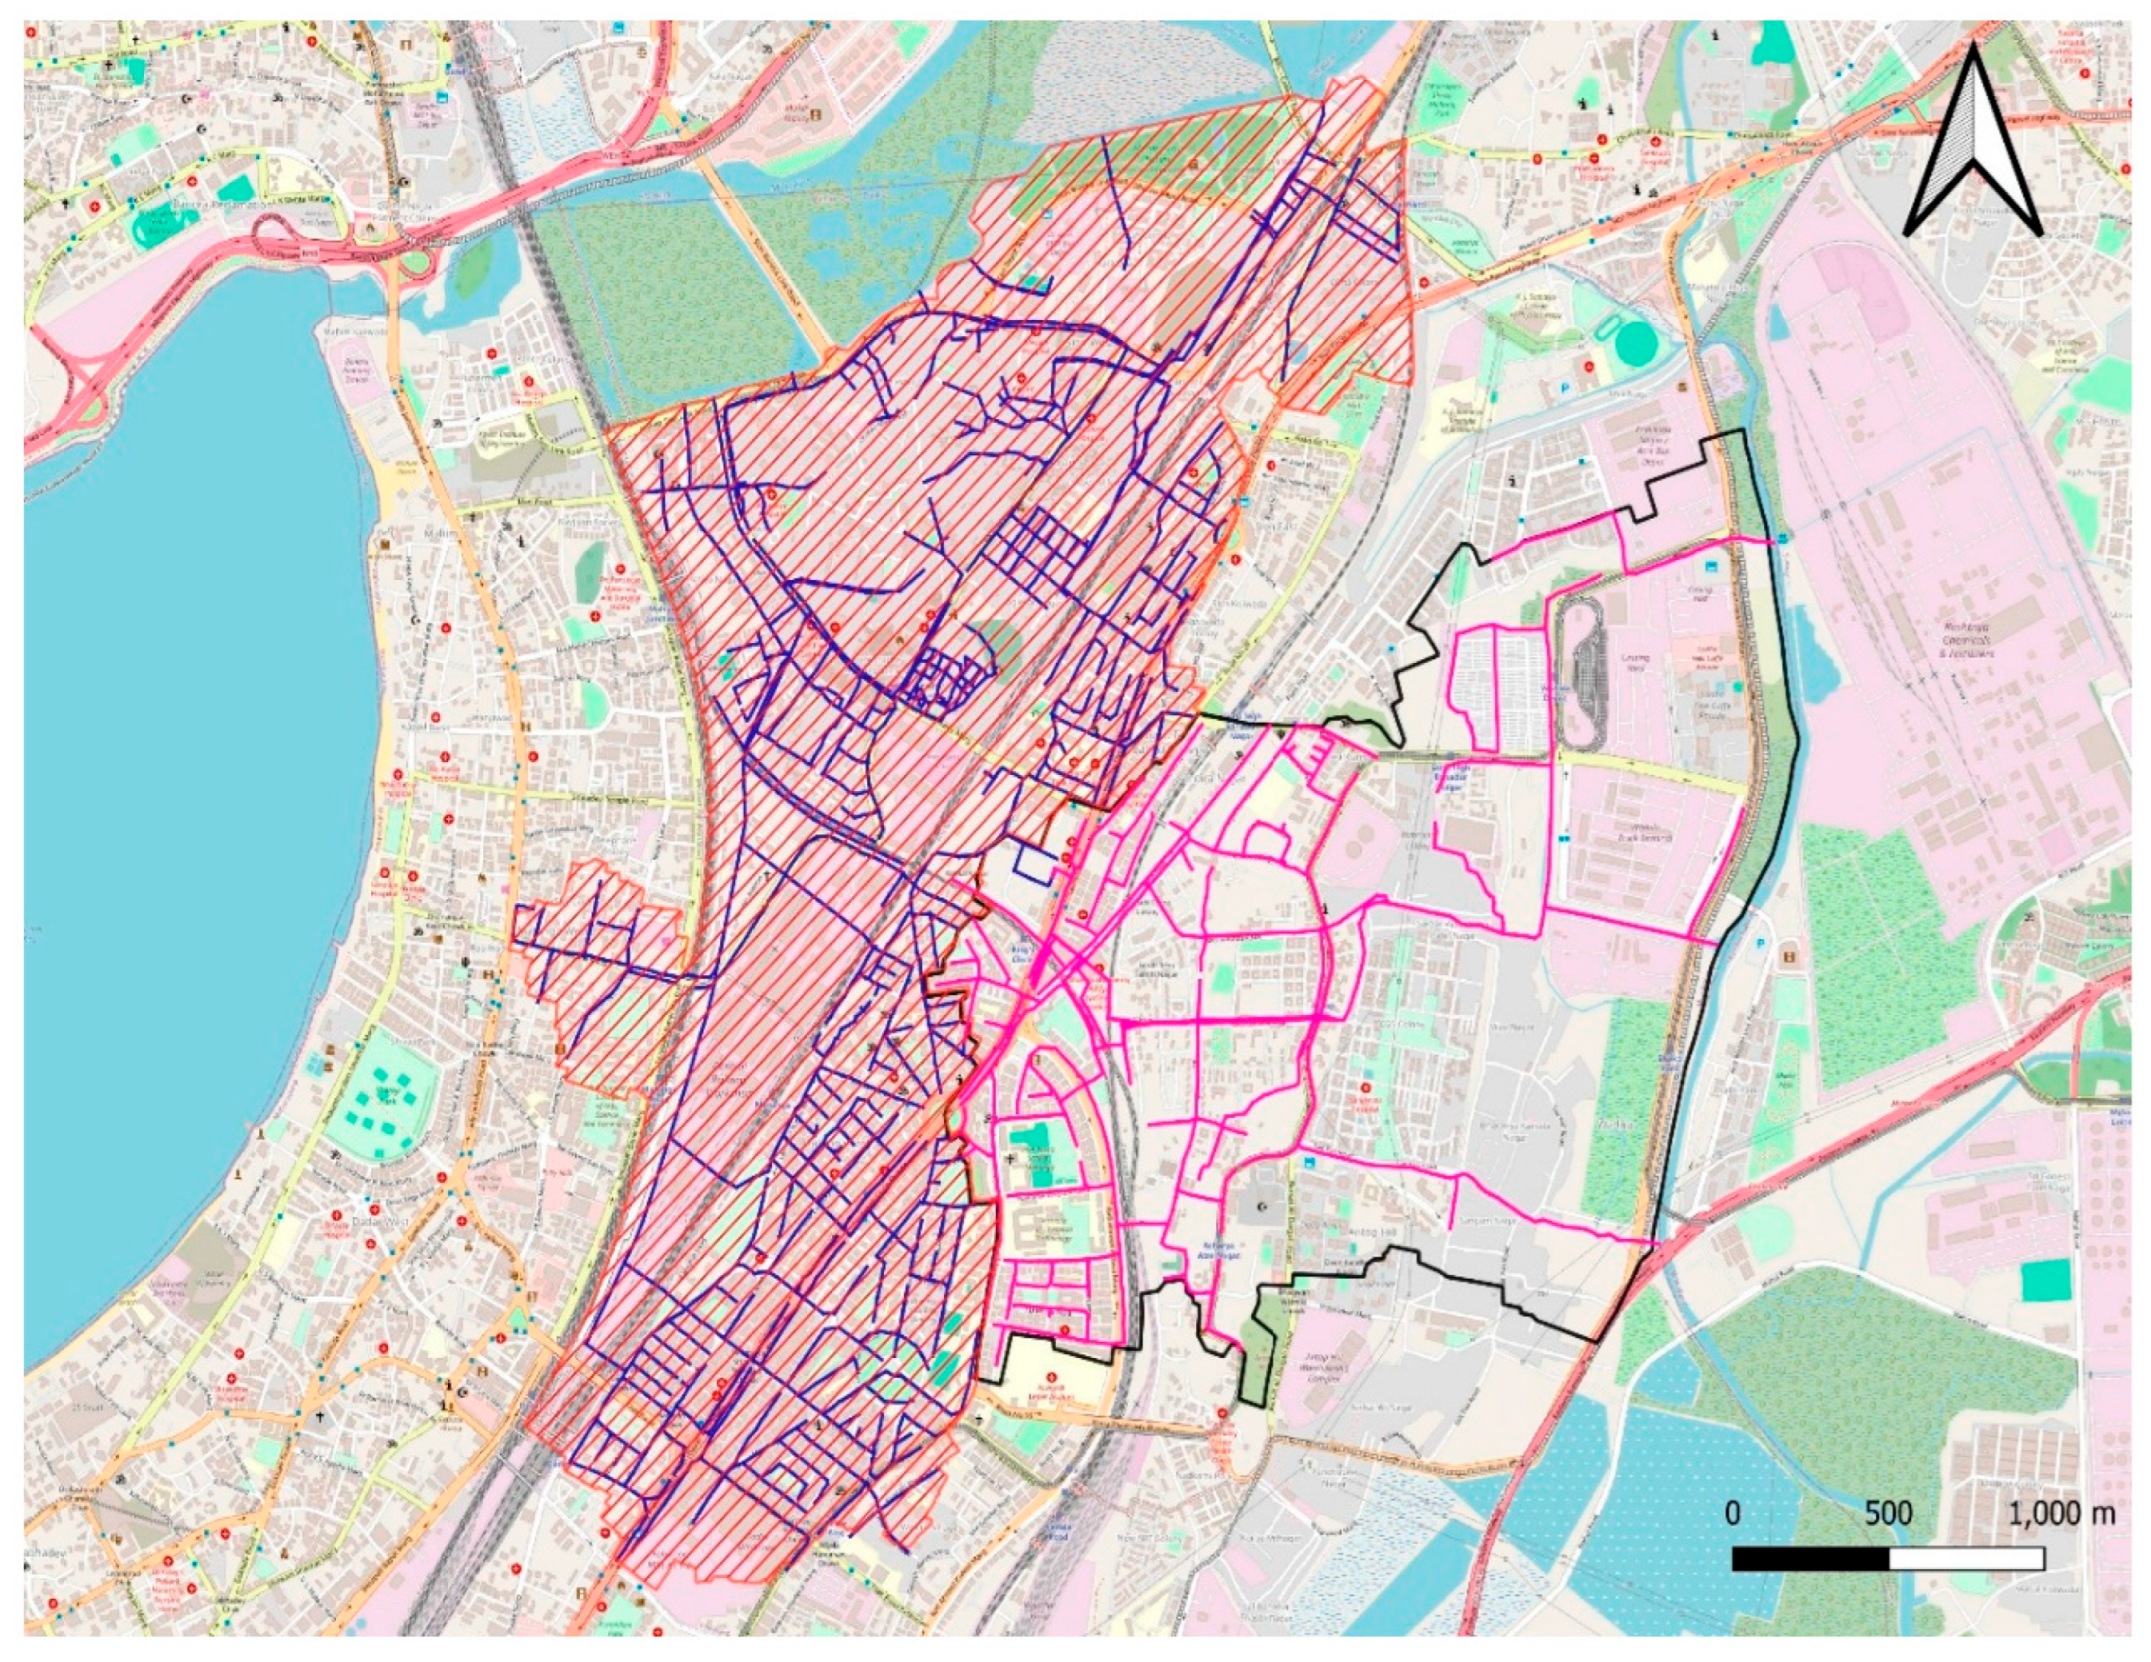
Figure 7.
SWMM Sub catchment properties editor window.
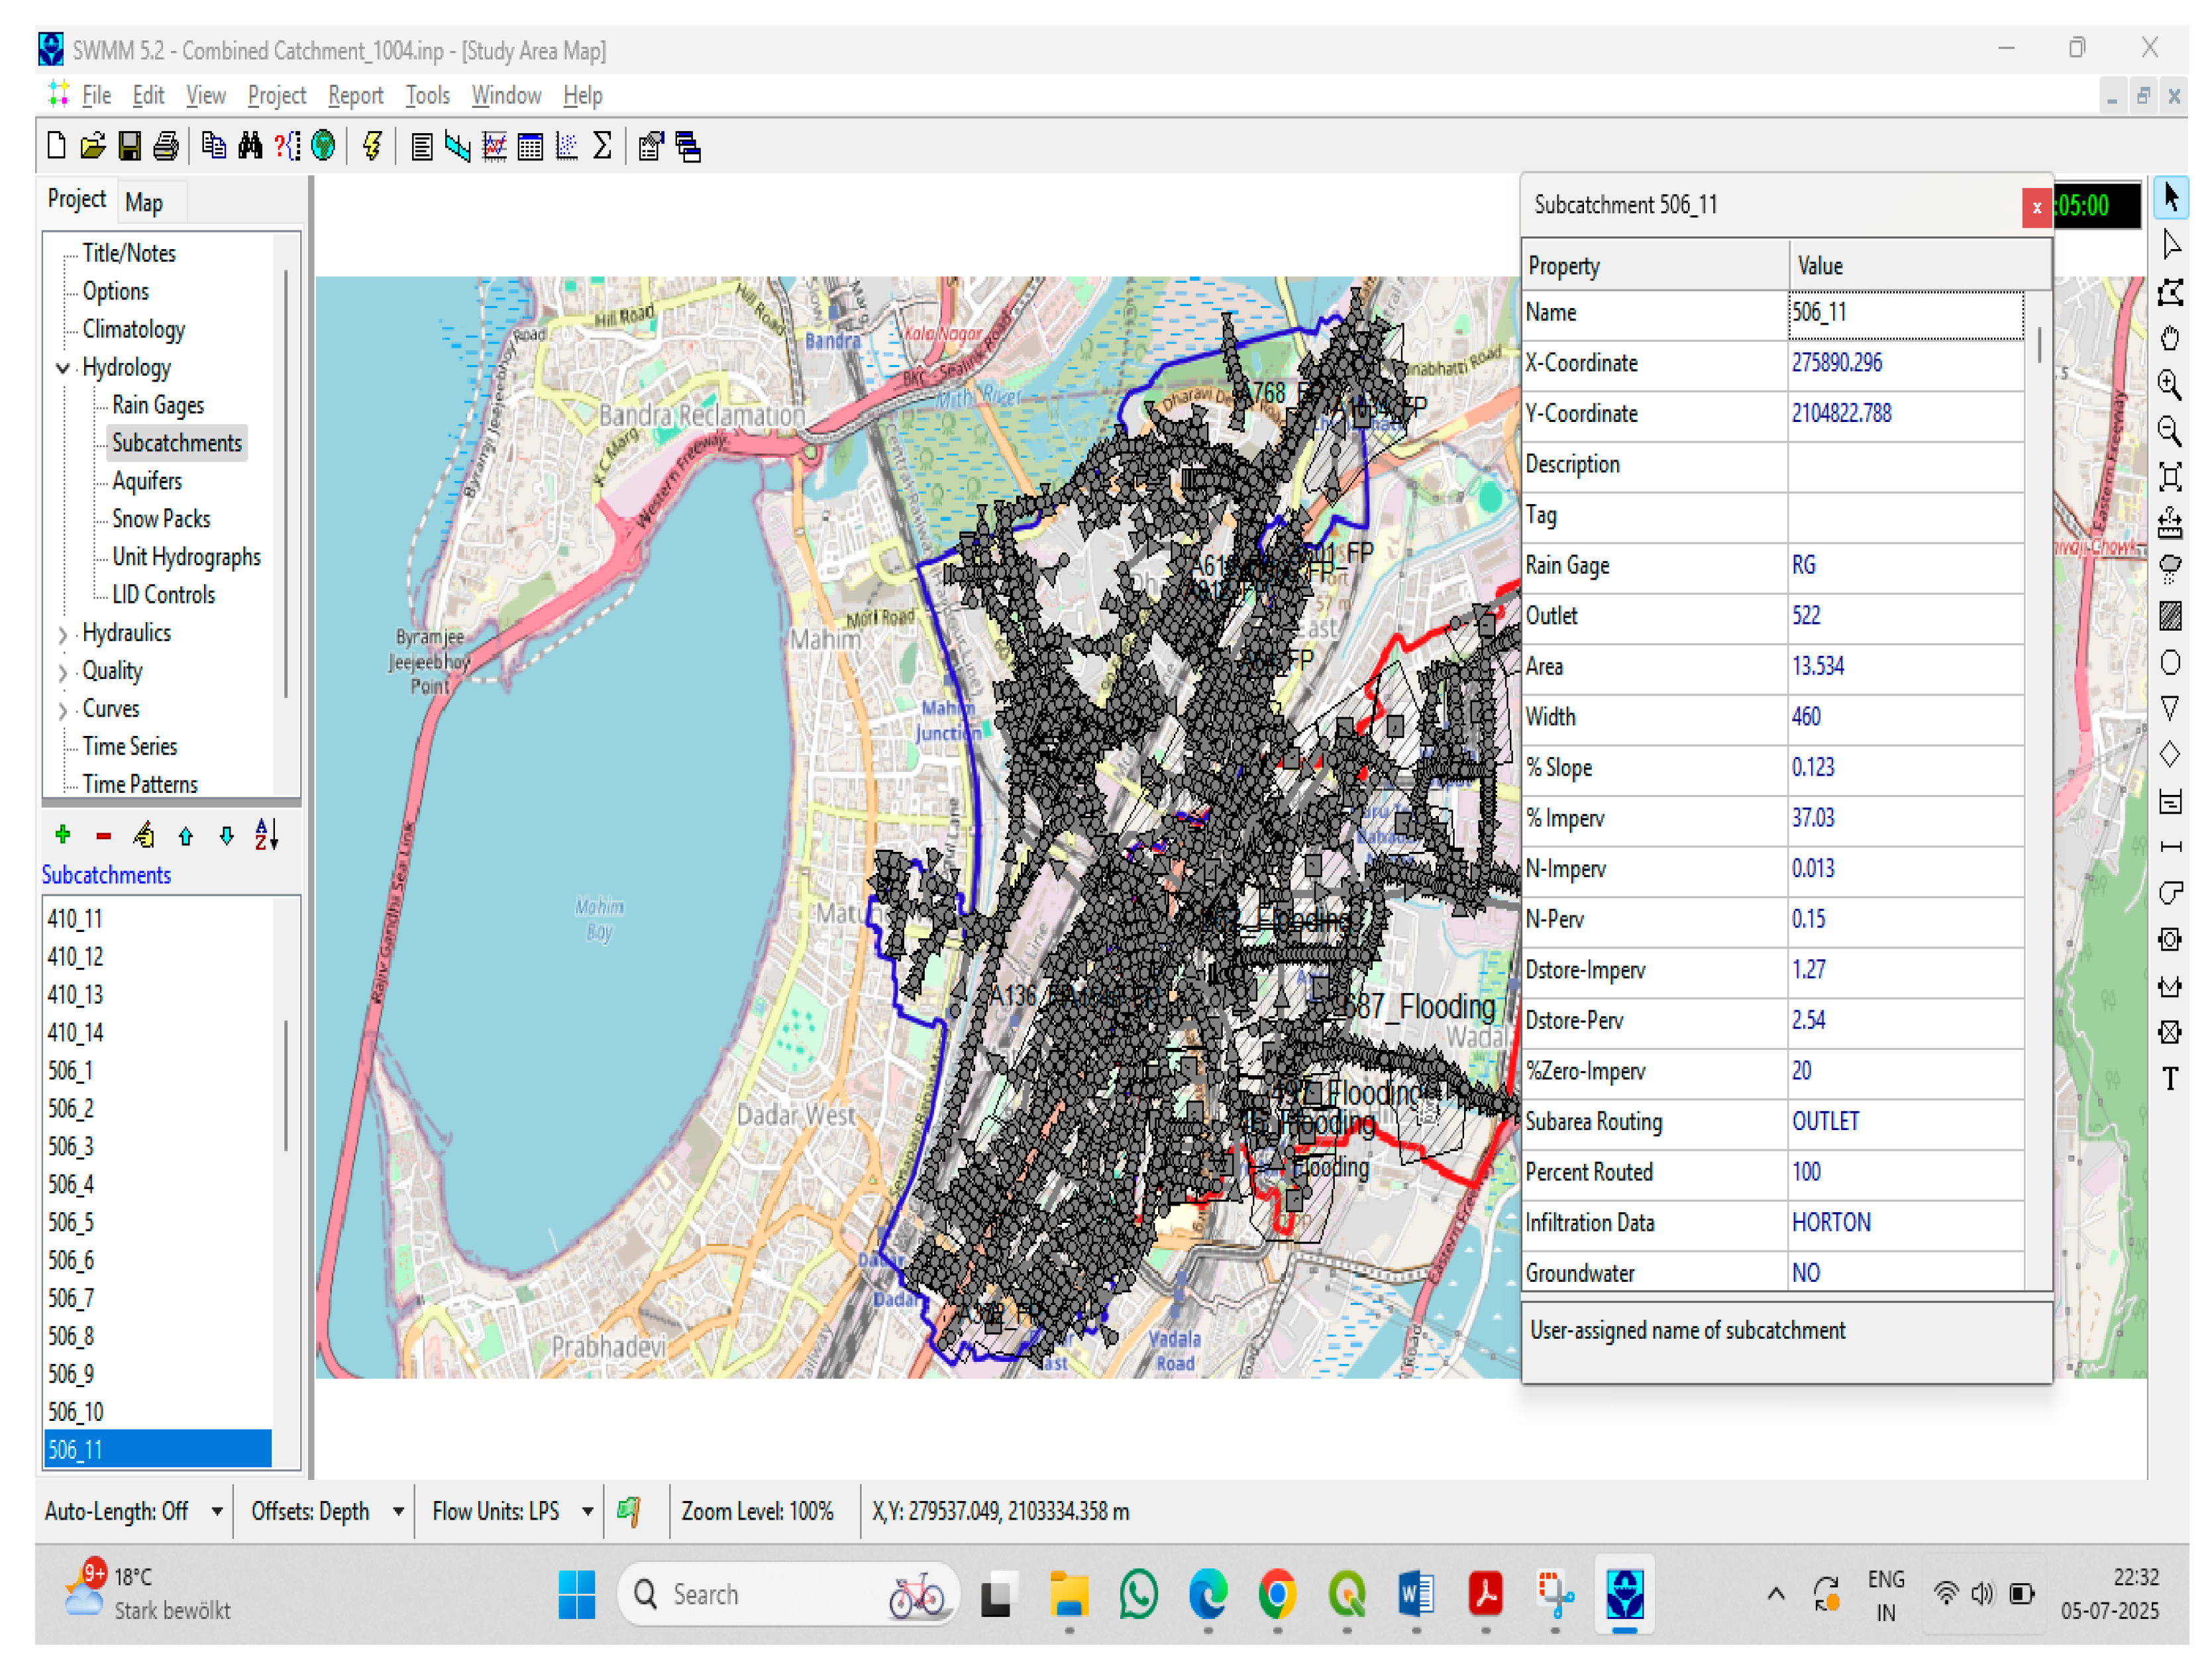
Figure 14.
Location of recorded Flooding hotspot.
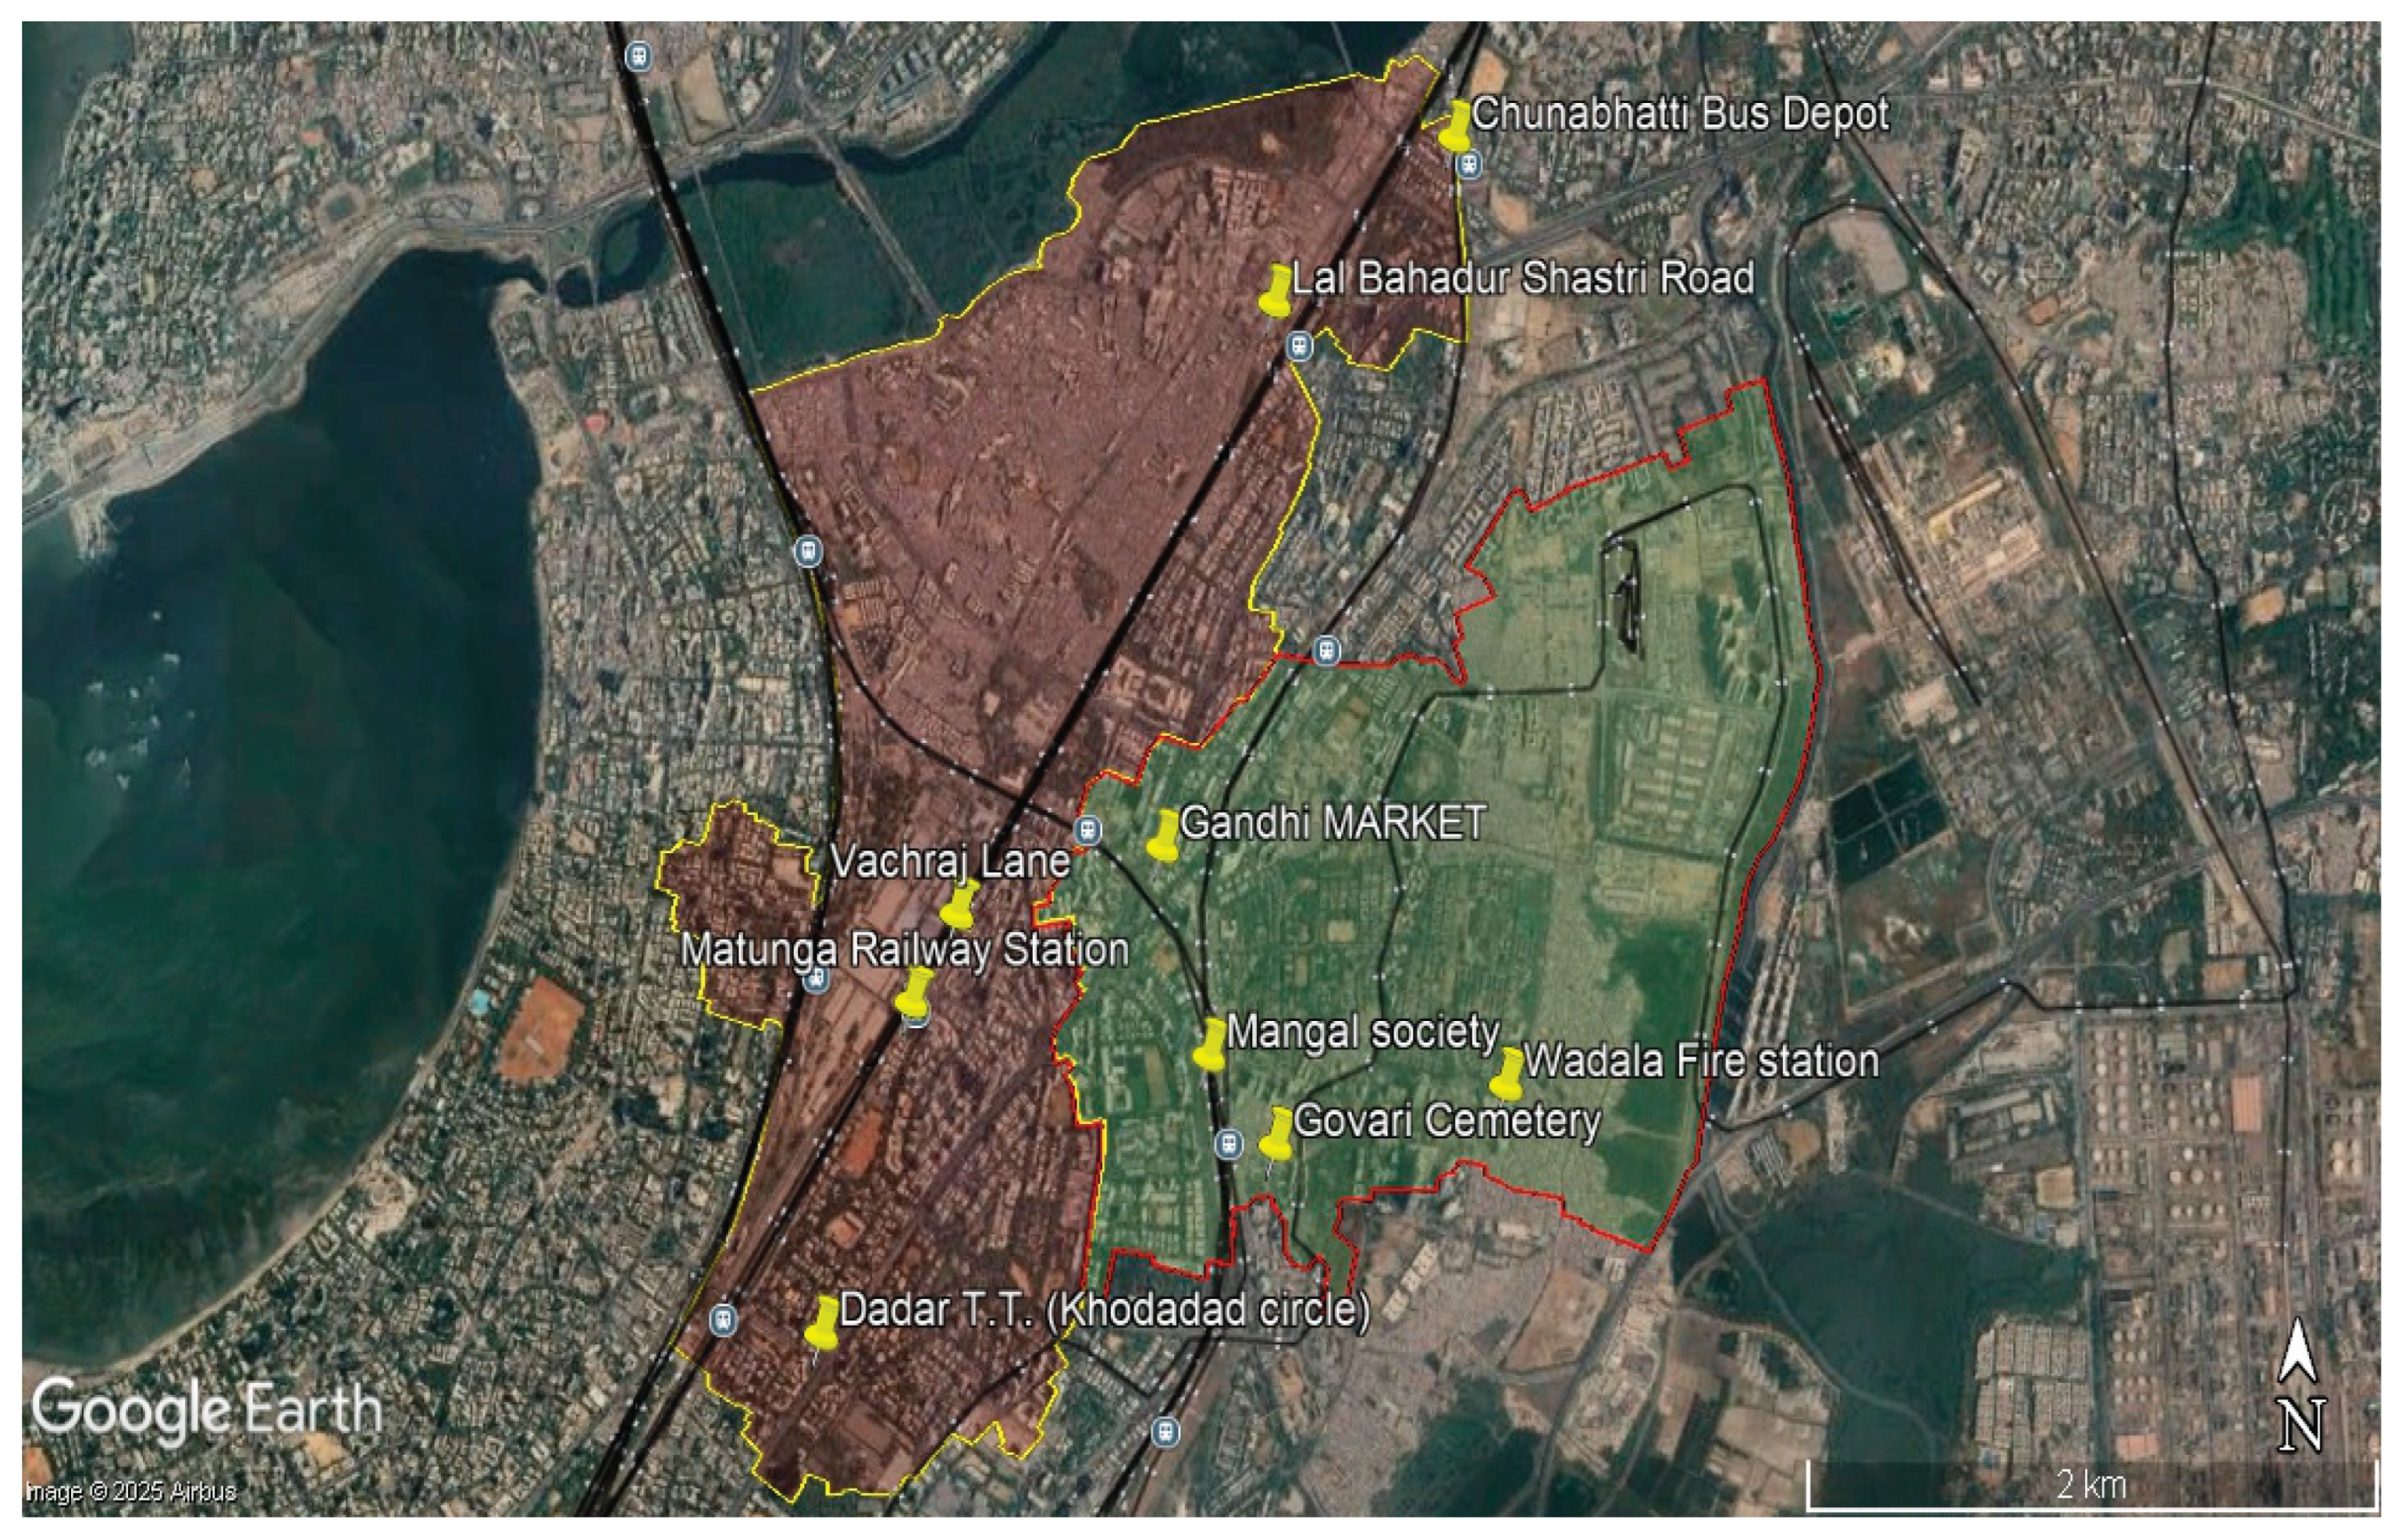
Figure 20.
Sub catchment ID as per SWMM.
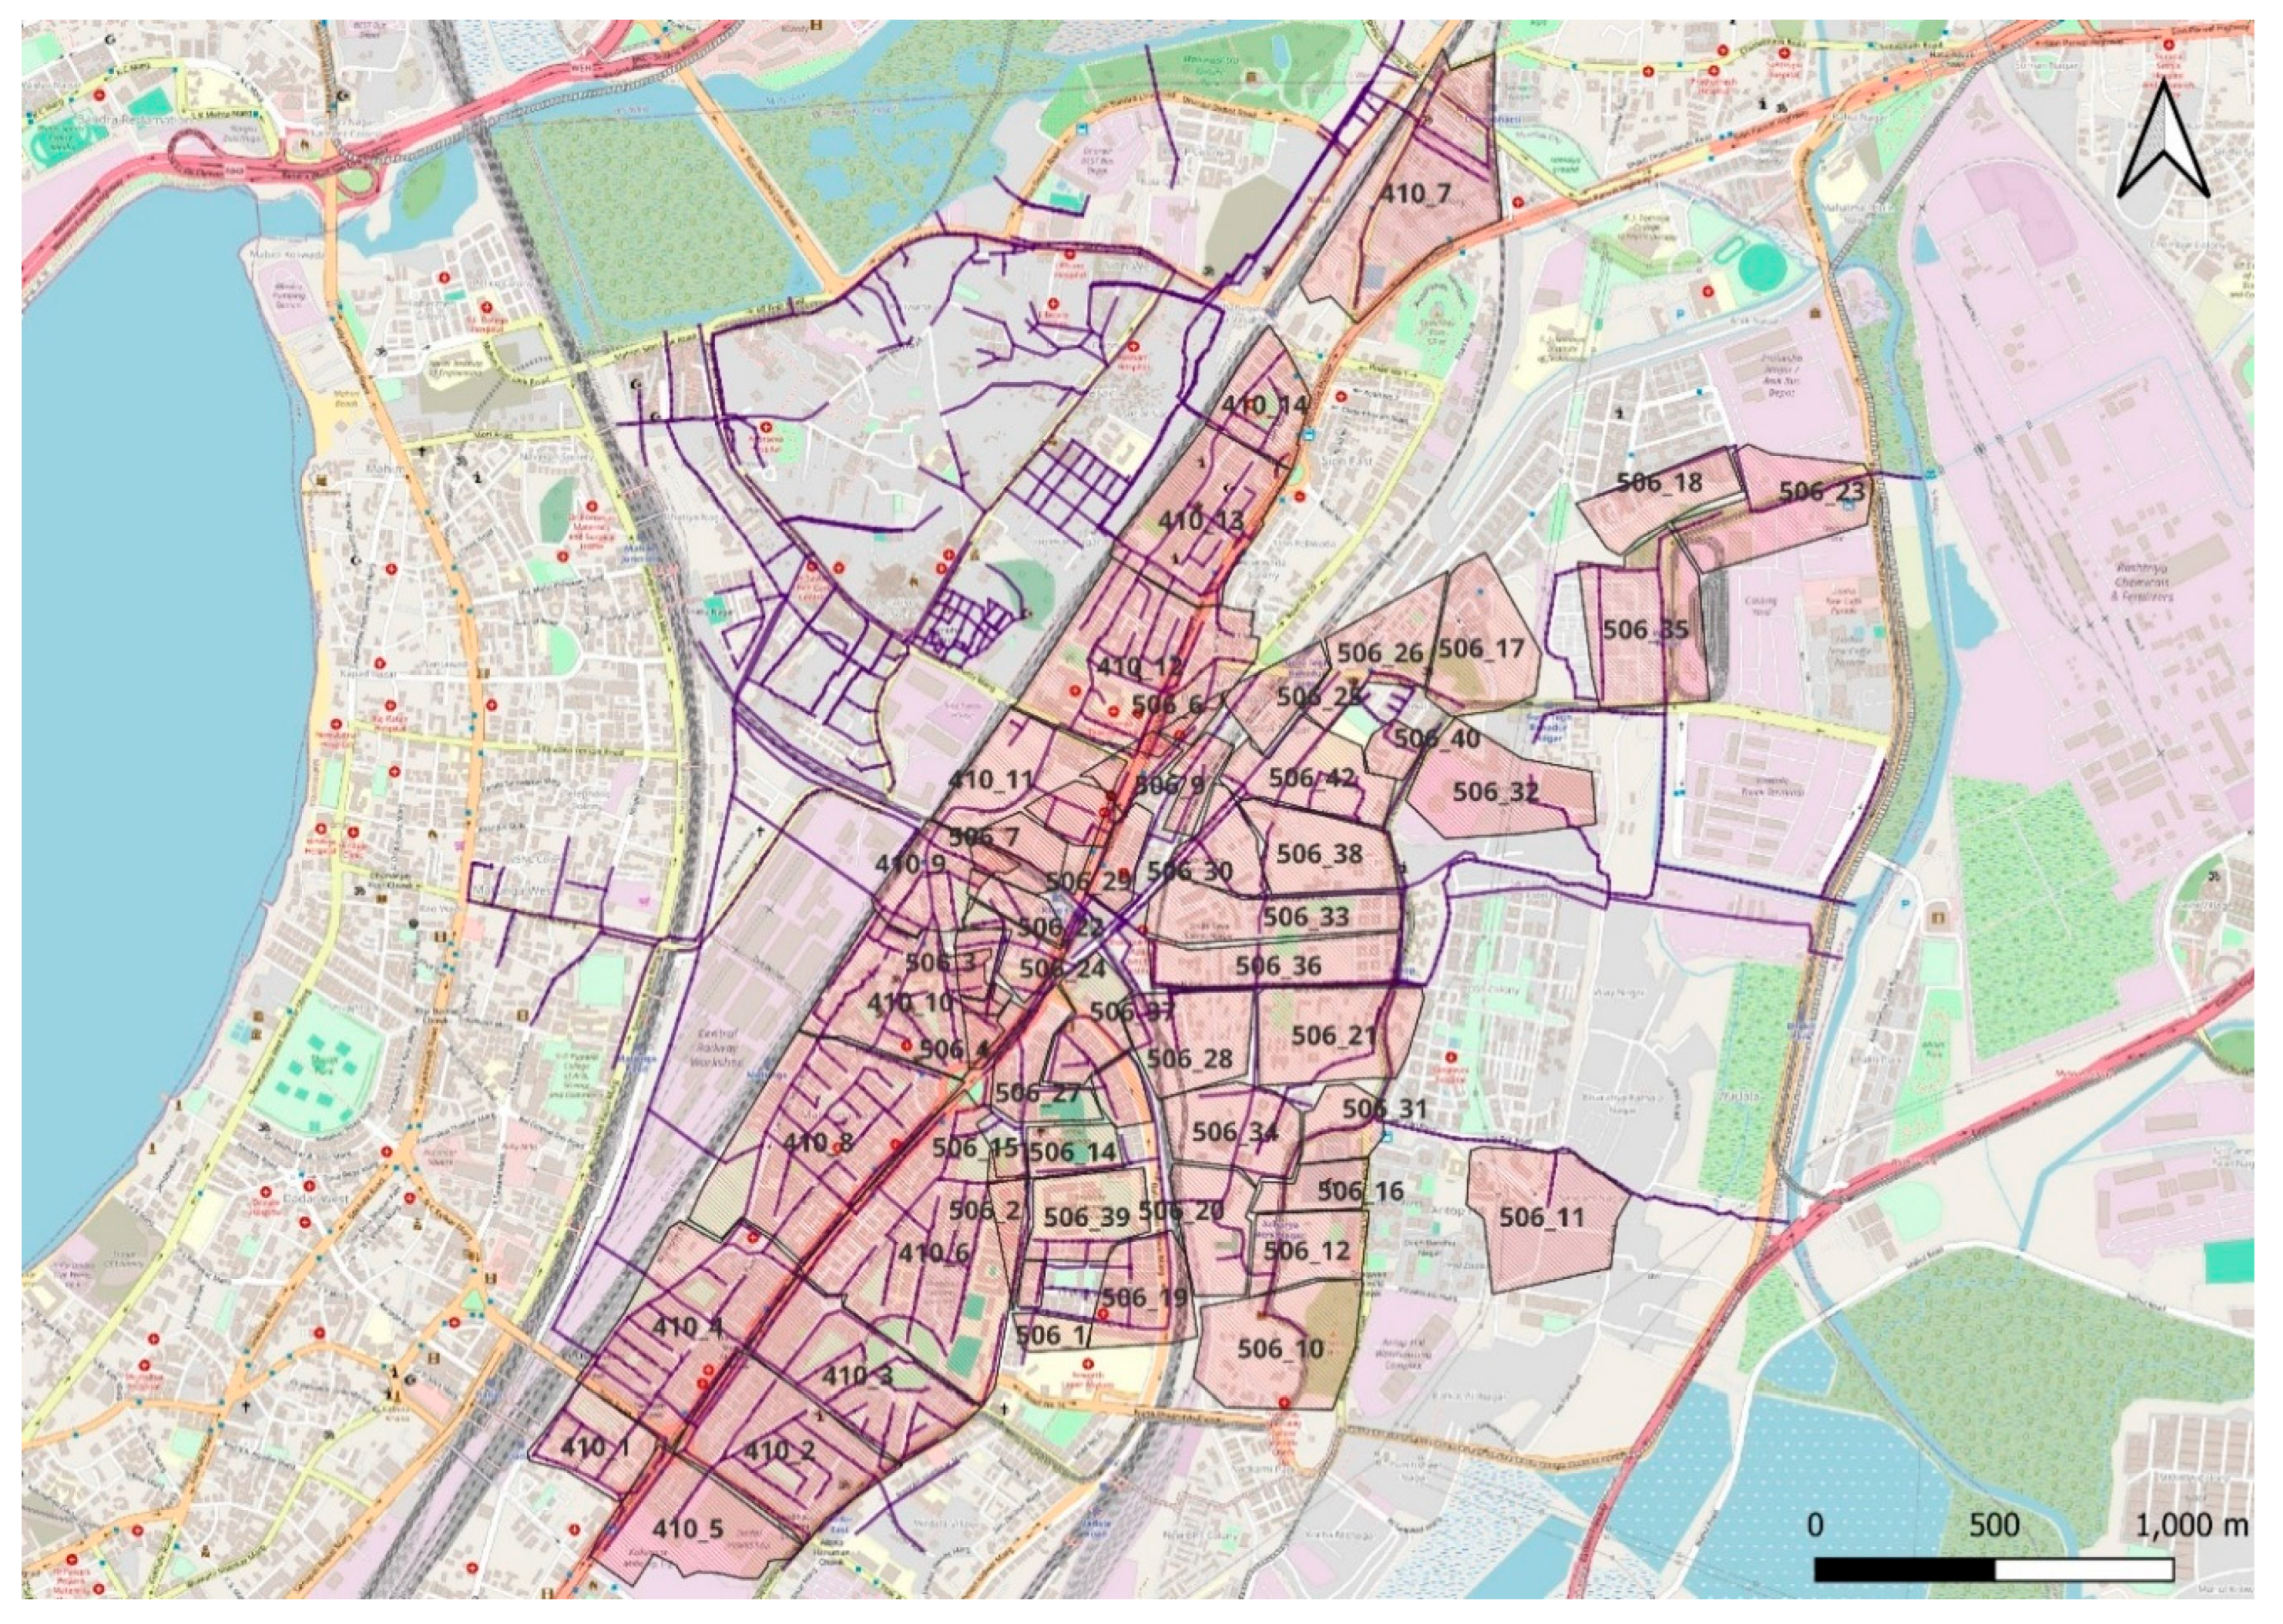
Figure 21.
Precipitation and Runoff Hydrograph for July 2024.
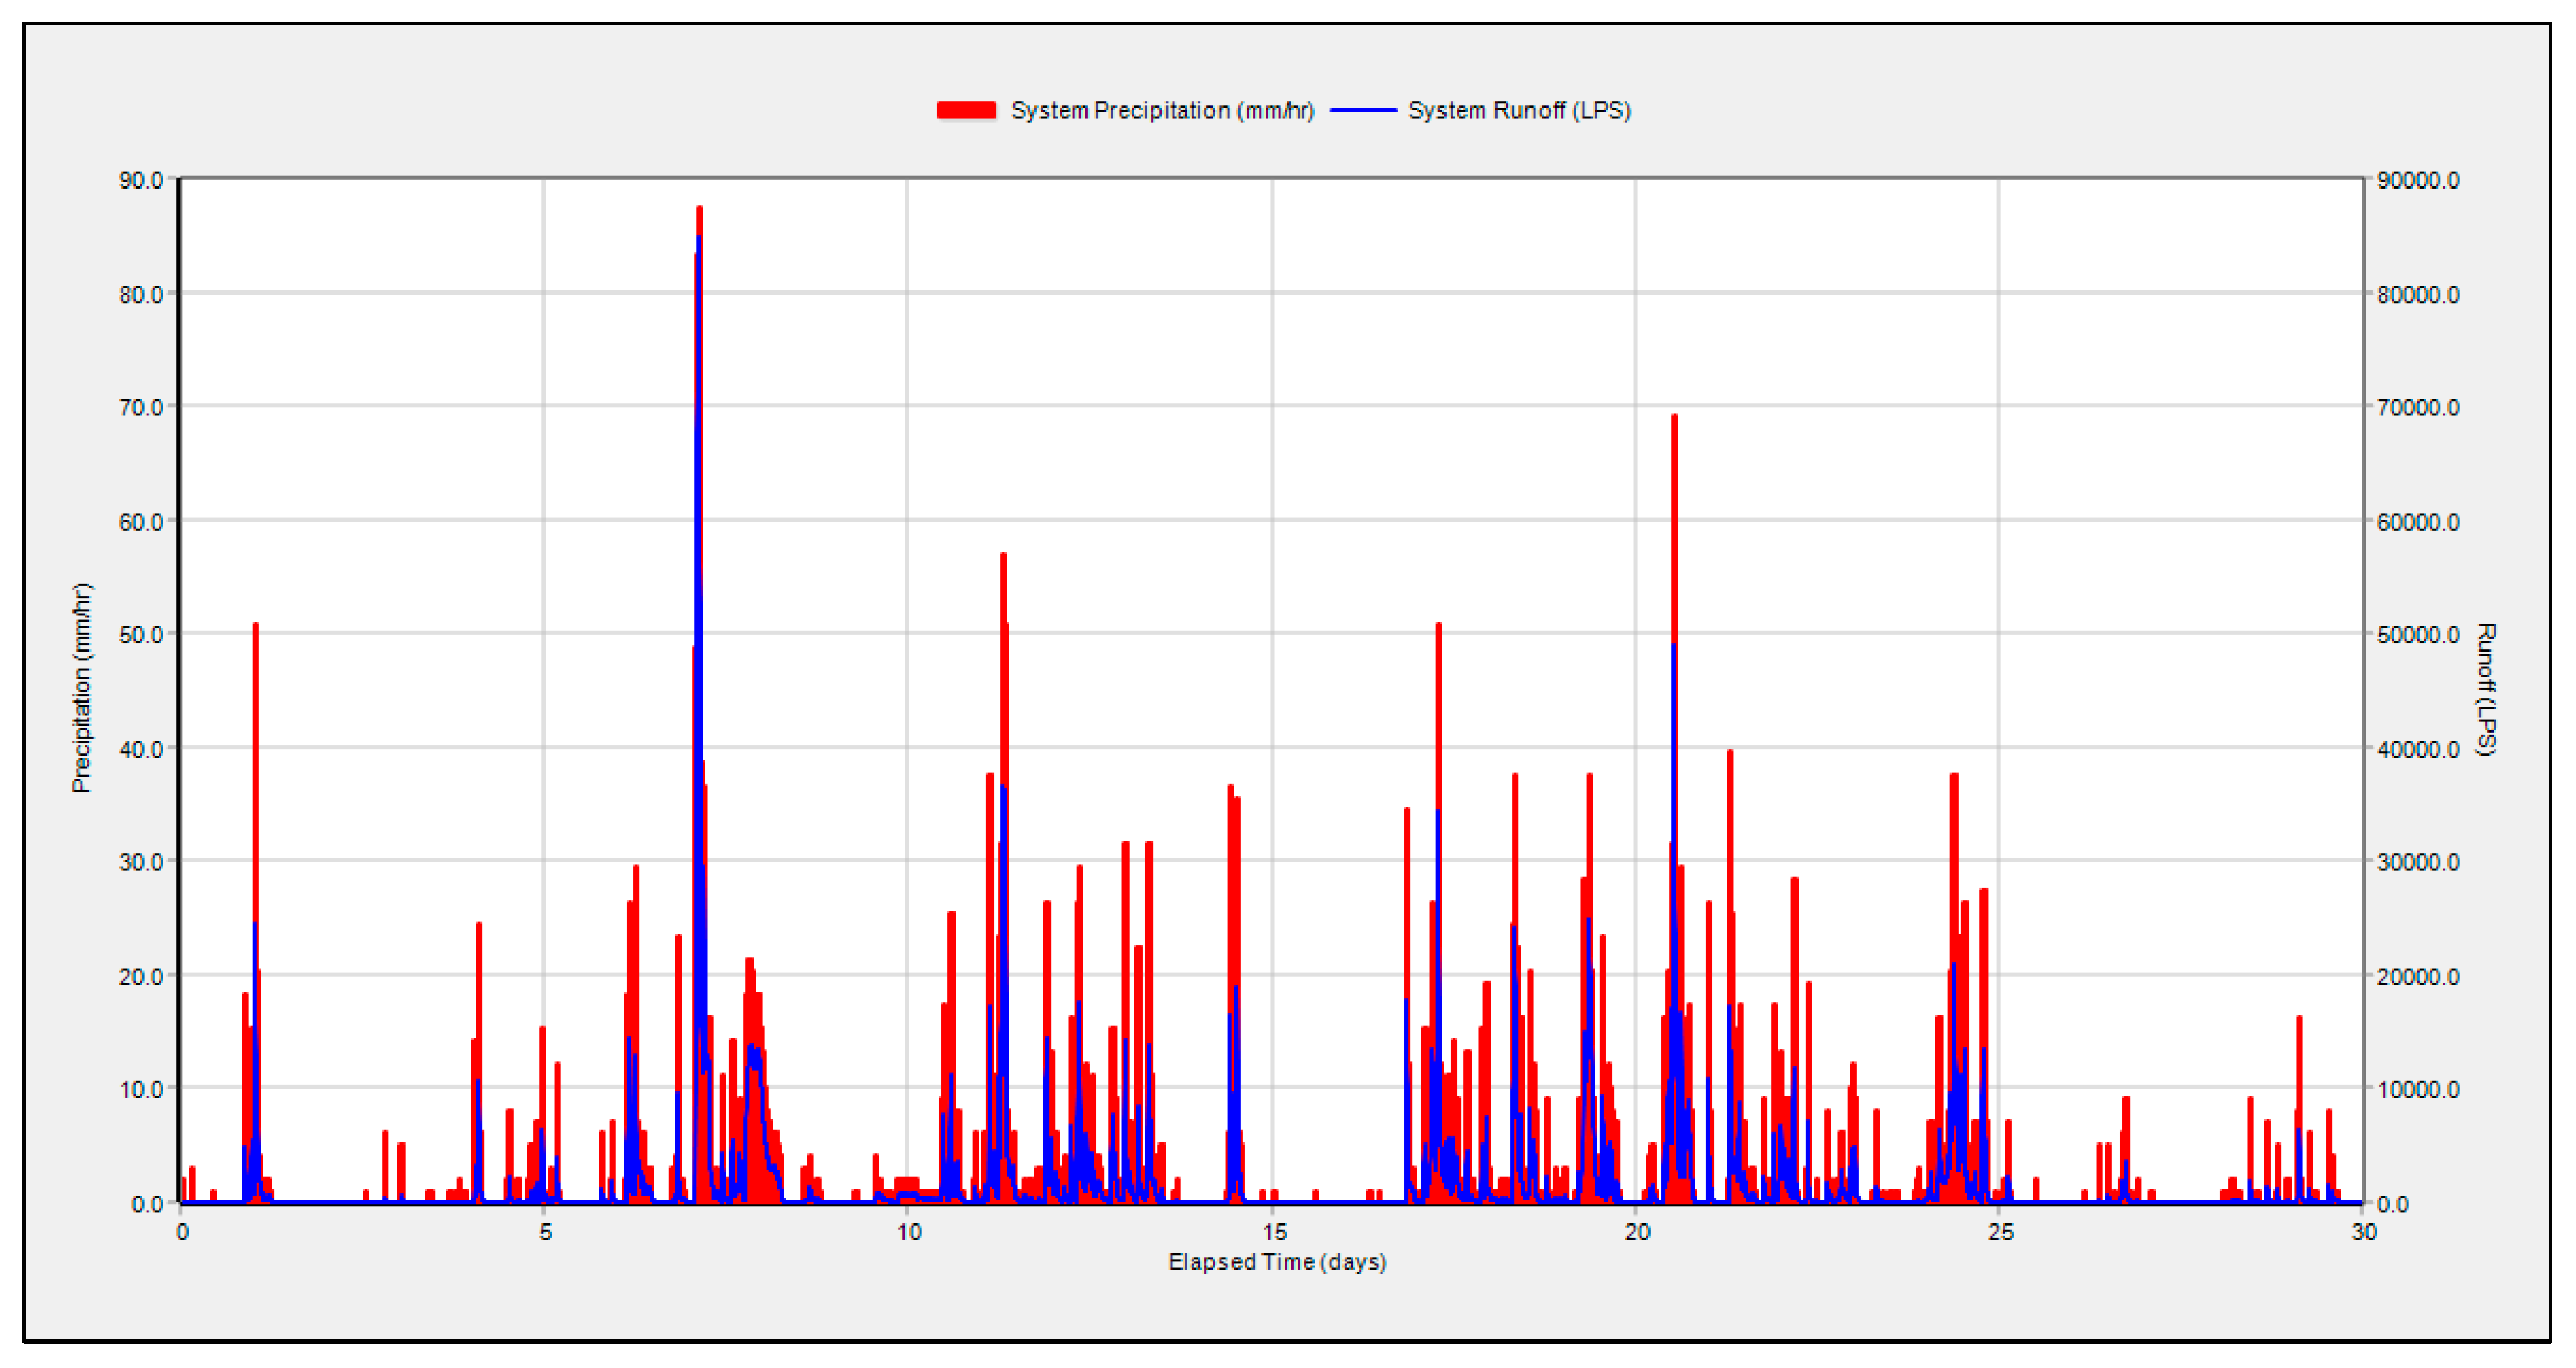
Figure 22.
Recorded vs Simulated flooding hotspot.
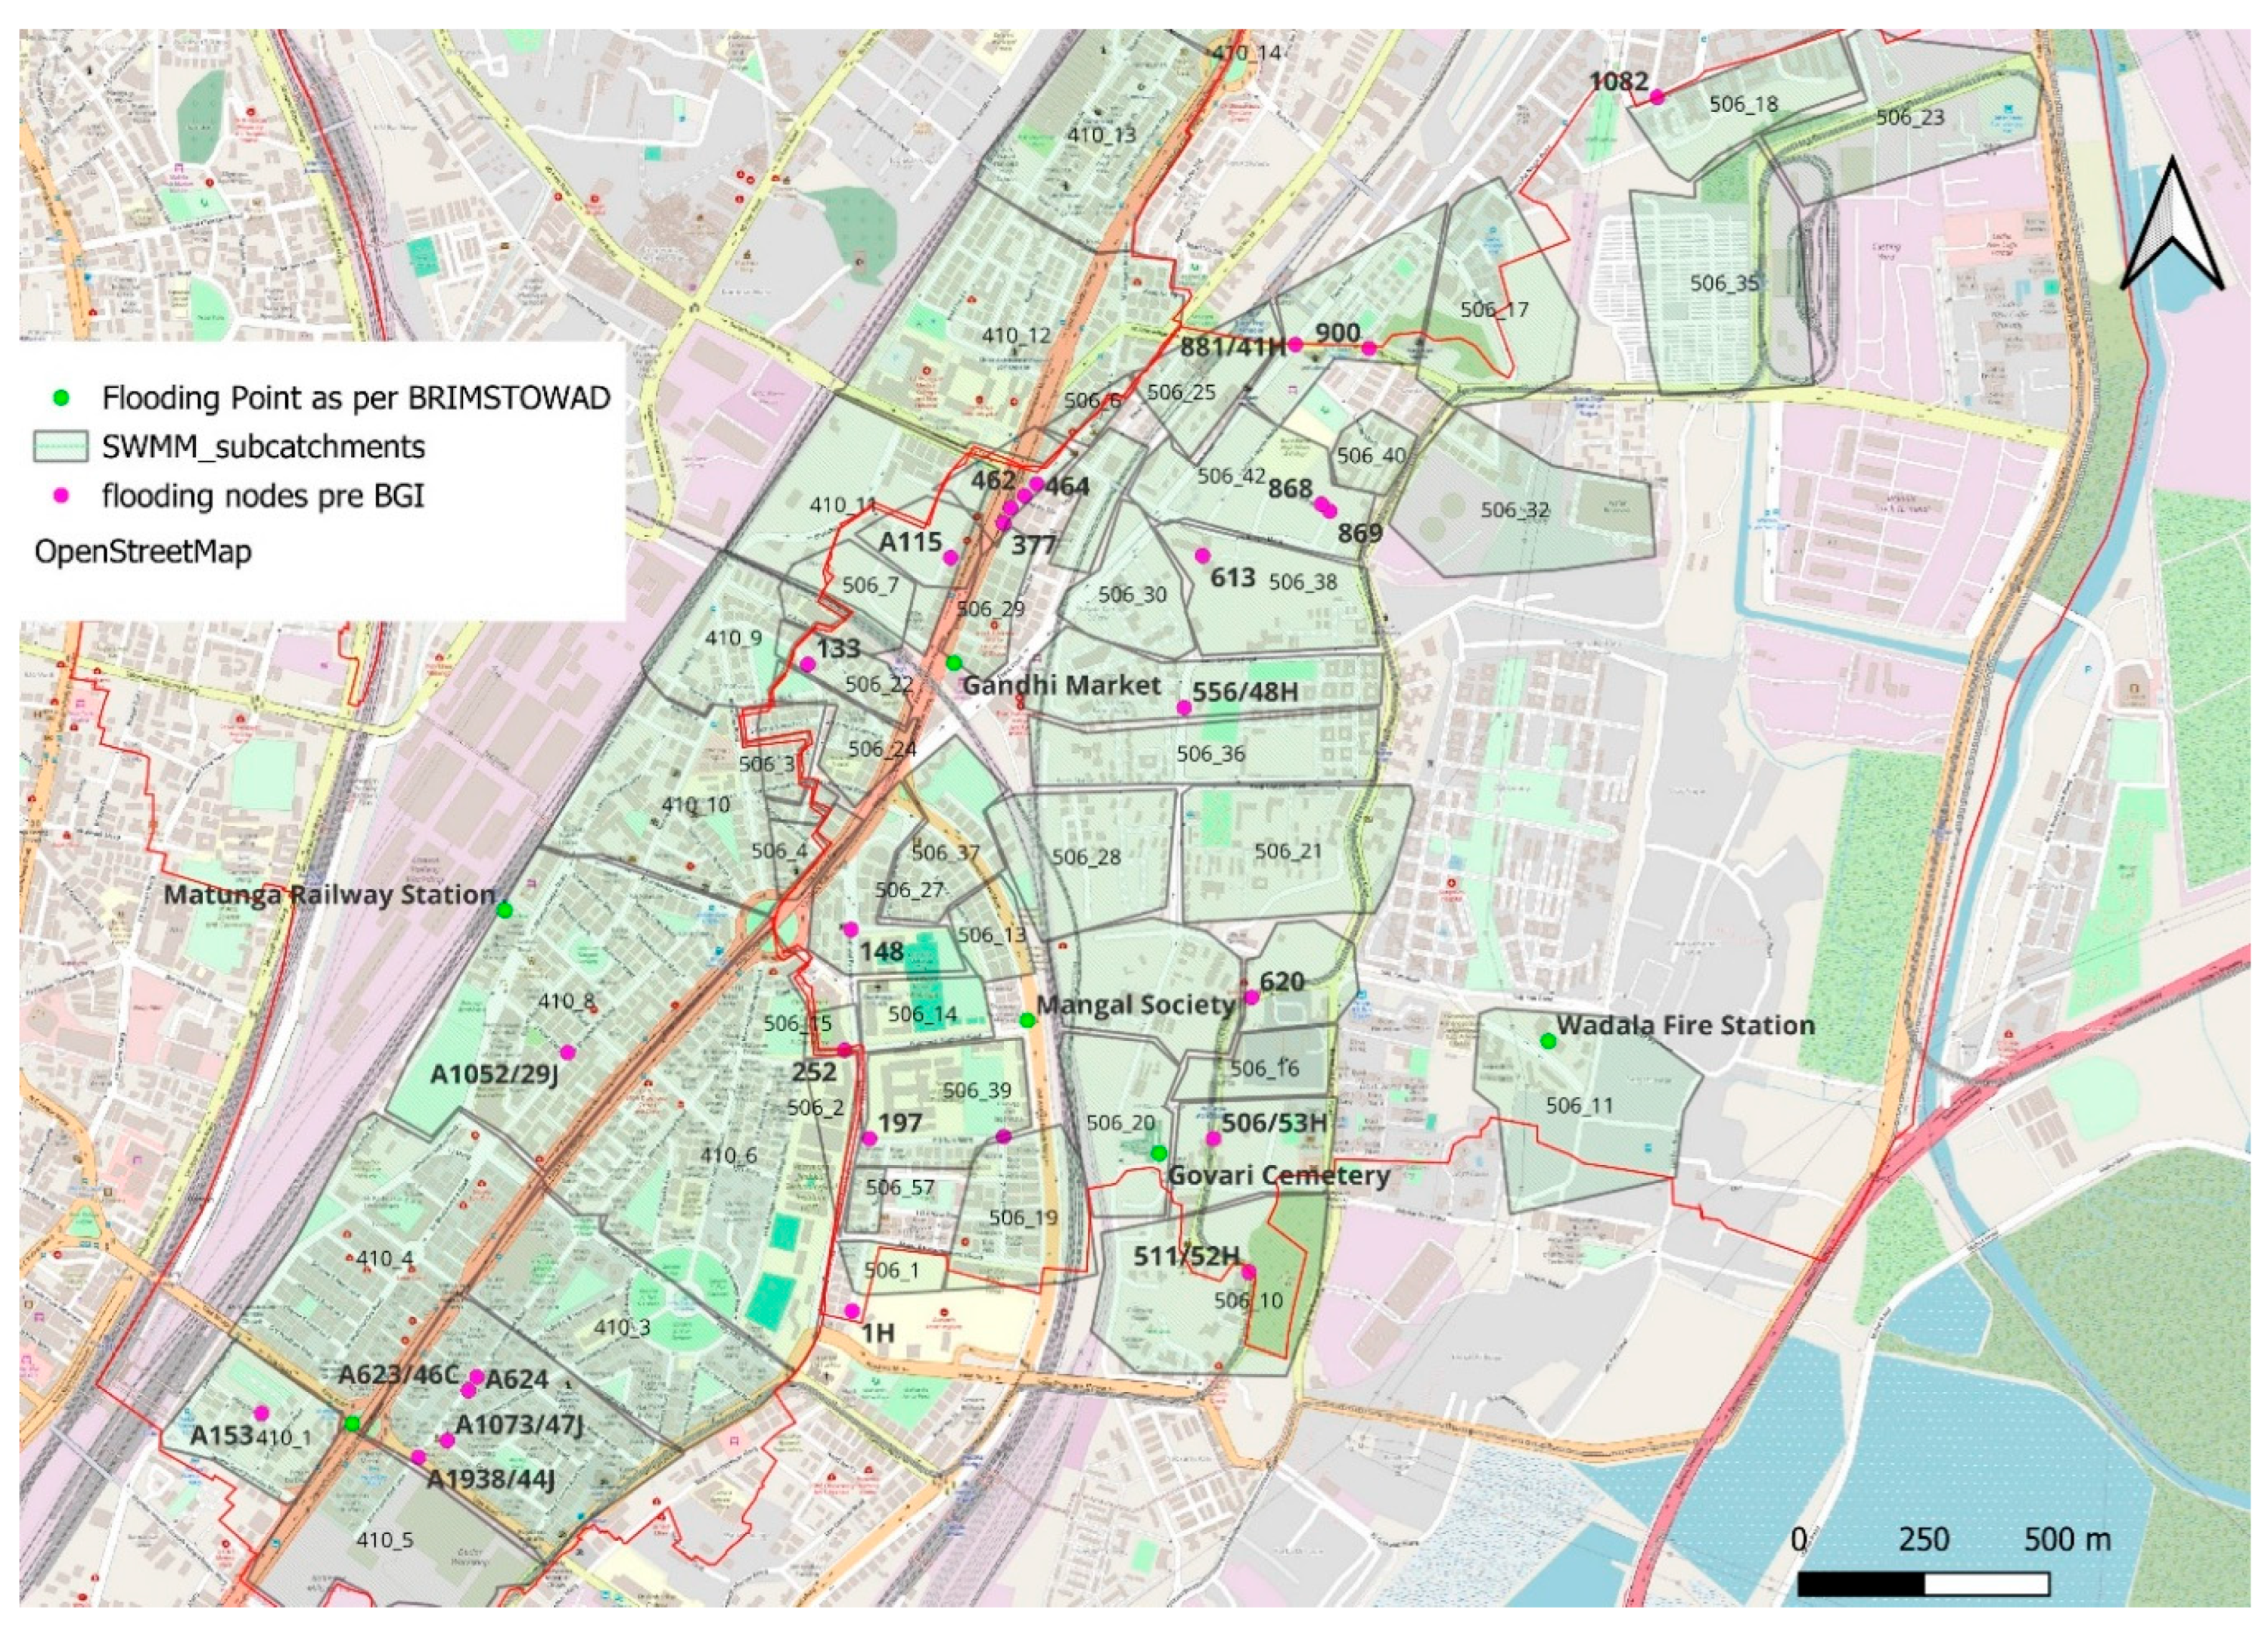
Figure 23.
Layout for Proposed PP, IT and GR.
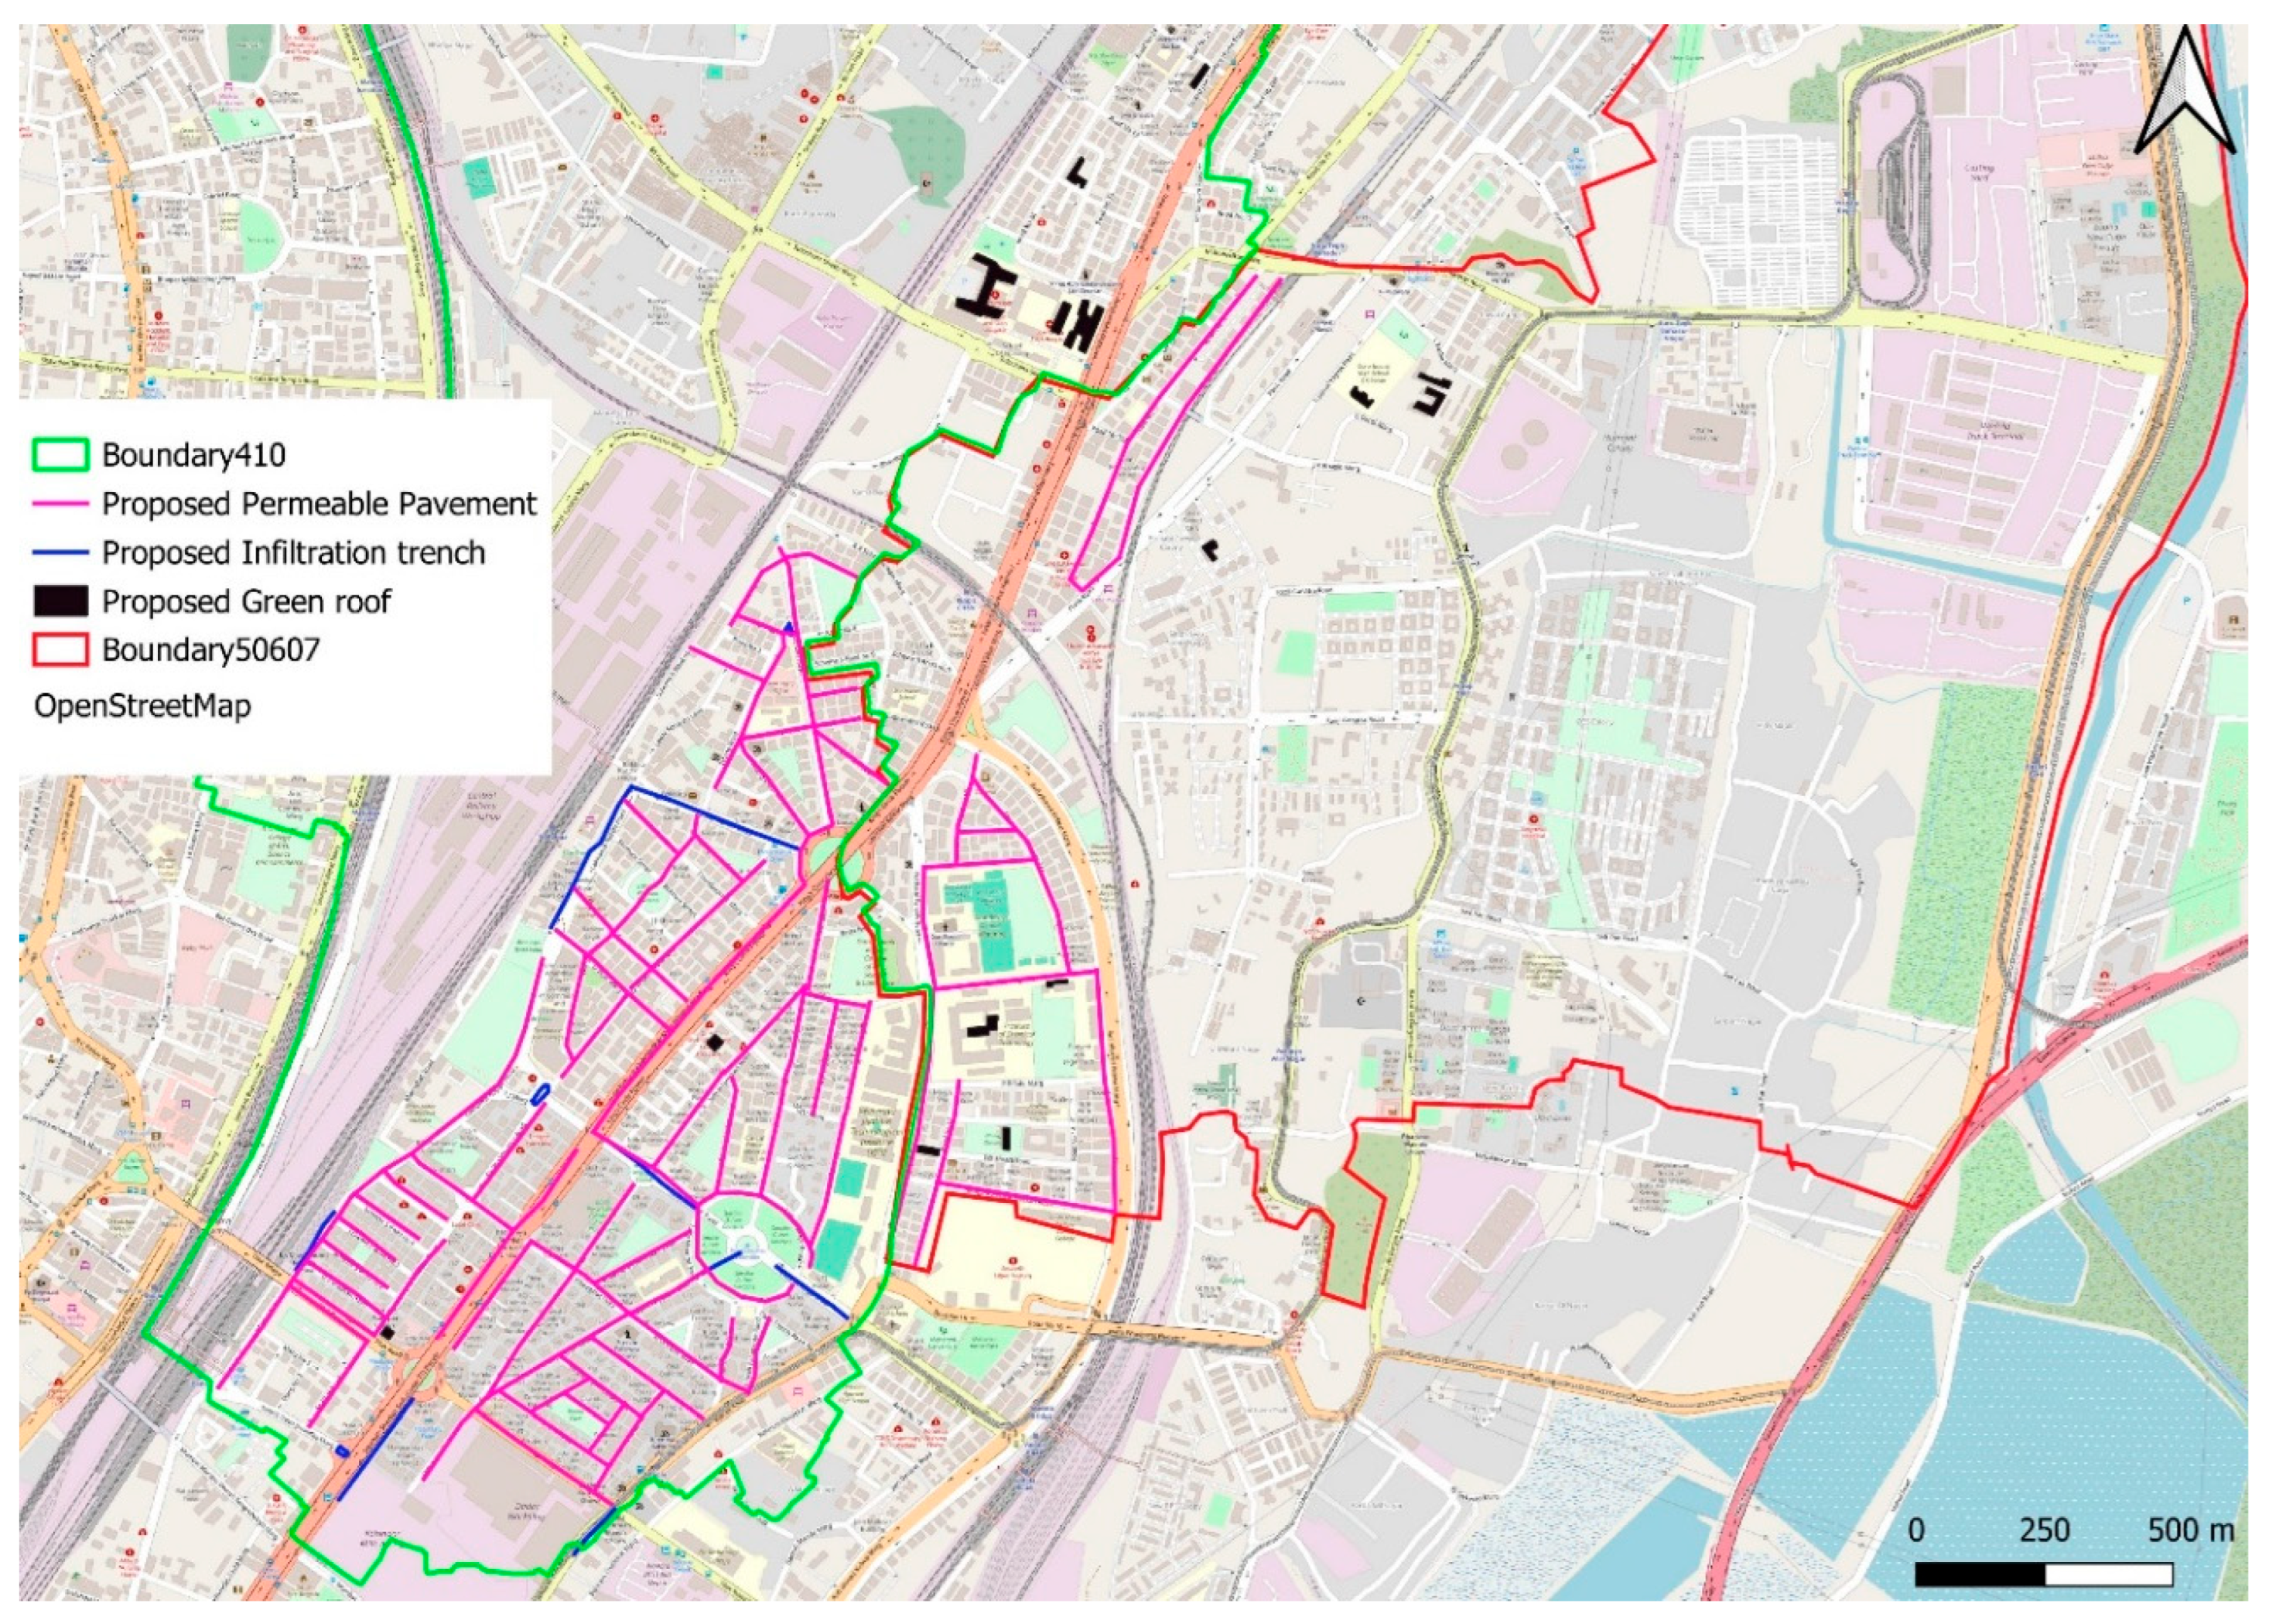
Figure 24.
Chart showing the pre and post BGI Max Rate LPS.
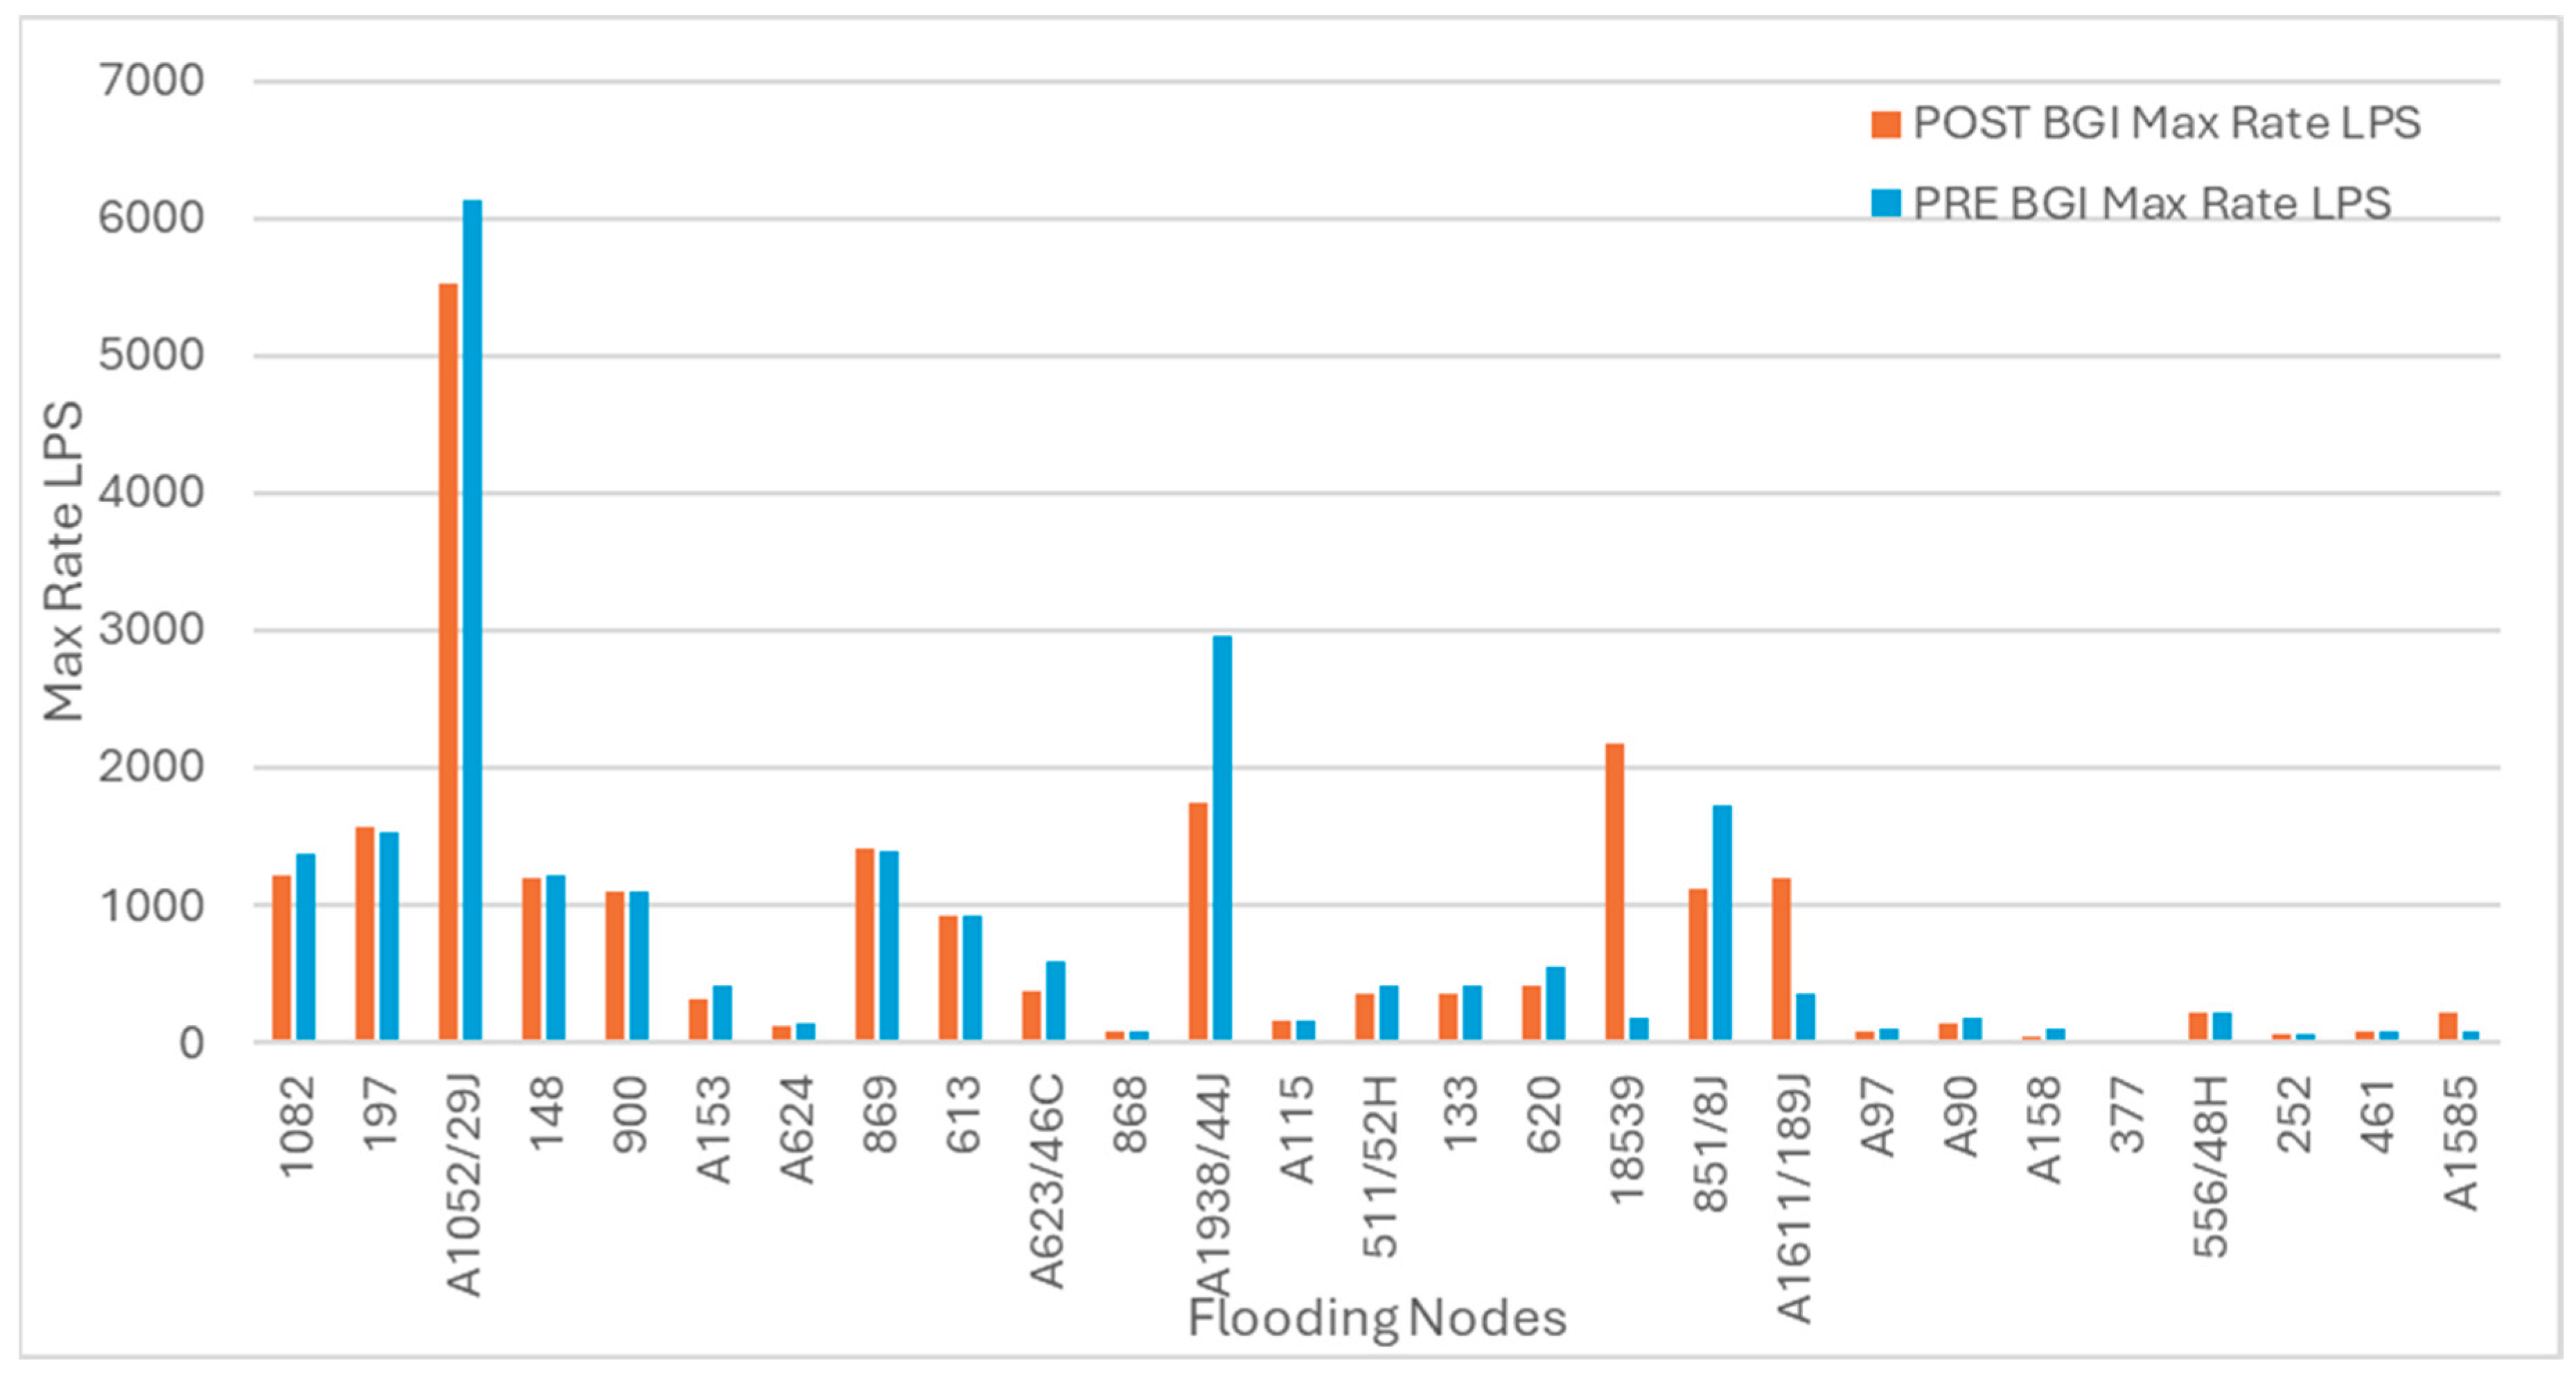
Figure 25.
Flooding Nodes POST BGI.
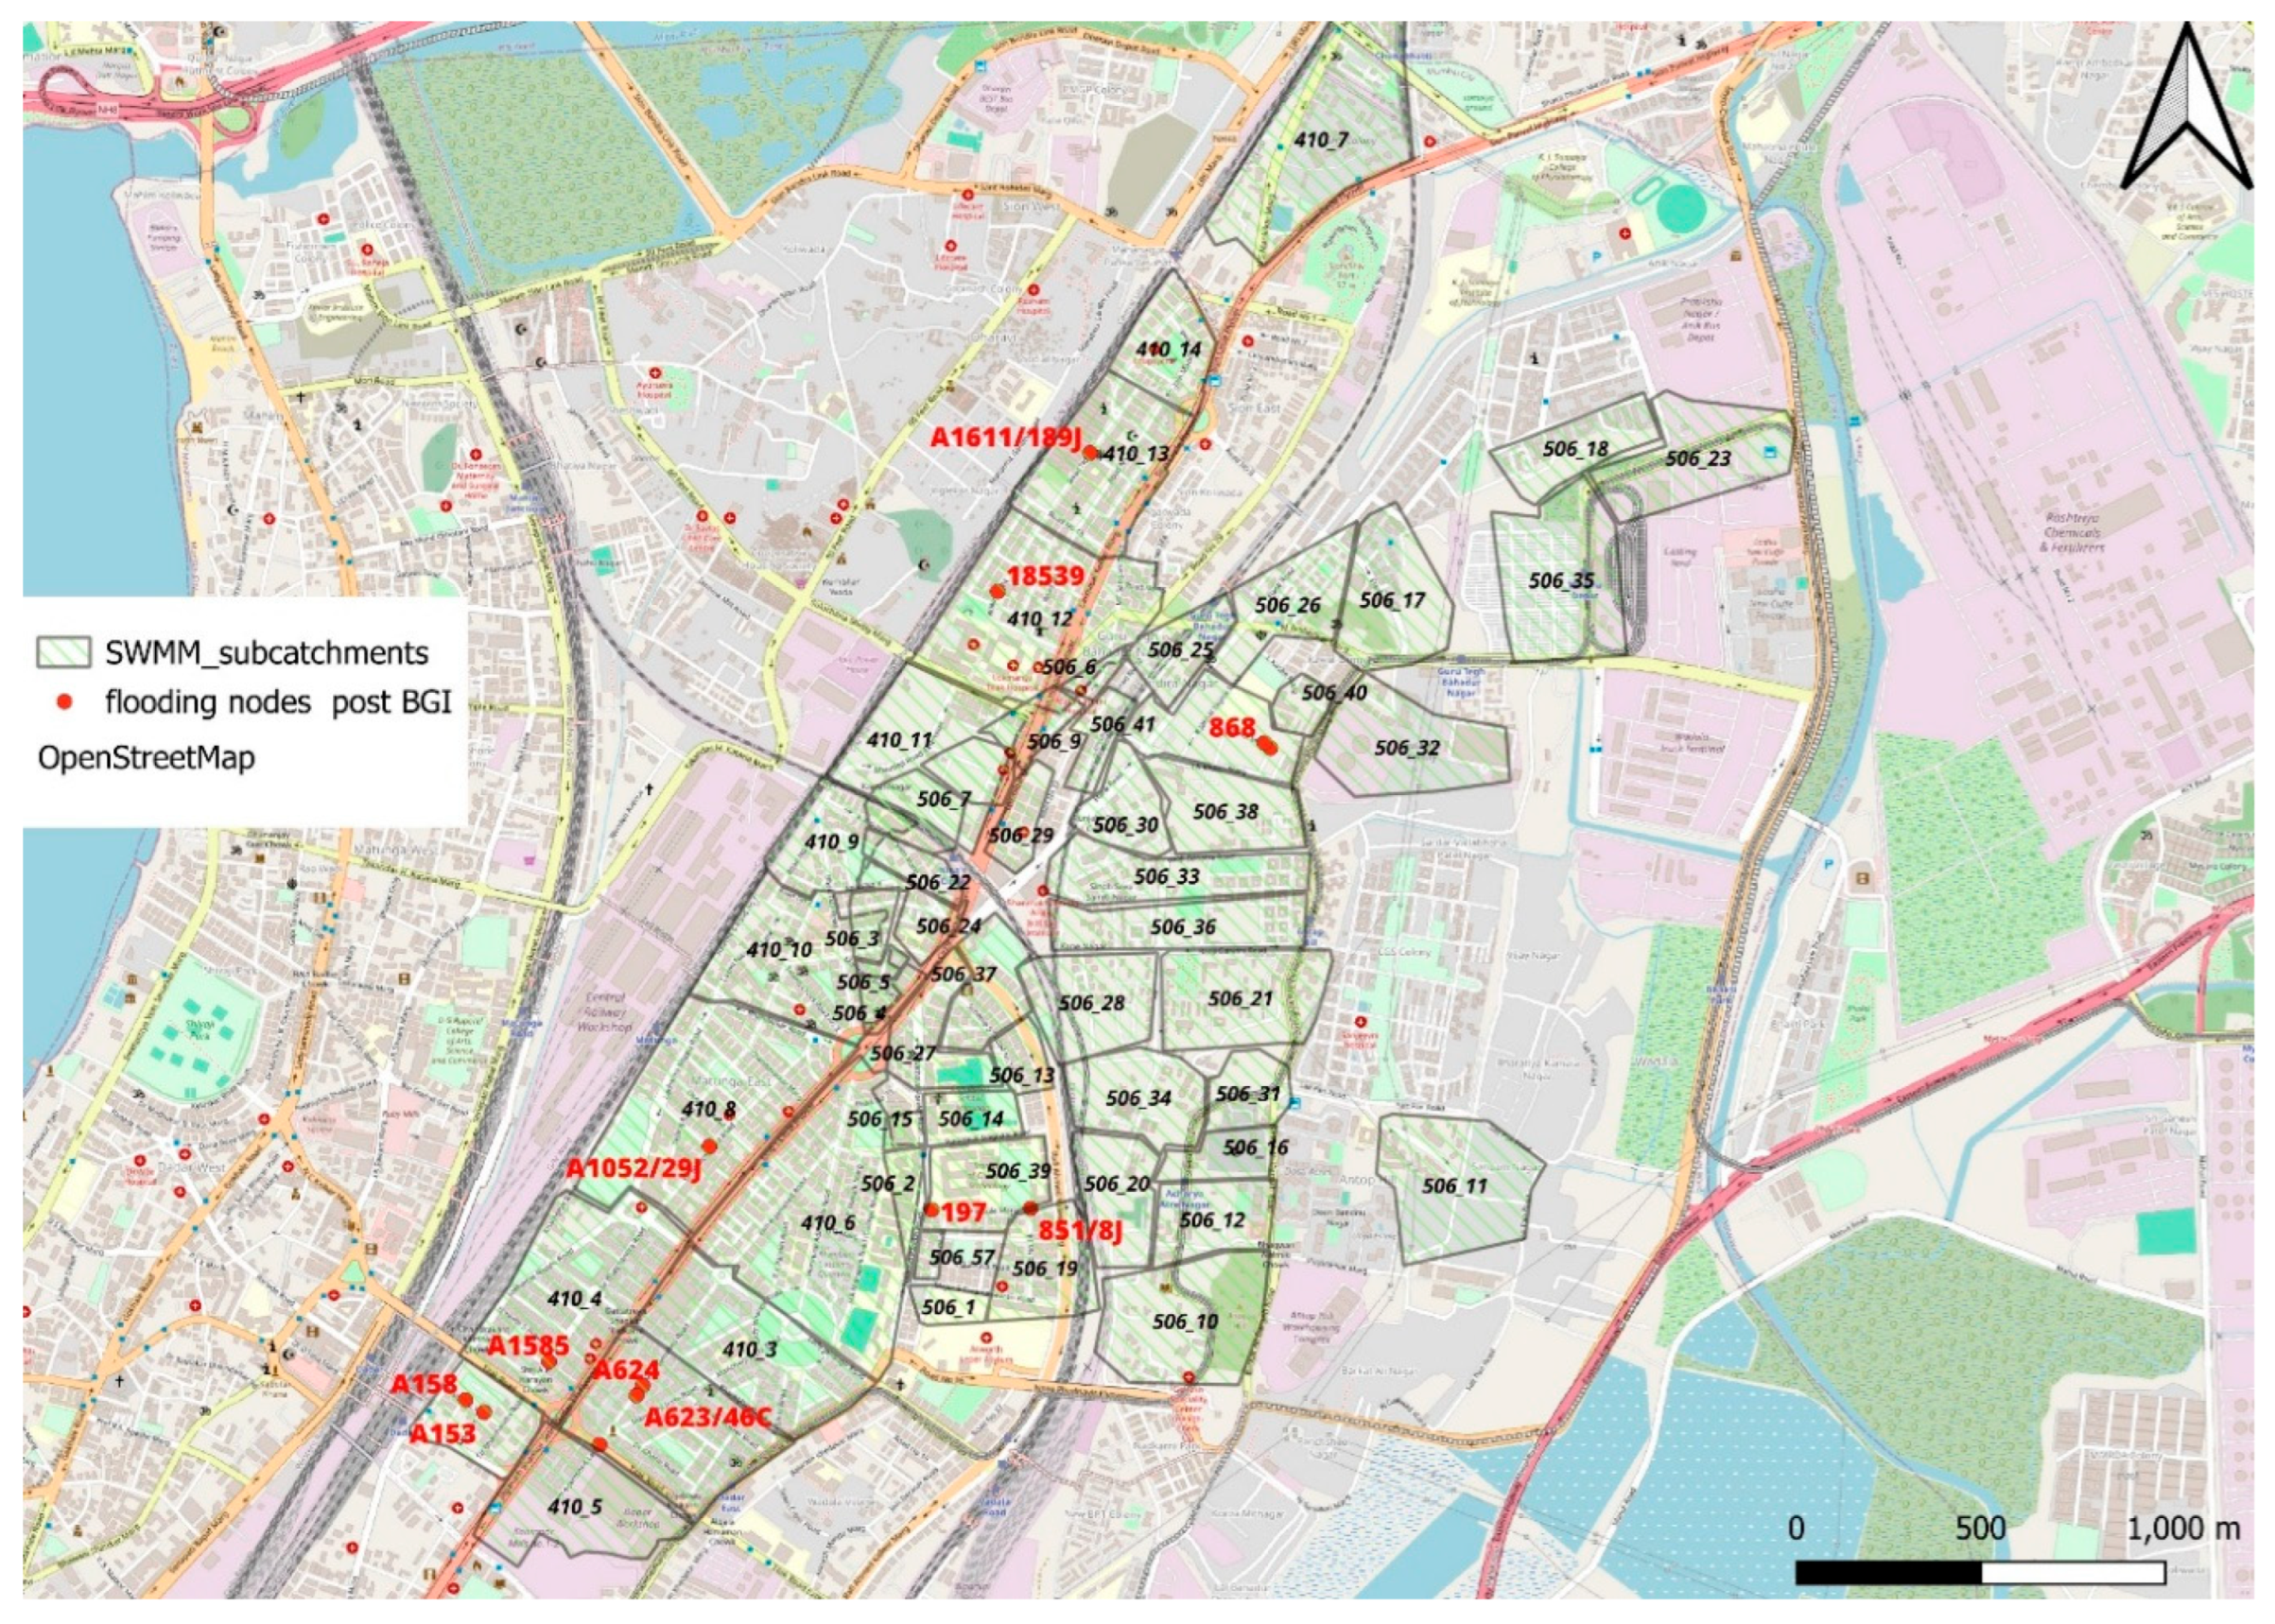

Table 1.
Data Collection and its source.
| Sr No | Type of Data | Source | Duration |
|---|---|---|---|
| 1 | Daily and Hourly Rainfall Data | India Meteorological Department, India | 2019 – 2024 |
| 2 | DEM (30 M) | BRIMSTOWAD II Design data (BRIMSTOWAD-II Master Plan report for Catchment 410, 2017), (BRIMSTOWAD-II Master Plan report for Catchment 506-507, 2017) | |
| 3 | Topographical map showing layout and existing data of existing storm water drainage system, Boundary of catchment, Ward water bodies (.pdf), and Road network (.pdf) | BRIMSTOWAD-II Catchment drawing and Report (BRIMSTOWAD-II Master Plan report for Catchment 410, 2017), (BRIMSTOWAD-II Master Plan report for Catchment 506-507, 2017) | Till 2017 |
| 4 | Verification and supplementation of drain data | Using Google Earth Pro | |
| 5 | Soil map | Ground Water Year Book (Department of Water Resources, Ministry of Jal Shakti, 2019–2020) | January 2021 |
| 6 | Historical flooding point of study area | (BRIMSTOWAD-II Master Plan report for Catchment 410, 2017), (BRIMSTOWAD-II Master Plan report for Catchment 506-507, 2017) | |
| 7 | Building/ Properties details, open spaces, roads and natural features | Open Street Map | As Available |
| 8 | Soil and Groundwater data | GIS-GPS based map of soil index properties of Mumbai (Mhaske and D.C., 2012) | 2011 |
Table 2.
Permeable pavement proposed dimensions.
| Surface | Soil | Storage | |||
|---|---|---|---|---|---|
| Berm height (mm) | 200 | Thickness (mm) | 300 | Thickness (mm) | 200 |
| Vegetation volume | 0.1 | Porosity (volume fraction) | 0.5 | Void ratio | 0.5 |
| Surface roughness (Manning’s n) | 0.02 | Field Capacity (Volume fraction) | 0.2 | Seepage rate (mm/hr) | 100 |
| Surface slope (%) | 1.0 | Wilting point (volume fraction) | 0.1 | Clogging factor | 0 |
| Conductivity (in/hr) | 0.5 | ||||
| Conductivity slope | 10 | ||||
| Suction head (mm) | 3.5 |
Table 3.
Green roof proposed dimensions.
|
Surface |
Soil | Drainage Mat | |||
|---|---|---|---|---|---|
| Berm height in mm | 10 | Thickness in mm | 150 | Thickness (mm) | 300 |
| Vegetation volume | 0.1 | Porosity (volume fraction) | 0.3 | Void function | 0.5 |
| Surface roughness (Manning’s n) | 0.15 | Field Capacity (Volume fraction) | 0.1 | Roughness (Manning’s n) | 0.1 |
| Surface slope (%) | 1 | Wilting point (volume fraction) | 0.05 | ||
| Conductivity (in/hr) | 0.5 | ||||
| Conductivity slope | 10 | ||||
| Suction head (mm) | 75 |
Table 4.
Infiltration trench proposed dimensions.
| Surface | Storage | ||
|---|---|---|---|
| Berm height (mm) | 200 | Thickness (mm) | 600 |
| Vegetation volume | 0.05 | Void ratio | 0.4 |
| Surface roughness (Manning’s n) | 0.2 | Seepage rate (mm/hr) | 180 |
| Surface slope (%) | 0 | Clogging factor | 0 |
Table 5.
Time-Interval Rainfall Intensities Used for SWMM Simulation.
| Sr No | Interval (min) | 25 Year (mm/hr) | 10 Year (mm/hr) | 5 Year (mm/hr) | 2 Year (mm/hr) |
|---|---|---|---|---|---|
| 1 | 10 | 227.73 | 201.02 | 179.89 | 147.96 |
| 2 | 20 | 170.80 | 150.77 | 134.91 | 110.97 |
| 3 | 30 | 132.84 | 117.26 | 104.93 | 86.31 |
| 4 | 40 | 106.28 | 93.81 | 83.95 | 69.05 |
| 5 | 50 | 86.95 | 76.75 | 68.68 | 56.49 |
| 6 | 60 | 72.46 | 63.96 | 57.24 | 47.08 |
| 7 | 70 | 61.31 | 54.12 | 48.43 | 39.83 |
| 8 | 80 | 52.55 | 46.39 | 41.51 | 34.14 |
| 9 | 90 | 45.55 | 40.21 | 35.98 | 29.59 |
| 10 | 100 | 39.85 | 35.18 | 31.48 | 25.89 |
| 11 | 110 | 35.17 | 31.04 | 27.78 | 22.85 |
| 12 | 120 | 31.26 | 27.59 | 24.69 | 20.31 |
| 13 | 130 | 27.97 | 24.69 | 22.09 | 18.17 |
| 14 | 140 | 25.17 | 22.22 | 19.88 | 16.35 |
| 15 | 150 | 22.77 | 20.10 | 17.99 | 14.80 |
| 16 | 160 | 20.70 | 18.28 | 16.35 | 13.45 |
| 17 | 170 | 18.90 | 16.69 | 14.93 | 12.28 |
| 18 | 180 | 17.33 | 15.30 | 13.69 | 11.26 |
| 19 | 190 | 16.63 | 14.68 | 13.14 | 10.81 |
| 20 | 200 | 14.72 | 12.99 | 11.62 | 9.56 |
| 21 | 210 | 13.63 | 12.03 | 10.76 | 8.85 |
| 22 | 220 | 12.65 | 11.17 | 9.99 | 8.22 |
| 23 | 230 | 11.78 | 10.40 | 9.30 | 7.65 |
| 24 | 240 | 10.99 | 9.71 | 8.68 | 7.14 |
| 25 | 250 | 10.29 | 9.08 | 8.12 | 6.68 |
Table 6.
Flooding Nodes After Simulation.
| Node | Hours Flooded | Max Rate (m³/s) | Hour of Max Flooding | Total Flood Volume (m³) |
|---|---|---|---|---|
| 1082 | 1.98 | 1.37 | 00:20 | 4664.00 |
| 197 | 1.67 | 1.52 | 00:20 | 4603.00 |
| 148 | 1.51 | 1.21 | 00:20 | 3429.00 |
| A1052/29J | 1.36 | 6.13 | 00:39 | 17860.00 |
| 900 | 1.24 | 1.10 | 00:30 | 2737.00 |
| A153 | 1.13 | 0.41 | 00:49 | 1151.00 |
| 869 | 1.12 | 1.38 | 00:10 | 3028.00 |
| 613 | 1.08 | 0.92 | 00:20 | 1960.00 |
| 868 | 1.06 | 0.08 | 00:22 | 190.00 |
| A624 | 0.99 | 0.14 | 00:54 | 481.00 |
| A623/46C | 0.95 | 0.58 | 00:33 | 1588.00 |
| 511/52H | 0.94 | 0.42 | 00:40 | 895.00 |
| 133 | 0.87 | 0.41 | 00:20 | 735.00 |
| A1938/44J | 0.85 | 2.96 | 00:20 | 5557.00 |
| 851/8J | 0.79 | 1.72 | 00:18 | 2553.00 |
| 620 | 0.76 | 0.55 | 00:10 | 805.00 |
| 506/53H | 0.75 | 0.88 | 00:20 | 1250.00 |
| A115 | 0.53 | 0.15 | 00:21 | 204.00 |
| 377 | 0.52 | 0.02 | 00:08 | 17.00 |
| 461 | 0.50 | 0.09 | 00:19 | 125.00 |
| 252 | 0.45 | 0.07 | 00:30 | 63.00 |
| 881/41H | 0.44 | 0.64 | 00:10 | 490.00 |
| A1073/47J | 0.42 | 2.10 | 00:11 | 1966.00 |
| 556/48H | 0.37 | 0.22 | 00:20 | 111.00 |
| 1H | 0.35 | 0.07 | 00:20 | 27.00 |
| 462 | 0.31 | 0.05 | 00:08 | 11.00 |
| 464 | 0.29 | 0.09 | 00:22 | 62.00 |
Table 7.
Comparison of PRE- and POST-BGI Flooding Nodes. Max Rate in m³/s and Total Flood Volume in m³.
Table 7.
Comparison of PRE- and POST-BGI Flooding Nodes. Max Rate in m³/s and Total Flood Volume in m³.
| Node | Hours Flooded | POST-BGI Max Rate (m³/s) | POST-BGI Volume (m³) | PRE-BGI Max Rate (m³/s) | PRE-BGI Volume (m³) | Proposed BGI | Sub-catchment |
|---|---|---|---|---|---|---|---|
| 1082 | 1.99 | 1.21 | 4355.00 | 1.37 | 4664.00 | No direct BGI inlet | 506_18 |
| 197 | 1.67 | 1.56 | 4621.00 | 1.52 | 4603.00 | GR | 506_39 |
| A1052/29J | 1.54 | 5.53 | 17801.00 | 6.13 | 17860.00 | IT, PP | 410_8 |
| 148 | 1.51 | 1.20 | 3418.00 | 1.21 | 3429.00 | No direct BGI inlet | 506_27 |
| 900 | 1.24 | 1.10 | 2729.00 | 1.10 | 2737.00 | No direct BGI inlet | 506_26 |
| A153 | 1.23 | 0.32 | 1004.00 | 0.41 | 1151.00 | IT, PP | 410_1 |
| A624 | 1.13 | 0.11 | 423.00 | 0.14 | 481.00 | PP | 410_2 |
| 869 | 1.11 | 1.41 | 3100.00 | 1.38 | 3028.00 | GR | 506_42 |
| 613 | 1.08 | 0.92 | 1956.00 | 0.92 | 1960.00 | No direct BGI inlet | 506_38 |
| A623/46C | 1.08 | 0.38 | 1159.00 | 0.58 | 1588.00 | PP | 410_2 |
| 868 | 1.05 | 0.08 | 189.00 | 0.08 | 190.00 | GR | 506_42 |
| A1938/44J | 0.98 | 1.73 | 3597.00 | 2.96 | 5557.00 | IT, PP | 410_5 |
| A115 | 0.97 | 0.15 | 403.00 | 0.15 | 204.00 | No direct BGI inlet | 410_11 |
| 511/52H | 0.89 | 0.35 | 655.00 | 0.42 | 895.00 | No direct BGI inlet | 506_10 |
| 133 | 0.86 | 0.35 | 644.00 | 0.41 | 735.00 | No direct BGI inlet | 506_22 |
| 620 | 0.75 | 0.42 | 639.00 | 0.55 | 805.00 | No direct BGI inlet | 506_31 |
| 18539 | 0.73 | 2.17 | 3556.00 | 0.18 | 10.00 | GR | 410_12 |
| 851/8J | 0.66 | 1.11 | 1173.00 | 1.72 | 2553.00 | GR | 506_39 |
| A1611/189J | 0.64 | 1.20 | 1676.00 | 0.35 | 23.00 | GR | 410_13 |
| A97 | 0.60 | 0.07 | 16.00 | 0.10 | 0.00 | No direct BGI inlet | 506_8 |
| A90 | 0.55 | 0.13 | 40.00 | 0.18 | 1.00 | No direct BGI inlet | 506_8 |
| A158 | 0.39 | 0.05 | 35.00 | 0.09 | 6.00 | IT, PP | 410_1 |
| 377 | 0.38 | 0.01 | 12.00 | 0.02 | 17.00 | No direct BGI inlet | 506_9 |
| 556/48H | 0.37 | 0.21 | 101.00 | 0.22 | 111.00 | No direct BGI inlet | 506_33 |
| 252 | 0.37 | 0.05 | 28.00 | 0.07 | 63.00 | No direct BGI inlet | 506_15 |
| 461 | 0.35 | 0.07 | 52.00 | 0.09 | 125.00 | No direct BGI inlet | 506_9 |
| A1585 | 0.26 | 0.22 | 56.00 | 0.08 | 3.00 | IT, PP | 410_1 |
Table 8.
Sub catchment runoff comparison for PRE and POST BGI.
| Sub-catch-ment | POST BGI | Proposed BGI | PRE BGI | ||||||||||
|---|---|---|---|---|---|---|---|---|---|---|---|---|---|
| Total Evaporation mm |
Total Infiltration mm | Impervious Runoff mm |
Pervious Runoff mm | Total Runoff mm | Total Runoff 10^6 Ltr | Peak Runoff LPS | Total Runoff 10^6 Ltr | Peak Runoff LPS | |||||
| 410_1 | 1.51 | 57.84 | 51.72 | 92.45 | 134.66 | 8.69 | 1315.54 | IT | PP | 9.88 | 1498.54 | ||
| 410_2 | 1.67 | 48.23 | 67.11 | 81.1 | 140.16 | 22.78 | 3587.6 | PP | 32.44 | 7395.55 | |||
| 410_3 | 1.6 | 60.9 | 75.74 | 78.08 | 137.38 | 21.18 | 3592.33 | IT | PP | 25.26 | 4308.11 | ||
| 410_4 | 1.68 | 58.12 | 83.23 | 74.08 | 145.8 | 29.33 | 4472.72 | IT | PP | 32.77 | 5231.45 | ||
| 410_5 | 1.54 | 45.63 | 91.95 | 75.84 | 164.91 | 20.28 | 3679.86 | IT | PP | 21.73 | 4291.24 | ||
| 410_6 | 1.52 | 64.33 | 52.39 | 90.38 | 140.8 | 41.96 | 5210.58 | PP | 46.56 | 6743.16 | |||
| 410_8 | 1.83 | 49.49 | 88.9 | 69.01 | 154.07 | 38.53 | 5112.41 | IT | PP | 41.39 | 6866.24 | ||
| 410_9 | 1.44 | 52.5 | 67.22 | 88.48 | 151.96 | 11.06 | 2083.03 | IT | PP | 11.62 | 1905.24 | ||
| 410_10 | 1.61 | 43.69 | 89.11 | 75.07 | 162.28 | 25.28 | 4481.14 | PP | 25.96 | 4470.84 | |||
| 410_12 | 1.64 | 43.45 | 81.54 | 76.65 | 166.88 | 36.55 | 6020.23 | GR | 36.19 | 6220.18 | |||
| 410_13 | 1.51 | 44.6 | 86.54 | 78.94 | 166.31 | 22.78 | 3995.31 | GR | 22.89 | 4164.04 | |||
| 506_1 | 1.53 | 46.99 | 61.68 | 88 | 141.87 | 2.65 | 479.24 | PP | 3.05 | 677.3 | |||
| 506_30 | 1.7 | 43.12 | 93.45 | 71.14 | 167.4 | 8.03 | 1361.18 | GR | 8 | 1345.85 | |||
| 506_39 | 1.6 | 40.19 | 93.15 | 73.45 | 170.68 | 12.35 | 2324.83 | GR | 12.29 | 2287.56 | |||
| 506_40 | 1.68 | 38.08 | 77.85 | 75.55 | 172.77 | 3.38 | 752.2 | GR | 3.46 | 814.15 | |||
| 506_42 | 1.61 | 38.25 | 96.05 | 71.4 | 172.73 | 14.52 | 2828.05 | GR | 14.44 | 2801.56 | |||
| 506_57 | 1.61 | 42.43 | 55.46 | 87.49 | 168.62 | 1.42 | 370.98 | GR | 1.37 | 386.14 | |||
Table 9.
BGI-Performance summary.
| Sub- catchment | Proposed BGI | Total Inflow mm | Evaporation Loss mm | Infiltration Loss mm | Surface Outflow mm |
|---|---|---|---|---|---|
| 410_1 | IT | 4844.67 | 1.27 | 1101.34 | 3714.33 |
| 410_1 | PP | 386.6 | 4.78 | 17.35 | 54.32 |
| 410_2 | PP | 377.28 | 4.78 | 30.92 | 66.42 |
| 410_3 | IT | 1708.75 | 1.16 | 1024.6 | 660.53 |
| 410_3 | PP | 1002.4 | 4.78 | 30.92 | 692.16 |
| 410_4 | IT | 2634.84 | 1.27 | 1117.92 | 1486.92 |
| 410_4 | PP | 1855.13 | 4.78 | 30.92 | 1540.8 |
| 410_5 | IT | 6547.7 | 1.37 | 1185.24 | 5336.4 |
| 410_5 | PP | 11387.52 | 4.78 | 30.92 | 11079.6 |
| 410_6 | PP | 1294 | 4.78 | 30.92 | 980.64 |
| 410_8 | IT | 3549.85 | 1.35 | 1194.37 | 2320.29 |
| 410_8 | PP | 1190.25 | 4.78 | 24.14 | 864.94 |
| 410_9 | IT | 12866.85 | 1.32 | 1144.39 | 11690.46 |
| 410_9 | PP | 1615.22 | 4.78 | 30.92 | 1307.07 |
| 410_10 | PP | 3701.06 | 4.78 | 17.35 | 3365.88 |
| 410_12 | GR | 767.41 | 4.77 | 0 | 734.88 |
| 410_13 | GR | 3398.68 | 4.77 | 0 | 3372.68 |
| 506_1 | PP | 591.4 | 4.78 | 30.92 | 283.72 |
| 506_30 | GR | 2249.53 | 4.77 | 0 | 2223.72 |
| 506_39 | GR | 908.99 | 4.77 | 0 | 882.8 |
| 506_40 | GR | 459.22 | 4.77 | 0 | 435.02 |
| 506_42 | GR | 774.47 | 4.77 | 0 | 751.18 |
| 506_57 | GR | 346.13 | 4.77 | 0 | 324.43 |
Disclaimer/Publisher’s Note: The statements, opinions and data contained in all publications are solely those of the individual author(s) and contributor(s) and not of MDPI and/or the editor(s). MDPI and/or the editor(s) disclaim responsibility for any injury to people or property resulting from any ideas, methods, instructions or products referred to in the content. |
© 2025 by the authors. Licensee MDPI, Basel, Switzerland. This article is an open access article distributed under the terms and conditions of the Creative Commons Attribution (CC BY) license (http://creativecommons.org/licenses/by/4.0/).
Copyright: This open access article is published under a Creative Commons CC BY 4.0 license, which permit the free download, distribution, and reuse, provided that the author and preprint are cited in any reuse.


