
Submitted:
18 December 2025
Posted:
19 December 2025
You are already at the latest version
Abstract
The growing complexity of BIM (Building Information Model) models leads to perfor-mance issues, extended file loading times, and difficulties in cross-industry coordina-tion. One of the main factors reducing performance are so-called "heavy" library com-ponents (families in Revit), characterized by excessive geometric complexity, a large number of instances, or improper optimization. Currently, the identification of such components is based mainly on the experience of designers and manual inspection of models, which is time-consuming and prone to errors. This article presents a new tool, HeavyFamilies, which automates the detection and analysis of heavy library compo-nents in BIM models. The tool uses a multi-criteria analysis method, evaluating com-ponents based on five key parameters: number of instances, geometry complexity, number of walls and edges, and estimated file size. Each parameter is weighed ac-cording to its impact on model performance. The developed solution has been imple-mented as a pyRevit plugin for Autodesk Revit, offering a graphical interface with a tabular summary of results, a CSV export function, and visualization of detected components directly in the model. Validation of the tool on real BIM projects has demonstrated its effectiveness in identifying components with a weight index exceed-ing the threshold of 200, allowing designers to prioritize optimization efforts. The HeavyFamilies tool is a practical contribution to the field of BIM model optimization, enabling a systematic approach to managing model performance in complex construc-tion projects and supporting the development of smart cities.
Keywords:
BIM (Building Information Modeling)
; HeavyFamilies
; BIM plugin
; BIM components
; BIM models
; optimization
1. Introduction
1.1. Research Background
Building Information Modeling (BIM) has now become standard in the construction industry, enabling the creation of digital representations of building objects containing both three-dimensional geometric data and non-graphical data, linked by high-level relationships [1]. BIM models built by design studios and contractors support the processes of design, coordination, conflict analysis, and building life cycle management, thus contributing to the reduction of design errors and implementation costs [2]. With the increasing complexity of projects, BIM models contain more and more library components, i.e., parametric objects representing structural, installation, or interior design elements [3]. In the very popular Autodesk Revit environment, the dominant BIM tool, such components are referred to as families, which can be instantiated multiple times in the design environment [4].
The performance of BIM models is a key factor influencing the efficiency of design teams, especially in large building or infrastructure projects [5]. Research shows that elements such as model loading time, interface responsiveness, and application stability have a direct impact on user productivity [6,7]. Performance issues are particularly acute in large cross-industry projects, where models can contain hundreds of thousands of elements from different industries [8]. One of the main factors degrading performance are so-called heavy families, i.e., BIM library components characterized by excessive geometric complexity, improper data structure, or inefficient use of graphic resources [9,10].
The geometric complexity of BIM components affects not only the performance of the model itself, but also the processes of rendering (creating visualizations), collision analysis (and subsequent triage), and export to other formats [11]. Components containing thousands of walls, edges, or nested elements can increase the time required for geometric calculations and burden RAM [12]. This problem is particularly important in the context of interdisciplinary coordination, where federated models combine data from architecture, construction, and installation, which can lead to models containing millions of triangles [13].
Previous approaches to BIM model performance management have focused mainly on general modeling guidelines, such as the use of appropriate levels of detail (LoD) (or Level of Information Need, LoIN) or the reduction of unnecessary elements (duplicates, redundant parameters, etc.) [14,15]. Common standards such as ISO 19650 define information requirements for different project phases, but do not provide specific methods for identifying problematic components [16]. Some tools offered by software vendors, such as Revit Model Performance Advisor, provide general optimization guidelines, but do not offer a detailed analysis of individual families in terms of their impact on performance [17].
The scientific literature emphasizes the need for a systematic approach to assessing the quality of BIM components [18,19]. Researchers have proposed various metrics for measuring model complexity, including the number of elements, file size, geometry topology, and relationships between objects [20,21]. However, most of these methods require advanced technical knowledge and manual data processing, which limits their practical application in everyday design work [22]. The development of tools that automate the identification of heavy components is therefore an important direction of research in the field of BIM model optimization [23].
1.2. Research Problem
Despite growing awareness of the importance of BIM model performance, design practice still struggles with the problem of identifying and managing heavy library components. Currently, designers rely mainly on intuition and experience to assess which families may cause performance issues [24]. This process is reactive, as problems are usually only detected when the model becomes so large that it requires significantly better hardware resources to handle it, or when the model loading time exceeds acceptable limits. This approach very often leads to the need for time-consuming corrective actions in advanced stages of the project, when making changes is much more costly and risky.
The lack of objective criteria for assessing the weight of components is a significant barrier to the systematic optimization of models. Various aspects affecting performance, such as geometric complexity, number of entities, nested family structure, or graphical representation detail, are difficult to assess without dedicated analytical tools. Designers are often unaware that a seemingly small BIM library component, duplicated dozens or hundreds of times in a model, can have a greater impact on performance than a single, geometrically complex family [25]. This asymmetry of information leads to situations where model optimization is done by trial and error, without the ability to prioritize actions based on the actual impact of individual components.
The problem is particularly evident in multi-disciplinary (federated) projects, where different teams, e.g., architectural, structural, and MEP, create component libraries according to their own standards and requirements, often without considering their impact on the federated model [26]. Component libraries developed in isolation (often by building material manufacturers) may contain elements that are suboptimal in terms of performance, which are then reused repeatedly in different projects, propagating the problem throughout the organization. The lack of tools for automatic analysis and validation of components before they are included in corporate libraries leads to the accumulation of the problem in BIM resources.
An additional challenge is the lack of transparency in the evaluation of components obtained from external sources, such as manufacturer libraries or publicly available online repositories. These components, although functionally correct, may be modeled without taking performance constraints into account, containing unnecessary geometric details (over-modeling), improperly configured levels of detail, or inefficient data structures. Designers who include such components in their models are unable to quickly assess their quality and potential impact on project performance.
Existing tools, such as the built-in performance analyzers in Revit software, provide only general guidance for the entire model, without the ability to analyze and compare individual families in detail. There is a lack of solutions offering multi-criteria evaluation of components with the ability to export results, visualize them in the model, and support decisions on prioritizing optimization actions. This tool gap is a significant barrier to the development of a culture of systematic BIM model optimization in the construction industry.
1.3. Research Gap and Purpose of the Work
An analysis of literature and design practice indicates a significant gap in tools supporting automatic, multi-criteria assessment of the severity of BIM library components. While there are general guidelines for model optimization [27] and tools for analyzing performance at the project level, there is a lack of solutions that enable the systematic identification and quantification of the impact of individual families on model performance. Existing approaches are either too general or require advanced programming knowledge and manual data processing, which limits their application in everyday design practice.
Existing research focuses mainly on individual aspects of component evaluation, such as geometric complexity or file size, neglecting a comprehensive analysis that takes into account the interaction of various factors affecting performance [28]. There is also a lack of defined metrics that allow for an objective comparison of library components and the establishment of thresholds for classifying families as "heavy." In addition, few solutions offer direct integration with popular BIM environments, which hinders their adoption by practitioners in the construction industry.
The aim of this work was therefore to develop and validate a tool for the automatic identification of heavy library components in BIM models, using a multi-criteria analysis method. The developed tool was designed to enable:
- Automatic evaluation of components based on a defined set of criteria covering both geometric aspects (number of walls, edges, solids) and contextual aspects (number of instances in the project, estimated size);
- Quantification of the impact on performance by calculating an aggregate weight index that considers the weights of individual criteria;
- Visualization of results in tabular form with sorting and filtering capabilities and direct highlighting of problematic components in the BIM model;
- Export of data to CSV format for further analysis, documentation, and support of optimization decision-making processes;
- Easy integration with the popular Autodesk Revit ecosystem through implementation as a pyRevit plugin, ensuring the tool's availability without the need to install additional software.
The HeavyFamilies tool is designed to fill an identified gap by providing BIM designers with a practical instrument to support systematic model performance management early in the project (data acquisition stage). The proposed multi-criteria evaluation method is an innovative approach to the classification of library components and enables the prioritization of optimization activities based on objective and measurable criteria. In a broader perspective, the tool can contribute to the development of a culture of proactive BIM resource quality management in design organizations and support the standardization and validation of component libraries.
2. Materials and Methods
2.1. Research Approach and General Assumptions
This study adopts a design science research approach, focusing on the development of a specific technological tool, called HeavyFamilies, which solves an identified practical problem in the field of BIM model management [29]. The research methodology comprises four main stages: (1) analysis of requirements and definition of component evaluation criteria, (2) design and implementation of the tool, (3) validation on real BIM models, and (4) evaluation of the usability and effectiveness of the solution. The basic assumption is that the weight of a BIM library component cannot be assessed based on a single parameter (e.g., the degree of geometric complexity) but requires a multi-criteria analysis that considers both intrinsic characteristics (geometric properties of the component) and contextual characteristics (how it is used in the project). A component with relatively simple geometry but occurring in thousands of instances may have a greater impact on model performance than a geometrically complex family occurring singly. Similarly, components with a high number of faces and edges burden the rendering engine regardless of the number of instances. The HeavyFamilies tool was developed with the following design assumptions in mind:
- Automation and efficiency: Model analysis must be fully automated, requiring no programming knowledge or manual parameter configuration from the user. Analysis time should be proportional to the number of family instances in the model, allowing for practical application even in large projects.
- Transparency of methodology: The user should be able to see how the weight index is calculated and interpret the results in the context of specific criteria. The tool provides detailed source data (number of instances, geometries, walls, edges) in addition to the aggregated index.
- Integration with the existing BIM ecosystem: The tool is implemented as a native plugin for the pyRevit platform, providing direct access to the Autodesk Revit API and integration with the software's user interface. This approach eliminates the need to export data to external analytical tools.
- End-user focus: The graphical interface has been designed in accordance with user experience design principles, offering intuitive navigation, clear visualization of results, and decision-making support features (sorting, filtering, visualization in the model).
- Extensibility and documentation: Analysis results can be exported to CSV format, enabling further processing, integration with reporting systems, and the creation of performance metrics in the context of multiple projects or overtime.
The functional scope of the tool covers three main use cases: (1) performance diagnostics of existing BIM models with the ability to identify components requiring optimization, (2) quality validation of components before their inclusion in corporate libraries, and (3) comparative analysis of alternative families representing the same building element, supporting decisions on the selection of the most effective modeling solution.
2.2. Analysis Criteria and Evaluation Model
The BIM library component weighting model is based on five key criteria, identified through literature review and consultation with AECOO (Architecture, Engineering, Construction, Owner Operator) industry practitioners. Each criterion represents a different aspect of a component's impact on model performance and has been assigned a weight reflecting its relative importance.
Criterion 1 is the Instance Count, which represents the number of occurrences of a given family in a project. This is a contextual criterion that considers the fact that even a geometrically simple family becomes problematic when it is duplicated multiple times. In the evaluation model, it is weighted w₁ = 0.2 (20%), reflecting the linear impact of the number of instances on RAM load and object data processing time. This criterion is normalized relative to the maximum number of instances in the analyzed model.
Criterion 2 is geometric complexity (Geometry Count), which determines the number of basic geometric objects (solids, surfaces, curves) that make up the definition of a family. High geometric complexity directly translates into the time required for geometric calculations, logical operations (e.g., collision detection), and rendering [30]. This criterion is given the highest weight w₂ = 0.3 (30%) because it affects both interactive performance (interface responsiveness) and computational performance (analysis time). Geometric complexity is measured by recursive inspection of the geometric hierarchy of the family, considering nested components.
Criterion 3 is the number of faces (Face Count), which represents the total number of flat and curved surfaces defining the boundaries of solids in a component. Faces are the basic element of rendering and surface and volume calculations. Many faces, especially when combined with a high number of instances, leads to an exponential increase in the number of triangles in the rendered scene. This criterion is weighted w₃ = 0.2 (20%).
Criterion 4 is the Edge Count, which determines the total number of edges (wall intersections) in the component geometry. Edges affect file size, topological complexity, and the processing time of geometric operations. Due to its lower impact on interactive performance compared to walls, this criterion is weighted w₄ = 0.1 (10%).
Criterion 5 is Estimated Size, which is an approximate measure of a component's impact on the project file size, calculated as a combination of geometric complexity and the number of topological elements. Due to the difficulty of accurately measuring the size of a single family in Revit memory, an approximation function (1) was used:
This criterion is weighted w₅ = 0.2 (20%), reflecting its impact on file loading time and disk space requirements.
The aggregate Weight Score is calculated as the weighted sum of the normalized criterion values (2):
where all criterion values are expressed in absolute values (without normalization to the range [0,1]), which allows for direct interpretation of the result. Families with a Weight_Score ≥ 200 are classified as "heavy" and require special attention in the optimization process. This threshold was set empirically based on the analysis of test projects and consultations with BIM experts.
2.3. Tool Architecture and Implementation
The HeavyFamilies tool was implemented as a plugin for the pyRevit platform (an open-source framework that extends the functionality of Autodesk Revit through Python scripts and integration with the .NET API) [31]. The choice of pyRevit as the implementation platform was dictated by three key factors: (1) native integration with the Revit API enabling direct access to model geometry and metadata, (2) a simplified process of plugin distribution and installation by end users, and (3) the widespread adoption of pyRevit in the BIM user community, which increases the tool's accessibility.
The tool's architecture consists of four main modules:
- 1)
- The geometry analysis module, which is responsible for extracting geometric data from family instances. It uses the Revit Geometry API to traverse the geometric hierarchy of components, identifying and counting solids, walls, and edges. The implementation includes support for nested families through recursive inspection of geometry instances (GeometryInstance). The module uses DetailLevel.Fine to ensure a complete analysis of the geometry available in the model.
- 2)
- The data aggregation module collects statistics for each unique family in the project, combining the geometric data from the first instance encountered with the family occurrence counter in the model. It uses a dictionary structure to efficiently group data by family name, ensuring O(n) computational complexity for n instances in the model. After the iteration is complete, the data is converted to FamilyData class objects that encapsulate the logic for calculating the weight index.
- 3)
- The user interface module implements a graphical interface based on Windows Forms (.NET), presenting the results in a sorted table. The interface offers row coloring functions according to severity thresholds (red for Weight_Score ≥ 200, orange for 100 < Weight_Score < 200), which increases the readability of the results and supports quick identification of problematic components. The implementation uses the DataGridView control from with configurable columns representing individual criteria and an aggregated indicator.
- 4)
- The export and visualization module provides two key functionalities: (1) exporting results to CSV format with UTF-8 BOM encoding, ensuring correct reading of Polish characters in Microsoft Excel, and (2) visualization of selected families in the model by applying graphic overrides (OverrideGraphicSettings), highlighting instances in red with bold lines. The visualization function uses Revit API transactions to modify view settings while maintaining the ability to undo changes.
The implementation has been optimized for the performance of large model analysis. Geometry is extracted only for the first instance of each unique family, if all instances of the same family share the same geometric definition. This approach reduces computational complexity from O(n × m) to O(u × m), where n is the number of all instances, u is the number of unique families, and m is the average geometric complexity of a family. In typical BIM projects, the ratio u/n is 1:50 – 1:200, which provides a significant speedup in analysis.
The tool's source code is modular and documented, which allows it to be extended with additional analysis criteria or integrated with other BIM model quality management systems.
2.4. User Interface and Functionalities
The HeavyFamilies tool user interface has been designed in accordance with user-centered design principles, prioritizing intuitive operation and efficiency in making optimization decisions. The tool is launched as a button in a custom pyRevit tab in the Autodesk Revit interface (ribbon), ensuring consistency with the native working environment of BIM users.
Once launched, the tool initiates the analysis process, the progress of which is communicated to the user via messages in the pyRevit console. The messages include: (1) process initialization ("Heavy Families Analysis"), (2) start of model scanning ("Scanning model..."), (3) number of family instances found, (4) periodic updates on processing progress every 100 instances ("Processed X/Y..."), and (5) confirmation of analysis completion ("Analysis completed!"). This feedback mechanism is particularly important in the context of large models, where the analysis can take from a few seconds to several minutes.
After the analysis is complete, the results are presented in a modal dialog box containing a results table and a function panel. The interface consists of the following components:
- 1)
- The results table (DataGridView), which is the central element of the interface, presenting all analyzed families in tabular form. The table columns represent: (1) Family Name, (2) Revit Category, (3) Number of Instances, (4) Number of Geometries, (5) Number of Faces, (6) Number of Edges, (7) estimated size (Size Est.), and (8) calculated weight score (Weight Score). The table is sorted in descending order by weight score by default, allowing the user to immediately identify the most problematic components. The user can change the sorting by clicking on the header of any column, which allows for analysis of the data from different perspectives (e.g., families with the highest number of instances, highest geometric complexity).
- 2)
- Row coloring: Table rows are automatically colored according to two severity thresholds, implementing a visual alert system. Families with Weight_Score ≥ 200 are marked with a bright red background color (RGB: 255, 200, 200), signaling a critical severity level requiring immediate attention. Families with a Weight_Score between 100 and 200 are marked with an orange background (RGB: 255, 240, 200), indicating a moderate level of severity that should be monitored. This semantic color coding supports quick visual interpretation without the need to analyze numerical values.
- 3)
- The statistics panel is located below the table and displays aggregated information in text form: "Analyzed X families | Y classified as HEAVY (weight score ≥ 200)". This statistic provides the user with context regarding the scale of the problem in the analyzed model – the percentage of heavy families relative to the total number of unique families is a key metric for the quality of the component library.
The export and visualization functions, on the other hand, are a complex interface offering four action buttons:
- 1)
- Export to CSV – initiates a file save dialog, allowing the full analysis results to be exported to a CSV format with a semicolon separator and UTF-8 BOM encoding. The exported file contains all data columns visible in the table, allowing for further analysis in tools such as Microsoft Excel, Power BI, or data analysis languages (Python, R). After saving, the tool automatically opens the folder containing the exported file, optimizing the user's workflow.
- 2)
- Highlight Selected – after selecting a row in the table and activating this function, the tool closes the dialog box and highlights all instances of the selected family in the active Revit view. The implementation uses the Selection API mechanism to select elements and OverrideGraphicSettings to apply red coloring with a weight of 5, which ensures clear visualization even in densely modeled areas. After the operation is completed, a message is displayed with the number of highlighted instances.
- 3)
- Highlight HEAVY – an advanced feature that automatically identifies all families that meet the Weight_Score ≥ 200 criterion and highlights all their instances in the model. This "big picture" tool allows the user to immediately visualize the spatial distribution of problematic components, which can reveal patterns (e.g., concentration of heavy families in specific areas of the project) that are not visible in a tabular presentation of data. A message after the operation informs about the number of highlighted families and instances.
- 4)
- Close – closes the dialog box without performing any additional operations, allowing the user to return to normal work in Revit with the option to restart the analysis later.
The user workflow has been optimized for typical usage scenarios. For model diagnostics, the user can run the tool, review the sorted table, export the results to a report, and then selectively visualize selected families to evaluate their spatial context. For component library validation, an analyst can compare different versions of the same family, evaluating their relative weight indicators before deciding on the optimal version for the standard design library.
2.5. Validation and Testing Methodology
The validation of the HeavyFamilies tool was carried out in two phases: (1) functional testing to verify the correct implementation of algorithms and the user interface, and (2) usability testing in the context of real BIM projects (Figure 1), assessing the practical value of the tool for end users.
Functional testing included verification of the correctness of geometric data extraction by comparing the results generated by the tool with manual measurements performed on a representative sample of families of varying complexity. The following were tested: (1) the precision of counting family instances, (2) the correctness of recursive inspection of nested components, (3) the accuracy of calculating the number of walls and edges for different types of geometry (extruded solids, free forms, surfaces), and (4) the consistency of weight index calculations in accordance with the defined mathematical model. All functional tests showed 100% compliance with reference values, confirming the implementation correctness of the algorithms.
Additionally, performance tests were conducted on models of varying sizes: (1) small project (133 unique families), (2) medium project (240 unique families), and (3) large cross-industry project (680 unique families). The analysis times were 8 seconds, 35 seconds, and 165 seconds, respectively, on the test bench (Intel Core i7-12700K, 32GB RAM, Windows 11), which was considered acceptable in the context of diagnostic use. The O(n) time complexity was confirmed empirically, and the analysis time scaled relatively linearly with the number of family instances.
Testing was also conducted on tessellated models, i.e., limited to selected smaller views covering a single floor or a single room (Figure 2). This may be helpful for weaker workstations that may have problems handling large BIM models.
Usability testing was conducted with a group of six BIM specialists (BIM managers, BIM coordinators, BIM modelers) with at least three years of experience working with Autodesk Revit. Participants were asked to perform three tasks on a real construction project: (i) identify the three heaviest families in the architectural model, (ii) generate a CSV report, and (iii) visualize all families classified as heavy in the model. All tasks were completed by 100% of participants.
In the qualitative part of the study, participants expressed particular appreciation for the automatic row coloring feature and the ability to directly highlight components in the model, describing these features as "significantly speeding up the diagnostic process" and "eliminating the need to manually search for elements." The development suggestions reported included: (i) the ability to define custom severity classification thresholds, (ii) a function to compare analysis results between different versions of the model (tracking changes over time), and (iii) integration with tools for automatic family optimization.
3. Results
3.1. Tool Installation
The HeavyFamilies tool was packaged as a complete pyRevit plugin with a dedicated installer that automates the implementation process. The installer offers two options: (i) a batch script (.bat) for users who prefer a simple command line installation, and (ii) a PowerShell script with a graphical interface that allows interactive selection of the file source. Upon launch, the installer verifies the presence of pyRevit in the user's system (standard location: %APPDATA%\pyRevit\Extensions), creates the required directory structure (HeavyFamilies.extension\HeavyFamilies.tab\Analysis.panel\HeavyFamilies.pushbutton), and then copies the tool's source files (script.py, icon.png). If an existing installation is detected, the user receives a warning about overwriting files, which allows for easy updates of the tool to newer versions. The entire installation process takes an average of 15-30 seconds and ends with a message instructing the user to reload pyRevit in Revit (the "Reload" function) or restart the application. After reloading, a new "HeavyFamilies" tab appears in the Revit ribbon (Figure 3), containing a button that launches the tool with a dedicated icon (capital letter H).
3.2. Heavy Families Functionality
After launching the tool by clicking the button in the HeavyFamilies tab, an automatic analysis of the active Revit model is initiated. The progress of the analysis is communicated in the pyRevit console through a sequence of text messages (Figure 4, left side): the header "Heavy Families Analysis," the status "Scanning model...," information about the number of family instances found ("Found 133 family instances"), and periodic updates on the progress of processing every 100 instances ("Processed 0/133...", "Processed 100/133..."). After scanning is complete, a confirmation message is displayed ("✓ Analysis completed!"), followed by the automatic opening of a modal results window. In a fairly simple test model containing 133 family instances, the analysis was completed in less than 10 seconds, demonstrating the efficiency of the data processing algorithm. The results window presents a table with eight columns of data (Family Name, Category, Instances, Geometry, Faces, Edges, Size Est., Weight Score), sorted by default in descending order according to the severity index (Figure 4, right side). In the analyzed example, the tool identified components with weight scores ranging from several dozen to over 700 points, with three families exceeding the threshold for classification as "heavy" (Weight Score ≥ 200), which were automatically marked with bright red row coloring. The user can interactively sort the table by any criterion by clicking on the column header, which allows for multidimensional data analysis – for example, identifying families with the highest number of instances or the highest geometric complexity regardless of the aggregated index.
3.3. Preview of Results in 3D View and Export to .csv
The "Highlight Selected" function allows direct visualization of the selected family in the active Revit 3D view. After selecting a row in the table and activating this function, the tool closes the dialog box and applies a red graphic overlay to all instances of the selected family, while simultaneously selecting them in the Revit selection mechanism. The advanced "Highlight HEAVY" function automates the process of visualizing all heavy components. A total of 3 families (4 instances) were highlighted in the analyzed model, allowing for immediate assessment of the spatial distribution of problematic components (Figure 5).
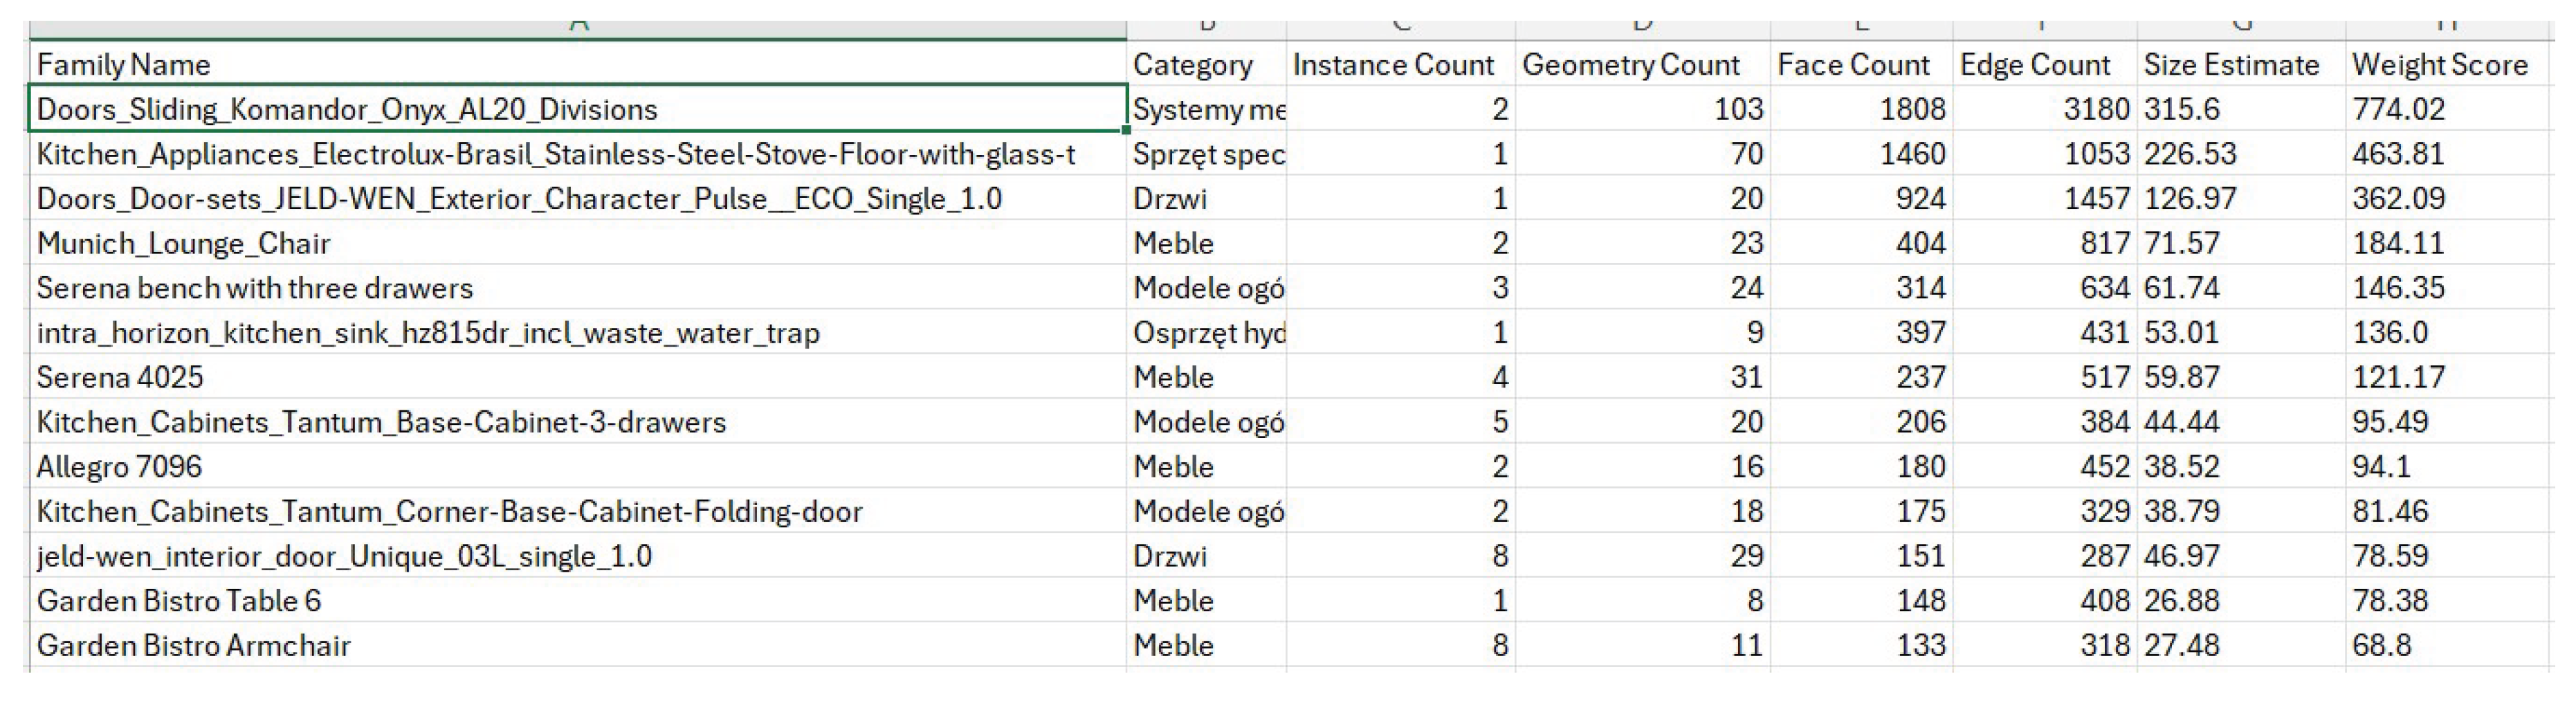
The results are exported to CSV format using the "Export to CSV" button, which initiates the standard Windows file save dialog. The generated CSV file uses a semicolon separator and UTF-8 BOM encoding, ensuring full compatibility with Microsoft Excel and correct display of special characters (Figure 6). The structure of the exported file retains all data columns visible in the graphical interface, with headers in English: "Family Name;Category;Instance Count;Geometry Count;Face Count;Edge Count;Size Estimate;Weight Score". After saving the file, the tool automatically opens the destination location in Windows Explorer, optimizing the user's workflow. The generated CSV report can then be used for further statistical analysis, creating comparative charts, integration with project management systems, or documentation of optimization processes within the ISO 19650 standards [16].
4. Discussion and Conclusions
4.1. Interpretation of Results and Practical Implications
The results of the HeavyFamilies tool validation confirm that multi-criteria analysis of BIM library components is an effective approach to identifying elements that affect model performance. A key finding is the heterogeneity of the causes of component heaviness, as in the analyzed test projects, different families achieved high heaviness indices for different reasons. Some components were characterized by a high number of instances with relatively simple geometry (e.g., MEP fasteners occurred hundreds of times), while others exhibited complex geometry with a small number of instances (e.g., non-standard facade elements with parametric free-form surfaces). This observation justifies the choice of a multi-criteria model instead of a single indicator, as none of the criteria analyzed alone would be sufficient for a comprehensive assessment of a component's impact on model performance.
The practical usefulness of the tool has been confirmed in usability tests. An important practical aspect is the possibility of using the tool not only in the context of diagnosing existing models, but also in quality assurance processes during the creation of corporate libraries. Design organizations can incorporate HeavyFamilies analysis as a standard step in the workflow of validating new components before their acceptance into official libraries, which can prevent the propagation of inefficient modeling solutions across the entire enterprise.
4.2. Limitations and Future Research Directions
The developed tool has certain limitations resulting from the design assumptions and available Revit API mechanisms. First, the Estimated Size criterion is an approximation based on geometric complexity rather than a direct measurement of memory allocation by a component in Revit's internal structures. The lack of a public API for extracting precise data on the size of families in memory prevents the implementation of a more accurate indicator, although validation tests suggest that the approximation used correlates well with the observed impact on performance. Second, the current implementation does not consider some advanced aspects that affect performance, such as the complexity of parametric formulas, the number and type of constraints in the family definition, or the presence of nested shared parameters. Extending the evaluation model with these additional criteria may increase the precision of identifying problematic components, but requires access to the family parameter API, which is possible through the Family API (available after opening the family document in edit mode).
The third limitation is the lack of a mechanism for tracking changes over time, as the current version of the tool generates a point report for the current state of the model, without the ability to automatically compare results between different versions or phases of the project. Implementing such functionality would require integration with BIM version control systems (CDE, Common Data Environment, e.g., Autodesk Construction Cloud, ProjectWise) or a mechanism for archiving historical CSV reports with the ability to visualize trends. Future research should also explore the possibility of using machine learning techniques to automatically predict the impact of a component on performance based on its geometric and contextual characteristics, which could enable the classification of components without the need to actually load them into a test model [33]. Such a predictive model could be trained on large datasets from projects with expert annotations, analogous to methods used in other domains of BIM analysis [34].
The fourth direction of development is to extend the functionality of the tool with optimization suggestions, because currently the tool identifies problematic components but does not provide specific recommendations on how to optimize them. A rule-based system could analyze the specific characteristics of identified heavy families and generate contextual suggestions such as "Consider reducing the level of detail for Coarse views," "247 invisible lines detected, consider removing them," or "Component contains 3 nesting levels: consider flattening the structure." However, implementing such functionality would require a much more advanced semantic analysis of the family structure and integration with tools for automatic geometry modification.
4.3. Broader Context and Contribution to BIM Optimization
The HeavyFamilies tool fits into the broader context of the development of intelligent support tools for BIM processes, where automation and data-driven analysis are replacing traditional approaches based solely on the expert knowledge of designers. In the context of smart cities and the digitization of construction, the ability to systematically manage the quality of digital assets is becoming as important as managing the quality of physical construction processes [35]. BIM models are a fundamental information resource for city infrastructure management systems (CIM – City Information Modeling), and their performance and quality directly affect the analytical capabilities of such systems [36]. As shown by the research of Radziejowska et al. [37,38], the effective use of BIM models in the operational phase requires ensuring the appropriate quality of components already at the design stage, which emphasizes the importance of tools such as HeavyFamilies in the context of the entire life cycle of buildings.
The proposed multi-criteria approach can be adapted to other contexts of BIM component analysis, for example, to assess the information completeness of families in the context of Level of Information (LOI) requirements, to assess compliance with corporate modeling guidelines, or to classify components according to their suitability for specific use cases (design, construction, facility management). The conceptual framework of the tool—automatic extraction of multidimensional features of BIM objects, their aggregation according to a defined evaluation model, and presentation of results in a form that supports decision-making—is a universal pattern that can be applied in various domains of model quality management.
The contribution of this work to the field of BIM optimization includes: (i) defining and validating a multi-criteria model for assessing the severity of library components, (ii) implementing and providing a practical tool that addresses the identified gap in the BIM ecosystem, (iii) empirical verification of the tool's effectiveness in real projects and in the context of its usefulness for end users, and (iv) formulation of methodological recommendations for future research in the field of BIM resource quality management automation. The HeavyFamilies tool, available as an open-source extension for pyRevit, can serve both as a practical solution for design organizations and as a research platform for further experiments with methods of analysis and optimization of BIM components.
Funding
This research received no external funding.
Data Availability Statement
The datasets generated and analyzed during the current study, including the HeavyFamilies tool source code and supplementary materials, are openly available in the Warsaw University of Technology Knowledge Base repository: http://dx.doi.org/10.71724/njm2-1f30
Acknowledgments
The author would like to thank the reviewers for their feedback, insightful comments, and assistance in improving the article.
Conflicts of Interest
The author declares no conflicts of interest.
References
- Sacks, R.; Eastman, C.; Lee, G.; Teicholz, P. BIM Handbook: A Guide to Building Information Modeling for Owners, Designers, Engineers, Contractors, and Facility Managers, 3rd ed.; John Wiley & Sons: Hoboken, NJ, USA, 2018. [Google Scholar]
- Azhar, S. Building Information Modeling (BIM): Trends, Benefits, Risks, and Challenges for the AEC Industry. Leadership and Management in Engineering 2011, 11, 241–252. [Google Scholar] [CrossRef]
- Volk, R.; Stengel, J.; Schultmann, F. Building Information Modeling (BIM) for existing buildings — Literature review and future needs. Automation in Construction 2014, 38, 109–127. [Google Scholar] [CrossRef]
- Borkowski, A.S. File Hygiene and BIM Models Restrictions. Trends in Civil Engineering and its Architecture 2019, 3, 430–435. [Google Scholar] [CrossRef]
- Gu, N.; London, K. Understanding and facilitating BIM adoption in the AEC industry. Automation in Construction 2010, 19, 988–999. [Google Scholar] [CrossRef]
- Singh, V.; Gu, N.; Wang, X. A theoretical framework of a BIM-based multi-disciplinary collaboration platform. Automation in Construction 2011, 20, 134–144. [Google Scholar] [CrossRef]
- Liu, Y.; van Nederveen, S.; Hertogh, M. Understanding effects of BIM on collaborative design and construction: An empirical study in China. International Journal of Project Management 2017, 35, 686–698. [Google Scholar] [CrossRef]
- Porwal, A.; Hewage, K.N. Building Information Modeling (BIM) partnering framework for public construction projects. Automation in Construction 2013, 31, 204–214. [Google Scholar] [CrossRef]
- Kreider, R.G.; Messner, J.I. The Uses of BIM: Classifying and Selecting BIM Uses Version 0.9. Penn State Computer Integrated Construction Research Program 2013. [Google Scholar]
- NBS. National BIM Report 2021; RIBA Enterprises Ltd: Newcastle upon Tyne, UK, 2021. [Google Scholar]
- Borrmann, A.; König, M.; Koch, C.; Beetz, J. Building Information Modeling: Technology Foundations and Industry Practice; Springer: Cham, Switzerland, 2018. [Google Scholar]
- Whyte, J.; Stasis, A.; Lindkvist, C. Managing change in the delivery of complex projects: Configuration management, asset information and 'big data'. International Journal of Project Management 2016, 34, 339–351. [Google Scholar] [CrossRef]
- Hu, Z.Z.; Tian, P.L.; Li, S.W.; Zhang, J.P. BIM-based integrated delivery technologies for intelligent MEP management in the operation and maintenance phase. Advances in Engineering Software 2018, 115, 1–16. [Google Scholar] [CrossRef]
- BIMForum. Level of Development (LOD) Specification Part I & Commentary; BIMForum: Washington, DC, USA, 2021. [Google Scholar]
- AIA. AIA Document G202–2013: Project Building Information Modeling Protocol Form; The American Institute of Architects: Washington, DC, USA, 2013. [Google Scholar]
- ISO. ISO 19650-1; 2018 Organization and digitization of information about buildings and civil engineering works, including building information modeling (BIM) — Information management using building information modeling. International Organization for Standardization: Geneva, Switzerland, 2018.
- Autodesk Inc. Revit Performance Technical Note; Autodesk Knowledge Network: San Rafael, CA, USA, 2023. [Google Scholar]
- Oti, A.H.; Tizani, W. BIM extension for the sustainability appraisal of conceptual steel design. Advanced Engineering Informatics 2015, 29, 28–46. [Google Scholar] [CrossRef]
- Cavka, H.B.; Staub-French, S.; Pottinger, R. Evaluating the alignment of organizational and project contexts for BIM adoption: A case study of a large owner organization. Buildings 2015, 5, 1265–1300. [Google Scholar] [CrossRef]
- Hbeich, E.; Roxin, A.; Bus, N.; Ramirez, A.C. Object detection in BIM: A study of the state of the art in computer vision techniques. Buildings 2023, 13, 153. [Google Scholar]
- Won, J.; Lee, G.; Dossick, C.; Messner, J. Where to focus for successful adoption of building information modeling within organization. Journal of Construction Engineering and Management 2013, 139, 04013018. [Google Scholar] [CrossRef]
- Motawa, I.; Almarshad, A. A knowledge-based BIM system for building maintenance. Automation in Construction 2013, 29, 173–182. [Google Scholar] [CrossRef]
- Matthews, J.; Love, P.E.D.; Heinemann, S.; Chandler, R.; Rumsey, C.; Olatunj, O. Real time progress management: Re-engineering processes for cloud-based BIM in construction. Automation in Construction 2015, 58, 38–47. [Google Scholar] [CrossRef]
- Borkowski, A.S. Introduction to BIM: Philosophy of Building Information Modeling; Warsaw University of Technology Press: Warsaw, Poland, 2024; p. 188p. (in Polish) [Google Scholar]
- Leite, F.; Akcamete, A.; Akinci, B.; Atasoy, G.; Kiziltas, S. Analysis of modeling effort and impact of different levels of detail in building information models. Automation in Construction 2011, 20, 601–609. [Google Scholar] [CrossRef]
- Grilo, A.; Jardim-Goncalves, R. Value proposition on interoperability of BIM and collaborative working environments. Automation in Construction 2010, 19, 522–530. [Google Scholar] [CrossRef]
- Hardin, B.; McCool, D. BIM and Construction Management: Proven Tools, Methods, and Workflows, 2nd ed.; John Wiley & Sons: Indianapolis, IN, USA, 2015. [Google Scholar]
- Kim, H.; Anderson, K.; Lee, S.; Hildreth, J. Generating construction schedules through automatic data extraction using open BIM (building information modeling) technology. Automation in Construction 2013, 35, 285–295. [Google Scholar] [CrossRef]
- Hevner, A.R.; March, S.T.; Park, J.; Ram, S. Design Science in Information Systems Research. MIS Quarterly 2004, 28, 75–105. [Google Scholar] [CrossRef]
- Jiang, S.; Jiang, L.; Han, Y.; Wu, Z.; Wang, N. OpenBIM: An Enabling Solution for Information Interoperability. Applied Sciences 2019, 9, 5358. [Google Scholar] [CrossRef]
- Ehsan Iran-Nejad. pyRevit: Rapid Application Development (RAD) Environment for Autodesk Revit . Available online: https://github.com/pyrevitlabs/pyRevit (accessed on 10 December 2024).
- Brooke, J. SUS: A "Quick and Dirty" Usability Scale. In Usability Evaluation in Industry; Jordan, P.W., Thomas, B., Weerdmeester, B.A., McClelland, I.L., Eds.; Taylor & Francis: London, UK, 1996; pp. 189–194. [Google Scholar]
- Zhang, C.; Arditi, D. Automated progress control using laser scanning technology. Automation in Construction 2013, 36, 108–116. [Google Scholar] [CrossRef]
- Kang, T.W.; Hong, C.H. A study on software architecture for effective BIM/GIS-based facility management data integration. Automation in Construction 2015, 54, 25–38. [Google Scholar] [CrossRef]
- Deng, Y.; Cheng, J.C.; Anumba, C. Mapping between BIM and 3D GIS in different levels of detail using schema mediation and instance comparison. Automation in Construction 2016, 67, 1–21. [Google Scholar] [CrossRef]
- Xu, X.; Ma, L.; Ding, L. A framework for BIM-enabled life-cycle information management of construction project. International Journal of Advanced Robotic Systems 2014, 11, 126. [Google Scholar] [CrossRef]
- Radziejowska, A.; Ciepłucha, W.; Majta, M. BIM model for the operational phase based on available documentation. Arch. Civ. Eng. 2025, 71, 347–363. [Google Scholar] [CrossRef]
- Radziejowska, A.; Ciepłucha, W.; Majta, M. Pilot implementation of a digital building model for operational management. Arch. Civ. Eng. 2025, 71, 365–380. [Google Scholar] [CrossRef]
Figure 1.
An example BIM model used to validate the HeavyFamilies tool. Source: own work.
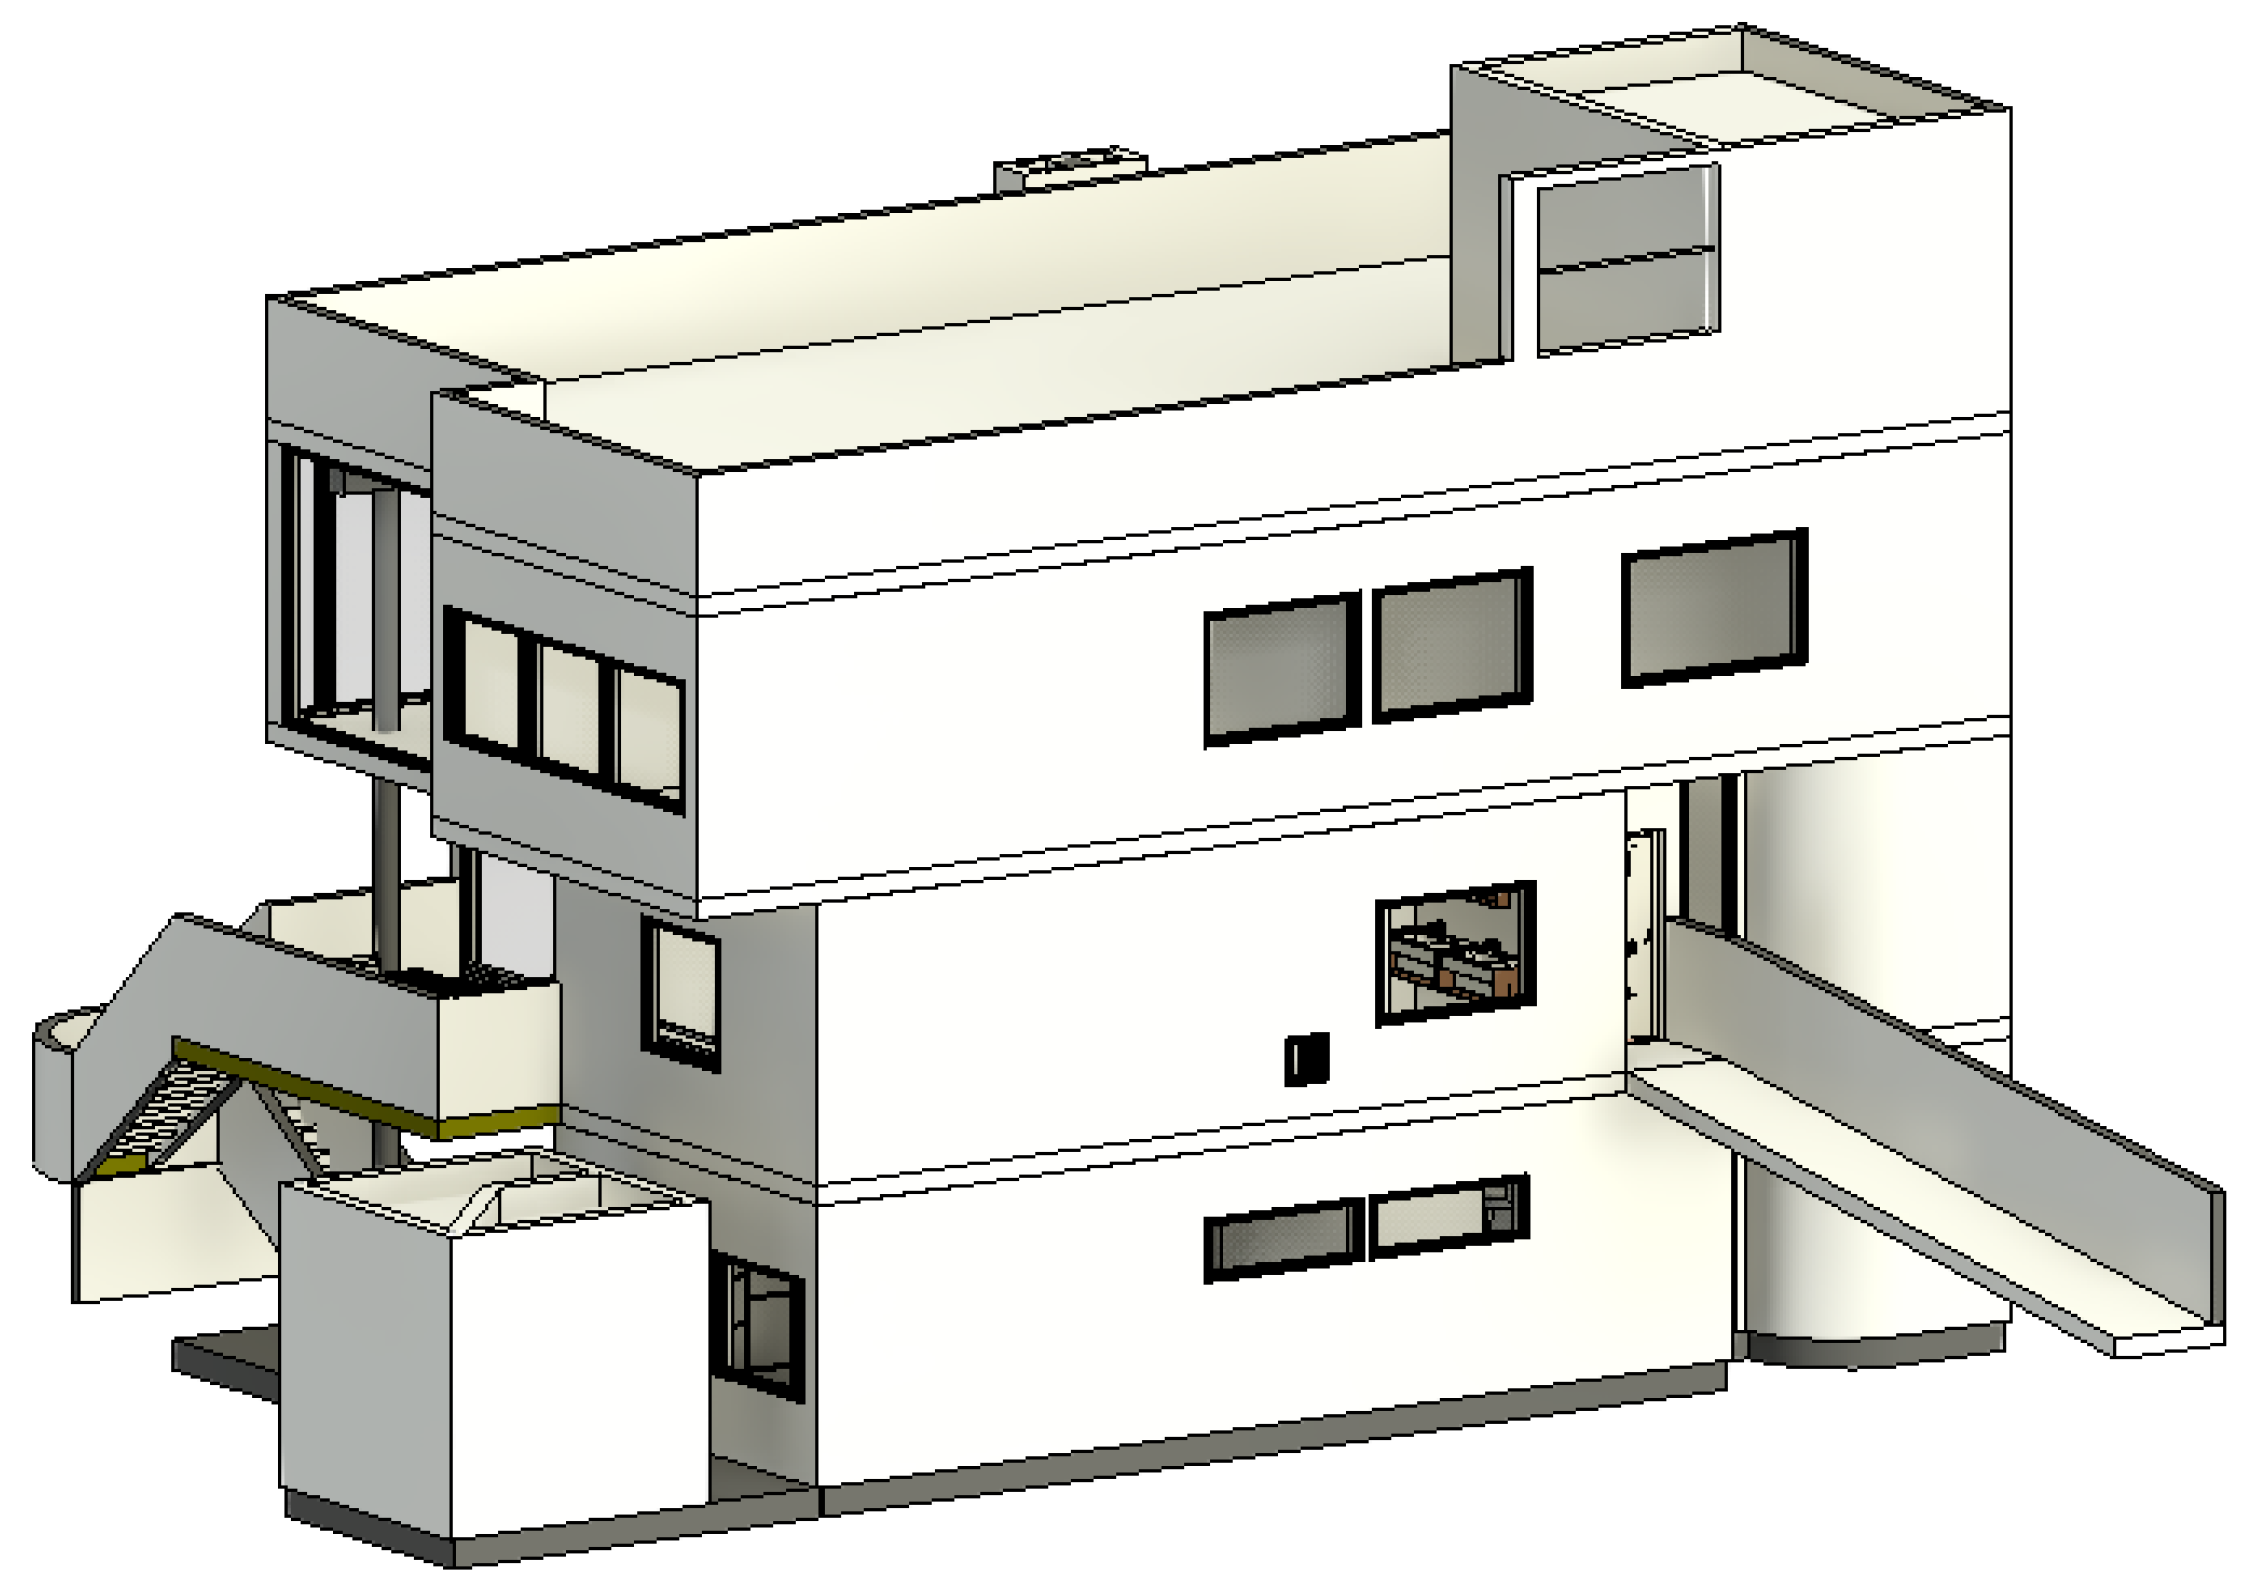
Figure 2.
Limited 3D views – on the left, limited to one floor (ground floor), on the right, limited to one room (living room). Source: own work.
Figure 2.
Limited 3D views – on the left, limited to one floor (ground floor), on the right, limited to one room (living room). Source: own work.
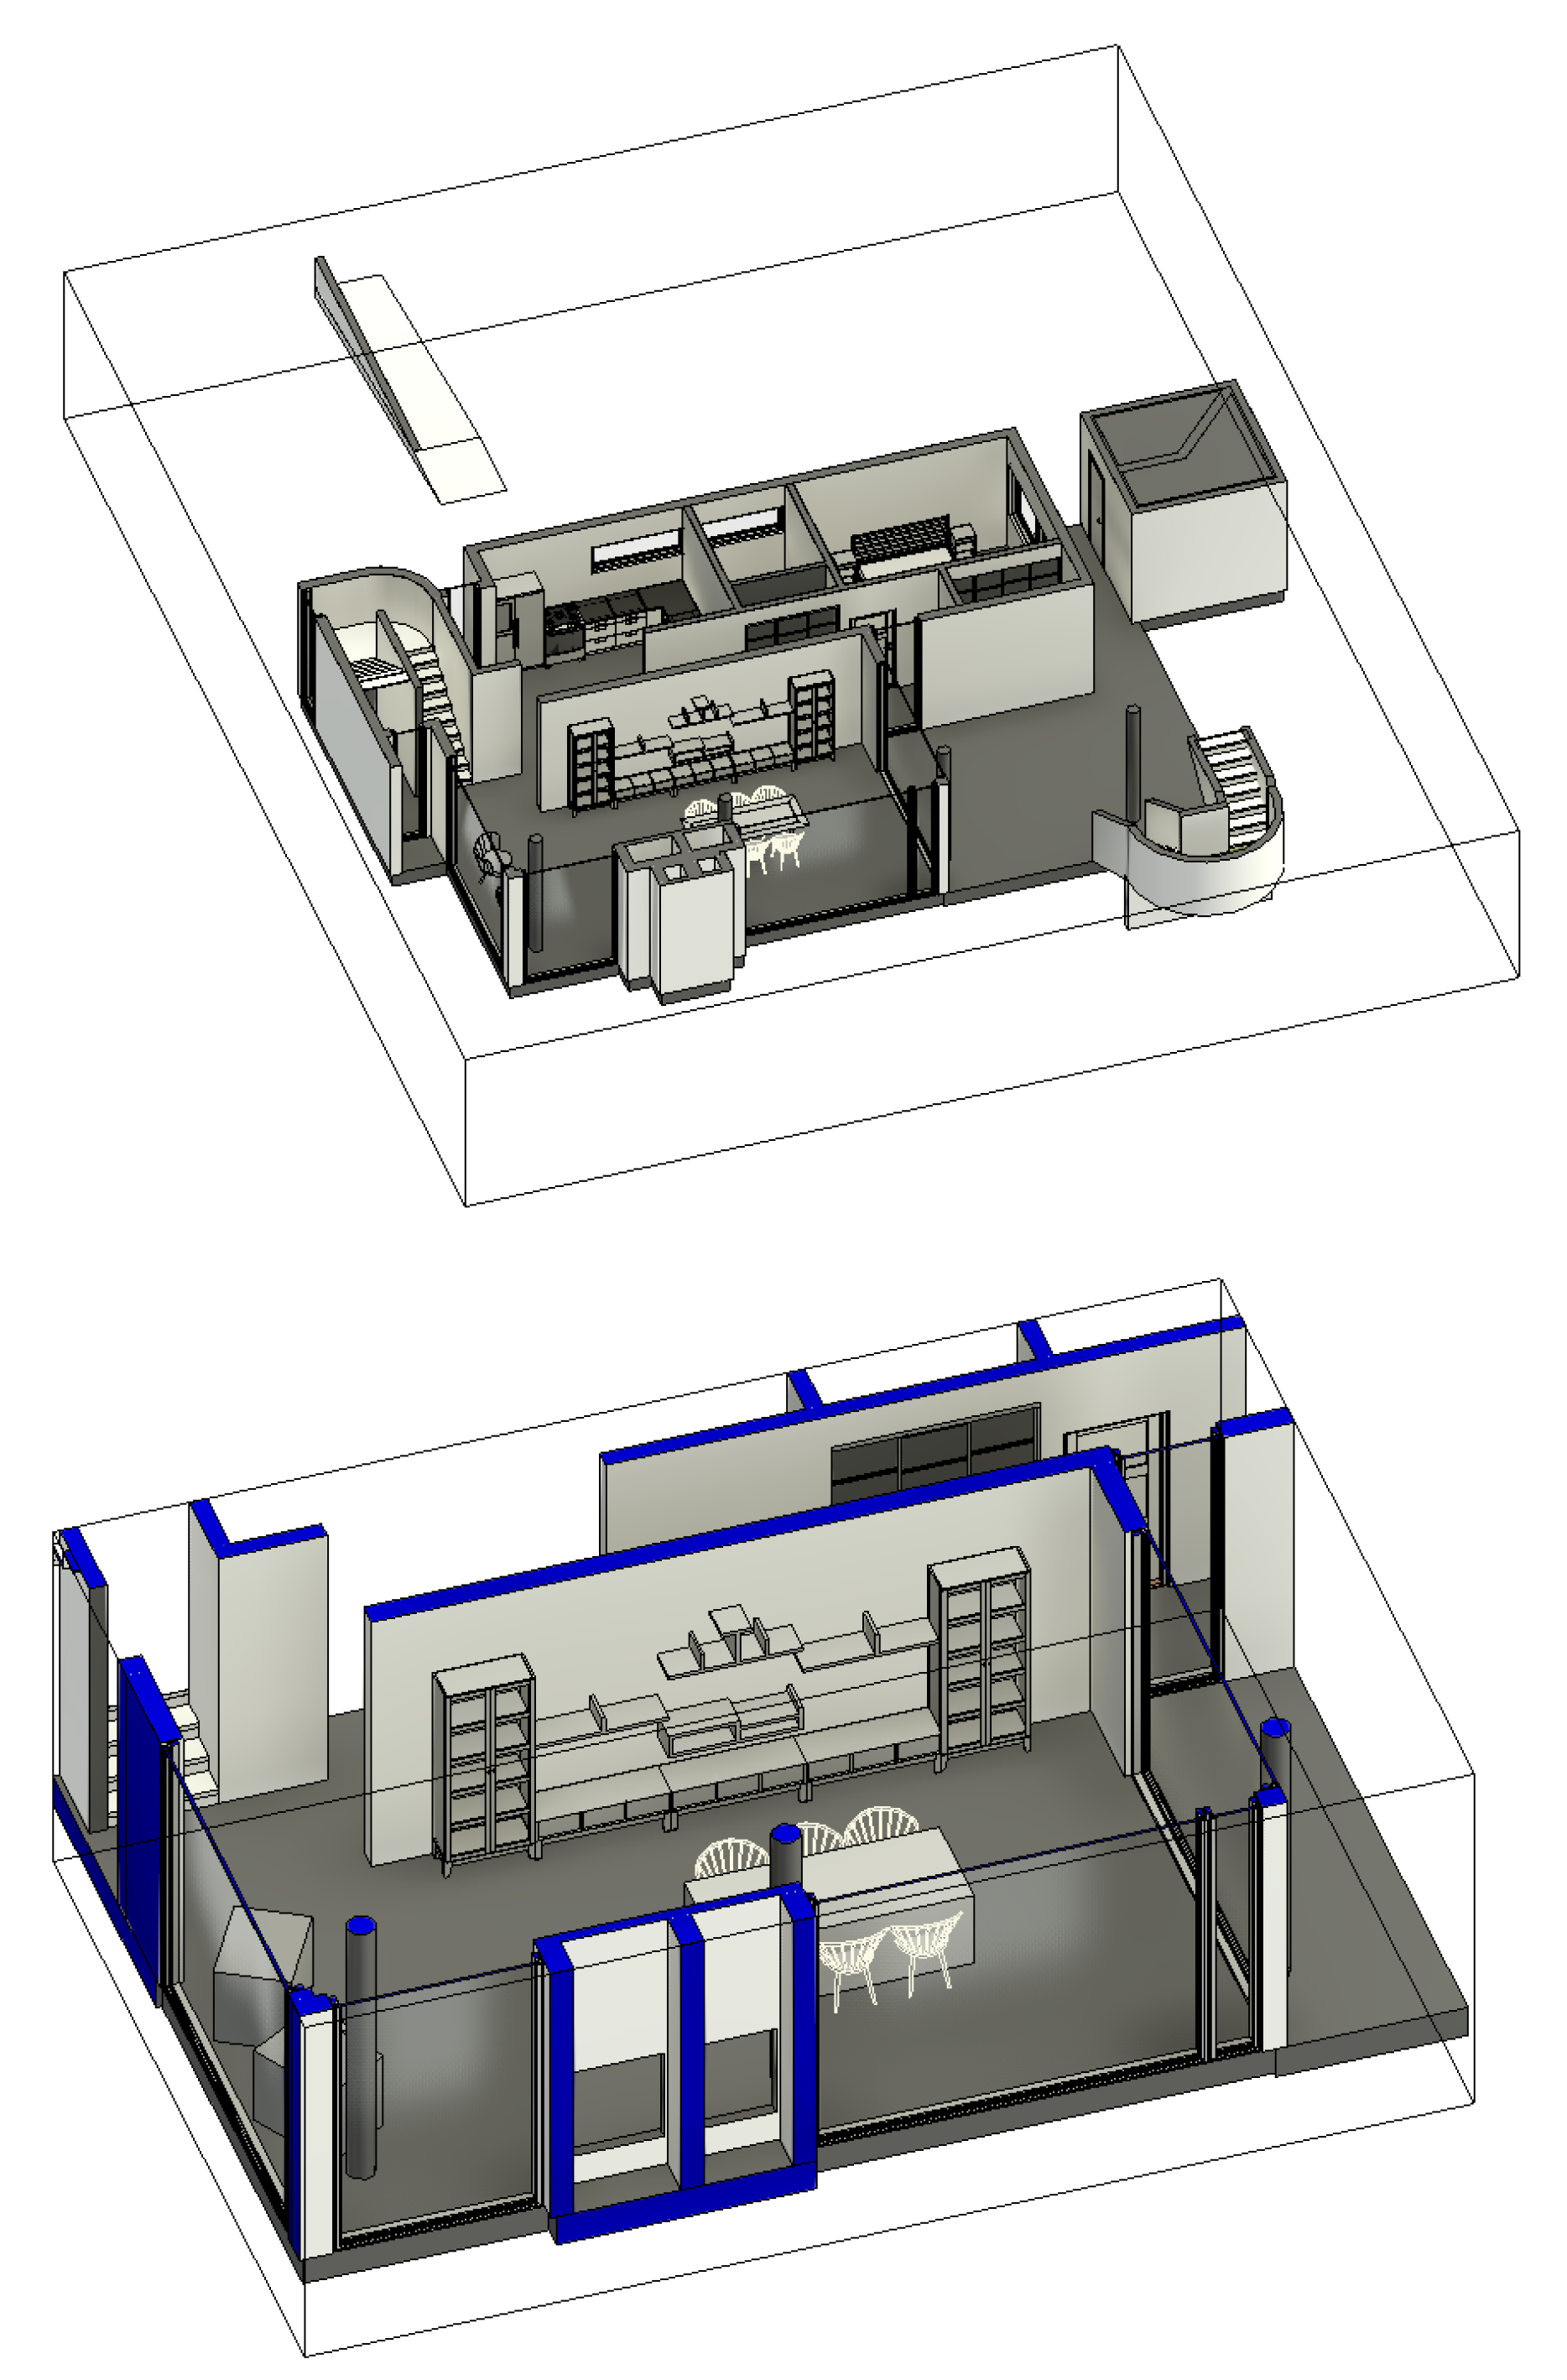
Figure 3.
Access to the Heavy Families tool in Autodesk Revit after installation. Source: own work.
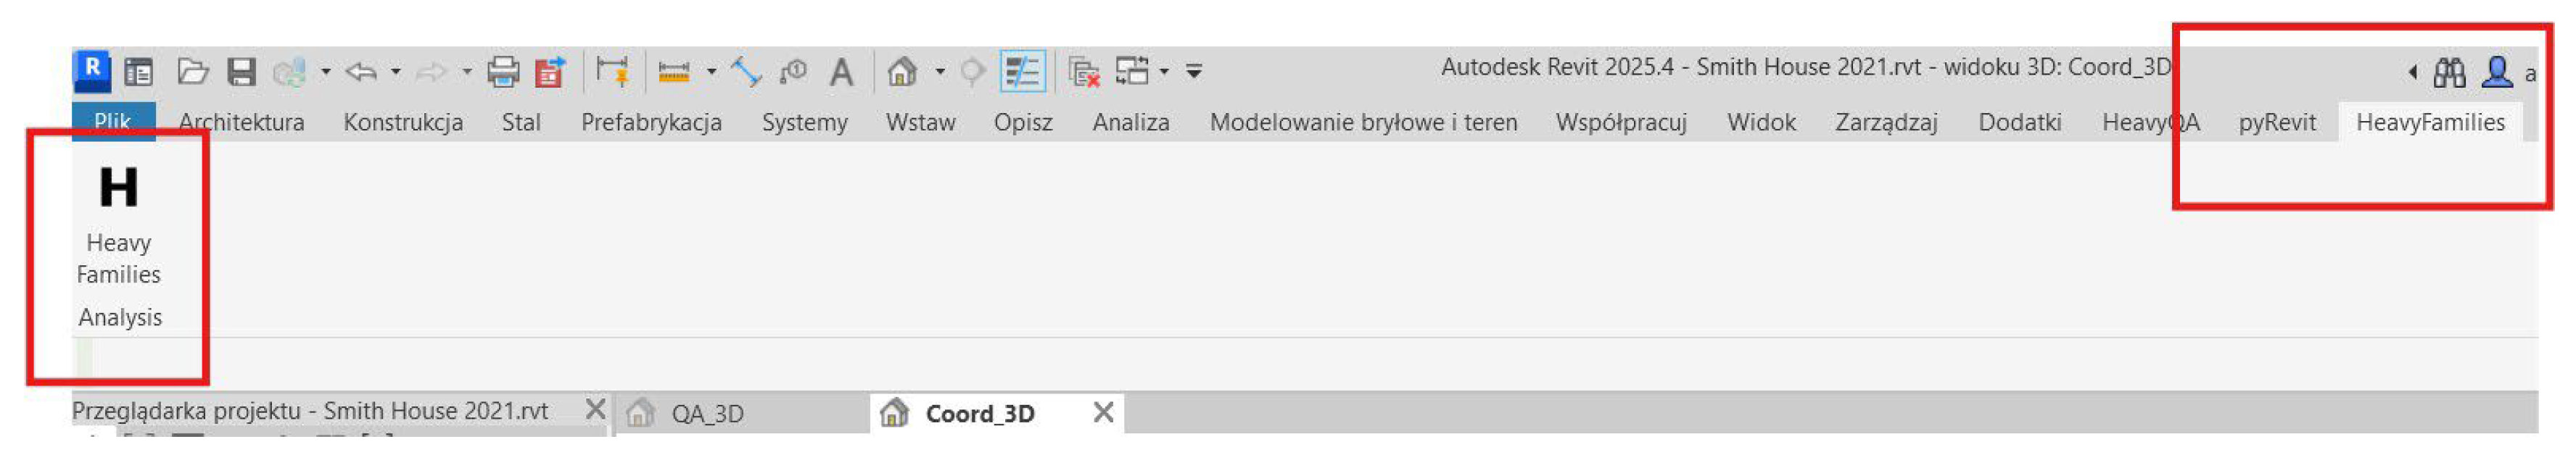
Figure 4.
Preview of the results of the HeavyFamilies tool from the user's perspective. Source: own work.
Figure 4.
Preview of the results of the HeavyFamilies tool from the user's perspective. Source: own work.
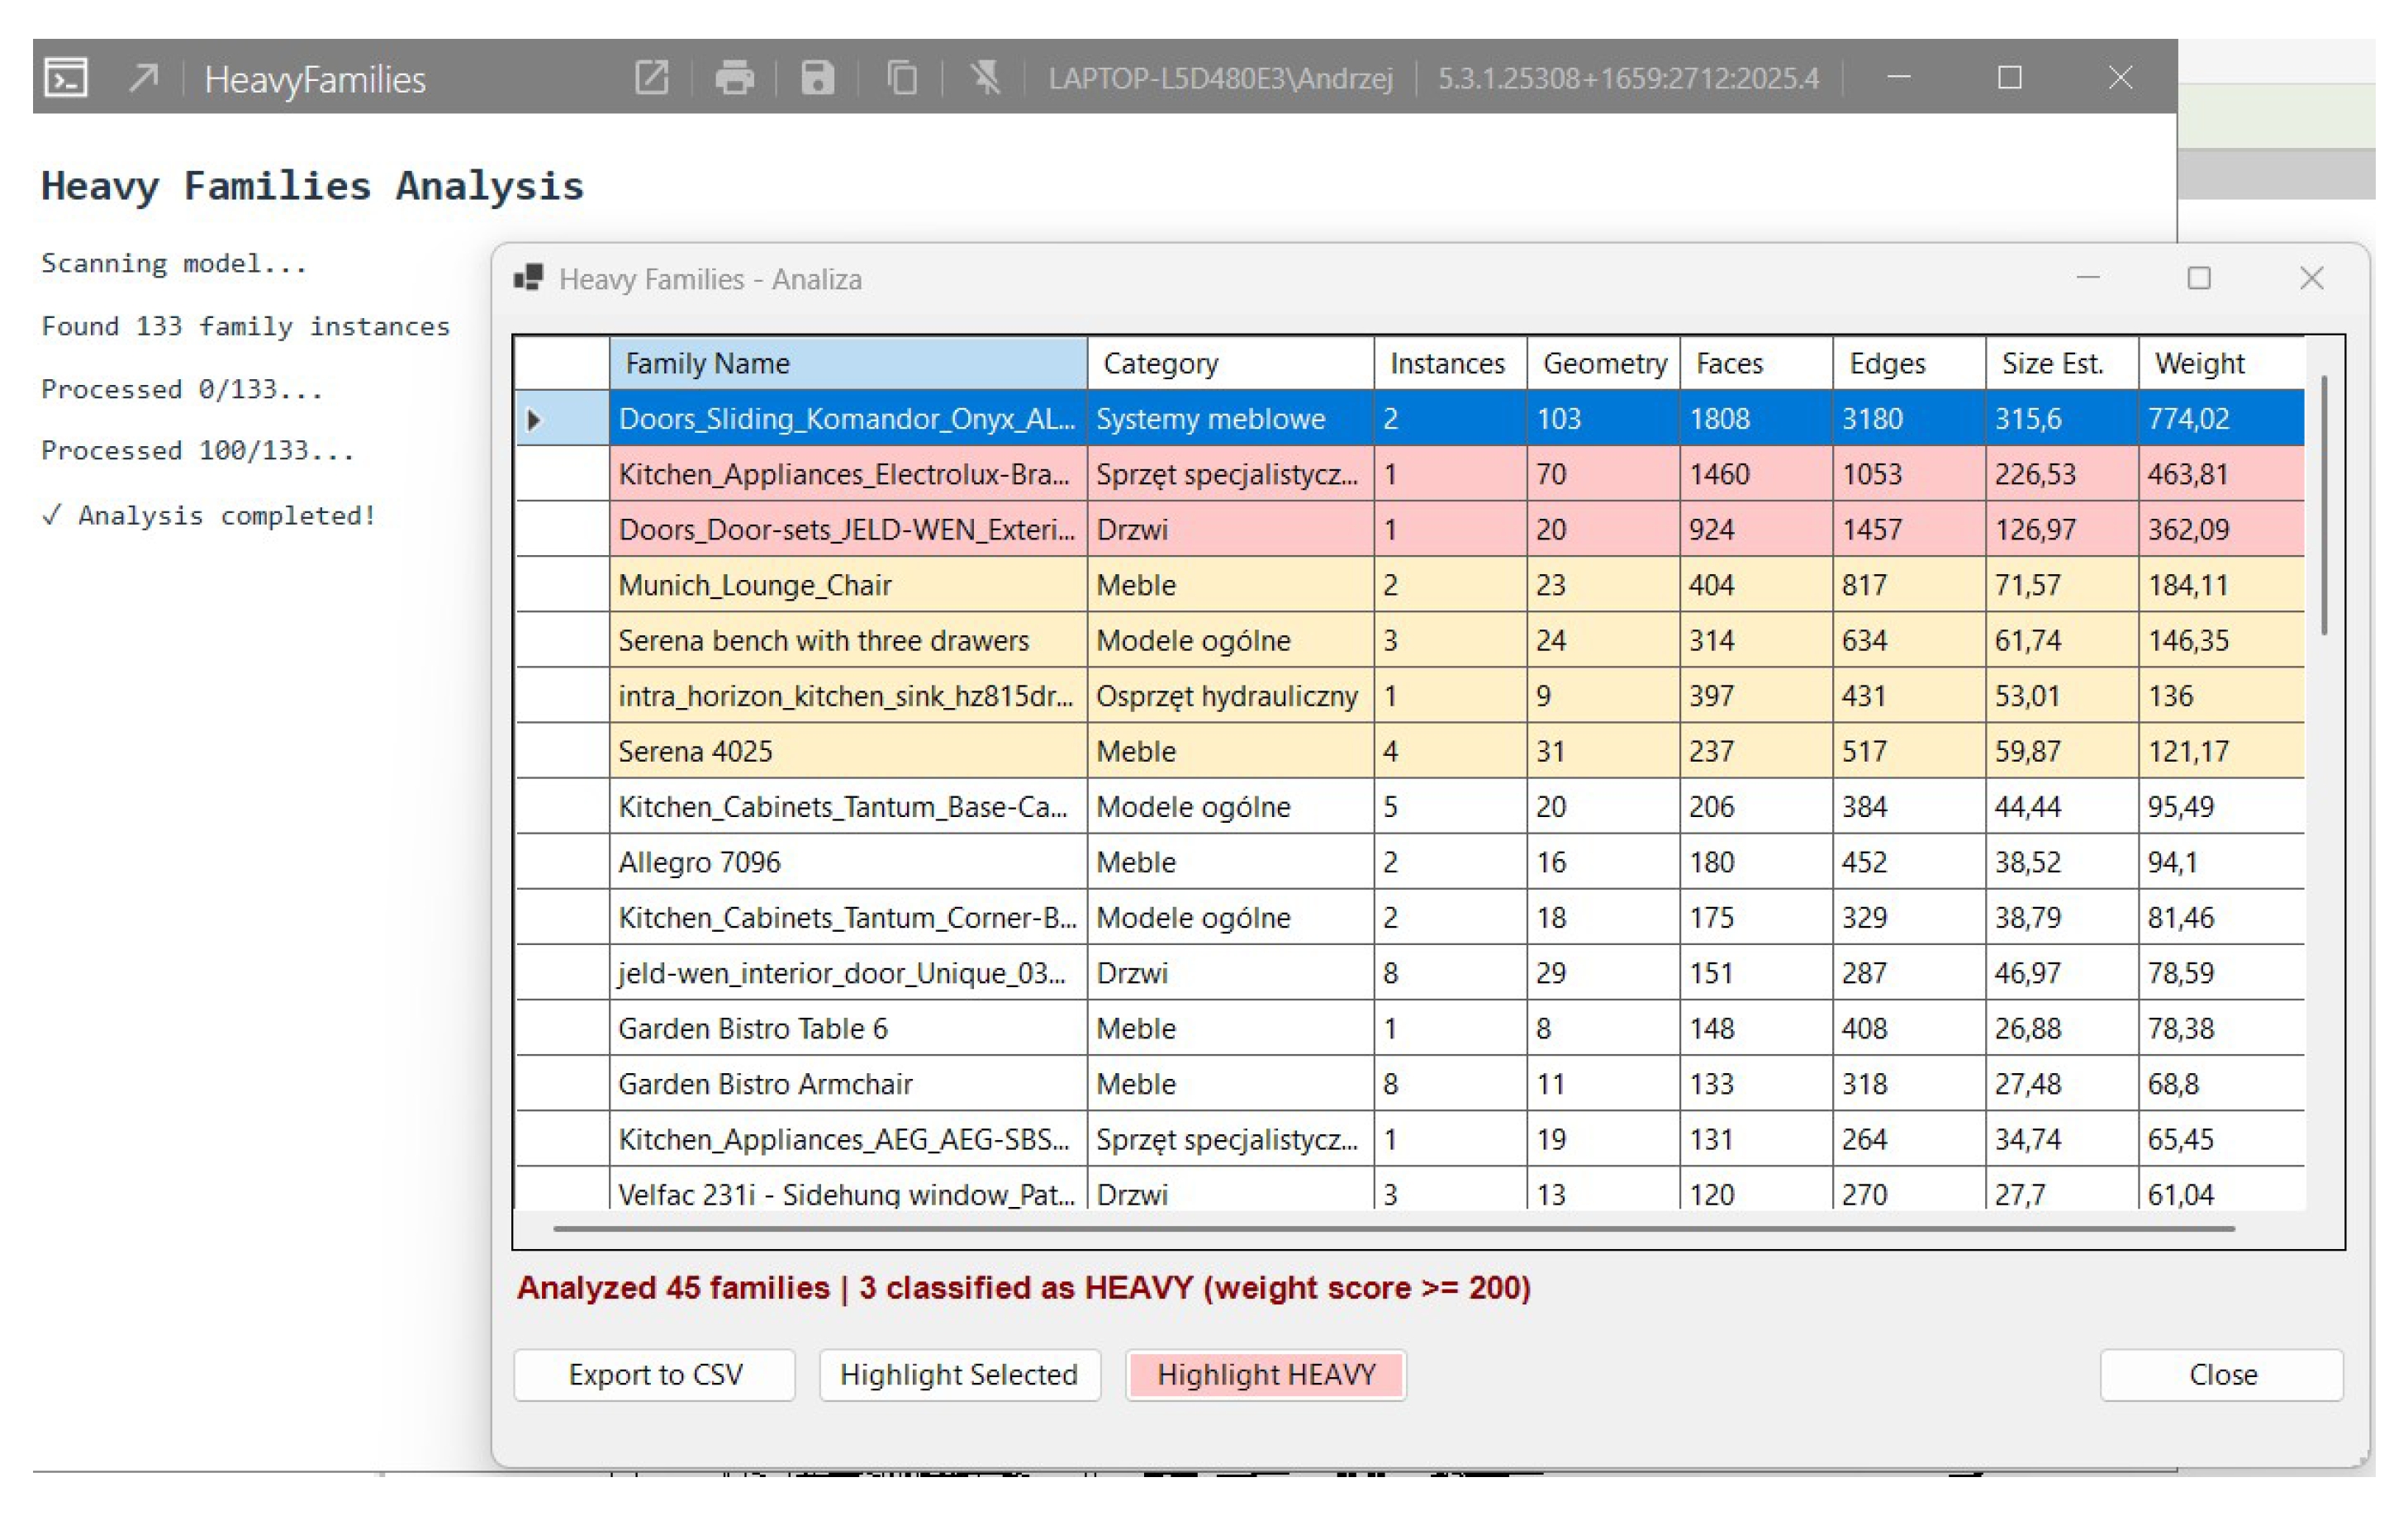
Figure 5.
Highlighting "heavy" objects in red and yellow in the edge view.
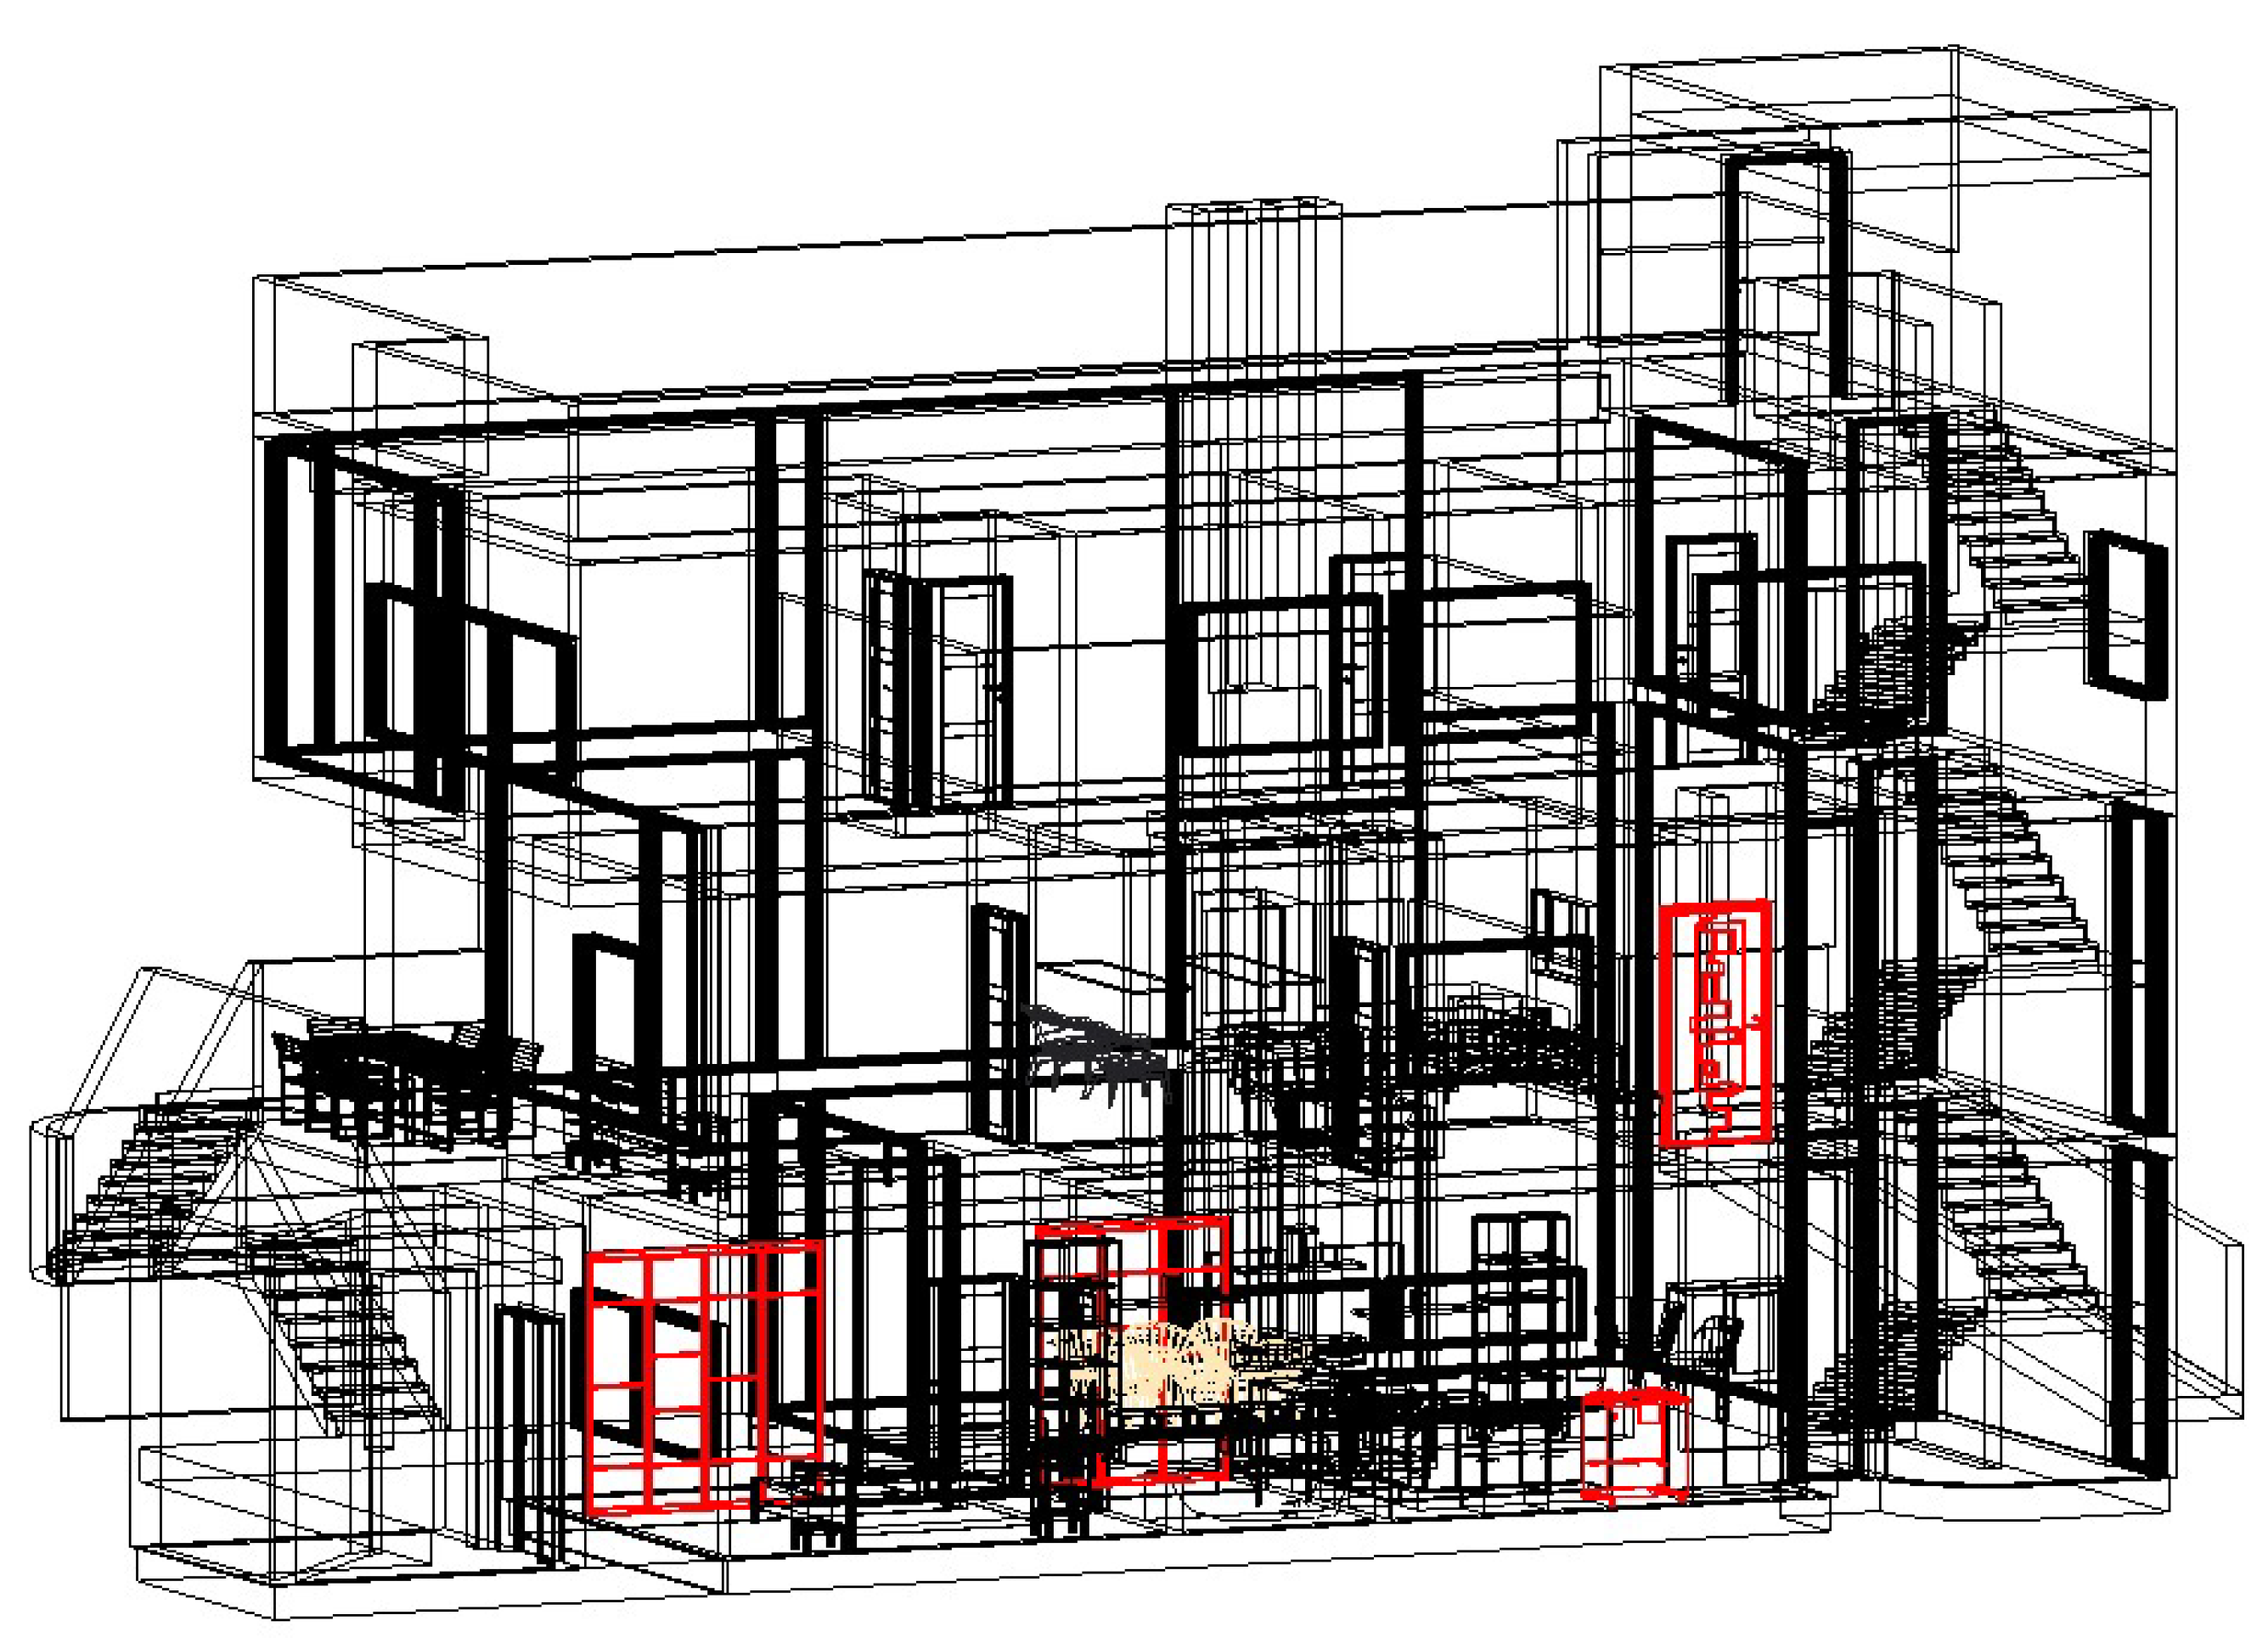
Figure 6.
Exporting results to a .csv file and user view in Microsoft Excel.
Disclaimer/Publisher’s Note: The statements, opinions and data contained in all publications are solely those of the individual author(s) and contributor(s) and not of MDPI and/or the editor(s). MDPI and/or the editor(s) disclaim responsibility for any injury to people or property resulting from any ideas, methods, instructions or products referred to in the content. |
© 2025 by the authors. Licensee MDPI, Basel, Switzerland. This article is an open access article distributed under the terms and conditions of the Creative Commons Attribution (CC BY) license (http://creativecommons.org/licenses/by/4.0/).
Copyright: This open access article is published under a Creative Commons CC BY 4.0 license, which permit the free download, distribution, and reuse, provided that the author and preprint are cited in any reuse.


