
Submitted:
18 December 2025
Posted:
19 December 2025
You are already at the latest version
Abstract
The construction of mass concrete foundations for nuclear power plants faces significant challenges in controlling hydration heat and preventing early-age thermal cracking. This study develops an integrated framework combining high-fidelity thermal-mechanical simulation, real-time temperature monitoring, and construction process optimization to address these issues. Focusing on the VVER-1200 reactor raft foundation in the Xudapu NPP Phase II Project, an innovative center-to-periphery synchronous pouring method is proposed. Numerical simulations demonstrate that this method strategically utilizes construction stage time lags to moderate temperature distribution and reduce thermal stress. Field monitoring data show good agreement with simulated results, which provide conservative and safe estimates for curing guidance. Post-construction verification confirmed the absence of thermal cracks. The proposed methodology offers a reliable, science-based approach for thermal crack mitigation and can serve as a valuable reference for similar large-scale mass concrete structures in nuclear and other critical infrastructure projects.
Keywords:
mass concrete
; nuclear island raft foundation
; thermal cracking
; finite element simulation
; temperature monitoring
; construction process optimization
1. Introduction
As a clean and efficient energy source, nuclear power plays an increasingly vital role in the energy supply of coastal regions in many developed countries [1]. As of the end of December 2024, the global operational nuclear power capacity reached 377 GWe, supplied by 417 reactors across 31 member states. The structural integrity of nuclear power plants (NPPs) under extreme conditions is paramount to national safety, environmental protection, and public confidence [2]. Among the critical structures in an NPP, the reactor containment building (RCB) serves as the final barrier against the release of radioactive materials [3]. Any compromise in its integrity, such as through cracking, could lead to severe consequences, underscoring the RCB’s significance within the plant [4].
The raft foundation of the nuclear island forms the base of the RCB, bearing core functions such as supporting key equipment and resisting extreme loads, including seismic events and thermo-mechanical coupling effects. In the aftermath of the Fukushima nuclear accident, global standards for the seismic and structural performance of NPPs have been significantly heightened. Countries worldwide have since imposed stricter requirements on the technology, safety, and reliability of newly constructed NPPs [5,6].
To enhance the safety margins of NPPs, the design of nuclear island raft foundations has become more conservative in the post-Fukushima era. The concrete used typically has high design strength grades, often C35 or above. For instance, the HPR1000 (Hualong One) reactor uses C40 concrete, the VVER-1200 specifies B40, and the EPR reaches C50. Moreover, the volume of concrete placed in these foundations has seen a marked increase. Examples include 5,050 m³ for the AP1000, 9,266 m³ for the EPR, 11,441 m³ for the high-temperature gas-cooled reactor (HTGR), 15,210 m³ for the CAP1400, 16,366 m³ for the VVER-1200, and 26,057 m³ for the HPR1000.
These large-volume, high-strength concrete placements fall under the category of mass concrete, where significant hydration heat is generated during construction. Without appropriate control measures, this can lead to excessive temperature rises and subsequent harmful thermal cracking [7,8,9,10,11]. The appearance of such cracks in the nuclear island raft foundation may result in serious consequences, including: (1) Risk of radioactive leakage: Cracks can provide pathways for the release of radioactive substances, endangering the environment and public health. (2) Reduction in structural load-bearing capacity: Cracks may diminish the compressive and shear strength of the concrete, compromising the stability of the foundation. Under extreme conditions such as earthquakes, this could potentially initiate progressive failure [12]. (3) Impairment of long-term durability: As NPPs are often built in coastal areas, they are exposed to offshore environmental conditions. Seawater infiltration and chloride ion intrusion through cracks can accelerate reinforcement corrosion, reducing durability and shortening the service life of the structure [13,14,15,16].
Therefore, preventing the occurrence of harmful temperature-induced cracks is a critical technical challenge in the construction of nuclear island raft foundations. Current design codes and construction practices rely on empirical methods and generalized guidelines for thermal control, which may not fully address the complex thermal behavior in such large-scale, high-strength concrete structures. Advanced simulation-based approaches present a promising direction for optimizing temperature management and crack mitigation. This study aims to develop a simulation-based heat transfer optimization framework tailored for mass concrete in NPP construction. By integrating high-fidelity thermal-stress simulation with optimization algorithms, the proposed method seeks to provide a more rational and reliable solution for controlling thermal cracking, thereby enhancing the safety and durability of nuclear island raft foundations.
2. Related Studies on Heat Control in Mass Concrete
Thermal cracking control in mass concrete constitutes a well-established research domain within civil engineering, encompassing numerical, experimental, and field-based investigations. Early approaches predominantly relied on empirical formulations and simplified analytical models to estimate temperature distributions and associated thermal stresses. With the evolution of computational capabilities, finite element analysis (FEA) has emerged as a mainstream methodology for simulating the coupled thermo-mechanical behaviour of mass concrete. For instance, Li et al. [17] developed a numerical model to simulate the propagation of temperature-induced cracks during concrete placement, underscoring the necessity of modelling crack evolution alongside thermal prediction.
Recent advancements reflect a growing integration of field monitoring with numerical simulation to validate and refine predictive models. Li et al. [18] conducted a comprehensive field monitoring case study, illustrating how real-time temperature data can inform the adjustment of curing protocols and mitigate cracking risk. Similarly, Ha et al. [19] proposed an automated curing system that employs real-time thermal feedback to dynamically regulate curing conditions, thereby attenuating thermal gradients and inhibiting early-age cracking.
The optimisation of cooling systems and curing methodologies represents another focal area of research. Lu et al. [20] introduced an innovative hydraulic cooling technique for mass concrete, demonstrating its efficacy in controlling the maximum temperature rise and core-to-surface temperature differential. Zhang et al. [21] systematically analysed factors influencing the temperature field during cement hydration, highlighting the significance of concrete mix proportion, placement temperature, and ambient conditions.
In recent years, artificial intelligence (AI) and machine learning (ML) have emerged as promising tools for predicting concrete properties and optimising thermal management strategies. Oyebisi and Alomayri [22] utilised deep neural networks to predict the compressive strength of slag-ash-based geopolymer concrete, illustrating the potential of AI in performance prediction. Kim and Lee [23] applied machine learning to forecast early-age thermal cracking susceptibility in bridge piers, offering a data-driven framework for risk assessment. Furthermore, Qian et al. [24] and Zhao et al. [25] optimised cooling system parameters via temperature field simulation, thereby enhancing the thermal regulation efficiency in mass concrete structures.
Material modifications, including the incorporation of temperature-rise inhibitors and supplementary cementitious materials, have also been explored for crack mitigation. Chen et al. [26] examined the influence of temperature-rise inhibitors on the thermal and mechanical properties of mass concrete, confirming their role in reducing peak temperatures and enhancing crack resistance.
The long-term durability of mass concrete and its correlation with thermal history have been addressed in several studies. El-Mir et al. [27] established correlations between strength, durability, and time–temperature profiles, emphasising the importance of controlled thermal regimes for ensuring structural longevity. Shen et al. [28,29] investigated the coupled thermal–hygral–mechanical behaviour of mass concrete under active temperature control, providing insights into the multi-physical nature of thermal stress development.
Notwithstanding these developments, a systematic integration of numerical simulation, real-time monitoring, and intelligent control within a unified framework remains lacking, particularly for complex structural systems such as nuclear island raft foundations. This study seeks to address this gap by proposing a holistic methodology that combines high-fidelity thermal–mechanical simulation, automated temperature monitoring, and construction process optimisation to achieve reliable thermal crack control in nuclear power plant applications.
3. Methodology
This study establishes a systematic methodology that integrates numerical simulation, on-site monitoring, and construction process optimization to develop a scientifically informed and effective quality control framework for mass concrete construction in nuclear island raft foundations. The overall workflow is illustrated in Figure 1. This integrated approach enables a comprehensive understanding of the evolution of the temperature field and the characteristics of stress distribution during the construction of mass concrete. On this basis, scientifically grounded temperature control measures and curing regimes are formulated to ensure that the construction quality meets the stringent requirements of nuclear power engineering.
The methodology comprises three core components: (i) Dynamic simulation of hydration heat and coupled thermal-stress analysis for mass concrete.(ii) Real-time temperature monitoring and control during construction.(iii) Optimization of construction processes and techniques.
3.1. Finite Element Analysis – Scientific Prediction
The multi-physics simulation of mass concrete involves establishing a high-fidelity finite element model that captures the coupled thermal-mechanical behavior. This process entails defining material properties (both structural and thermal), boundary conditions, and other relevant parameters to predict the internal temperature and stress fields.
3.1.1. Theoretical Foundation for Temperature Field Simulation
1) Heat Conduction Governing Equation
Assuming the concrete to be homogeneous, continuous, and isotropic, the heat conduction in the cylindrical coordinate system is governed by the following differential equation:
where is the instantaneous temperature (℃), is time(h), is the thermal conductivity (kJ/(m·h·℃)), is the specific heat capacity(kJ/(kg·℃)), is the density (kg/ m³), and is the rate of heat generation per unit volume due to cement hydration(kJ/(h·m³)).
The rate of temperature rise under adiabatic conditions, due to hydration heat, is:
where is the adiabatic temperature rise (℃), is the binder content per cubic meter of concrete (kg/ m³), and is the total hydration heat of the binder(kJ/kg).
Thus, the heat conduction equation can be rewritten as:
2) Hydration Heat Source Function
The hydration heat of cementitious materials significantly influences the transient temperature field. An exponential expression is adopted to model the heat generation rate per unit volume:
where is a constant related to cement type, dosage, and concrete placement temperature.
3) Initial and Boundary Conditions
To solve the temperature distribution problem, the following definite conditions are applied:
i) Dirichlet condition (constant temperature)
The bottom surface in contact with bedrock is assumed to maintain a constant temperature based on prior project experience (set to 18 °C in this study).
ii) Robin condition (convective heat transfer)
Surfaces exposed to air (through insulation or formwork) follow:
where is the surface normal; is the surface heat transfer coefficient(kJ/(m2·h·℃)), and is the ambient temperature (°C).
iii) Interface continuity condition:
At the concrete-bedrock interface, temperature and heat flux are continuous:
3.1.2. Development of the Multi-Physics Coupling Simulation Model
A detailed finite element model was developed based on a real nuclear power project, incorporating concrete mix proportions, thermophysical properties (specific heat, adiabatic temperature rise, thermal conductivity, diffusivity), mechanical properties (elastic modulus, shrinkage, creep, Poisson’s ratio), environmental conditions (ambient temperature, wind speed), and construction details (pouring sequence, rate, layer thickness). This model simulates the coupled temperature-stress-deformation history of the raft foundation.
1) Hydration Heat Dynamic Simulation:
An unsteady-state finite element model simulates the spatiotemporal release of hydration heat, predicting the evolution of the temperature field Key outputs include the maximum internal temperature rise, the core-to-surface temperature difference, and the temperature distribution over time and space, providing direct input for thermal stress analysis.
2) Thermal-Stress Coupled Analysis
Thermal stress arises from constrained thermal deformation. The coupling between the temperature and stress fields is achieved through the following relations:
i) Thermal strain equation:
where is the thermal strain, is the linear expansion coefficient (1/°C), is the temperature difference relative to the placement reference temperature .
ii) Thermo-mechanical constitutive equation
Considering the time-dependent development of concrete properties, an age-dependent linear elastic constitutive model is used:
where is the stress tensor, is the total strain, is the drying shrinkage strain (neglected in pure hydration analysis), and is the age-dependent elastic stiffness matrix. For an isotropic material, is defined by the age-varying elastic modulus and Poisson’s ratio ν(t):
The elastic modulus development is modeled as:
iii) Cracking Risk Assessment:
A cracking risk coefficient is employed for quantitative evaluation:
where is the maximum tensile stress at age ; is the corresponding axial tensile strength, modeled as:
A value of indicates a low cracking risk (95% confidence), suggests potential risk requiring curing optimization, and indicates a high risk of cracking.
3.1.3. Pre-Construction Prediction for Scheme Decision-Making
Based on the simulated temperature and stress fields, the overall construction scheme—including segment division, pouring method, and temperature control plan—is finalized. This enables early identification of potential high-risk zones for excessive temperature differentials or cracking and guides the layout of monitoring instrumentation.
After construction commences, the finite element model is dynamically calibrated by comparing its predictions with real-time temperature data from the site. Model parameters are iteratively adjusted to improve accuracy, and the updated model is used to forecast future temperature and stress trends. This feedback loop allows for real-time optimization of curing measures and temperature control strategies throughout the construction and curing period.
3.2. Temperature Monitoring – Accurate Measurement
While finite element analysis provides a theoretical understanding of the internal temperature and thermal stress development in the nuclear island raft foundation, discrepancies between simulation results and actual field conditions are inevitable. This is primarily due to the inherent difficulty in fully capturing the exact material properties, boundary conditions, and construction dynamics within a computational model. To address this, a comprehensive on-site temperature monitoring regime is essential. This allows for the real-time comparison of measured data with theoretical predictions, enabling continuous calibration of model parameters, refinement of the simulation model, and the timely implementation of corrective temperature control measures. This integrated monitoring-and-calibration approach ensures the reliability of the numerical analysis and, subsequently, enables the optimization of temperature control strategies to guarantee the construction quality of the raft foundation.
3.2.1. Automated Temperature Monitoring System
An automated temperature monitoring system was deployed, comprising a central monitoring platform, data transmission units, data acquisition modules, and embedded temperature sensors (Figure 2 and Figure 3). This system was designed to fulfill three core requirements: real-time monitoring, analytical early warning, and full data traceability. Its key functionalities included: (i) Real-time Visualization: Display of temperature evolution curves and spatial distribution maps of monitoring points. (ii) Intelligent Early Warning: Customizable alert thresholds (e.g., core-surface temperature difference > 25 °C, cooling rate > 2 °C/day) with push notifications via a mobile application to ensure prompt response.
3.2.2. Layout of Temperature Measurement Points
The layout of temperature sensors followed the principle of comprehensive coverage combined with focused monitoring of critical zones. The aim was to accurately capture the maximum temperature rise, internal-to-surface temperature differentials, cooling rates, and ambient temperature within the concrete pour. The monitoring scheme was deployed over one symmetric half of the raft foundation plan. Monitoring points were arranged in a planar grid, and along the thickness direction, sensors were placed at the core, as well as near the top and bottom surfaces (positioned 5–10 cm from the respective concrete faces).
3.2.3. Data Acquisition and Management
A fully automatic data acquisition scheme was implemented with a sampling interval of 10 minutes. The system was connected to a central computer for automatic data storage and preliminary analysis. All monitoring data were uploaded in real-time to a cloud platform, facilitating remote oversight via a mobile application. This setup enabled the timely detection of anomalies and the swift implementation of countermeasures.
3.3. Optimization of Construction Technology—Innovation in Methods
The selection of appropriate construction technology is paramount, as it directly influences both the quality and the efficiency of mass concrete placement. In this study, the optimal construction technique was determined through an iterative process involving numerical simulation and techno-economic comparison.
3.3.1. Optimization via Multi-Physics Field Simulation
A parametric study was conducted by quantifying the influence weights of various factors—including concrete mix proportion, thermal and physical material parameters, environmental conditions, and construction sequencing—on the outcomes of the coupled multi-physics simulation. This analysis established optimization thresholds for key variables. Temperature rise curves under different pouring sequences and layer thicknesses were simulated to identify a balance between construction efficiency and the risk of thermal cracking. The effectiveness of different thermal insulation covering regimes was modeled to determine the optimal timing and duration for curing interventions.
3.3.2. Selection of Construction Technology
Common placement methods for mass concrete include full-layer pouring, segmental-layer pouring, and inclined-layer pouring (Figure 4). The fundamental differences among these methods lie in the pouring sequence, inter-layer interval time, and heat dissipation paths, leading to significant variations in resulting temperature fields (e.g., peak temperature, temperature distribution) and stress fields (e.g., stress type, magnitude, cracking risk).
Deviating from the traditional inclined-layer method previously used for similar foundations, this project adopted an innovative placement strategy. By analyzing concrete supply capacity, on-site batching plant throughput, and feasible placement intensity, the circular raft foundation was divided into six uniformly sized fan-shaped pouring zones. A hybrid placement method combining inclined-layer and full-layer techniques was employed to execute a synchronous pouring sequence from the center towards the periphery. This optimized scheme was demonstrated through simulation to significantly reduce the peak concrete temperature, thereby effectively mitigating the risk of thermal cracking and ensuring superior construction quality.
4. Case Study
4.1. Case Background
The VVER-1200 represents a Generation III+ pressurized water reactor and a core component of ROSATOM’s integrated nuclear power plant solution. Evolving from the earlier VVER-1000 design, it incorporates enhanced safety systems and improved performance parameters designed to prevent the release of radioactive materials under postulated accident conditions.
This study focuses on the nuclear island raft foundation constructed for a VVER-1200 reactor within the Phase II Project of the Xudapu Nuclear Power Plant in northern China. This cylindrical reinforced concrete raft serves as the base for the reactor containment building (RCB). The foundation, illustrated in Figure 7, Figure 8 and Figure 9, has a diameter of 51.6 m, with a central thickness of 2.114 m increasing to 3.35 m at the periphery. The foundation bottom is situated at an elevation of -10.850 m. The central circular area, with a diameter of 38.7 m, has a top elevation of -8.730 m, and its side walls transition from a truncated conical to a cylindrical surface within the elevation range of -8.730 m to -7.500 m.
The substructure consists of moderately to slightly weathered bedrock. Designed with B40-grade concrete, the raft required a one-time monolithic placement of 5,240 m³ over approximately 41 hours, classifying the work as mass concrete construction. While the raft includes sealed penetrations for sump tanks, their thermal influence is neglected in this analysis for simplification. The concrete mix design is detailed in Table 1.
4.2. Innovative Concrete Placement Strategy
An innovative placement methodology was implemented to mitigate thermal cracking risks. The circular raft was divided into six equal-area fan-shaped sectors. A hybrid placement technique, merging the inclined-layer and full-layer methods, was employed to execute a synchronous pour progressing from the center outward (Figure 10).
Placement was sequenced into 23 layers: the lower section (-10.850 m to -8.736m) utilized an inclined-layer technique (17 layers), while the upper section (-8.736 m to -7.500 m) employed horizontal full-layer placement (6 layers). The initial four layers were placed at a 500 mm thickness, with subsequent layers at 250 mm (Figure 11).
The total placement duration was organized into five sequential 8-hour stages (Figure 12 and Figure 13): Stage 1 (Layers 1–6), Stage 2 (Layers 7–9), Stage 3 (Layers 10–12), Stage 4 (Layers 13–17), and Stage 5 (Layers 18–23). The concrete volume per layer is summarized in Figure 14, with the maximum single-layer placement volume of 421 m³ occurring at Layer 10. Detailed construction photographs of the in-situ concrete pouring for the nuclear island raft foundation (mass concrete) are provided in Figure 15.
4.3. Concrete Curing Regime
4.3.1. Curing Enclosure
A dedicated curing enclosure was erected over the entire raft approximately 8–10 hours after concrete finishing, coinciding with a surface strength of approximately 1.2 MPa. The gable-roof structure, with a 1.5% slope along its central axis (90° to 270°) and incorporating five roof vents (Figure 16 and Figure 17), served to protect the concrete from adverse weather and to minimize convective heat loss, thereby providing stable thermal insulation.
4.3.2. Staged Curing Procedure
A 30-day curing period was implemented. Vertical surfaces (external formwork and steel liner) received form-attached curing. For horizontal surfaces, a two-phase staged curing approach was adopted. Heating Phase (Approximately 3 days): Initial curing followed the multi-layer insulation scheme specified in Table 2. Cooling Phase: Insulation (e.g., gunny sacks, thermal quilts) was dynamically applied or removed based on real-time thermal monitoring feedback.
Insulation was managed proactively: layers were added when the core-surface temperature difference approached 20 °C or the cooling rate exceeded 1.5 °C/day, and reduced when these values were satisfactory. All insulation was removed once the temperature difference between the concrete surface and the ambient air stabilized at or below 20 °C.
4.4. Field Monitoring and Simulation Validation
4.4.1. Temperature Monitoring Scheme
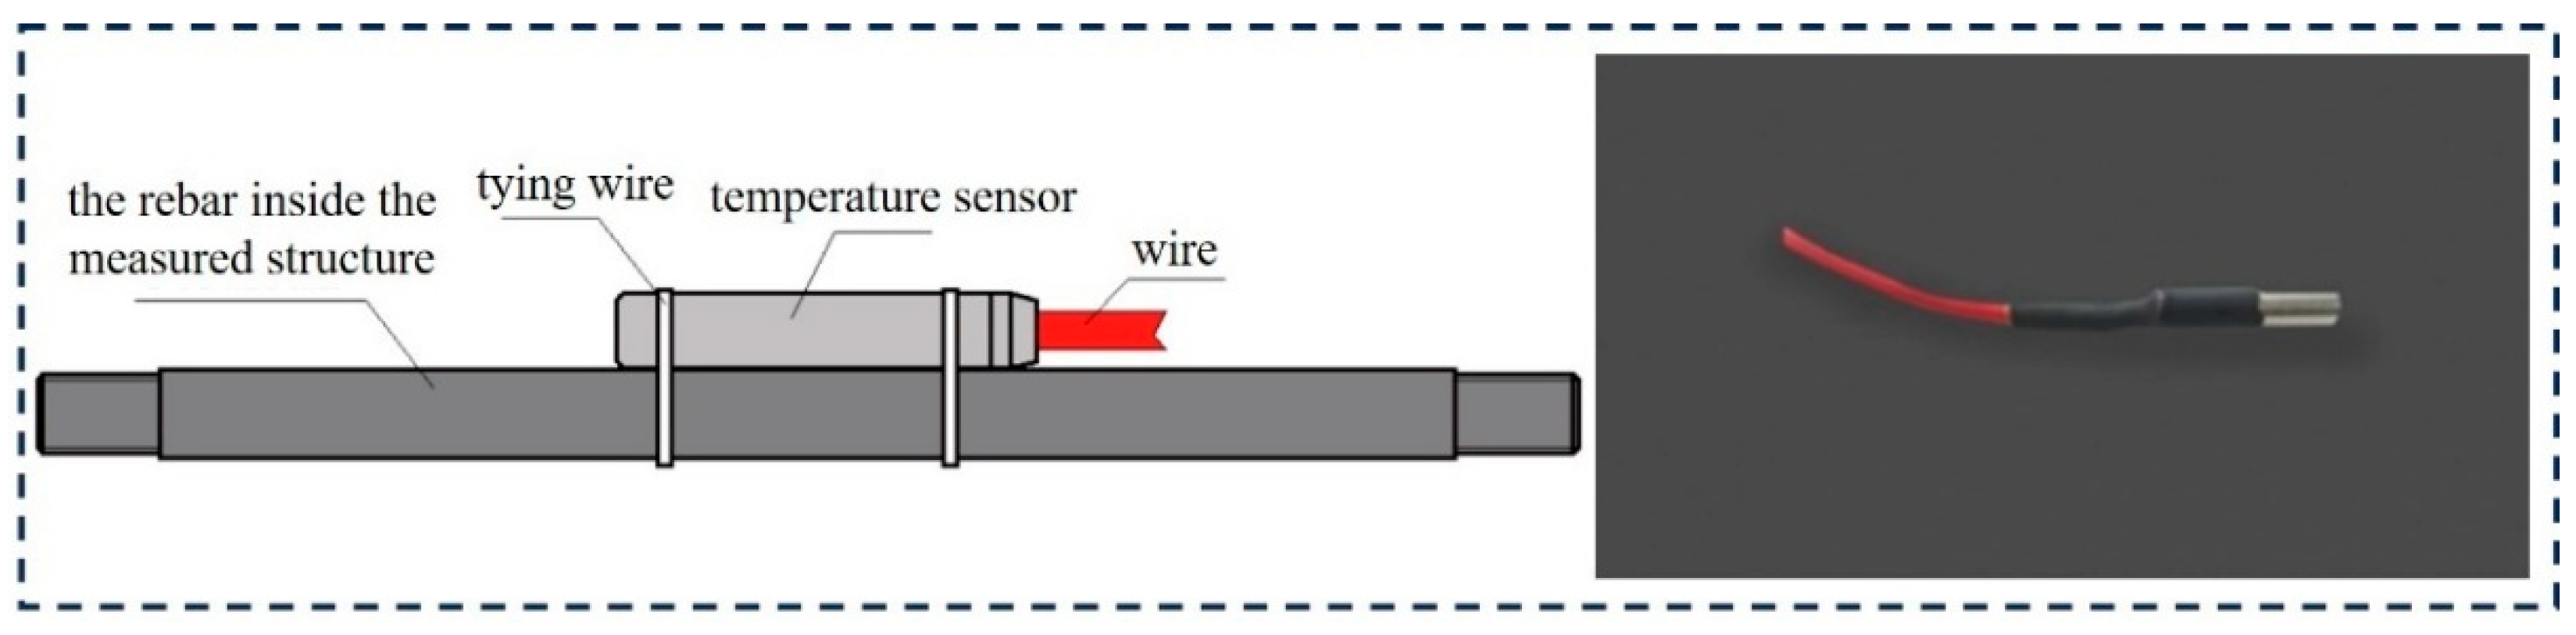
A comprehensive temperature monitoring system was deployed to capture the raft’s thermal evolution and guide curing operations. A total of 193 embedded thermistor sensors (JMT-36C type, range: -30 to +120 °C, accuracy: ±0.5 °C) were installed at 29 strategic locations across one symmetric half of the raft (Figure 18 and Figure 19). Two additional sensors recorded ambient temperatures inside and outside the curing enclosure.
An automated data acquisition system collected readings at 10-minute intervals initially, transitioning to hourly intervals after 7 days. Monitoring continued for the full 30-day curing period, ceasing only after the temperature differential between concrete and ambient remained consistently below 25 °C for three consecutive days.
Figure 20.
Automatic concrete temperature monitoring equipment.

Figure 21.
JMT-36C type temperature sensor.
4.4.2. Numerical Simulation Setup
A three-dimensional finite element model, incorporating the raft and a 5-meter-thick underlying bedrock layer extending 3 m beyond the raft perimeter, was developed using Midas FEA (Figure 22). The model simulated the transient temperature field, explicitly accounting for the five distinct concrete placement stages.
Critical input parameters included:
Heat Source Function: Defined by the adiabatic temperature rise curve obtained from concrete performance tests (Figure 23).
Ambient Temperature Function: Based on measured on-site environmental data (Figure 24).
Thermophysical Properties: Derived from material characterization tests and the specific curing conditions (Table 3).
4.4.3. Comparison of Measured and Simulated Results
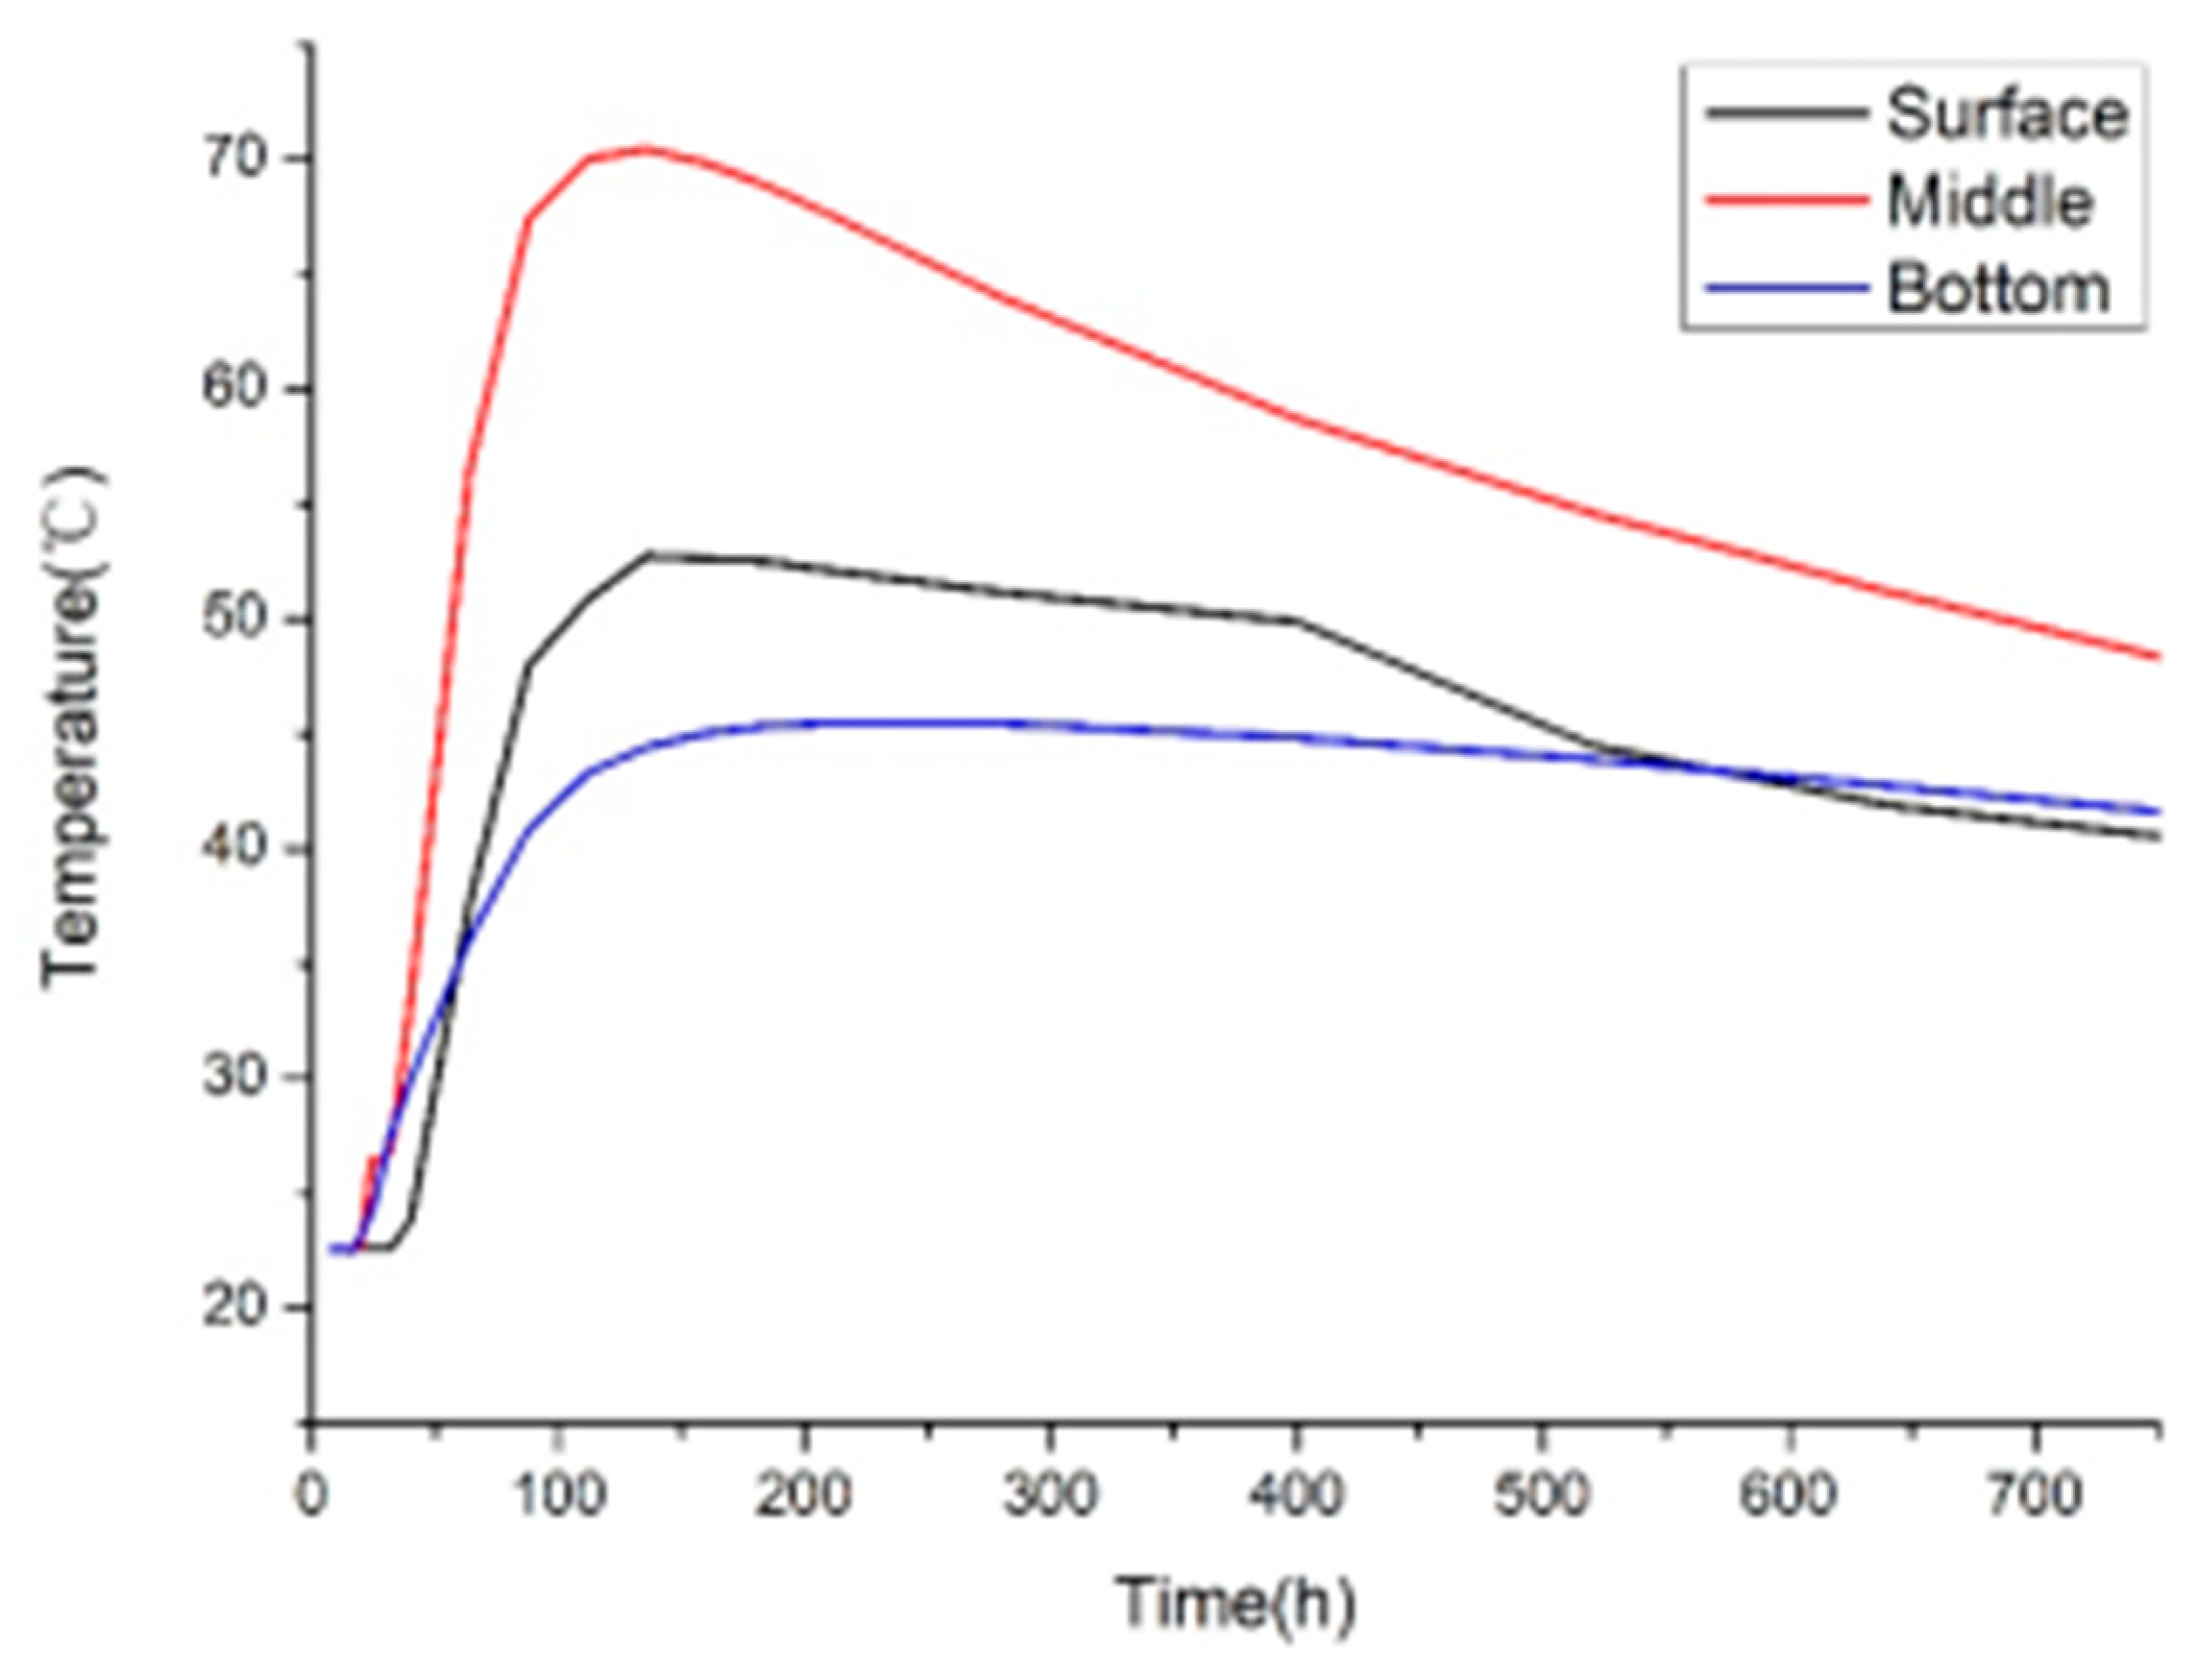
Temperature data from three representative points—Points 1 and 5 in the 2.114 m thick central region, and Point 7 in the 3.35 m thick peripheral region—were selected for detailed analysis (Figure 25, Figure 26 and Figure 27). Key measured thermal characteristics are summarized in Table 4.
The simulated temperature field evolution at key ages (Figure 28, Figure 29, Figure 30, Figure 31, Figure 32, Figure 33, Figure 34 and Figure 35) and the corresponding time-history curves at the monitored points (Figure 37, Figure 38 and Figure 39) demonstrated good agreement with field measurements. The finite element analysis yielded slightly conservative predictions for peak temperatures and core-surface differentials (Table 5), which is favorable for proactive and conservative curing management.
Figure 28.
Temperature field after the completion of the 1st pouring phase.
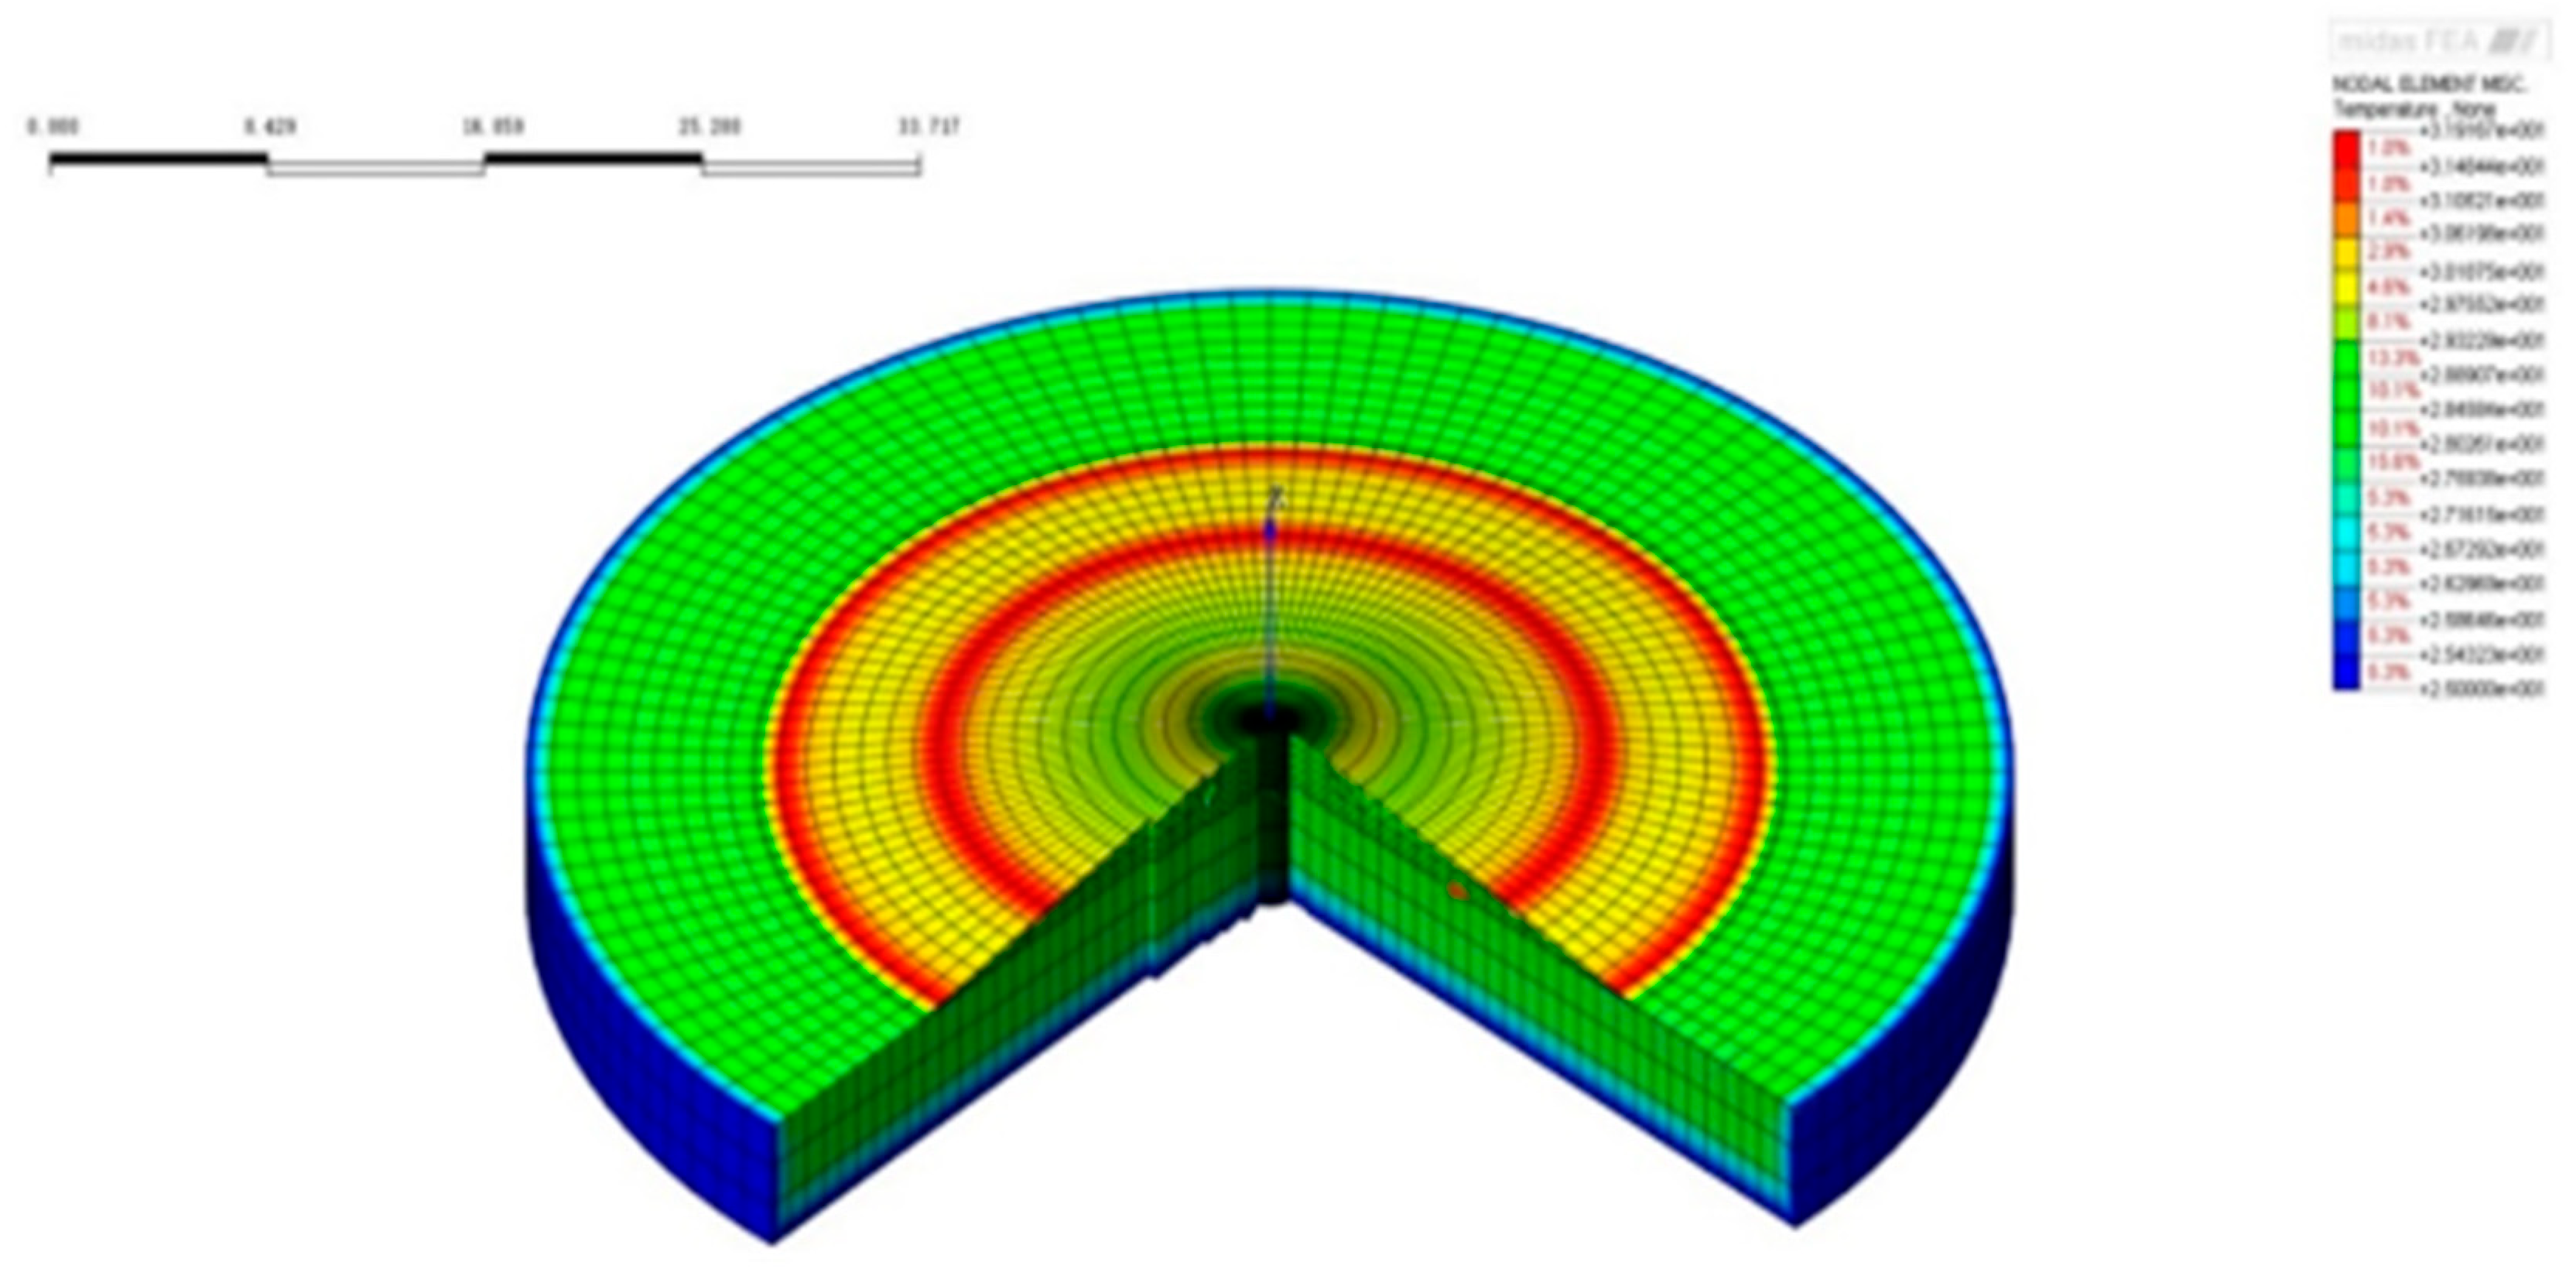
Figure 29.
Temperature field after the completion of the 2nd pouring phase.
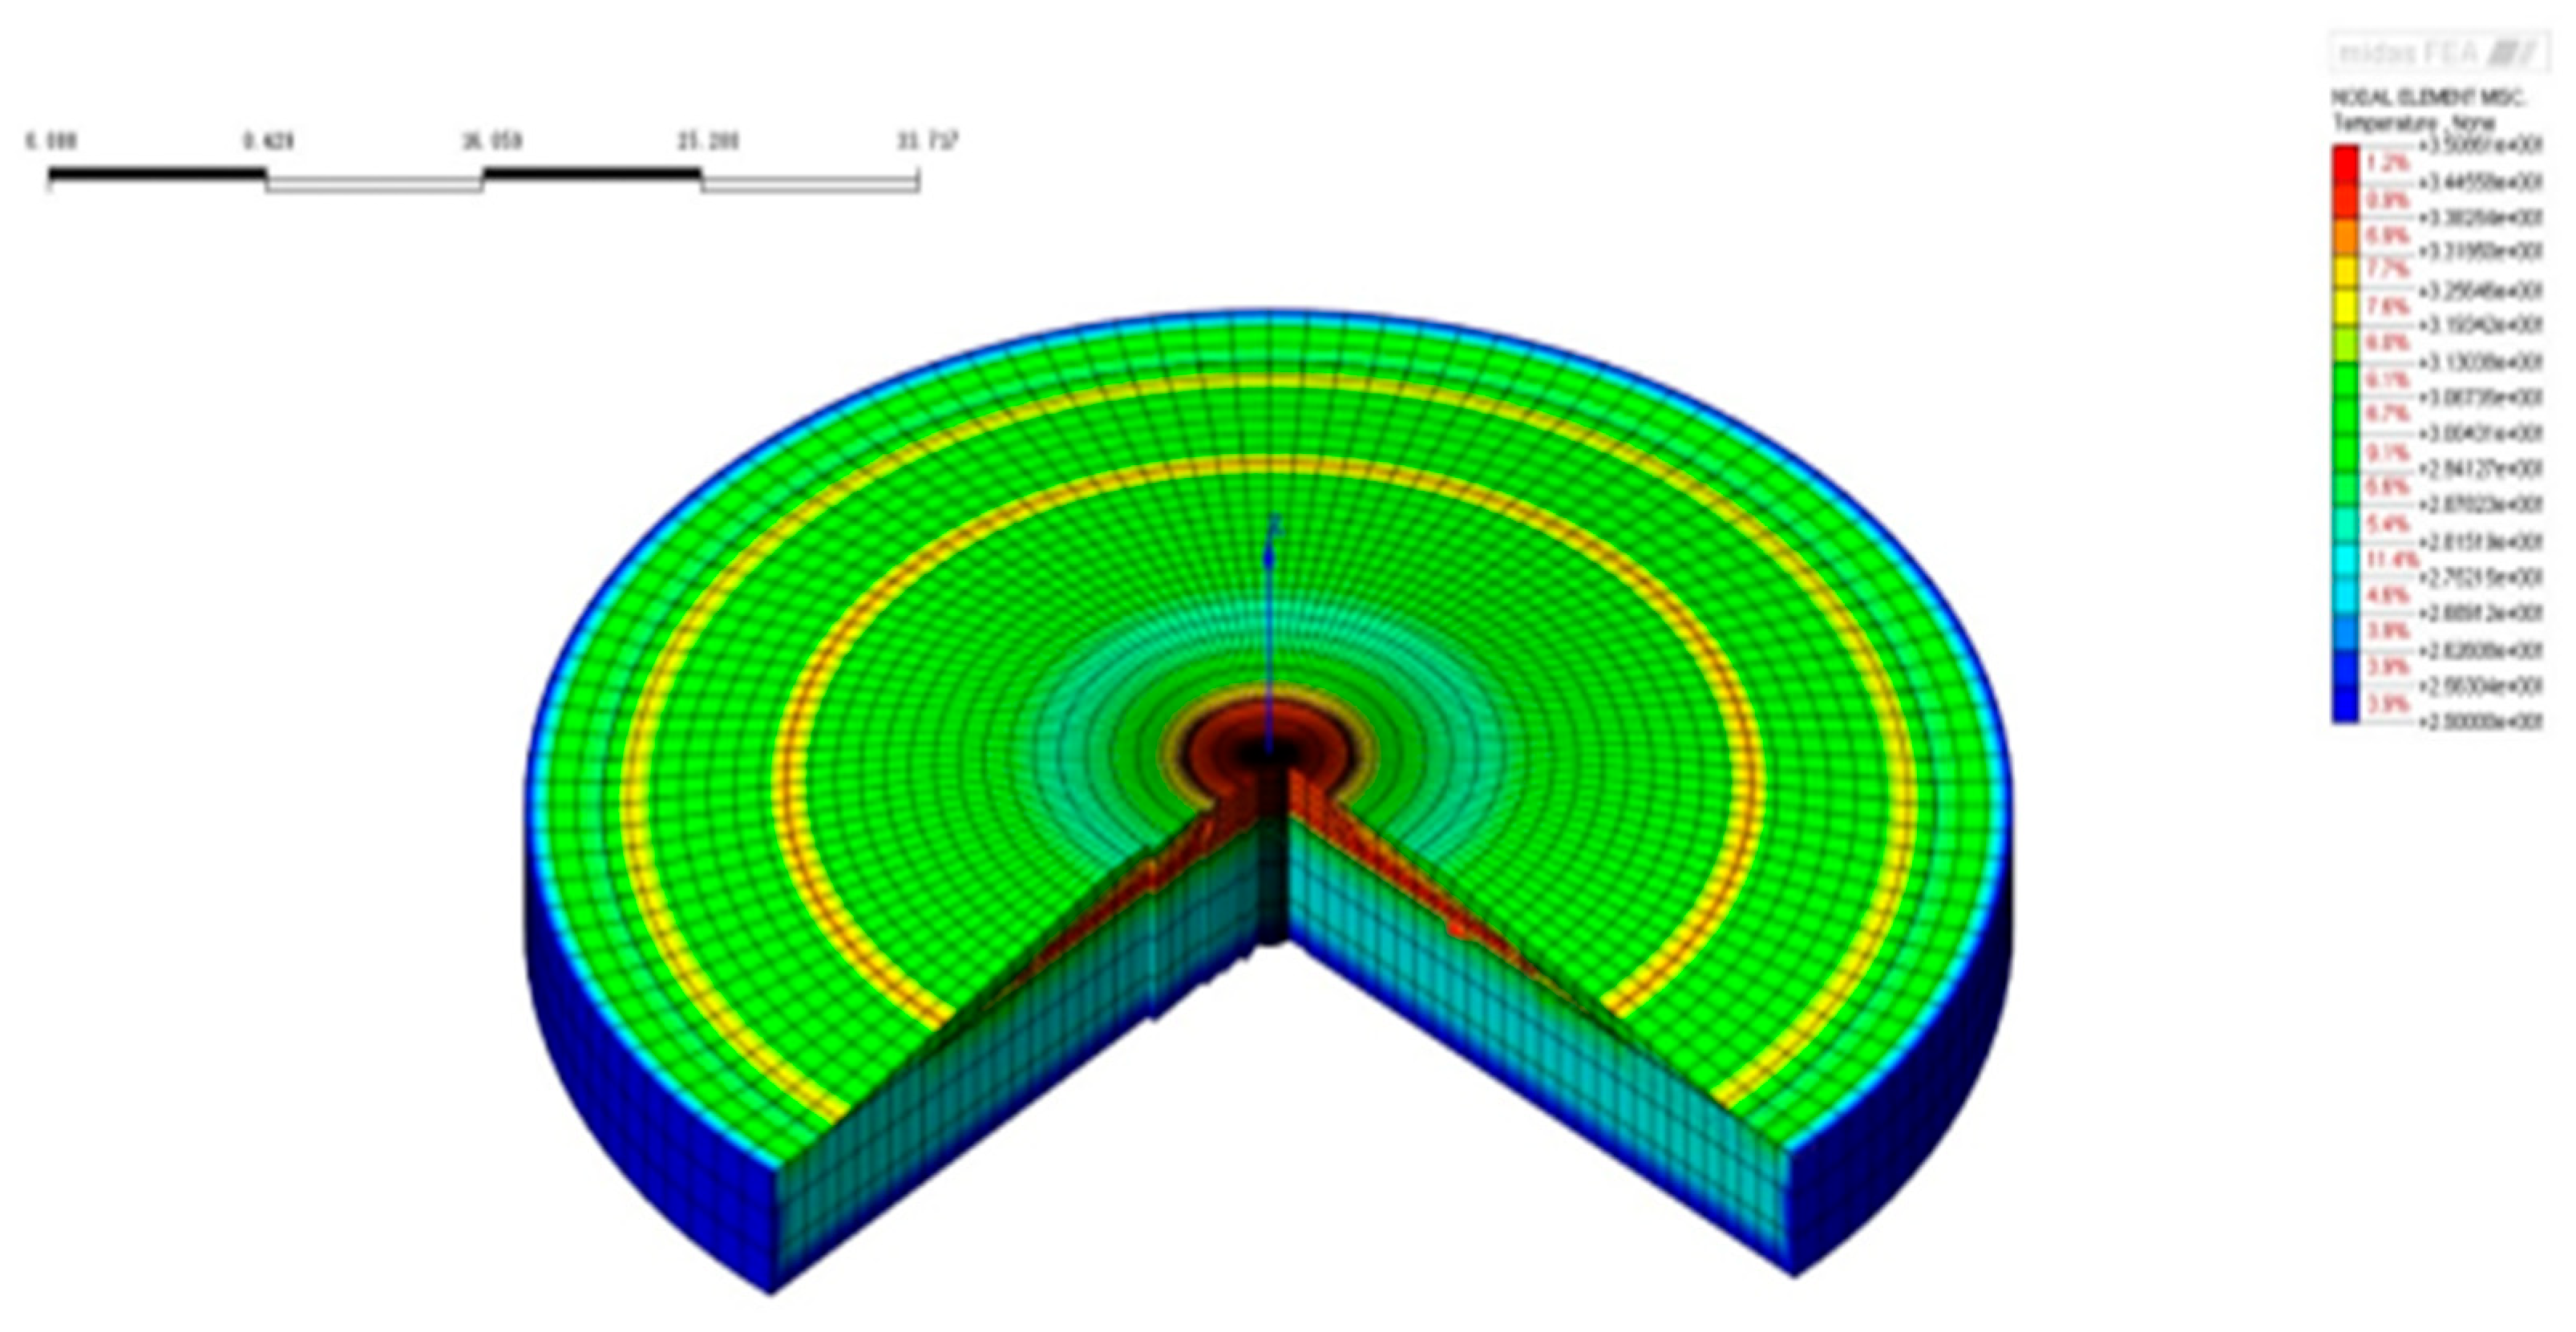
Figure 30.
Temperature field after the completion of the 3rd pouring phase.
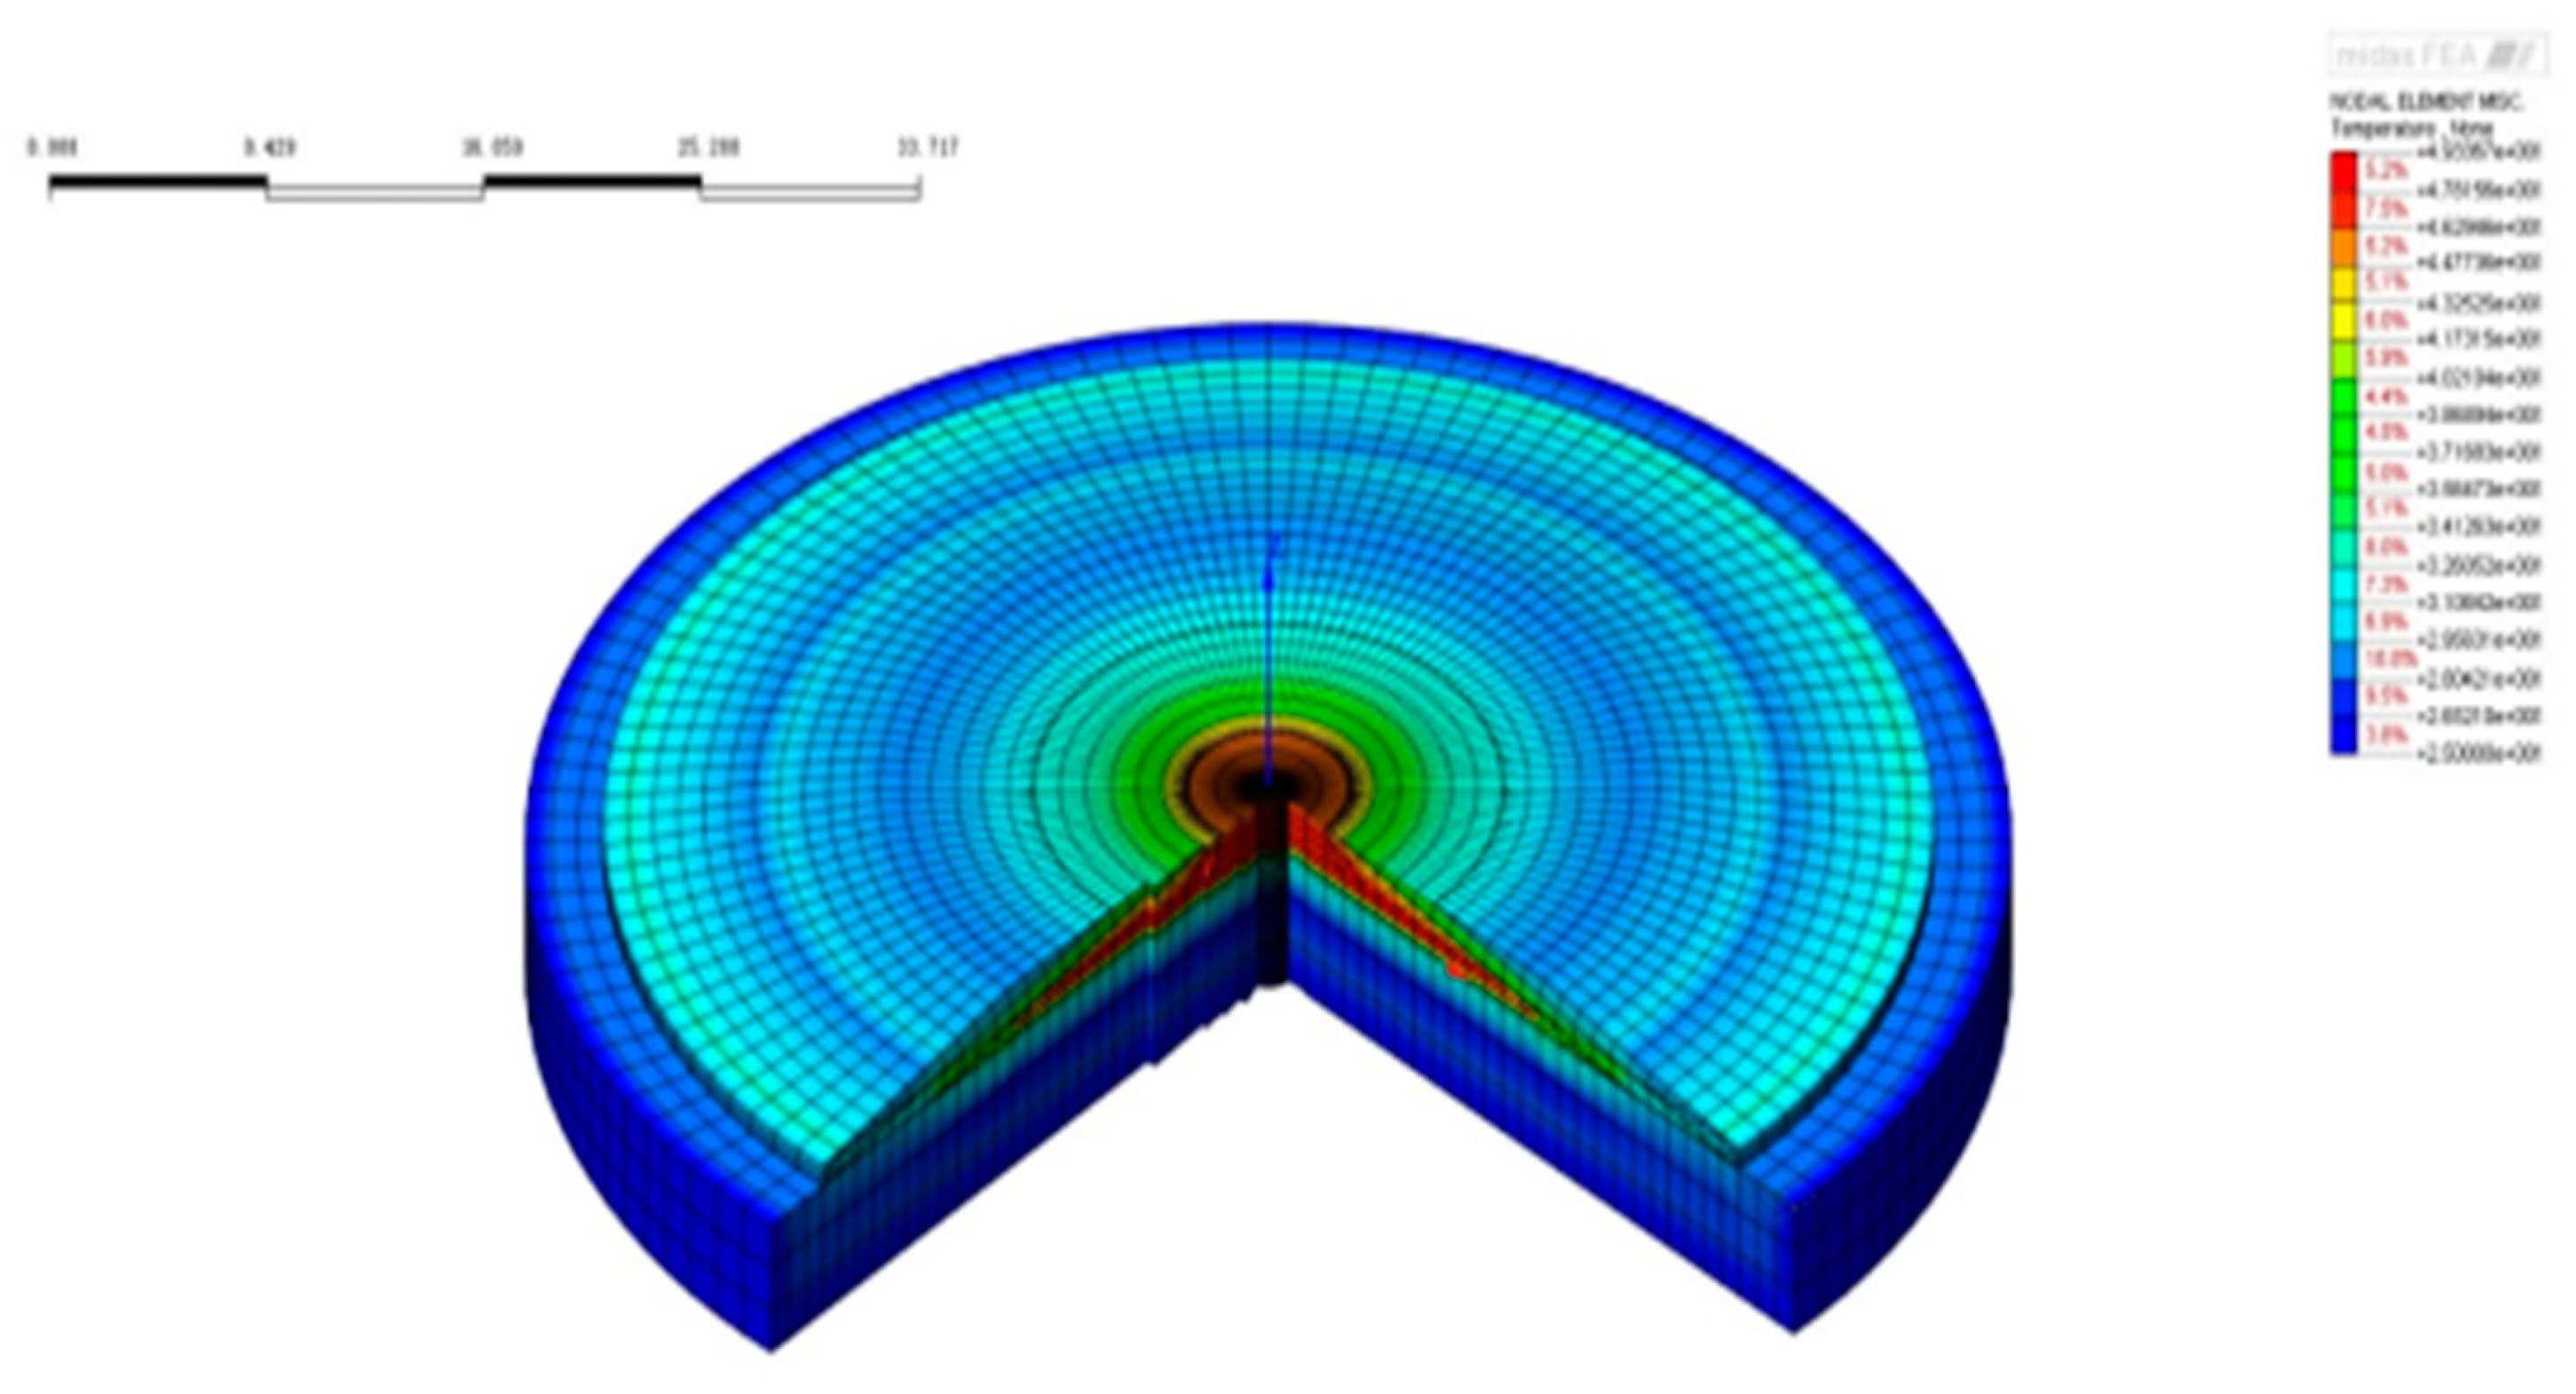
Figure 31.
Temperature field after the completion of the 4th pouring phase.
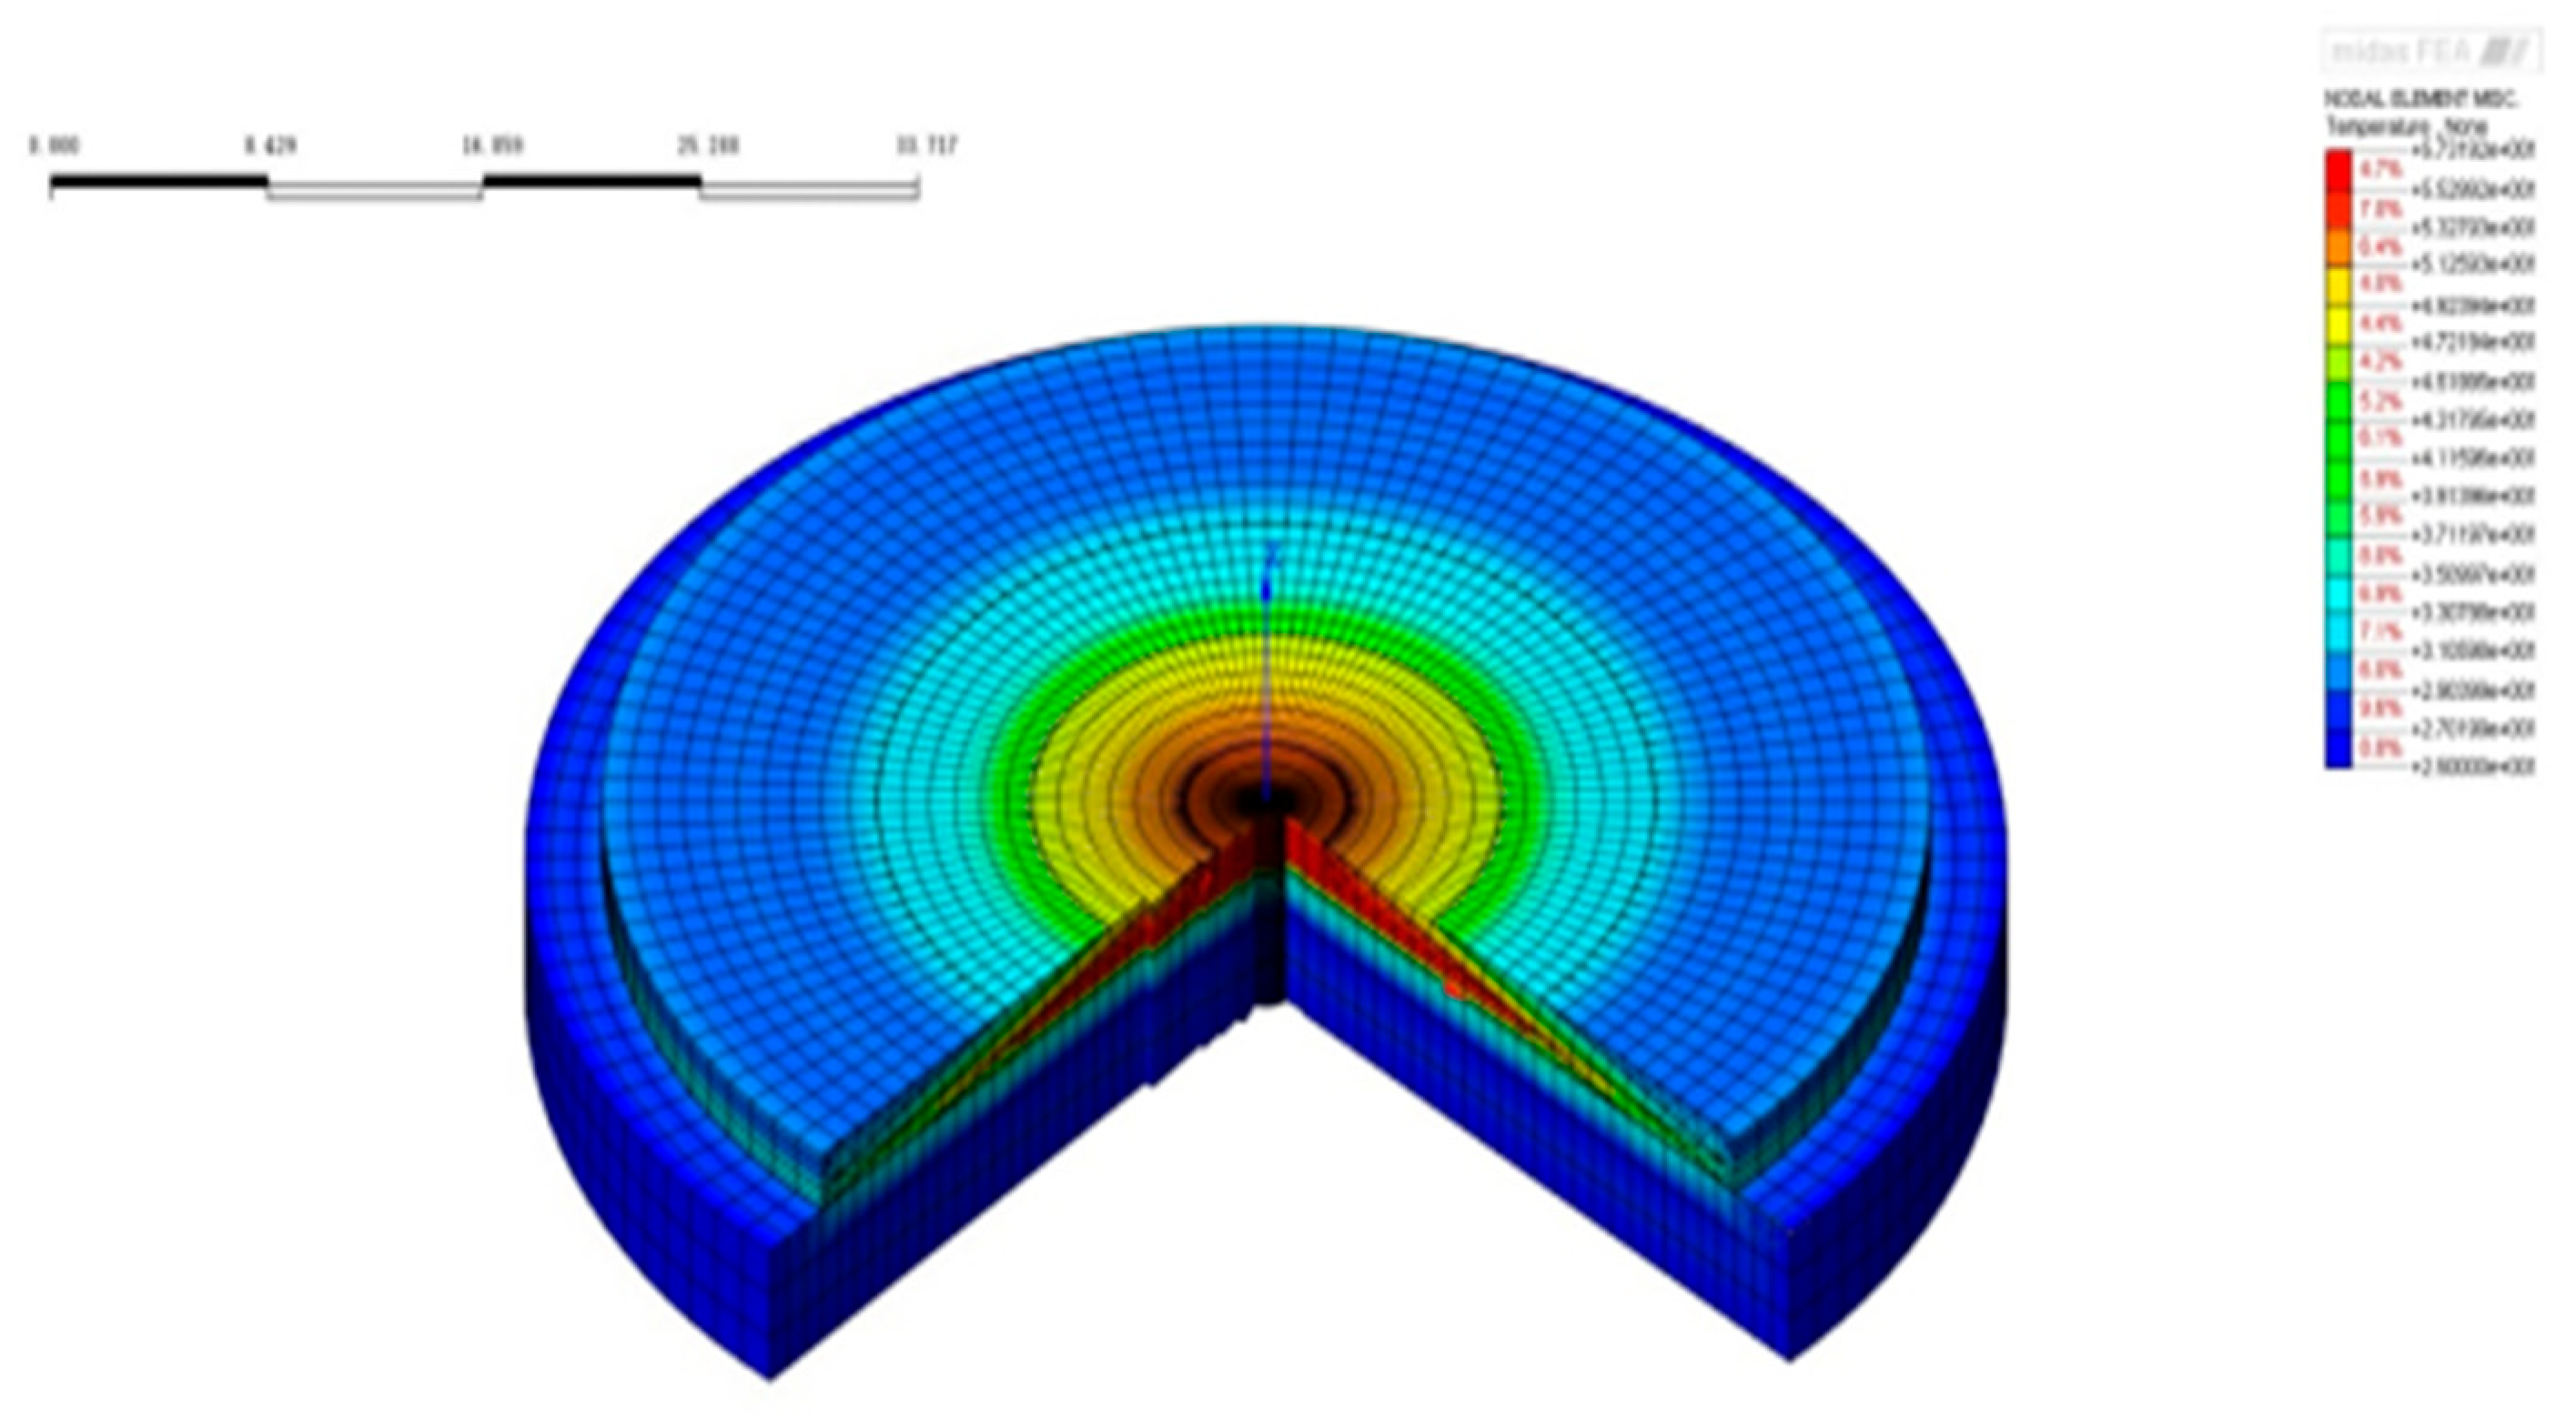
Figure 32.
Temperature field after the completion of the 5th pouring phase.
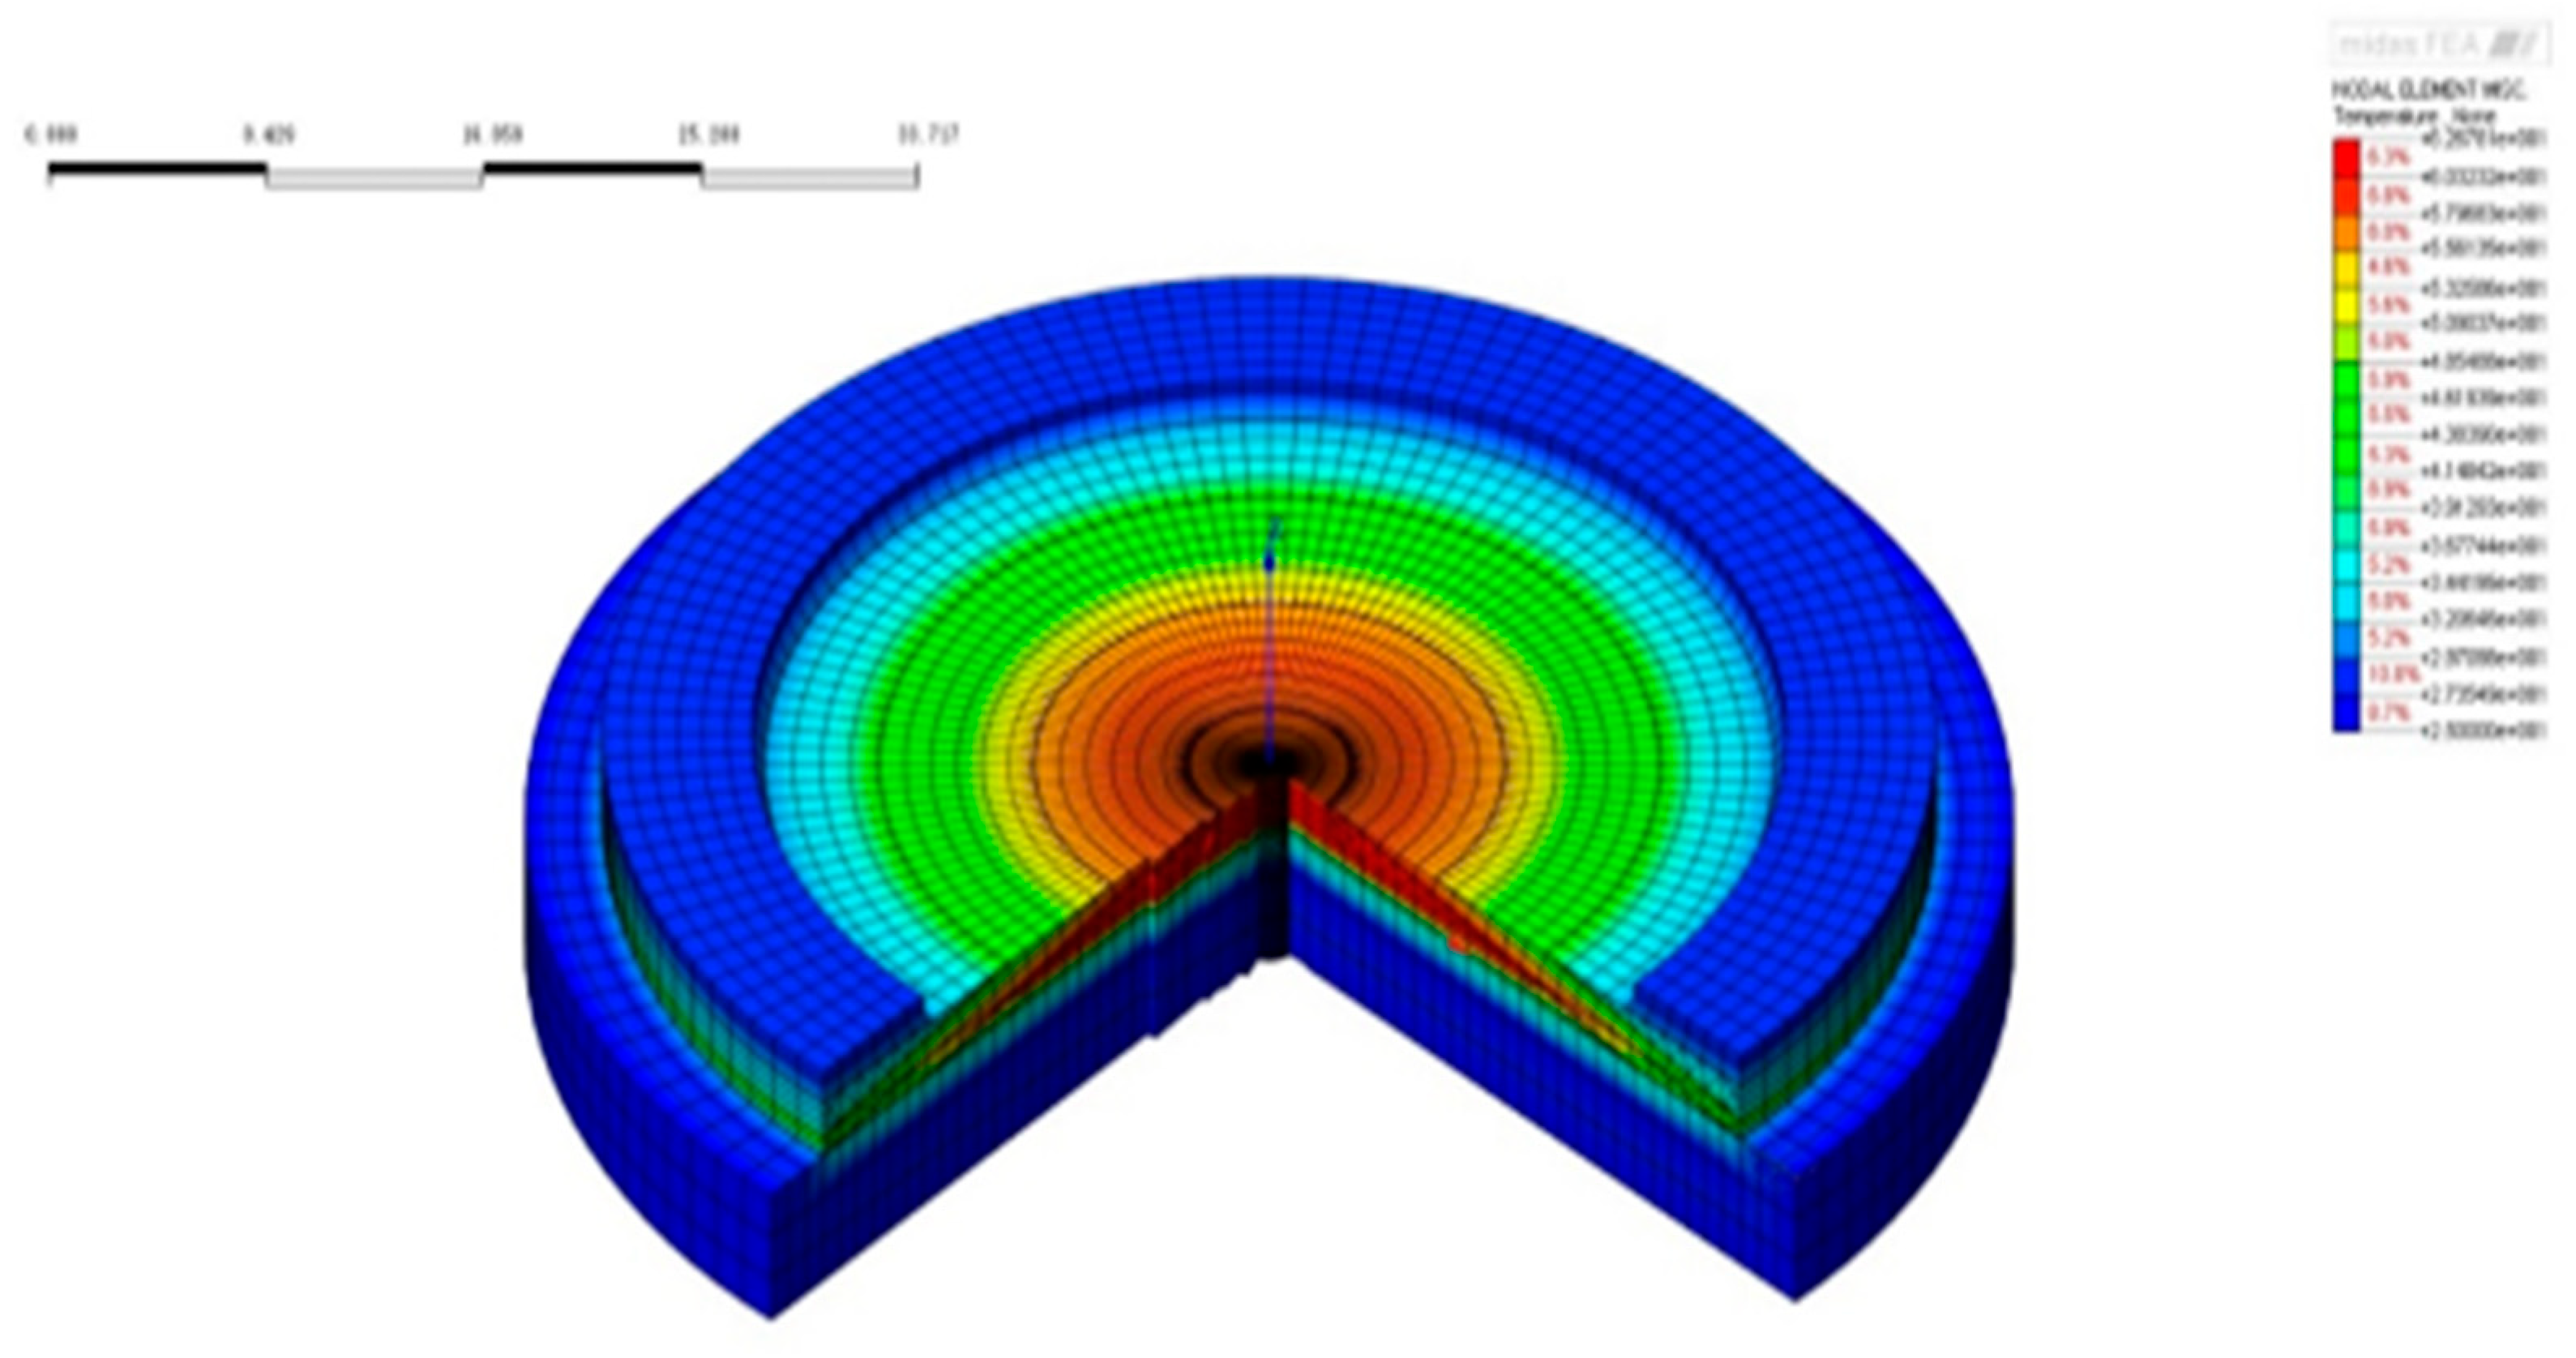
Figure 33.
Temperature field of the nuclear Island raft foundation at 1 day age after the completion of pouring.
Figure 33.
Temperature field of the nuclear Island raft foundation at 1 day age after the completion of pouring.
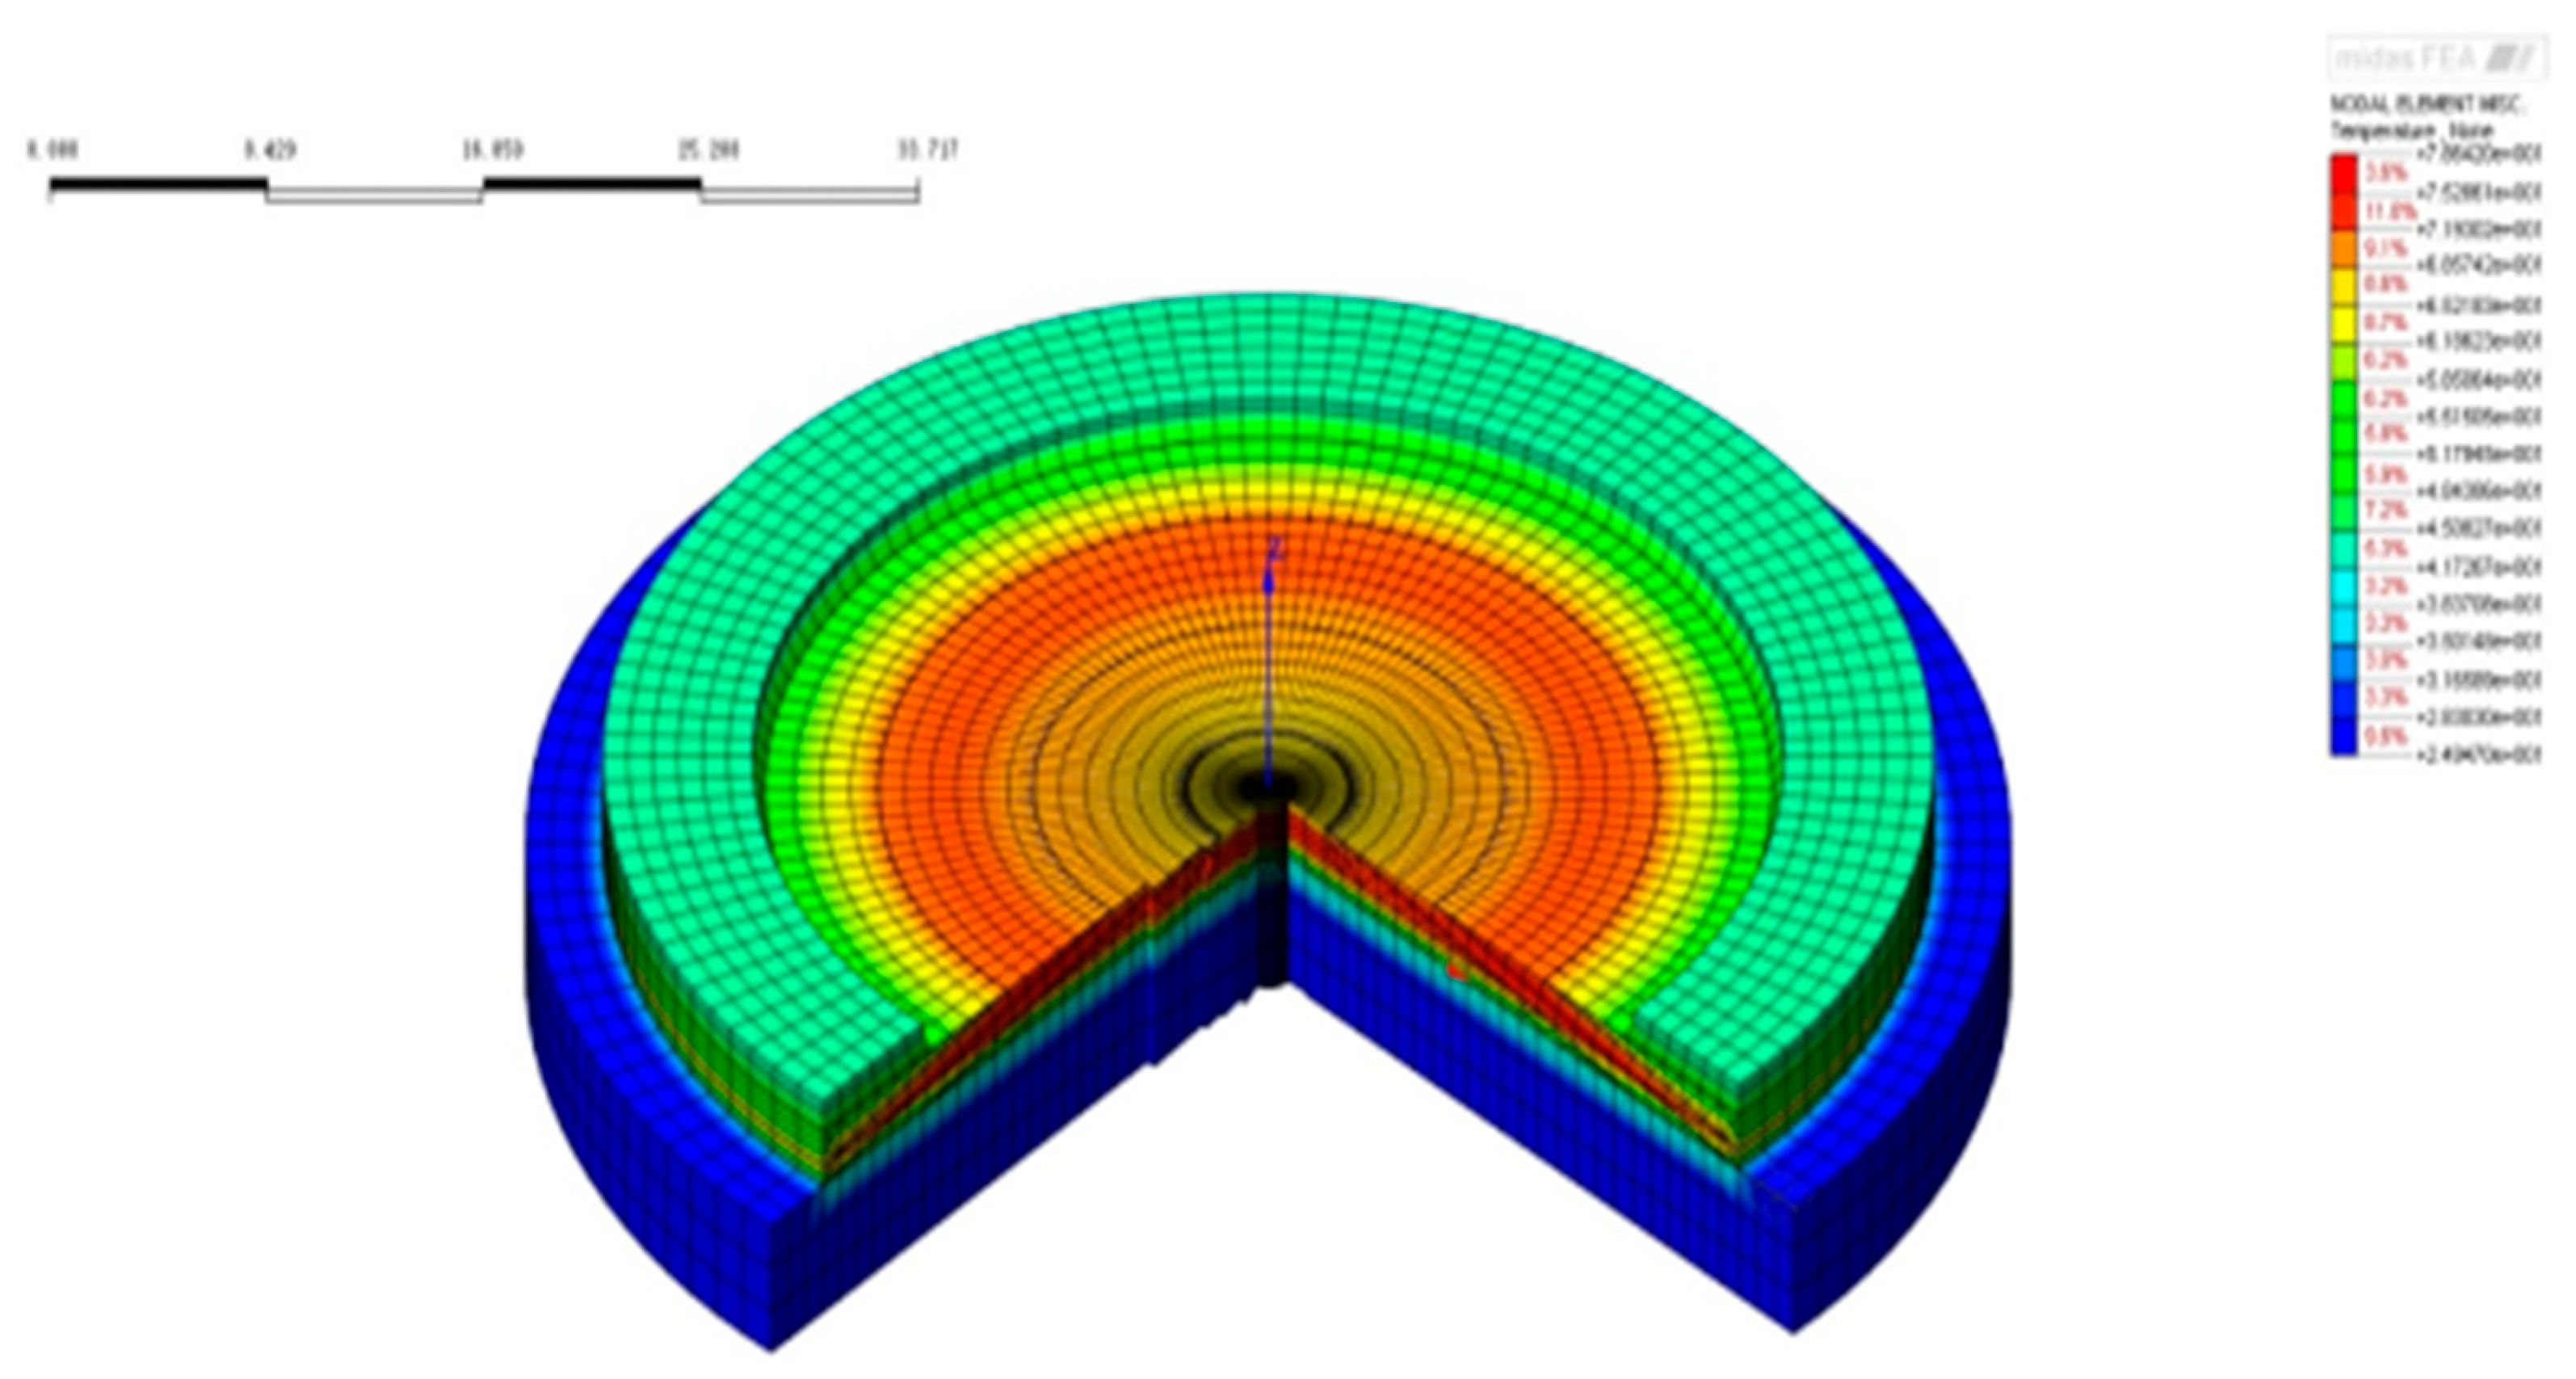
Figure 34.
Temperature field of the nuclear island raft foundation at 3 days after the completion of pouring.
Figure 34.
Temperature field of the nuclear island raft foundation at 3 days after the completion of pouring.
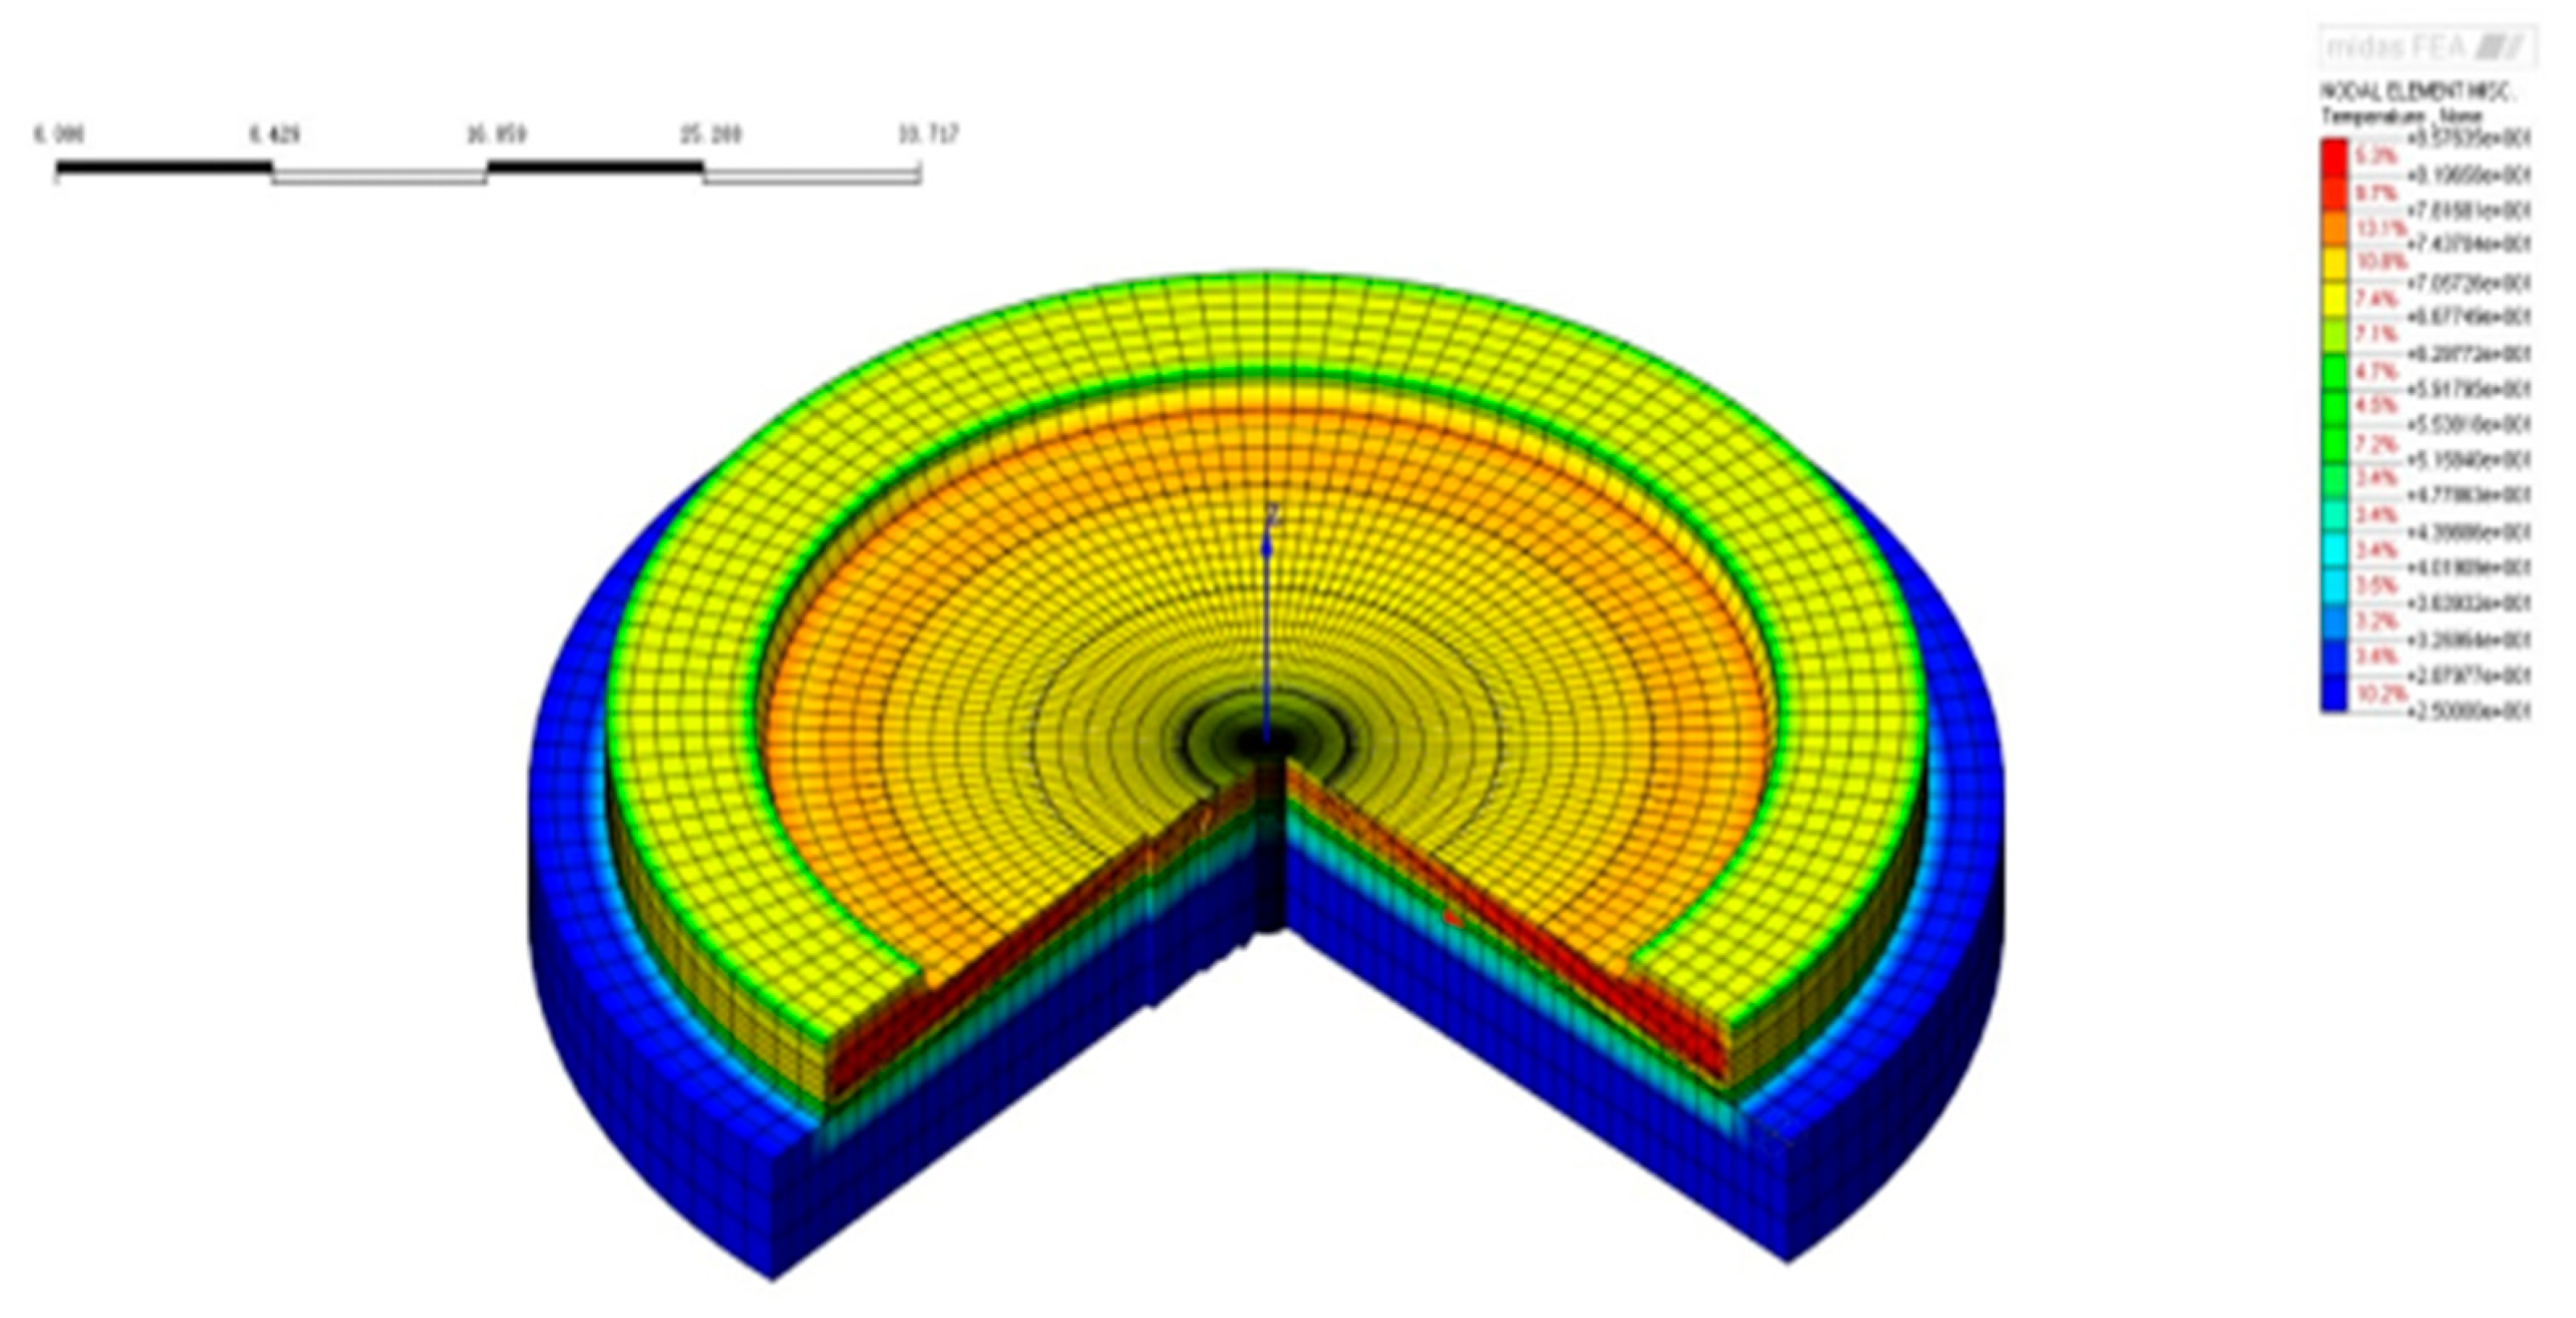
Figure 35.
Temperature field of the nuclear island raft foundation at 7 days after the completion of pouring.
Figure 35.
Temperature field of the nuclear island raft foundation at 7 days after the completion of pouring.
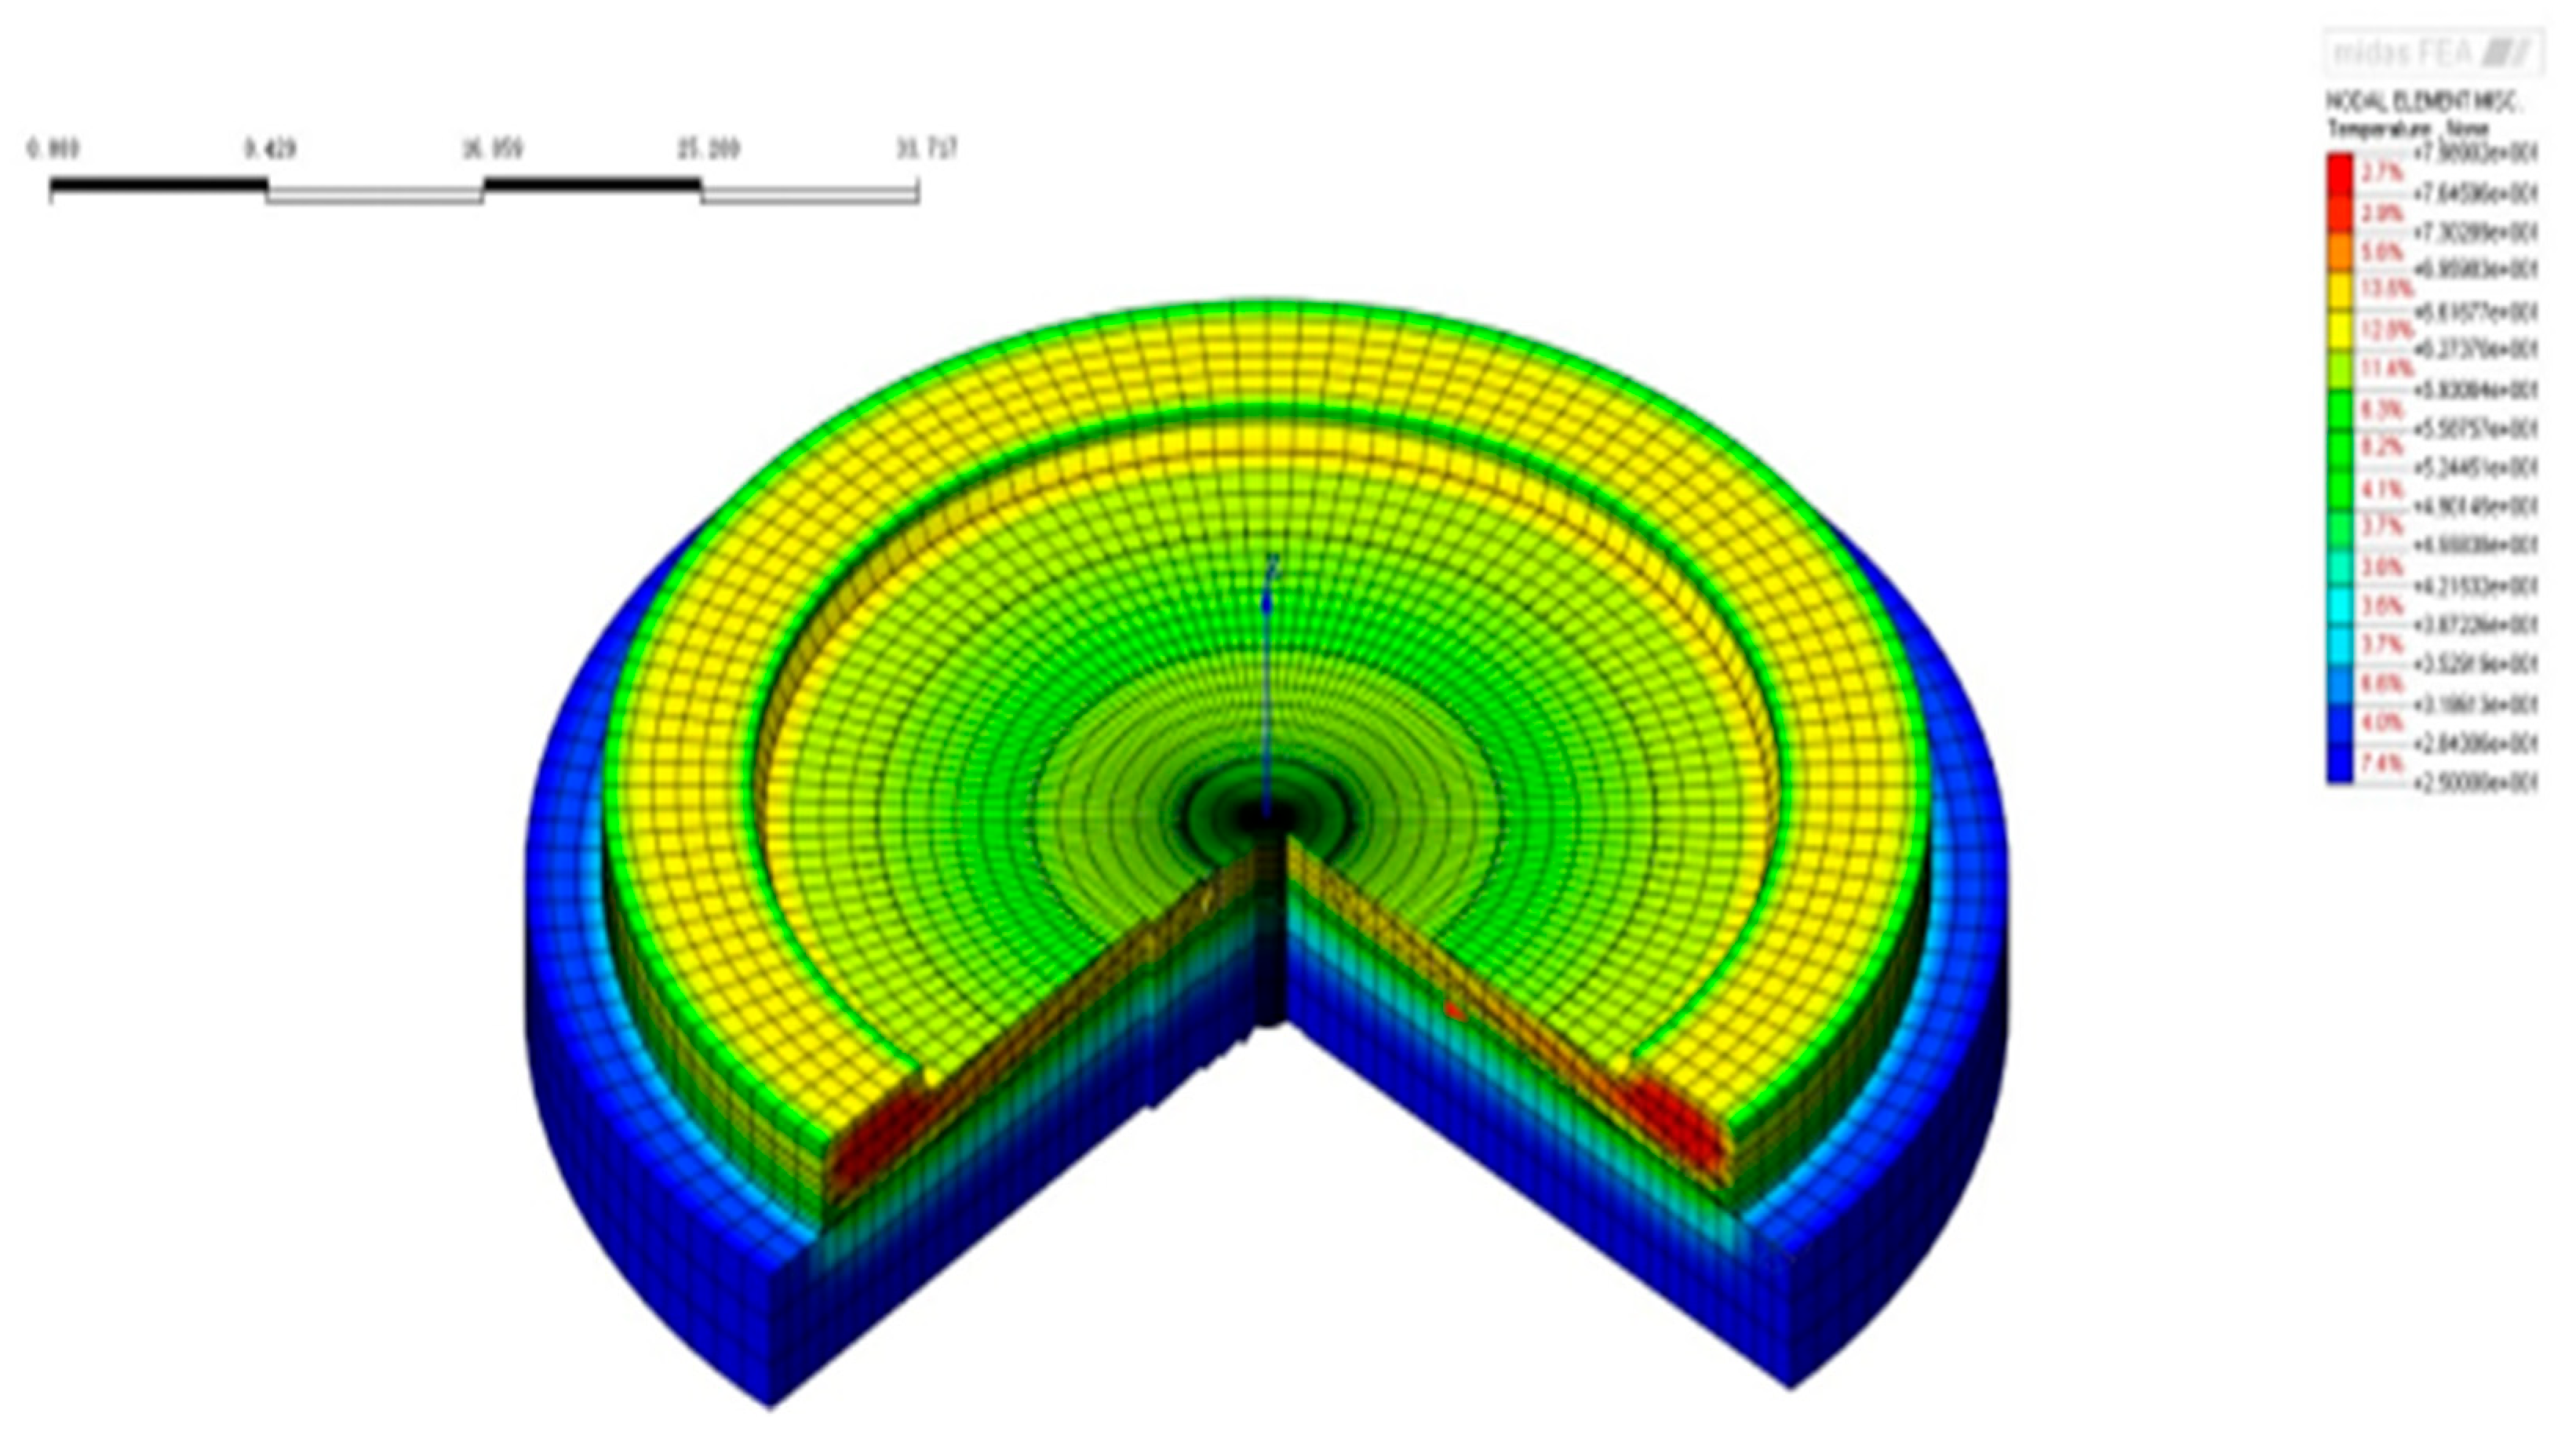
Figure 36.
Temperature distribution diagram of nuclear island raft foundation cross-section.
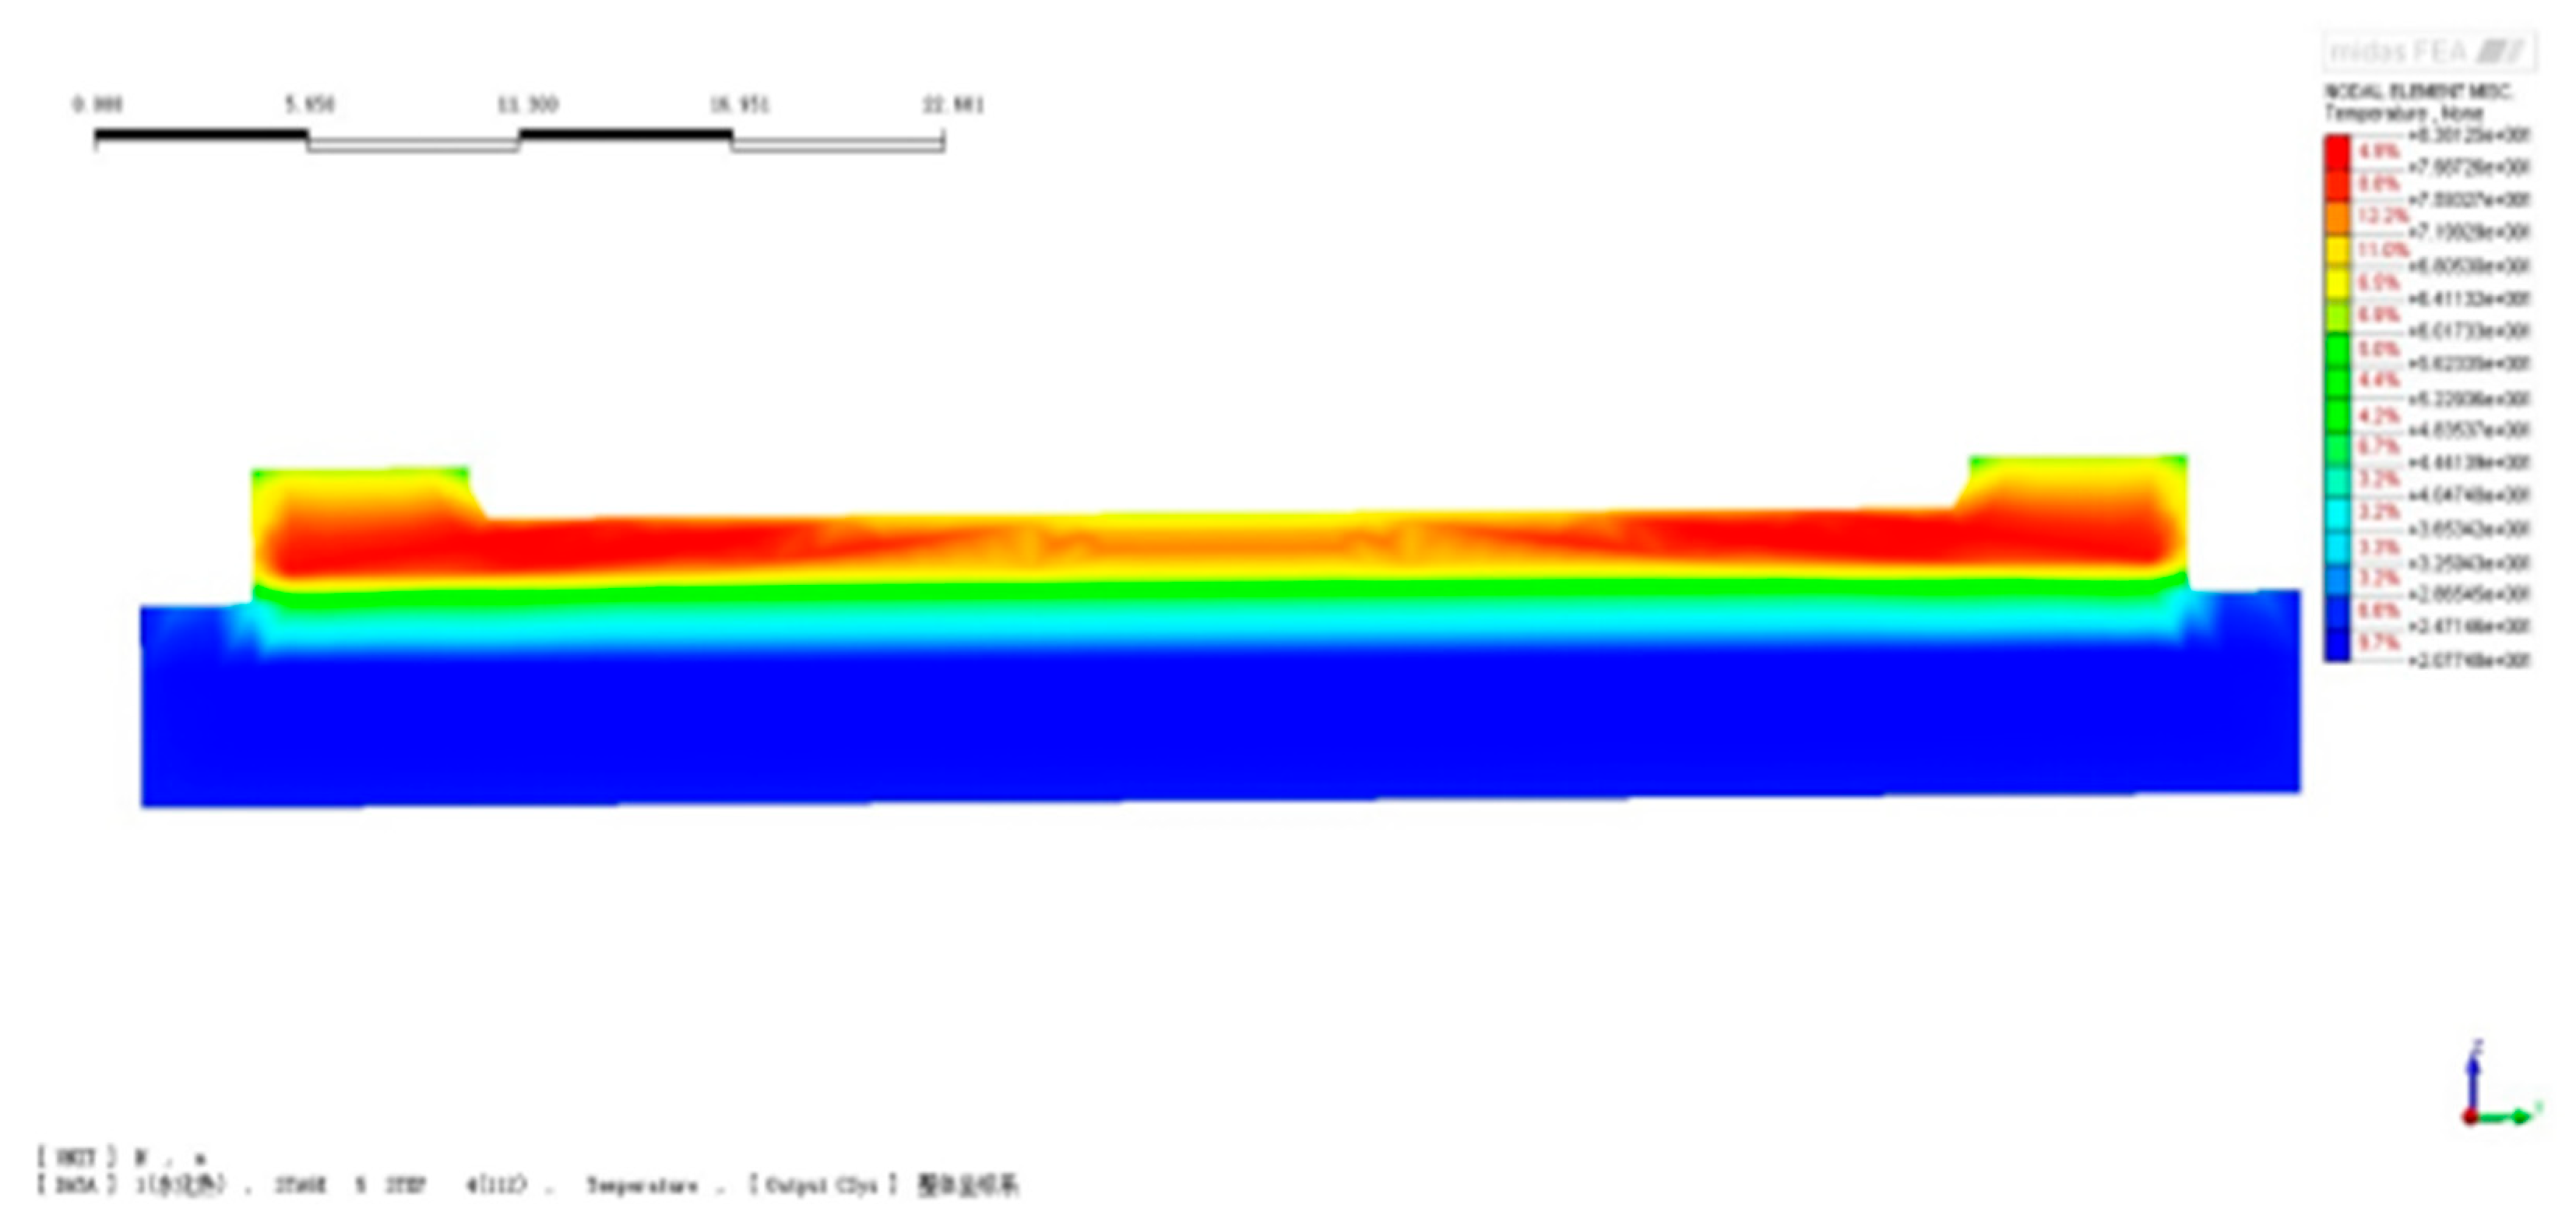
Figure 37.
Finite element calculated temperature time-history curve at measuring point 1.
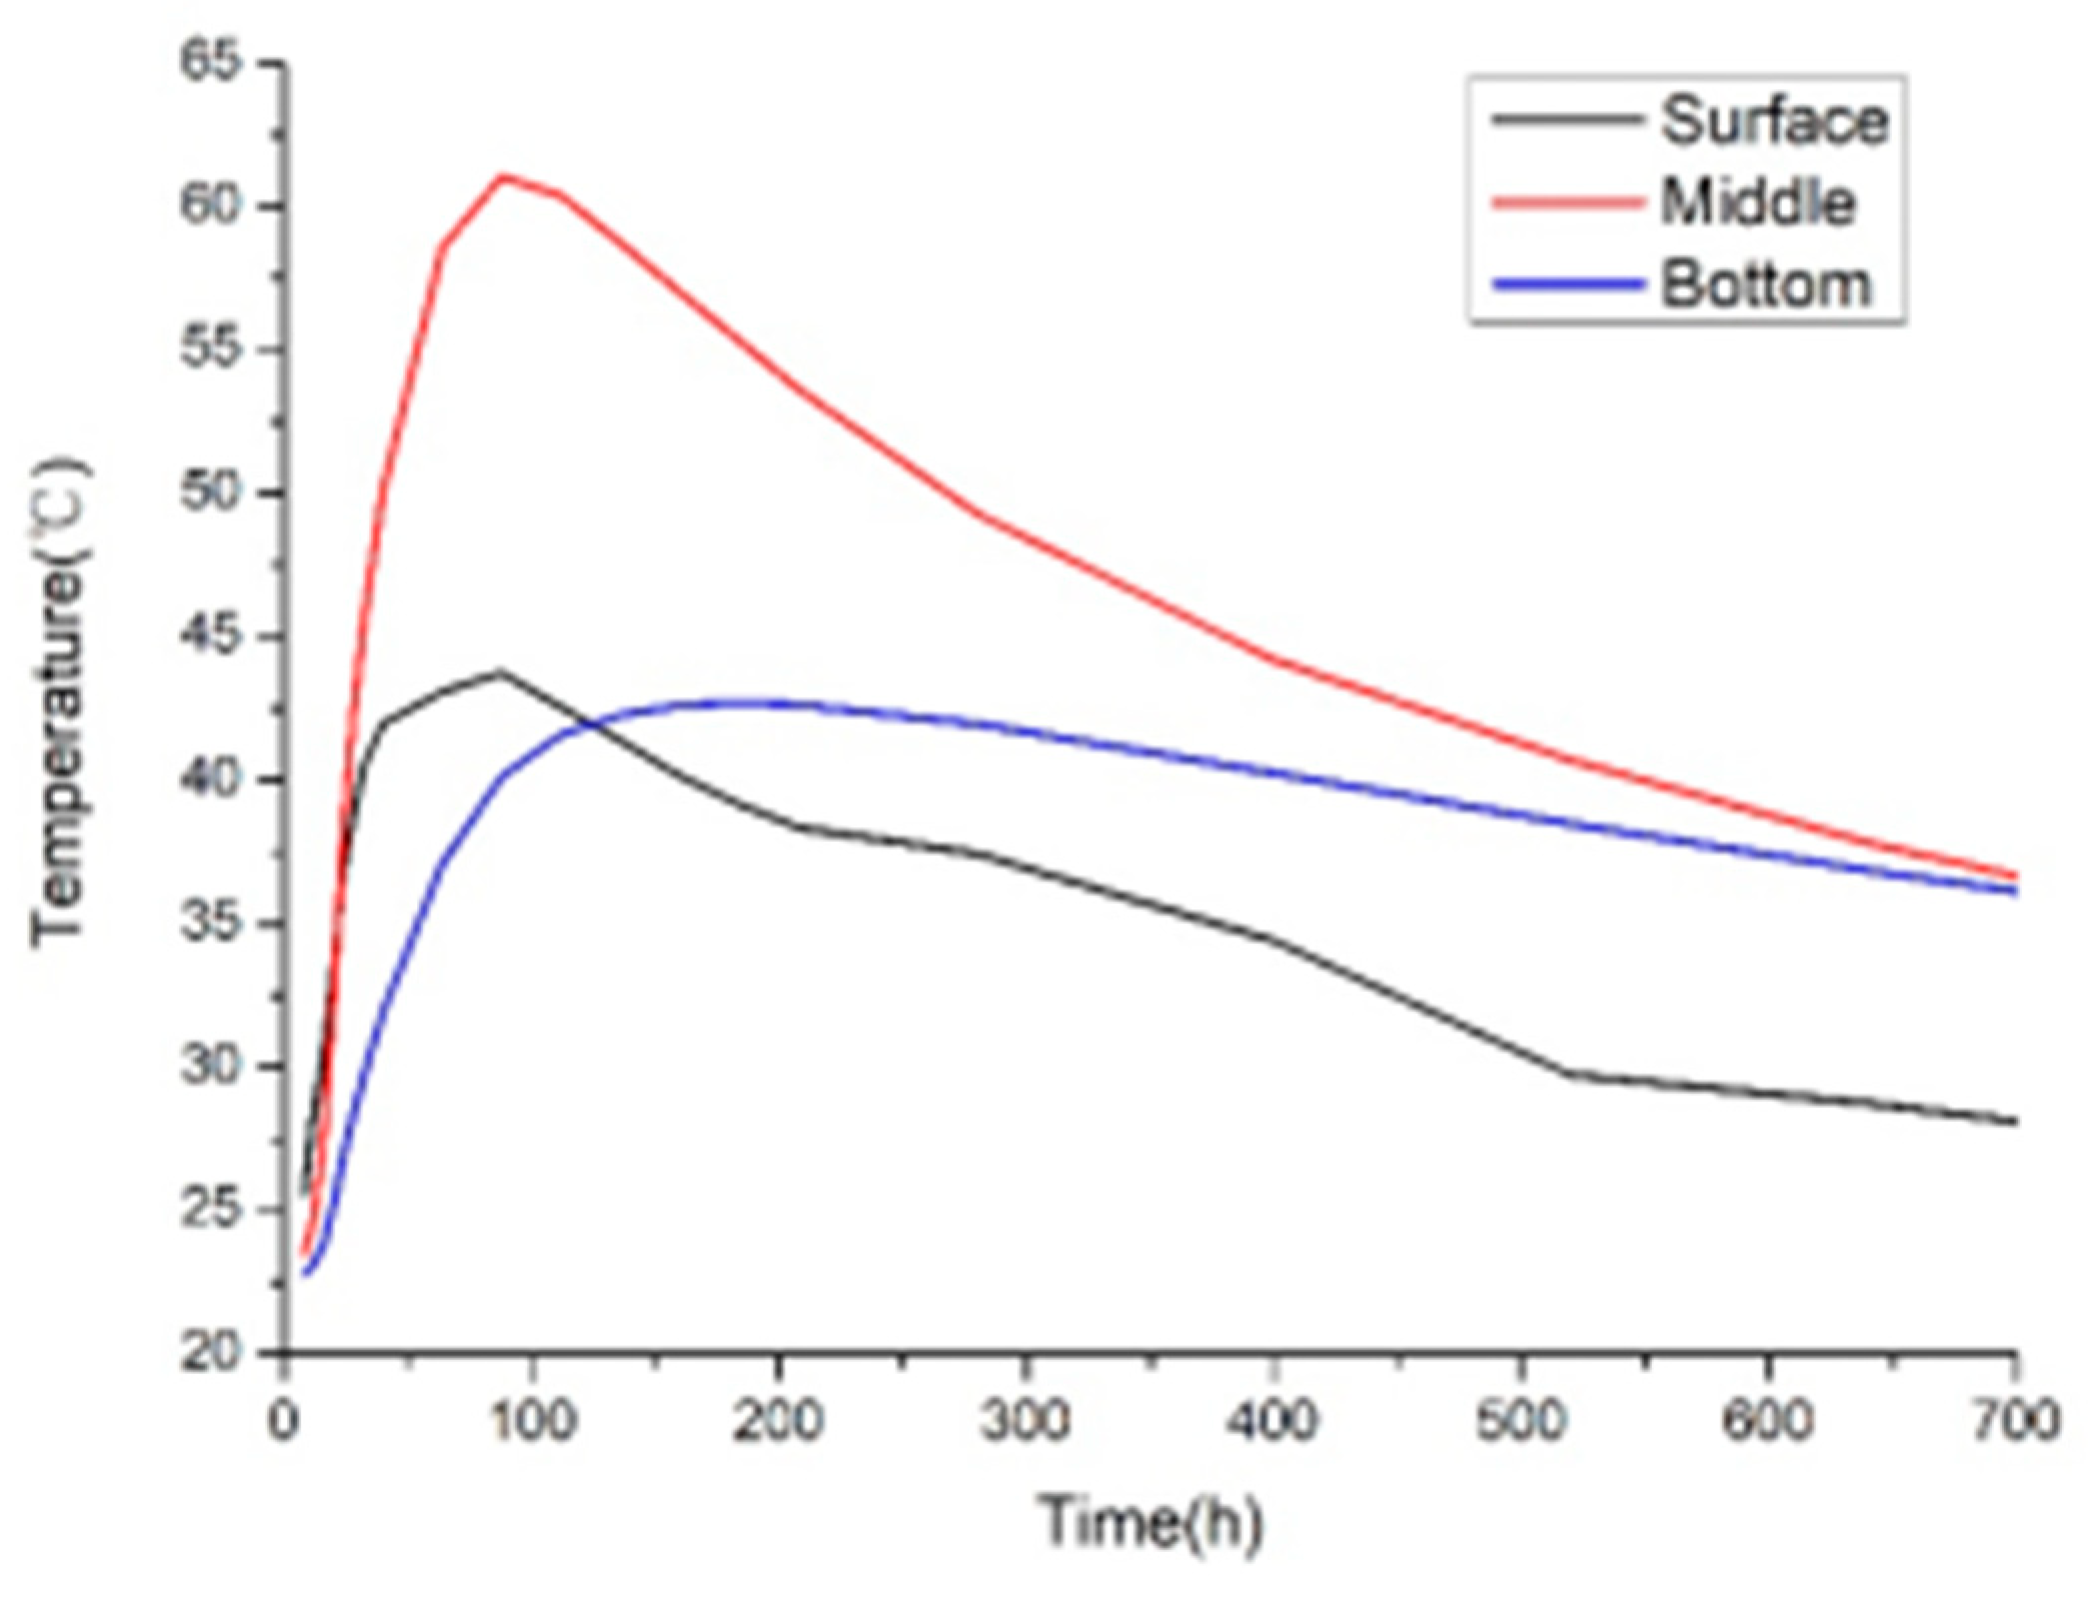
Figure 38.
Finite element calculated temperature time-history curve at measuring point 5.
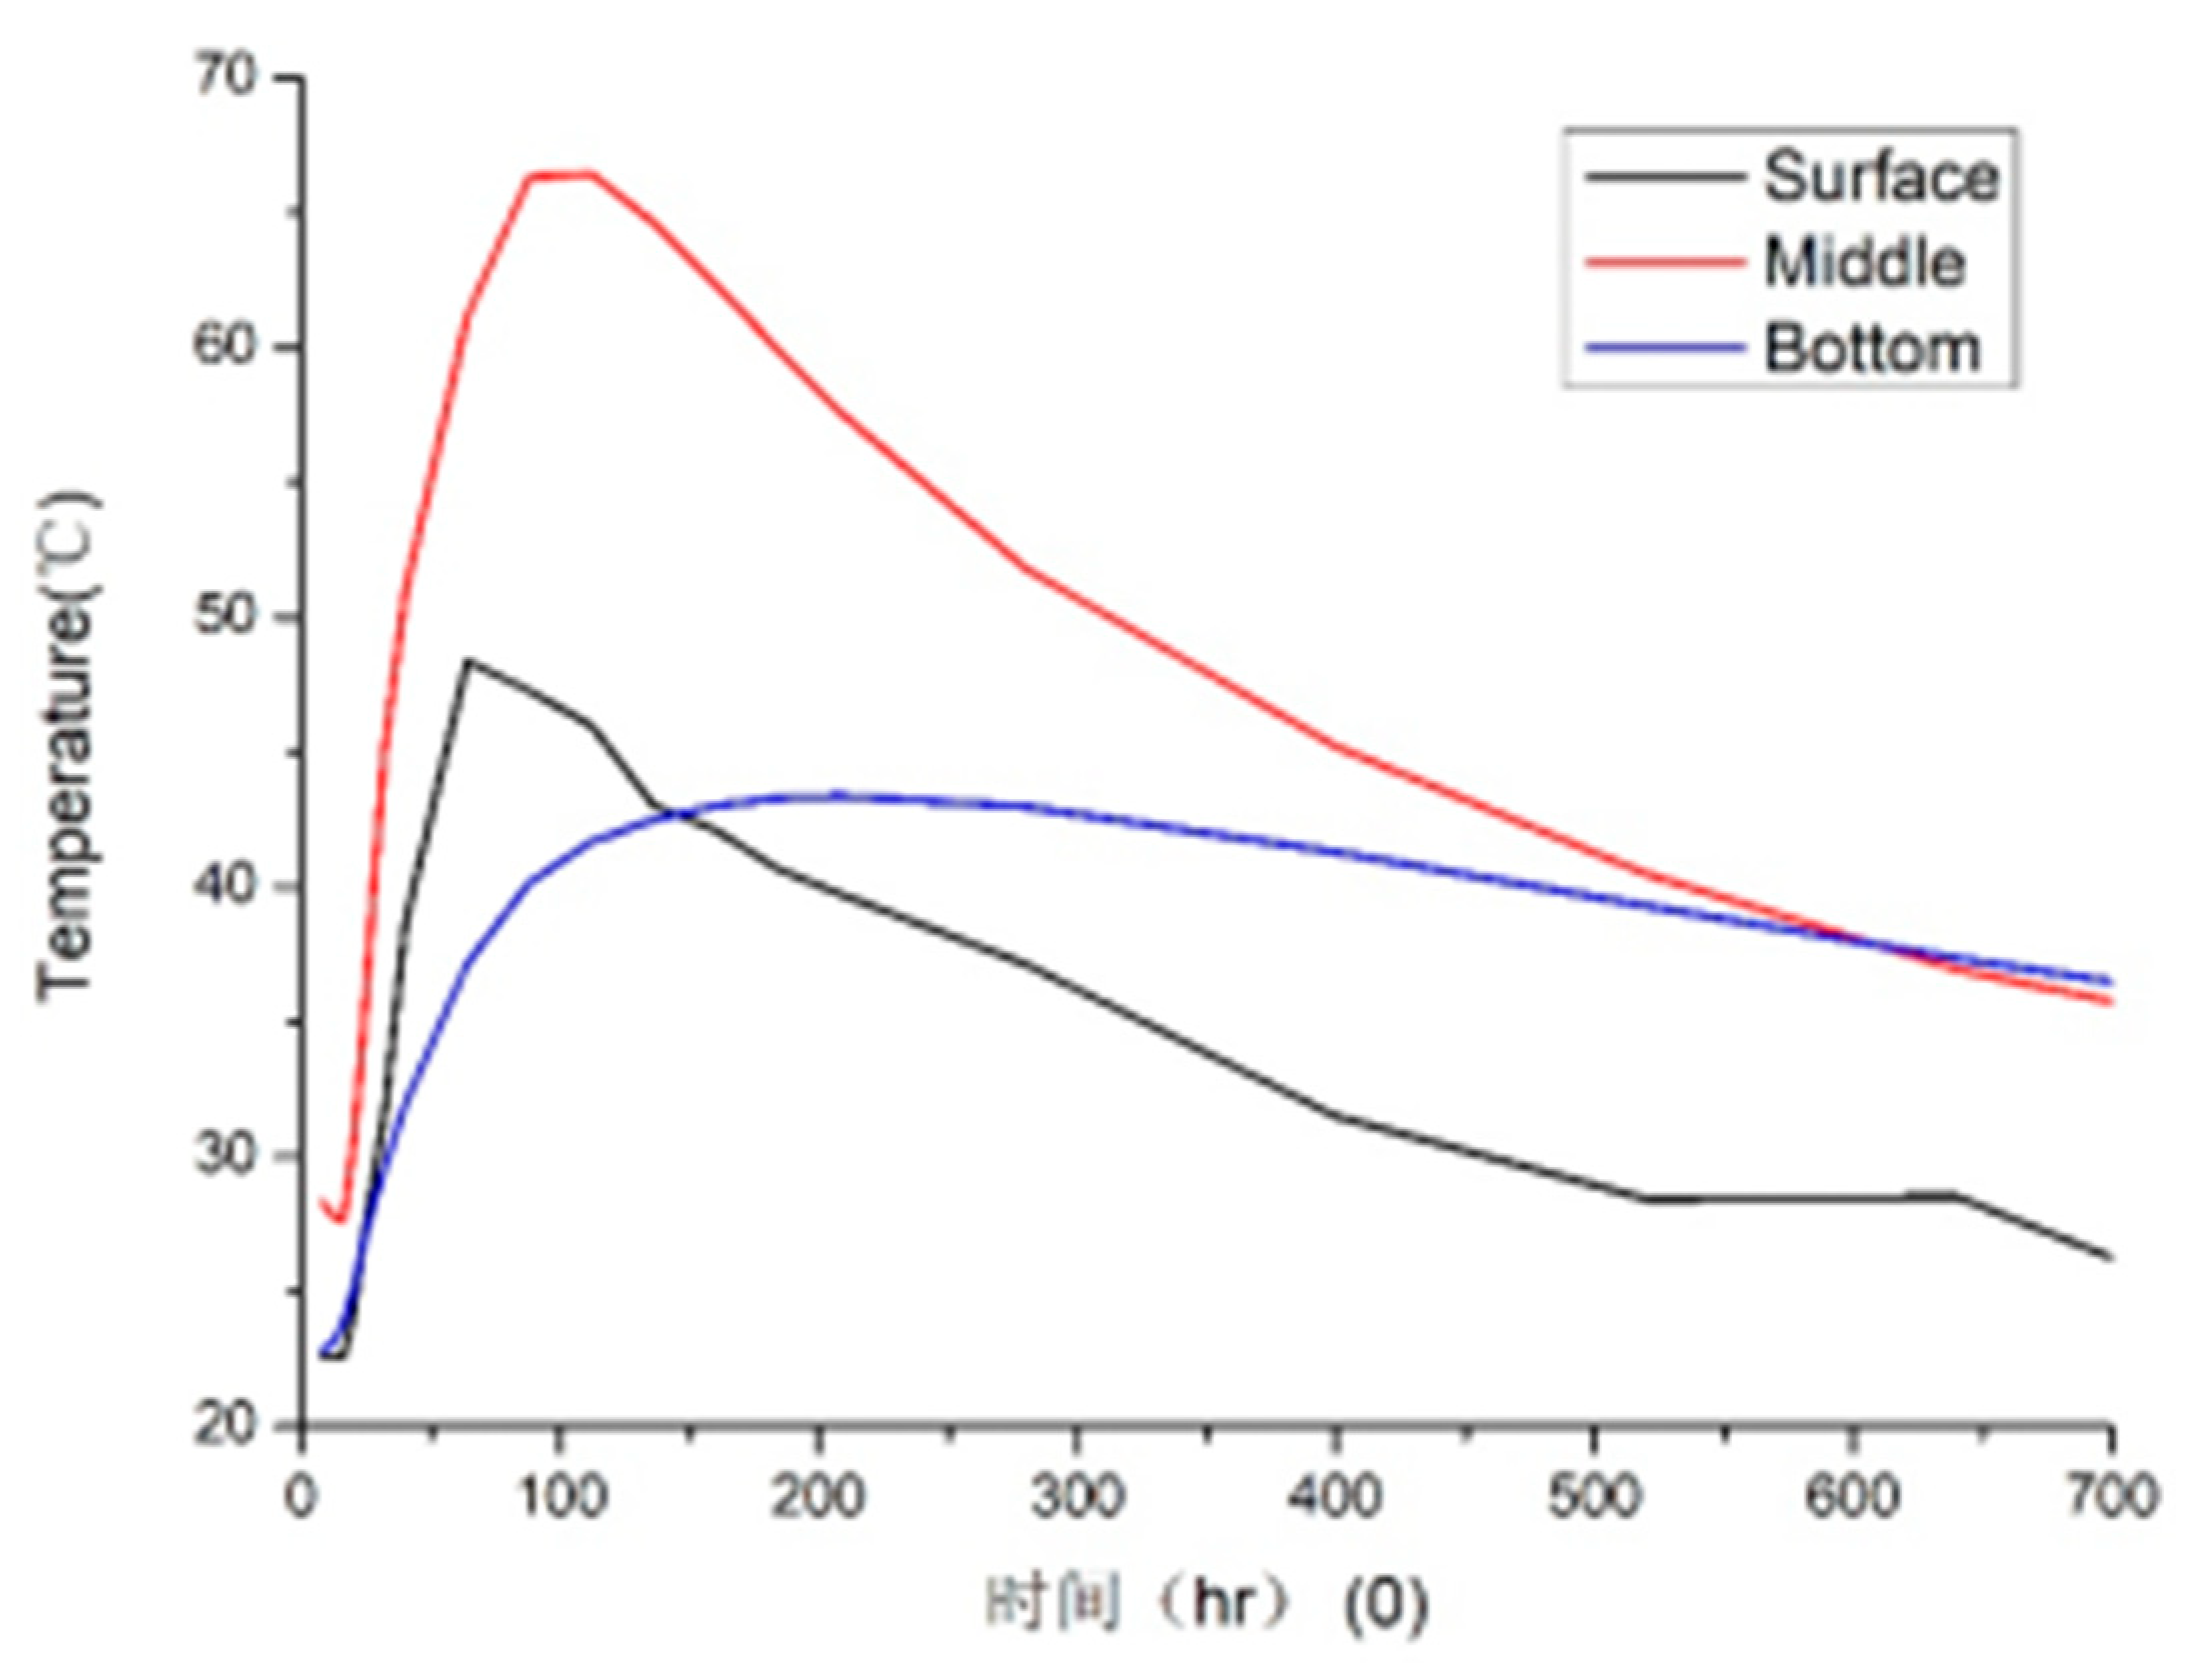
Figure 39.
Finite element calculated temperature time-history curve at measuring point 7.
4.4.4. Thermal Analysis of the Novel Placement Method
The temperature distribution in a circular slab can be conceptually decomposed into a linear component and a nonlinear radial component as expressed in Equations 15-16 and illustrated in Figure 40. The nonlinear component is primarily responsible for inducing self-equilibrating thermal stresses.
The implemented center-to-periphery placement strategy created a constructive time lag in the hydration heating process. The central, thinner region achieved and passed its peak temperature before the thicker peripheral region reached its thermal maximum. This phased thermal development effectively reduced the simultaneous temperature gradient between the center and edge of the raft, thereby mitigating the associated tensile thermal stress. Furthermore, analysis of the initial temperature rise (Figure 25, Figure 26 and Figure 27) confirms that this method also reduced the initial heating rate, contributing to an overall lower peak temperature—a critical factor in controlling thermal cracking.
5. Conclusions and Future Works
This study presents and validates an innovative center-to-periphery synchronous pouring method for large-volume cylindrical concrete raft foundations. The core of this approach lies in strategically utilizing the inherent time differences between construction stages to moderate the internal temperature field distribution, thereby mitigating the thermal stress caused by the center-edge temperature gradient, i.e., a primary driver of early-age cracking. A high-fidelity finite element model incorporating realistic thermodynamic parameters was developed and demonstrated reliable predictive capability, as evidenced by the good agreement between simulated and monitored temperature histories. Field application on the referenced project confirmed the absence of thermal cracks. The research establishes an integrated framework combining an optimized placement strategy, predictive simulation, and real-time monitoring, offering a practical methodology for quality control in the construction of similar mass concrete structures in nuclear power and other critical infrastructure projects.
The principal conclusions of this work are threefold. First, the proposed center-to-periphery synchronous pouring method is proven effective in moderating the temperature gradient and reducing early-age thermal cracking risk in mass concrete rafts. Second, the developed thermo-mechanical finite element model provides a reliable and conservatively safe tool for predicting temperature evolution, validating its utility for pre-construction planning and real-time curing guidance. Finally, the integrated implementation of the novel pouring technique, predictive simulation, and field monitoring constitutes a robust and effective framework for ensuring construction quality. This methodology provides a valuable and transferable reference for the execution of large-scale mass concrete projects where crack prevention is paramount.
While effective within its scope, this study has limitations that indicate avenues for future research. The current numerical model primarily addresses thermo-mechanical coupling; thus, enhancing it to a higher-fidelity multi-physics framework incorporating humidity and shrinkage effects would provide a more comprehensive understanding of crack evolution. Furthermore, the monitoring and data fusion approach, while successful, could be advanced by integrating emerging sensing technologies like distributed optical fiber sensing for richer, multi-dimensional real-time data acquisition. The present framework focuses on construction-phase crack control; its extension towards a full lifecycle digital twin, integrating IoT, BIM, and real-time simulation for long-term performance management, represents a logical and valuable progression. Lastly, the findings contribute to the knowledge base but highlight the need for broader validation and synthesis to inform the standardization of simulation-driven, intelligent workflows in industry guidelines.
Author Contributions
Conceptualization, Jie Xiong and Zhongli Yao; methodology, Jie Xiong; software, Jie Xiong; validation, Zhongli Yao; formal analysis, Jie Xiong; investigation, Degui Wang; resources, Degui Wang and Liping Xie; data curation, Jie Xiong and Zhongli Yao; writing—original draft preparation, Jie Xiong.; writing—review and editing, Liping Xie; supervision, Zhu Fan; project administration, Degui Wang, Liping Xie, Zhu Fan , and Zhongli Yao. All authors have read and agreed to the published version of the manuscript.
Funding
This research received no external funding.
Data Availability Statement
The original contributions presented in this study are included in the article. Further inquiries can be directed to the corresponding author.
Conflicts of Interest
All authors declare that the research was conducted in the absence of any commercial or financial relationships that could be construed as a potential conflict of interest.
References
- Zhou, L., Li, X., Yan, Q., Li, X., 2024. Study on the dynamic response of reinforced concrete nuclear containment under the impact of large aircraft. Nuclear Engineering and Design 417, 112880. [CrossRef]
- Ye, J., Ahn, H., Yu, Y., Cho, J.-Y., 2026. Influence of rebar configuration and steel liner detailing on the local impact response of reinforced concrete panels. International Journal of Impact Engineering 208, 105554. [CrossRef]
- B, C., Cho, P., Shittu, R.A., Kim, T.-Y., Rostron, P., AlFantazi, A., Yi, Y., 2022. Effect of Temperature Gradient on Chloride Ion Diffusion in Nuclear Reactor Containment Building Concrete. Energies 15 (15), 5581. [CrossRef]
- Thusa, B., Nguyen, D.-D., Azad, M.S., Lee, T.-H., 2023. Seismic performance evaluation of reactor containment building considering effects of concrete material models and prestressing forces. Nuclear Engineering and Technology 55 (5), 1567-1576. [CrossRef]
- Li, J., Hu, Z., 2025. Systematic seismic simulation for nuclear island buildings in CPCRF site: Insights into interfacial discontinuity. Soil Dynamics and Earthquake Engineering 191, 109221. [CrossRef]
- Feng, D., Chu, M., El Naggar, M.H., Ren, Y., Gong, W., Dai, G., Li, B., Wang, Y., 2025. Seismic response of nuclear power plants on different foundations: Large-scale shake table tests. Journal of Building Engineering 112, 113694. [CrossRef]
- Ikumi, T., Cairó, I., Boix-Cots, D., Herrera-Mesén, C., Aguado, A., de la Fuente, A., 2025. Evaluating data transmission performance of a UHF sensor for wireless temperature monitoring in mass concrete. Journal of Infrastructure Intelligence and Resilience 4 (4), 100172. [CrossRef]
- Prasanna, W.G.J., Subhashini, A.P., Jayawardhana, A.M.C.C., 2016. Cracking due to Temperature Gradient in Concrete. Engineer - Journal of the Institution of Engineers, Sri Lanka 43 (4), 43. [CrossRef]
- Song, Z., Wang, K., 2025. Case study on thermal conductivity-driven cooling optimization for mass concrete raft foundations in loess environments: Experimental and numerical validation. Case Studies in Thermal Engineering 74, 106938. [CrossRef]
- Hu, Y., Chen, J., Zou, F., He, M., Mao, J., Liu, X., Zhou, C., Yuan, Z., 2021. A comparative study of temperature of mass concrete placed in August and November based on on-site measurement. Case Studies in Construction Materials 15, e00694. [CrossRef]
- Singh, M.P., Sen, S., Pathak, H., Dogra, A.B., 2024. Early age cracking relevant to mass concrete dam structures during the construction schedule. Construction and Building Materials 411, 134739. [CrossRef]
- Lin, F., Li, H., 2017. Safety analysis of nuclear containment vessels subjected to strong earthquakes and subsequent tsunamis. Nuclear Engineering and Technology 49 (5), 1079-1089. [CrossRef]
- Yang, K.-H., Kwon, S.-J., Hwang, J.-W., Yoon, Y.-S., 2023. Temperature effect on strength and chloride migration in nuclear power plant concrete. Construction and Building Materials 405, 133345. [CrossRef]
- Liu, J., Ou, G., Qiu, Q., Xing, F., Tang, K., Zeng, J., 2018. Atmospheric chloride deposition in field concrete at coastal region. Construction and Building Materials 190, 1015-1022. [CrossRef]
- Gao, Q., Wang, T., Zhao, T., Zhang, Y., Yue, X., Guo, T., Wu, S., Ma, J., 2025. Macro-scale analysis of chloride penetration and durability in coastal concrete. Journal of Building Engineering 113, 113953. [CrossRef]
- Chen, J., Zhang, W., Tang, Z., Huang, Q., 2020. Experimental and numerical investigation of chloride-induced reinforcement corrosion and mortar cover cracking. Cement and Concrete Composites 111, 103620. [CrossRef]
- Li, Y., Nie, L., Wang, B., 2014. A numerical simulation of the temperature cracking propagation process when pouring mass concrete. Automation in Construction 37, 203-210. [CrossRef]
- Li, X., Yu, Z., Chen, K., Deng, C., Yu, F., 2023. Investigation of temperature development and cracking control strategies of mass concrete: A field monitoring case study. Case Studies in Construction Materials 18, e02144. [CrossRef]
- Ha, J.-H., Jung, Y.S., Cho, Y.-G., 2014. Thermal crack control in mass concrete structure using an automated curing system. Automation in Construction 45, 16-24. [CrossRef]
- Lu, X., Chen, B., Tian, B., Li, Y., Lv, C., Xiong, B., 2021. A new method for hydraulic mass concrete temperature control: Design and experiment. Construction and Building Materials 302, 124167. [CrossRef]
- Zhang, Y., Wang, S., He, S., Hao, X., 2023. Analysis of factors influencing the temperature field variation in mass concrete during hydration heat release. Case Studies in Thermal Engineering 52, 103737. [CrossRef]
- Oyebisi, S., Alomayri, T., 2023. Artificial intelligence-based prediction of strengths of slag-ash-based geopolymer concrete using deep neural networks. Construction and Building Materials 400, 132606. [CrossRef]
- Kim, H., Lee, S., 2023. Machine learning approach for predicting early-age thermal cracking potential in concrete bridge piers. Engineering Structures 279, 115432. [CrossRef]
- Qian, C., Zheng, T., Zhang, X., 2022. Optimization of cooling system parameters with temperature field of mass concrete during hydration. Applied Thermal Engineering 202, 117789. [CrossRef]
- Zhao, Y., Liu, G., He, S., 2021. Optimization of cooling system parameters with temperature field of mass concrete. Heat Transfer Engineering 42 (12), 1089-1100. [CrossRef]
- Chen, Y., Zhang, L., Wang, Z., 2020. Influence of temperature rising inhibitor on temperature and cracking resistance of mass concrete. Construction and Building Materials 258, 120152. [CrossRef]
- El-Mir, A., Assaad, J.J., Nehme, S.G., El-Hassan, H., 2022. Correlating strength and durability to time-temperature profiles of high-performance mass concrete. Case Studies in Construction Materials 16, e01055. [CrossRef]
- Shen, D., Liu, C., Kang, J., 2022. Prediction of thermal stresses in mass concrete structures with experimental and analytical results. Case Studies in Construction Materials 18, e02098. [CrossRef]
- Shen, D., Liu, C., 2023. Research on thermal-humidity-force coupling characteristics of mass concrete structures under temperature control. Construction and Building Materials 381, 130542. [CrossRef]
- Xiong, J., Cao, L., Wang, D., 2023. VVER-1200 nuclear island raft foundation mass concrete construction and transient temperature field simulation analysis. The Proceedings of the International Conference on Nuclear Engineering (ICONE) 2023 (30), 1902. [CrossRef]
Figure 1.
Flowchart of the proposed integrated quality control framework for mass concrete construction in nuclear island raft foundations.
Figure 1.
Flowchart of the proposed integrated quality control framework for mass concrete construction in nuclear island raft foundations.
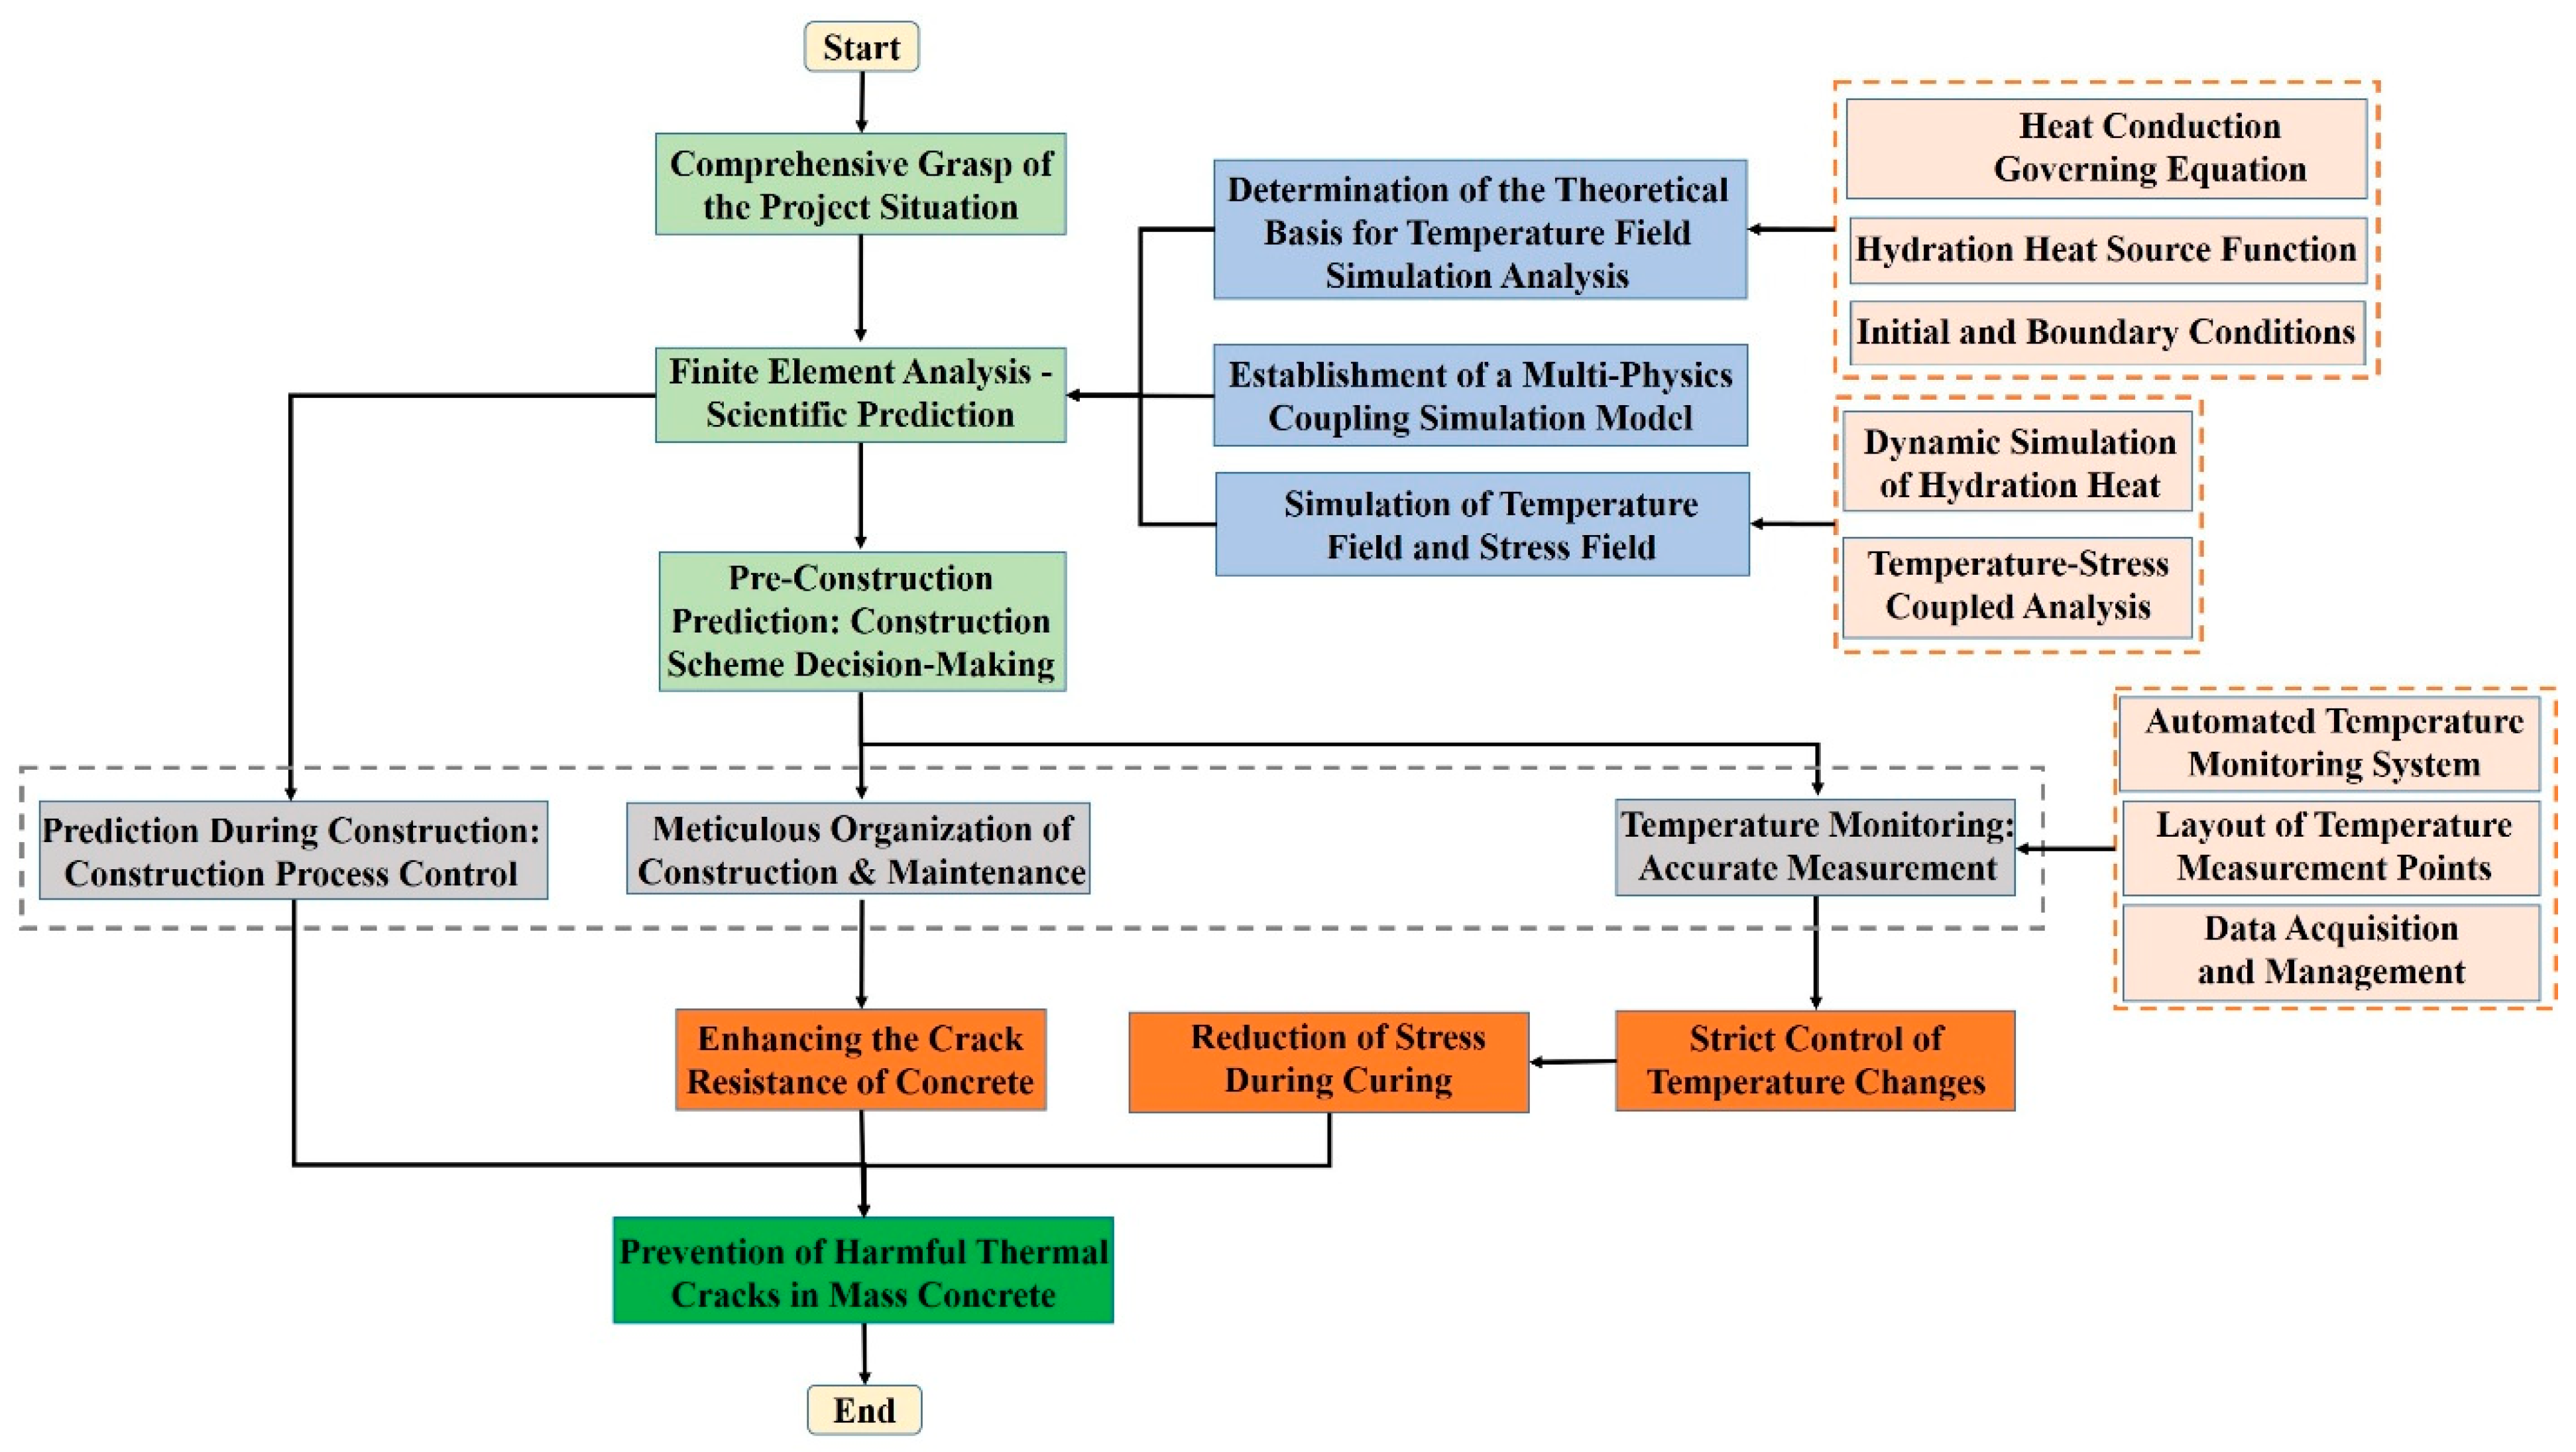
Figure 2.
Schematic of the automated temperature monitoring system.
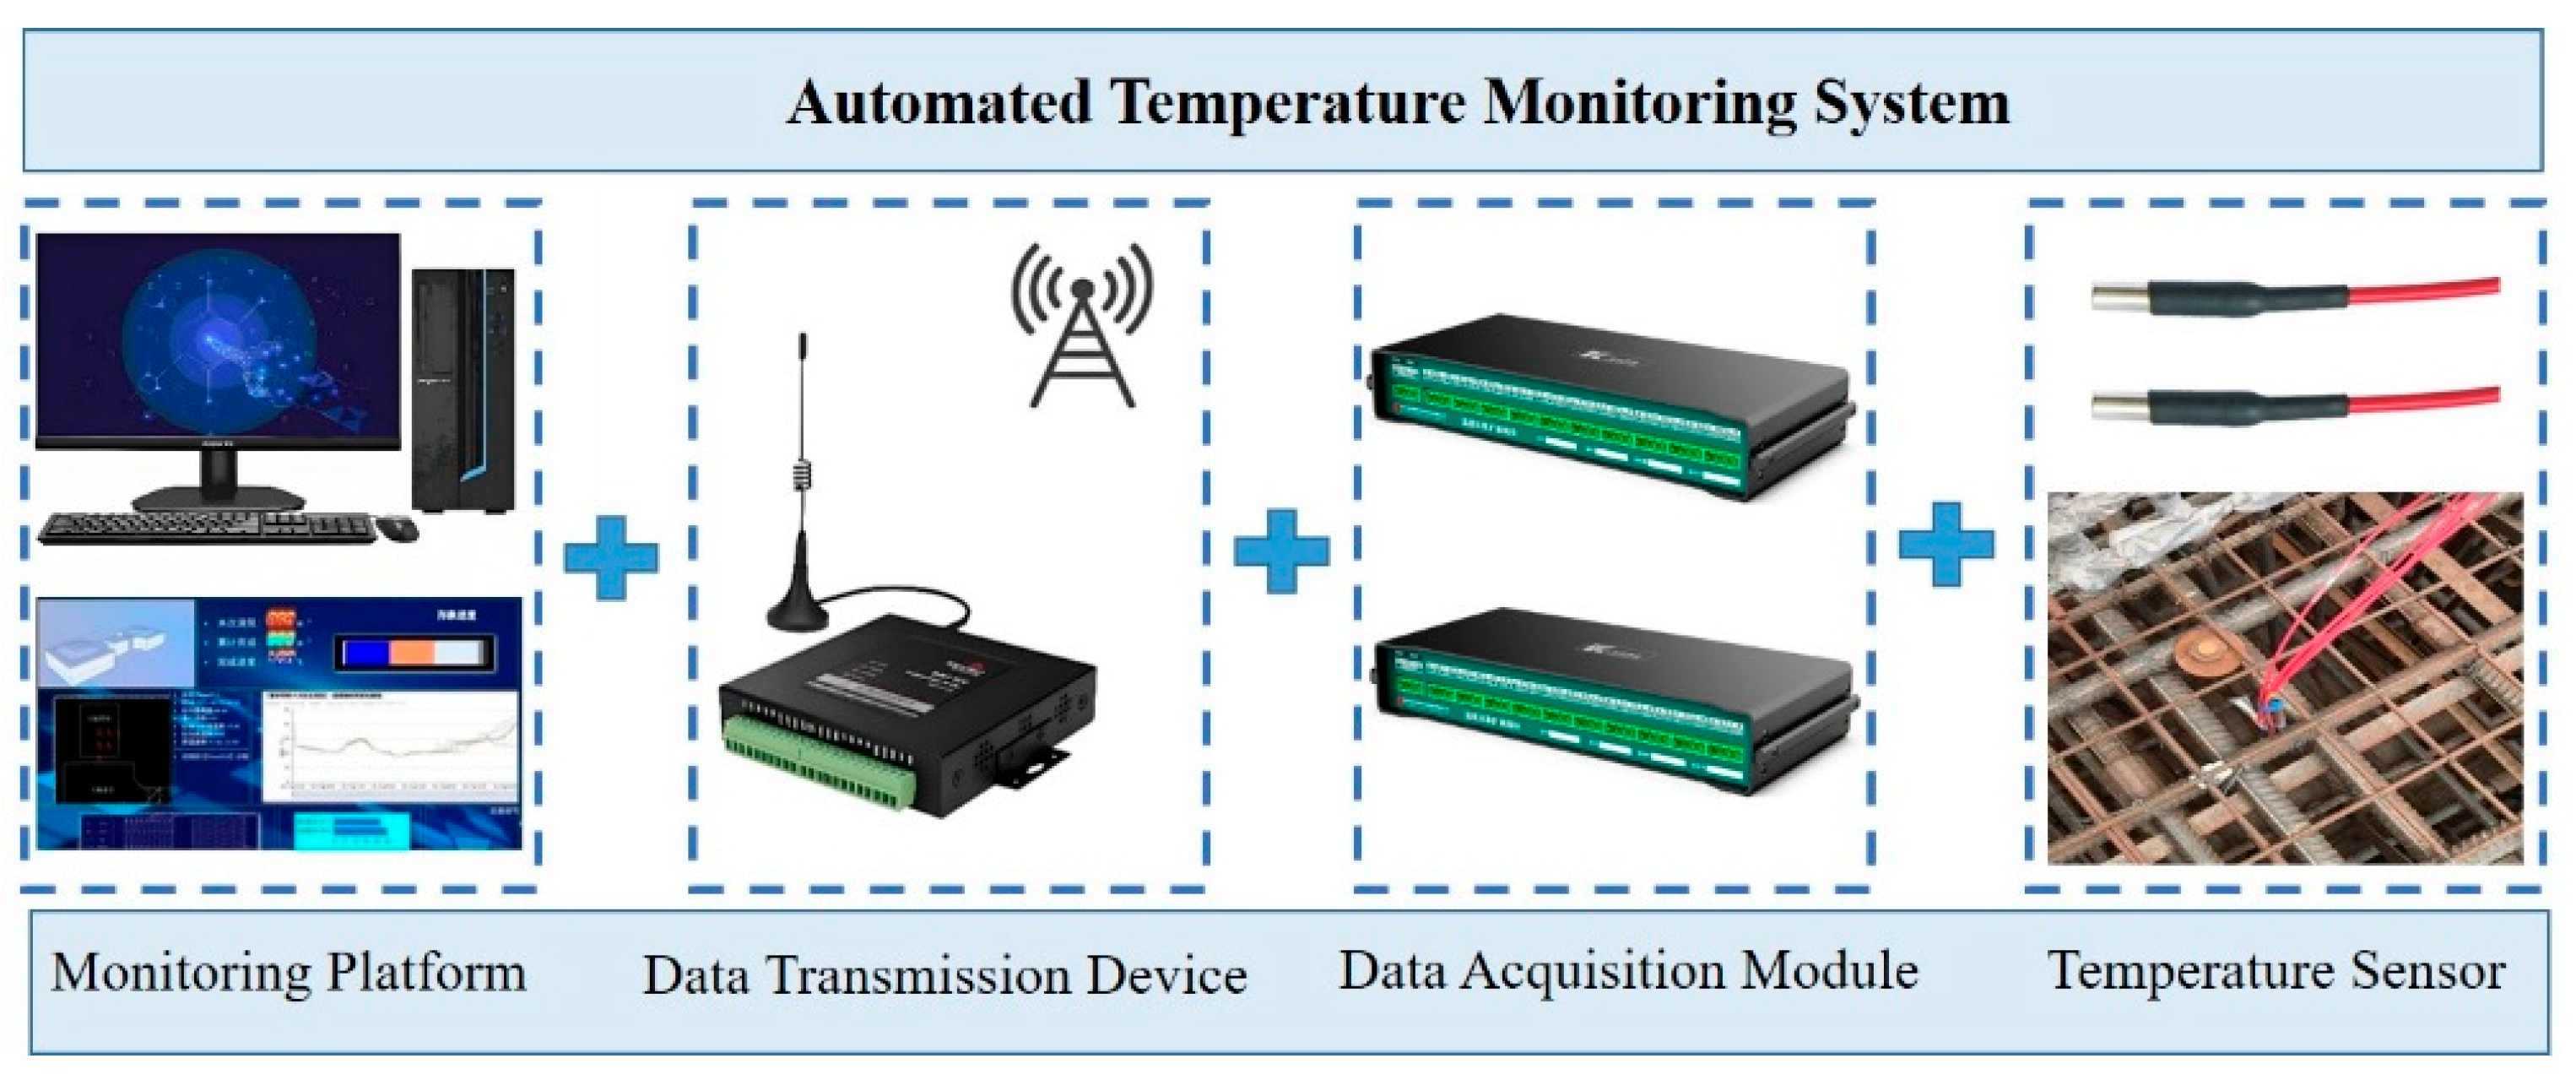
Figure 3.
Working principle of the automated temperature monitoring system.
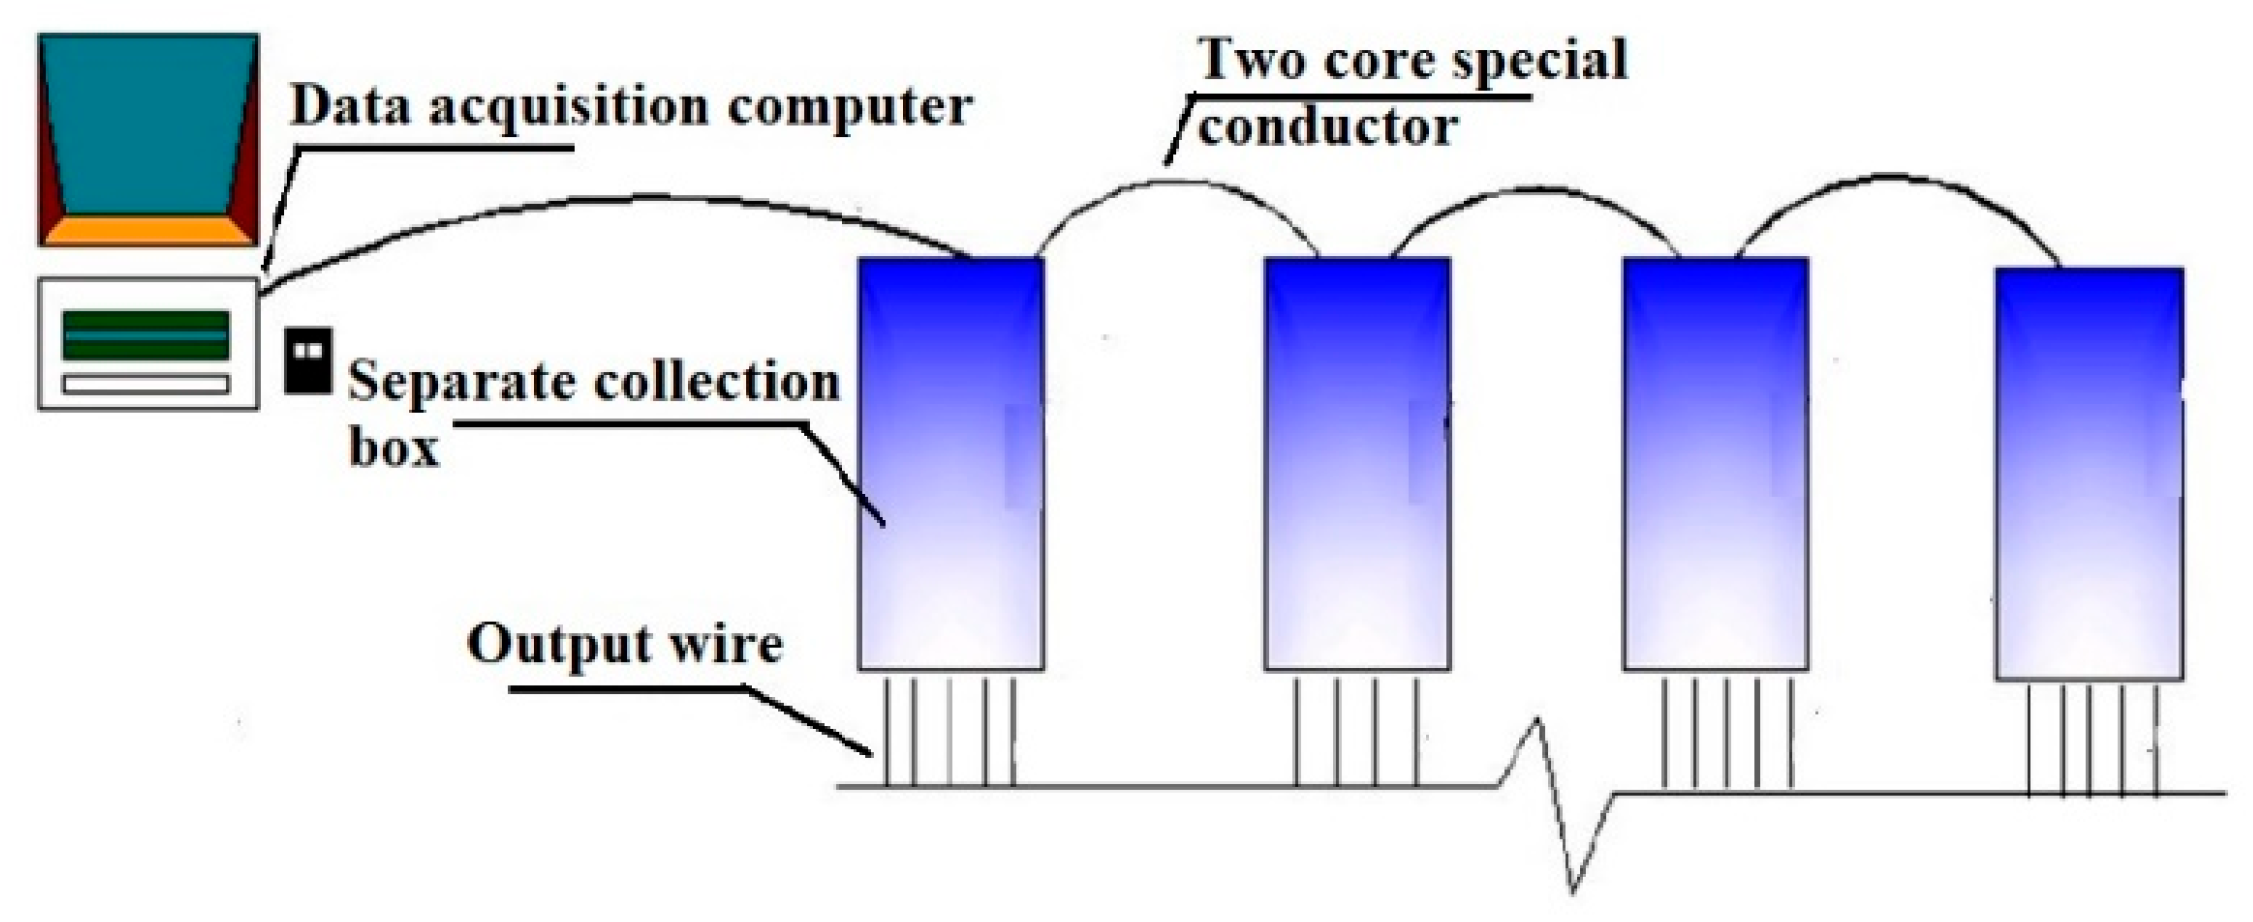
Figure 4.
Traditional mass concrete placement methods: (a) full-layer, (b) segmental-layer, (c) inclined-layer (1 – Formwork; 2 – Fresh concrete).
Figure 4.
Traditional mass concrete placement methods: (a) full-layer, (b) segmental-layer, (c) inclined-layer (1 – Formwork; 2 – Fresh concrete).
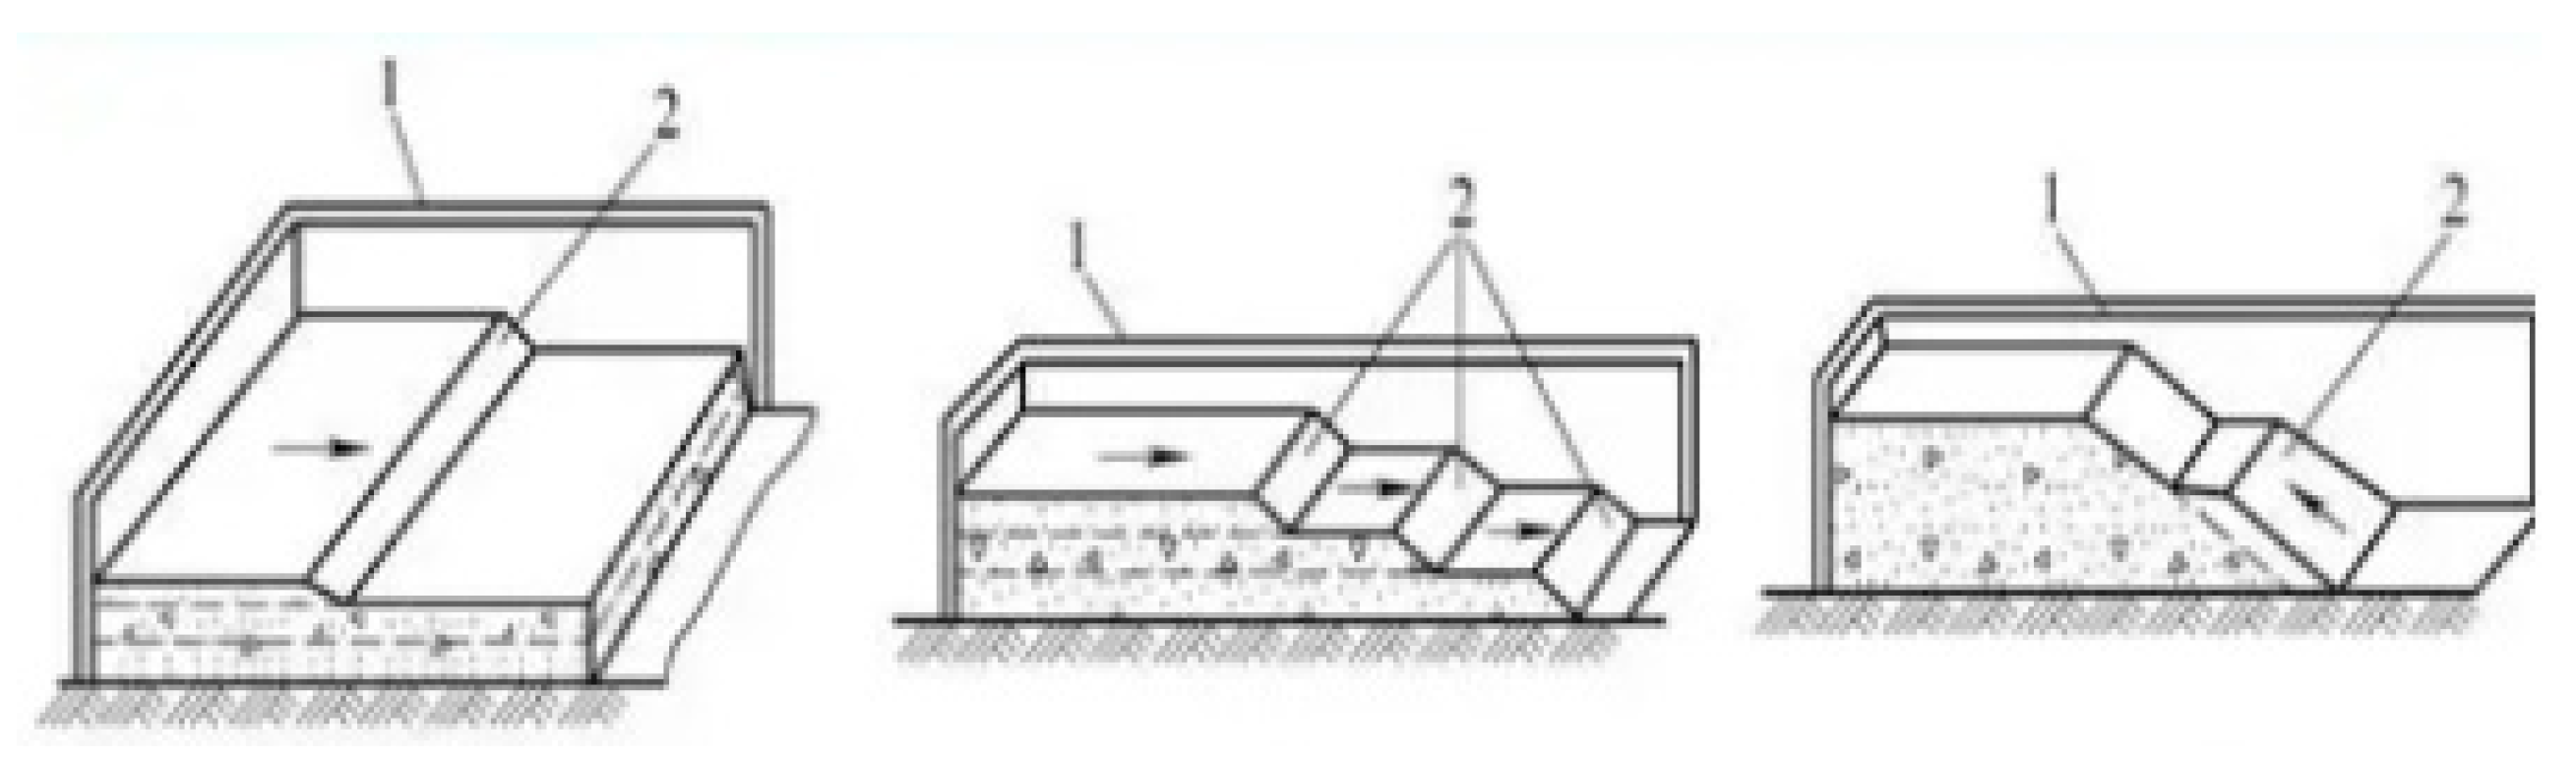
Figure 7.
Rendering of the phase II project of the Xudapu NPP in northern China.
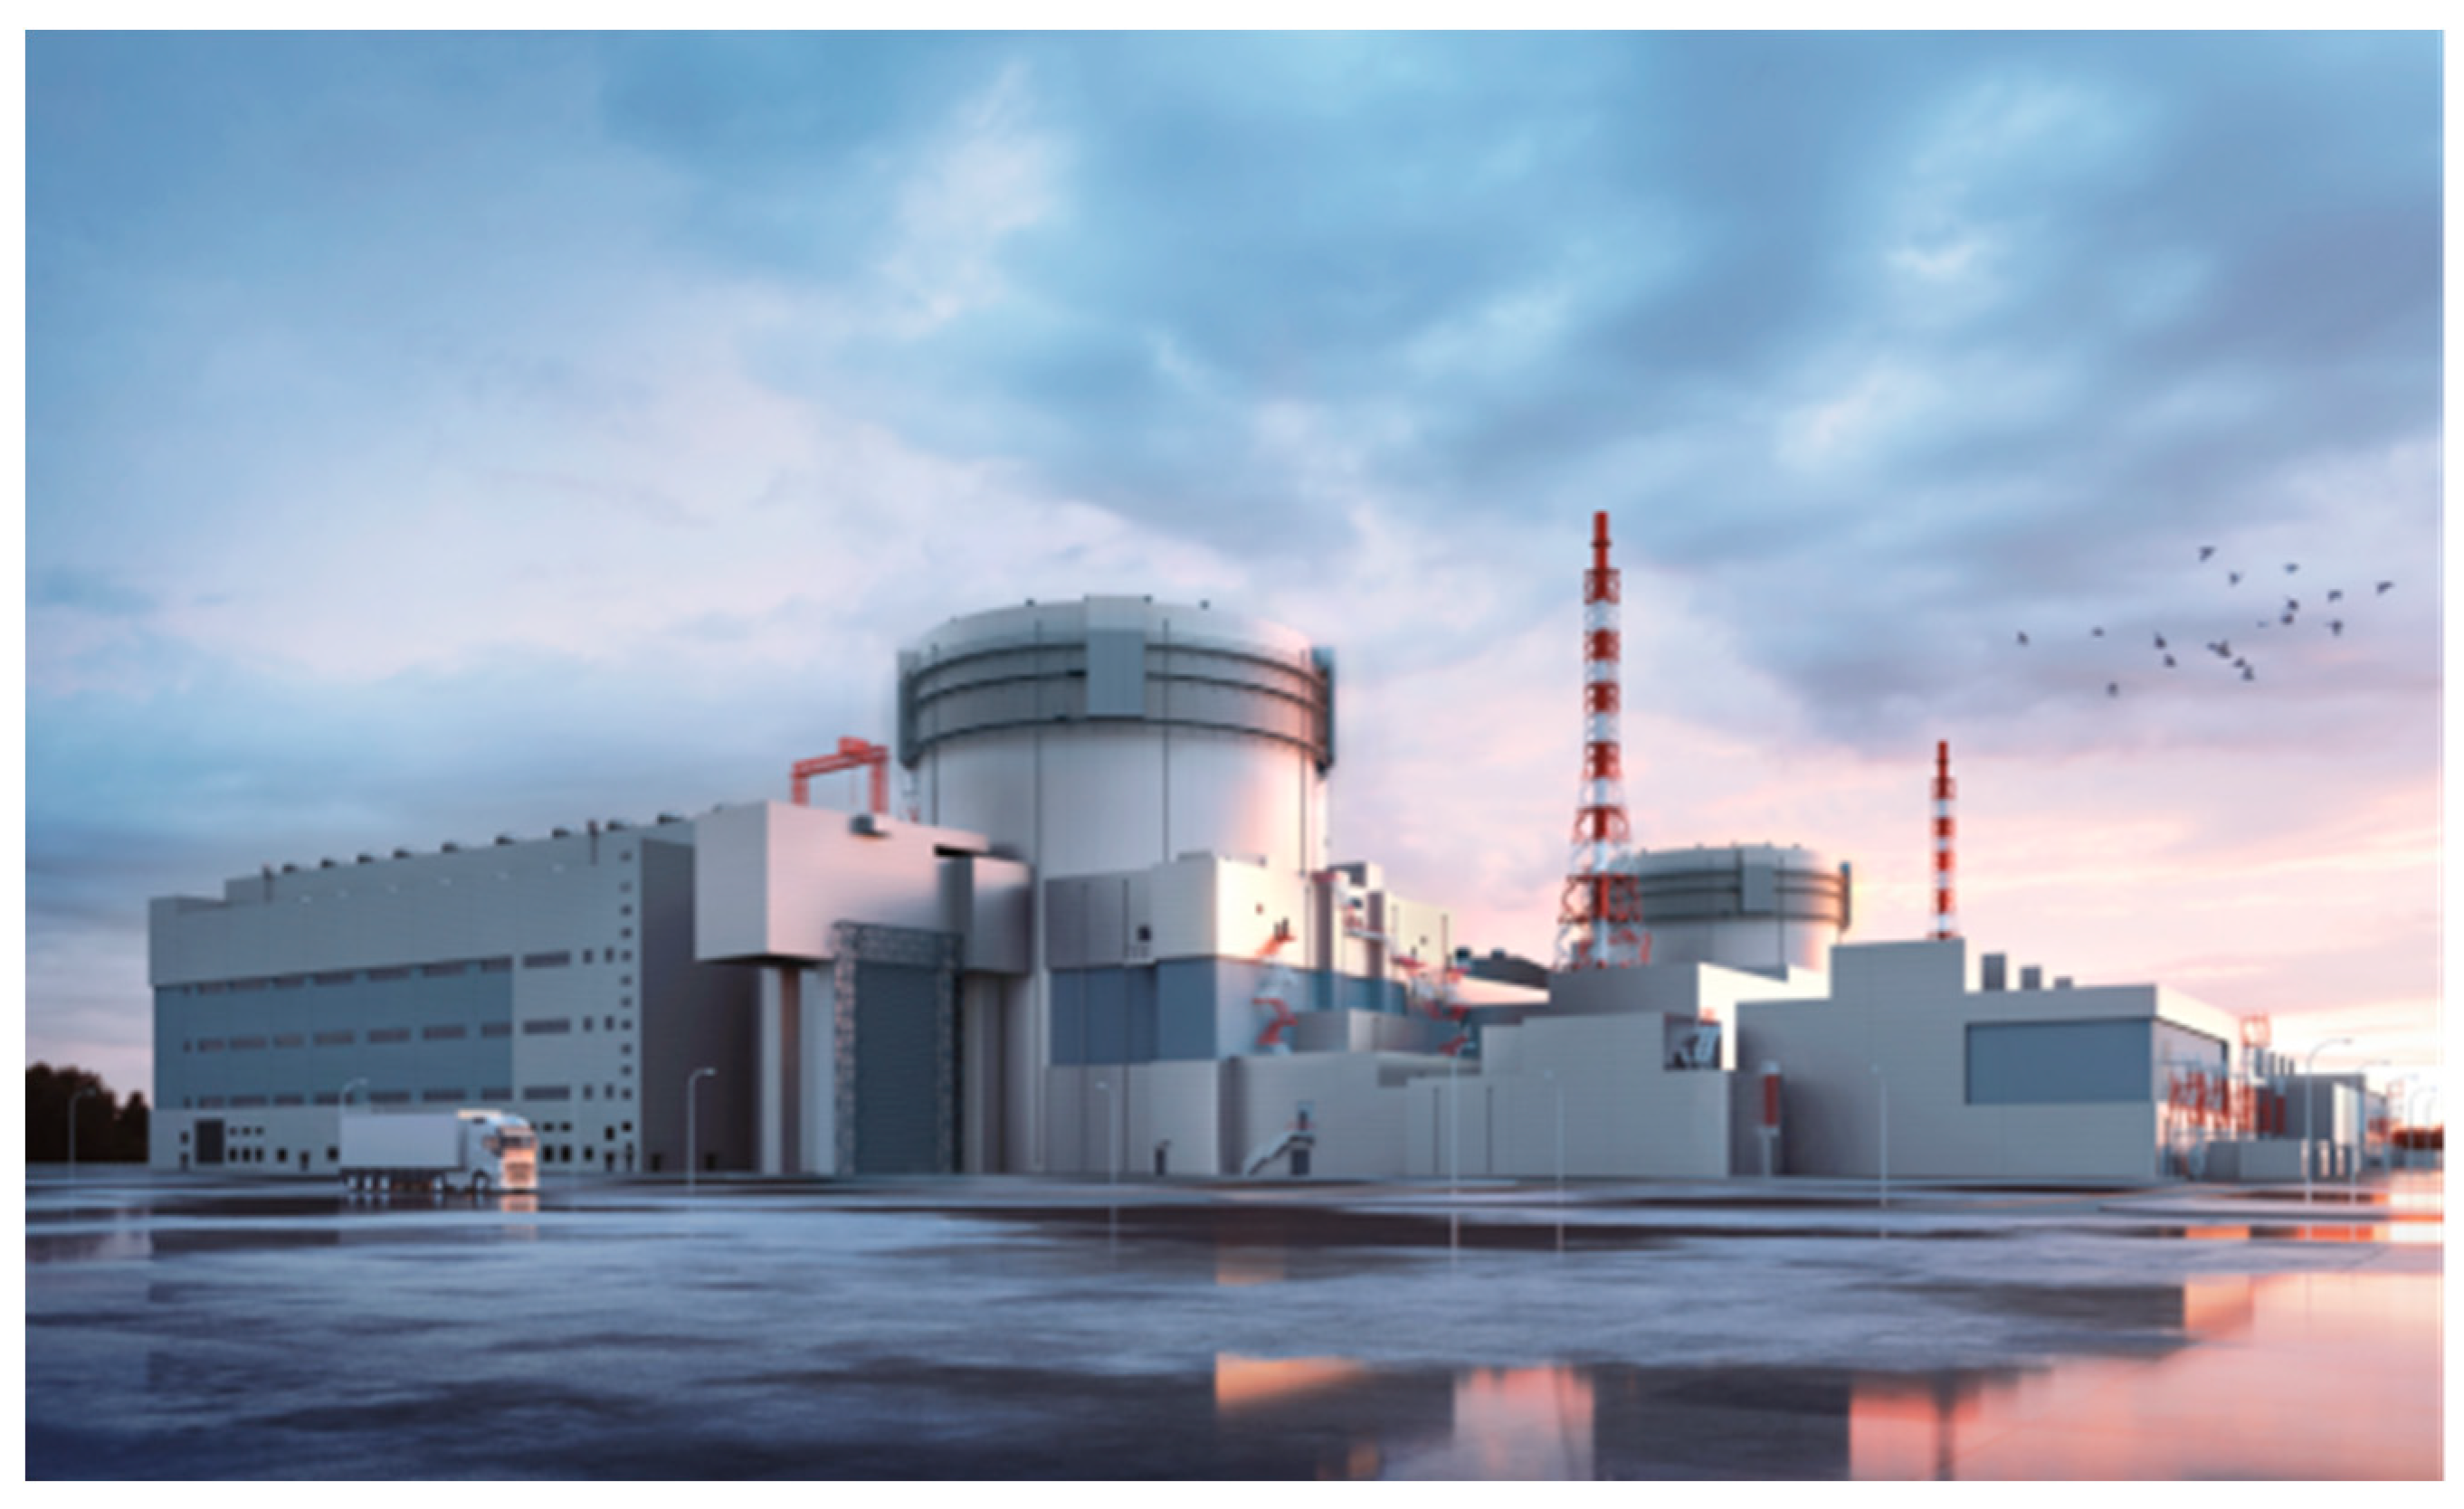
Figure 8.
3D Model of the nuclear island raft foundation for the VVER-1200 reactor type NPP.
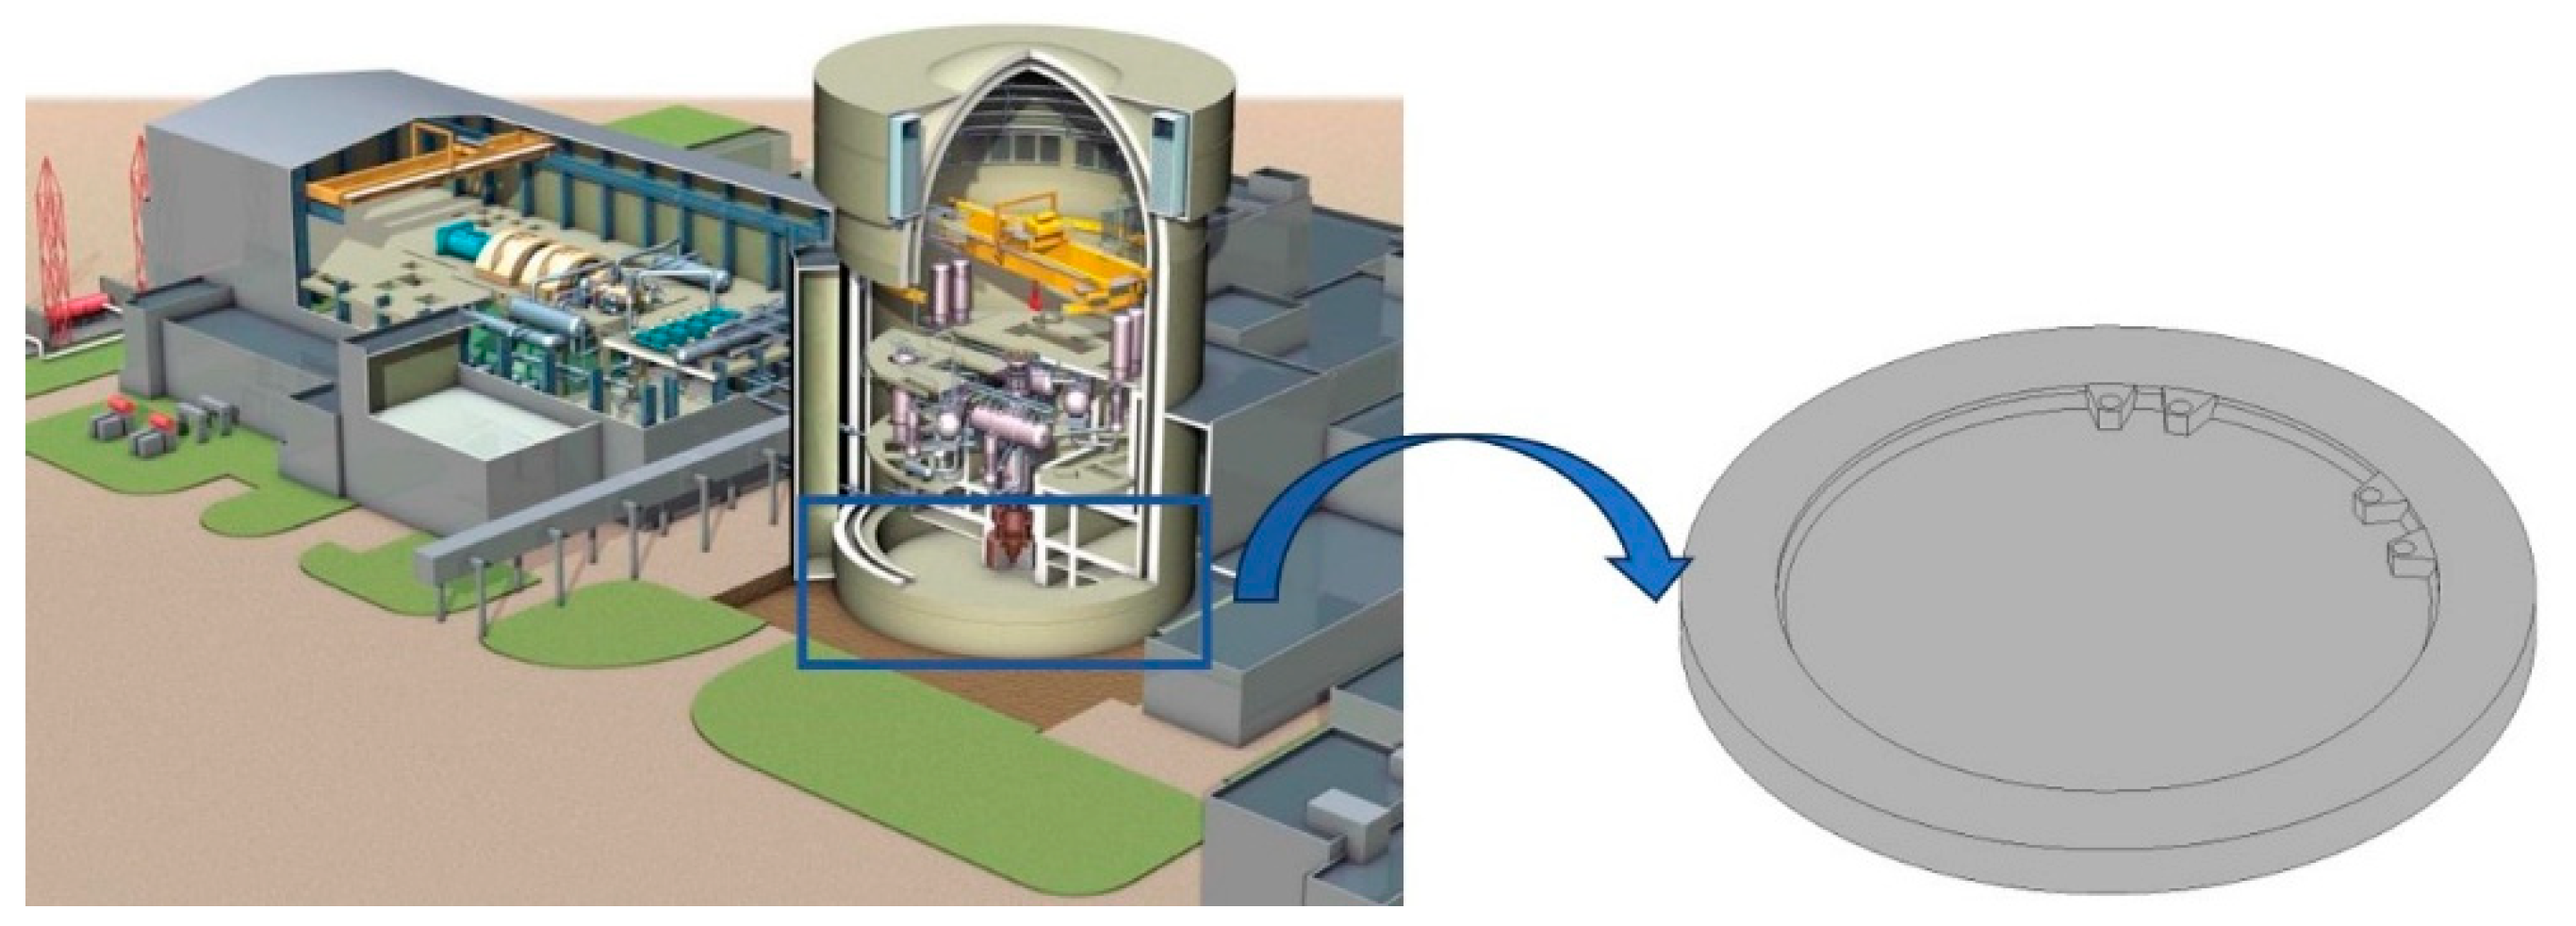
Figure 9.
Cross-section of the nuclear island raft foundation.

Figure 10.
Concrete pouring direction of the 1st~23rd Layers : (a) the 1st~17th Layers, (b) the 18th~23rd Layers.
Figure 10.
Concrete pouring direction of the 1st~23rd Layers : (a) the 1st~17th Layers, (b) the 18th~23rd Layers.
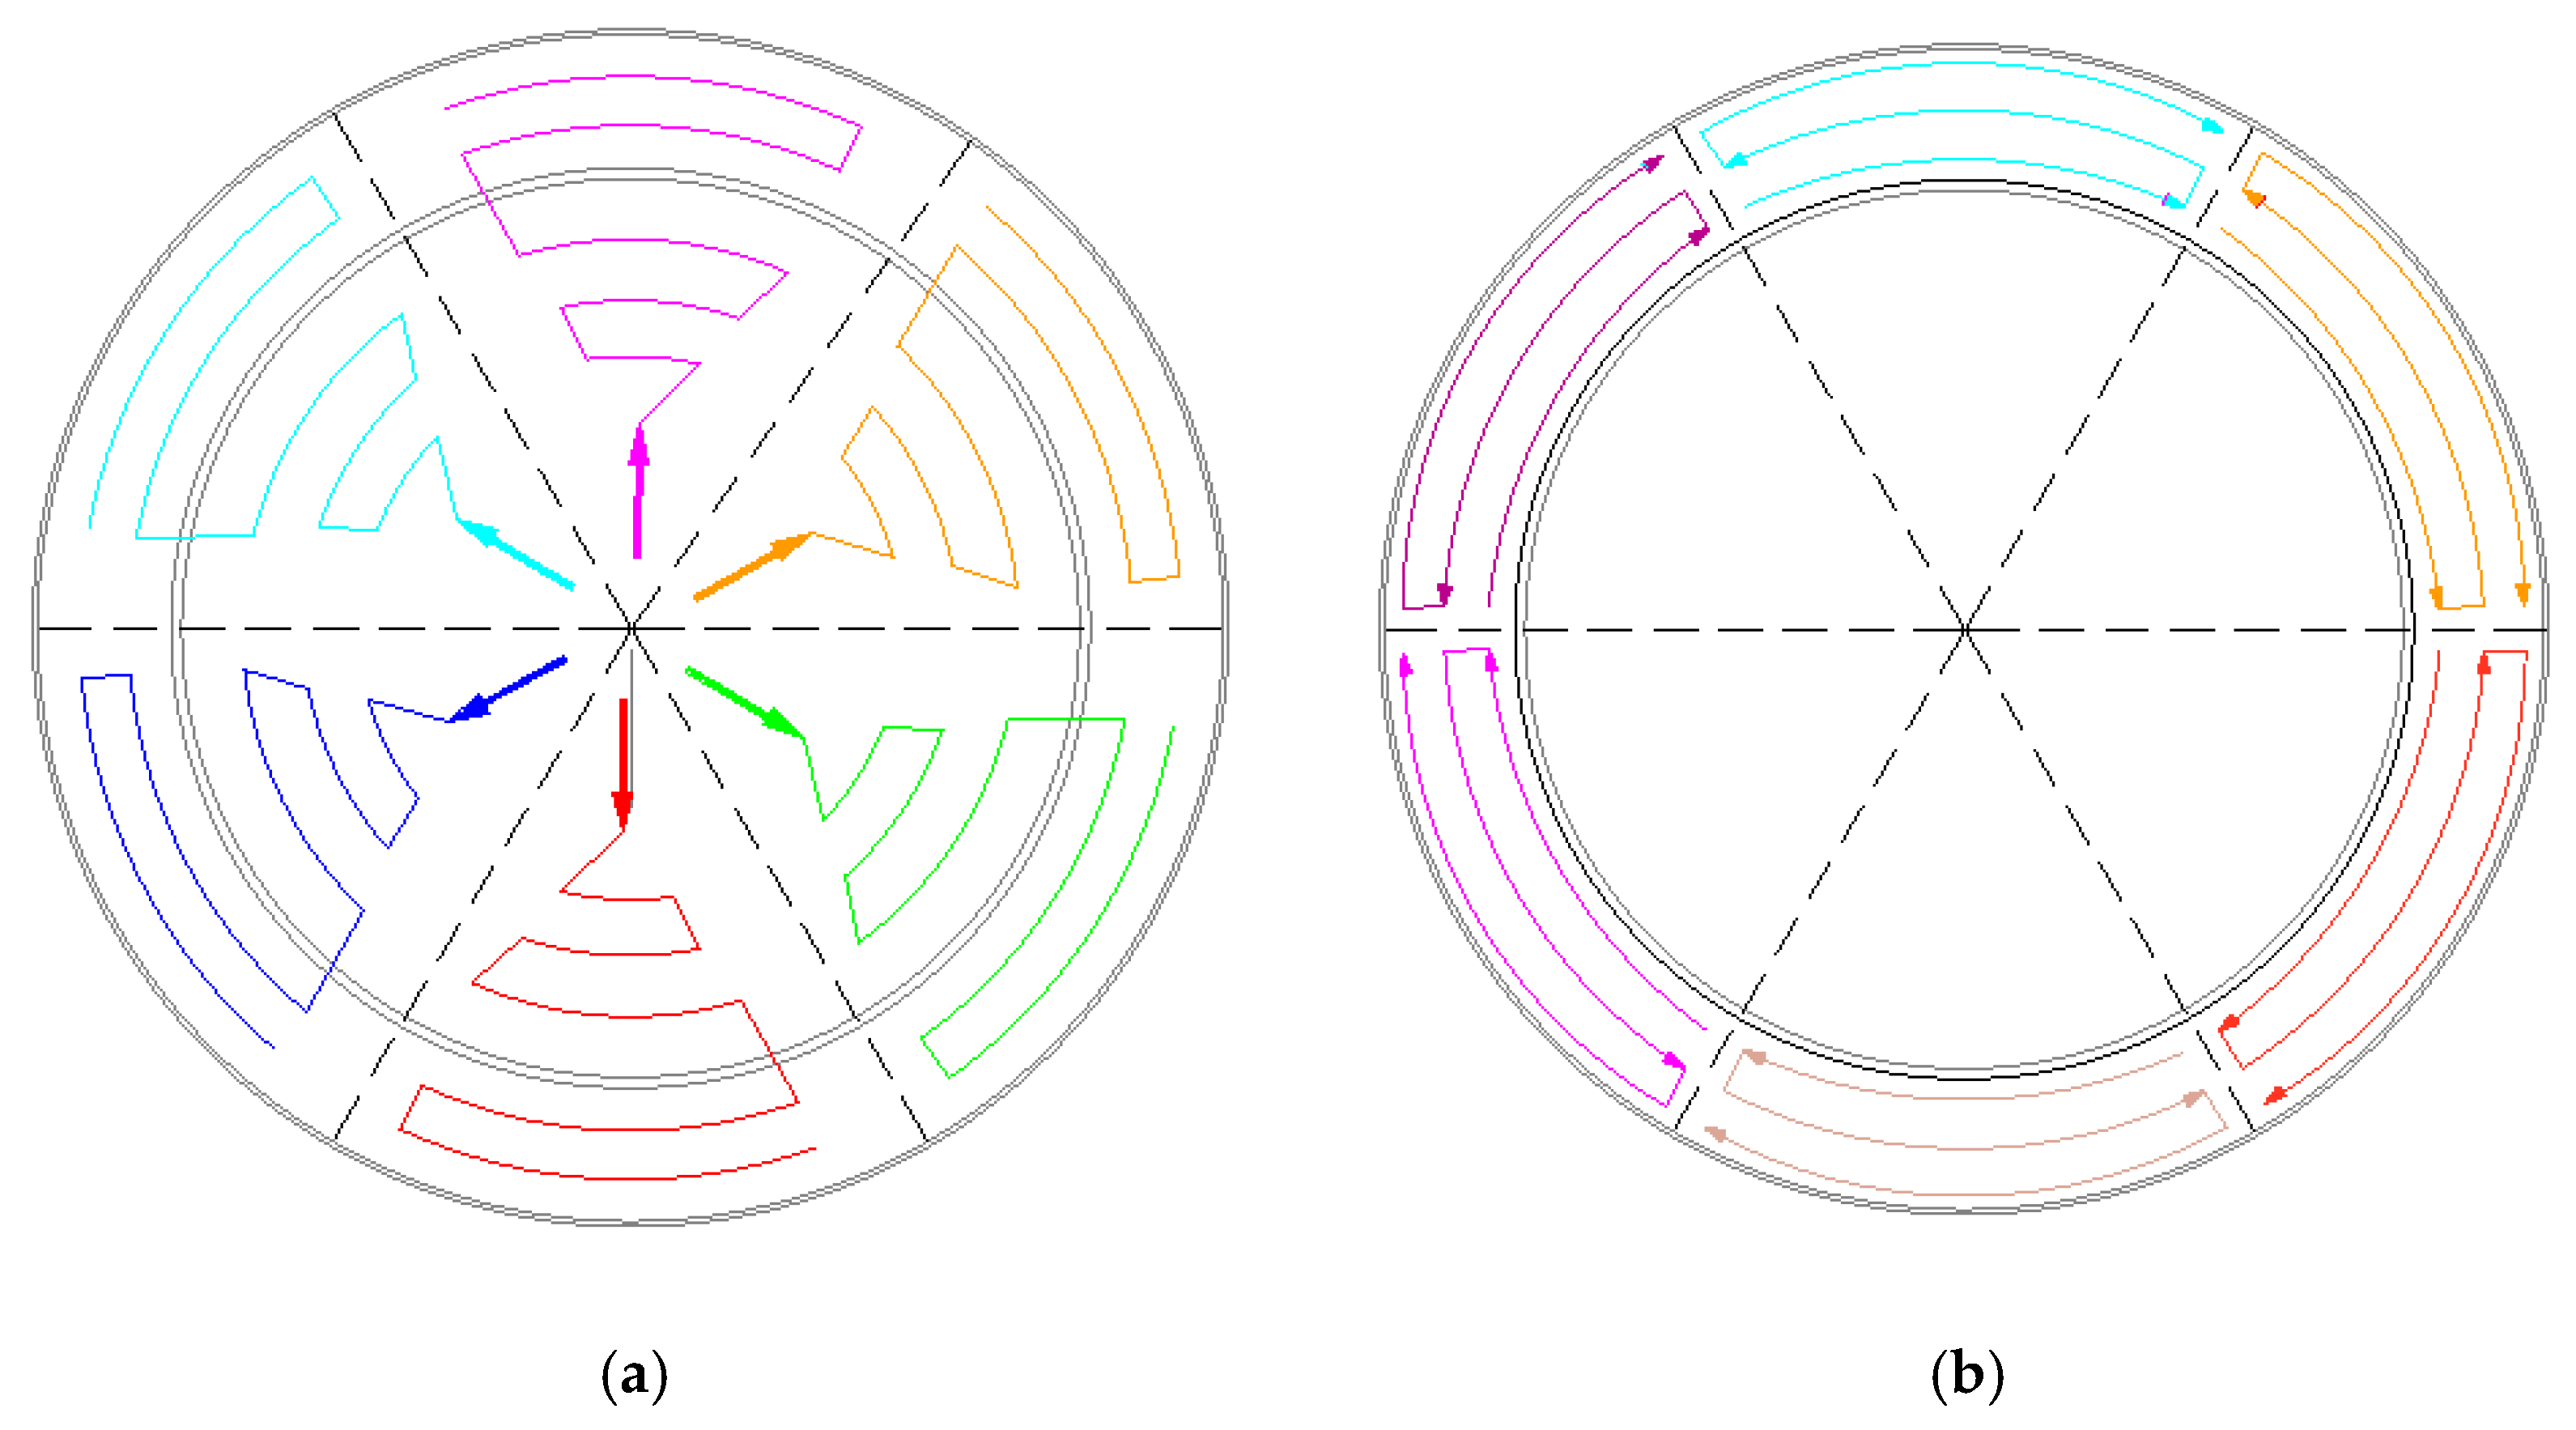
Figure 11.
Sequential diagram of layered pouring for the nuclear island raft foundation.
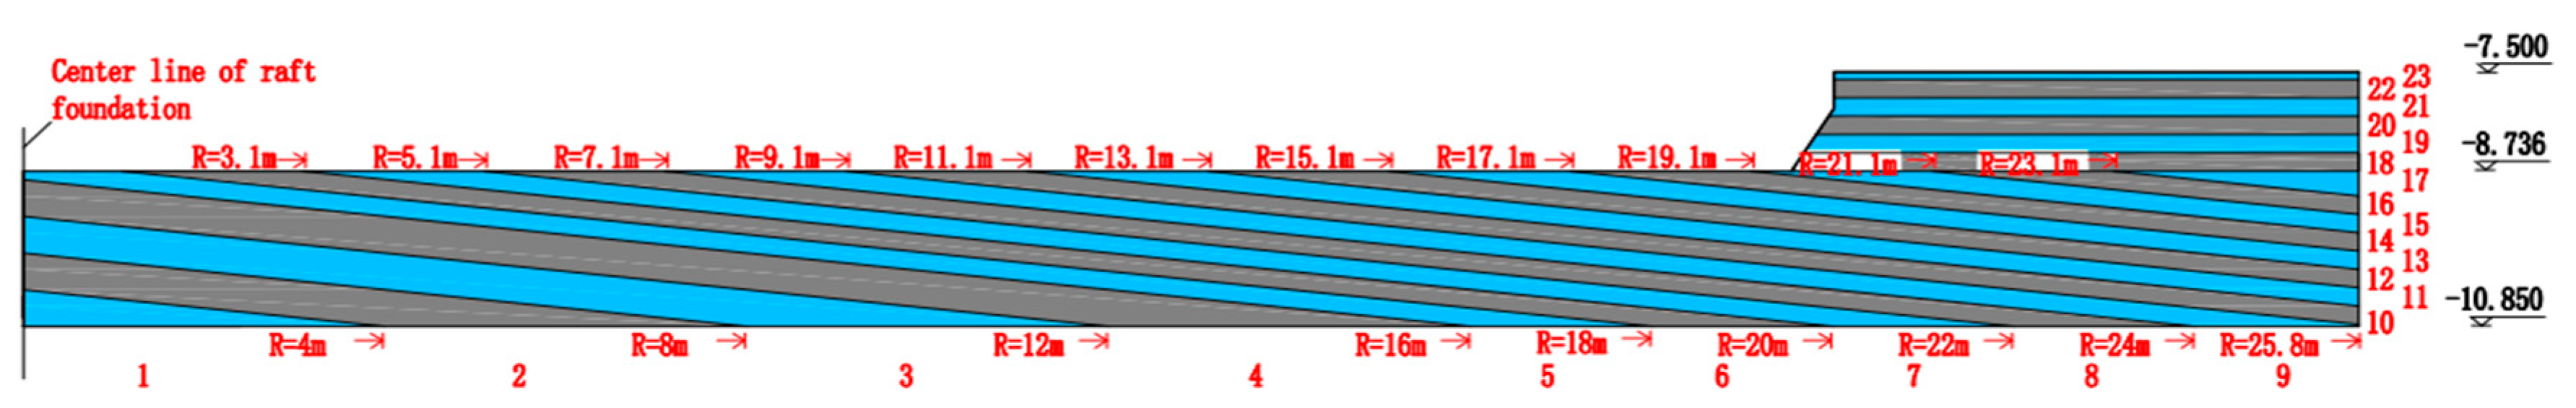
Figure 12.
Phased Diagram of Layered Pouring for the Nuclear Island Raft Foundation.
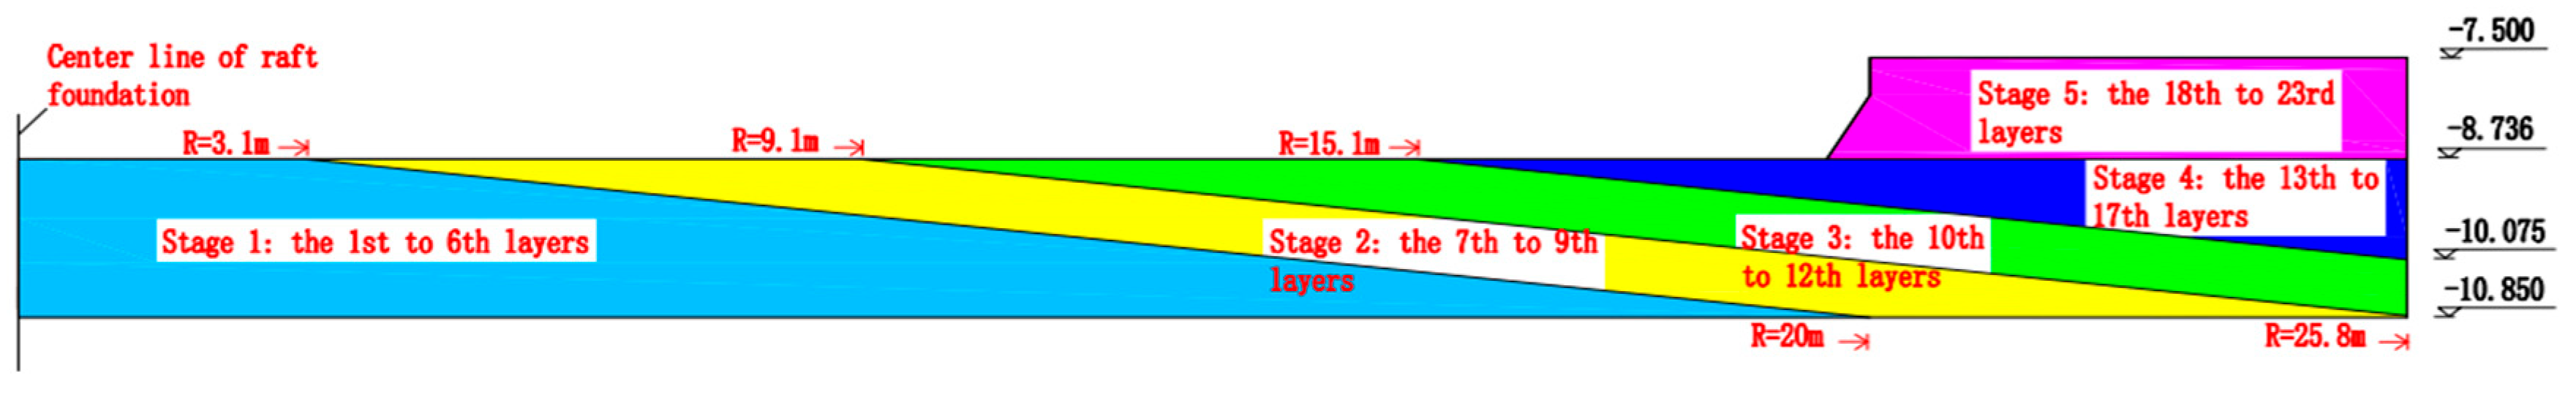
Figure 13.
3D Diagram of layered pouring phases for the nuclear island raft foundation.
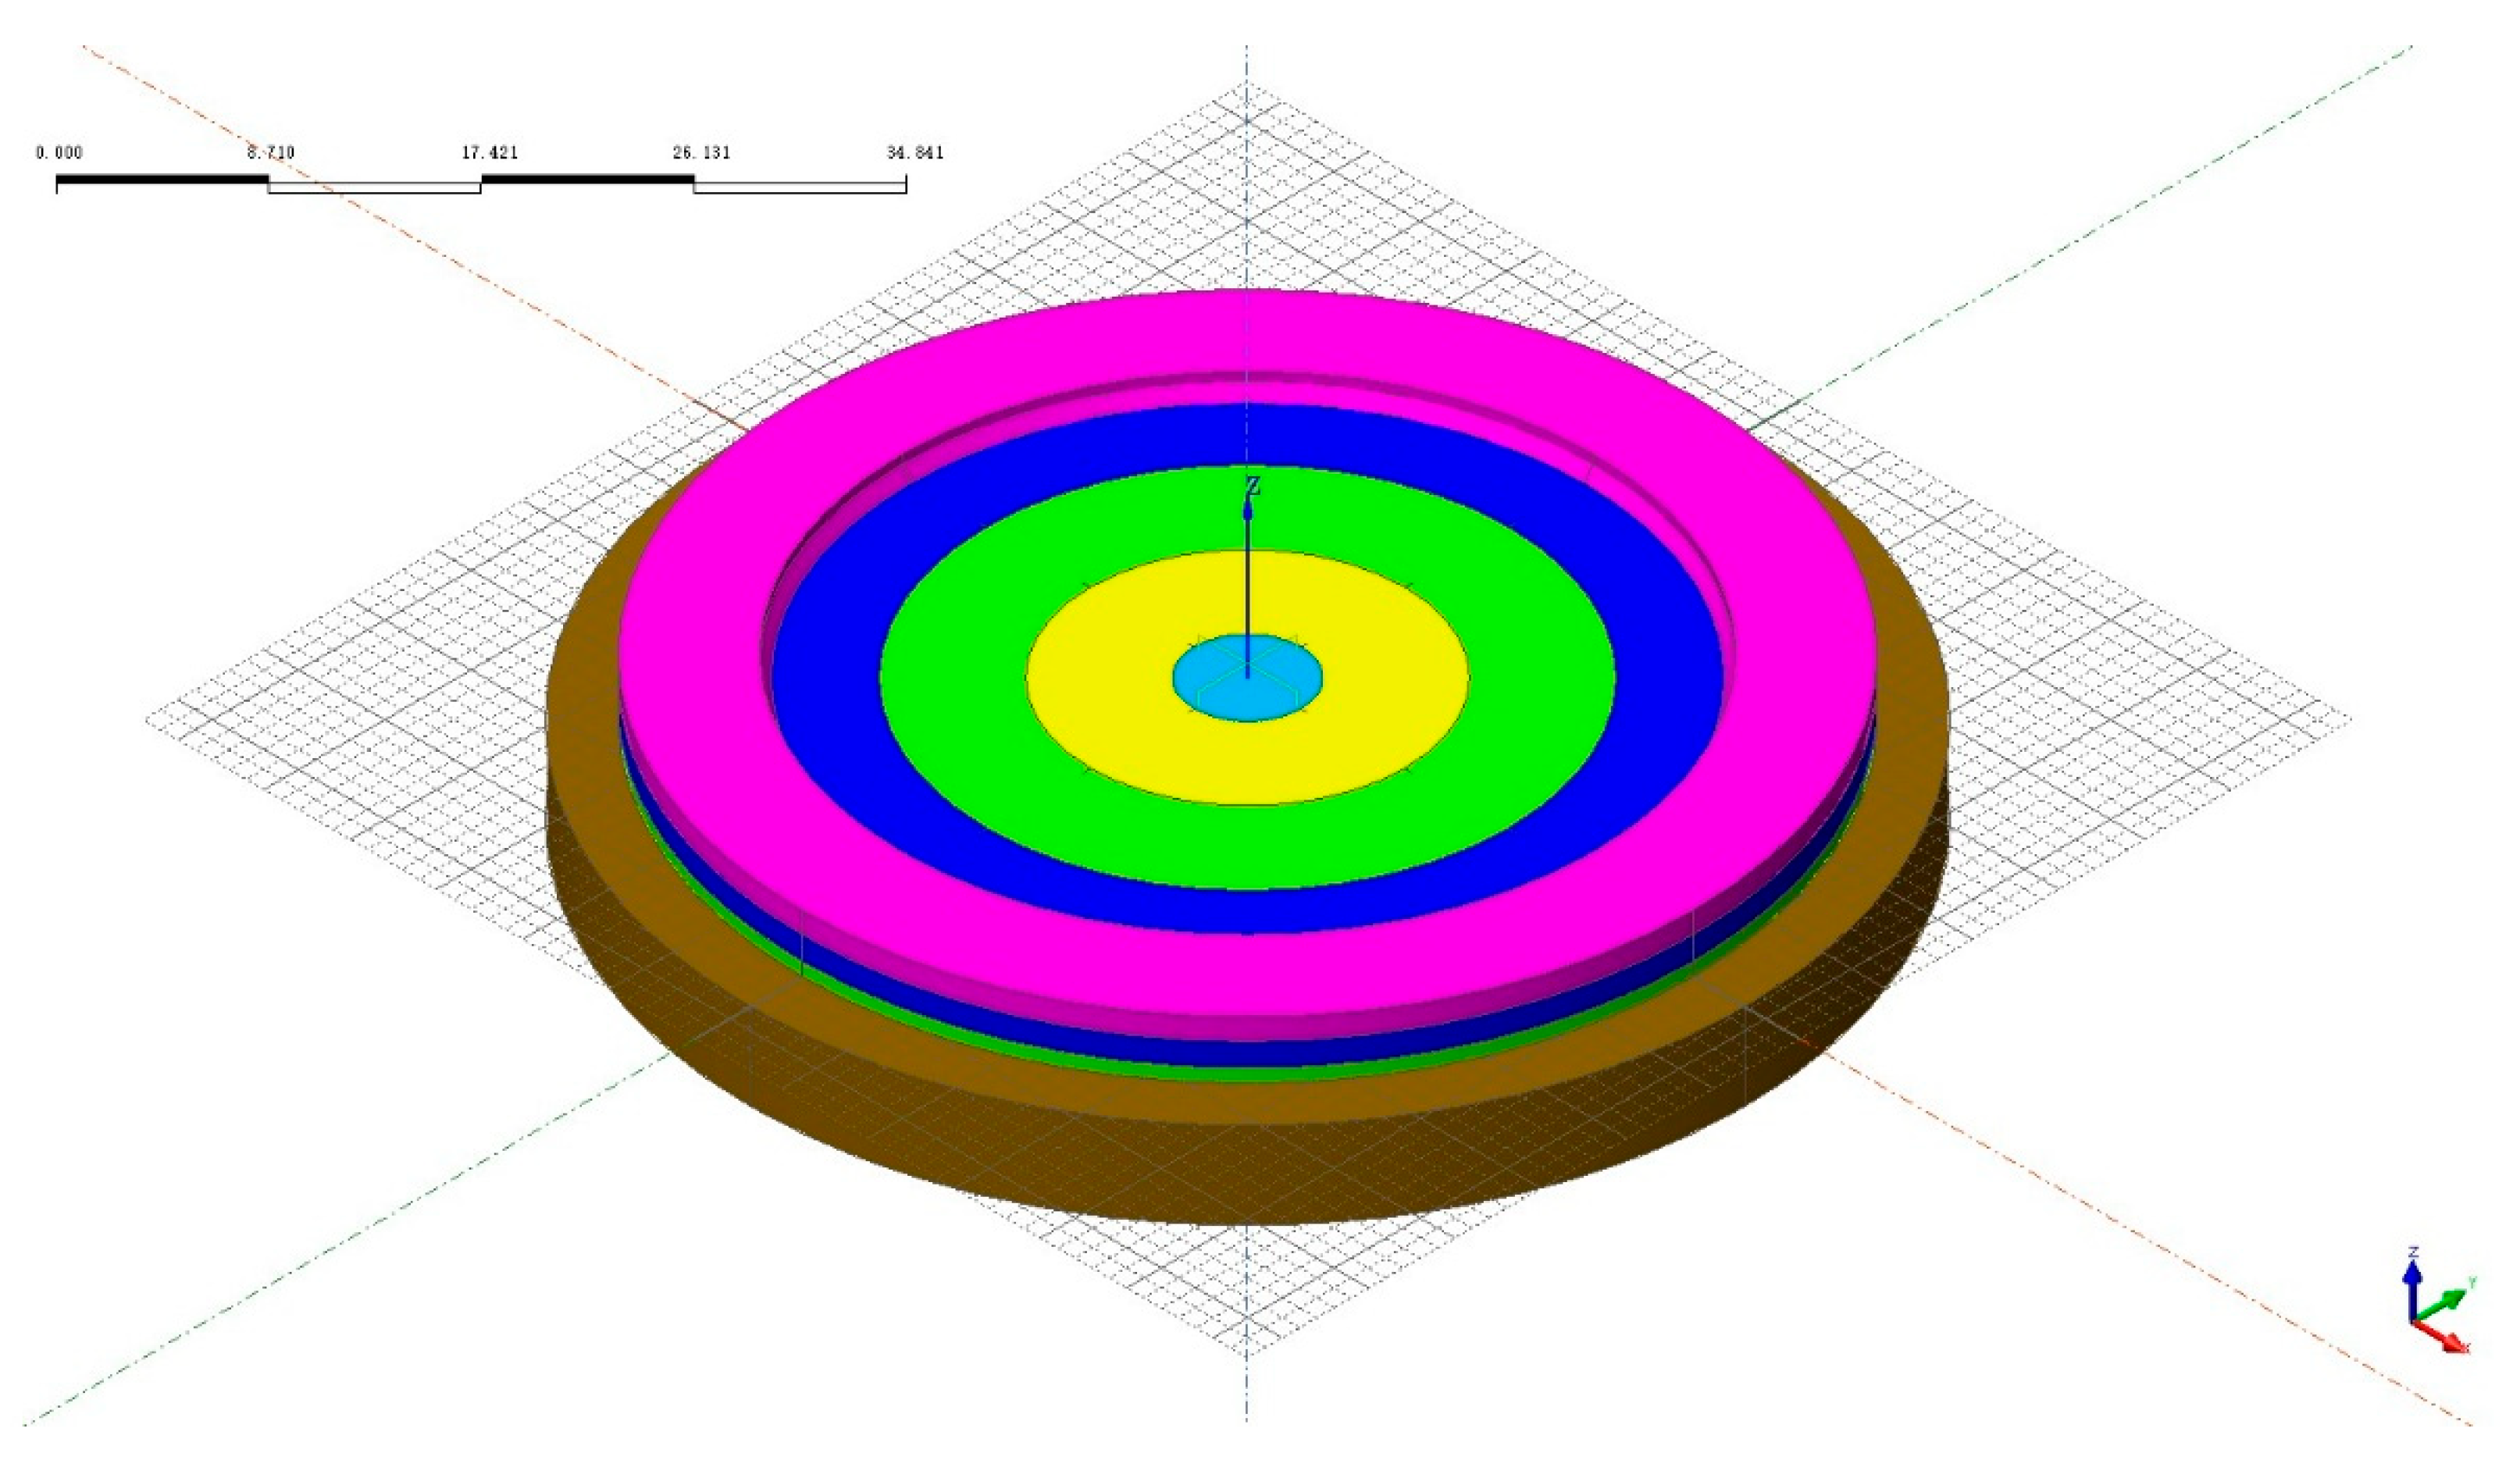
Figure 14.
Statistical chart of layered concrete pouring volume.

Figure 15.
Actual photos of cast-in-place mass concrete for the nuclear island raft foundation.
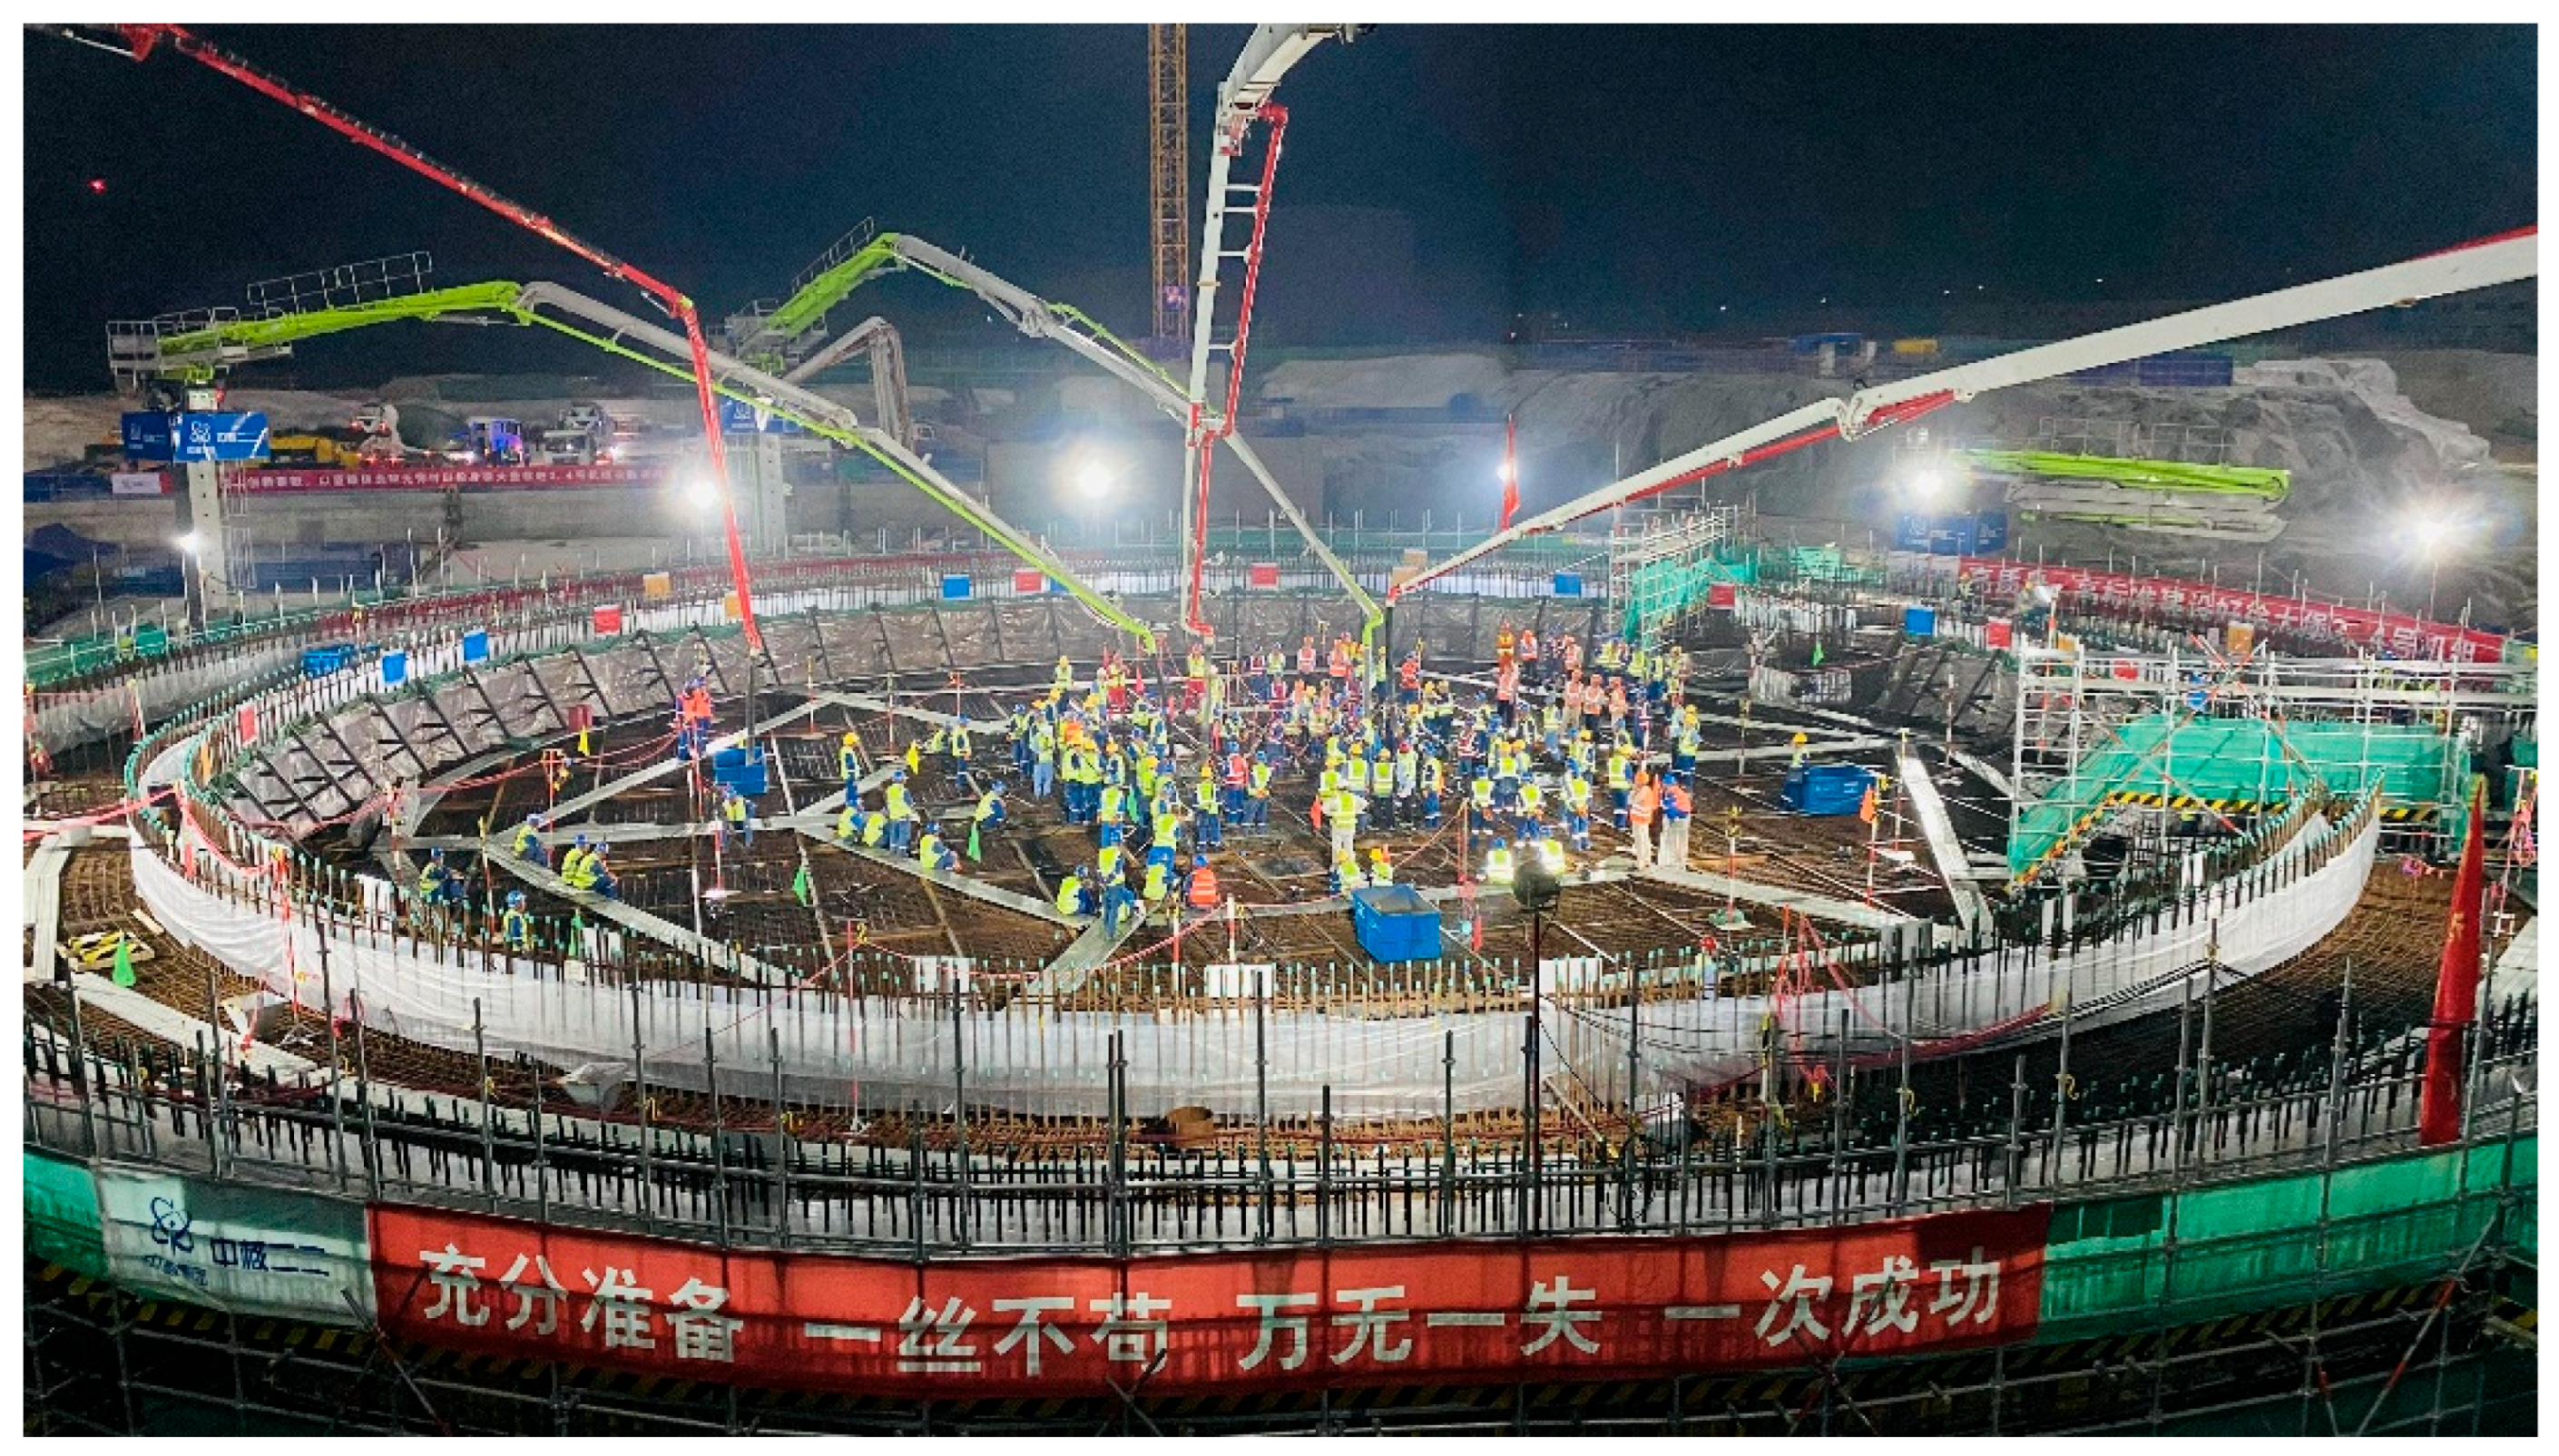
Figure 16.
Layout diagram of curing shed erection.
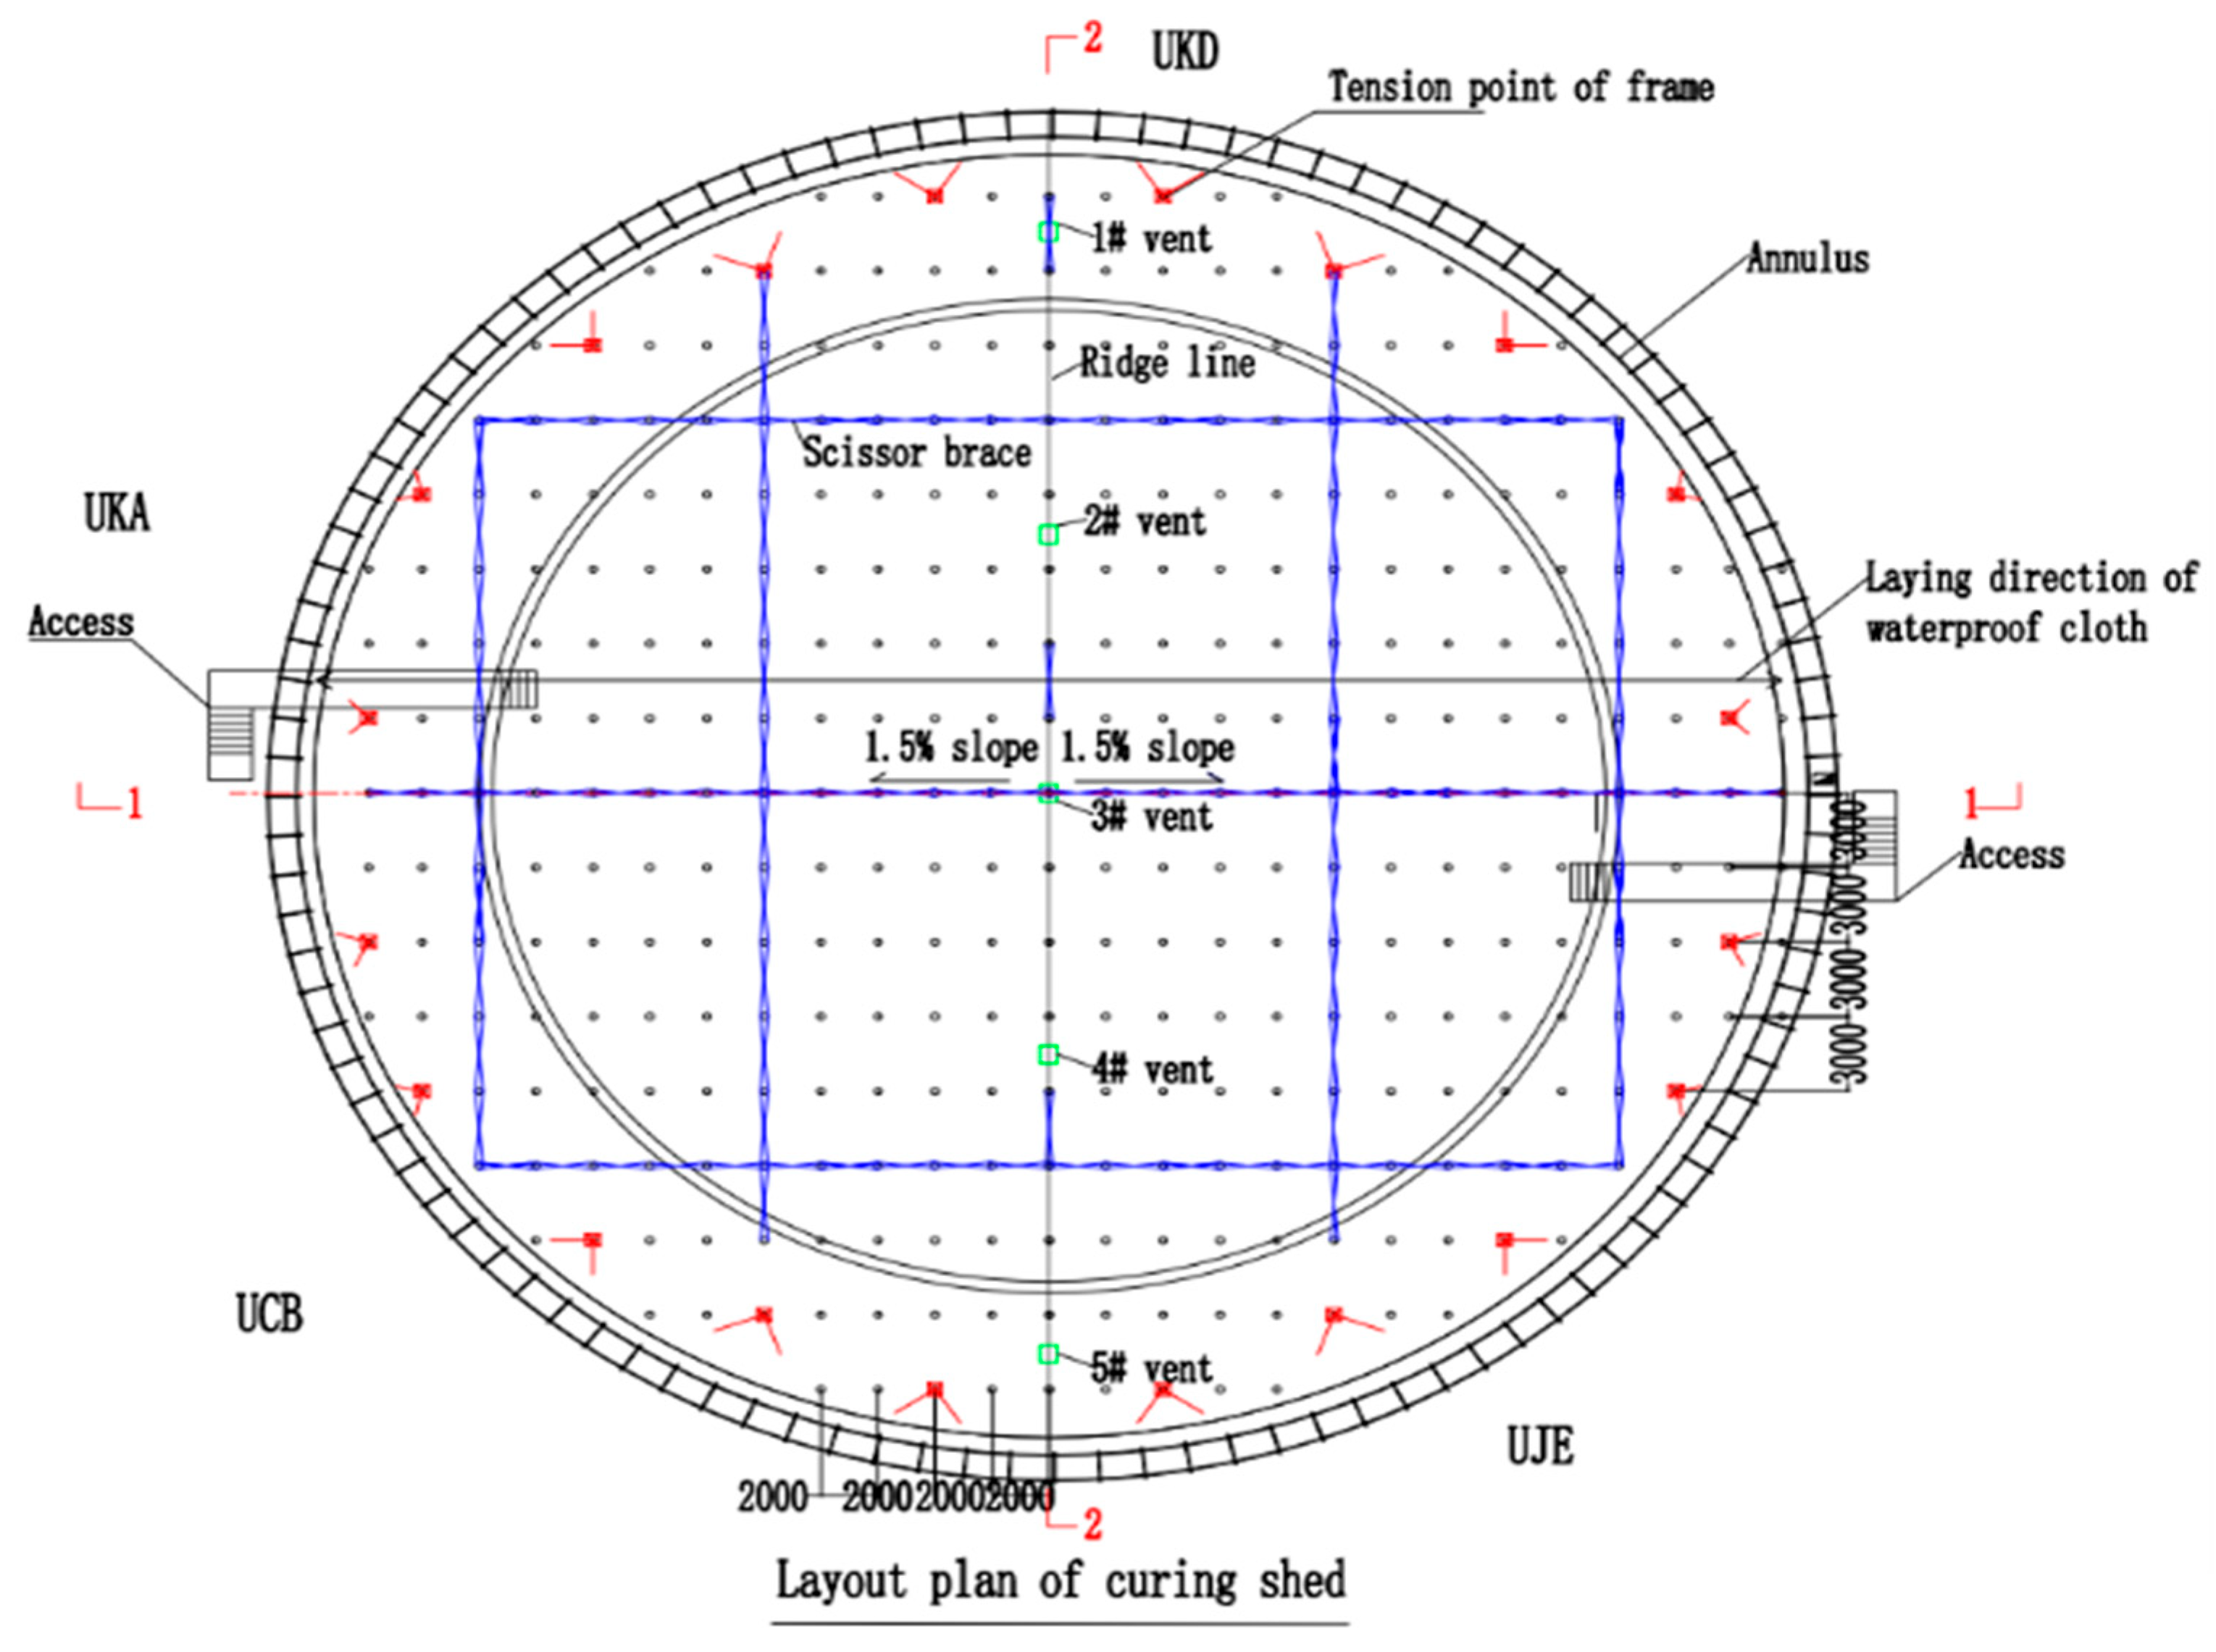
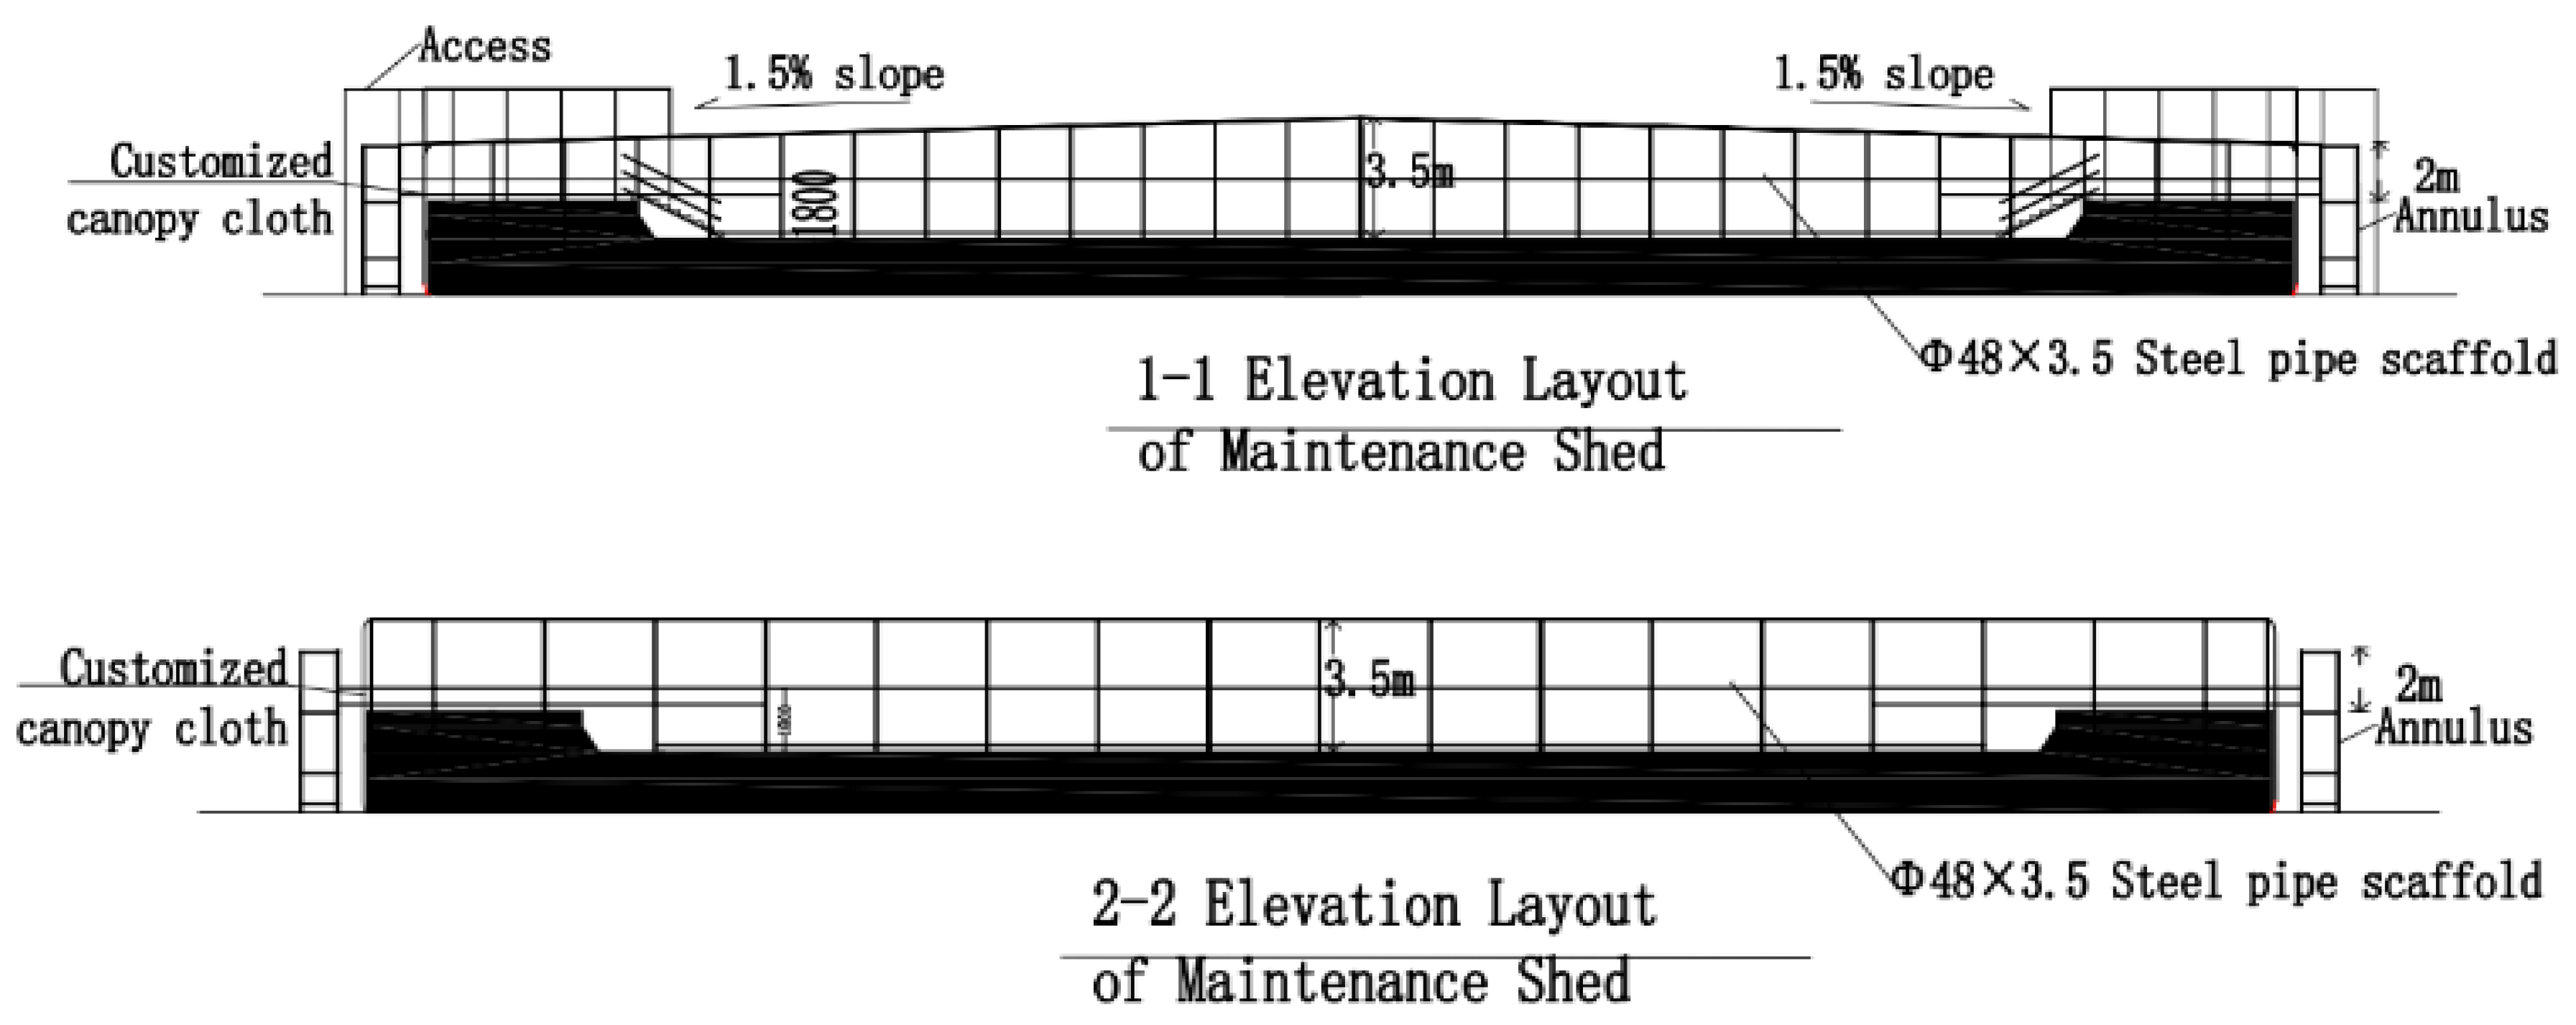
Figure 17.
Actual photo of the curing shed.
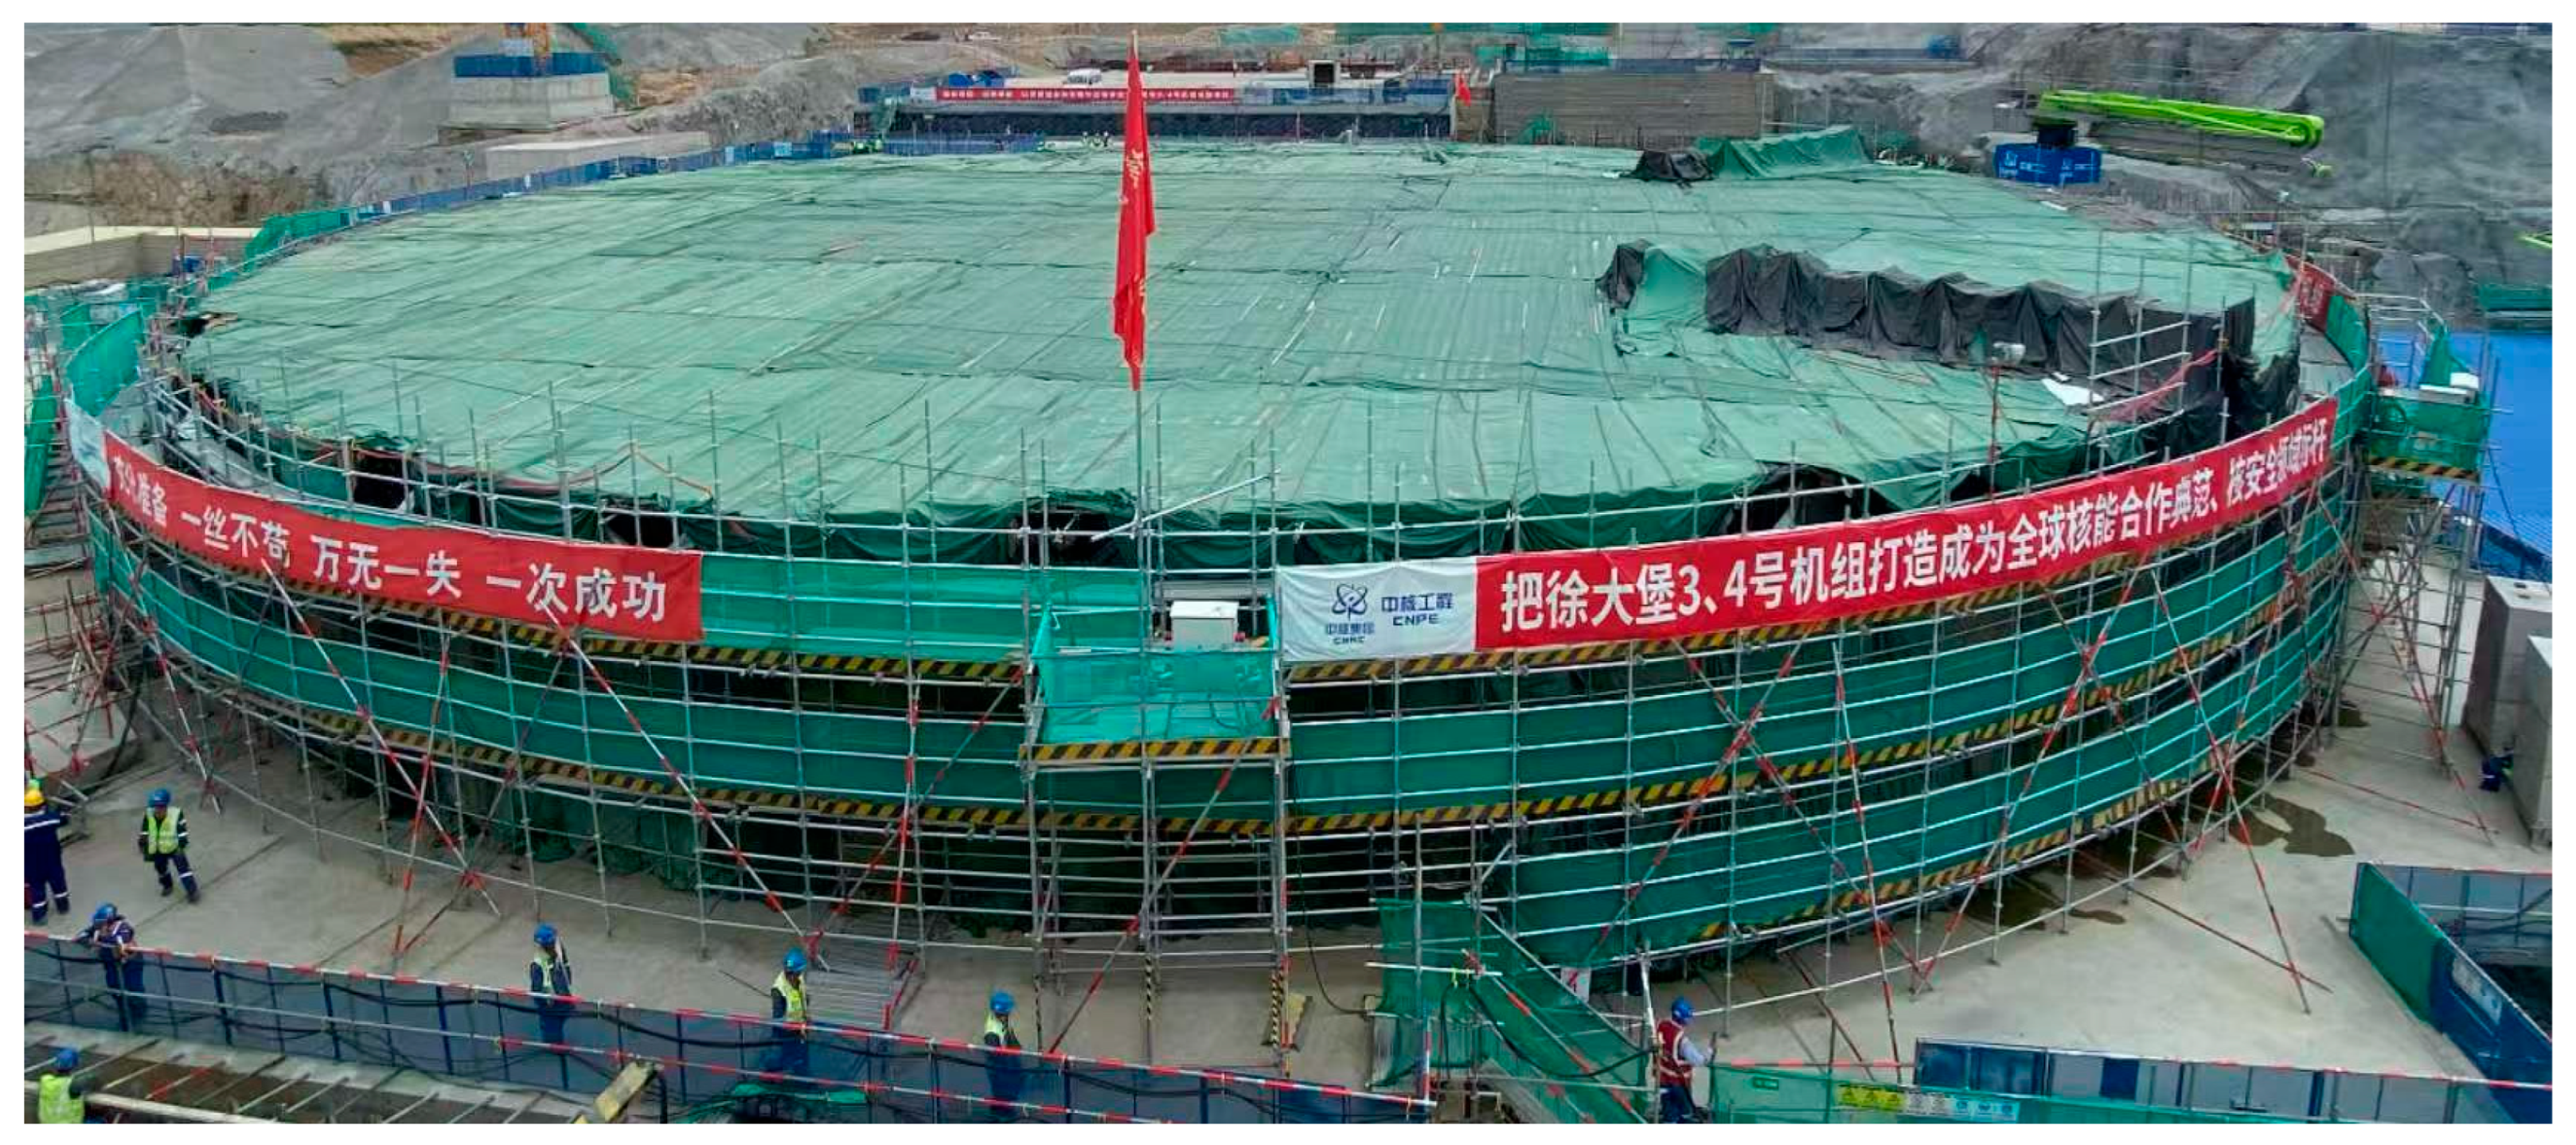
Figure 18.
Plan View of temperature measuring points layout.

Figure 19.
Cross-section view of temperature measuring points layout.
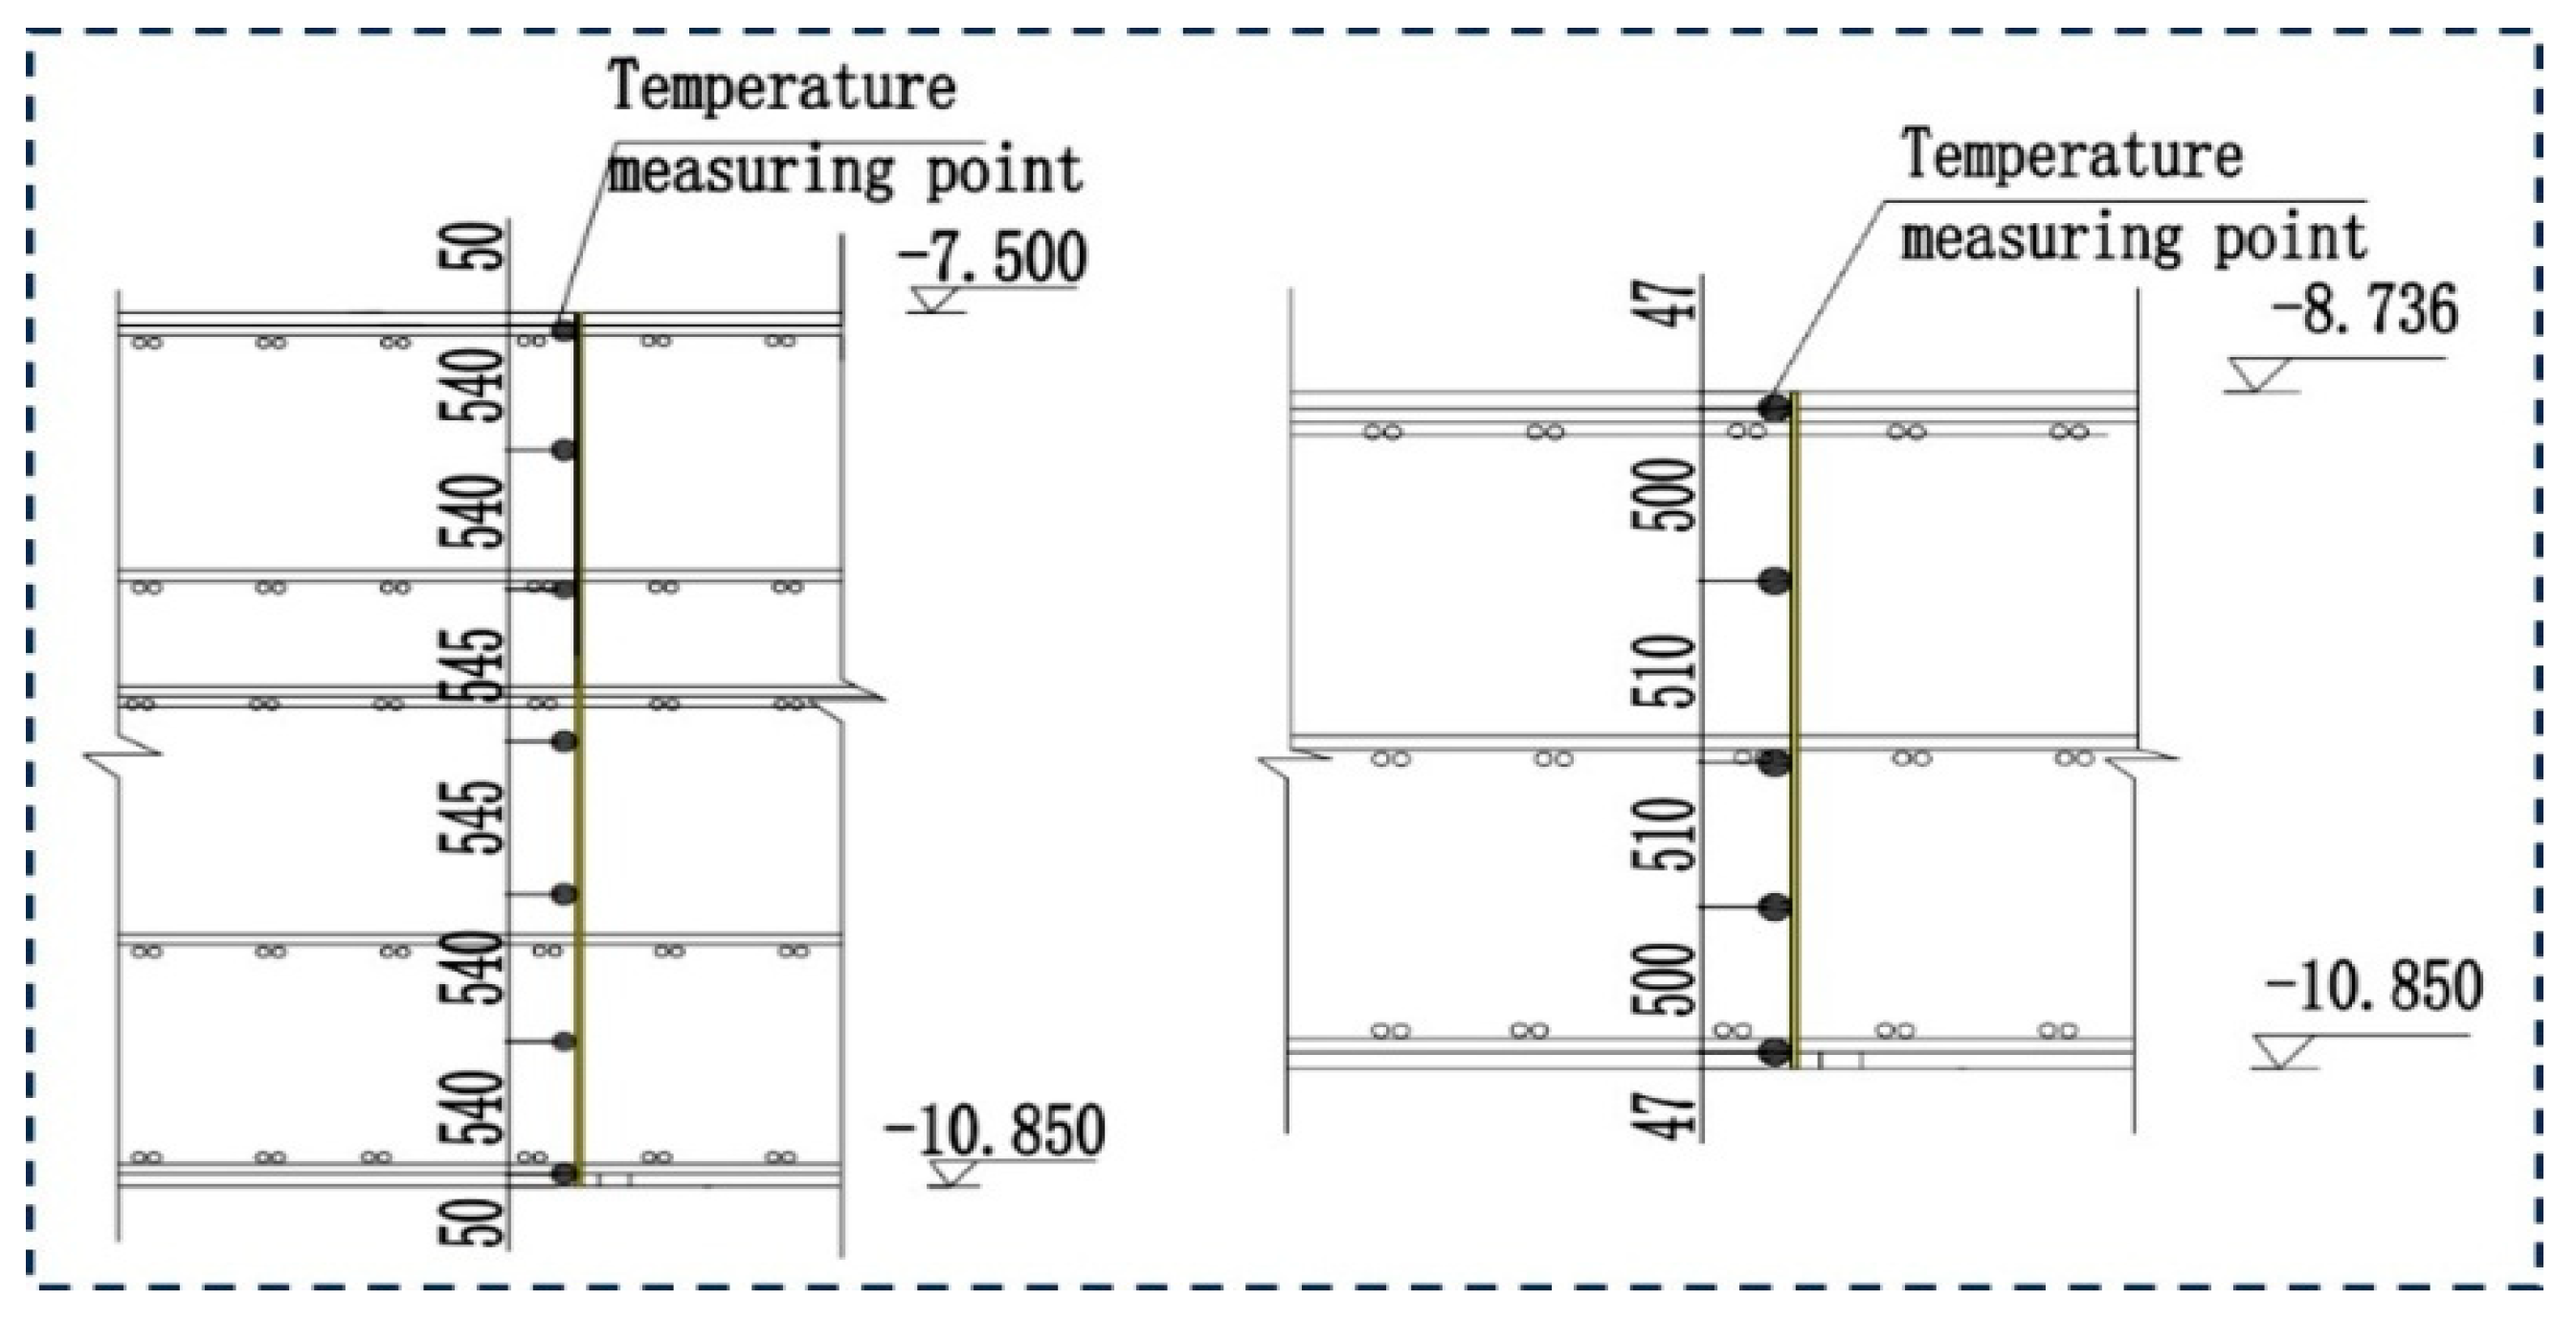
Figure 22.
Finite element model of the nuclear island raft foundation (Including Bedrock).
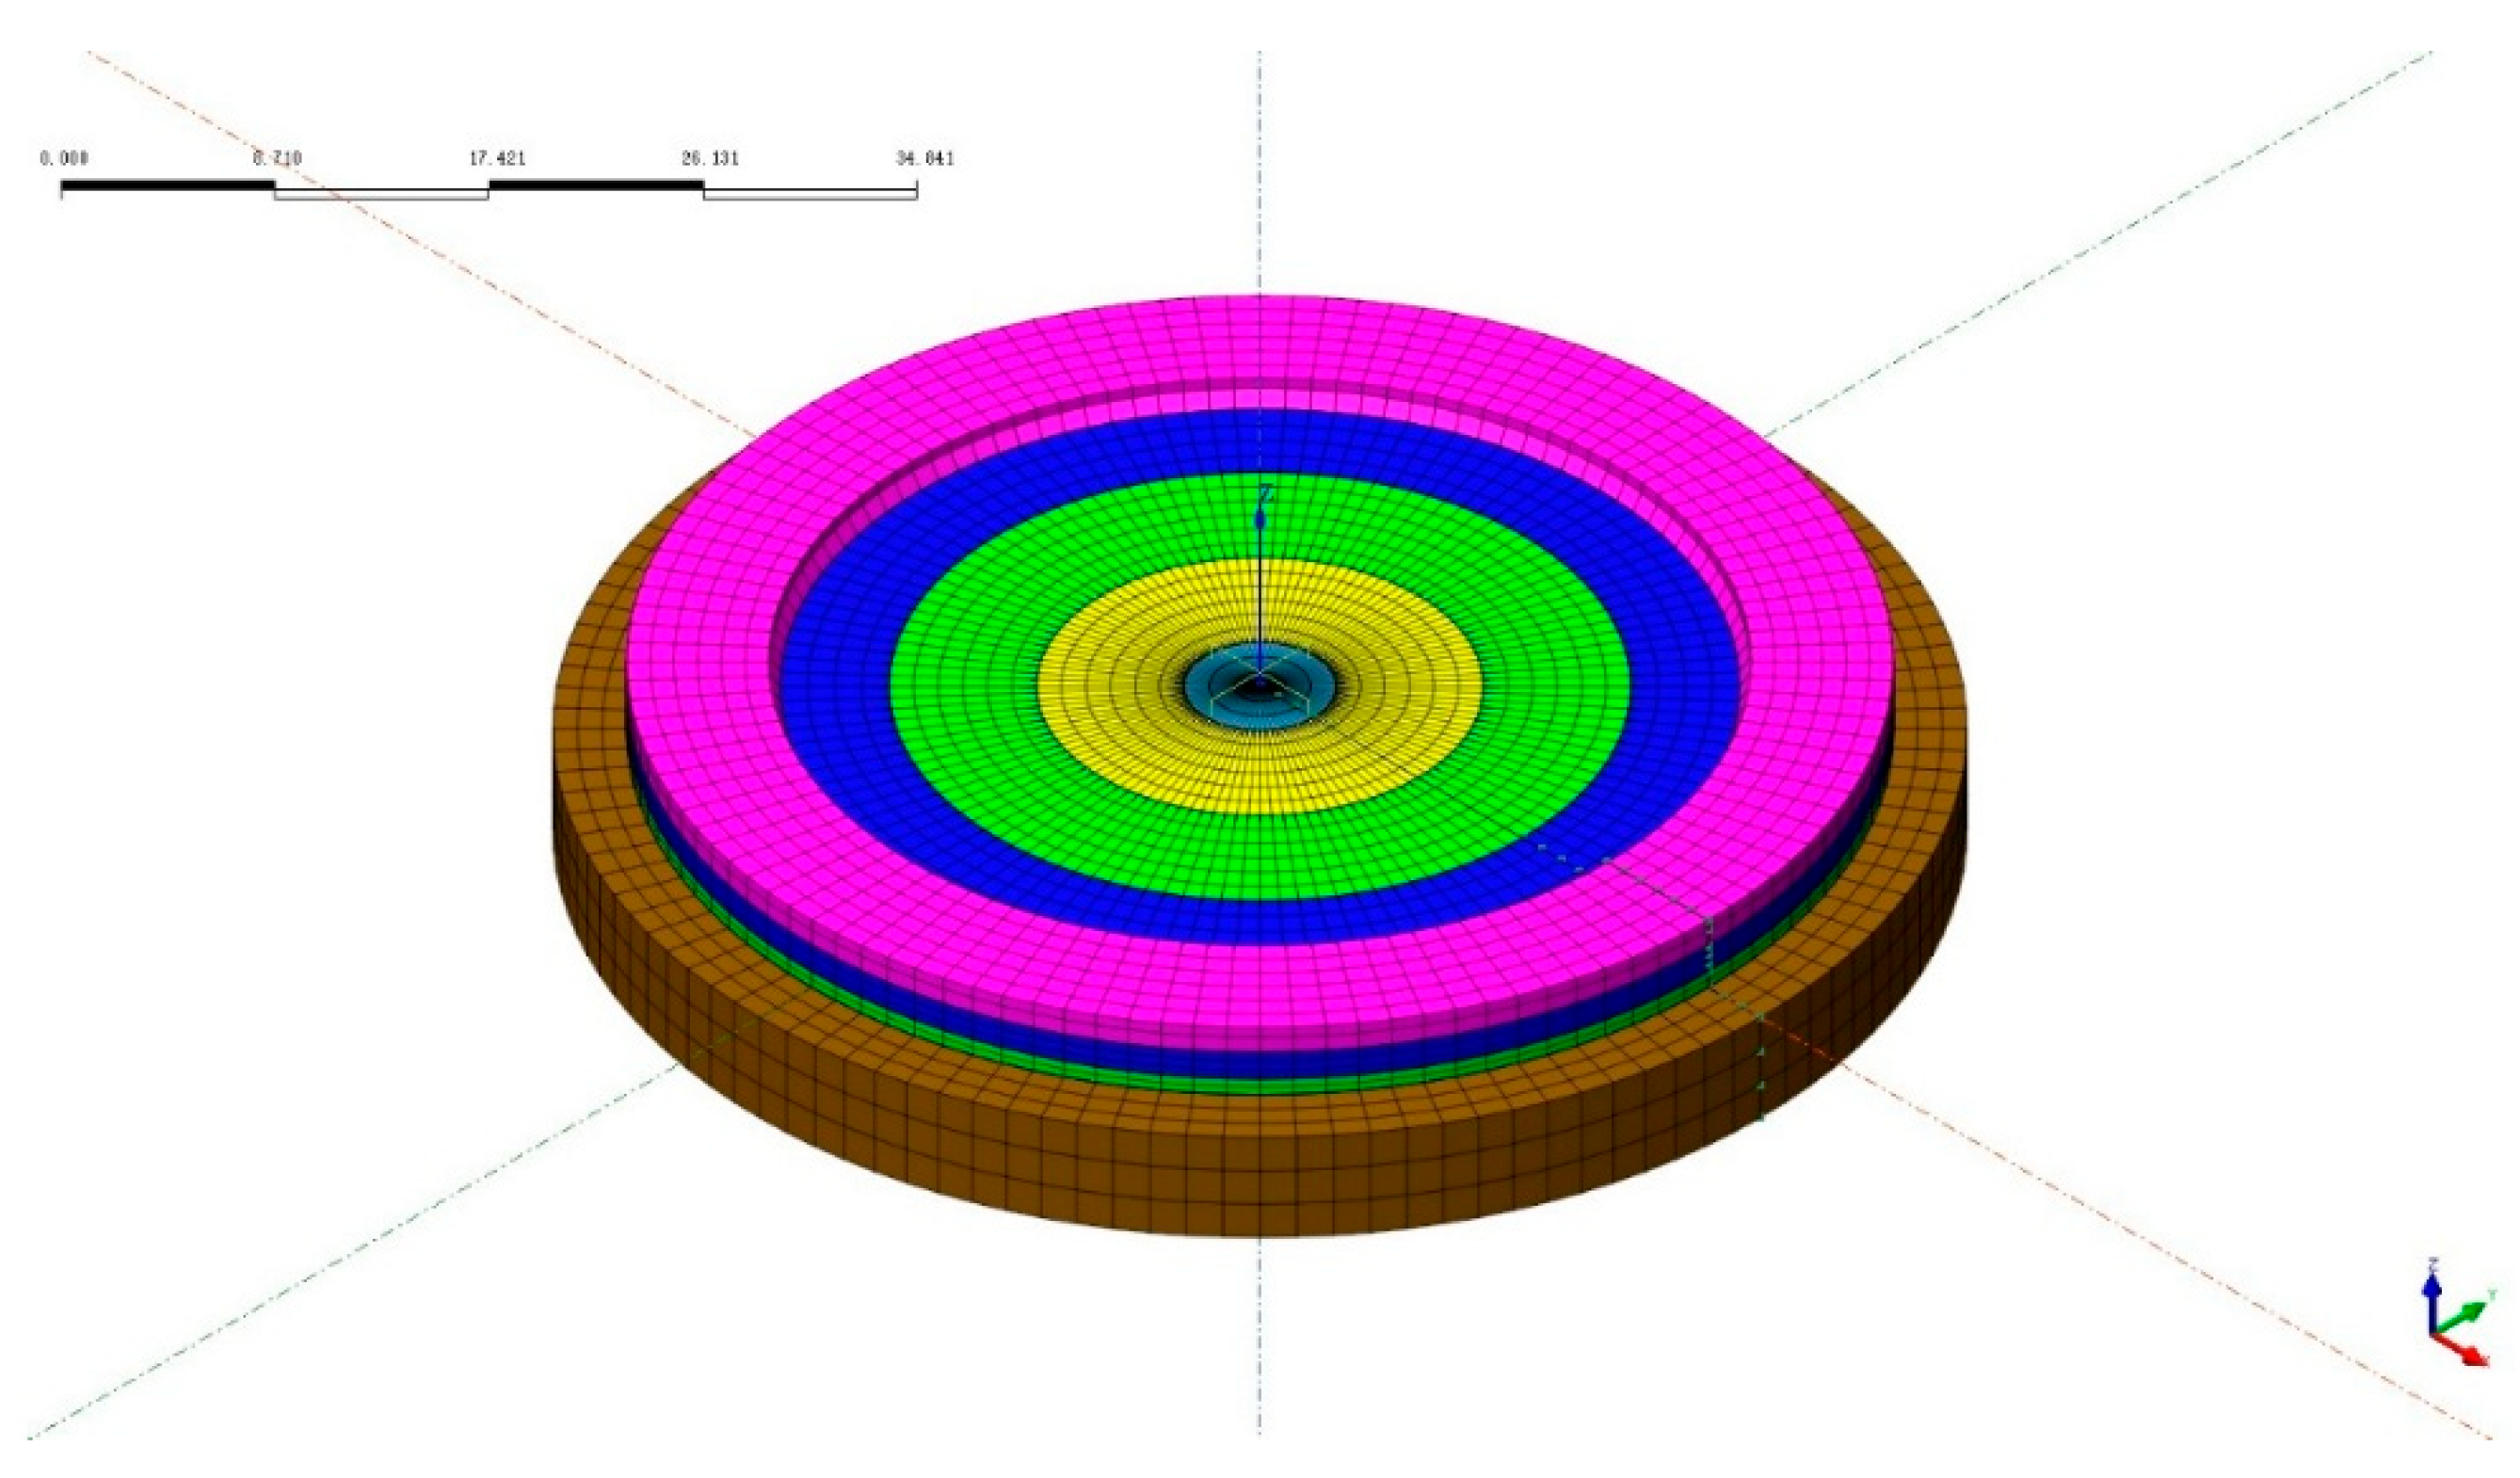
Figure 23.
Measured adiabatic temperature rise curve of concrete.
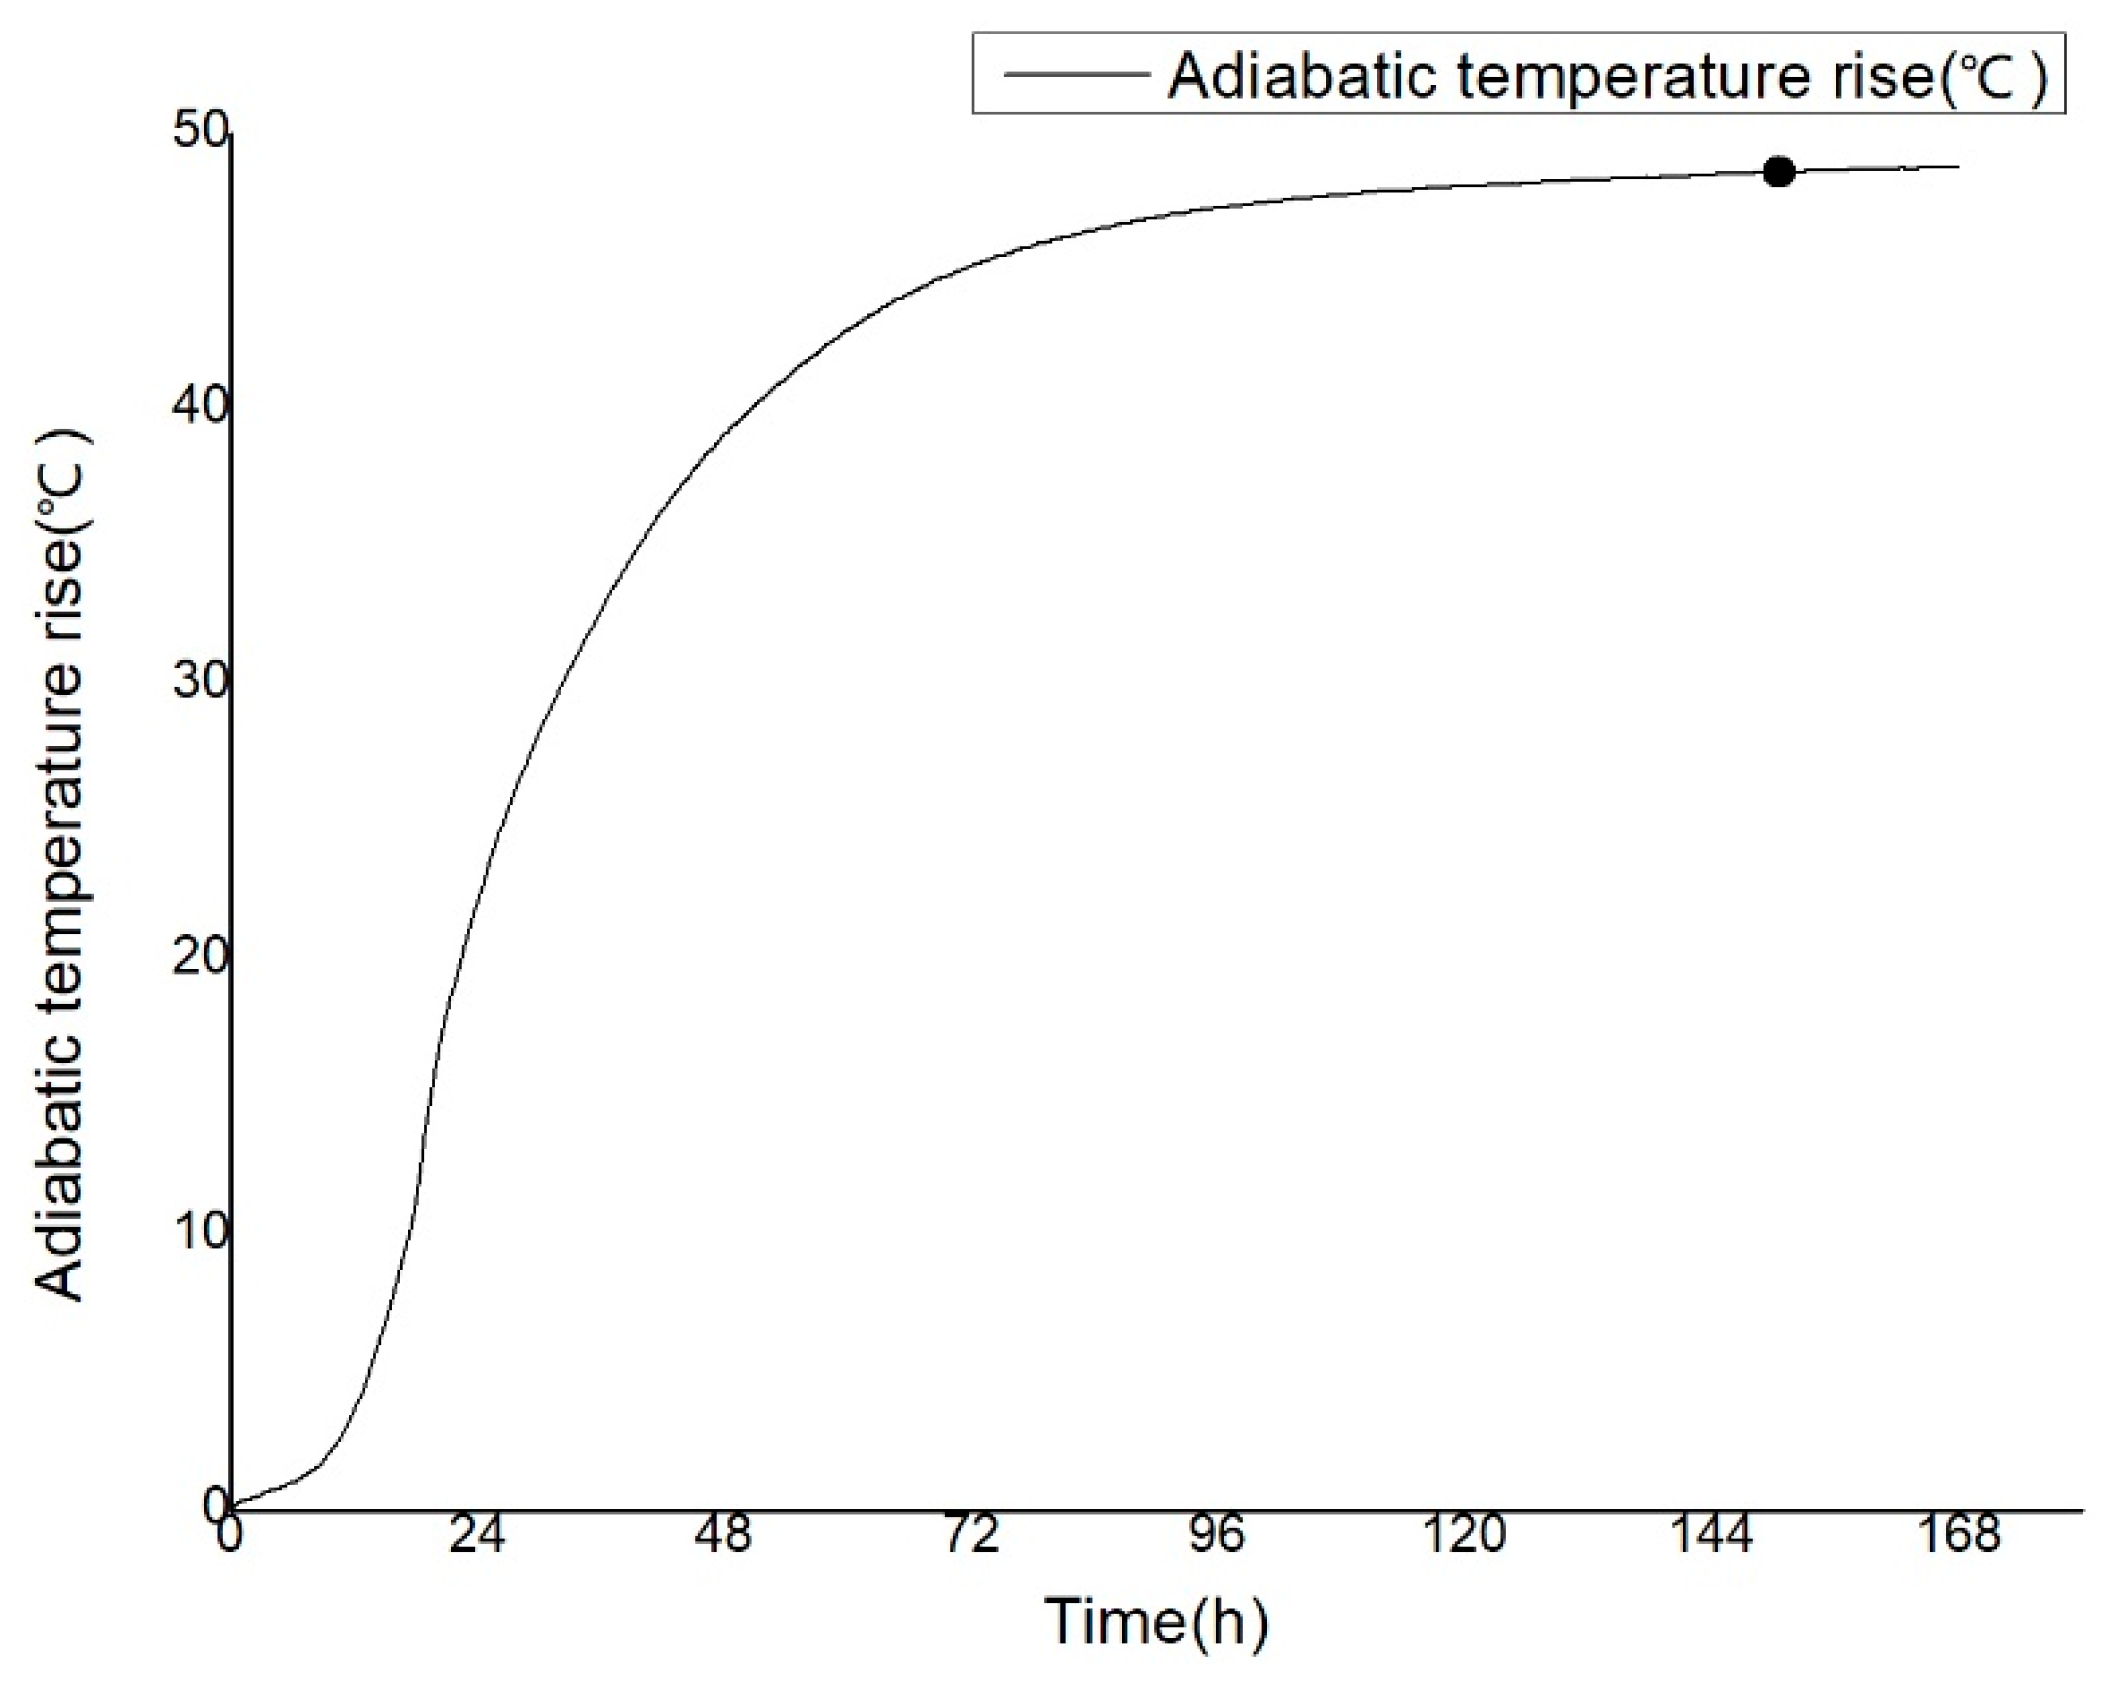
Figure 24.
Measured ambient temperature curve.
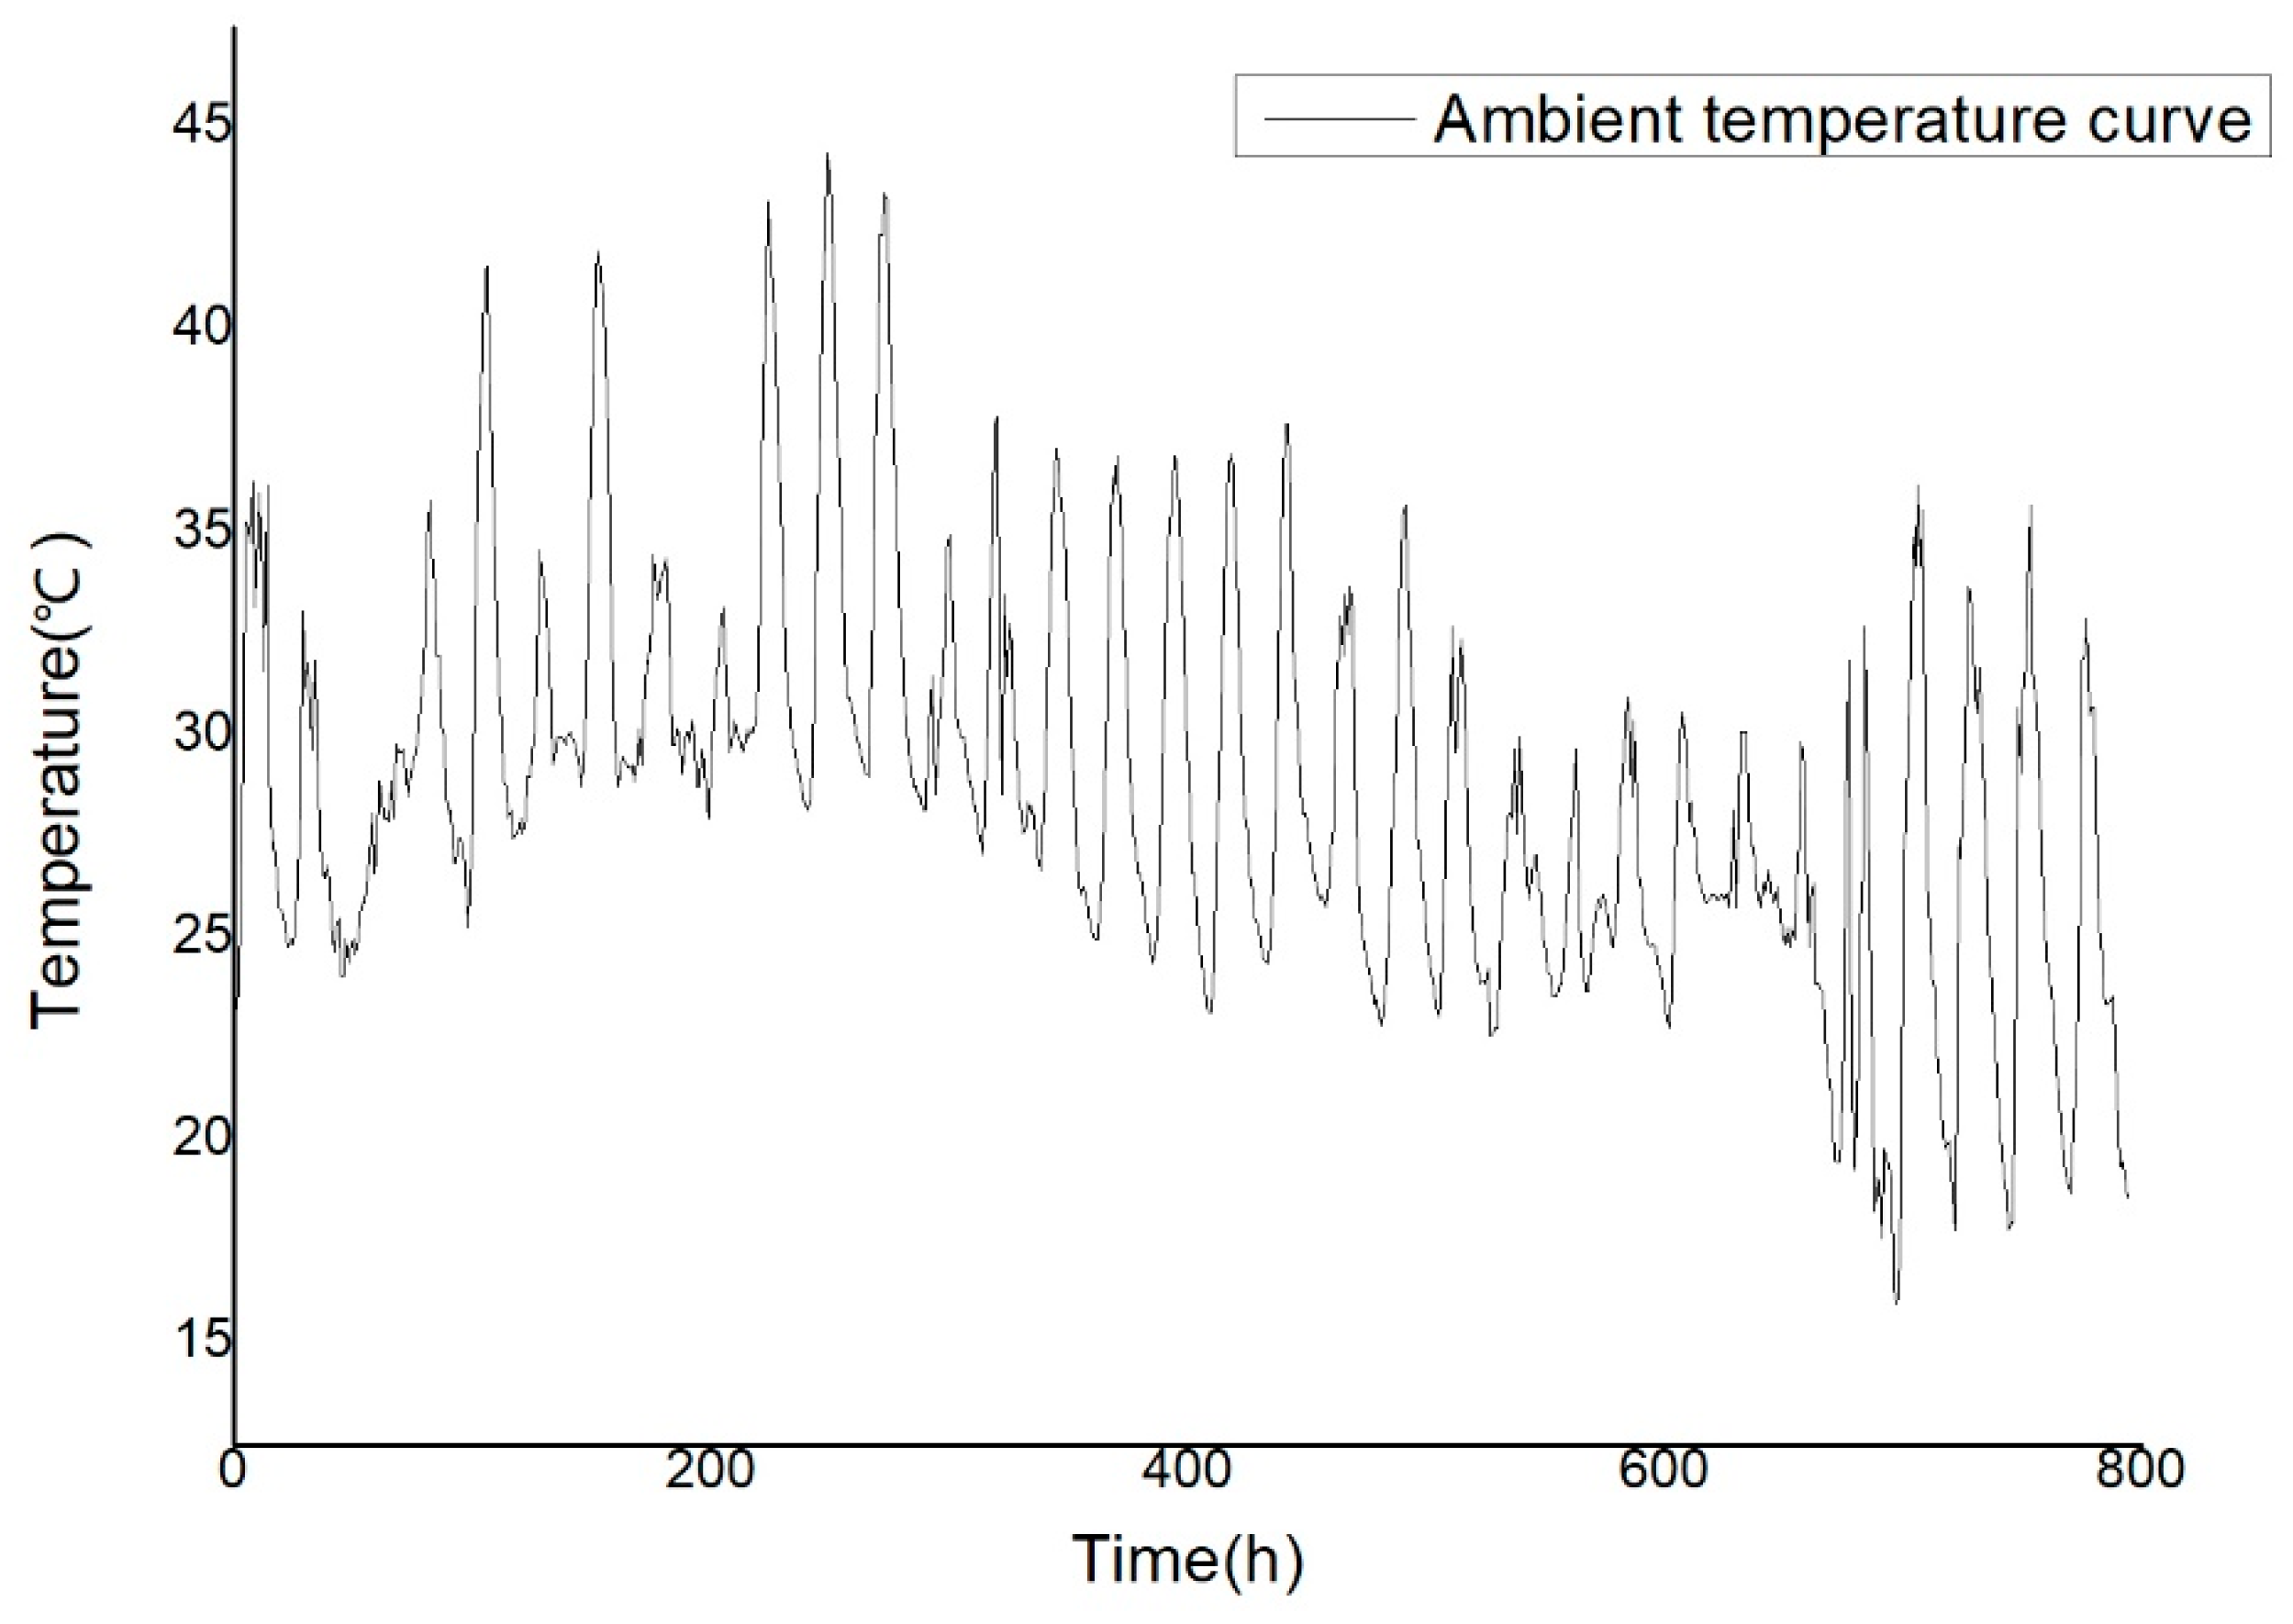
Figure 25.
Measured temperature time-history curve of measuring point 1.
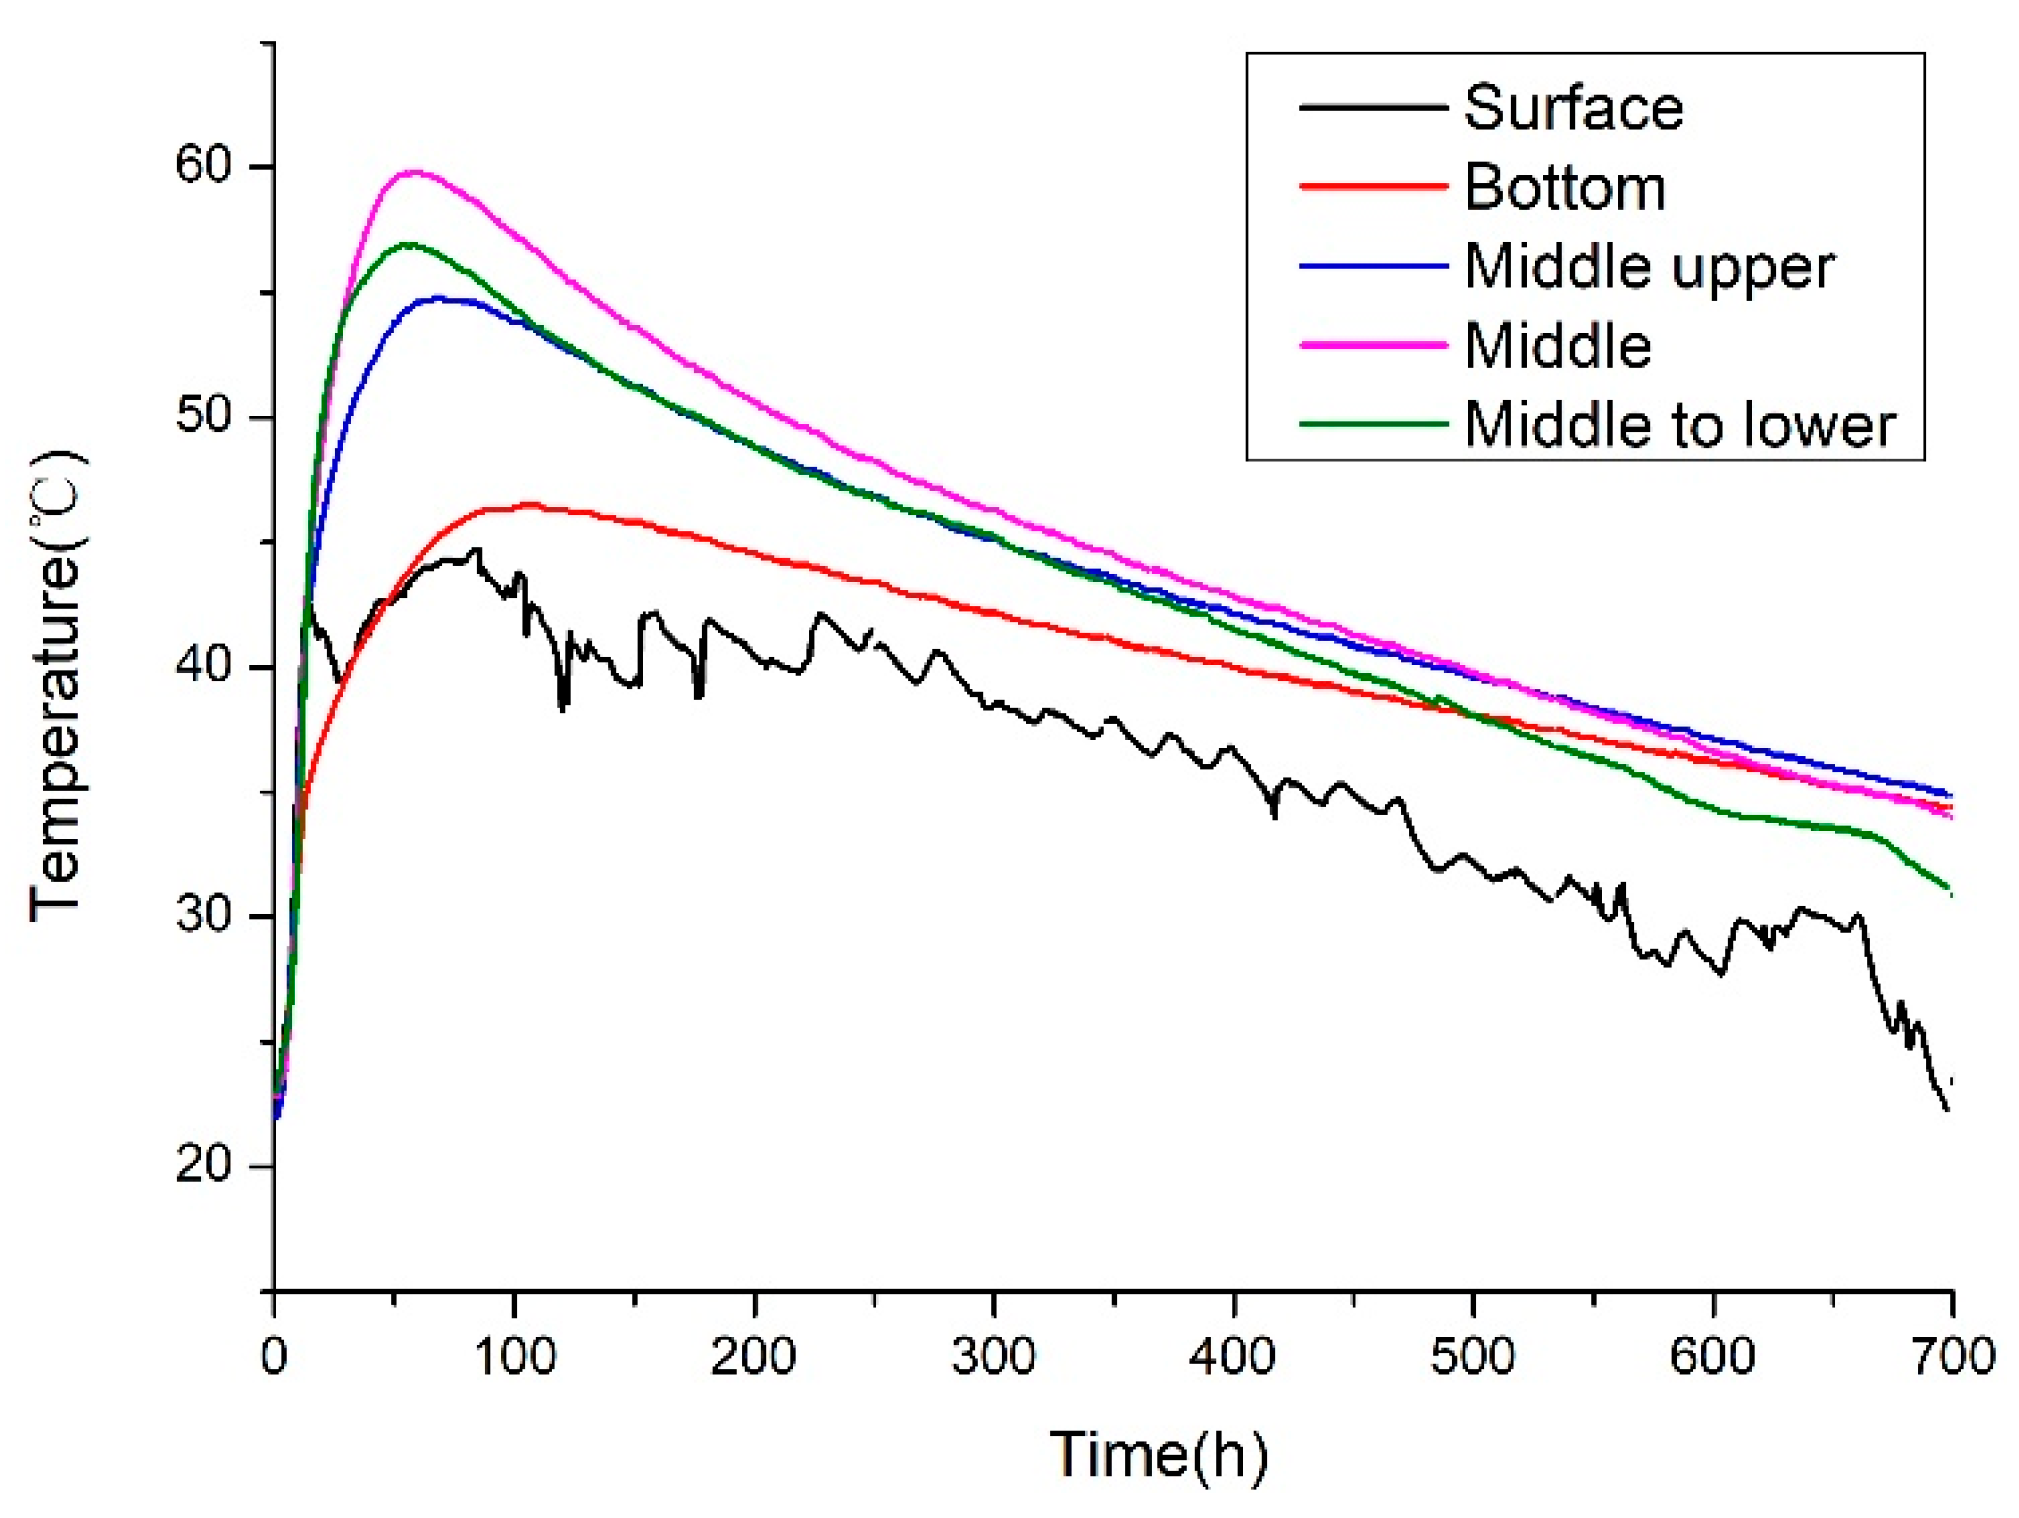
Figure 26.
Measured temperature time-history curve of measuring point 5.
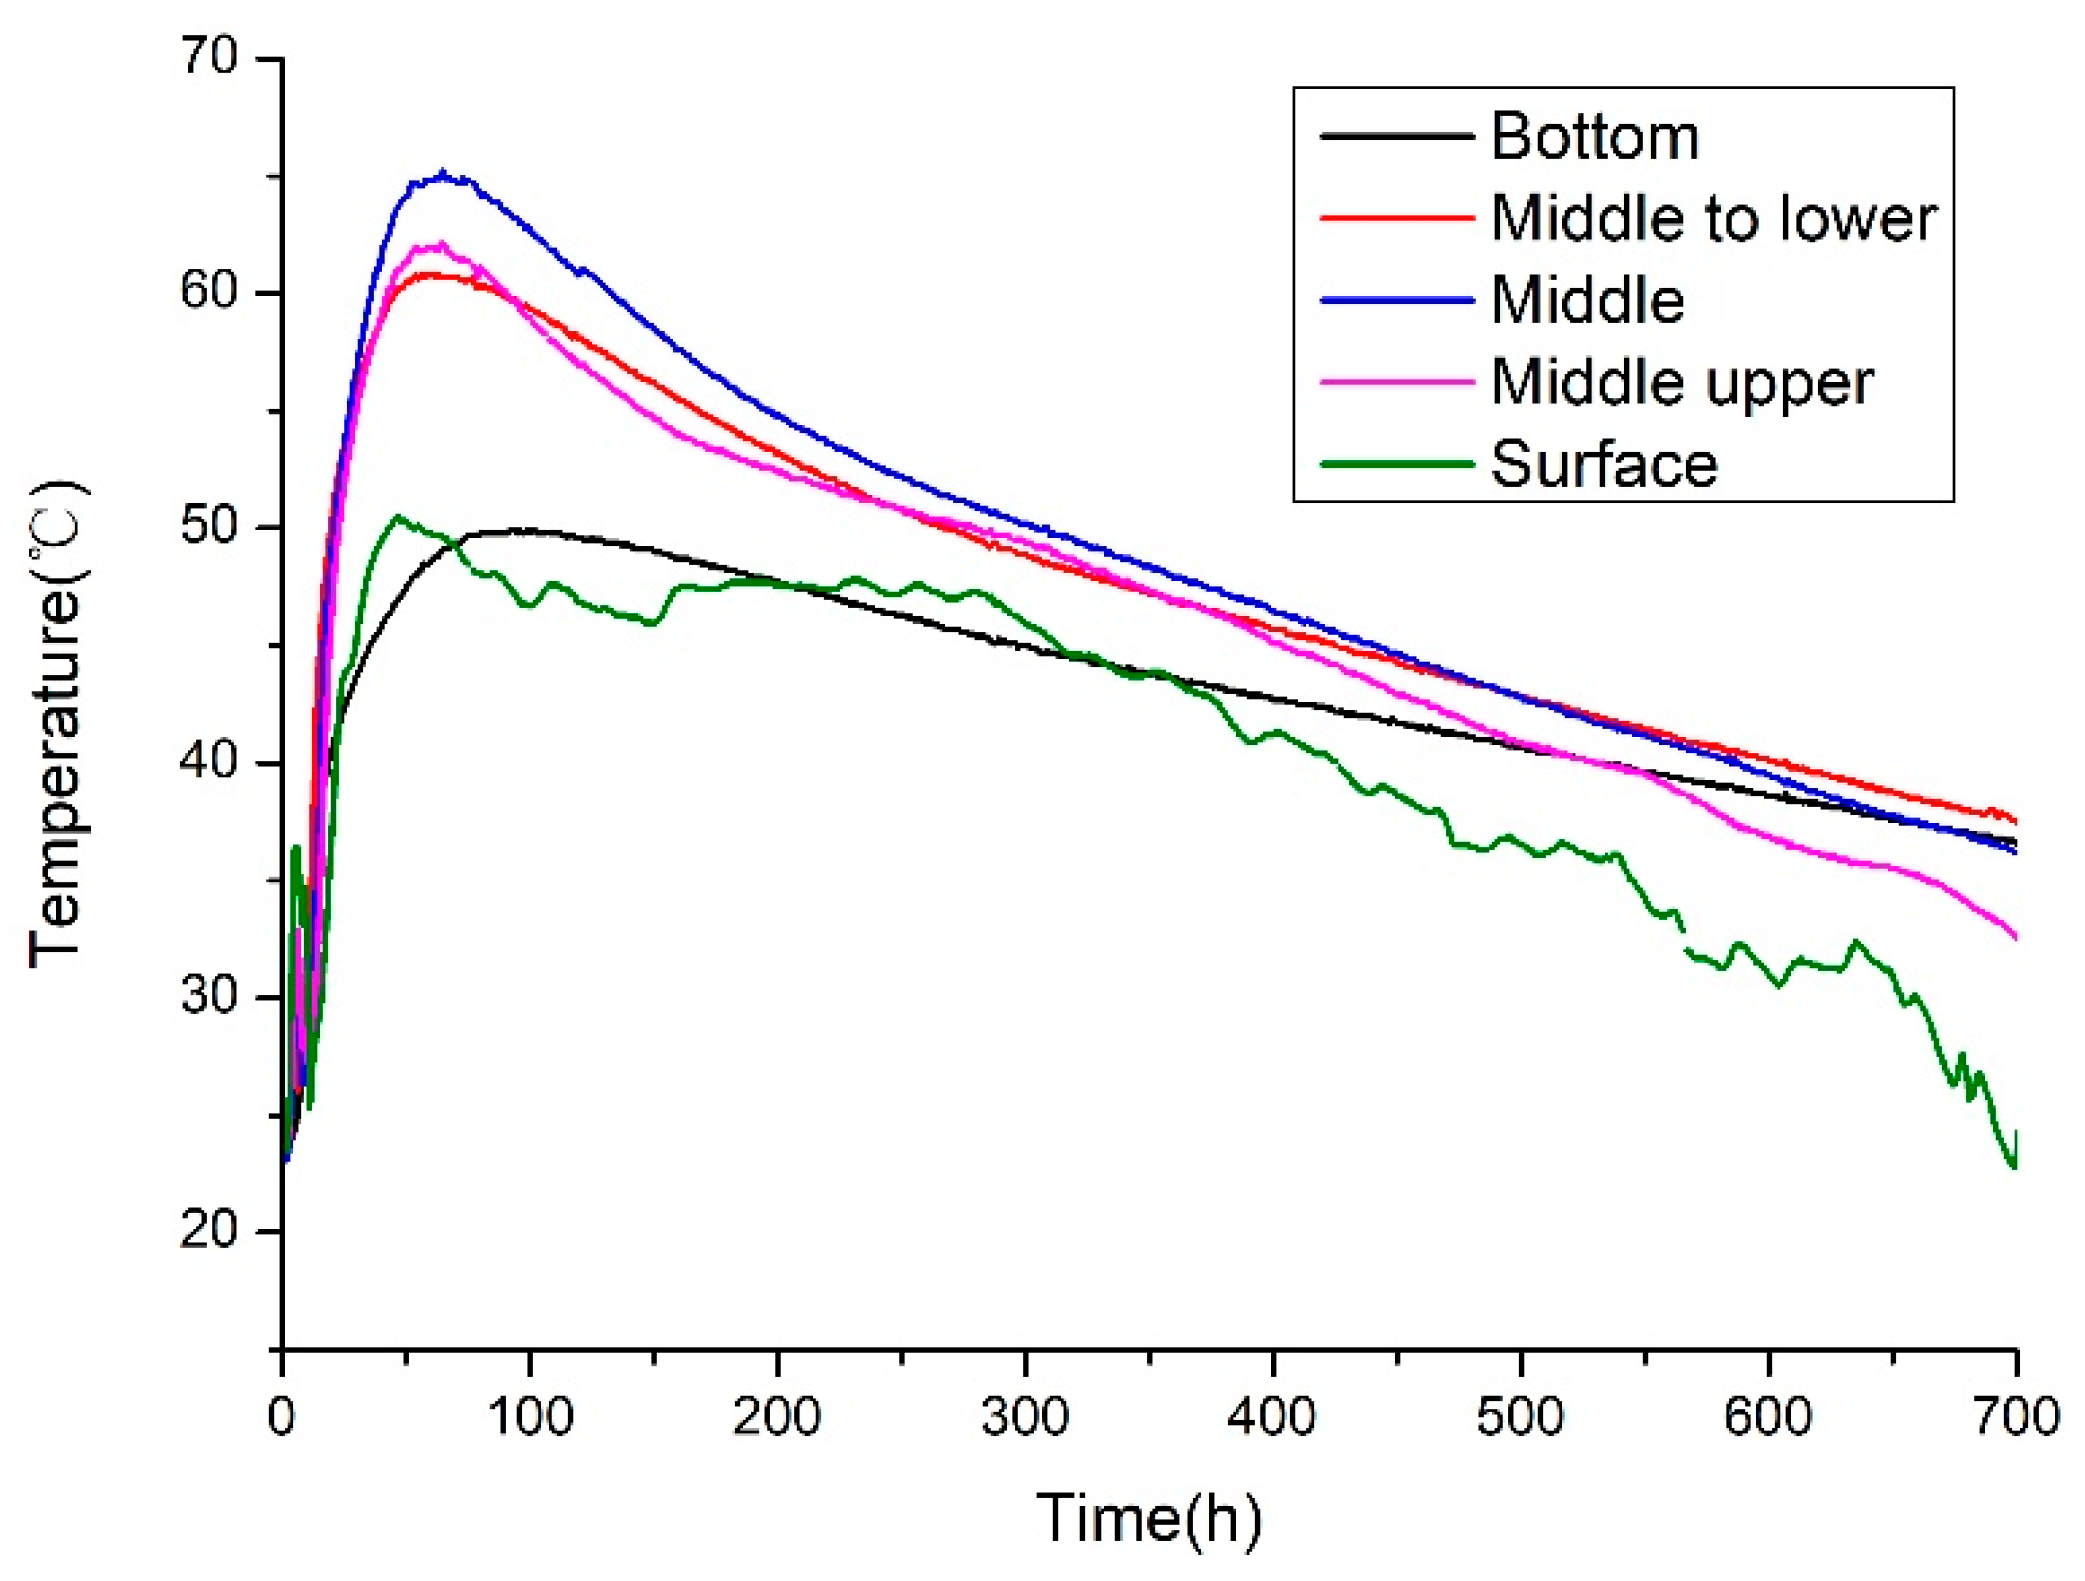
Figure 27.
Measured temperature time-history curve of measuring point 7.
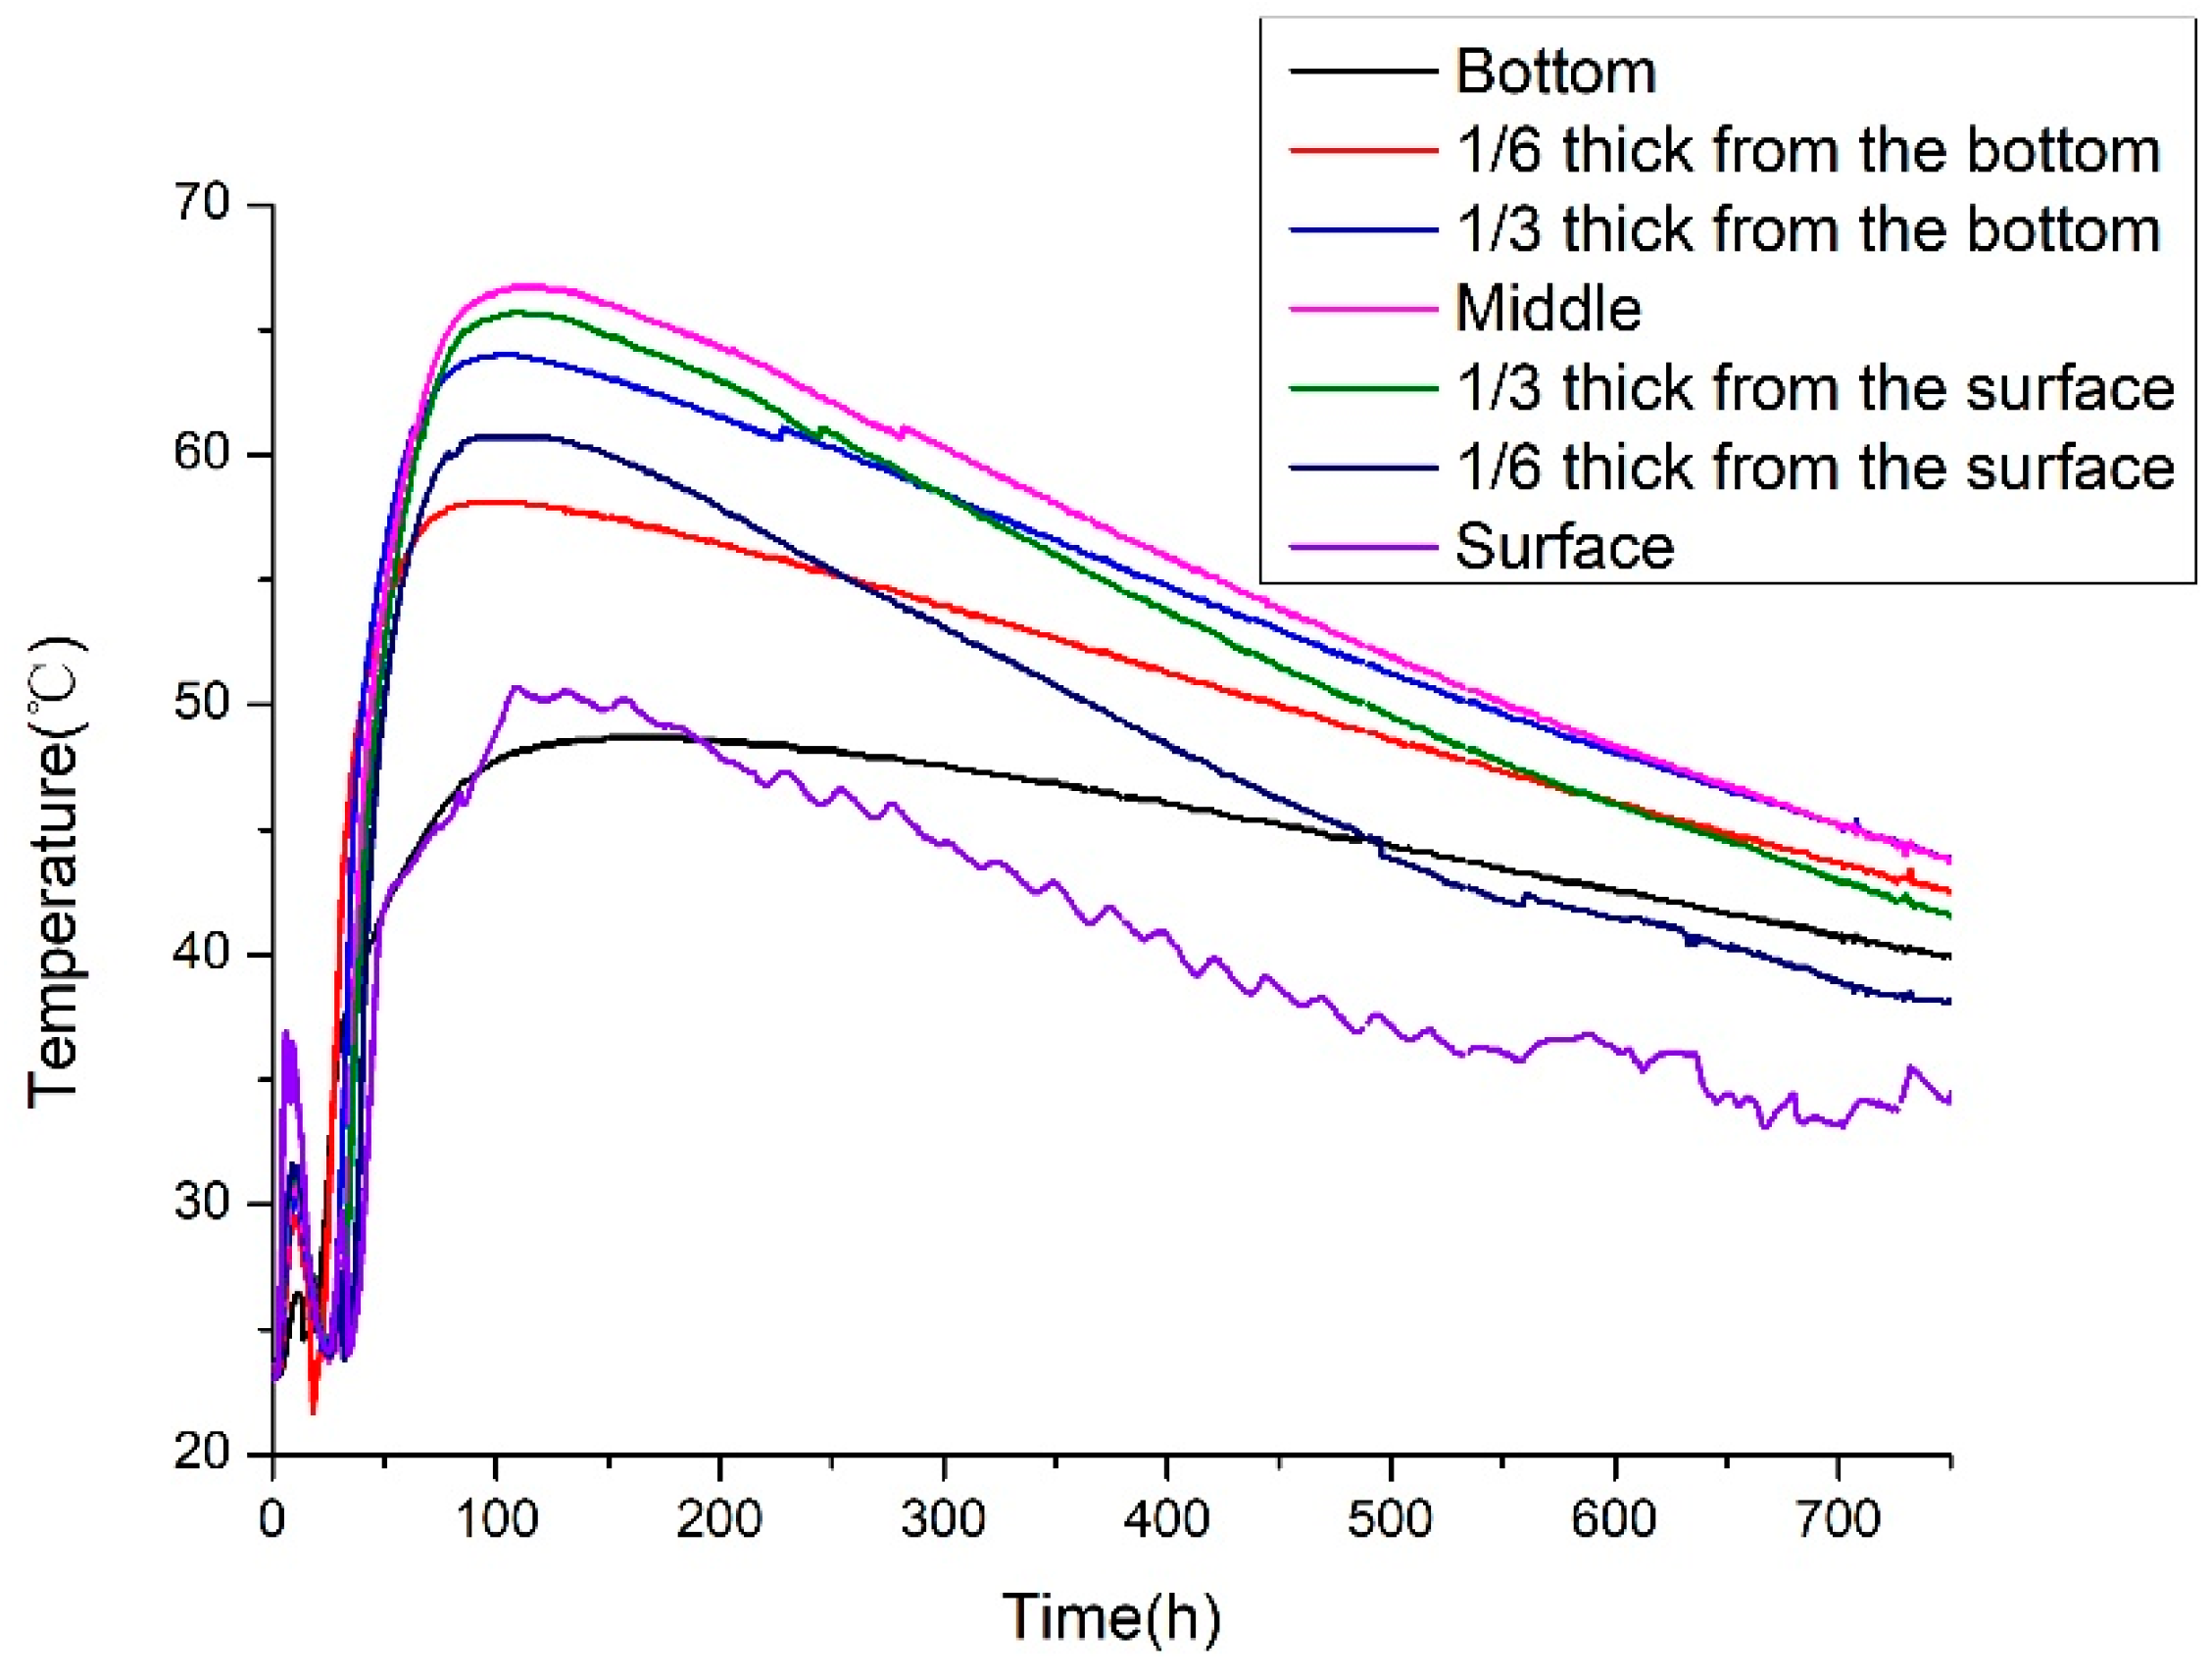
Figure 40.
Nonlinear temperature distribution of circular plate.
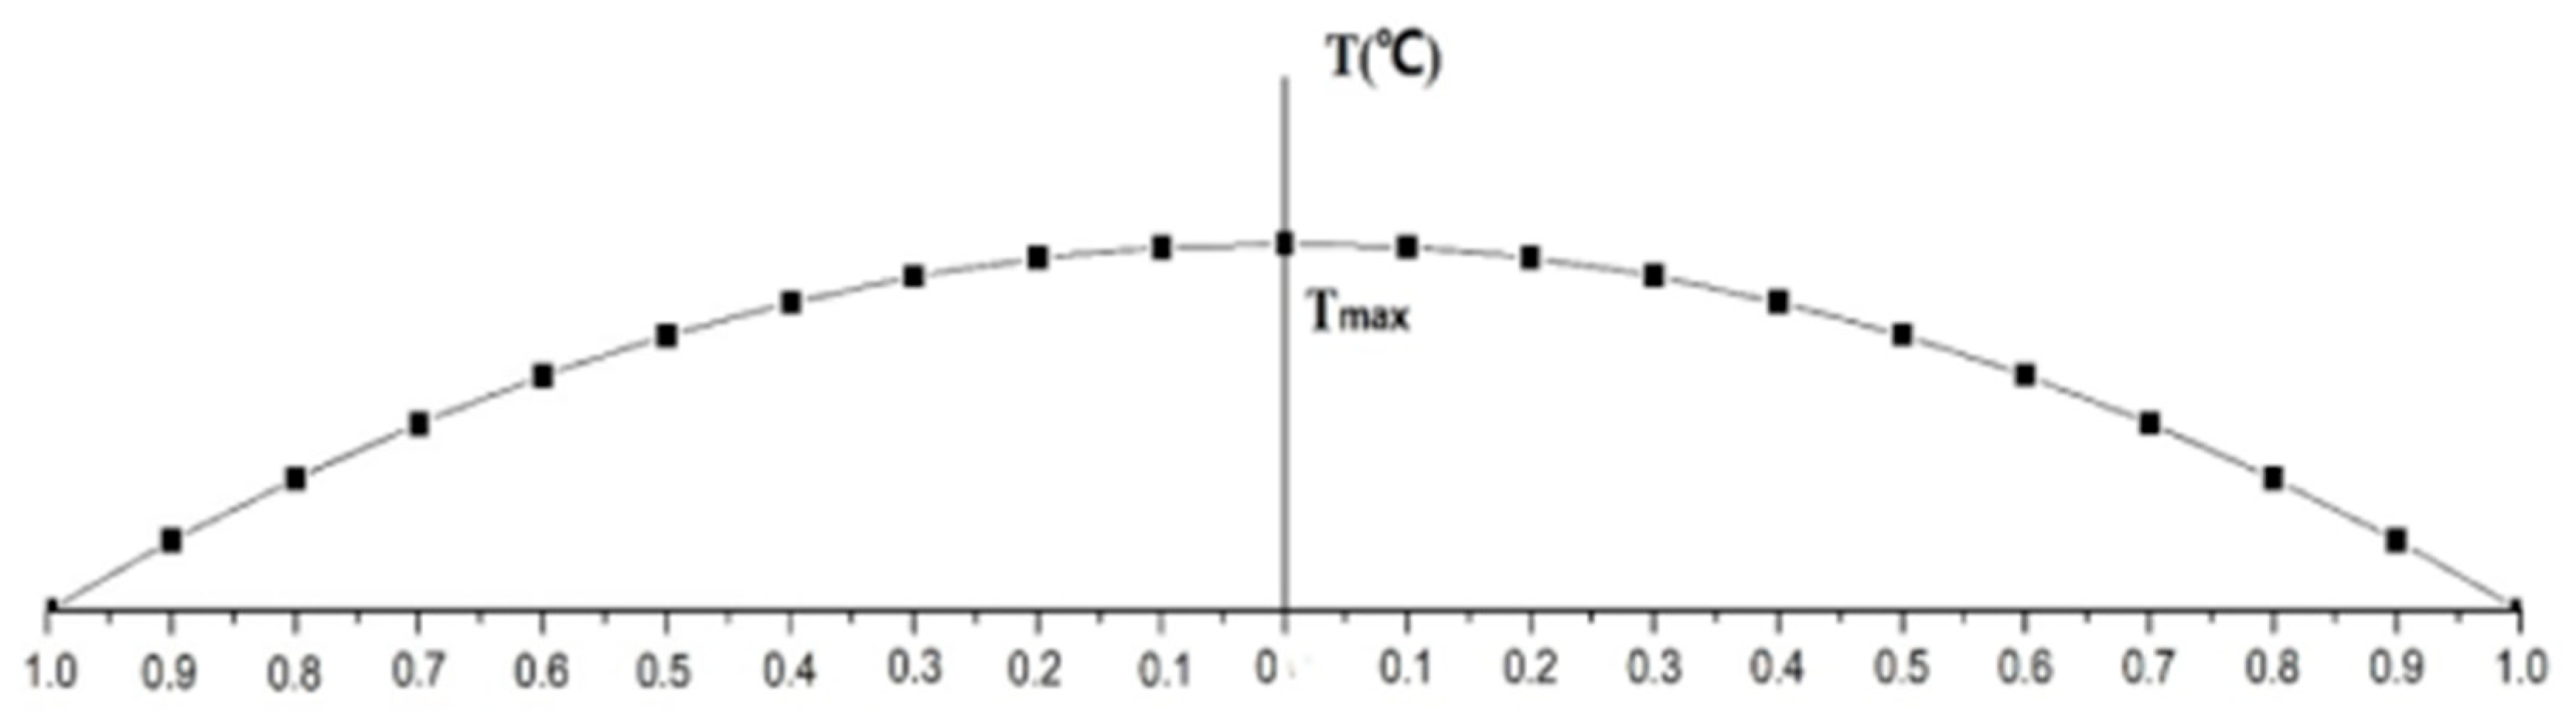

Table 1.
Concrete mix proportion for the nuclear island raft foundation.
| Material | Content (kg/m³) |
| Medium Sand | 733 |
| Crushed Stone (5–16 mm) | 550 |
| Crushed Stone (16–31.5 mm) | 550 |
| Cement | 310 |
| Fly Ash | 103 |
| Chemical Admixture | 3.92 |
| Water | 165 |
Table 2.
Initial curing conditions for the nuclear island raft foundation.
| No. | Location | Curing Configuration | Remarks |
| 1 | Horizontal surface (2.114 m thick) | 1 moist geotextile + drip irrigation + 1 plastic film + 1 cotton quilt + 3 layers of gunny sacks | 6mm-thick gunny sack |
| 2 | Horizontal surface (3.35 m thick) | 1 moist geotextile + drip irrigation + 1 plastic film + 1 cotton quilt + 5 layers of gunny sacks | |
| 3 | Steel liner facade (2.114 m thick) | 6 mm steel liner + 1 cotton quilt + 5 layers of gunny sacks | |
| 4 | Outer facade (3.35 m thick) | Wooden formwork + 1 cotton quilt + 5 layers of gunny sacks |
Table 3.
Thermodynamic parameters of concrete and bedrock.
| Property | Raft Foundation Concrete | Bedrock |
| Density (kg/m³) |
2414.92 | 2610 |
| Specific Heat (kJ/(kg·℃)) |
1.09 | 0.91 |
| Thermal Conductivity (kJ/(m·h·℃)) |
7.1 | 11.304 |
| Thermal Diffusivity (m2/h) |
0.0027 | 0.0046 |
| Equivalent Heat Transfer Coefficient (W/(m2·℃)) |
1.26 (Outer facade of 3.35m-thick region) | / |
| 1.29 (Horizontal surface of 3.35m-thick region) | / | |
| 1.40 (Steel lining facade of 2.114m-thick region) | / | |
| 1.57 (Horizontal surface of 2.114m-thick region) | / | |
| Initial Placing Temperature (℃) | 22.6 | / |
Table 4.
Summary of measured temperature characteristics at selected points.
| Monitoring Point |
Peak Temperature (℃)[ Time] |
Max. Core-Surface ΔT (℃)[ Time] |
| Point 1 | 59.8[55h] | 16.9[49h] |
| Point 5 | 65.2[65h] | 16.5[77h] |
| Point 7 | 66.7[108h] | 19.8[86h] |
Note: Time in brackets indicates concrete age from the start of pouring.
Table 5.
Summary of simulated temperature characteristics at selected points.
| Location (Simulated) |
Peak Temperature (℃)[ Time] |
Max. Core-Surface ΔT (℃)[ Time] |
| Corresponding to Point 1 | 61.0[88h] | 17.8[112h] |
| Corresponding to Point 5 | 66.4 [112h] | 21.6[136h] |
| Corresponding to Point 7 | 70.4[136h] | 19.4[88h] |
Disclaimer/Publisher’s Note: The statements, opinions and data contained in all publications are solely those of the individual author(s) and contributor(s) and not of MDPI and/or the editor(s). MDPI and/or the editor(s) disclaim responsibility for any injury to people or property resulting from any ideas, methods, instructions or products referred to in the content. |
© 2025 by the authors. Licensee MDPI, Basel, Switzerland. This article is an open access article distributed under the terms and conditions of the Creative Commons Attribution (CC BY) license (http://creativecommons.org/licenses/by/4.0/).
Copyright: This open access article is published under a Creative Commons CC BY 4.0 license, which permit the free download, distribution, and reuse, provided that the author and preprint are cited in any reuse.


