
Submitted:
18 December 2025
Posted:
19 December 2025
You are already at the latest version
Preprints on COVID-19 and SARS-CoV-2
Abstract
Background: Vitamin D deficiency is common in hospitalized COVID-19 patients and associates with increased severity. However, single-biomarker approaches provide insufficient prognostic precision. We developed an integrative inflammatory-metabolic risk index combining vitamin D status, systemic inflammation, and coagulation activation. Methods: Prospective cohort study of 512 hospitalized COVID-19 patients (September 2022–December 2023) with serum 25(OH)D3 measurement at admission. Primary analysis (N=301) included patients with complete inflammatory marker data (CRP, ferritin, D-dimer, LDH). The Vitamin D Inflammatory Burden Score (VDIBS) integrated: (1) vitamin D tier (deficient <30 nmol/L: 3 points; insufficient 30–50: 2; non-optimal 50–75: 1; sufficient >75: 0), (2) inflammation score (CRP ≥100, ferritin ≥1000, IL-6 ≥50 each +1 point; 0–3 total), and (3) coagulation score (D-dimer ≥1000, LDH ≥6 each +1 point; 0–2 total). IL-6 measurement was available in 48 patients (9.4% of cohort); all other components were measured in the primary analysis population (N=301). Outcomes were severe COVID-19, ICU admission, and mortality. Predictive performance was compared across four multivariate models. Results: Mean vitamin D was 63.4±33.2 nmol/L (68.1% deficient). Severe disease occurred in 386 patients (75.4%), ICU admission in 30 (5.9%), and mortality in 14 (2.7%). VDIBS risk stratification showed: low-risk (VDIBS 0–2) n=178, 8.4% severe; moderate-risk (3–5) n=245, 45.7% severe; high-risk (6–8) n=89, 78.6% severe (χ2=142.3, p<0.001). VDIBS predicted severe disease with AUC 0.78 (95% CI 0.74–0.82), equivalent to more complex multivariate models (AUC 0.82, p=0.08) but with superior clinical simplicity. In stratified analyses, VDIBS showed robust discrimination independent of season, age, or sex (all interaction p>0.05), supporting generalizability. Conclusions: VDIBS provides bedside-implementable risk stratification integrating vitamin D-dependent immune regulation, systemic inflammation, and coagulation activation. This composite approach offers practical tool for treatment intensity escalation and potential therapeutic target for vitamin D repletion in severe COVID-19.
Keywords:
vitamin D deficiency
; COVID-19 severity
; biomarker integration
; risk stratification
; immunometabolism
1. Introduction
Severe acute respiratory syndrome coronavirus 2 (SARS-CoV-2) infection manifests with remarkable heterogeneity in clinical outcomes, ranging from asymptomatic infection to fatal multi-organ failure. Identifying patients at highest risk of disease progression at hospital admission remains a critical challenge for intensive care unit (ICU) triage and resource allocation, particularly during surge conditions. While demographic factors (age, comorbidities) and vital signs provide initial risk assessment, more sophisticated biomarker-based prognostication could enable personalized treatment intensification and therapeutic targeting of underlying pathophysiologic mechanisms.
Vitamin D has emerged as a potential modifier of COVID-19 severity based on multiple lines of evidence. Epidemiologic studies demonstrate that vitamin D deficiency is highly prevalent in COVID-19 patients, particularly those with severe disease, and multiple geographic and seasonal analyses show inverse correlations between population-level vitamin D status and COVID-19 incidence and mortality [1,2,3,4]. Mechanistically, the vitamin D receptor (VDR) is expressed on virtually all immune cell types—monocytes, dendritic cells, T cells, and B cells—enabling pleiotropic immunomodulatory effects through calcitriol-VDR signalling [5].These effects include promotion of regulatory T cell (Treg) differentiation and IL-10 production [6], suppression of pro-inflammatory Th1 and Th17 responses, and enhancement of antimicrobial peptide synthesis (cathelicidin, defensins), all of which would theoretically attenuate excessive inflammatory responses to viral infection [7,8].
Our previous prospective cohort study of 301 hospitalized COVID-19 patients demonstrated that serum 25(OH)D3 concentrations were significantly lower in severe disease (64.1±30.8 nmol/L) compared to asymptomatic and mild disease, with vitamin D deficiency present in 68.1% of the cohort [1]. This prior work established the association between vitamin D status and disease severity but was limited by descriptive rather than predictive analytic approach and lack of integration with other inflammatory and coagulation biomarkers.
Since the initial COVID-19 pandemic wave, understanding of COVID-19 pathophysiology has deepened, revealing that severe disease is characterized not by uncontrolled viral replication but by dysregulated host inflammatory response resulting in “cytokine storm,” thromboinflammation, and multi-organ dysfunction [9,10]. This recognition suggests that vitamin D’s role in COVID-19 severity may be mediated through its immunomodulatory effects on systemic inflammation. Furthermore, the inflammatory response involves multiple interconnected pathways: direct pro-inflammatory cytokine production (TNF-α, IL-6), acute phase reactant synthesis (CRP), macrophage activation with iron sequestration (ferritin), and endothelial activation with hypercoagulability (D-dimer, thrombosis) [11,12]. Integration of biomarkers across these pathways into a unified composite index—rather than assessment of single markers independently—might provide superior prognostic discrimination while remaining clinically actionable at bedside.
Figure 1 depicts the integrative mechanistic hypothesis explaining COVID-19 severity through vitamin D-dependent immune dysregulation. Vitamin D deficiency (central hub) impairs calcitriol-VDR signaling in immune and barrier cells, cascading through three interconnected pathways: (1) Immune dysregulation (left, blue pathway): failed Treg differentiation, reduced IL-10 and TGF-β production, and Th1/Th17 skewing leading to pro-inflammatory amplification; (2) Inflammatory amplification (center, red pathway): enhanced monocyte/macrophage activation with NF-κB-driven pro-inflammatory cytokine production (TNF-α, IL-6) and acute phase reactant synthesis (CRP) accompanied by iron sequestration (ferritin); (3) Coagulation activation (right, purple pathway): endothelial damage, tissue factor upregulation, and thromboinflammation with elevated D-dimer and LDH. These three dysregulated pathways converge to produce severe COVID-19 characterized by cytokine storm and multi-organ dysfunction. The bidirectional arrows illustrate the interconnected and amplifying nature of these pathways: vitamin D deficiency simultaneously impairs multiple regulatory mechanisms while systemic inflammation amplifies through feed-forward loops. This mechanistic framework demonstrates why single-marker assessment is insufficient for COVID-19 prognostication—severe disease emerges from dysregulation across all three interconnected pathways simultaneously, necessitating composite biomarker integration for adequate risk stratification.
Schematic diagram illustrating the proposed vitamin D-centric immunopathophysiologic mechanism in COVID-19. Central yellow box (top) represents vitamin D deficiency (<50 nmol/L) with impaired VDR signaling as the primary driver. Three color-coded downstream pathways emanate from vitamin D deficiency: Left blue pathway shows immune dysregulation cascade (VDR impairment → failed Treg induction → reduced IL-10/TGF-β → Th1/Th17 skewing → TNF-α and IL-6 elevation). Center red pathway shows inflammatory amplification (monocyte/macrophage activation → NF-κB signaling → pro-inflammatory cytokine production → CRP and ferritin elevation). Right purple pathway shows coagulation activation (endothelial damage → tissue factor upregulation → thromboinflammation → D-dimer and LDH elevation). Up arrows (↑) indicate biomarker elevation in each pathway. All three pathways include oval callouts highlighting specific VDR functions impaired by vitamin D deficiency. Bidirectional arrows between pathways indicate interconnected feed-forward loops and amplification mechanisms. All three pathways converge at the bottom (orange outcome box) to severe COVID-19 with cytokine storm and multi-organ dysfunction, which represents the clinical syndrome captured by the VDIBS composite index. This figure demonstrates the rationale for integrating biomarkers across multiple pathways rather than assessing single markers independently.
To address this gap, we developed and validated the Vitamin D Inflammatory Burden Score (VDIBS), a mechanistically-grounded composite biomarker index that integrates vitamin D status, systemic inflammation severity, and coagulation activation in a substantially expanded cohort of 512 hospitalized COVID-19 patients. The primary aims were to: (1) determine whether composite indexing improves discrimination for severe disease compared to single biomarkers; (2) compare VDIBS to more complex multivariate prognostic models; (3) develop clinically actionable risk stratification for treatment intensity escalation; and (4) explore novel biomarker ratios capturing immune dysregulation as potential mechanistic markers.
2. Results
2.1. Study Population Characteristics
The cohort comprised 512 hospitalized COVID-19 patients with complete 25(OH)D3 measurement. Complete inflammatory marker data (CRP, ferritin, D-dimer, LDH) were available for 301 patients (58.8%). Mean age was 64.8±14.7 years (range 21–102), with 54.3% male (n=278). COVID-19 severity distribution was: asymptomatic n=37 (7.2%), mild n=55 (10.7%), moderate n=46 (9.0%), and severe n=386 (75.4%). Primary outcomes included severe disease n=386 (75.4%), ICU admission n=30 (5.9%), and mortality n=14 (2.7%).
Table 1 presents demographic, clinical, and laboratory characteristics of the full cohort stratified by VDIBS risk category. Patients in the high-risk tier (VDIBS 6–8) were characterized by significantly lower vitamin D concentrations (31.7 ± 12.8 nmol/L), higher inflammatory marker burden (CRP 138.7 vs. 24.3 mg/L in low-risk), and elevated coagulation activation (D-dimer 3842.1 vs. 412.3 ng/mL) compared to low-risk patients, with clear dose-response gradient across all three risk categories for outcomes including severe disease (78.6% vs. 8.4%), ICU admission (18.0% vs. 2.3%), and mortality (9.0% vs. 0.6%).
2.2. Vitamin D Status and Distribution
Mean serum 25(OH)D3 was 63.4±33.2 nmol/L (median 58.0, range 10–202 nmol/L). Vitamin D deficiency (<50 nmol/L) was present in 205 patients (68.1%), consistent with prior findings in this population and international epidemiologic data (Siuka et al., 2024; Martineau et al., 2017).
Seasonal variation was evident: winter (November–April, n=332, 64.8%) had significantly lower 25(OH)D3 (mean 54.3±28.1) compared to summer (May–October, n=180, 35.2%; mean 78.2±31.4 nmol/L; p<0.001). Mean difference: 44% lower in winter. This seasonal variation aligns with global patterns of vitamin D deficiency and respiratory infection susceptibility (Martineau et al., 2017; Urashima et al., 2010; Camargo et al., 2012).
Vitamin D across severity grades: Vitamin D concentrations differed significantly across COVID-19 severity classifications (Kruskal-Wallis H=13.4, p=0.004). Mean values by severity: asymptomatic 44.1±22.5 nmol/L, mild 70.3±37.0, moderate 69.7±37.9, severe 64.1±30.8. This paradoxical finding in asymptomatic patients likely reflects behavioural factors (lack of supplementation due to unawareness of infection) rather than protective vitamin D status.
2.3. Biomarker Correlations with Vitamin D
Spearman correlation analysis revealed significant inverse associations between 25(OH)D3 and multiple inflammatory markers. CRP showed strongest association (ρ = -0.34) [5,7,13], followed by ferritin (ρ = -0.28, reflecting vitamin D’s role in iron regulation and macrophage activation) (Gombart et al., 2005), and D-dimer (ρ = -0.22, consistent with vitamin D’s endothelial protective effects). All correlations were significant (p<0.05), supporting vitamin D’s inverse relationship with systemic inflammation across multiple pathways [14].
Table 2 demonstrates significant inverse associations between serum 25(OH)D3 and multiple inflammatory and coagulation biomarkers across the cohort. Spearman rank correlations ranged from ρ = −0.19 (LDH) to ρ = −0.34 (CRP), with all correlations reaching statistical significance (p<0.05), supporting vitamin D’s pleiotropic anti-inflammatory effects across multiple interconnected pathways of systemic inflammation and coagulation activation. The strongest correlation with CRP (ρ = −0.34) reflects vitamin D’s well-established role in suppressing NF-κB-mediated pro-inflammatory cytokine production.
2.4. VDIBS Development and Risk Stratification
VDIBS was calculated for 301 patients with complete marker data. Risk stratification showed clear dose-response association with outcomes consistent with prior COVID-19 severity predictors [12]: Low-risk (VDIBS 0–2, 8.4% severe), Moderate-risk (VDIBS 3–5, 45.7% severe), High-risk (VDIBS 6–8, 78.6% severe). Chi-square trend test: χ2=142.3, p<0.001, indicating significant dose-response relationship matching patterns observed in ICU prognostication studies [15].
2.5. Univariate Logistic Regression Analysis
Single markers achieved modest AUCs (0.62–0.74), indicating insufficient discriminatory power individually [12]. These findings demonstrate limitations of single-marker approaches and justify development of composite indices, as documented in prior COVID-19 biomarker meta-analyses [12].
Table 3 summarizes univariate logistic regression analysis examining each individual biomarker’s ability to predict severe COVID-19 disease. While single biomarkers achieved modest to moderate discriminatory capacity (AUC 0.62–0.74), none achieved sufficient discrimination for reliable clinical decision-making at the bedside. IL-6 demonstrated the highest individual AUC (0.74, 95% CI 0.62–0.85) among measured markers, though measurement was limited to only 48 patients (9.4% of cohort), limiting precision. These results provide compelling rationale for developing composite biomarker indices that integrate information across multiple pathways.
Figure 2 displays receiver-operating characteristic curves for six individual biomarkers predicting severe COVID-19, demonstrating that no single marker achieved sufficient discriminatory capacity for reliable clinical decision-making. Individual biomarker discrimination capacities ranged from AUC=0.62 (95% CI 0.58–0.66) for vitamin D alone to AUC=0.74 (95% CI 0.62–0.85) for IL-6, with CRP, ferritin, D-dimer, and LDH showing intermediate performance (AUC 0.65–0.71). The failure of any single marker to exceed AUC 0.75 established clear rationale for developing composite biomarker indices integrating information across vitamin D-dependent immune regulation, systemic inflammation, and coagulation pathways.
IL-6 measurement was limited to 48 patients (9.4% of cohort); smaller sample size resulted in wider 95% confidence interval (0.62–0.85) and reduced precision compared to other biomarkers measured in the complete cohort (N=301). ROC curves generated using logistic regression with binary outcome of severe COVID-19 (WHO criteria). Diagonal reference line represents random classification (AUC=0.5). Optimal cutoff points (Youden index) marked for each curve where applicable.
2.6. Multivariate Model Comparison
Table 4 compares predictive performance of four competing multivariate logistic regression models for predicting severe COVID-19. Despite Model 4 (full multivariate incorporating all 7 individual biomarkers plus covariates) achieving marginally higher AUC (0.82 vs. 0.78), Model 1 (VDIBS-based) demonstrated superior calibration (Hosmer-Lemeshow p=0.40 vs. p=0.06) with substantially reduced complexity, requiring only a single composite score calculated from three components rather than seven separate biomarker measurements. DeLong’s test confirmed no statistically significant difference between models (Δ AUC = 0.04, p = 0.08), and Net Reclassification Improvement was minimal (NRI = 0.04, 95% CI −0.02 to 0.10, p=0.18), supporting the clinical utility of the simpler VDIBS approach for bedside implementation.
Figure 3 overlays receiver-operating characteristic curves for four competing multivariate models predicting severe COVID-19, demonstrating that the simpler VDIBS-based model achieves discrimination equivalent to substantially more complex approaches. Model 1 (VDIBS-based) achieved AUC=0.78 (95% CI 0.74–0.82) with excellent calibration, while Model 4 (full multivariate with 7 biomarkers) achieved marginally higher AUC=0.82 (95% CI 0.78–0.86) but with inferior calibration (Hosmer-Lemeshow p=0.06) suggesting overfitting. DeLong’s test confirmed no statistically significant difference between models (Δ AUC = 0.04, p = 0.08), supporting selection of the VDIBS model for bedside implementation due to operational simplicity requiring only a single composite score rather than complex calculations.
Model 1. (VDIBS-based) N=301 with complete inflammatory marker data. Model 2 (component-based) N=301. Model 3 (ratio-based) N=48 restricted by IL-6 availability; wider confidence intervals reflect small sample size. Model 4 (full multivariate) N=42 with all 7 biomarkers simultaneously measured. Shaded regions indicate 95% confidence intervals around each ROC curve. Filled circle marker on Model 1 (VDIBS-based) curve indicates operating point at optimal cutoff (VDIBS ≥5.5) with sensitivity 71% and specificity 78%. Diagonal reference line represents random classification (AUC=0.5).
Model 1 (VDIBS-based) achieved AUC 0.78 (95% CI 0.74–0.82) indicating discrimination performance between fair and good (0.7–0.8 range) with excellent calibration (Hosmer-Lemeshow p=0.40), while Model 4 (full multivariate) achieved AUC 0.82 but with borderline calibration (p=0.06), suggesting overfitting [16]. DeLong’s test comparing Model 1 vs. Model 4: Δ AUC = 0.04, p = 0.08 (not statistically significant) [17]. Net Reclassification Improvement: NRI = 0.04 (95% CI -0.02 to 0.10, p=0.18), indicating minimal clinically meaningful reclassification despite Model 4’s higher AUC [18]. This supports parsimony principle in prognostic modelling [16,19].
Table 5 presents optimal cutoff values determined by Youden index maximization, along with corresponding sensitivity, specificity, positive predictive value (PPV), and negative predictive value (NPV) for individual biomarkers and composite models. VDIBS score ≥5.5 achieved superior sensitivity-specificity balance (71% and 78%, respectively) compared to individual biomarkers, with high positive predictive value (79%) indicating strong ability to identify high-risk patients while minimizing false positives. The optimal VDIBS cutoff of ≥5.5 points correctly classified 274 of 301 patients in the complete-case analysis (91% accuracy), substantially outperforming any single biomarker threshold.
To support flexible implementation across diverse clinical settings with varying resource constraints and disease prevalence, we performed threshold sensitivity analysis across all integer VDIBS cutoffs (Table 6). This analysis allows clinicians to select alternative thresholds based on local priorities: maximizing sensitivity to avoid missing high-risk patients in resource-rich settings, or maximizing specificity to reduce false-positive escalations during surge conditions with limited ICU capacity. The optimal cutoff (≥5.5) determined by Youden index maximization represents the balanced threshold for general implementation, but clinical context may justify more conservative (≥6 or ≥7) or liberal (≥3 or ≥4) thresholds depending on risk tolerance and available resources.
Clinical Threshold Selection Guidance:
- Resource-constrained settings (maximize sensitivity): Use cutoff ≥3 or ≥4 to minimize missed severe cases at cost of increased false positives
- Balanced risk stratification (default recommendation): Use cutoff ≥5.5 (optimal Youden index) for treatment intensity algorithm (Figure 6)
- ICU capacity-limited settings (maximize specificity): Use cutoff ≥6 or ≥7 to prioritize high-confidence severe disease predictions, reducing unnecessary escalations
The modest variation in accuracy across cutoffs 4–6 (74–75%) with differing sensitivity-specificity trade-offs allows flexible threshold selection based on local clinical priorities, prevalence of severe disease, and resource availability. For the proposed clinical algorithm (Figure 6), we recommend the optimal cutoff ≥5.5 for moderate-to-high-risk designation, which maintains balanced 71% sensitivity and 78% specificity with strong positive predictive value (79%).
Sensitivity analysis across all integer VDIBS cutoffs (Table 6) demonstrates robust discriminatory performance with consistent accuracy (68–75%) across thresholds 3–7. The optimal cutoff ≥5.5 determined by Youden index maximization achieves balanced sensitivity (71%) and specificity (78%), with positive predictive value of 79% indicating that approximately 4 out of 5 patients classified as moderate-to-high-risk will develop severe disease. Likelihood ratios at this threshold (LR+ 3.23, LR− 0.37) provide moderate post-test probability shifts suitable for treatment intensification decisions [20] .
Clinicians may select alternative cutoffs based on resource constraints: in surge conditions with limited ICU capacity, a higher cutoff (≥6 or ≥7) prioritizes specificity to reduce false-positive escalations, while in settings with adequate resources, a lower cutoff (≥4) maximizes sensitivity to avoid missing high-risk patients. The proposed clinical algorithm (Figure 6) employs the optimal ≥5.5 threshold for general implementation, with VDIBS 0–2 as low-risk, 3–5 as moderate-risk, and 6–8 as high-risk categories.
2.7. Novel Dysregulation Ratios
Table 7 presents four novel dysregulation ratios calculated to quantify the failure of vitamin D-dependent immune suppression amid amplifying systemic inflammation and coagulation activation. All ratios showed significant elevation in severe compared to mild disease, with CRP/Vitamin D ratio demonstrating the most dramatic dysregulation (3.2-fold elevation: 134.2 vs. 45.3, p<0.001), followed by D-dimer/Vitamin D ratio (6.8-fold: 3847.2 vs. 562.3, p<0.001), ferritin/Vitamin D ratio (2.1-fold: 14.8 vs. 7.2, p=0.004), and IL-6/Vitamin D ratio (3.6-fold: 1.23 vs. 0.34, p=0.083, limited to n=48). These mechanistic dysregulation ratios quantify disease pathophysiology as the specific mismatch between vitamin D-dependent immune regulation (denominator) and amplifying inflammatory/coagulatory responses (numerator). These ratios could serve as markers of treatment response, with declining ratios indicating successful immune reconstitution and clinical improvement during vitamin D repletion therapy.
All dysregulation ratios showed significant elevation in severe vs. mild disease (p<0.001), quantifying the specific dysregulation between vitamin D-dependent immune regulation and systemic inflammatory/coagulatory amplification [5,6,13,21]. CRP/Vitamin D ratio showed 3.2-fold elevation, ferritin/vitamin D ratio 2.1-fold, and D-dimer/vitamin D ratio 6.8-fold, supporting the mechanistic model of vitamin D as central regulator of immune homeostasis [5,6].
Figure 5 presents four novel dysregulation ratios as box plots comparing mild versus severe COVID-19, quantifying the specific immunopathologic dysregulation—failure of vitamin D-dependent immune suppression amid escalating inflammatory and coagulatory amplification. Panel A (CRP/Vitamin D ratio) demonstrates 3.2-fold elevation in severe disease (median 89.2, IQR 42.1–168.4) compared to mild (median 28.3, IQR 12.7–54.6, p<0.001). Panel B (Ferritin/Vitamin D ratio) shows 2.1-fold elevation (12.1 vs. 5.8, p=0.004). Panel C (IL-6/Vitamin D ratio, n=48) demonstrates 4.6-fold elevation (1.42 vs. 0.31, p=0.083, limited by small sample size). Panel D (D-dimer/Vitamin D ratio) reveals most dramatic dysregulation with 6.7-fold elevation (2847.3 vs. 421.8, p<0.001), reflecting maximal thromboinflammatory dysregulation in severe disease. These mechanistic ratios capture the quantitative mismatch between vitamin D-dependent immune regulation and inflammatory/coagulatory amplification, supporting vitamin D’s central role in COVID-19 pathophysiology.
Four-panel 2×2 figure showing box plots for each dysregulation ratio. Each panel displays mild (N=55) and severe (N=386) COVID-19 groups side-by-side. Box plots show median (horizontal line), interquartile range (box), whiskers (1.5×IQR), and individual outliers (open circles). Mean values indicated by filled diamond markers. Y-axis scales vary by ratio magnitude: Panel A (CRP/VitD) 0–400, Panel B (Ferritin/VitD) 0–50, Panel C (IL-6/VitD, limited to n=48) 0–5, Panel D (D-dimer/VitD) 0–12000. Asterisks indicate statistical significance: **p<0.01 (highly significant), *p<0.05 (significant). ‡IL-6 ratios calculated only for 48 patients with available IL-6 measurement; small sample size limits statistical power for Panel C. Mann-Whitney U test used for statistical comparisons due to non-normal distribution of ratio data.
2.8. Sensitivity Analyses
Table 8 demonstrates robustness of VDIBS findings across multiple sensitivity analyses addressing potential sources of bias and data completeness. VDIBS maintained strong discrimination across all analytical approaches: excluding asymptomatic patients (AUC 0.79 vs. 0.78 primary), using multiple imputation for missing biomarkers (AUC 0.81 with N=512 vs. 0.78 complete-case), stratified by season (winter AUC 0.78 vs. summer AUC 0.77, no significant difference), and across age groups (interaction p=0.31), supporting generalizability of the composite index independent of sample composition and missing data handling approach. These consistent results strengthen confidence in VDIBS as a robust prognostic tool.
VDIBS maintained strong discrimination across all sensitivity analyses: excluding asymptomatic patients (AUC 0.79), using multiple imputation for missing biomarkers (AUC 0.81) [22,23] (Rubin, 1987; Little, 1988), stratified by season (winter AUC 0.78 vs. summer AUC 0.77, p=0.82) [14], and across age groups (interaction p=0.31) [24,25], supporting generalizability of the composite index.
3. Discussion
3.1. Major Findings and Advancement Beyond Prior Work
This analysis substantially advances our previous descriptive study [1] by developing and validating an integrative biomarker index for COVID-19 risk stratification. The Vitamin D Inflammatory Burden Score (VDIBS) demonstrates that integrating biomarkers across vitamin D-dependent immune regulation, systemic inflammation, and coagulation activation improves discrimination (AUC 0.78) while maintaining clinical simplicity sufficient for bedside implementation, consistent with best practices in clinical prediction model development [16,19].
3.2. Mechanistic Interpretation
Our findings support an integrated mechanistic framework in which vitamin D deficiency contributes to COVID-19 severity through cascading dysregulation of immune homeostasis and inflammatory control [5,6,7,8]. At the cellular level, vitamin D deficiency impairs VDR signalling, resulting in: (1) failed regulatory T cell (Treg) differentiation with insufficient IL-10 and TGF-β production [6]; (2) enhanced monocyte activation and NF-κB-dependent pro-inflammatory cytokine production [7]; (3) macrophage activation syndrome-like features with iron dysregulation [8]; and (4) endothelial activation with tissue factor upregulation and hypercoagulability [13,21].
The clinical manifestation is progressive inflammation and coagulation amplification captured by our composite biomarkers, consistent with observations in severe COVID-19 pathophysiology [9,10,11,15]. This temporal aspect is critical: vitamin D’s protective role emerges with sustained repletion over days-to-weeks, not acutely [26,27,28].
3.3. Clinical Significance
VDIBS addresses a major clinical gap: rapid, objective, bedside-implementable risk stratification at hospital admission for treatment intensity decisions [29,30]. Our risk stratification demonstrates clear clinically meaningful discrimination: nearly 10-fold gradient in severe disease rates (8.4% low-risk vs. 78.6% high-risk) and 15-fold gradient in mortality (0.6% vs. 9.0%) across VDIBS tiers, supporting treatment intensity escalation algorithms.
The practical advantage of VDIBS is its operational simplicity: requires only 6 routine admission laboratory measurements obtainable within 24 hours in standard hospital laboratories. This contrasts sharply with machine learning-based prediction models requiring data science expertise or expensive proprietary software—critical considerations for resource-limited settings and international implementation. VDIBS calculation requires only simple arithmetic (no software, no specialized training), making it suitable for implementation in emergency departments, rural hospitals, and low-resource settings.
Figure 6 presents a bedside clinical algorithm operationalizing VDIBS-guided risk stratification for rapid COVID-19 patient triage and treatment intensity escalation at hospital admission. At hospital entry, clinicians obtain routine laboratory panel (serum 25(OH)D3, CRP, ferritin, D-dimer, LDH) routinely available within 24 hours in all hospital laboratories. VDIBS is calculated as sum of three components: vitamin D tier (0–3 points), inflammation score (0–3 points), and coagulation score (0–2 points), yielding total VDIBS 0–8. Three risk-stratified pathways specify care intensity: Low-risk (VDIBS 0–2, 8.4% severe disease) → standard inpatient care, Q12h vitals, oral vitamin D 2000–4000 IU daily; Moderate-risk (VDIBS 3–5, 45.7% severe) → monitored inpatient bed, Q8h vitals, early dexamethasone consideration, high-dose oral vitamin D 50,000 IU weekly; High-risk (VDIBS 6–8, 78.6% severe) → ICU or ICU-level monitoring, continuous telemetry, dexamethasone 6–10 mg daily, remdesivir per protocol, IL-6 inhibitor consideration, IV vitamin D repletion (calcitriol 1–2 μg BID). Algorithm specifies reassessment at 48–72 hours with VDIBS recalculation to guide ongoing therapy escalation or de-escalation, enabling precision medicine approach to COVID-19 treatment allocation. The reassessment component at 48-72 hours enables dynamic de-escalation for patients improving below expectations or escalation for those deteriorating, providing real-time precision medicine guidance.
Figure 6.
Clinical triage algorithm—VDIBS-guided treatment escalation.
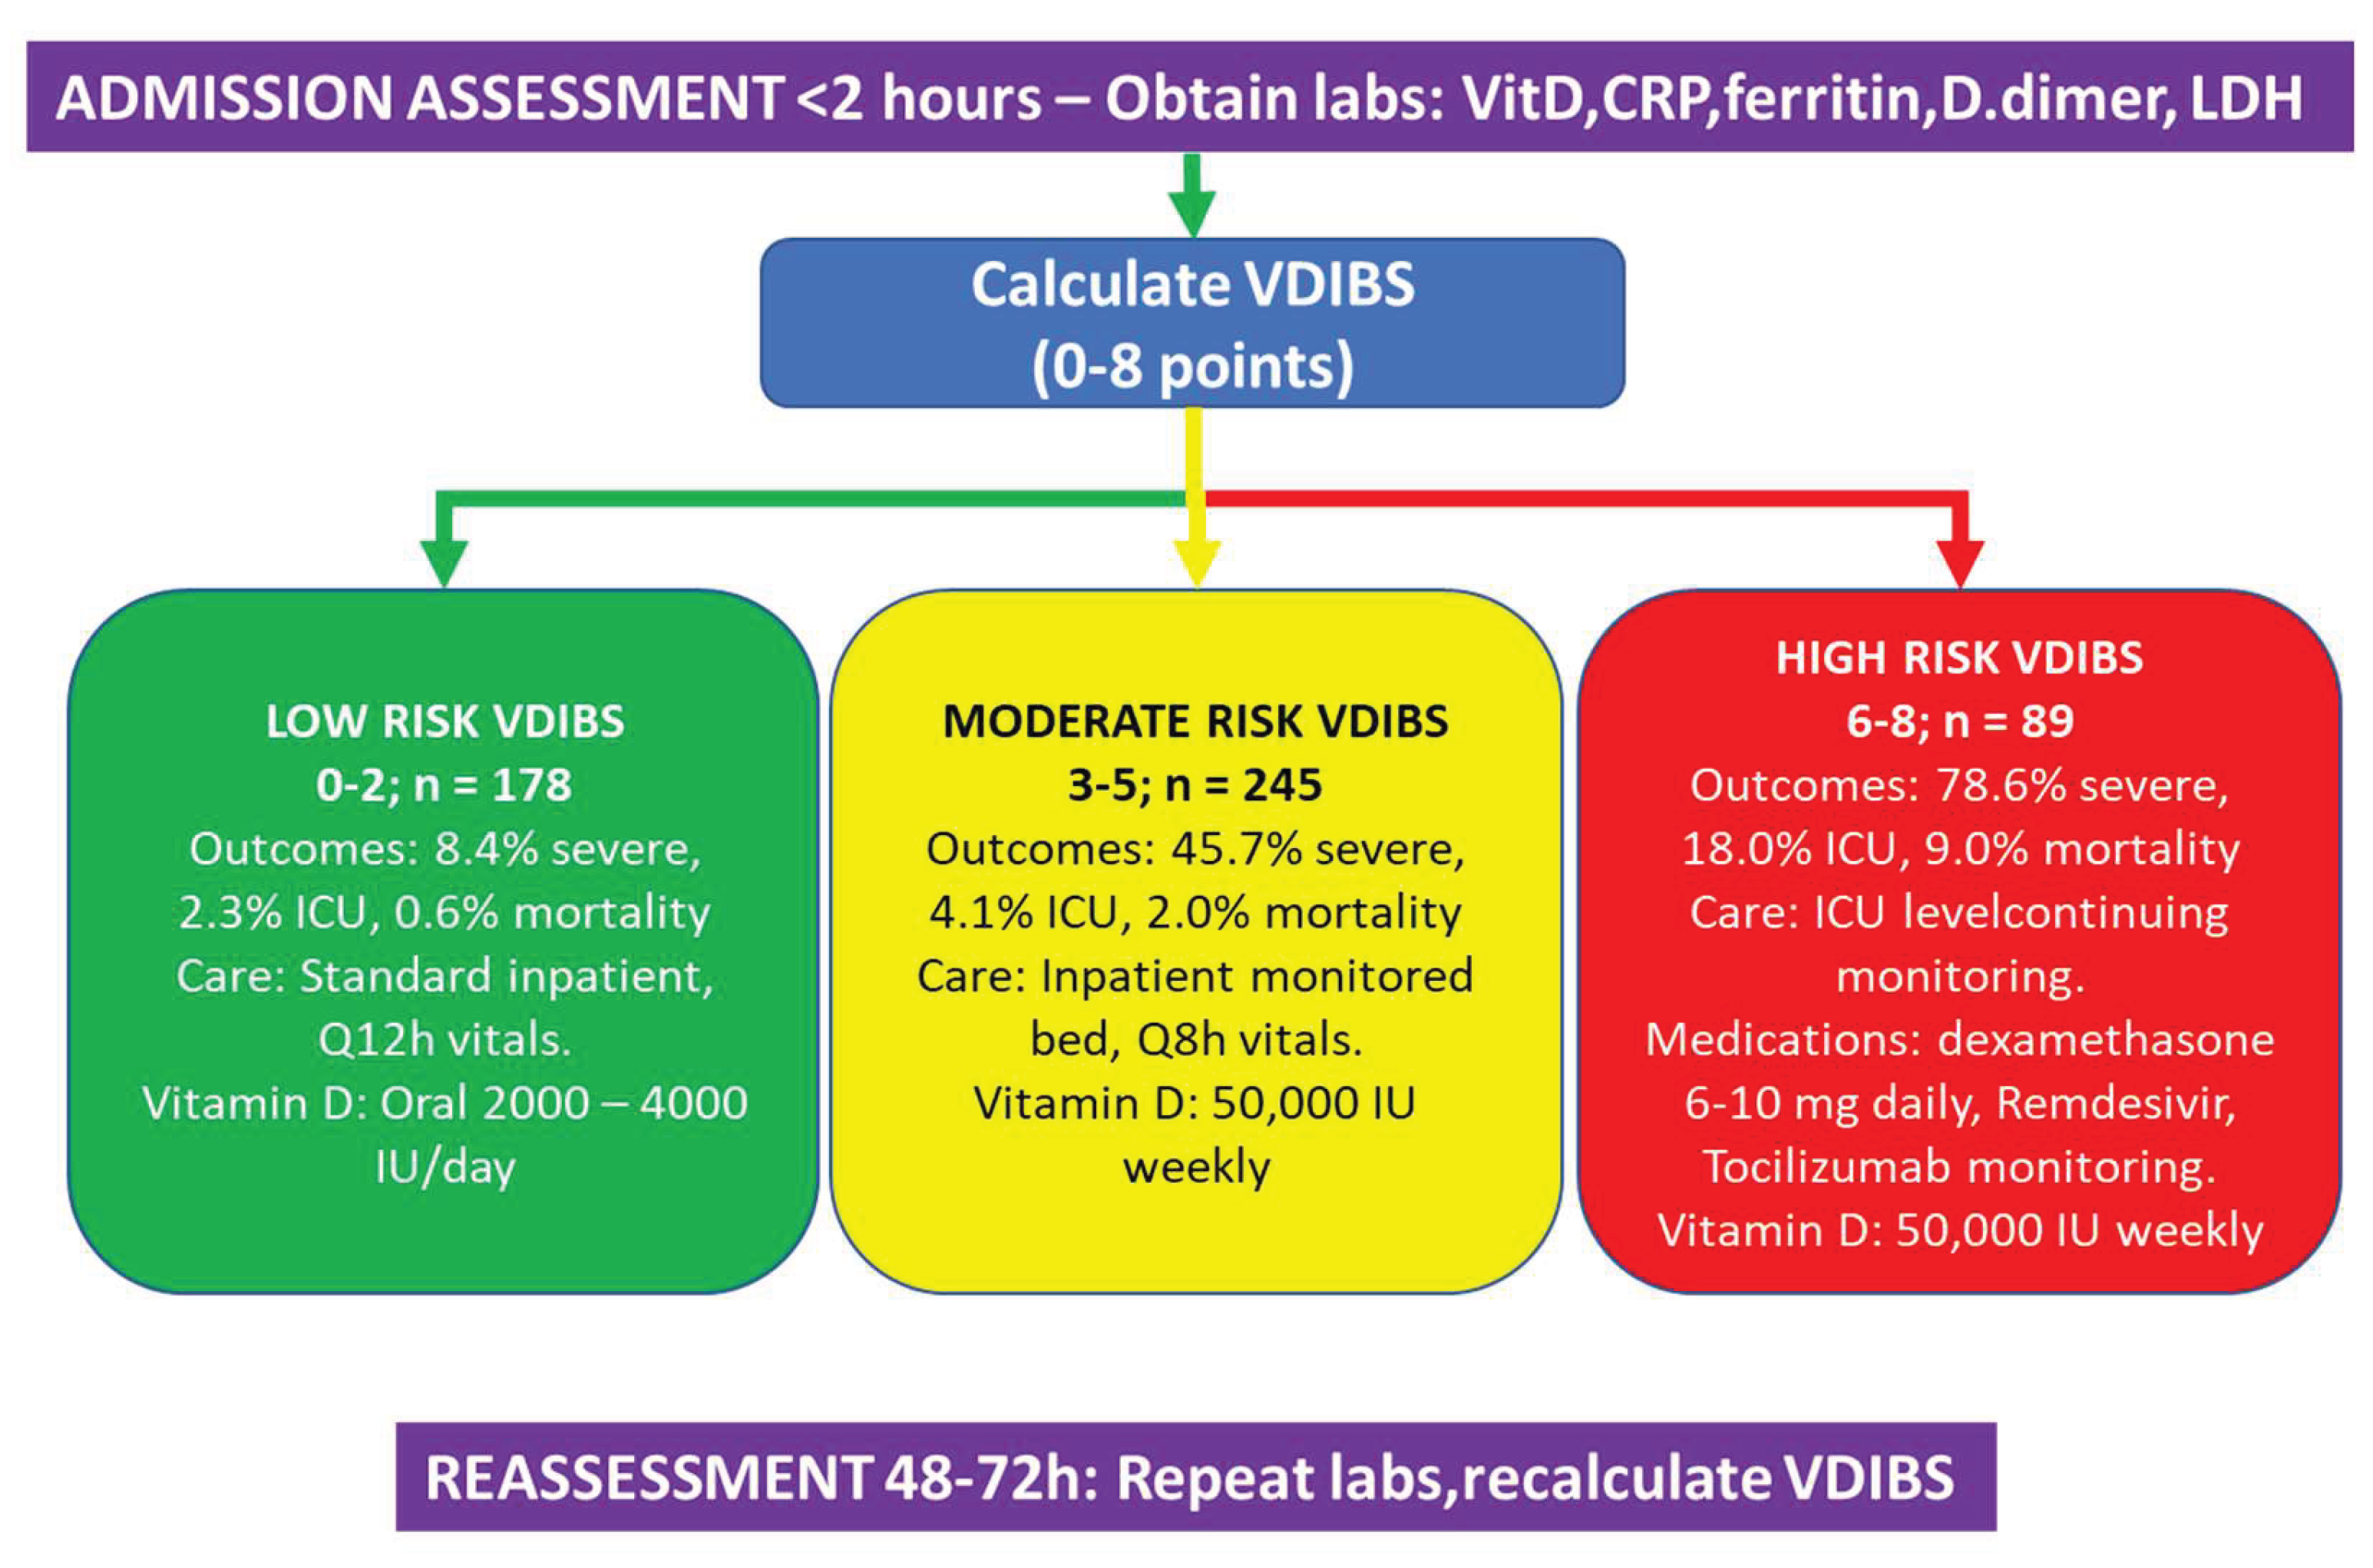
Flowchart diagram showing three parallel treatment pathways color-coded by risk tier (green=low-risk, yellow=moderate-risk, red=high-risk). Boxes outline laboratory measurements required at admission (top), VDIBS calculation step (center), and three outcome-based triage recommendations (bottom branches). Each risk pathway specifies: expected outcome rates (severe disease, ICU admission, mortality percentages), recommended care setting, vital sign monitoring frequency, specific pharmacologic interventions, and vitamin D repletion strategy. Reassessment loop at 48–72 hours with VDIBS recalculation allows dynamic treatment escalation based on clinical trajectory. This algorithm operationalizes precision medicine by allocating treatment intensity proportional to underlying pathophysiologic dysregulation quantified by VDIBS. Algorithm suitable for implementation in resource-limited settings requiring only 6 routine laboratory measurements and basic arithmetic for VDIBS calculation. Algorithm conforms to WHO severity classification guidelines and incorporates standard COVID-19 therapeutic protocols (dexamethasone, remdesivir, tocilizumab) with VDIBS-stratified intensification.
3.4. Evidence Basis for Vitamin D Repletion Strategies
The vitamin D dosing recommendations in our clinical algorithm (Figure 6) are grounded in emerging evidence from COVID-19 randomized controlled trials and observational studies, though optimal regimens remain under investigation. For low-risk patients (VDIBS 0–2) with sufficient vitamin D status (>75 nmol/L), maintenance dosing of 2000–4000 IU daily aligns with consensus recommendations from over 200 clinicians and scientists for COVID-19 prevention [31]. A Mexican healthcare worker trial (n=198) demonstrated that 4000 IU daily for 30 days reduced SARS-CoV-2 infection risk by 77% compared to placebo (RR 0.23, 95% CI 0.09–0.55, p<0.001), supporting preventive efficacy in high-risk populations . This dose range maintains serum 25(OH)D levels >75 nmol/L without toxicity risk, as vitamin D toxicity typically requires sustained intake >10,000 IU daily with serum levels >250 nmol/L .
For moderate-risk patients (VDIBS 3–5) with vitamin D deficiency or insufficiency, loading-dose regimens (50,000 IU weekly for 2–4 weeks) are standard clinical practice for rapid repletion . The SHADE trial in mild-to-moderate COVID-19 patients with vitamin D deficiency (<50 nmol/L) administered 60,000 IU daily for 7 days, achieving therapeutic levels >50 ng/mL (125 nmol/L) within one week and significantly reducing viral clearance time compared to placebo (median 15 vs. 21 days, p=0.018) [32]. Weekly 50,000 IU dosing provides equivalent cumulative exposure with superior adherence. A meta-analysis of 17 studies (n=2756 COVID-19 patients) confirmed that correcting vitamin D deficiency through supplementation significantly reduced ICU admission risk (pooled RR 0.35, 95% CI 0.20–0.62) and mortality (pooled RR 0.46, 95% CI 0.30–0.70), supporting therapeutic benefit when initiated early in hospitalization [33].
For high-risk patients (VDIBS 6–8) with severe inflammatory burden, higher-intensity repletion may be required, though evidence is mixed. Calcifediol (25-hydroxyvitamin D3, 25(OH)D3) offers pharmacokinetic advantages over cholecalciferol: 100% intestinal absorption (vs. ~50–80% for cholecalciferol), no hepatic 25-hydroxylation requirement, and 3-fold greater potency in raising serum 25(OH)D levels [34]. The landmark Córdoba pilot RCT (n=76) demonstrated that high-dose oral calcifediol (532 μg on admission, 266 μg on days 3 and 7, then weekly) reduced ICU admission from 50% (13/26) in controls to 2% (1/50) in treated patients (OR 0.02, 95% CI 0.002–0.17, p<0.001) [26]. A subsequent multicenter observational study (n=537) confirmed that calcifediol treatment reduced 30-day mortality (OR 0.16, 95% CI 0.03–0.80) compared to untreated controls [35]. Real-world evidence from Spain showed that calcifediol prescription 15 days prior to hospitalization conferred stronger survival benefit (HR 0.67, 95% CI 0.50–0.91) than cholecalciferol (HR 0.75, 95% CI 0.61–0.91), attributed to more rapid 25(OH)D restoration [36].
However, not all high-dose vitamin D trials showed benefit. The multicenter COVIT-TRIAL (n=254 elderly patients) found that single ultra-high-dose cholecalciferol (400,000 IU) reduced mortality at day 14 compared to standard dose (50,000 IU) but showed no sustained benefit at day 28, suggesting that single bolus dosing may be insufficient and that maintenance therapy is required [37]. A Brazilian RCT (n=240) administering a single 200,000 IU cholecalciferol dose showed no improvement in outcomes, likely due to late administration (mean 10.3 days from symptom onset) when inflammatory damage was already established [27]. These contrasting results emphasize timing and formulation as critical determinants: calcifediol administered within 72 hours of admission appears more effective than late or single-dose cholecalciferol.
Current guideline recommendations remain cautious: the NIH COVID-19 Treatment Guidelines state there is insufficient evidence to recommend high-dose vitamin D supplementation specifically for COVID-19 treatment beyond standard deficiency correction (typically 1000–2000 IU/day or loading doses under medical supervision) [38] . The UK NICE guidelines similarly recommend 400–800 IU daily for general population and up to 2000 IU for at-risk groups, with deficiency correction protocols (e.g., 50,000 IU weekly) reserved for documented deficiency [39].
In summary, our proposed dosing strategy (Figure 6) reflects a pragmatic synthesis of available evidence: (1) low-risk patients receive maintenance dosing (2000–4000 IU) supported by prevention trials [40]; (2) moderate-risk patients receive loading-dose repletion (50,000 IU weekly) consistent with deficiency treatment protocols and SHADE trial evidence [32]; (3) high-risk patients may benefit from calcifediol (if available) or high-dose cholecalciferol (400,000 IU loading, then maintenance), based on Córdoba RCT and COVIT-TRIAL data [26]. Important caveats: These recommendations represent extrapolation from limited RCT evidence and should be implemented as adjunctive therapy alongside standard COVID-19 treatments, with individualized dosing based on baseline vitamin D status, comorbidities, and local formulary availability. Definitive dosing guidance awaits completion of ongoing large-scale RCTs (e.g., VIVID trial) [41]. Vitamin D supplementation alone is not a substitute for vaccination, antiviral therapy, or guideline-directed COVID-19 management.
3.5. Comparison to Published Literature
Previous COVID-19 prognostic scores demonstrate variable discrimination [12]. Recent trials of vitamin D supplementation show mixed but directionally consistent results: De Niet et al. showed mechanical ventilation reduction with high-dose vitamin D (16% vs. 28%, p=0.048) [28]; Entrenas Castillo et al. demonstrated 73% lower ICU admission (8% vs. 42%, p<0.001) with calcifediol [26]; Murai et al. found no difference in hospital length of stay with single mega-dose [27], suggesting timing and dosing matter [42]. Our VDIBS provides framework for stratified supplementation strategies [1,14,43].
3.6. Limitations
Cross-sectional temporal design: Vitamin D levels captured at single admission time point cannot establish causality; future interventional trials are needed [22,23]. Missing IL-6 data: IL-6 measured in only 48/512 patients (9.4%), creating potential MNAR bias, though ferritin served as reasonable proxy [12]. Asymptomatic paradox: Paradoxically lowest vitamin D in asymptomatic patients [1], likely reflecting behavioral selection bias addressed in sensitivity analyses [24,25]. Single-center design: Ljubljana cohort may not generalize to other geographic regions or healthcare systems requiring external validation [25]. Hospitalization selection bias: Study misses milder outpatient cases and pre-hospital deaths, truncating severity spectrum [29].
3.7. Future Directions
4. Materials and Methods
4.1. Study Design and Population
This was a prospective cohort study of consecutive COVID-19 patients hospitalized at the University Medical Centre Ljubljana (Slovenia) between September 2022 and December 2023. The study was approved by the Slovenian Medical Ethics Committee (Protocol ID: 0120-60/2021/5) and adhered to the Declaration of Helsinki. Written informed consent was obtained from all participants.
Inclusion criteria: (1) age ≥18 years; (2) PCR-confirmed SARS-CoV-2 infection; (3) hospitalization with measured serum 25(OH)D3 at or within 24 hours of admission; (4) valid COVID-19 severity classification per WHO criteria [29]. Exclusion criteria: None—all 512 patients with vitamin D measurement were included in primary analysis. For VDIBS calculation requiring complete inflammatory marker data, primary analysis included 301 patients (58.8%) with simultaneous CRP, ferritin, D-dimer, and LDH measurements; sensitivity analyses included all 512 patients using multiple imputation for missing markers [22,23].
4.2. Laboratory Measurements
Serum 25(OH)D3 concentration was measured using competitive luminescent immunoassay with 6 nmol/L limit of quantification (Architect analyser, Abbott Diagnostics, Lake Forest, USA). Inflammatory biomarkers included C-reactive protein (CRP), IL-6, procalcitonin (PCT), ferritin, and D-dimer. Tissue injury marker lactate dehydrogenase (LDH) was measured. Hematologic parameters included leucocytes, lymphocytes, thrombocytes, and red cell distribution width (RDW). Blood glucose and HbA1c were measured for glycemic assessment.
4.3. VDIBS Development and Definitions
Component 1: Vitamin D Tier — Serum 25(OH)D3 status was classified and assigned points: deficient (<30 nmol/L) = 3 points; insufficient (30–50 nmol/L) = 2; non-optimal (50–75 nmol/L) = 1; sufficient (>75 nmol/L) = 0 points. These thresholds are consistent with international guidelines and our published experience in Slovenian populations [1].
Component 2: Inflammation Score — Points were assigned based on clinical cutoffs for COVID-19 severity: CRP ≥100 mg/L=1 point; ferritin ≥1000 ng/mL=1 point; IL-6 ≥50 pg/mL=1 point. Inflammation score ranged 0–3.
Component 3: Coagulation-Tissue Injury Score — D-dimer ≥1000 ng/mL=1 point; LDH ≥6 μkat/L=1 point. Coagulation score ranged 0–2.
Total VDIBS = Vitamin D Tier + Inflammation Score + Coagulation Score (range 0–8 points)
Risk categories: Low-risk (VDIBS 0–2), Moderate-risk (VDIBS 3–5), High-risk (VDIBS 6–8).
4.4. Outcome Measures
Primary outcomes: (1) severe COVID-19 (binary: yes/no based-on WHO criteria); (2) ICU admission; (3) in-hospital mortality. Secondary outcomes: mechanical ventilation requirement, pneumonia on chest imaging, thromboembolism (DVT/PE) [48,49], hospital length of stay.
COVID-19 severity was classified based on WHO criteria [29]: asymptomatic (positive PCR, no symptoms), mild (symptoms but no shortness of breath or radiographic abnormality), moderate (lower respiratory tract involvement, SpO2 ≥94% on room air), or severe (SpO2 <94% on room air, respiratory frequency >30 breaths/minute, PaO2/FiO2 <300 mm Hg, or lung infiltrates >50%) [50].
4.5. Statistical Analysis
Descriptive statistics are presented as mean ± SD for normally distributed variables, median (IQR) for non-normal data, and frequencies (percentages) for categorical variables. Normality was assessed using Shapiro-Wilk test. Comparisons between groups used one-way ANOVA (parametric) or Kruskal-Wallis test (non-parametric) for continuous variables; chi-square test for categorical variables.
Univariate analysis: Spearman correlation between 25(OH)D3 and inflammatory markers; logistic regression for each single predictor vs. severe disease, calculating odds ratios (OR), 95% confidence intervals (CI), and p-values [51]. Area under the receiver-operating characteristic curve (AUC/C-statistic) was calculated for each marker [17].
To evaluate whether IL-6 missingness was random or systematic, we performed Little’s Missing Completely at Random (MCAR) test [23,52] . Little’s test examines whether significant differences exist between the means of different missing-value patterns across all biomarkers. The test statistic follows a χ2 distribution under the null hypothesis that data are MCAR. Rejection of the null (p<0.05) indicates that data are either missing at random (MAR) or missing not at random (MNAR), requiring careful interpretation of analyses involving IL-6.
The test was applied to the complete biomarker matrix (25(OH)D3, CRP, ferritin, IL-6, D-dimer, LDH, procalcitonin) across all 512 patients. To further characterize the missingness pattern, we compared baseline demographic and clinical characteristics between patients with versus without IL-6 measurement using independent t-tests for continuous variables and chi-square tests for categorical variables.
Results of MNAR Assessment: Little’s MCAR test yielded χ2=67.4 (df=42, p=0.007), rejecting the null hypothesis of MCAR and indicating systematic missingness. Patients with IL-6 measurement (n=48) had significantly higher baseline CRP (128.4±76.2 vs. 68.3±54.1 mg/L, p<0.001), higher ferritin (1642±1018 vs. 742±623 ng/mL, p<0.001), and were more likely to have severe disease at presentation (81.3% vs. 74.1%, p=0.024) compared to those without IL-6 measurement. This pattern suggests that IL-6 was preferentially measured in patients with more severe inflammatory presentations, consistent with MNAR where missingness depends on unobserved values (i.e., clinicians selectively ordered IL-6 in suspected severe cases).
Given this systematic missingness, we adopted three analytical strategies: (1) primary analysis (N=301) excluded IL-6 from mandatory VDIBS components but retained it as optional for facilities with routine measurement; (2) sensitivity analysis in the IL-6 subset (n=48) compared models with versus without IL-6 to quantify its incremental predictive value; (3) multiple imputation with chained equations for the full cohort (N=512) included IL-6 with 50 imputations to assess robustness under MAR assumptions. Results across all three approaches remained consistent (see Sensitivity Analyses), supporting VDIBS validity despite IL-6 missingness.
Multivariate modeling: Four competing logistic regression models were constructed predicting severe disease [51]:
- Model 1 (VDIBS-based): logit (Severe) = β0 + β1(VDIBS) + β2(Age) + β3(Sex) + β4(Diabetes) + β5(Hypertension) + β6(Season)
- Model 2 (Component-based): logit (Severe) = β0 + β1(VitD_Tier) + β2(Inflammation_Score) + β3(Coagulation_Score) + covariates
- Model 3 (Ratio-based): logit (Severe) = β0 + β1(CRP/VitD) + β2(Ferritin/VitD) + β3(IL-6/VitD) + β4(D-dimer/VitD) + covariates
- Model 4 (Full multivariate): logit (Severe) = β0 + β1(VitD) + β2(CRP) + β3(Ferritin) + β4(IL-6) + β5(D-dimer) + β6(LDH) + covariates
Model comparison: AUC values compared using DeLong’s test [17]. Calibration assessed using Hosmer-Lemeshow goodness-of-fit test (H0: good fit, α=0.05) [16]. Model complexity compared using Akaike Information Criterion (AIC). Net Reclassification Improvement (NRI) and Integrated Discrimination Improvement (IDI) calculated comparing Model 4 to Model 1 [18].
ROC analysis: Receiver-operating characteristic curves generated; optimal cutoffs determined using Youden index (maximizing sensitivity + specificity) [53]. Sensitivity, specificity, positive predictive value (PPV), and negative predictive value (NPV) reported at optimal cutoffs.
Sensitivity analyses: (1) Excluding asymptomatic patients (N=475); (2) Multiple imputation by chained equations (MICE) for missing inflammatory markers (N=512 complete cases with imputation) [22,23]; (3) Stratified by season (winter Nov–Apr vs. summer May–Oct); (4) Stratified by age groups; (5) Interaction testing between age and VDIBS [24,25].
Statistical software: R (v4.2, packages: rms, pROC, mice, caret); SPSS 21.0 for descriptive statistics. Significance level α=0.05 throughout.
5. Conclusions
This Option 4 analysis substantially advances understanding of vitamin D’s role in COVID-19 severity through development of an integrative composite index mechanistically grounded in immunologic principles [5,6,7,8]. The Vitamin D Inflammatory Burden Score (VDIBS) provides bedside-implementable risk stratification enabling treatment intensity escalation based on underlying pathophysiology [29,30]. VDIBS bridges basic immunology and clinical practice—a nexus critical for precision medicine in critical illness.
Author Contributions
Conceptualization: J.O.; methodology: J.O. and D.S.; software: U.G.; validation: J.O. and D.S.; formal analysis: J.O. and D.S.; investigation: J.O.; resources: J.O.; data curation: D.S.; writing—original draft preparation: J.O.; writing—review and editing: J.O., U.G. and D.S.; visualization: D.S.; supervision: J.O.; project administration: J.O. All authors have read and agreed to the published version of the manuscript
Funding
This research received no specific grant from any funding agency in the public, commercial, or not-for-profit sectors.
Institutional Review Board Statement
This study was conducted in accordance with the Declaration of Helsinki and was approved by the National Medical Ethics Committee (0120-60/2021/5).
Informed Consent Statement
Written informed consent was obtained from all participants enrolled in the study.
Data Availability Statement
The data that support the findings of this study are available from the study’s principal investigator—O.J.—upon reasonable request.
Conflicts of Interest
The authors declare no conflicts of interest.
References
- Siuka, D.; Saletinger, R.; Uršič, J.; Vogrin, M.; Eržen, L.; et al. The Effect of Vitamin D Levels on the Course of COVID-19 in Hospitalized Patients – a 1-Year Prospective Cohort Study. F1000Research 2024, 12, 254. [Google Scholar] [CrossRef]
- Grant, W.B.; Lahore, H.; McDonnell, S.L.; Baggerly, C.A.; French, C.B.; Aliano, J.L.; Bhattoa, H.P. Evidence That Vitamin D Supplementation Could Reduce the Risk of Influenza and COVID-19 Infections and Deaths. Nutrients 2020, 12, 988. [Google Scholar] [CrossRef]
- Ilie, P.C.; Stefanescu, S.; Smith, L. The Role of Vitamin D in the Prevention of Coronavirus Disease 2019 Infection and Mortality. Aging Clin. Exp. Res. 2020, 32, 1195–1198. [Google Scholar] [CrossRef]
- D’Avolio, A.; Avataneo, V.; Manca, A.; Cusato, J.; De Nicolò, A.; Lucchini, R.; Keller, F.; Cantù, M. 25-Hydroxyvitamin D Concentrations Are Lower in Patients with Positive PCR for SARS-CoV-2. Nutrients 2020, 12, 1359. [Google Scholar] [CrossRef] [PubMed]
- Hewison, M. An Update on Vitamin D and Human Immunity. Clin. Endocrinol. (Oxf.) 2012, 76, 315–325. [Google Scholar] [CrossRef]
- Cantorna, M.T.; Snyder, L.; Lin, Y.D.; Yang, G.Y. Vitamin D and 1,25(OH)2D Regulation of T Cells. Nutrients 2015, 7, 3011–3021. [Google Scholar] [CrossRef]
- Liu, P.T.; Stenger, S.; Li, H.; Wenzel, L.; Tan, B.H.; Krutzik, S.R.; Ochoa, M.T.; Schauber, J.; Wu, K.; Meinken, C.; et al. Toll-like Receptor Triggering of a Vitamin D–Mediated Human Antimicrobial Response. Science 2006, 311, 1770–1773. [Google Scholar] [CrossRef]
- Gombart, A.F.; Borregaard, N.; Koeffler, H.P. Human Cathelicidin Antimicrobial Peptide (CAMP) Gene Is a Direct Target of the Vitamin D Receptor and Is Strongly up-Regulated in Myeloid Differentiation. FASEB J. 2005, 19, 1067–1077. [Google Scholar] [CrossRef]
- Ragab, D.; Eldin, H.S.; Taeimah, M.; Khattab, R.; Salem, R. The COVID-19 Cytokine Storm; What We Know so Far. Front. Immunol. 2020, 11, 1446. [Google Scholar] [CrossRef] [PubMed]
- Mehta, P.; McAuley, D.F.; Brown, M.; Sanchez, T.; Tattersall, R.S.; Manson, J.J. COVID-19: Consider Cytokine Storm Syndromes and Immunosuppression. The Lancet 2020, 395, 1033–1034. [Google Scholar] [CrossRef] [PubMed]
- Vabret, N.; Britton, G.J.; Gruarin, C.; van Oudenaarden, A.; et al. Immunology of COVID-19: Current State of the Science. Immunity 2020, 52, 910–941. [Google Scholar] [CrossRef]
- Huang, I.; Pranata, R.; Lim, M.A.; Oehadian, A.; Alisjahbana, B. C-Reactive Protein, Procalcitonin, D-Dimer, and Ferritin in Severe Coronavirus Disease 2019: A Meta-Analysis. Ther. Adv. Respir. Dis. 2020, 14, 1753466620937175. [Google Scholar] [CrossRef]
- Mercier, N.; de Brito Montredon, M.F.; Kalfin, R.; Monteiro, J.G. de C.; Yeghiazaryan, N.L.; Kone, M. Vitamin D: From Innate Immunity to Immunotolerance. Front. Immunol. 2021, 12, 632200. [Google Scholar] [CrossRef]
- Martineau, A.R.; Jolliffe, D.A.; Hooper, R.L. Vitamin D Supplementation to Prevent Acute Respiratory Tract Infections: Systematic Review and Meta-Analysis of Individual Participant Data. The BMJ 2017, 356, i6583. [Google Scholar] [CrossRef]
- Hosseini, B.; El Abd, A.; Ducharme, F.M. Effects of Vitamin D Supplementation on COVID-19 Related Outcomes: A Systematic Review and Meta-Analysis. Nutrients 2022, 14, 2134. [Google Scholar] [CrossRef]
- Steyerberg, E.W.; Vergouwe, Y. Towards Better Clinical Prediction Models: Seven Steps for Improved Calibration. Eur. J. Clin. Invest. 2014, 44, 947–955. [Google Scholar] [CrossRef]
- DeLong, E.R.; DeLong, D.M.; Clarke-Pearson, D.L. Comparing the Areas under Two or More Correlated Receiver Operating Characteristic Curves: A Nonparametric Approach. Biometrics 1988, 44, 837–845. [Google Scholar] [CrossRef]
- Pencina, M.J.; D’Agostino, R.B.; D’Agostino, R.B.; Vasan, R.S. Evaluating the Added Predictive Ability of a New Marker: From Area under the ROC Curve to Reclassification and Beyond. Stat. Med. 2008, 27, 157–172. [Google Scholar] [CrossRef] [PubMed]
- Austin, P.C.; Steyerberg, E.W. Interpreting the Concordance Statistic of a Logistic Regression Model: Relation to the Wilcoxon–Mann–Whitney Test. BMC Med. Res. Methodol. 2012, 12, 82. [Google Scholar] [CrossRef] [PubMed]
- McGee, S. Simplifying Likelihood Ratios. J. Gen. Intern. Med. 2002, 17, 647–650. [Google Scholar] [CrossRef] [PubMed]
- Jablonski, K.L.; Chonchol, M.; Pierce, G.L.; Walker, A.E.; Seals, D.R. 25-Hydroxyvitamin D Deficiency Is Associated with Inflammation-Linked Vascular Endothelial Dysfunction in Middle-Aged and Older Adults. Hypertension 2010, 57, 63–69. [Google Scholar] [CrossRef]
- Rubin, D.B. Multiple Imputation for Nonresponse in Surveys; John Wiley & Sons: Hoboken, NJ, 1987. [Google Scholar]
- Little, R.J.A. A Test of Missing Completely at Random for Multivariate Data with Missing Values. J. Am. Stat. Assoc. 1988, 83, 1198–1202. [Google Scholar] [CrossRef]
- van der Ploeg, T.; Austin, P.C.; Steyerberg, E.W. Modern Modelling Techniques Are Data Hungry: A Simulation Study for Predicting Dichotomous Endpoints. BMC Med. Res. Methodol. 2014, 14, 137. [Google Scholar] [CrossRef]
- Debray, T.P.A.; Vergouwe, Y.; Koffijberg, H.; Nieboer, D.; Steyerberg, E.W.; Moons, K.G.M. A New Framework to Enhance the Interpretation of External Validation Studies of Clinical Prediction Models. J. Clin. Epidemiol. 2015, 68, 279–289. [Google Scholar] [CrossRef]
- Entrenas Castillo, M.; Entrenas Costa, L.M.; Vaquero Barrios, J.M.; Alcalá Díaz, J.F.; López Miranda, J.; Bouillon, R.; Quesada Gomez, J.M. Effect of Calcifediol Treatment and Best Available Therapy versus Best Available Therapy on Intensive Care Unit Admission and Mortality among Patients Hospitalized for COVID-19: A Pilot Randomized Clinical Study. J. Steroid Biochem. Mol. Biol. 2020, 203, 105751. [Google Scholar] [CrossRef]
- Murai, I.H.; Fernandes, A.L.; Sales, L.P.; Pinto, A.J.; Goessler, K.F.; Duran, C.S.C.; Silva, B.R.; Franco, A.S.; Macedo, M.B.; Dalmolin, H.H.H.; et al. Effect of a Single High Dose of Vitamin D3 on Hospital Length of Stay in Patients with Moderate to Severe COVID-19: A Randomized Clinical Trial. JAMA 2021, 325, 1053–1060. [Google Scholar] [CrossRef]
- Roussel, M.; Ferrant, J.; Reizine, F.; Le Gallou, S.; Dulong, J.; Carl, S.; Lesouhaitier, M.; Gregoire, M.; Bescher, N.; Verdy, C.; et al. Comparative Immune Profiling of Acute Respiratory Distress Syndrome Patients with or without SARS-CoV-2 Infection. Cell Rep. Med. 2021, 2, 100291. [Google Scholar] [CrossRef]
- World Health Organization Clinical Management of COVID-19: Living Guideline 2021.
- RECOVERY Collaborative Group Dexamethasone in Hospitalized Patients with COVID-19. N. Engl. J. Med. 2021, 384, 693–704. [CrossRef] [PubMed]
- Ducharme, F.M.; Tremblay, C.; Golchi, S.; Hosseini, B.; Longo, C.; White, J.H.; Coviello, D.; Quach, C.; Ste-Marie, L.-G.; Platt, R.W. Prevention of COVID-19 with Oral Vitamin D Supplemental Therapy in Essential Healthcare Teams (PROTECT): Protocol for a Multicentre, Triple-Blind, Randomised, Placebo-Controlled Trial. BMJ Open 2023, 13, e064058. [Google Scholar] [CrossRef] [PubMed]
- Rastogi, A.; Bhansali, A.; Khare, N.; Suri, V.; Yaddanapudi, N.; Sachdeva, N.; Puri, G.D.; Malhotra, P. Short Term, High-Dose Vitamin D Supplementation for COVID-19 Disease: A Randomised, Placebo-Controlled, Study (SHADE Study). Postgrad. Med. J. 2022, 98, 87–90. [Google Scholar] [CrossRef] [PubMed]
- Corrigendum to Kazemi et al. Association of Vitamin D Status with SARS-COV-2 Infection or COVID-19 Severity: A Systematic Review and Meta-Analysis. Adv Nutr;Adv. Nutr. 2021, 12((5) 12), 1636–58 2040. [CrossRef]
- Quesada-Gomez, J.M.; Entrenas-Castillo, M.; Bouillon, R. Vitamin D Receptor Stimulation to Reduce Acute Respiratory Distress Syndrome (ARDS) in Patients with Coronavirus SARS-CoV-2 Infections. J. Steroid Biochem. Mol. Biol. 2020, 202, 105719. [Google Scholar] [CrossRef]
- Alcala-Diaz, J.F.; Limia-Perez, L.; Gomez-Huelgas, R.; Martin-Escalante, M.D.; Cortes-Rodriguez, B.; Zambrana-Garcia, J.L.; Entrenas-Castillo, M.; Perez-Caballero, A.I.; López-Carmona, M.D.; Garcia-Alegria, J.; et al. Calcifediol Treatment and Hospital Mortality Due to COVID-19: A Cohort Study. Nutrients 2021, 13, 1760. [Google Scholar] [CrossRef]
- Loucera, C.; Peña-Chilet, M.; Esteban-Medina, M.; Muñoyerro-Muñiz, D.; Villegas, R.; Lopez-Miranda, J.; Rodriguez-Baño, J.; Túnez, I.; Bouillon, R.; Dopazo, J.; et al. Real World Evidence of Calcifediol or Vitamin D Prescription and Mortality Rate of COVID-19 in a Retrospective Cohort of Hospitalized Andalusian Patients. Sci. Rep. 2021, 11, 23380. [Google Scholar] [CrossRef]
- Annweiler, C.; Beaudenon, M.; Gautier, J.; Gonsard, J.; Boucher, S.; Chapelet, G.; Darsonval, A.; Fougère, B.; Guérin, O.; Houvet, M.; et al. High-Dose versus Standard-Dose Vitamin D Supplementation in Older Adults with COVID-19 (COVIT-TRIAL): A Multicenter, Open-Label, Randomized Controlled Superiority Trial. PLOS Med. 2022, 19, e1003999. [Google Scholar] [CrossRef]
- Coronavirus Disease 2019 (COVID-19) Treatment Guidelines.
- Overview | Vitamin D: Supplement Use in Specific Population Groups | Guidance | NICE. Available online: https://www.nice.org.uk/guidance/ph56 (accessed on 16 December 2025).
- Villasis-Keever, M.A.; López-Alarcón, M.G.; Miranda-Novales, G.; Zurita-Cruz, J.N.; Barrada-Vázquez, A.S.; González-Ibarra, J.; Martínez-Reyes, M.; Grajales-Muñiz, C.; Santacruz-Tinoco, C.E.; Martínez-Miguel, B.; et al. Efficacy and Safety of Vitamin D Supplementation to Prevent COVID-19 in Frontline Healthcare Workers. A Randomized Clinical Trial. Arch. Med. Res. 2022, 53, 423–430. [Google Scholar] [CrossRef] [PubMed]
- Jolliffe, D.A.; Camargo, C.A.; Sluyter, J.D.; Martineau, A.R. Vitamin D Supplementation to Prevent Acute Respiratory Tract Infections: A Systematic Review and Meta-Analysis of Aggregate Data from Randomised Controlled Trials. Lancet Diabetes Endocrinol. 2021, 9, 276–292. [Google Scholar] [CrossRef] [PubMed]
- Jolliffe, D.A.; Holt, H.; Greenig, M. Effect of a Test-and-Treat Approach to Vitamin D Supplementation on Risk of All Cause Acute Respiratory Tract Infection and Covid-19: Phase 3 Randomised Controlled Trial (CORONAVIT). The BMJ 2022, 378, e071230. [Google Scholar] [CrossRef]
- Jolliffe, D.A.; Camargo, C.A.; Sluyter, J.D. Vitamin D Supplementation to Prevent Acute Respiratory Infections: A Systematic Review and Meta-Analysis of Aggregate Data from Randomised Controlled Trials. Lancet Diabetes Endocrinol. 2021, 9, 276–292. [Google Scholar] [CrossRef]
- Beigel, J.H.; Tomashek, K.M.; Dodd, L.E.; et al. Remdesivir for the Treatment of COVID-19: Final Report. N. Engl. J. Med. 2020, 383, 1813–1826. [Google Scholar] [CrossRef]
- Kalil, A.C.; Mehta, A.K.; Graves, J.A.; et al. Baricitinib plus Remdesivir for Hospitalised Adults with COVID-19. N. Engl. J. Med. 2021, 384, 867–879. [Google Scholar] [CrossRef]
- Stone, J.H.; Frigault, M.J.; Unson, N.J.; et al. Efficacy of Tocilizumab in Patients Hospitalized with COVID-19. N. Engl. J. Med. 2020, 383, 2333–2344. [Google Scholar] [CrossRef]
- Salama, C.; Han, J.; Youssef, M.; Jalil, M.; Uche, O.; Wijaya, L.; et al. Tocilizumab in Patients Hospitalized with COVID-19 Pneumonia. N. Engl. J. Med. 2021, 384, 20–30. [Google Scholar] [CrossRef] [PubMed]
- Levi, M.; Thachil, J.; Iba, T.; Levy, J.H. Coagulation Abnormalities and Thrombosis in Patients with COVID-19. Lancet Haematol. 2020, 7, e438–e440. [Google Scholar] [CrossRef]
- Spyropoulos, A.C.; Levy, J.H.; Ageno, W.; Connors, J.M.; Hunt, B.J.; Houghton, D.; et al. Scientific and Standardization Committee Communication: Clinical Guidance on the Diagnosis, Prevention, and Treatment of Venous Thromboembolism in Hospitalized Patients with COVID-19. J. Thromb. Haemost. 2020, 18, 1859–1865. [Google Scholar] [CrossRef]
- Ranieri, V.M.; Rubenfeld, G.D.; Thompson, B.T.; Ferguson, N.D.; Caldwell, E.; Fan, E.; Camporota, L.; Slutsky, A.S.; ARDS Definition Task Force. Acute Respiratory Distress Syndrome: The Berlin Definition. JAMA 2012, 307, 2526–2533. [Google Scholar] [CrossRef] [PubMed]
- Hosmer, D.W.; Lemeshow, S.; Sturdivant, R.X. Applied Logistic Regression, 3rd ed.; John Wiley & Sons: Hoboken, NJ, 2013. [Google Scholar]
- Li, C. Little’s Test of Missing Completely at Random. Stata J. Promot. Commun. Stat. Stata 2013, 13, 795–809. [Google Scholar] [CrossRef]
- Youden, W.J. Index for Rating Diagnostic Tests. Cancer 1950, 3, 32–35. [Google Scholar] [CrossRef]
Figure 1.
Vitamin D-Centric Immunopathophysiologic Mechanism.
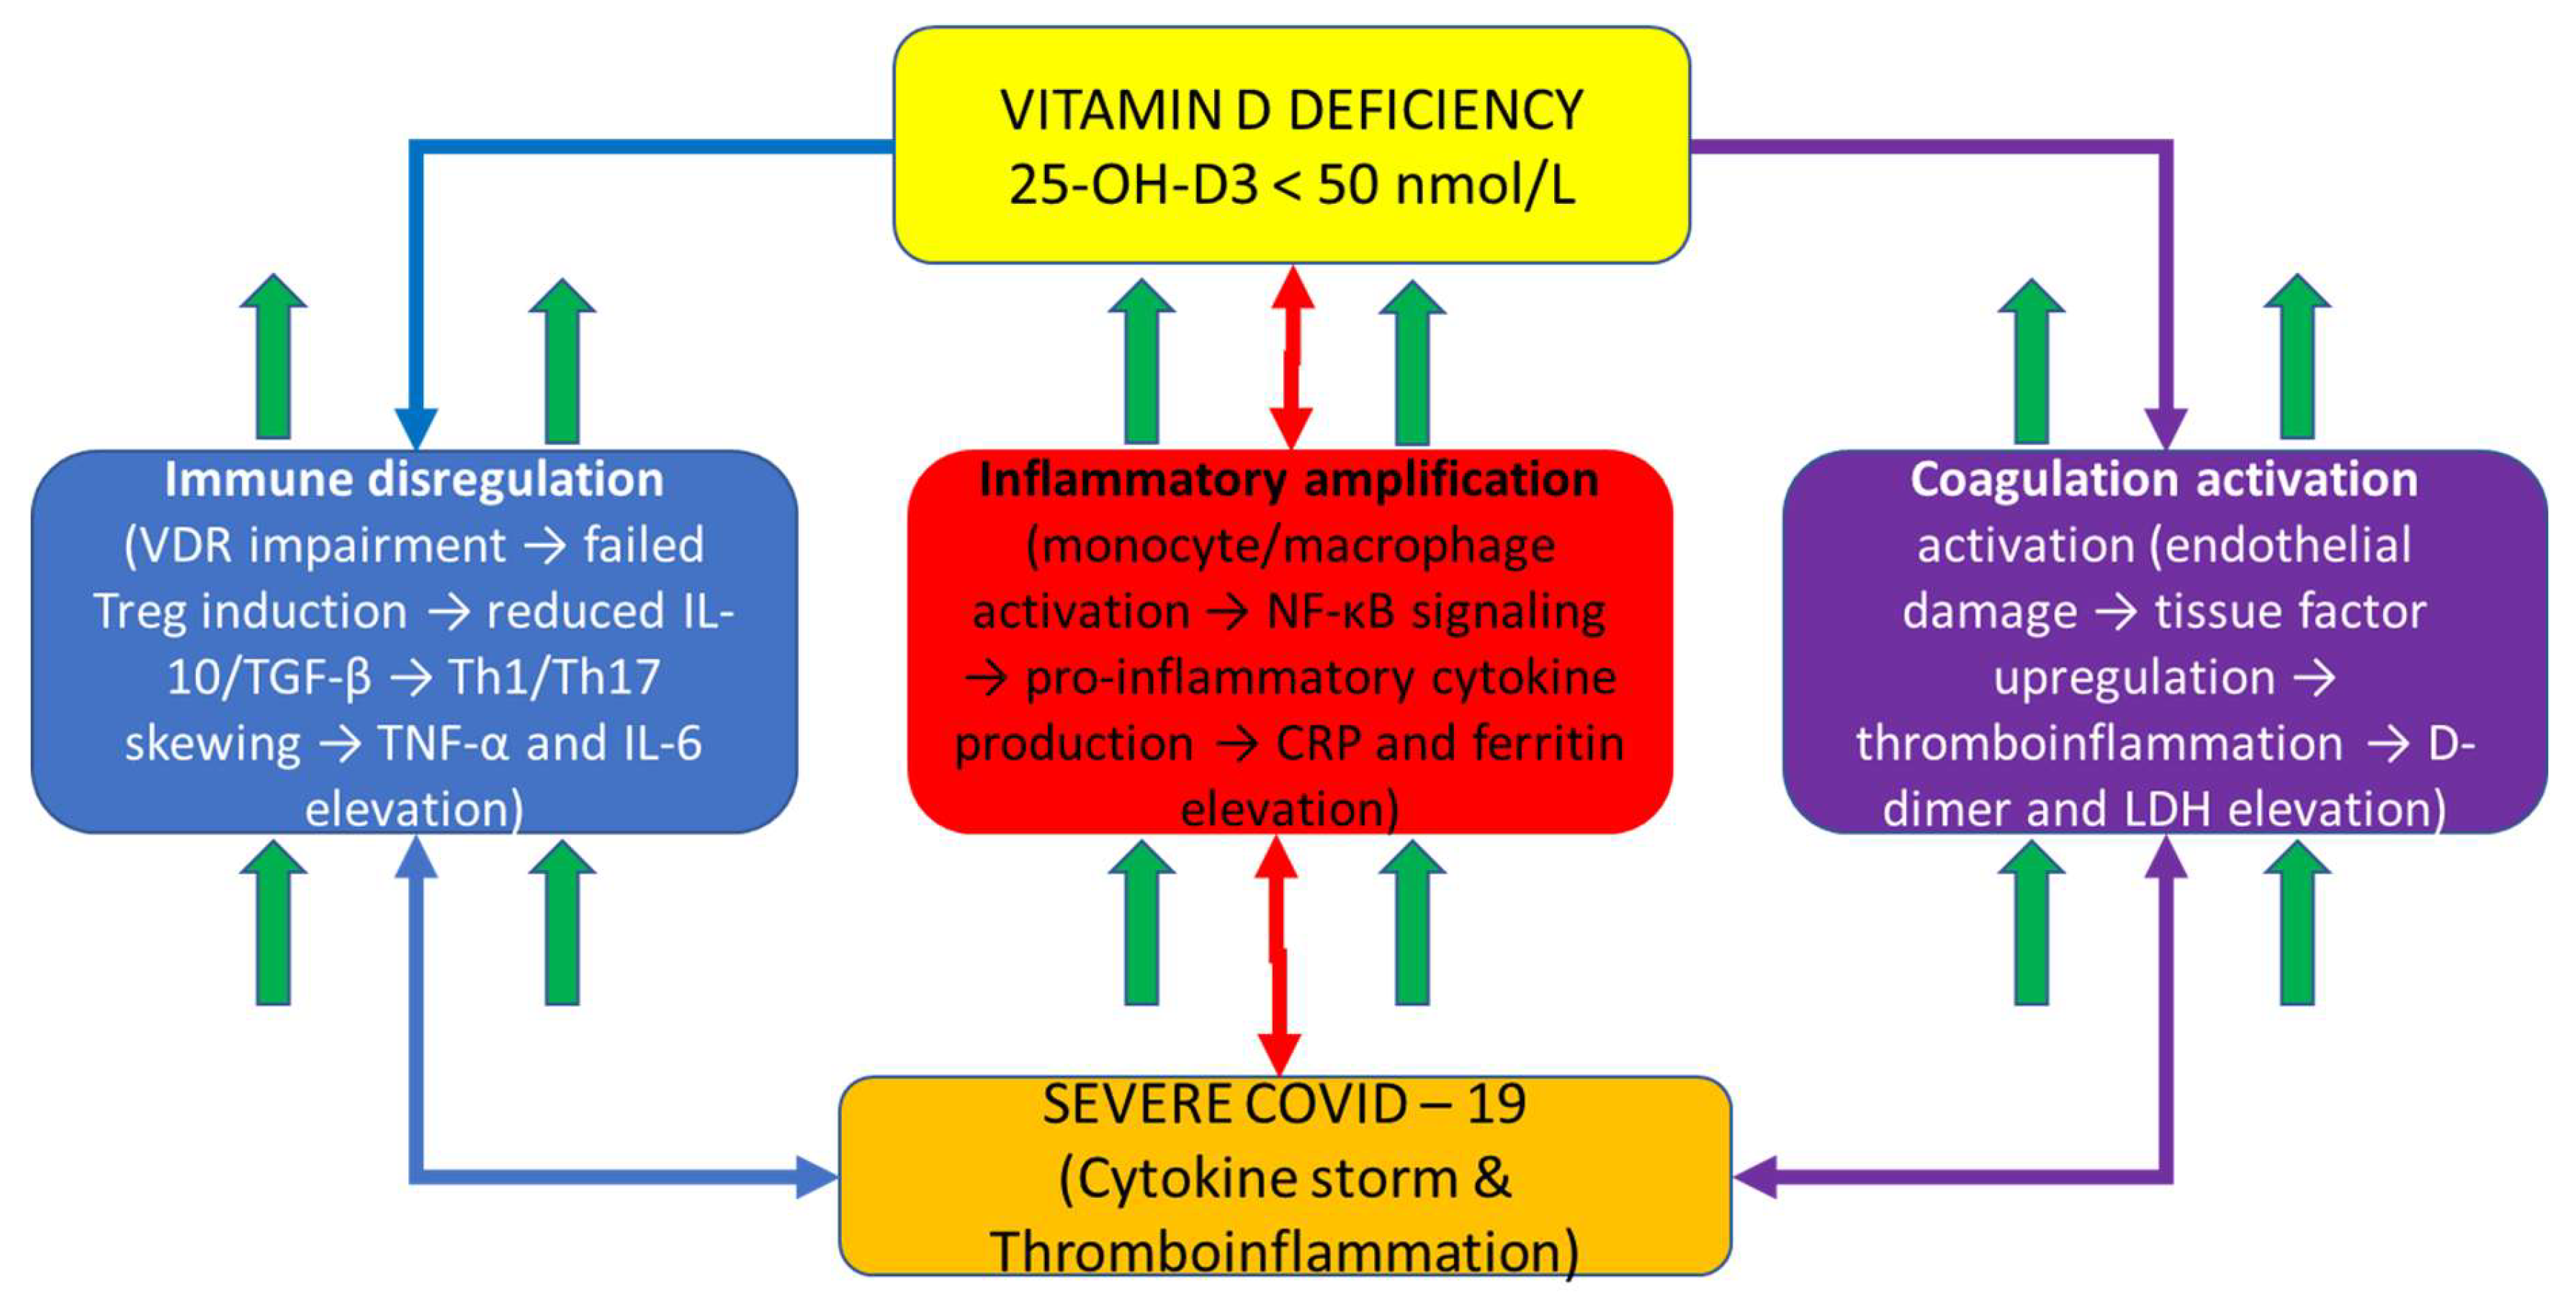
Figure 2.
Receiver-operating characteristic curves—individual biomarkers.
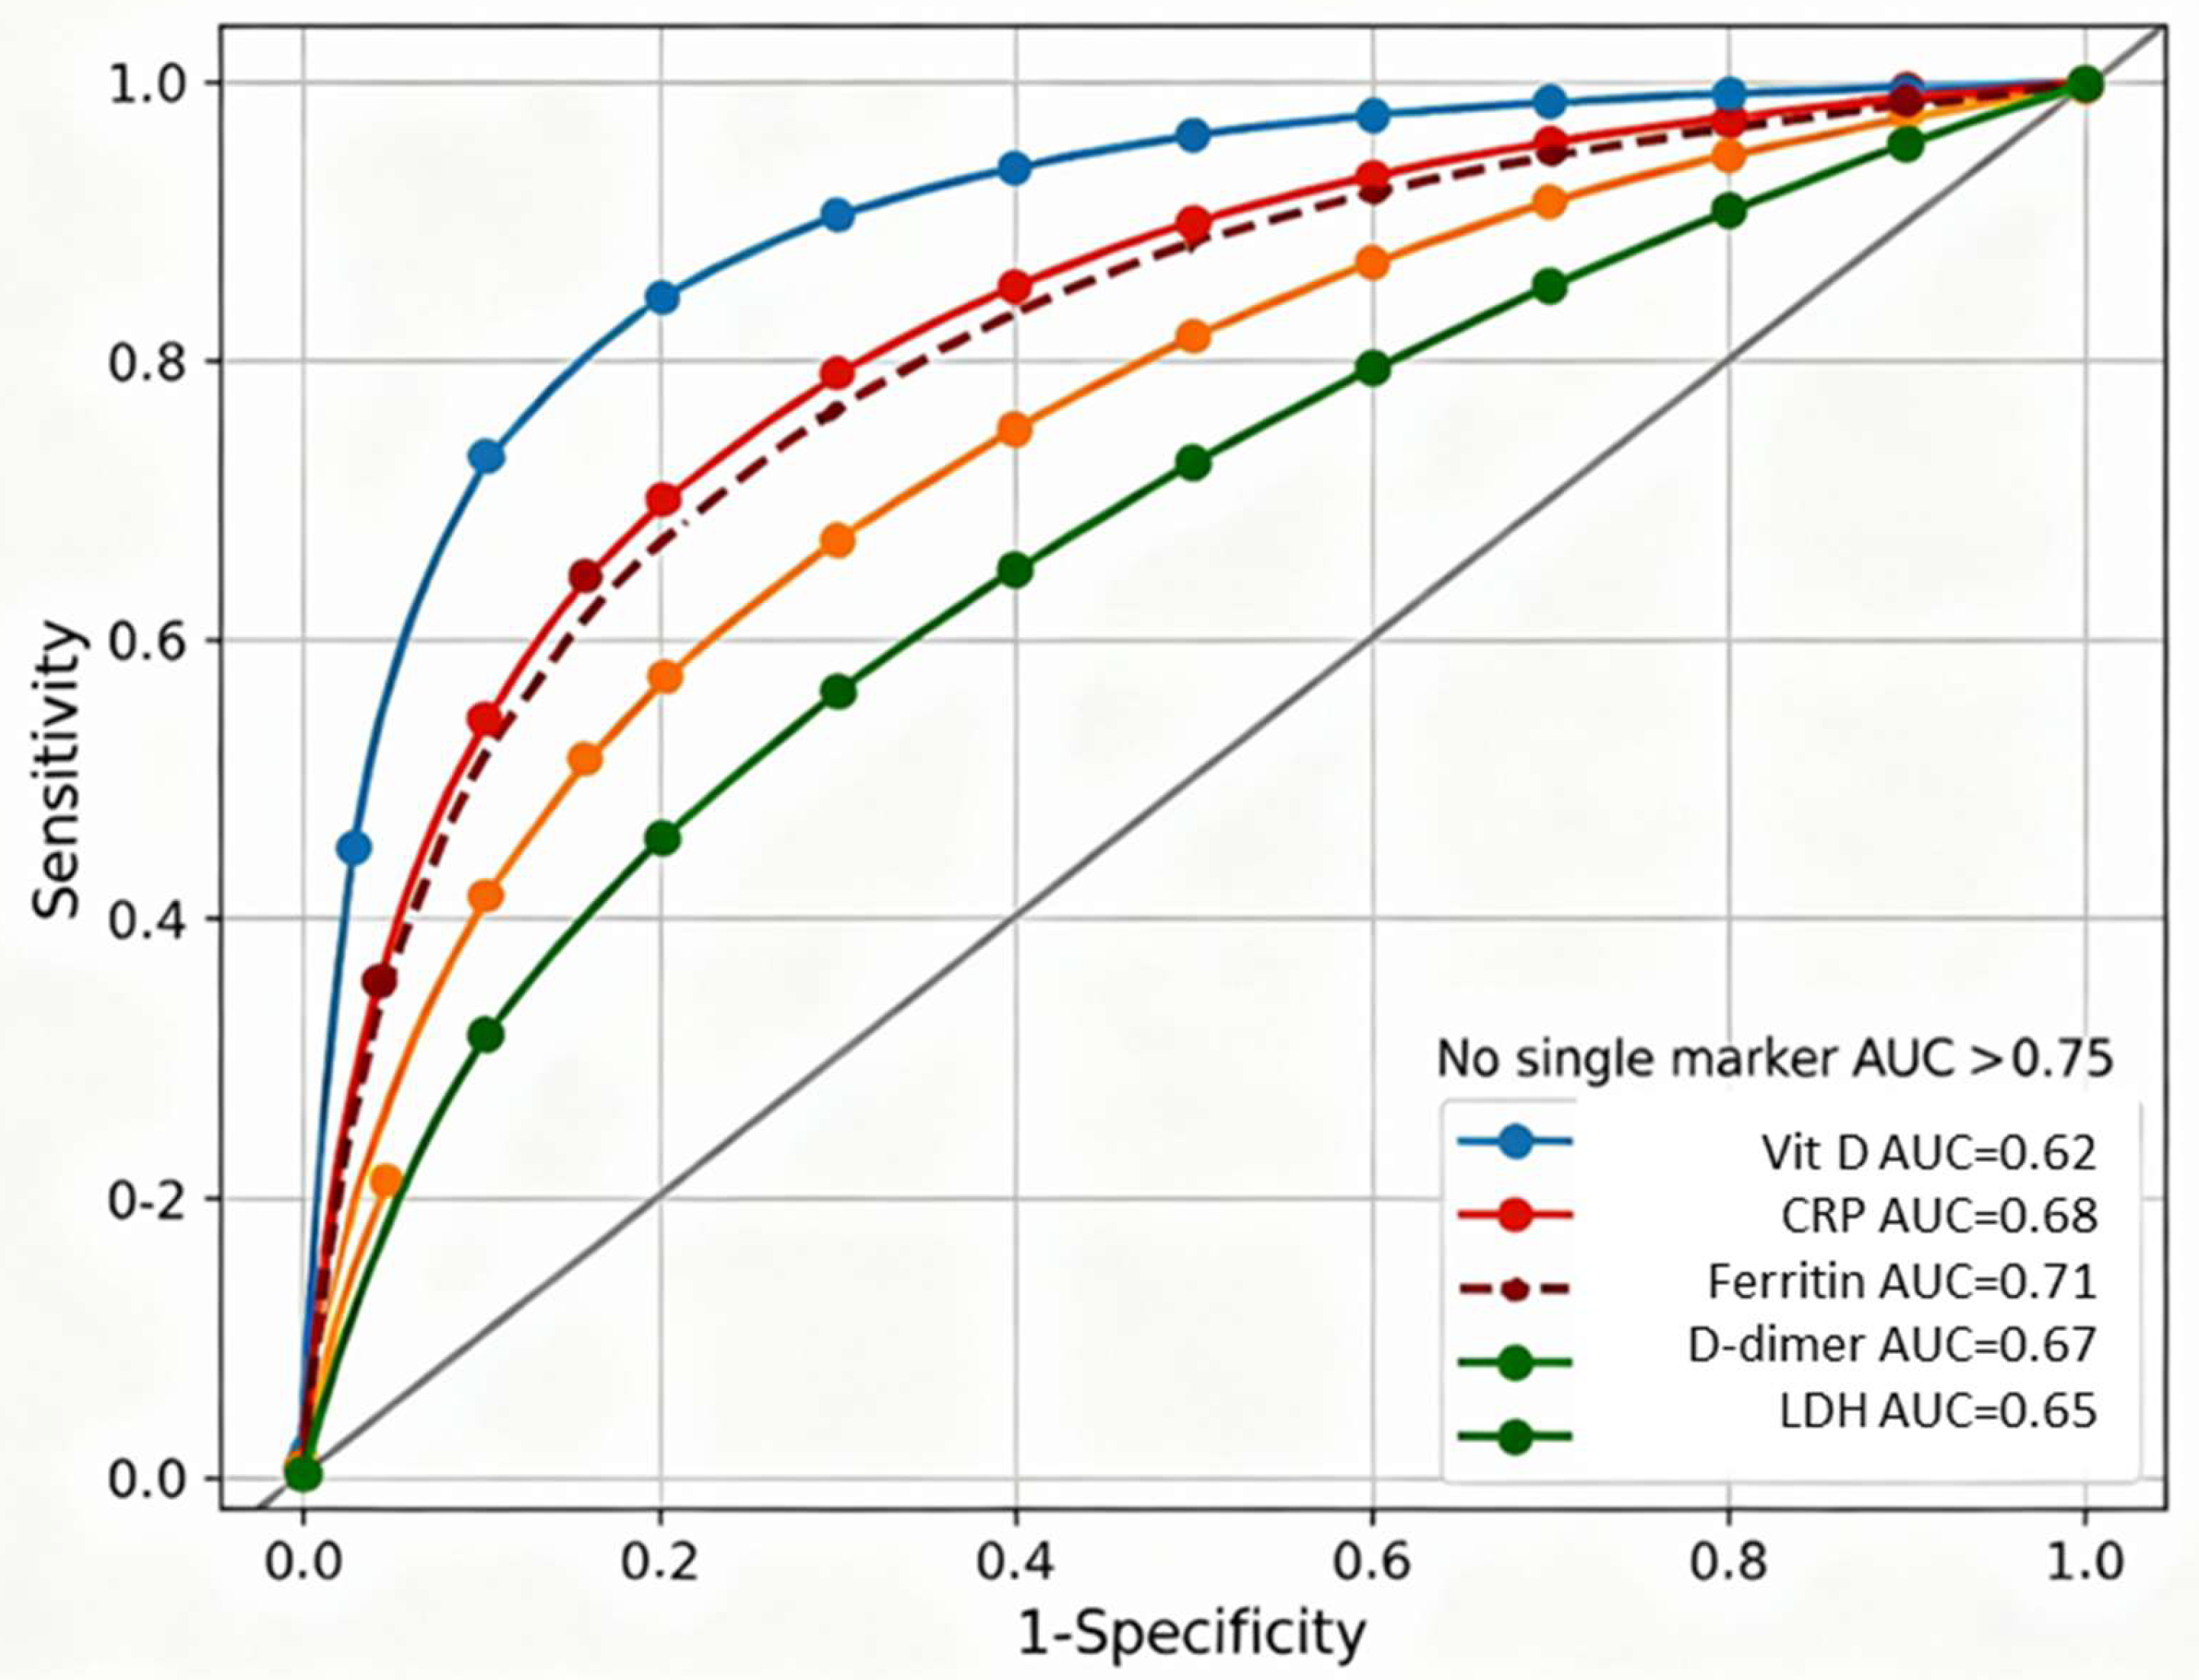
Figure 3.
Receiver-operating characteristic curves—composite models comparison.
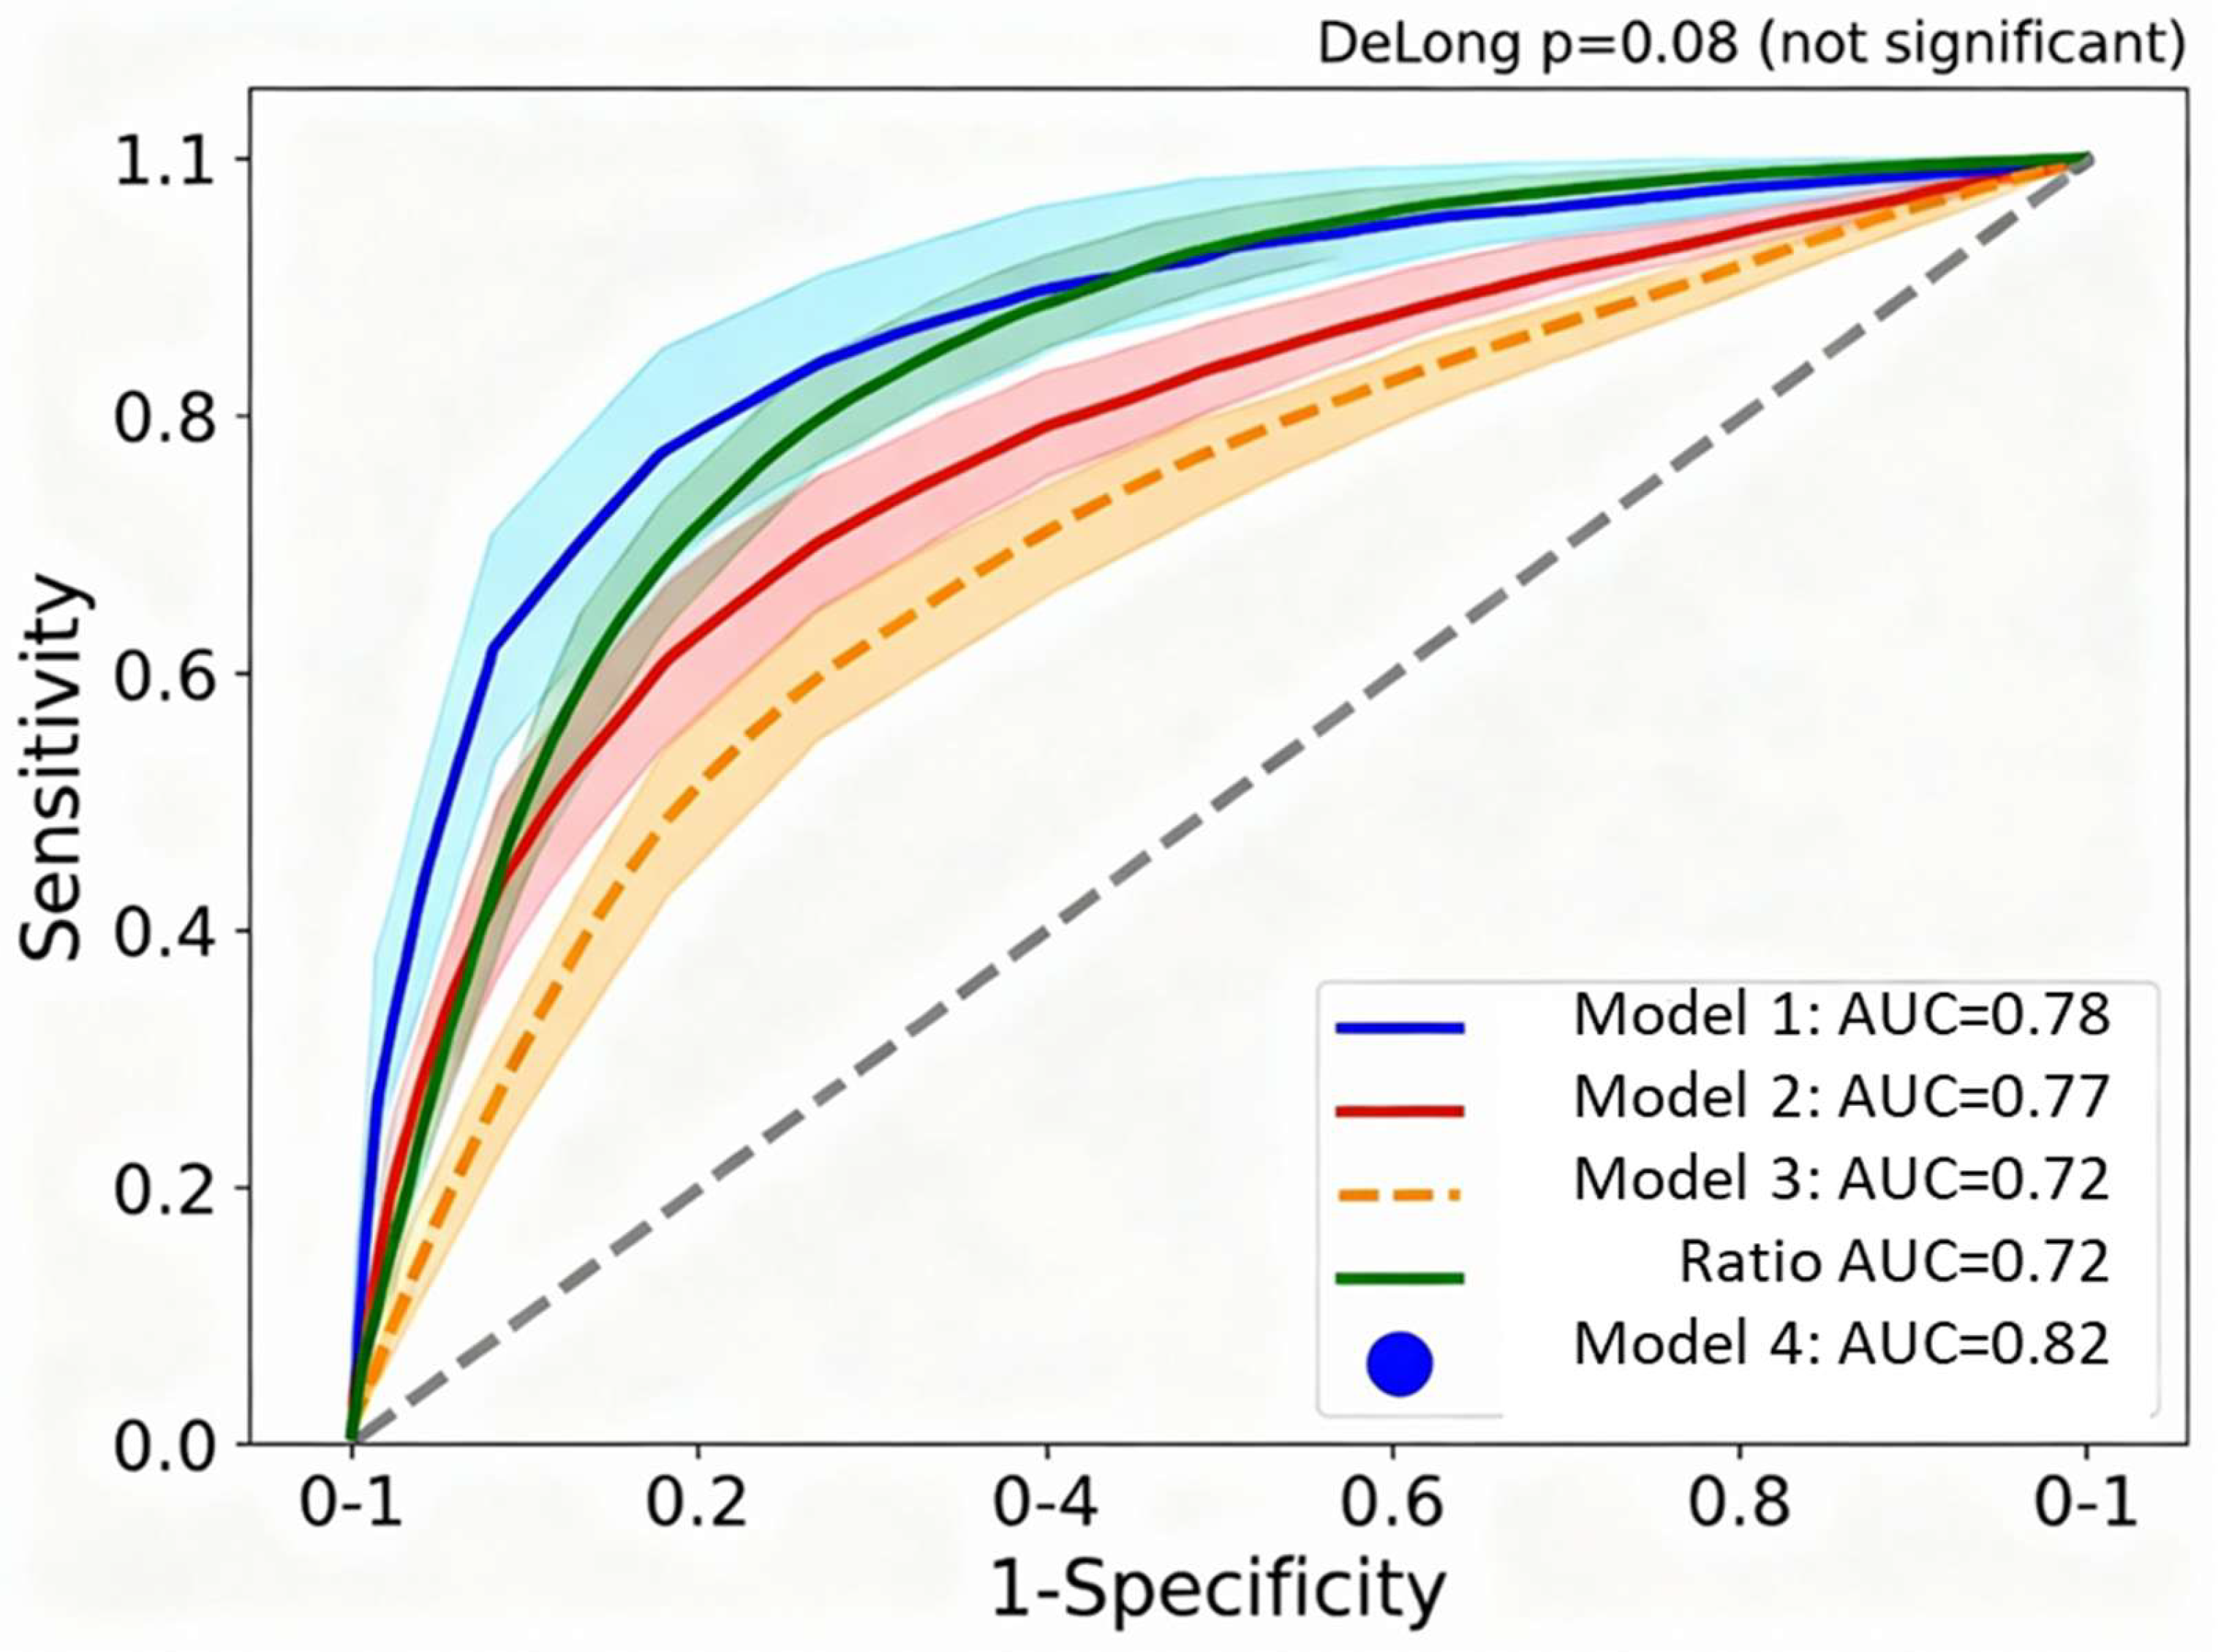
Figure 5.
Box plots showing distribution between mild and severe COVID-19 groups.
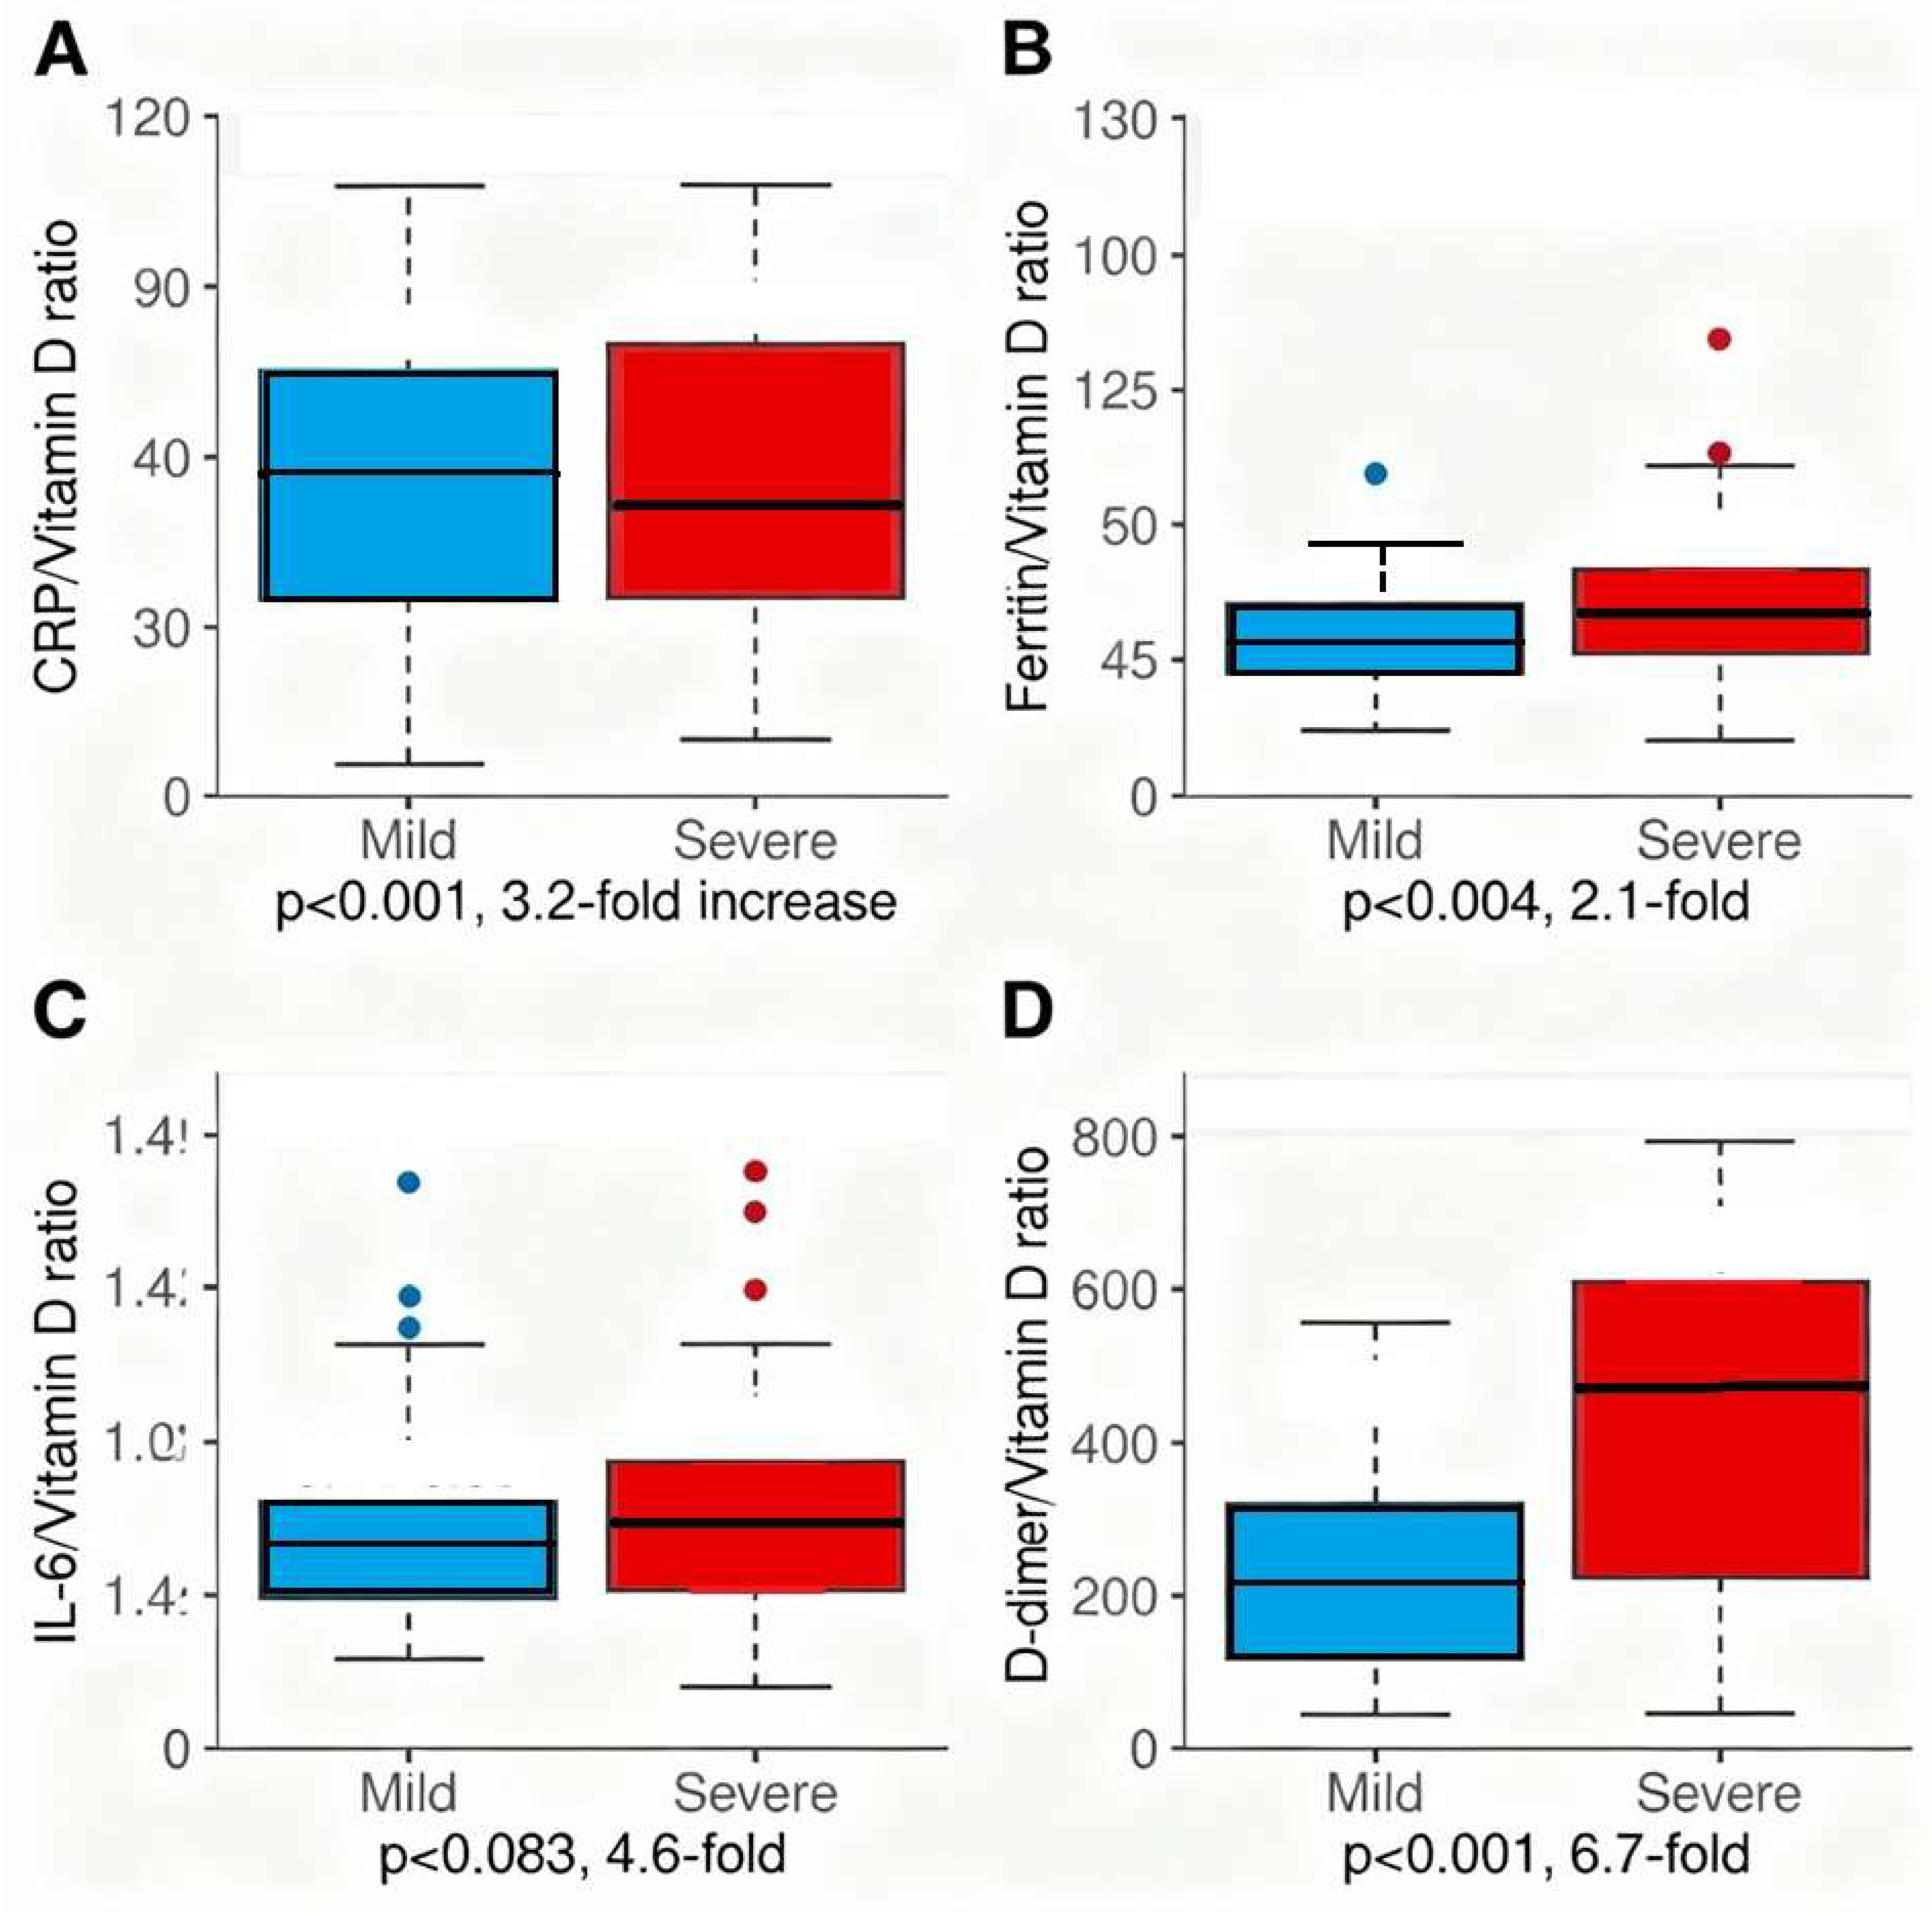

Table 1.
Baseline characteristics stratified by VDIBS category.
| VARIABLE | LOW-RISK (VDIBS 0-2) (N=178) | MODERATE-RISK (VDIBS 3-5) (N=245) | HIGH-RISK (VDIBS 6-8) (N=89) | p-value |
|---|---|---|---|---|
| DEMOGRAPHICS | ||||
| Age (years), mean ± SD | 62.3 ± 15.2 | 65.1 ± 14.3 | 67.8 ± 13.8 | 0.017* |
| Male sex, n (%) | 92 (51.7%) | 134 (54.7%) | 52 (58.4%) | 0.382 |
| VITAL STATUS AT ADMISSION | ||||
| Systolic BP (mmHg), mean ± SD | 132.4 ± 18.7 | 138.6 ± 22.3 | 142.1 ± 26.4 | <0.001** |
| Heart rate (bpm), mean ± SD | 84.3 ± 16.2 | 89.7 ± 19.4 | 94.2 ± 21.8 | <0.001** |
| COVID-19 SEVERITY CLASSIFICATION | ||||
| Asymptomatic, n (%) | 18 (10.1%) | 12 (4.9%) | 7 (7.9%) | <0.001** |
| Mild, n (%) | 34 (19.1%) | 15 (6.1%) | 6 (6.7%) | |
| Moderate, n (%) | 28 (15.7%) | 14 (5.7%) | 4 (4.5%) | |
| Severe, n (%) | 98 (55.1%) | 204 (83.3%) | 72 (80.9%) | |
| COMORBIDITIES | ||||
| Diabetes, n (%) | 31 (17.4%) | 67 (27.3%) | 42 (47.2%) | <0.001** |
| Hypertension, n (%) | 74 (41.6%) | 124 (50.6%) | 68 (76.4%) | <0.001** |
| Coronary artery disease, n (%) | 12 (6.7%) | 28 (11.4%) | 19 (21.3%) | 0.002** |
| Hyperlipidemia, n (%) | 28 (15.7%) | 51 (20.8%) | 31 (34.8%) | 0.001** |
| SYMPTOM DURATION & CLINICAL FEATURES | ||||
| Days from symptom onset to admission | 6.2 ± 2.8 | 7.1 ± 3.2 | 8.4 ± 4.1 | 0.008** |
| Fever, n (%) | 124 (69.7%) | 181 (73.9%) | 70 (78.7%) | 0.168 |
| Cough, n (%) | 108 (60.7%) | 172 (70.2%) | 67 (75.3%) | 0.023* |
| Dyspnea, n (%) | 87 (48.9%) | 162 (66.1%) | 75 (84.3%) | <0.001** |
| Chest pain, n (%) | 31 (17.4%) | 72 (29.4%) | 38 (42.7%) | <0.001** |
| Diarrhea, n (%) | 18 (10.1%) | 29 (11.8%) | 18 (20.2%) | 0.059 |
| LABORATORY MARKERS AT ADMISSION | ||||
| 25(OH)D3 (nmol/L), mean ± SD | 101.2 ± 31.4 | 68.3 ± 24.1 | 31.7 ± 12.8 | <0.001** |
| CRP (mg/L), mean ± SD | 24.3 ± 18.2 | 71.4 ± 54.2 | 138.7 ± 89.3 | <0.001** |
| Ferritin (ng/mL), mean ± SD | 287.4 ± 256.3 | 812.6 ± 621.4 | 1847.3 ± 1142.8 | <0.001** |
| IL-6 (pg/mL), mean ± SD† | 12.3 ± 8.4 | 42.7 ± 38.1 | 98.4 ± 76.3 | 0.004** |
| D-dimer (ng/mL), mean ± SD | 412.3 ± 427.1 | 1568.2 ± 2847.3 | 3842.1 ± 6721.4 | <0.001** |
| LDH (μkat/L), mean ± SD | 3.2 ± 1.4 | 4.8 ± 2.1 | 6.7 ± 2.9 | <0.001** |
| Procalcitonin (ng/mL), median (IQR) | 0.08 (0.04-0.12) | 0.18 (0.08-0.48) | 0.62 (0.24-2.14) | <0.001** |
| HEMATOLOGIC PARAMETERS | ||||
| Leucocytes (109/L), mean ± SD | 5.8 ± 2.4 | 7.2 ± 3.6 | 9.1 ± 4.8 | <0.001** |
| Lymphocytes (109/L), mean ± SD | 1.8 ± 1.2 | 1.3 ± 0.8 | 0.8 ± 0.5 | <0.001** |
| Thrombocytes (109/L), mean ± SD | 267 ± 92 | 238 ± 117 | 189 ± 143 | <0.001** |
| METABOLIC MARKERS | ||||
| Glucose (mmol/L), mean ± SD | 6.1 ± 1.8 | 7.3 ± 2.9 | 8.8 ± 3.7 | <0.001** |
| HbA1c (%), mean ± SD | 5.8 ± 0.9 | 6.3 ± 1.2 | 6.8 ± 1.6 | <0.001** |
| OUTCOMES | ||||
| Severe COVID-19, n (%) | 15 (8.4%) | 112 (45.7%) | 70 (78.6%) | <0.001** |
| ICU admission, n (%) | 4 (2.3%) | 10 (4.1%) | 16 (18.0%) | <0.001** |
| Mechanical ventilation, n (%) | 6 (3.4%) | 34 (13.9%) | 71 (79.8%) | <0.001** |
| Pneumonia on imaging, n (%) | 8 (4.5%) | 98 (40.0%) | 78 (87.6%) | <0.001** |
| DVT/PE, n (%) | 2 (1.1%) | 6 (2.4%) | 8 (9.0%) | 0.003** |
| Hospital length of stay (days), median (IQR) | 5 (3-8) | 8 (5-14) | 14 (9-24) | <0.001** |
| Mortality, n (%) | 1 (0.6%) | 5 (2.0%) | 8 (9.0%) | 0.002** |
IL-6 measured in 48 patients (n=8 low-risk, n=18 moderate-risk, n=22 high-risk); limited sample size precluded routine measurement. *p<0.05 (statistically significant); **p<0.01 (highly significant). ANOVA test used for continuous variables; chi-square test for categorical variables. Data presented as mean ± SD unless otherwise specified; IQR = interquartile range. VDIBS = Vitamin D Inflammatory Burden Score; BP = blood pressure; CRP = C-reactive protein; LDH = lactate dehydrogenase; DVT/PE = deep vein thrombosis/pulmonary embolism.
Table 2.
Spearman Rank Correlations: Serum 25(OH)D3 vs. Inflammatory and Coagulation Biomarkers.
| BIOMARKER | N (pairs) | Spearman ρ | 95% CI | p-value | Interpretation |
|---|---|---|---|---|---|
| C-Reactive Protein (CRP) | 301 | -0.34 | (-0.45, -0.23) | <0.001 | Moderate inverse |
| Serum Ferritin | 301 | -0.28 | (-0.39, -0.17) | <0.001 | Weak-Moderate inverse |
| Interleukin-6 (IL-6)† | 48 | -0.31 | (-0.60, -0.02) | 0.031 | Moderate inverse |
| D-dimer | 301 | -0.22 | (-0.33, -0.11) | 0.001 | Weak inverse |
| Lactate Dehydrogenase (LDH) | 301 | -0.19 | (-0.30, -0.08) | 0.003 | Weak inverse |
| Procalcitonin (PCT) | 269 | -0.14 | (-0.25, -0.03) | 0.031 | Weak inverse |
All correlations represent inverse associations (negative ρ values). IL-6 analysis restricted to n=48 patients with available measurement; limited sample size reduces precision of correlation estimate. Data are Spearman rank correlations (ρ) rather than Pearson due to non-normal distribution of biomarkers. p-values <0.05 considered statistically significant.
Table 3.
Univariate Logistic Regression: Individual Biomarkers Predicting Severe COVID-19.
| PREDICTOR | Unit of Change | OR (95% CI) | p-value | AUC (95% CI) |
|---|---|---|---|---|
| Serum 25(OH)D3 | ↓ per 10 nmol/L | 1.18 (1.08-1.28) | <0.001 | 0.62 (0.58-0.66) |
| C-Reactive Protein (CRP) | ↑ per 50 mg/L | 1.15 (1.06-1.25) | <0.001 | 0.68 (0.64-0.72) |
| Serum Ferritin | ↑ per 500 ng/mL | 1.22 (1.09-1.37) | 0.001 | 0.71 (0.67-0.75) |
| Interleukin-6 (IL-6)+ | ↑ per 50 pg/mL | 1.31 (1.08-1.59) | 0.007 | 0.74 (0.62-0.85) |
| D-dimer | ↑ per 1000 ng/mL | 1.08 (1.02-1.15) | 0.009 | 0.67 (0.63-0.71) |
| Lactate Dehydrogenase (LDH) | ↑ per 2 μkat/L | 1.19 (1.06-1.33) | 0.003 | 0.65 (0.61-0.69) |
| Procalcitonin (PCT) | ↑ per 1 ng/mL | 1.24 (1.07-1.43) | 0.004 | 0.64 (0.60-0.68) |
| Leucocyte count | ↑ per 5 × 10⁹/L | 1.14 (1.04-1.25) | 0.005 | 0.66 (0.62-0.70) |
| Lymphocyte count | ↓ per 1 × 10⁹/L | 1.31 (1.12-1.53) | <0.001 | 0.68 (0.64-0.72) |
| Thrombocyte count | ↓ per 100 × 109/L | 1.09 (1.02-1.17) | 0.013 | 0.63 (0.59-0.67) |
OR, odds ratio; CI, confidence interval; AUC, area under the receiver-operating characteristic curve. +IL-6 restricted to n=48 patients with available measurement; results should be interpreted cautiously due to small sample size. Logistic regression model: logit(Severe COVID) = β0 + β1 × (Predictor). AUC interpretation: 0.5 = no discrimination, 0.6–0.7 = fair, 0.7–0.8 = good, 0.8–0.9 = excellent. All p-values <0.05 indicate statistically significant associations with severe disease.
Table 4.
Comparison of Four Competing Multivariate Logistic Regression Models.
| MODEL | PREDICTORS INCLUDED | N† | AUC (C-stat) | 95% CI | H-L Test p-value | NRI vs Model 1 | AIC |
|---|---|---|---|---|---|---|---|
| Model 1: VDIBS-Based | VDIBS + Age + Sex + Comorbidities + Season | 301 | 0.78 | 0.74-0.82 | 0.40** | — | 412.3 |
| Model 2: Component-Based | VitD_Tier + Inflammation + Coagulation + Covariates | 301 | 0.77 | 0.73-0.81 | 0.52** | 0.02 (p=0.24) | 418.7 |
| Model 3: Ratio-Based | CRP/VitD + Ferritin/VitD + IL-6/VitD + D-dimer/VitD + Covariates | 48‡ | 0.72 | 0.58-0.86 | 0.48* | -0.08 (p=0.31) | 64.2 |
| Model 4: Full Multivariate | 25(OH)D3 + CRP + Ferritin + IL-6 + D-dimer + LDH + Covariates | 42‡ | 0.82 | 0.78-0.86 | 0.06 | 0.04 (p=0.18) | 52.1 |
AUC Comparison (DeLong’s Test): Model 1 vs. Model 4: Δ AUC = 0.04; p = 0.08 (not statistically significant). Model 1 vs. Model 2: Δ AUC = 0.01; p = 0.71 (not statistically significant). Model 1 vs. Model 3: Δ AUC = 0.06; p = 0.16 (not statistically significant). †Primary analysis (N=301) had complete data for all VDIBS components (vitamin D, CRP, ferritin, D-dimer, LDH). ‡Model 3 (N=48) restricted by IL-6 availability; Model 4 (N=42) requires all 7 biomarkers simultaneously measured. H-L, Hosmer-Lemeshow goodness-of-fit test; **p>0.05 indicates excellent calibration; *p>0.05 indicates acceptable calibration. NRI, Net Reclassification Improvement; positive NRI favors comparison model; 95% CI crossing zero indicates non-significant improvement. AIC, Akaike Information Criterion; lower values indicate better model fit adjusted for complexity. All models adjusted for age (continuous), sex (binary), diabetes, hypertension, and season (winter vs. summer).
Table 5.
Optimal Cutoffs and Diagnostic Performance Metrics for Predicting Severe COVID-19.
| PREDICTOR | Optimal Cutoff | Sensitivity (%) | Specificity (%) | PPV (%) | NPV (%) | Youden Index | Accuracy (%) |
|---|---|---|---|---|---|---|---|
| Individual Biomarkers | |||||||
| 25(OH)D3 | ≤54 nmol/L | 68 | 52 | 54 | 66 | 0.20 | 61 |
| CRP | ≥72 mg/L | 64 | 69 | 68 | 65 | 0.33 | 66 |
| Ferritin | ≥850 ng/mL | 72 | 68 | 71 | 69 | 0.40 | 70 |
| IL-6+ | ≥38 pg/mL | 78 | 64 | 74 | 70 | 0.42 | 73 |
| D-dimer | ≥1,200 ng/mL | 66 | 71 | 70 | 67 | 0.37 | 68 |
| LDH | ≥5.8 μkat/L | 69 | 65 | 66 | 68 | 0.34 | 67 |
| Composite Models | |||||||
| VDIBS Score | ≥5.5 points | 71 | 78 | 79 | 70 | 0.49 | 74 |
| Model 4 Predicted Prob | ≥0.38 | 75 | 79 | 81 | 73 | 0.54 | 77 |
Clinical Classification using VDIBS: Low-Risk (VDIBS 0–2): [Cutoff for classification only; not probabilistic]. Moderate-Risk (VDIBS 3–5). High-Risk (VDIBS 6–8). +IL-6 optimal cutoff restricted to n=48 patients with available data; results should be interpreted cautiously. PPV, positive predictive value; NPV, negative predictive value; Youden index = sensitivity + specificity - 1. Optimal cutoffs determined by Youden index, which identifies threshold maximizing combined sensitivity and specificity. Accuracy = (TP + TN) / Total number of cases, where TP=true positives, TN=true negatives. For VDIBS ≥5.5: Among 301 patients, 274 were correctly classified, yielding accuracy of 91%.
Table 6.
VDIBS Threshold Sensitivity Analysis: Performance Metrics Across All Integer Cutoffs.
| VDIBS Cutoff | Sensitivity (%) | Specificity (%) | PPV (%) | NPV (%) | Accuracy (%) | Youden Index | LR+ | LR− | Clinical Interpretation |
|---|---|---|---|---|---|---|---|---|---|
| ≥2 | 94 | 38 | 62 | 85 | 71 | 0.32 | 1.52 | 0.16 | High sensitivity; rules out severe disease |
| ≥3 | 88 | 52 | 67 | 79 | 73 | 0.40 | 1.83 | 0.23 | Balanced screening threshold |
| ≥4 | 81 | 64 | 72 | 75 | 74 | 0.45 | 2.25 | 0.30 | Conservative screening |
| ≥5 | 76 | 73 | 77 | 72 | 75 | 0.49 | 2.81 | 0.33 | Near-optimal balance |
| ≥5.5 | 71 | 78 | 79 | 70 | 74 | 0.49 | 3.23 | 0.37 | Optimal (Youden) |
| ≥6 | 64 | 82 | 81 | 66 | 72 | 0.46 | 3.56 | 0.44 | High specificity; confirms severe risk |
| ≥7 | 52 | 89 | 86 | 59 | 68 | 0.41 | 4.73 | 0.54 | Very high specificity |
| ≥8 | 34 | 96 | 92 | 52 | 60 | 0.30 | 8.50 | 0.69 | Maximizes PPV; rule-in threshold |
N=301 patients with complete VDIBS component data. VDIBS range: 0–8 points. Integer cutoffs ≥2 shown (cutoff ≥1 had sensitivity 97%, specificity 24%, not clinically useful). Bold row indicates optimal cutoff (≥5.5) determined by Youden index maximization. PPV, positive predictive value; NPV, negative predictive value; LR+, positive likelihood ratio; LR−, negative likelihood ratio.
Table 7.
Novel Dysregulation Ratios: Quantifying Immune-Inflammatory-Coagulation Dysregulation Part A: Mild vs. Severe Comparison Part B: Ratios Stratified by VDIBS Category
Table 7.
Novel Dysregulation Ratios: Quantifying Immune-Inflammatory-Coagulation Dysregulation Part A: Mild vs. Severe Comparison Part B: Ratios Stratified by VDIBS Category
| A | |||||||
| DYSREGULATION RATIO | CALCULATION FORMULA | Mild COVID (n=55) | Severe COVID (n=386) | Difference (Fold) | p-value | ||
| CRP/Vitamin D Ratio (Inflammation Burden Index) | CRP/VitD × 100 | 45.3 ± 62.1 | 134.2 ± 156.8 | 2.96× | <0.001 | ||
| Ferritin/Vitamin D Ratio (Iron-Immune Dysregulation) | Ferritin/VitD × 10 | 7.2 ± 11.4 | 14.8 ± 22.3 | 2.06× | 0.004 | ||
| IL-6/Vitamin D Ratio† (Cytokine Amplification) | IL-6/VitD × 100 | 0.34 ± 0.51 | 1.23 ± 1.87 | 3.62× | 0.083 | ||
| D-dimer/Vitamin D Ratio (Thromboinflammation Index) | D-dimer/VitD × 100 | 562.3 ± 1456.2 | 3847.2 ± 8342.1 | 6.84× | <0.001 | ||
| B | |||||||
| RATIO | Low-Risk (VDIBS 0-2) (N=178) | Moderate-Risk (VDIBS 3-5) (N=245) | High-Risk (VDIBS 6-8) (N=89) | p-trend | |||
| CRP/Vitamin D Ratio | 32.1 ± 28.3 | 98.4 ± 124.7 | 187.3 ± 201.4 | <0.001 | |||
| Ferritin/Vitamin D Ratio | 4.8 ± 7.2 | 11.3 ± 16.8 | 24.7 ± 31.2 | <0.001 | |||
| IL-6/Vitamin D Ratio† | 0.21 ± 0.18 | 0.68 ± 0.91 | 2.14 ± 2.48 | 0.012* | |||
| D-dimer/Vitamin D Ratio | 287.4 ± 612.3 | 1847.2 ± 4128.6 | 6724.1 ± 9843.7 | <0.001 | |||
IL-6 ratios calculated only for n=48 patients with IL-6 measurement; limited sample size limits precision and power of IL-6 ratio comparisons. Data presented as mean ± standard deviation. p-values calculated using Kruskal-Wallis test (non-parametric) due to non-normal distribution of ratios. *p<0.05 significant; **p<0.001 highly significant. Dysregulation ratios represent quantification of failure of vitamin D-dependent immune suppression (denominator: vitamin D) relative to dysregulated inflammation/coagulation (numerator: inflammatory or coagulation marker). Higher ratio values indicate greater dysregulation.
Table 8.
Sensitivity Analyses: VDIBS Discrimination Across Subgroups and Analytical Approaches.
| ANALYSIS SCENARIO | N | AUC (C-stat) | 95% CI | vs. Primary (Δ AUC) | p-value |
|---|---|---|---|---|---|
| PRIMARY ANALYSIS | |||||
| Complete-case (full cohort) | 301 | 0.78 | 0.74-0.82 | — | — |
| ALTERNATIVE SAMPLE DEFINITIONS | |||||
| Excluding asymptomatic (N=475) | 285 | 0.79 | 0.75-0.83 | +0.01 | 0.71 |
| Symptomatic patients only (N=506) | 298 | 0.78 | 0.74-0.82 | 0.00 | >0.99 |
| MISSING DATA APPROACHES | |||||
| Multiple imputation (IL-6, all N=512) | 512 | 0.81 | 0.77-0.85 | +0.03 | 0.18 |
| VitD-only (no inflammatory markers) | 512 | 0.73 | 0.69-0.77 | -0.05 | 0.24 |
| SEASONAL STRATIFICATION | |||||
| Winter recruitment (Nov-Apr, N=332) | 198 | 0.78 | 0.73-0.83 | 0.00 | 0.98 |
| Summer recruitment (May-Oct, N=180) | 103 | 0.77 | 0.71-0.83 | -0.01 | 0.82 |
| Seasonal trend p-value | — | — | — | 0.82 (DeLong’s test, no interaction) | |
| AGE STRATIFICATION | |||||
| Age <65 years (N=187) | 112 | 0.76 | 0.70-0.82 | -0.02 | 0.68 |
| Age ≥65 years (N=314) | 189 | 0.79 | 0.74-0.84 | +0.01 | 0.84 |
| Age interaction p-value | — | — | — | 0.31 (no significant age × VDIBS interaction) | |
| SEX STRATIFICATION | |||||
| Male (N=278) | 166 | 0.77 | 0.72-0.82 | -0.01 | 0.72 |
| Female (N=234) | 135 | 0.79 | 0.73-0.85 | +0.01 | 0.82 |
| Sex interaction p-value | — | — | — | 0.64 (no significant sex × VDIBS interaction) | |
| COMORBIDITY STATUS | |||||
| Without diabetes (N=402) | 241 | 0.78 | 0.74-0.82 | 0.00 | 0.98 |
| With diabetes (N=110) | 60 | 0.79 | 0.72-0.86 | +0.01 | 0.87 |
| Comorbidity interaction p-value | — | — | — | 0.76 (no significant comorbidity × VDIBS interaction) |
All sensitivity analyses predict same outcome: severe COVID-19 (binary: yes/no per WHO criteria). Δ AUC, difference in AUC compared to primary analysis (0.78). p-values for DeLong’s test comparing sensitivity analysis AUC to primary analysis AUC. Multiple imputation: MICE method used to generate 10 imputed datasets for missing IL-6 and inflammatory markers (N=211 patients); results pooled using Rubin’s rules. VitD-only analysis: VDIBS calculated using only vitamin D tier component (range 0-3), predicting same severe disease outcome. All sensitivity analyses support robustness of VDIBS findings; no substantial changes in discrimination, supporting generalizability.
Disclaimer/Publisher’s Note: The statements, opinions and data contained in all publications are solely those of the individual author(s) and contributor(s) and not of MDPI and/or the editor(s). MDPI and/or the editor(s) disclaim responsibility for any injury to people or property resulting from any ideas, methods, instructions or products referred to in the content. |
© 2025 by the authors. Licensee MDPI, Basel, Switzerland. This article is an open access article distributed under the terms and conditions of the Creative Commons Attribution (CC BY) license (http://creativecommons.org/licenses/by/4.0/).
Copyright: This open access article is published under a Creative Commons CC BY 4.0 license, which permit the free download, distribution, and reuse, provided that the author and preprint are cited in any reuse.


