Submitted:
18 December 2025
Posted:
18 December 2025
You are already at the latest version
Abstract
Insulin resistance (IR) is a hallmark of type 2 diabetes, characterized by disrupted metabolic regulation, oxidative stress, and altered cell signaling. This study employed Data-Independent Acquisition (DIA) quantitative proteomics to profile the proteomic landscape in a cellular model of insulin resistance (MOD) and to evaluate the therapeutic effects of camel milk derived peptide TYYPPQ. Principal Component Analysis (PCA) confirmed distinct proteomic profiles between healthy control (C), MOD, and P2-treated cells, indicating that TYYPPQ induced a partial but significant reprogramming of the insulin-resistant proteome. Enrichment analyses (GO and KEGG) revealed that insulin resistance was characterized by widespread dysregulation, including increased endoplasmic reticulum (ER) stress, oxidative stress, inflammatory pathways, and disruptions in sphingolipid and fructose metabolism. In contrast, TYYPPQ treatment promoted a recovery signature, significantly enriching pathways related to improved insulin signaling (PI3K-Akt, AMPK), regulation of lipolysis, amino acid metabolism, actin cytoskeleton organization, and a marked reduction in ER stress markers. Crucially, these pathway predictions were validated at the molecular level, as qPCR and Western blot analysis confirmed that TYYPPQ effectively restored the expression and phosphorylation of AMPK. Further domain and subcellular localization analyses indicated that insulin resistance disrupted mitochondrial, redox, and protein homeostasis, while P2 treatment counteracted these effects by modulating domains related to mitochondrial function (proline dehydrogenase, cytochrome c oxidase) and restoring protein distribution, notably reducing ER-localized proteins. Collectively, these multi-faceted proteomic findings demonstrate that the peptide TYYPPQ mitigates insulin resistance by coordinately restoring key metabolic and signaling pathways, reducing cellular stress, and improving mitochondrial and cytoskeletal function, highlighting its potential as a therapeutic agent.
Keywords:
insulin resistance
; TYYPPQ
; proteomics
; insulin signaling pathways
; mitochondrial function
1. Introduction
Type 2 diabetes mellitus (T2DM) is a chronic metabolic disorder characterized by insulin resistance (IR), where cells fail to respond effectively to insulin, leading to impaired glucose uptake, systemic hyperglycemia, and long-term complications. Central to this pathology is the disruption of insulin receptor (IR) activation and downstream signaling pathways, notably PI3K-Akt and AMPK, which are critical for maintaining glucose and lipid homeostasis. Recent advances in peptide-based therapeutics have opened new avenues for modulating IR function, with bioactive peptides showing promise as non-toxic, multi-target agents capable of restoring insulin sensitivity.
In our previous study [1], we identified the camel milk-derived peptide TYYPPQ as a potent modulator of insulin signaling in insulin-resistant HepG2 cells. TYYPPQ demonstrated a unique non-competitive allosteric mechanism of IR activation by binding to the IR kinase domain, stabilizing the activation loop, and promoting AKT phosphorylation. Structure-based modeling, including molecular docking, molecular dynamics (MD), and in silico mutagenesis, revealed persistent hydrogen bonding with Glu1047 and favorable interactions within the DFG motif, contributing to enhanced IR activation.
While these findings provided critical insight into the molecular basis of IR modulation by TYYPPQ, they primarily focused on receptor-level interactions. Given the complex, multi-factorial nature of insulin resistance, it is essential to understand how such peptide-induced receptor activation translates into broader cellular responses, particularly at the proteome level.
To bridge this gap, the present study expands on our previous work by employing label-free quantitative proteomics to investigate the global proteomic alterations in insulin-resistant HepG2 cells and assess how TYYPPQ treatment reshapes the cellular proteome. By integrating principal component analysis (PCA), gene ontology (GO), KEGG pathway enrichment, and subcellular localization, we aim to uncover the downstream molecular mechanisms by which TYYPPQ alleviates insulin resistance. This systems-level approach not only validates the functional impact of IR activation by TYYPPQ but also reveals novel protein targets and pathways involved in its therapeutic action, thus providing a comprehensive molecular framework for future peptide-based drug development in T2DM.
2. Materials and Methods
2.1. Peptide Synthesis
Peptide TYYPPQ sequences identified from camel milk, was synthesized by Sangon Biotech (Shanghai, China) at a purity level of 95%.
2.2. Modeling Insulin Resistance in HepG2 Cells and Peptide Intervention
HepG2 cells were seeded in 6-well culture plates and incubated overnight at 37 °C in a humidified atmosphere containing 5% CO₂ to allow for cell adherence. To induce insulin resistance, cells were treated the following day with 18 mM glucosamine (S1635, Beyotime Biotechnology, China) in high-glucose DMEM supplemented with 10% fetal bovine serum (FBS) for 16 hours. After induction, cells were gently washed with cold phosphate-buffered saline (PBS) and subsequently incubated in high glucose DMEM supplemented with 10% fetal bovin serum (FBS)containing 100 µM camel milk-derived peptide TYYPPQ for 24 hours. Three experimental groups were prepared: (1) healthy control HepG2 cells (CON), (2) insulin-resistant HepG2 cells (MOD), and (3) insulin-resistant HepG2 cells treated with TYYPPQ (P2). Each group was processed in biological triplicate, resulting in a total of nine samples. Following treatment, cells were immediately processed for protein extraction and proteomic analysis.
2.3. Total Protein Extraction
The cells sample were transferred to a 1.5ml centrifuge tube and lysed with DB lysis buffer (6 M Urea, 100 mM TEAB, pH 8.5), followed by 5 min of ultrasonication on ice. The lysate was centrifuged at 12000 g for 15 min at 4℃ and the supernatant was added with 1M DTT to react for 1 h at 56℃, and subsequently alkylated with sufficient iodoacetamide for 1 h at room temperature in the dark followed by ice-bath for 2 min.
2.4. Protein Quality Test
BSA standard protein solution was prepared according to the instructions of Bradford protein quantitative kit, with gradient concentration ranged from 0 to 0.5 g/L. BSA standard protein solutions and sample solutions with different dilution multiples were added into 96-well plate to fill up the volume to 20 µL, respectively. Each gradient was repeated three times. The plate was added 180 µL G250 dye solution quickly and placed at room temperature for 5 minutes, the absorbance at 595 nm was detected. The standard curve was drawn with the absorbance of standard protein solution and the protein concentration of the sample was calculated. 20 μg of the protein sample was loaded to 12% SDS-PAGE gel electrophoresis, wherein the concentrated gel was performed at 120 V for 20 min, and the separation gel was performed at 150 V for 50 min. After completing the electrophoresis, the samples were stained using Caulmers Brilliant Blue Staining Riso Reagent and decolorized until the bands became clearly visible.
2.5. Trypsin Treatment
Each protein sample was taken and the volume was made up to 100 μL with DB lysis buffer (6 M Urea, 100 mM TEAB, pH 8.5), trypsin and 100 mM TEAB buffer were added, sample was mixed and digested at 37 °C for 4 h. Then trypsin were added digested overnight. Formic acid was mixed with digested sample, adjusted pH under 3, and centrifuged at 12000 g for 5 min at room temperature. The supernatant was slowly loaded to the C18 desalting column, washed with washing buffer (0.1% formic acid, 3% acetonitrile) 3 times, then added elution buffer (0.1% formic acid, 70% acetonitrile). The eluents of each sample were collected and lyophilized.
2.6. UHPLC-Astral LC/MS DIA Method
Prepare mobile phase A (100% water, 0.1% formic acid) and B (80% acetonitrile, 0.1% formic acid). The lyophilized powder was dissolved using 10µ LA solution, centrifuged at 14,000g for 20 min at 4 °C, and 200 ng of the supernatant sample was injected into the sample for liquid-quality detection. A Vanquish Neo upgraded UHPLC system was used with a C18 pre-column of 174500 (5 mm×300 μm ,5 μm, thermo) heated at 50 °C in a column oven, and a C18 analytical column of ES906 (PepMap TM Neo UHPLC 150µm x 15 cm, 2 μm, thermo). a Thermo orbitrap astral mass spectrometer mass spectrometer was used, an Easy-spray (ESI) ion source was used, the ion spray voltage was set to 2.0 kV, the ion transfer tube temperature was set to 290 °C, and the mass spectrum was in a data independent acquisition mode, with a full first-stage mass spectrometry scanning range of m/z 380 980. The primary MS resolution was set to 240000 (200m/z), AGC was set to 500%, the parent ion window size was set to 2-Th, the number of DIA windows was 300, the NCE was set to 25%, the secondary m/z acquisition range was from 150 to 2000, the sub-ion resolution Astral was set to 80000, and the maximal injection time was 3ms. Into mass spectrometry detection raw data (.raw).
2.7. The Functional Analysis of Protein and DEP
Gene Ontology (GO) and InterPro (IPR) functional analysis were conducted using the interproscan program against the non-redundant protein database (including Pfam, PRINTS, ProDom, SMART, ProSite, PANTHER) [2], and the databases of COG (Clusters of Orthologous Groups) and KEGG (Kyoto Encyclopedia of Genes and Genomes) were used to analyze the protein family and pathway. DEPs were used for Volcanic map analysis, cluster heat map analysis andenrichment analysis of GO, IPR and KEGG [3].
2.8. QPCR Analysis
HEPG2 cells were seeded in 6-well plates and cultured overnight. The next day, insulin resistance was induced by treating the cells with 18 mM glucosamine for 16 hours. After induction, the culture medium was removed, and the cells were treated with 100 µM of peptides (P1, P2, P3, P4) for 24 hours. Following peptide treatment, the cells were collected, and total RNA was extracted using an appropriate RNA isolation kit. The extracted RNA was then subjected to quantitative PCR (qPCR) analysis to evaluate gene expression changes. Data were normalized using a housekeeping gene (β-actin), and fold changes in gene expression were calculated relative to the untreated control group.
2.9. Western Blot Analysis
Western blot analysis was conducted to evaluate the phosphorylation levels of AMPK (P-AMPK) and total AMPK in HepG2 cells. After the indicated treatments, cells were lysed using RIPA lysis buffer supplemented with protease and phosphatase inhibitors to extract total protein. Protein concentrations were determined using a bicinchoninic acid (BCA) assay. Equal amounts of protein (20–30 µg) from each sample were separated by SDS-PAGE on a polyacrylamide gel and transferred onto a PVDF membrane. The membrane was blocked with 5% non-fat milk in TBST buffer for 1 hour at room temperature and subsequently incubated overnight at 4 °C with primary antibodies against phospho-AMPKα (Thr172) (Rabbit mAb, Cell Signaling Technology) and total AMPK. β-actin was used as a loading control. After washing with TBST, the membrane was incubated with HRP-conjugated secondary antibodies for 1 hour at room temperature. Protein bands were visualized using an enhanced chemiluminescence (ECL) detection system and quantified using densitometry software. The relative expression levels of P-AMPK and total AMPK were normalized to β-actin.
2.10. Data Analysis
The identification and quantitation of protein according to the protein database, the raw files were analyzed using the DIA-NN search software. The search parameters are set as follows: the mass deviations for precursor and fragment ions are automatically assessed and corrected; the fixed modification is alkylation of cysteine; the loss of N-terminal methionine is set as a variable modification, allowing for a maximum of 2 missed cleavages. To improve the quality of the analytical results, the DIA-NN software further filtered the search results by retaining only credible Peptide Spectrum Matches (PSMs) with a confidence level of 99% or higher. Only credible spectral peptides and proteins were retained, and FDR validation was performed to remove peptides and proteins with an FDR greater than 1%.A protein with a fold change (FC) greater than or less than a certain value (FC) was defined as a differentially expressed protein (DEP). Note: For HD Blood-Plus (Astral platform), the DIA-NN software (DirectDIA) was used for raw data deconvolution and species library searching [4]. Retention time correction was performed using iRT added to the samples, and the precursor ion Qvaluecutoff value was set to 0.01. Protein quantification results were statistically analyzed using the T-test, and differentially expressed proteins were defined as those with significant quantitative differences between the experimental and control groups (p*(FC) or FC
3. Results and Discussion
3.1. Analysis of Protein Differences
3.1.1. Comparative Analysis of PCA Between Healthy Cells (Control) and Insulin Resistant Cells (MOD)
In this study, DIA-based quantitative proteomics technology was used, and a total of 7,068 proteins were identified across 9 samples (n=3 per group), all of which were quantitatively analyzed. Proteins with a fold change greater than 1.2 (upregulated) or less than 0.83 (downregulated), and a p-value < 0.05, were considered significantly differentially expressed. The Principal Component Analysis (PCA) plot (Figure 1) provides a visual summary of the proteomic variation among three experimental groups: healthy control cells (C, red), insulin-resistant cells (MOD, blue), and insulin-resistant cells treated with the peptide TYYPPQ (P2, orange). The plot clearly illustrates a distinct separation between the groups, with the red, blue, and orange ellipses indicating separate proteomic profiles. This confirms that insulin resistance significantly alters protein expression compared to healthy controls. The P2 group (peptide-treated) does not fully overlap with the control group, indicating that TYYPPQ treatment does not fully restore the proteome to a healthy state. However, the P2 group is also clearly separated from the MOD group, suggesting beneficial changes in protein expression patterns due to the peptide treatment. The separation of P2 from MOD suggests a partial restoration or reprogramming of cellular pathways. Further pathway analysis, including GO enrichment and KEGG pathway analysis, could help identify specific proteins and metabolic networks influenced by the peptide treatment.
3.1.2. Differential Protein Enrichment Analysis
3.1.2.1. GO Enrichment Analysis Between Healthy Cells and Insulin Resistant Cells
This analysis (Figure 2) presents enriched Gene Ontology (GO) terms comparing control (healthy) cells and MOD (insulin-resistant) cells. The GO terms are categorized into three major groups: Biological Process (BP) in red, Cellular Component (CC) in orange, and Molecular Function (MF) in blue.
In the Biological Process (BP) category, insulin-resistant HepG2 cells exhibited significant enrichment in biological regulation, protein catabolism, and stress response pathways. These changes reflect a well-established shift in cellular homeostasis and metabolic reprogramming associated with insulin resistance. Increased enrichment in proteolysis and amino acid biosynthesis suggests elevated protein turnover, which could be compensatory mechanism in response to impaired insulin signaling and altered energy demands. The observed dysregulation of redox balance and stress response pathways aligns with previous findings indicating that insulin resistance is closely associated with oxidative stress and inflammatory signaling [5]. The enrichment of neuron development-related processes, although unexpected, may relate to the expression of neural-related genes in hepatic cell lines under stress or may reflect broader changes in growth factor signaling, including insulin and IGF pathways.
In the Cellular Component (CC) category, enrichment in membrane-associated structures, including plasma membrane components, points toward altered membrane receptor function, cell adhesion, and extracellular matrix interactions. These findings are consistent with evidence that insulin resistance is accompanied by modifications in insulin receptor localization [6], lipid raft dynamics [7], and cell surface protein composition [8], which ultimately impair receptor-mediated signaling. Disruptions in membrane integrity and receptor trafficking can further contribute to defective glucose uptake and impaired cellular responsiveness to insulin.
For Molecular Function (MF) (green), enriched terms include ion transport, metabolic regulation, and extracellular matrix interactions in insulin-resistant cells. Enriched transport-related terms suggest altered cellular communication and insulin signaling, while increased scavenger receptor activity indicates potential changes in lipid metabolism and oxidative stress. Main binding functions, such as calcium ion and ADP binding, highlight disruptions in insulin secretion, glucose homeostasis, and mitochondrial function [9,10]. Enhanced enzymatic activities including isomerase activity, sulfotransferase activity, intramolecular transferase activity, 3,5-cyclic-nucleotide phosphodiesterase activity, and glutamate-ammonia ligase activity which functions are crucial for metabolic regulation, neurotransmitter synthesis, and detoxification pathways, their enrichment suggests metabolic adaptations in response to insulin resistance.
Additionally, hyaluronic acid binding and heparan sulfate-glucosamine N-binding are associated with extracellular matrix interactions [11,12], which could reflect changes in cell adhesion, signaling, and inflammation in insulin-resistant cells. These findings suggest that insulin resistance leads to increased protein degradation, redox stress, and metabolic dysregulation. Structural alterations in the extracellular matrix and membrane components may impact insulin receptor function and signaling. Furthermore, disruptions in transporter and receptor activities align with known metabolic disturbances in insulin resistance, reinforcing the idea that insulin-resistant cells experience widespread functional impairments.
3.1.2.2. GO Enrichment Analysis Between P2 and MOD
This analysis (Figure 3) compares insulin-resistant cells treated with the TYYPPQ peptide (P2) to untreated insulin-resistant cells (MOD). In the Biological Process (BP) category, enriched terms include protein modifications, amino acid biosynthesis, insulin signaling, and chromatin organization. Notably, peptidyl-lysine modification and ATP-dependent chromatin remodeling suggest regulatory changes [13,14] in gene expression induced by peptide treatment. Additionally, regulation of GTPase activity points to potential effects on intracellular signaling [15], while ubiquinone biosynthesis may indicate a response to oxidative stress [16]. These results imply that peptide treatment induces metabolic and regulatory adjustments that could influence insulin signaling and protein modifications.
The Molecular Function (MF) category reveals significant enrichment in zinc ion binding, peptidase activity, and enzymatic functions. Increased endopeptidase and hydrolase activity suggest enhanced protein degradation or processing. Furthermore, enrichment of ubiquitin-related processes, such as phosphatidylinositol binding, ATP-dependent peptidase activity, and deubiquitinase activity, indicates a role in protein homeostasis and degradation. These findings suggest that the peptide enhances protein regulation mechanisms, enzyme function, and signaling pathways, which may contribute to the recovery from insulin resistance.
Therefore, peptide treatment modulates insulin signaling, protein regulation, and metabolic pathways. It appears to influence chromatin remodeling and protein degradation processes, which may counteract insulin resistance. Altered enzyme and peptidase activities suggest an increase in protein turnover or metabolic processing. Compared to untreated insulin-resistant cells, peptide-treated cells exhibit enrichment in metabolic activity and enzyme regulation, suggesting potential recovery from insulin resistance through pathways related to insulin signaling, oxidative stress, and protein turnover.
3.1.2.3. KEGG Enrichment Analysis
A comparison of healthy cells (Control) and insulin-resistant cells (MOD) highlights major pathway disruptions. Sphingolipid metabolism, fructose and mannose metabolism, and fat digestion and absorption are significantly altered, reflecting metabolic dysregulation in insulin resistance. Endoplasmic reticulum (ER) stress is a key feature, as indicated by the enrichment of protein processing in the ER, a hallmark of insulin resistance and type 2 diabetes. Several inflammatory pathways, including Jak-STAT signaling, cytokine-cytokine receptor interaction, and steroid hormone biosynthesis, are upregulated, reinforcing the link between chronic inflammation and insulin resistance. Transport-related pathways, such as ABC transporters and antigen processing, show alterations, potentially affecting lipid metabolism and immune responses. Interestingly, multiple cancer-related pathways are enriched, likely reflecting increased cellular proliferation and metabolic reprogramming in insulin resistance.
Figure 4.
KEGG enrichment analysis between Control (healthy cells) and insulin resistant cells (MOD).
Figure 4.
KEGG enrichment analysis between Control (healthy cells) and insulin resistant cells (MOD).
3.1.2.3.1. KEGG pathways enrichment analysis between MOD (insulin cells) and TYYPPQ treated cells (P2)
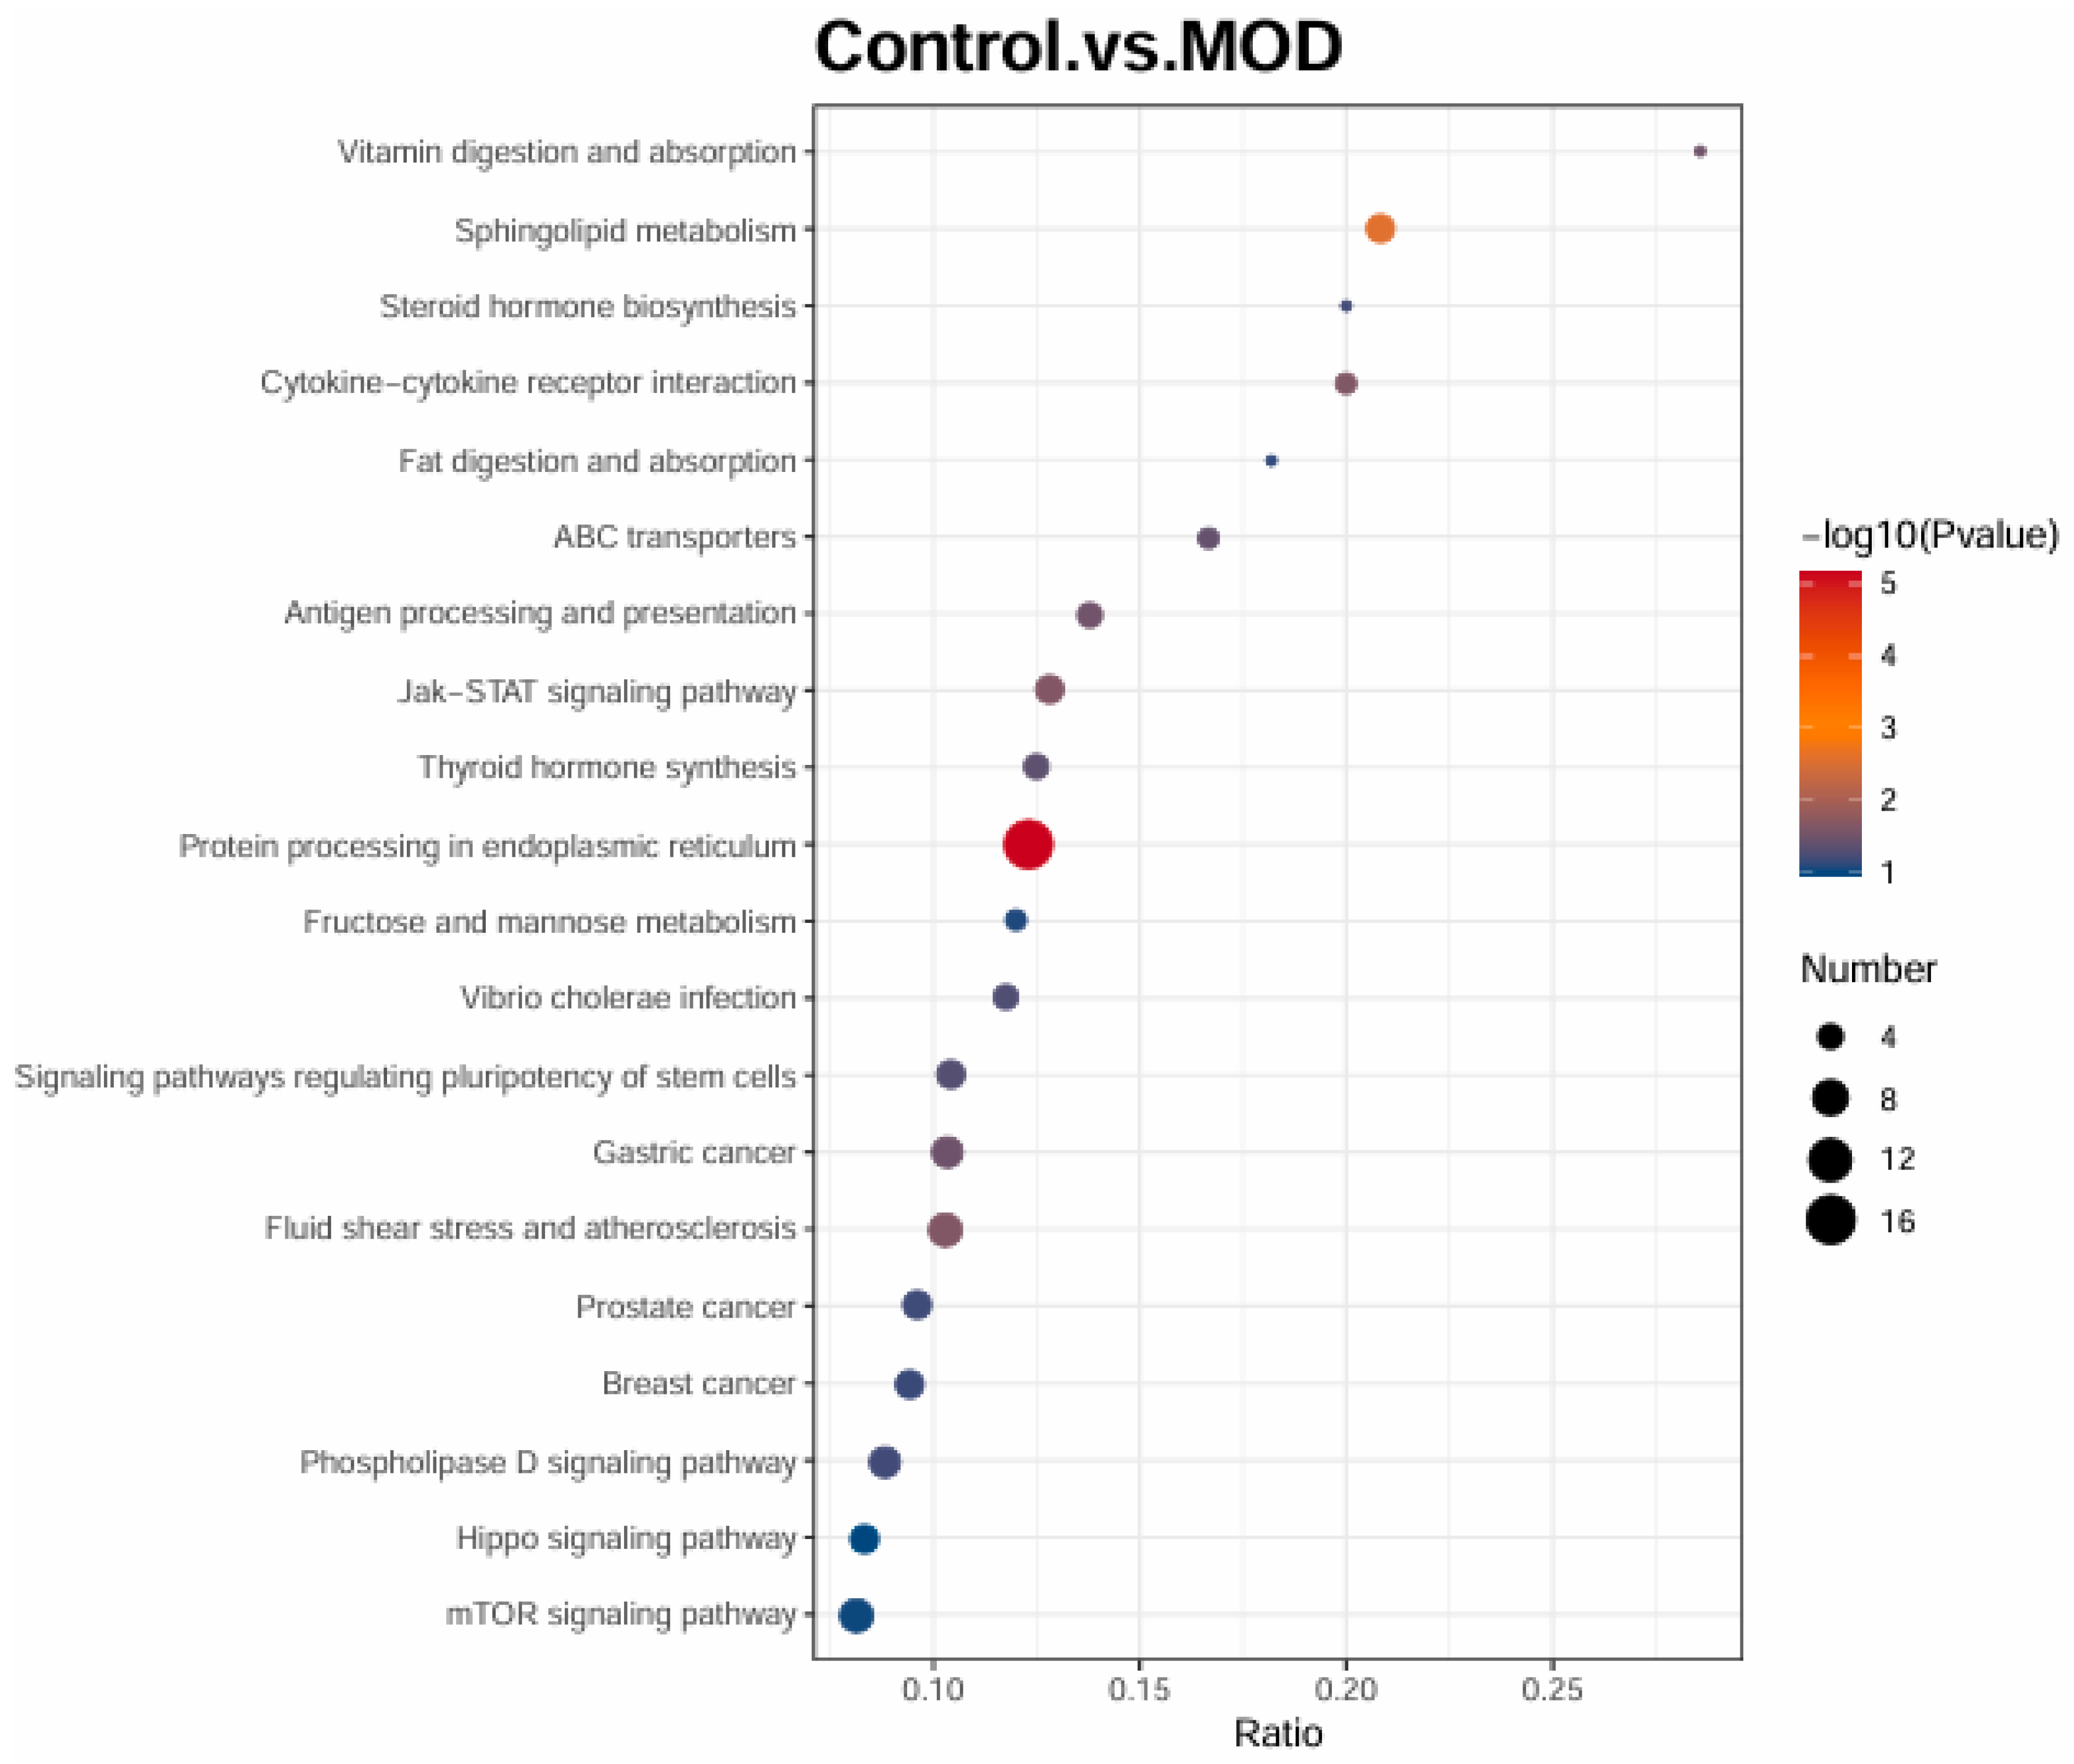
The Figure 5 represents a KEGG pathway enrichment analysis comparing P2 (peptide-treated insulin-resistant cells) and MOD (modeled insulin-resistant cells).
The pathways listed on the y-axis are those significantly enriched in the comparison, while the size and color of the dots indicate their significance and the number of genes involved. The KEGG pathway enrichment analysis provides insights into the biological pathways affected by insulin resistance and how peptide treatment influences these pathways. The pathway significance is represented by a color scale, where red and orange indicate highly significant pathways with a higher -log10(P-value), while blue represents less significant ones. The size of each dot reflects the number of genes mapped to a given pathway, with larger dots indicating a higher gene count.
Upon peptide treatment (P2 vs. MOD), significant pathway shifts are observed, suggesting potential recovery from insulin resistance. The PI3K-Akt and AMPK signaling pathways are enriched, indicating that the peptide may restore insulin sensitivity and metabolic regulation [17,18]. Regulation of lipolysis and amino acid metabolism is evident, suggesting that the peptide influences lipid and protein metabolism toward a more balanced state. Cytoskeletal integrity appears to improve, as reflected by the enrichment of actin cytoskeleton regulation and focal adhesion pathways, which were not prominent in the Control vs. MOD comparison. This can confirm a potential enhancement of insulin receptor function and glucose uptake. Notably, ER stress markers are reduced, with apoptosis-related pathways emerging instead, implying that the peptide may mitigate cellular stress and promote cell survival.
Globally, the peptide treatment appears to counteract insulin resistance by restoring key insulin signaling pathways (PI3K-Akt, AMPK), rebalancing metabolic processes, reducing ER stress, and improving cytoskeletal function. Compared to the insulin-resistant state, where metabolic and inflammatory dysregulation dominates, peptide-treated cells exhibit signs of insulin sensitivity recovery. These findings suggest that the peptide may have therapeutic potential in reversing insulin resistance through its effects on signaling, metabolism, and cellular homeostasis.
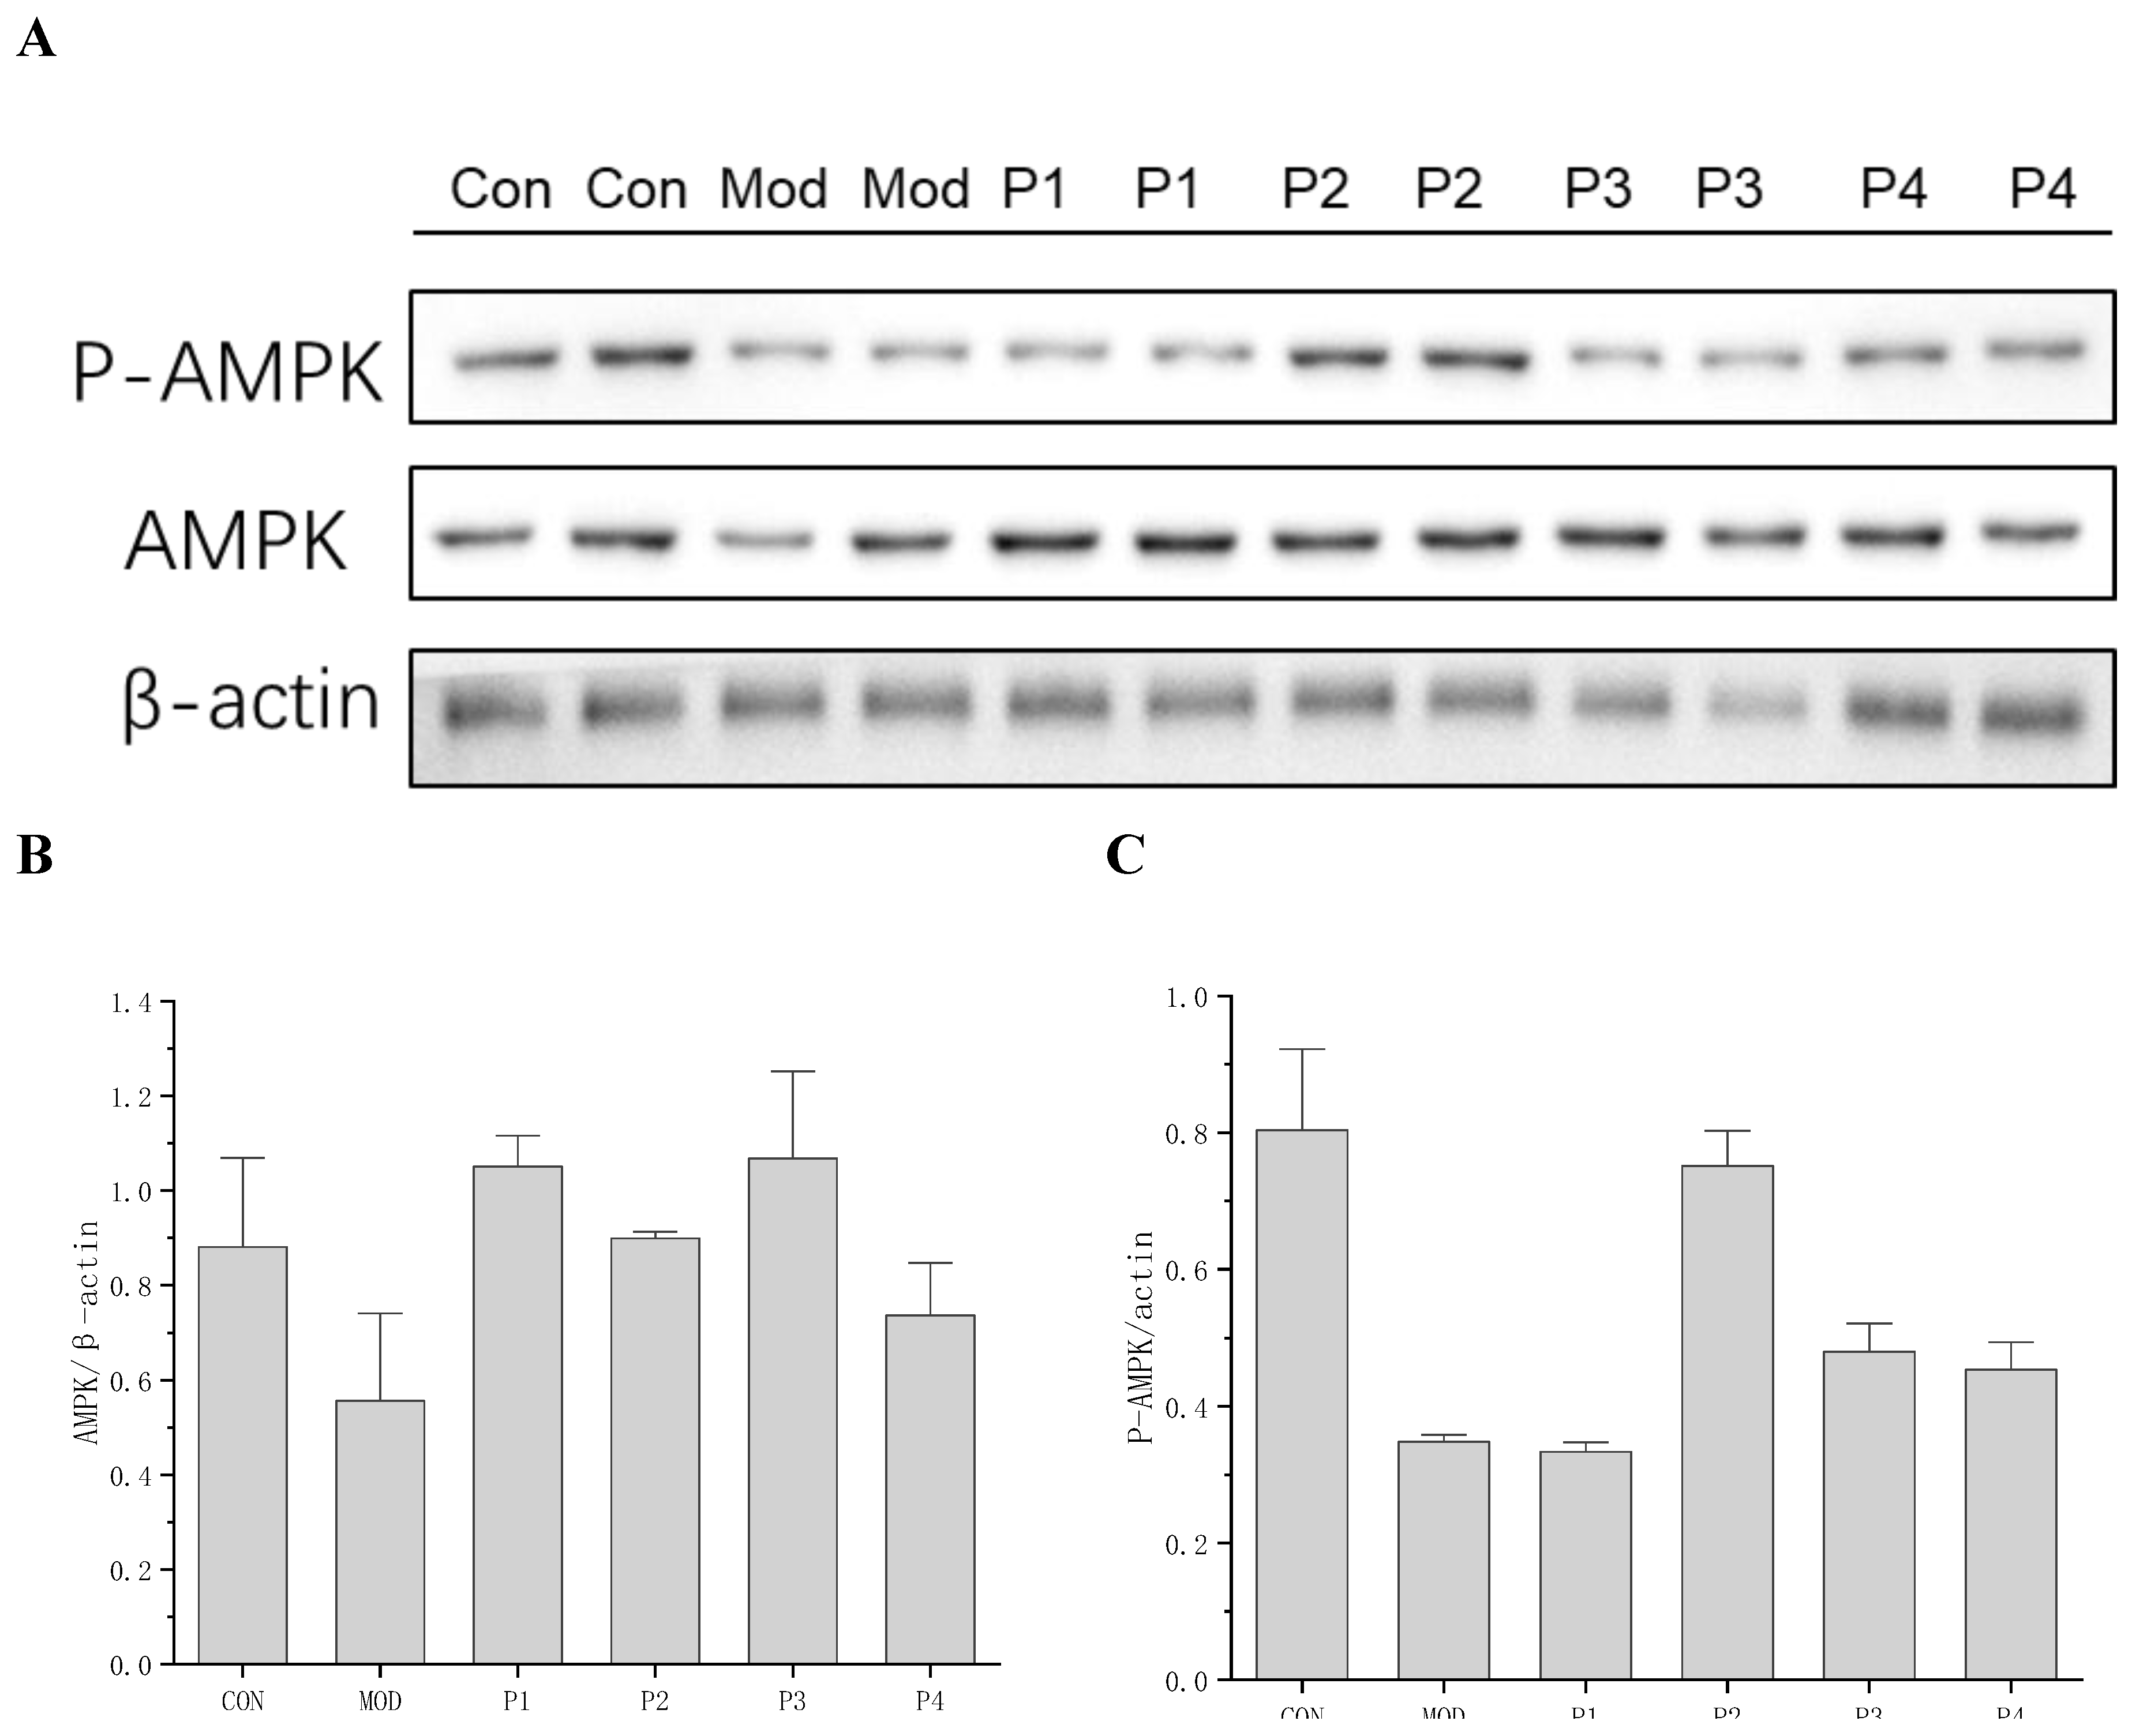
3.1.2.3.2. Validation of KEGG Enrichment by QPCR Analysis of AMPK Expression
To validate the KEGG pathway enrichment results, particularly the predicted involvement of AMPK signaling, AMPK expression and activation were examined at both the transcriptional and protein levels. qPCR analysis (Table 1) revealed that AMPK mRNA expression was significantly downregulated in the insulin-resistant model group (0.41 ± 0.074), confirming metabolic impairment. Treatment with TYYPPQ (Peptide 2) markedly upregulated AMPK expression (0.80 ± 0.049), approaching levels observed in healthy control cells (1.0 ± 0.076), whereas the others peptides considered as control failed to induce comparable recovery. Consistent with these transcriptional findings, Western blot analysis demonstrated a pronounced reduction in total AMPK and phosphorylated AMPK (P-AMPK) in insulin-resistant cells, indicating suppressed energy-sensing capacity. Notably, treatment with TYYPPQ restored both total AMPK and P-AMPK levels to near-control values, confirming effective reactivation of the AMPK pathway at the post-translational level. The increase in P-AMPK is particularly significant, as AMPK phosphorylation is essential for restoring cellular energy balance, enhancing insulin sensitivity, and improving glucose metabolism in hepatocytes [19,20,21].
Figure 6.
Western blot analysis A: Representative blot images, B: AMPK/β-actin ratios, C: P-AMPK/β-actin ratios.
Figure 6.
Western blot analysis A: Representative blot images, B: AMPK/β-actin ratios, C: P-AMPK/β-actin ratios.
3.1.3. Domain Enrichment Analysis
3.1.3.1. Healthy Cells (CONTROL) vs Insulin Resistant Cells (MOD): Domain Enrichment in Insulin Resistance
Domain enrichment analysis evaluates the functional domains most affected by peptide treatment. The x-axis represents the enrichment ratio, which indicates the number of differentially expressed proteins within a given domain relative to the total identified proteins in that domain. A higher ratio suggests stronger enrichment and a greater impact of peptide treatment on that domain. Statistical significance is represented by dot color (-log10 P-value), where redder dots indicate stronger confidence that the enrichment is not random. The dot size represents the number of differentially expressed proteins within each domain, with larger dots signifying a greater number of affected proteins.
Several domains were strongly enriched in insulin-resistant cells (Figure 7). The sodium neurotransmitter symporter domain, essential for neurotransmitter transport and ion homeostasis, suggests a possible link between insulin resistance and neurotransmitter dysregulation. The ribosomal protein L39e domain indicates potential disruptions in protein synthesis, which may contribute to metabolic and stress responses. Disruptions in the cobalamin (vitamin B12)-binding domain suggest potential effects on energy metabolism and methylation processes [22], while enrichment of the speract/scavenger receptor domain implies dysfunction in lipid metabolism and immune responses [23], common features of insulin resistance. Additionally, increased expression of selenoprotein (Rdx type) and thioredoxin domains suggests heightened oxidative stress in insulin-resistant cells, a hallmark of metabolic disorders [24,25,26].
Other affected domains include the glutamine synthetase/guanido kinase catalytic domain, involved in amino acid metabolism and energy balance [27], and the 35-cyclic nucleotide phosphodiesterase catalytic domain, which plays a role in cAMP signaling a key regulator of glucose metabolism [28,29]. The Rho GTPase-activating protein domain, which influences cell signaling [30] and cytoskeletal regulation [31], may also contribute to altered insulin signaling and glucose uptake in insulin-resistant cells.
Therefore, insulin-resistant cells exhibit significant alterations in domains related to oxidative stress (selenoprotein, thioredoxin), neurotransmitter and ion transport (sodium symporter), protein synthesis (ribosomal protein, cobalamin-binding), lipid metabolism and immune response (scavenger receptor), and insulin signaling (cAMP, Rho GTPase-activating domain). These findings highlight the metabolic, inflammatory, and signaling disruptions characteristic of insulin resistance.
3.1.3.2. Domain Enrichment Analysis Between Peptide Treated Cells and Insulin Resistant Cells
In Figure 8, several domains were highly enriched following peptide treatment. The proline dehydrogenase domain [32], linked to mitochondrial function and redox homeostasis, suggests that the peptide may regulate oxidative stress and energy metabolism. The Peptidase A22A (presenilin family) domain, which plays a role in protein degradation and turnover, indicates a potential effect on proteostasis and signaling regulation. Additionally, cytochrome c oxidase subunit III, a key component of the mitochondrial electron transport chain [33], suggests mitochondrial involvement in the peptide’s effects. The Ricin B lectin domain, associated with carbohydrate binding [34] and glycoprotein-mediated signaling, may play a role in insulin signaling, while the Integrin alpha-2 domain, which regulates cell adhesion and extracellular interactions, could influence insulin resistance and metabolic regulation.
Therefore, Peptide treatment (P2) significantly affects protein domains related to metabolism, mitochondrial function, and cell signaling. The enrichment of mitochondrial-related domains, including proline dehydrogenase and cytochrome c oxidase, suggests a role in energy metabolism regulation. Additionally, alterations in Peptidase A22A and signaling domains imply potential effects on proteostasis and insulin signaling, supporting the idea that the peptide modulates key metabolic pathways in insulin-resistant cells.
3.1.3.2.1. Comparison of P2 vs. MOD and Control vs. MOD: Peptide Effects on Insulin Resistance
This comparison identifies domains disrupted in insulin resistance (Control vs. MOD) and those influenced by peptide treatment (P2 vs. MOD). By analyzing these patterns, we can assess whether the peptide restores normal metabolic function or introduces new regulatory mechanisms.
Regarding Oxidative Stress and Redox Homeostasis Insulin-resistant cells (MOD) exhibit increased oxidative stress, reflected in thioredoxin and selenoprotein enrichment. Peptide treatment (P2) modulates redox balance through proline dehydrogenase [35], a mitochondrial enzyme involved in reactive oxygen species (ROS) regulation, suggesting a role in oxidative stress management.
Regarding mitochondrial function and energy metabolism MOD disrupts mitochondrial function, as seen in altered cobalamin-binding and sodium symporter domains. Peptide treatment restores mitochondrial activity through enrichment of cytochrome c oxidase and proline dehydrogenase, supporting improved oxidative phosphorylation and energy homeostasis.
Regarding protein synthesis and turnover MOD shows ribosomal dysregulation, indicated by increased ribosomal protein L39e expression. P2 treatment alters protein processing domains, such as Peptidase A22A and ribosomal proteins, which may contribute to enhanced proteostasis.
Regarding lipid metabolism and immune response, MOD enhances expression of the scavenger receptor domain, suggesting dysfunctional lipid metabolism and immune activation. P2 treatment affects Ricin B lectin and Integrin alpha-2, which regulate carbohydrate and lipid metabolism, potentially contributing to improved metabolic homeostasis and immune modulation.
In insulin signaling and glucose metabolism MOD impacts cAMP signaling and cytoskeletal function, affecting glucose uptake. P2 treatment modifies domains associated with insulin receptor interactions (FG-GAP repeat) and epigenetic regulation (SET domain), suggesting potential enhancement of insulin sensitivity.
Therefore, insulin resistance leads to widespread disruptions in redox balance, mitochondrial function, protein synthesis, lipid metabolism, and insulin signaling. Peptide treatment (P2) appears to restore mitochondrial function, improve protein homeostasis, regulate lipid metabolism, and enhance insulin signaling, while also reducing oxidative stress and immune dysfunction. These findings suggest that the peptide has protective and potentially therapeutic effects against insulin resistance by targeting multiple metabolic and signaling pathways.
3.1.3.3. Subcellular Localization Analysis of Differential Proteins
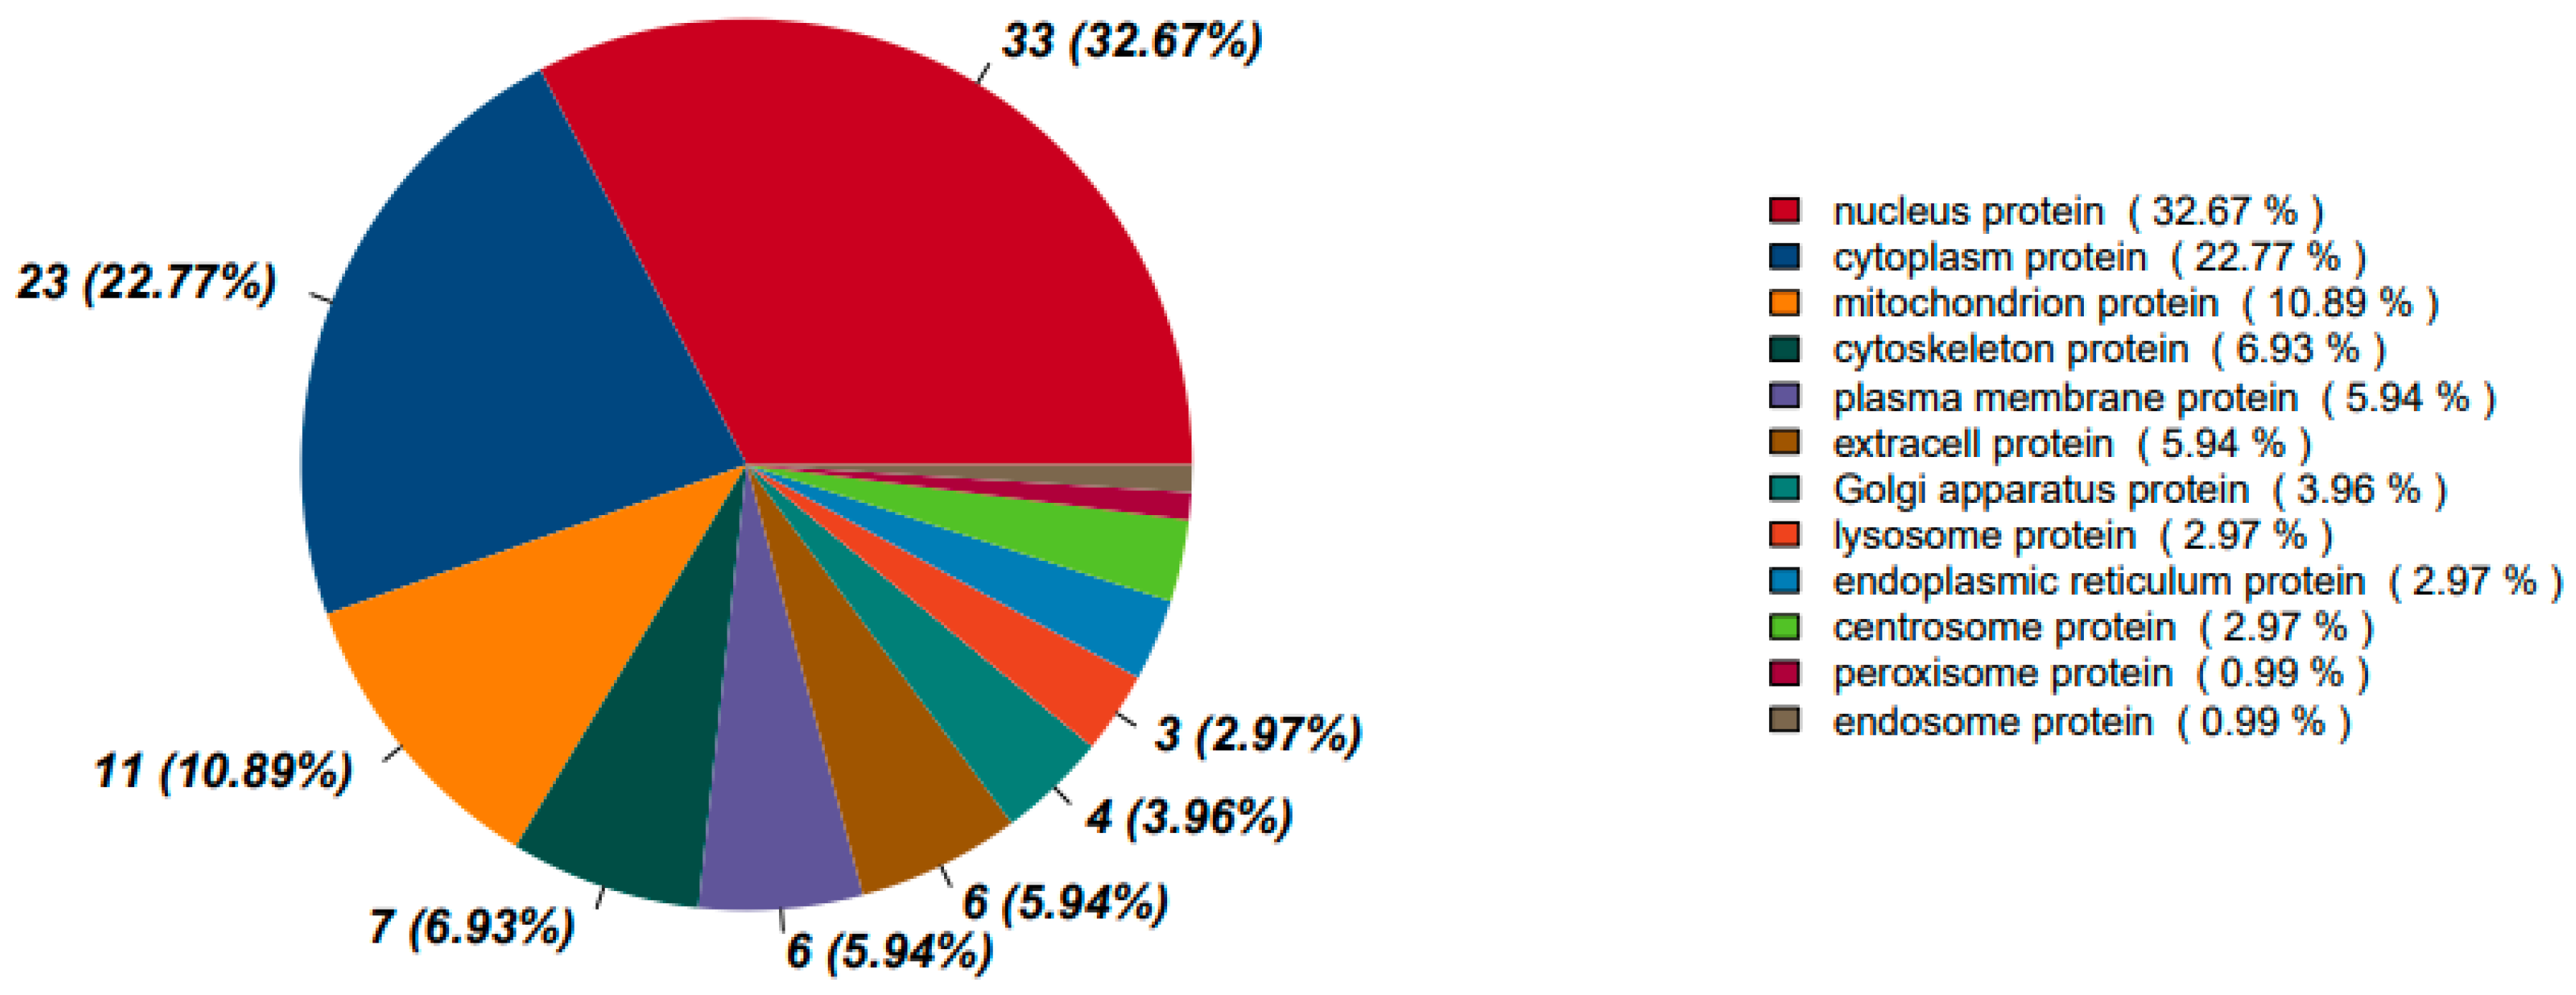
The subcellular localization of differentially expressed proteins (DEPs) was analyzed to understand how insulin resistance (MOD) and peptide treatment (P2) influence protein distribution within the cell. Figure 8 and Figure 9 presents this analysis for each comparison.
3.1.3.3.1. Protein Localization Between Healthy Cells and Insulin Resistant Cells
The analysis of protein localization between healthy cells and insulin resistant cells provides insights into disrupted cellular functions. The largest proportion of DEPs (35.41%) are nuclear, indicating significant alterations in gene regulation, transcription factors, and nuclear signaling. Insulin resistance is known to affect nuclear receptors, chromatin remodeling, and the transcriptional control of metabolic pathways [36,37]. A substantial number of DEPs (13.40%) are cytoplasmic, reflecting changes in cytosolic metabolic enzymes, signaling proteins, and stress response pathways. This may be associated with disruptions in insulin signaling cascades occurring in the cytoplasm.
The endoplasmic reticulum (ER) accounts for 11.96% of DEPs, suggesting a strong link to ER stress, which is a hallmark of insulin resistance. This may indicate disruptions in protein folding, activation of the unfolded protein response (UPR), and disturbances in protein synthesis or secretion. The plasma membrane contains 9.09% of DEPs, which may suggest alterations in insulin receptor localization, glucose transporter translocation, and other cell surface signaling proteins involved in insulin signaling.
Mitochondrial proteins make up 7.18% of DEPs, highlighting possible oxidative stress, impaired ATP production, and mitochondrial dysfunction factors commonly associated with insulin resistance. The extracellular space contains 6.70% of DEPs, suggesting altered secretion of signaling molecules, cytokines, or extracellular matrix components, which could contribute to inflammation and fibrosis in insulin resistance. Other cellular compartments are also affected. Golgi-associated DEPs (5.26%) suggest modifications in protein trafficking, while cytoskeletal proteins (3.83%) may reflect changes in GLUT4 vesicle transport, cell shape, and motility. Lysosomal and peroxisomal proteins are involved in degradation pathways, and their differential expression suggests changes in cellular clearance mechanisms.
3.1.3.3.2. Protein Localization Between Insulin Resistant Cells and Peptide Treated Insulin Resistant Cells
The subcellular localization of DEPs in P2 (peptide-treated) vs. MOD (insulin resistant) conditions provides insights into how peptide treatment affects protein distribution and whether it restores normal cellular functions. Nuclear proteins remain the most affected category at 32.67%, similar to the Control vs. MOD comparison (35.41%), indicating continued transcriptional regulation changes. However, there is a notable increase in cytoplasmic proteins, rising to 22.77% from 13.40% in MOD. This suggests a restoration of metabolic enzymes and signaling proteins functioning outside the nucleus, which may improve insulin signal transduction and metabolic regulation.
Mitochondrial proteins increase from 7.18% in MOD to 10.89% in P2-treated cells, suggesting a recovery of oxidative phosphorylation and energy metabolism. Cytoskeletal proteins also increase from 3.83% in MOD to 6.93% in P2-treated cells, which may indicate enhanced GLUT4 vesicle transport and improved glucose uptake. Plasma membrane proteins remain relatively stable at 5.94%, compared to 9.09% in MOD, suggesting partial recovery of membrane-associated proteins, such as insulin receptors and GLUT transporters, which could indicate improvements in insulin sensitivity.
One of the most notable changes is the significant decrease in ER proteins, dropping from 11.96% in MOD to 2.97% in P2-treated cells. This suggests a marked reduction in ER stress and improvements in protein folding or secretion mechanisms. Since ER stress is closely linked to insulin resistance, this shift indicates a beneficial effect of peptide treatment. The Golgi apparatus (3.96%) and endosomal proteins (0.99%) remain relatively unchanged, suggesting minimal impact on vesicle trafficking.
The observed changes suggest that P2 treatment plays a role in reversing protein mislocalization associated with insulin resistance. The increased presence of mitochondrial and cytoplasmic proteins indicates metabolic recovery and improved energy regulation. The reduction in ER protein localization suggests lower ER stress, a factor known to contribute to insulin resistance. The higher presence of cytoskeletal proteins points to enhanced GLUT4 vesicle transport, which could improve glucose uptake. Overall, peptide treatment restores normal subcellular protein distribution, potentially reversing some of the mislocalization seen in MOD.
Insulin resistance (MOD) leads to an imbalance in protein localization, characterized by an increase in ER proteins, suggesting elevated ER stress [38], and stable nuclear proteins, which point to sustained dysregulation of gene expression. Mitochondrial protein alterations may also reflect metabolic dysfunction. In contrast, P2 treatment appears to restore normal protein distribution patterns. The increase in cytoplasmic proteins suggests the recovery of metabolic enzymes and signaling proteins essential for insulin response. The higher proportion of mitochondrial proteins points to improved oxidative metabolism through the activation of the mitochondrial unfolded protein response [39], while the significant reduction in ER proteins suggests lower ER stress [40], which is beneficial for insulin sensitivity. The increased presence of cytoskeletal proteins may support GLUT4 translocation [41], potentially enhancing glucose uptake. However, some Golgi and plasma membrane proteins remain altered, which may reflect ongoing cellular adaptation to peptide treatment.
Table 2 highlights how insulin resistance (MOD) alters protein localization and how P2 treatment restores or further modifies these distributions.
Figure 10.
Protein subcellular localization between insulin resistant cells and peptide treated insulin resistant cells.
Figure 10.
Protein subcellular localization between insulin resistant cells and peptide treated insulin resistant cells.
4. Conclusions
This study provides comprehensive proteomic evidence that insulin resistance profoundly alters protein expression, biological pathways, and cellular functions, as revealed by PCA, GO enrichment, and KEGG pathway analyses. Compared to healthy cells, insulin-resistant cells display disrupted metabolic regulation, increased oxidative stress, altered membrane dynamics, and elevated inflammatory signaling.
Treatment with the bioactive peptide TYYPPQ induces notable shifts in the proteomic landscape of insulin-resistant cells. PCA analysis demonstrates that while the peptide does not fully restore the proteome to a healthy profile, it significantly diverges from the insulin-resistant state, indicating partial recovery. Enrichment analyses reveal that the peptide promotes beneficial biological processes, including improved insulin signaling, enhanced protein regulation, and reduced endoplasmic reticulum stress. Notably, activation of PI3K-Akt and AMPK pathways suggests that TYYPPQ enhances insulin sensitivity and cellular energy balance.
The domain enrichment and subcellular localization analyses offer valuable insights into the molecular disruptions associated with insulin resistance and the restorative potential of the peptide treatment (P2). Insulin-resistant cells (MOD) exhibit significant enrichment in domains related to oxidative stress (thioredoxin, selenoprotein), disrupted mitochondrial activity (cobalamin-binding, sodium symporter), impaired protein synthesis (ribosomal proteins), and altered lipid metabolism and immune signaling (scavenger receptor). These alterations are accompanied by imbalanced subcellular protein distribution, including elevated nuclear and ER-localized proteins, indicative of transcriptional dysregulation and ER stress.
Peptide treatment reverses many of these disruptions. Domain enrichment analysis revealed the activation of mitochondrial and metabolic domains (cytochrome c oxidase, proline dehydrogenase), along with improvements in proteostasis (Peptidase A22A) and signaling pathways (Ricin B lectin, FG-GAP, and SET domains), all of which point toward enhanced insulin sensitivity and metabolic recovery. Subcellularly, P2-treated cells showed increased mitochondrial and cytoplasmic protein localization, reduced ER stress, and improved cytoskeletal organization collectively supporting better energy homeostasis, insulin signaling, and glucose uptake.
Therefore, TYYPPQ exerts multi-targeted effects by reducing oxidative stress, restoring mitochondrial function, enhancing proteostasis, and rebalancing subcellular protein distribution. Its ability to improve insulin signaling, alleviate metabolic stress, and influence cytoskeletal and membrane-related functions positions it as a promising candidate for the management of type 2 diabetes.
Author Contributions
Issoufou Katambe Mohamed: Writing – review & editing, Writing –original draft, Methodology, Investigation, Data curation. Xiangzhen Kong and Xingfei Li: Methodology, Formal analysis, Data curation, Yeming Chen and Caimeng Zhang: Formal analysis, review & editing. Mouhamed Fall: Formal analysis. Yufei Hua: Supervision, Project administration, Methodology, Investigation, Conceptualization.
Funding
This work was supported by the Key Research and Development Program of Shandong Province (2022CXGC010603), the National Natural Science Foundation of China (32272243, 32072164), and the China Postdoctoral Science Foundation (2020M671342).
Institutional Review Board Statement
Not applicable.
Informed Consent Statement
Not applicable.
Data Availability Statement
The original contributions presented in this study are included in the article. Further inquiries can be directed to the corresponding author.
Conflicts of Interest
The authors declare no conflicts of interest.
References
- Mohamed, I K; Hua, Y; Kong, X; et al. Bioactive camel milk peptides as regulators of insulin receptor signaling: Experimental and computational perspectives[J]. Results in Chemistry 2025, 16, 102504. [Google Scholar] [CrossRef]
- Huang da, W; Sherman, B T; Lempicki, R A. Bioinformatics enrichment tools: paths toward the comprehensive functional analysis of large gene lists[J]. Nucleic Acids Res 2009, 37(1), 1–13. [Google Scholar] [CrossRef]
- Franceschini, A; Szklarczyk, D; Frankild, S; et al. STRING v9.1: protein-protein interaction networks, with increased coverage and integration[J]. Nucleic Acids Res 2013, 41(Database issue), D808–815. [Google Scholar] [CrossRef] [PubMed]
- Demichev, V; Messner, C B; Vernardis, S I; et al. DIA-NN: neural networks and interference correction enable deep proteome coverage in high throughput[J]. Nat Methods 2020, 17(1), 41–44. [Google Scholar] [CrossRef]
- Cecerska-Heryć, E; Engwert, W; Michałów, J; et al. Oxidative stress markers and inflammation in type 1 and 2 diabetes are affected by BMI, treatment type, and complications[J]. Scientific Reports 2025, 15(1), 23605. [Google Scholar] [CrossRef]
- Dall’Agnese, A; Platt, J M; Zheng, M M; et al. The dynamic clustering of insulin receptor underlies its signaling and is disrupted in insulin resistance[J]. Nat Commun 2022, 13(1), 7522. [Google Scholar] [CrossRef]
- Perona, J S. Membrane lipid alterations in the metabolic syndrome and the role of dietary oils[J]. Biochimica et Biophysica Acta (BBA) - Biomembranes 2017, 1859(9, Part B), 1690–1703. [Google Scholar] [CrossRef]
- Szablewski, L. Changes in Cells Associated with Insulin Resistance[J]. Int J Mol Sci 2024, 25(4). [Google Scholar] [CrossRef] [PubMed]
- LEE, J-W; JUNG, Y; IM, S-S; et al. 1512-P: The Novel Roles of Intracellular Calcium and Phosphoinositides in Insulin Signaling and Metabolic Disease[J]. Diabetes 2023, 72 (Supplement_1). [Google Scholar] [CrossRef]
- Ludzki, A; Paglialunga, S; Smith, B K; et al. Rapid Repression of ADP Transport by Palmitoyl-CoA Is Attenuated by Exercise Training in Humans: A Potential Mechanism to Decrease Oxidative Stress and Improve Skeletal Muscle Insulin Signaling[J]. Diabetes 2015, 64(8), 2769–2779. [Google Scholar] [CrossRef] [PubMed]
- Garantziotis, S; Savani, R C. Hyaluronan biology: A complex balancing act of structure, function, location and context[J]. Matrix Biol 2019, 78-79: 1–10. [Google Scholar] [CrossRef] [PubMed]
- Alotaibi Faizah, S; Alsadun Marim, M R; Alsaiari Sarah, A; et al. Interactions of proteins with heparan sulfate[J]. Essays in Biochemistry 2024, 68(4), 479–489. [Google Scholar]
- Malik, D; Deshmukh, A; Bilokapic, S; et al. Mechanisms of chromatin remodeling by the human Snf2-type ATPase SNF2H[J]. Cell Research 2025. [Google Scholar] [CrossRef]
- Wang, Z A; Cole, P A. The Chemical Biology of Reversible Lysine Post-translational Modifications[J]. Cell Chem Biol 2020, 27(8), 953–969. [Google Scholar] [CrossRef] [PubMed]
- Machin, P A; Tsonou, E; Hornigold, D C; et al. Rho Family GTPases and Rho GEFs in Glucose Homeostasis[J]. Cells 2021, 10(4). [Google Scholar] [CrossRef]
- Weinberg, S E; Chandel, N S. COQ6 defies immune and metabolic expectations[J]. Nature Immunology 2024, 25(12), 2170–2172. [Google Scholar] [CrossRef]
- An, H; Jang, Y; Choi, J; et al. New Insights into AMPK, as a Potential Therapeutic Target in Metabolic Dysfunction-Associated Steatotic Liver Disease and Hepatic Fibrosis[J]. Biomol Ther (Seoul) 2025, 33(1), 18–38. [Google Scholar] [CrossRef]
- Li, J; Sun, M; Tang, M; et al. Mechanism of PI3K/Akt-mediated mitochondrial pathway in obesity-induced apoptosis (Review)[J]. Biomed Rep 2025, 22(3), 40. [Google Scholar] [CrossRef]
- Trefts, E; Shaw, R J. AMPK: restoring metabolic homeostasis over space and time[J]. Mol Cell 2021, 81(18), 3677–3690. [Google Scholar] [CrossRef]
- Chauhan, S; Singh, A P; Rana, A C; et al. Natural activators of AMPK signaling: potential role in the management of type-2 diabetes[J]. J Diabetes Metab Disord 2023, 22(1), 47–59. [Google Scholar] [CrossRef] [PubMed]
- Francini, F; Schinella, G R; Ríos, J L. Activation of AMPK by Medicinal Plants and Natural Products: Its Role in Type 2 Diabetes Mellitus[J]. Mini Rev Med Chem 2019, 19(11), 880–901. [Google Scholar] [CrossRef]
- Mucha, P; Kus, F; Cysewski, D; et al. Vitamin B(12) Metabolism: A Network of Multi-Protein Mediated Processes[J]. Int J Mol Sci 2024, 25(15). [Google Scholar] [CrossRef]
- Vogel, A; Brunner, J S; Hajto, A; et al. Lipid scavenging macrophages and inflammation[J]. Biochimica et Biophysica Acta (BBA) - Molecular and Cell Biology of Lipids 2022, 1867(1), 159066. [Google Scholar] [CrossRef]
- Yu, S S; Du, J L. Selenoprotein S: a therapeutic target for diabetes and macroangiopathy?[J]. Cardiovasc Diabetol 2017, 16(1), 101. [Google Scholar] [CrossRef]
- Gorini, F; Vassalle, C. Selenium and Selenoproteins at the Intersection of Type 2 Diabetes and Thyroid Pathophysiology[J]. Antioxidants (Basel) 2022, 11(6). [Google Scholar] [CrossRef] [PubMed]
- Wondafrash, D Z; Nire’a, A T; Tafere, G G; et al. Thioredoxin-Interacting Protein as a Novel Potential Therapeutic Target in Diabetes Mellitus and Its Underlying Complications[J]. Diabetes Metab Syndr Obes 2020, 13, 43–51. [Google Scholar] [CrossRef] [PubMed]
- Tecson, M C B; Geluz, C; Cruz, Y; et al. Glutamine Synthetase: Diverse Regulation and Functions of an Ancient Enzyme[J]. Biochemistry 2025, 64(3), 547–554. [Google Scholar] [CrossRef] [PubMed]
- Maurice, D H; Ke, H; Ahmad, F; et al. Advances in targeting cyclic nucleotide phosphodiesterases[J]. Nat Rev Drug Discov 2014, 13(4), 290–314. [Google Scholar] [CrossRef]
- Yang, H; Yang, L. Targeting cAMP/PKA pathway for glycemic control and type 2 diabetes therapy[J]. J Mol Endocrinol 2016, 57(2), R93–r108. [Google Scholar] [CrossRef]
- Liu, C; Chen, S; Zhang, Y; et al. Mechanisms of Rho GTPases in regulating tumor proliferation, migration and invasion[J]. Cytokine & Growth Factor Reviews 2024, 80, 168–174. [Google Scholar]
- Nayak, R C; Chang, K H; Vaitinadin, N S; et al. Rho GTPases control specific cytoskeleton-dependent functions of hematopoietic stem cells[J]. Immunol Rev 2013, 256(1), 255–268. [Google Scholar] [CrossRef]
- Choudhury, D; Rong, N; Senthil Kumar, H V; et al. Proline restores mitochondrial function and reverses aging hallmarks in senescent cells[J]. Cell Reports 2024, 43(2), 113738. [Google Scholar] [CrossRef]
- Kalpage, H A; Wan, J; Morse, P T; et al. Cytochrome c phosphorylation: Control of mitochondrial electron transport chain flux and apoptosis[J]. Int J Biochem Cell Biol 2020, 121, 105704. [Google Scholar] [CrossRef]
- De Coninck, T; Gippert, G P; Henrissat, B; et al. Investigating diversity and similarity between CBM13 modules and ricin-B lectin domains using sequence similarity networks[J]. BMC Genomics 2024, 25(1), 643. [Google Scholar] [CrossRef] [PubMed]
- Servet, C; Ghelis, T; Richard, L; et al. Proline dehydrogenase: a key enzyme in controlling cellular homeostasis[J]. Front Biosci (Landmark Ed) 2012, 17(2), 607–620. [Google Scholar] [CrossRef] [PubMed]
- Fu, Y; Luo, L; Luo, N; et al. NR4A Orphan Nuclear Receptors Modulate Insulin Action and the Glucose Transport System: POTENTIAL ROLE IN INSULIN RESISTANCE *[J]. Journal of Biological Chemistry 2007, 282(43), 31525–31533. [Google Scholar] [CrossRef]
- Vidal, C M; Alva-Ornelas, J A; Chen, N Z; et al. Insulin Resistance in Women Correlates with Chromatin Histone Lysine Acetylation, Inflammatory Signaling, and Accelerated Aging[J]. Cancers (Basel) 2024, 16(15). [Google Scholar] [CrossRef]
- Bhattarai, K R; Riaz, T A; Kim, H-R; et al. The aftermath of the interplay between the endoplasmic reticulum stress response and redox signaling[J]. Experimental & Molecular Medicine 2021, 53(2), 151–167. [Google Scholar]
- Torres, A K; Fleischhart, V; Inestrosa, N C. Mitochondrial unfolded protein response (UPR(mt)): what we know thus far[J]. Front Cell Dev Biol 2024, 12, 1405393. [Google Scholar] [CrossRef]
- Ellgaard, L; Sevier, C S; Bulleid, N J. How Are Proteins Reduced in the Endoplasmic Reticulum?[J]. Trends Biochem Sci 2018, 43(1), 32–43. [Google Scholar] [CrossRef]
- Błaszczyk, M; Gajewska, M; Dymowska, M; et al. Interleukin-6 mimics insulin-dependent cellular distribution of some cytoskeletal proteins and Glut4 transporter without effect on glucose uptake in 3T3-L1 adipocytes[J]. Histochemistry and Cell Biology 2022, 157(5), 525–546. [Google Scholar] [CrossRef] [PubMed]
Figure 1.
PCA of protein expression profiles between healthy cells (control) and insulin resistant cells (MOD).
Figure 1.
PCA of protein expression profiles between healthy cells (control) and insulin resistant cells (MOD).
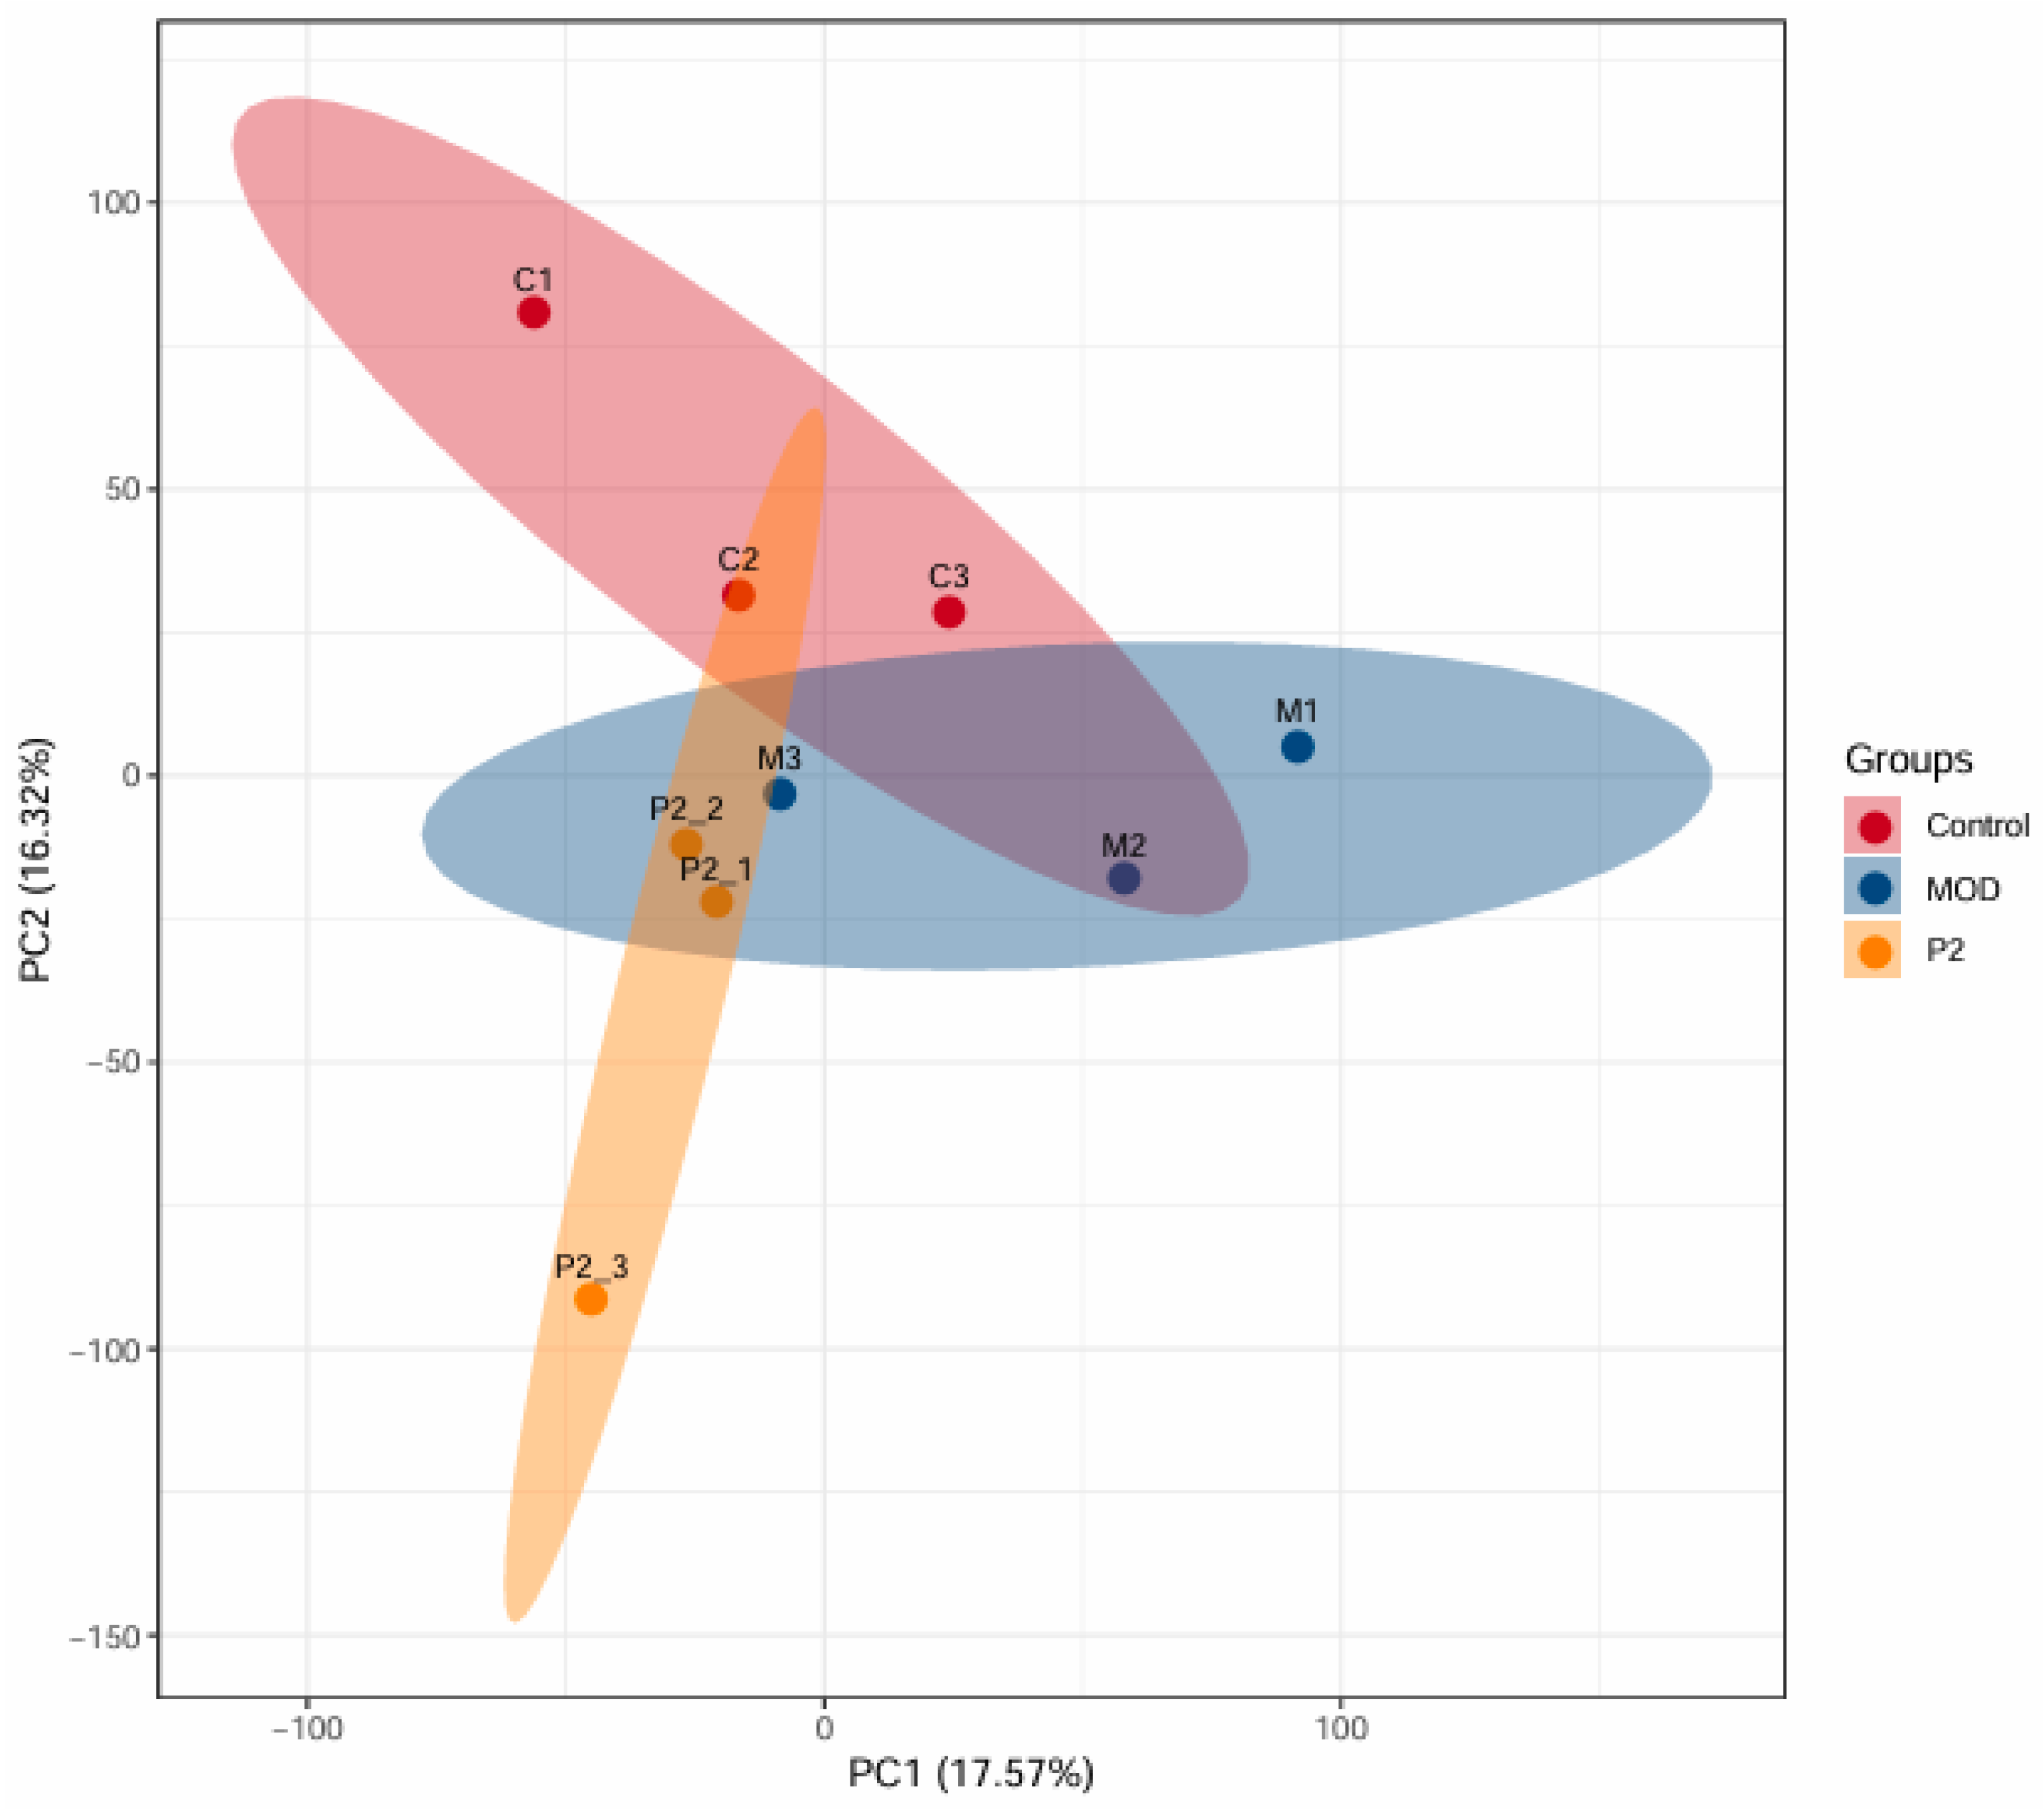
Figure 2.
GO enrichment analysis between healthy cells (control) and insulin resistant cells (MOD).
Figure 3.
GO enrichment analysis between TYYPPQ treated cells (P2) and insulin resistant cells (MOD).
Figure 3.
GO enrichment analysis between TYYPPQ treated cells (P2) and insulin resistant cells (MOD).
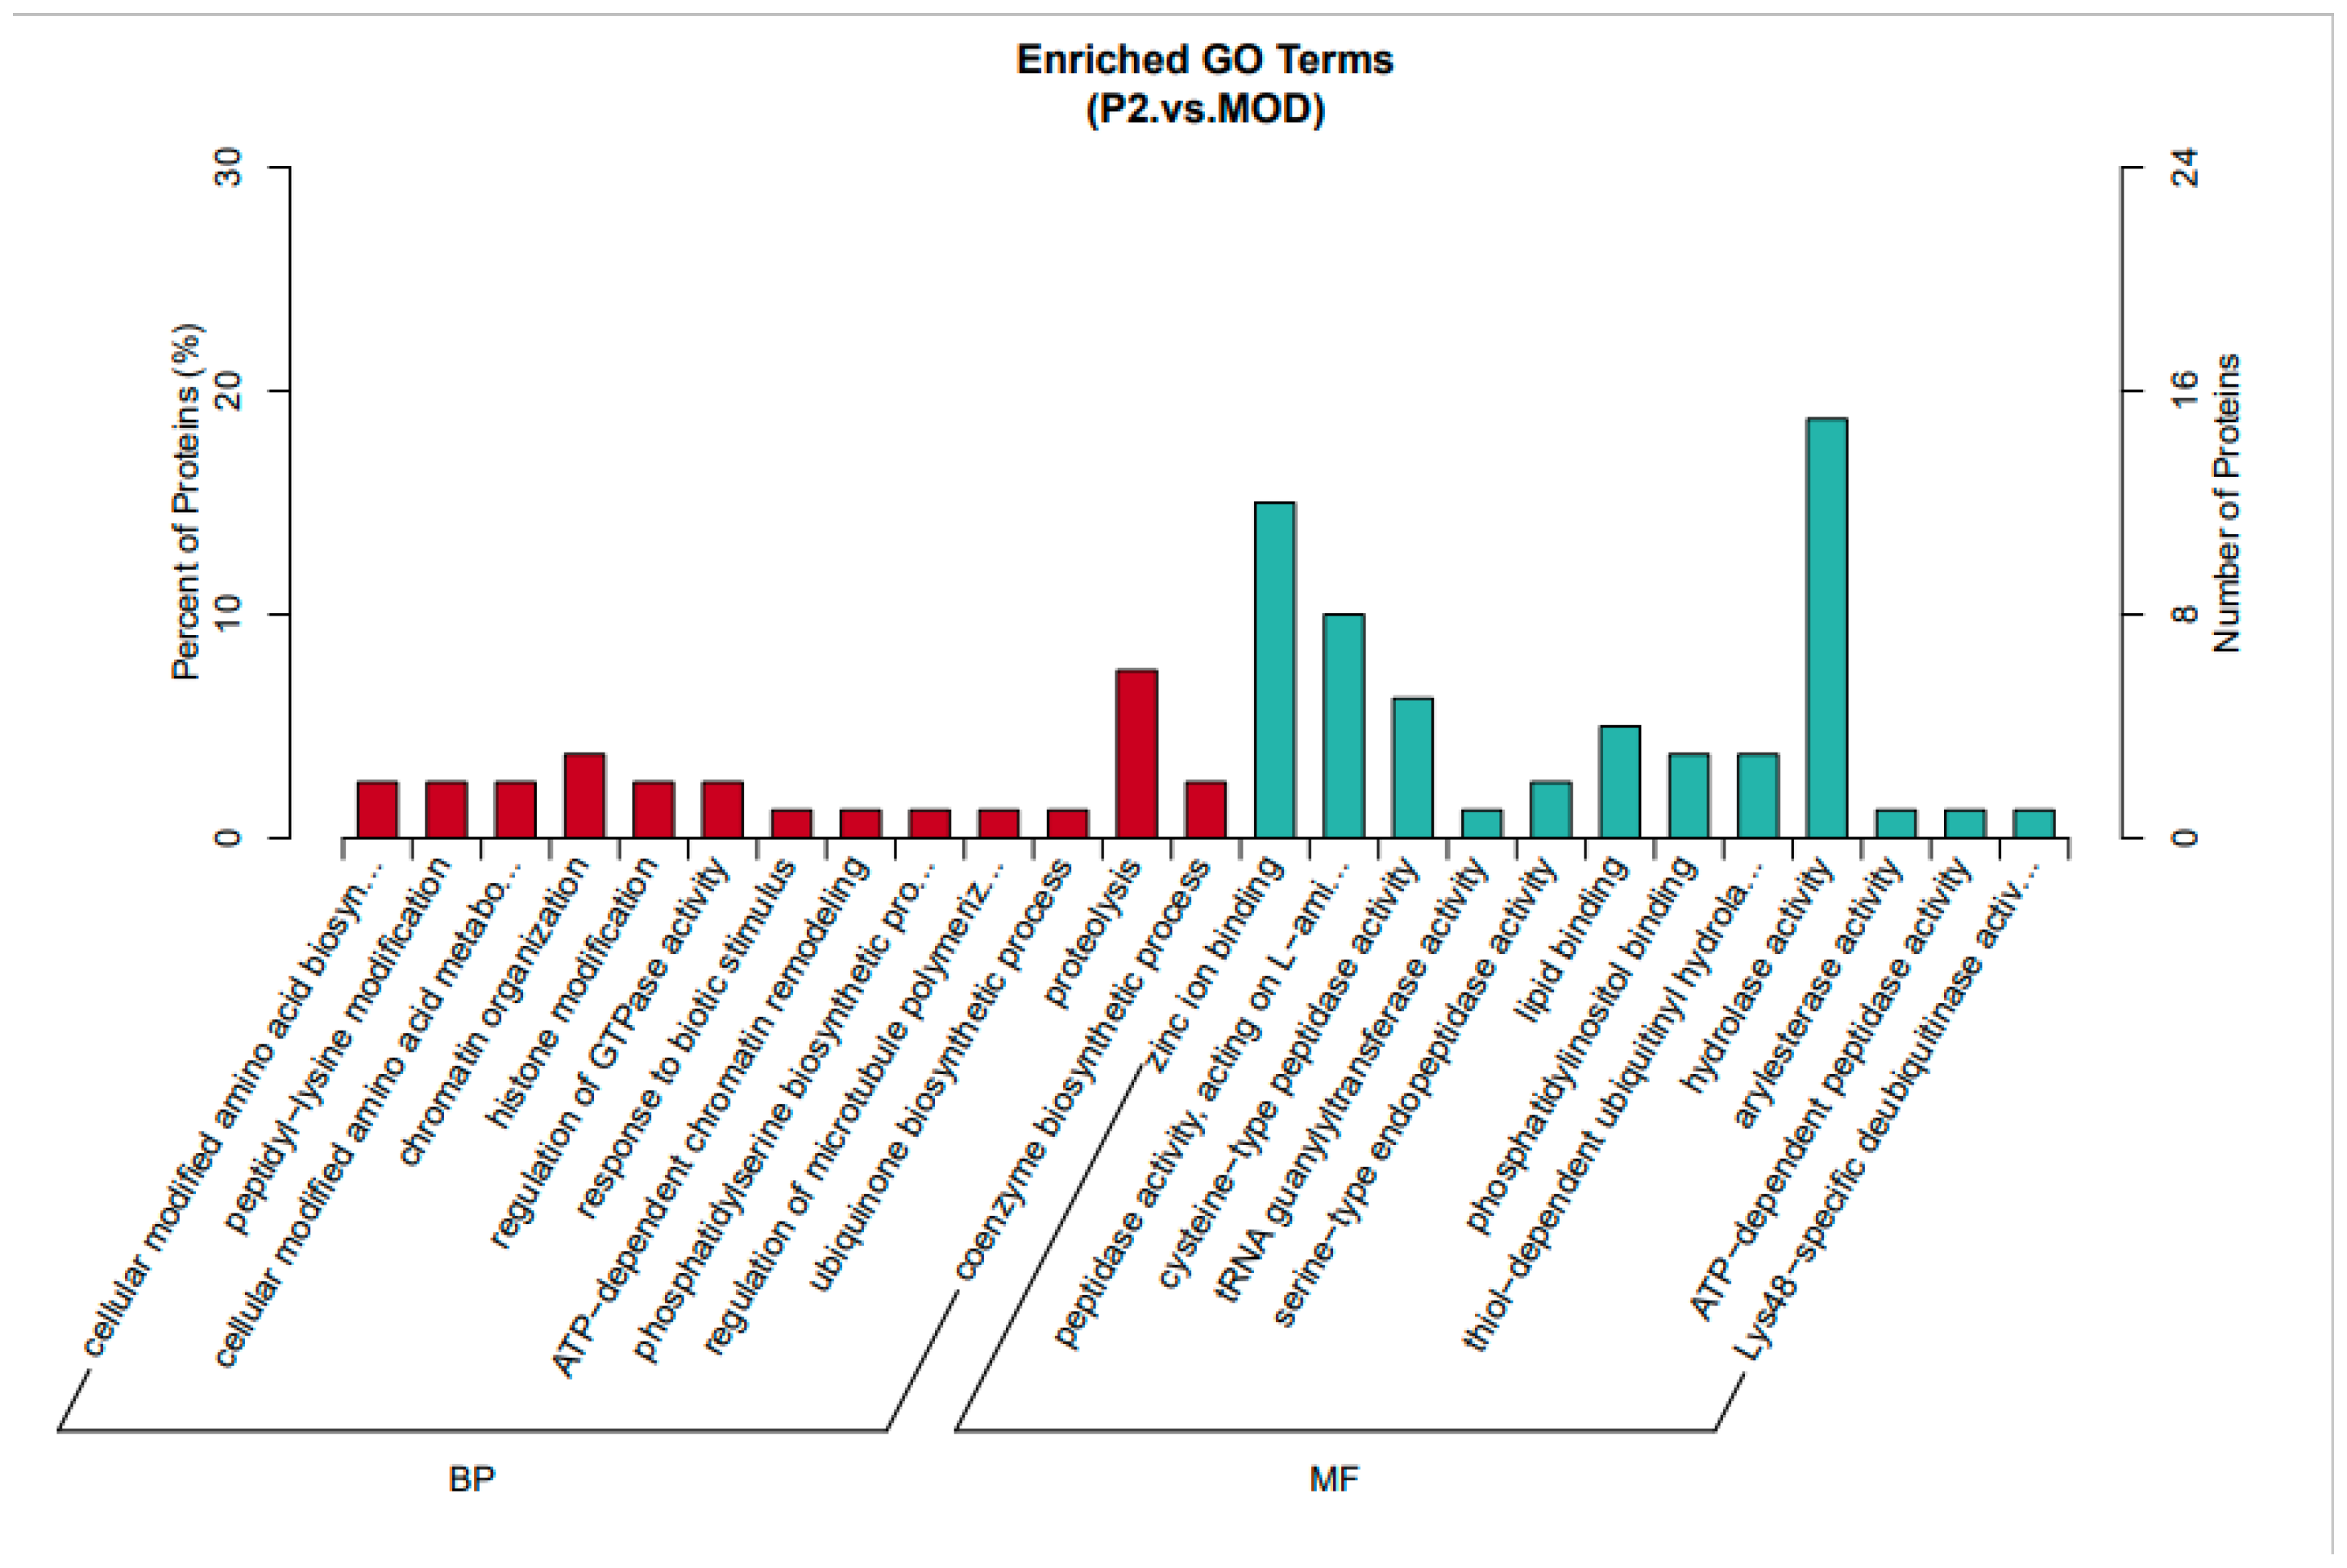
Figure 5.
KEGG pathways enrichment analysis between MOD (insulin cells) and TYYPPQ treated cells (P2).
Figure 5.
KEGG pathways enrichment analysis between MOD (insulin cells) and TYYPPQ treated cells (P2).
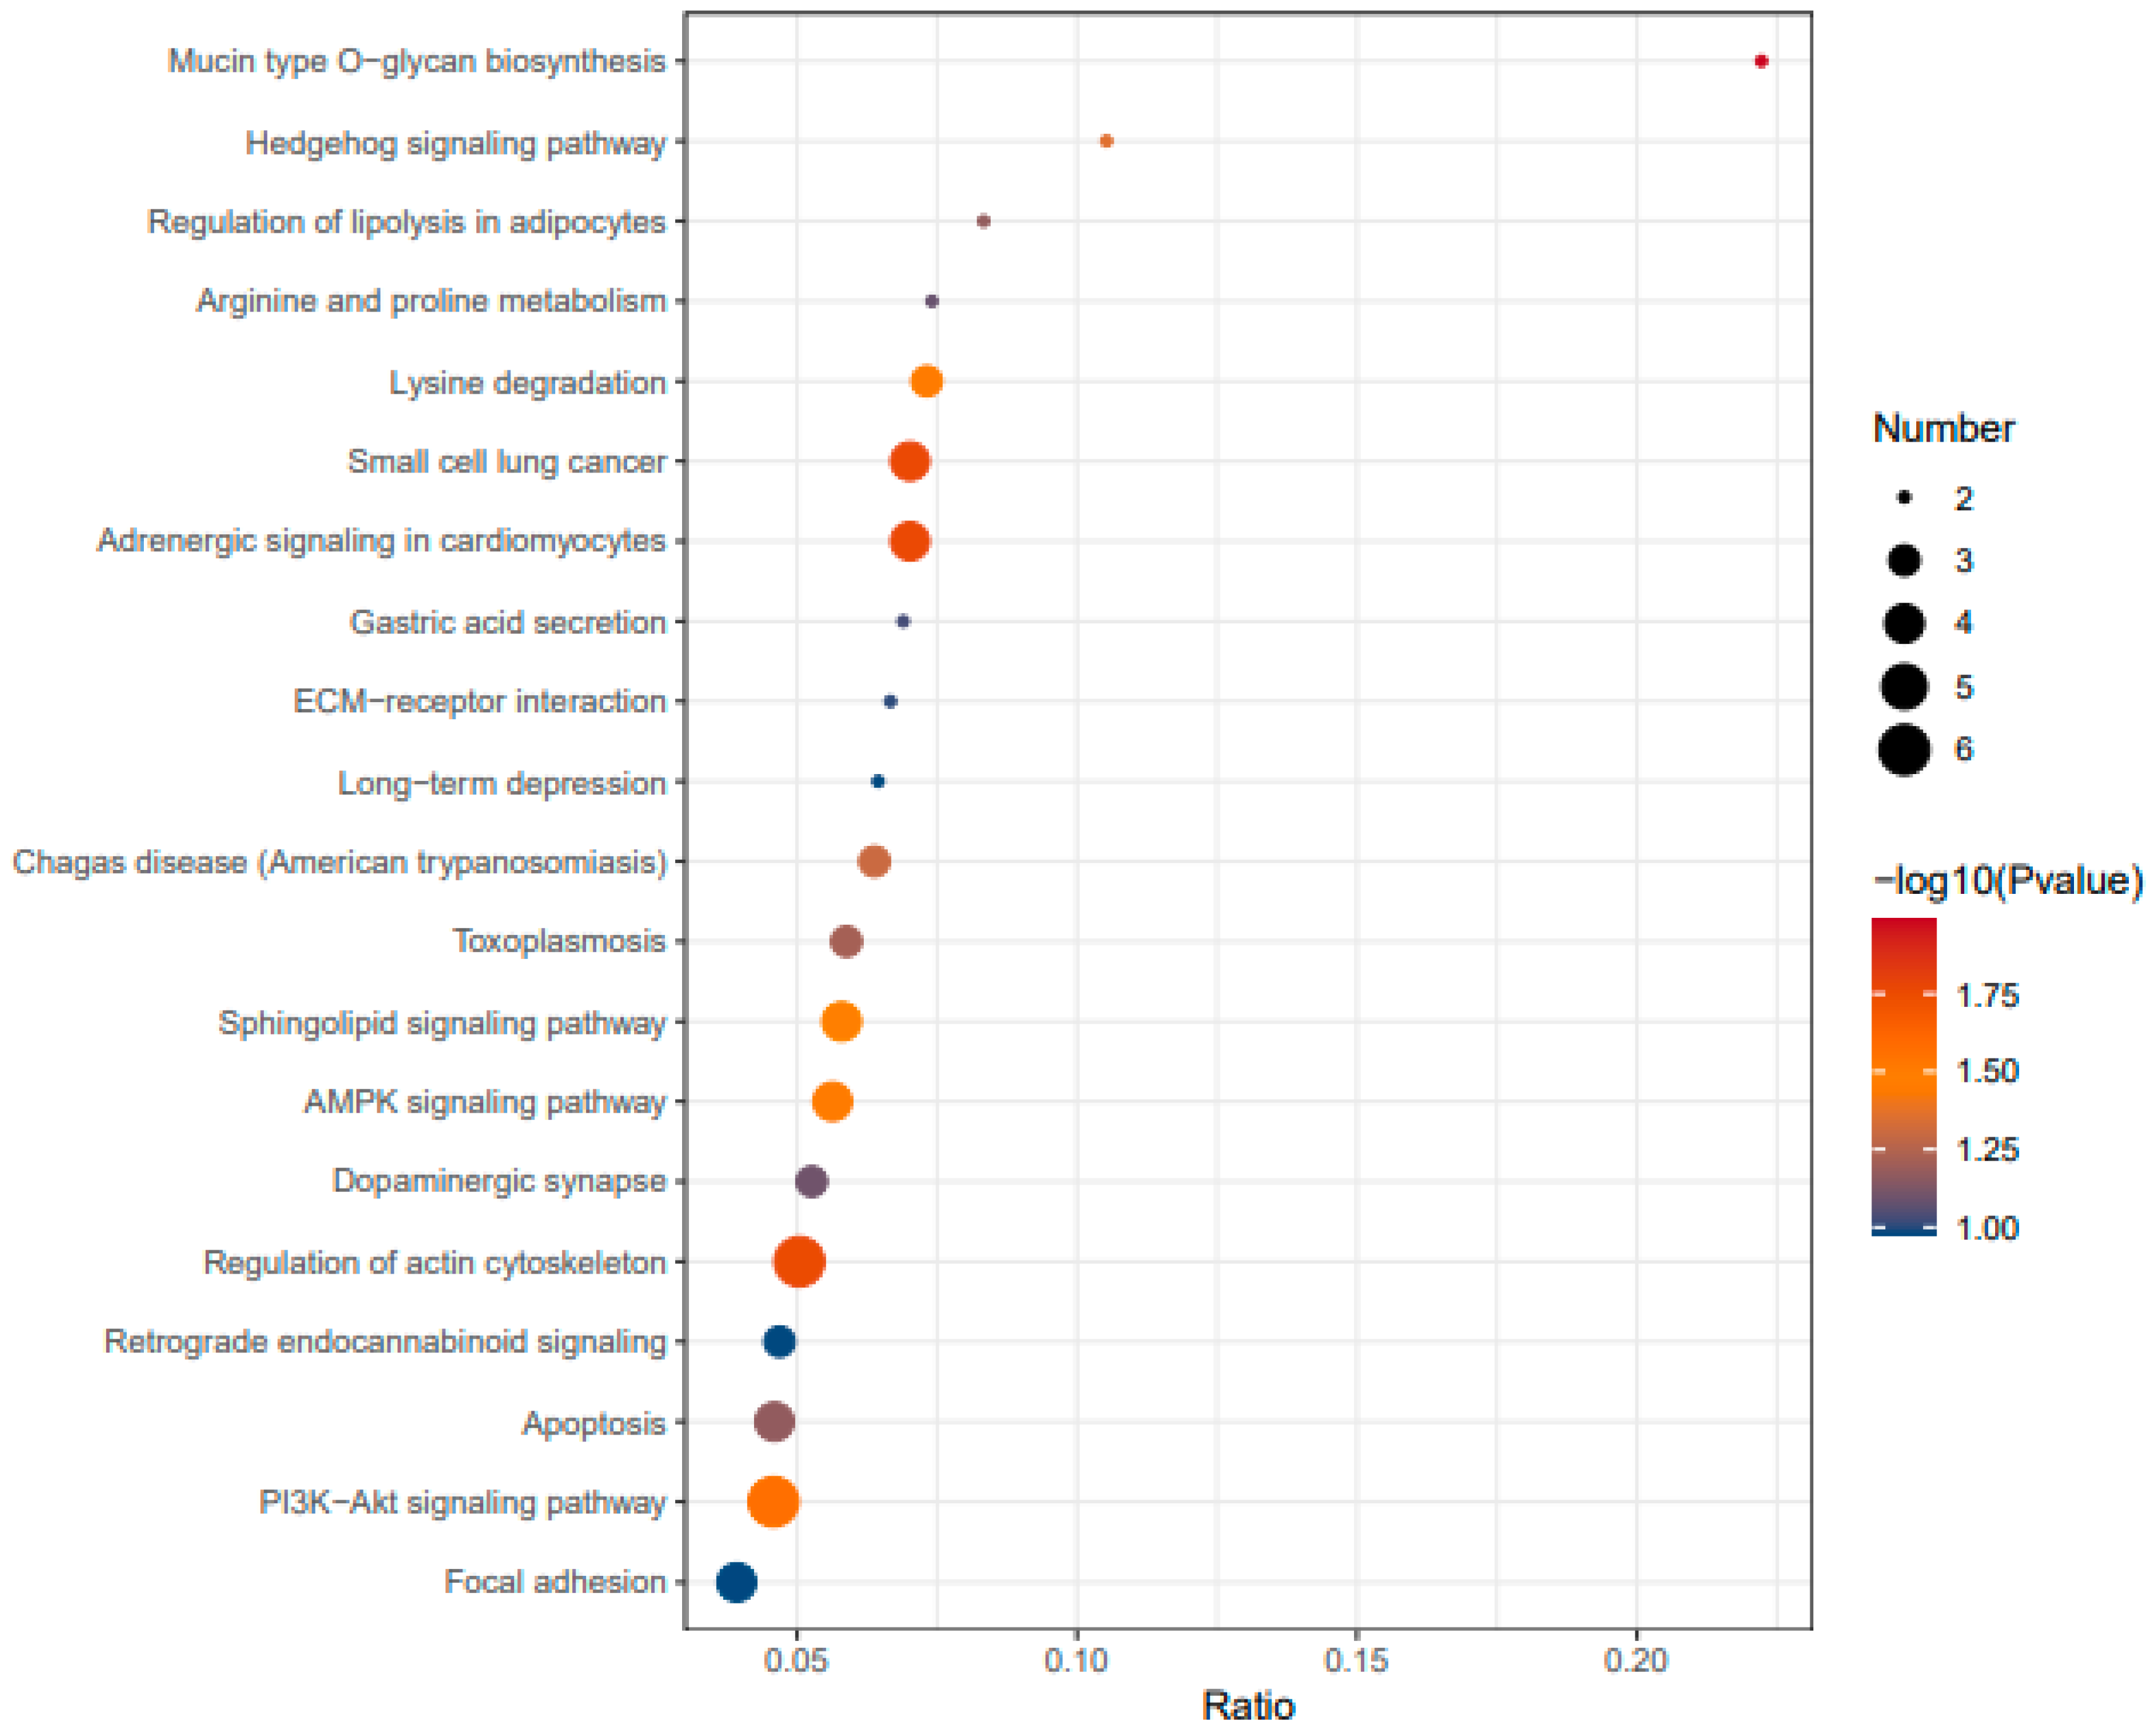
Figure 7.
Domain enrichment analysis between CON (healthy cells) and MOD (insulin cells).
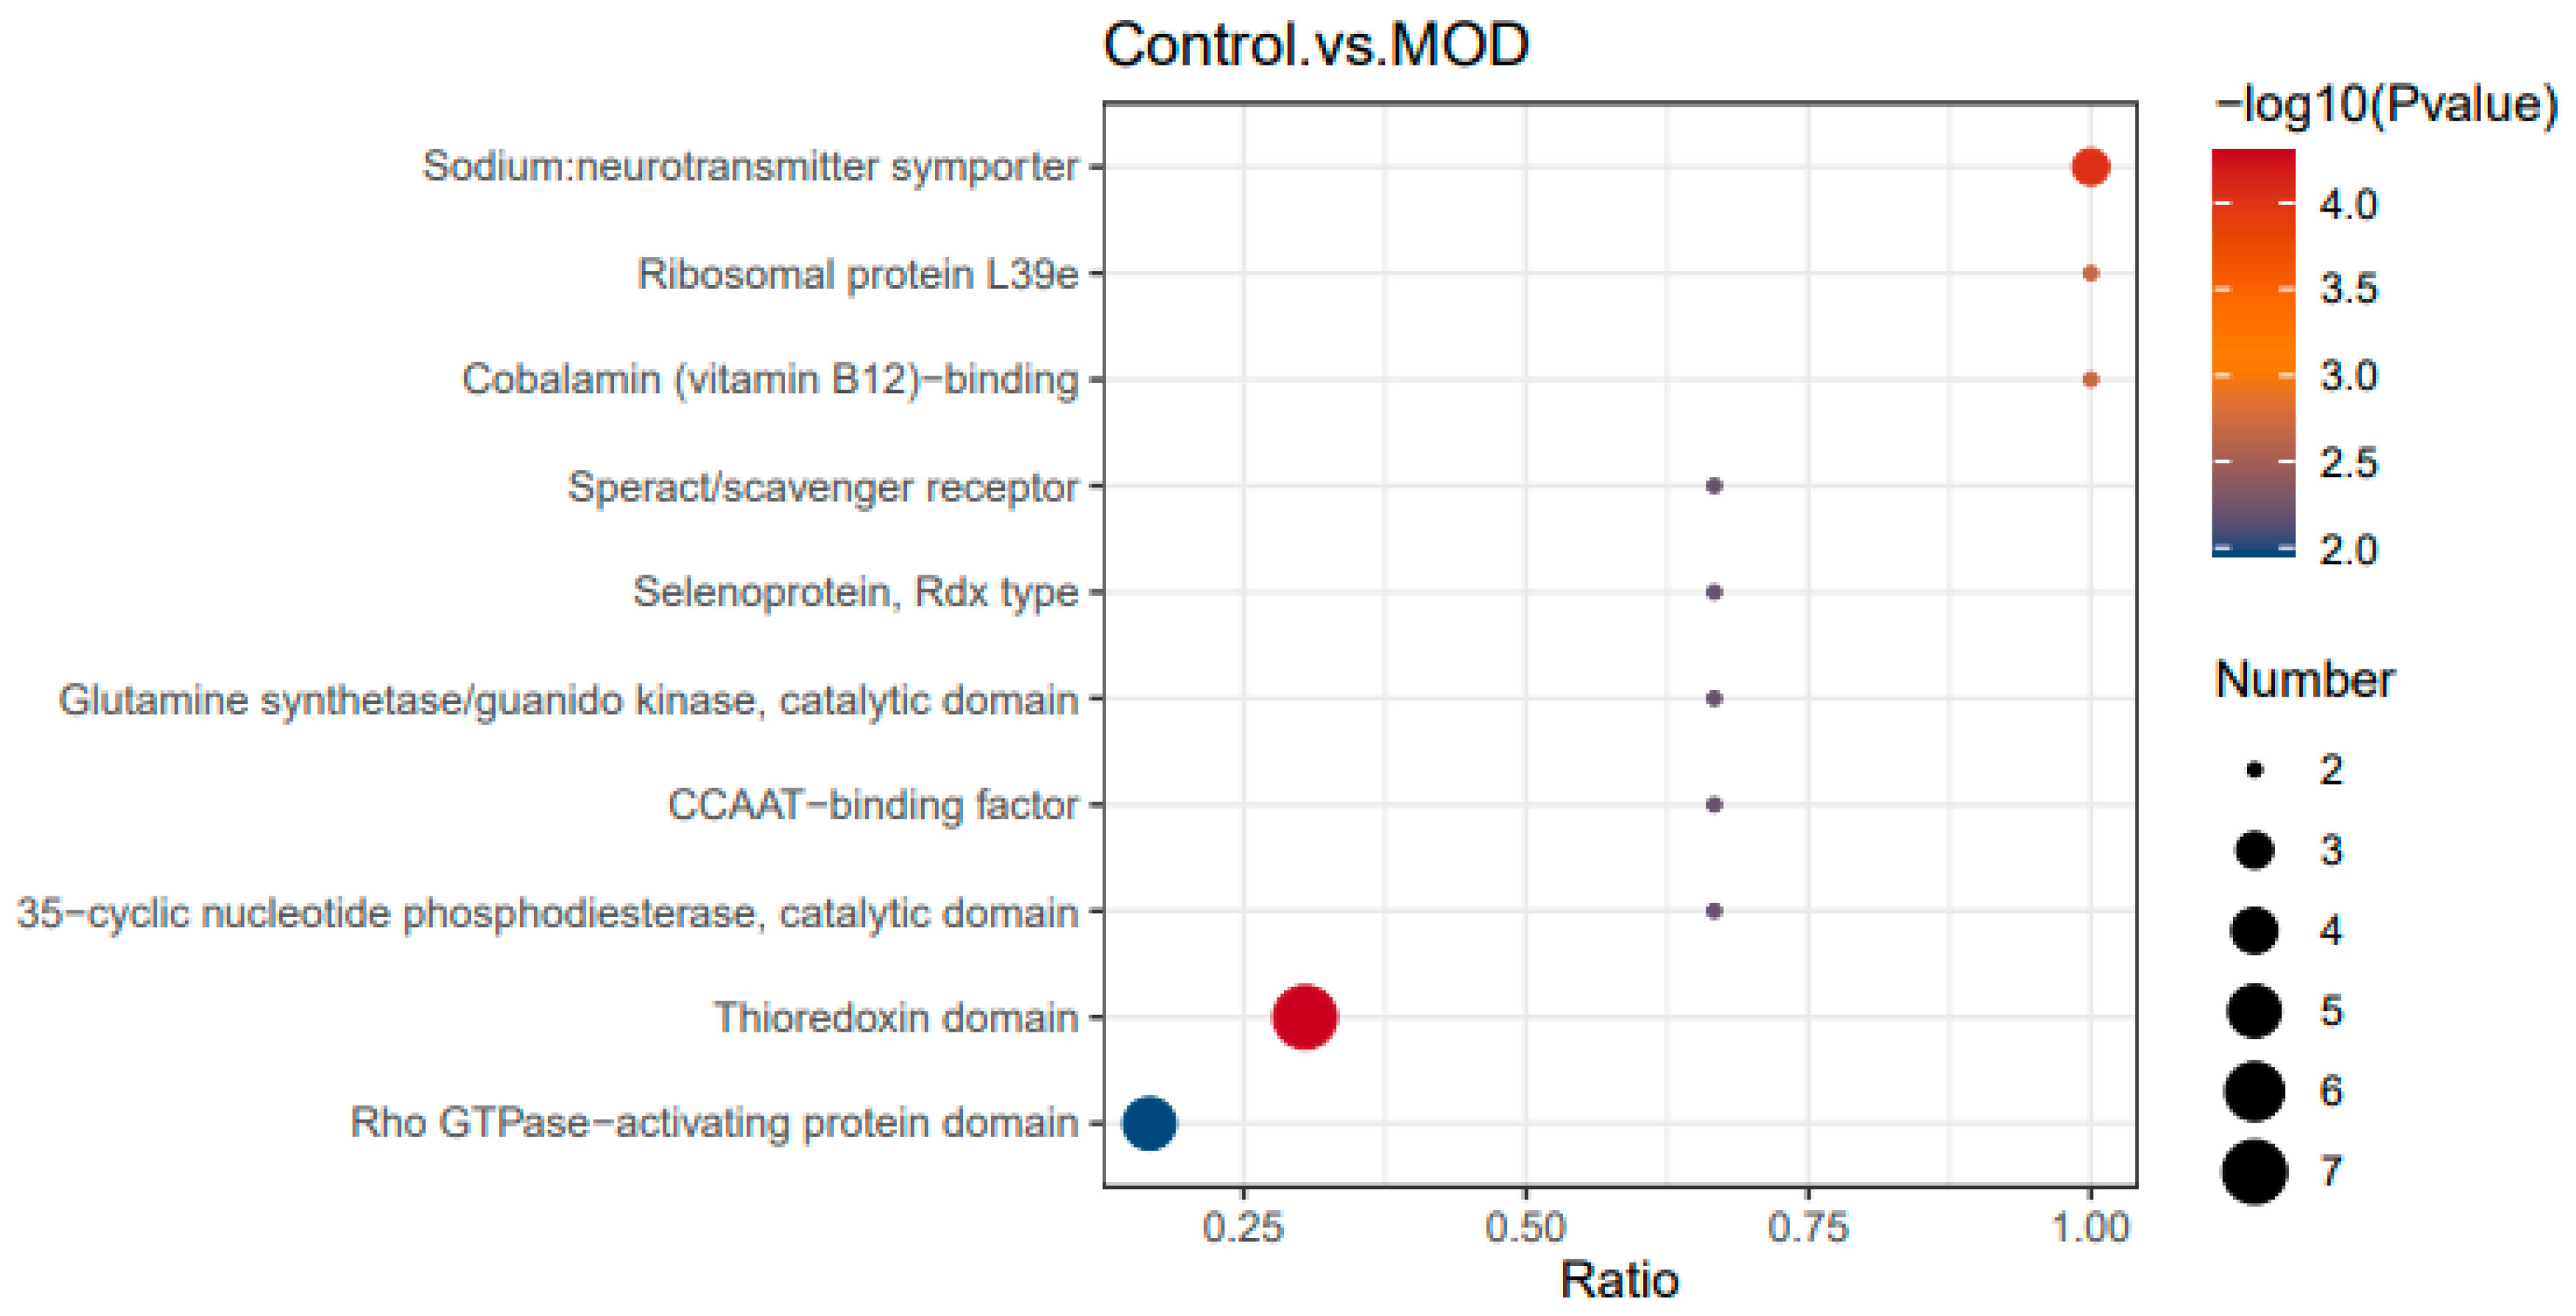
Figure 8.
Domain enrichment analysis between P2 (insulin resistant treated cells) and MOD (insulin cells).
Figure 8.
Domain enrichment analysis between P2 (insulin resistant treated cells) and MOD (insulin cells).
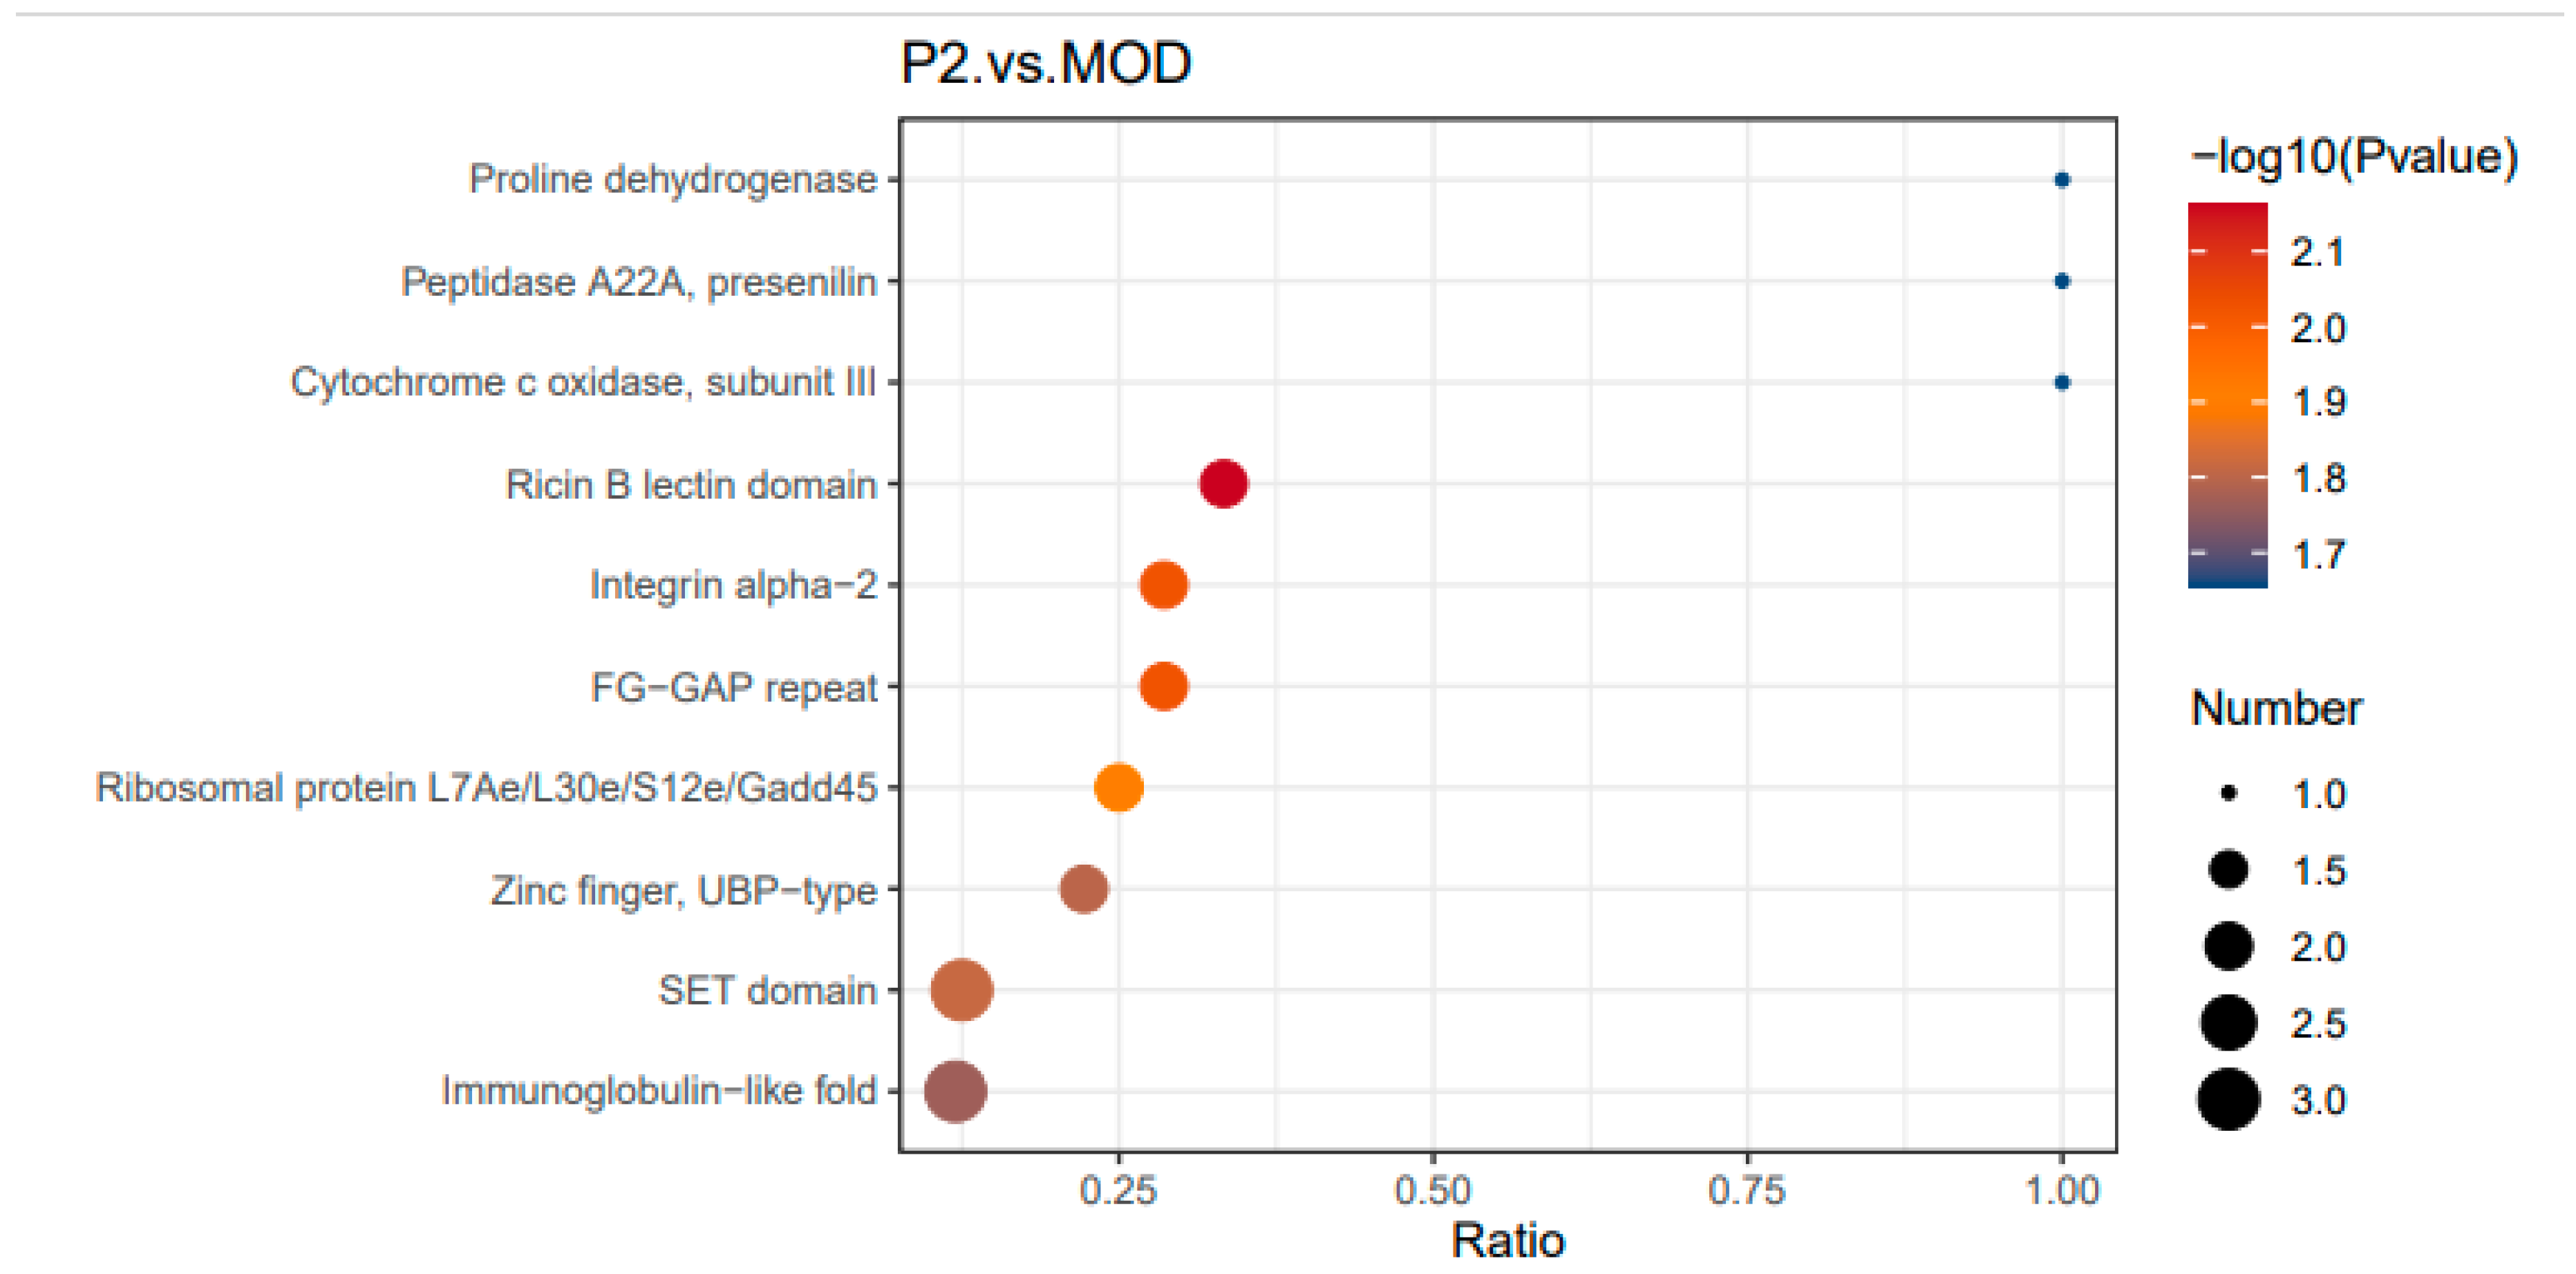
Figure 9.
Protein subcellular localization between healthy cells and insulin resistant cells.


Table 1.
AMPK expression in healthy cells (control), insulin resistant cell (Model) and insulin resistant cells treated with different peptide (Peptide 1, 2, 3, 4) at concentration 100uM.
Table 1.
AMPK expression in healthy cells (control), insulin resistant cell (Model) and insulin resistant cells treated with different peptide (Peptide 1, 2, 3, 4) at concentration 100uM.
| GROUP | AMPK Expression |
|---|---|
| Control | 1.0 ± 0.076 |
| Model | 0.41 ± 0.074 |
| Peptide 1 | 0.35 ± 0.16 |
| Peptide 2 | 0.80± 0.049 |
| Peptide 3 | 0.76 ± 0.16 |
| Peptide 4 | 0.41 ± 0.25 |
Table 2.
Protein Subcellular localization in healthy, insulin resistant and peptide treated insulin resistant cells.
Table 2.
Protein Subcellular localization in healthy, insulin resistant and peptide treated insulin resistant cells.
| Subcellular Location | Control vs MOD (%) | P2 (%) (Peptide Treatment) | Interpretation (P2 MOD) |
|---|---|---|---|
| Nucleus | 35.41 | 32.67 | Slight reduction; suggests transcriptional regulation may be shifting back to a healthier state |
| Cytoplasm | 13.40 | 22.77 ↑ | Increased presence of metabolic and signaling proteins, possibly indicating improved insulin signaling |
| Mitochondria | 7.18 | 10.89 ↑ | Higher mitochondrial protein proportion suggests improved energy metabolism |
| Plasma Membrane | 9.09 | 5.94 ↓ | Some reduction; could indicate fewer stress-related surface proteins or altered receptor expression |
| Endoplasmic Reticulum (ER) | 11.96 | 2.97 ↓ | Significant decrease suggests reduced ER stress and better protein processing. |
| Cytoskeleton | 3.83 | 6.93 ↑ | Increased structural proteins, potentially aiding GLUT4 translocation and glucose uptake |
| Golgi Apparatus | 5.26 | 3.96 ↓ | Slight decrease, indicating potential recovery in protein trafficking |
| Extracellular Proteins | 6.70 | 5.94 ↓ | Small reduction, possibly linked to secretion changes |
| Lysosome | 1.91 | 2.97 ↑ | Increased protein degradation activity, possibly linked to cellular cleanup mechanisms |
| Peroxisome | 1.44 | 0.99 ↓ | Decrease in oxidative stress-related proteins |
| Endosome | 1.44 | 0.99 ↓ | Slight reduction, possibly linked to fewer internalized insulin receptors under improved conditions |
| Centrosome | 0.96 | 2.97 ↑ | Increased centrosome proteins may support improved vesicle trafficking or cellular organization |
| Microsome | 0.48 | - | Disappears after peptide treatment, possibly linked to ER stress reduction. |
Disclaimer/Publisher’s Note: The statements, opinions and data contained in all publications are solely those of the individual author(s) and contributor(s) and not of MDPI and/or the editor(s). MDPI and/or the editor(s) disclaim responsibility for any injury to people or property resulting from any ideas, methods, instructions or products referred to in the content. |
© 2025 by the authors. Licensee MDPI, Basel, Switzerland. This article is an open access article distributed under the terms and conditions of the Creative Commons Attribution (CC BY) license (http://creativecommons.org/licenses/by/4.0/).
Copyright: This open access article is published under a Creative Commons CC BY 4.0 license, which permit the free download, distribution, and reuse, provided that the author and preprint are cited in any reuse.


