1. Introduction
The global surface temperatures have risen by 0.99 °C in the year 2001–2020 compared to 1850–1900 [
11]. The average global surface temperatures are projected to increase by 2.7 °C and 4.4 °C in 2080–2100 compared to 1995–2014 under SSP2-4.5 and SSP5-8.5 scenarios, respectively [
11]. Globally, the impact of climate variability on food security and crop production has been seen as a major concern [
6]. Both Asia and Africa have been identified as vulnerable regions to the negative impacts of climate change, with the agricultural sector highlighted as the most vulnerable [
42,
43].
In Africa, climate change is expected to have catastrophic impacts on the agricultural and economic sectors, of which 85 % of agriculture is rainfed and up to 55 % of the continent’s gross domestic product comes from the agricultural sector [
1,
28]. In China, maize has become one of the most important crops for livestock forage, contributing to the production of meat, eggs, and milk [
4]. Agriculture over decades has become one of the largest sectors affected by climate change, and consequently maize production has been impacted in China [
16]. The average temperature increase in Africa between 1991 and 2021 has been recorded at +0.3 °C per decade, which was higher compared to +0.2 °C per decade for 1961–1990 [
43]. This increase in temperature has led to a 34 % decline in agricultural productivity for Africa since 1961, increasing the risk of food insecurity [
43]. In Asia, the average temperature was estimated to be +0.86 °C above the 1981–2010 average and +1.41 °C above the 1961–1990 period [
42]. Precipitation levels were also recorded as below normal in the Western Asia sub-region, contributing to reduced agricultural production [
42].
Future climate projections in Kenya based on downscaled GCM data from CMIP5 under RCP4.5 show an increase in precipitation and temperature ranging by 7–48 % and 1–7 °C, respectively, for 2020–2100 [
10,
25]. Meanwhile, an average precipitation and temperature increase of 17.5 % and 0.84 °C in Northwest China by the 2030s relative to the 2000s under RCP4.5 has been projected, which may have varying impacts on maize yields [
45].
Northwest China is the most vulnerable area, with low precipitation for crop growth and higher temperature risks, similar to many regions in Kenya. Kenya’s over-dependence on rainfed agriculture has influenced food security both directly and indirectly, a situation magnified by the changing climate [
21,
38]. In Kenya, agriculture is one of the key pillars of the economy, contributing approximately 26 % to GDP and supporting 80 % of livelihoods, with the crop sub-sector contributing about 60 % of agricultural GDP [
8]. Rainfall, temperature, climate variability, surface water runoff, and carbon dioxide fertilization have been identified as major climate factors affecting crop production in Africa [
35]. As a result of projected increases in precipitation and temperature levels in Northwest China [
49], various future climate scenarios have recorded an increase in mean annual maize yield under RCP4.5 and RCP8.5 of 2.51 % and 2.3 %, respectively, while a decrease under RCP2.6 of 2.07 % was noted for 2021–2050 relative to 2012–2015 [
19]. Adaptation is therefore considered essential to enhance resilience in the agricultural sector and reduce food insecurity risks, since agriculture is a major source of livelihood for rural communities in Africa [
33].
In Kenya, adaptation strategies vary across farm levels and include crop management (changing cultivars and planting dates suitable for new climates) and conservation agriculture (irrigation, soil management, and soil water conservation) [
2,
15,
25]. Adapting to climate change in Northwest China under increasing temperature and heat-wave conditions will require efficient water resource use [
30,
36]. Maize adaptation measures in China include delaying sowing dates to avoid heat stress during grain filling and using heat-resistant hybrid cultivars [
3].
There are still limited studies comparing climate change impacts and adaptation measures on crop yield in Africa and vulnerable areas in China. In this study, we used the CERES-Maize model (DSSAT v4.7) to simulate and compare maize yield under future climate change scenarios based on different adaptation measures in both Nakuru County (Kenya) and Northwest China for the 2030s (2021–2040) and 2050s (2041–2060), relative to the baseline (1986–2005), under RCP4.5 and RCP8.5 scenarios.
2. Results
2.1. Impact of future climate change on maize yield in Nakuru County, Kenya
2.1.1. Model Calibration in Nakuru County, Kenya
Six set of genetic cultivar coefficients at each site were obtained with appropriate modelling results compared with observed data in Nakuru County, Kenya. The NMRSE for flowering period, maturation period and maize yield for all the six maize cultivars ranged between 0.8 to 9.0 % which is considered excellent. The predicted deviation values for all the six maize cultivars in regard to the difference between simulated and observed flowering period, maturation period and maize yield ranged between -10.0 to 9.6 %. In conclusion, the CERES-Maize model was able to simulate grain yield under various agricultural management strategies and soil conditions, which suggests that this model could be applied in Kenya (
Table S5).
2.1.2. Changes in the Major Meteorological Elements in 2030s and 2050s in Nakuru County, Kenya
According to
Table S4, the projected changes in temperature, precipitation, and solar radiation relative to the baseline from 1986 to 2005 were analysed under two climate change scenarios RCP4.5 and RCP8.5 at 6 study sites in Nakuru County (Fig. S1), during the future periods of 2030s and 2050s. The results showed that the mean temperature was expected to increase by a range of 0.58 to 1.48 °C and 1.07 to 3.35 °C in 2030s and 2050s, respectively, under RCP8.5, which was higher than that under RCP4.5. The annual average precipitation was projected to increase in the future periods under both scenarios, with a higher increase under RCP8.5 compared to RCP4.5. Solar radiation was expected to decrease by a range of -2.82 to -8.05% and -1.74 to -7.84% for the 2030s and 2050s, respectively, under RCP8.5, which was a further decrease compared to RCP4.5.
2.1.3. Impact of Future Climate Change on Maize Phenology by 2030s and 2050s
The phenological duration from sowing to flowering in days, one of the important phenological indicators, was listed in Fig.S4 based on six different genetic coefficient parameters under future climate change scenarios. The modelling results showed that maize phenology for the six cultivars based on the genetic coefficients under RCP4.5 and RCP8.5 showed a decrease in the number of days to flowering if no adaptation measures were taken (Fig. S4). This decrease was due to the projected increase in temperature and decrease in solar radiation under RCP4.5 and RCP8.5 between 2021 and 2060 (Fig. S4). The reduction in the number of days to flowering was higher under RCP8.5 than RCP4.5 due to differences in CO
2 levels between the two scenarios. The reduction in days to flowering ranged from 1 day under parameter 2 in Molo for 2030s to 13 days under parameter 2 and 3 in Njoro for 2050s under RCP8.5 (Fig. S4). Njoro and Bahati recorded the largest reduction in the number of days to flowering due to the projected rise in mean temperature under RCP4.5 and RCP8.5 (
Table S4). The time-to-maturity of maize, which is the length of the life cycle in days, was compared using six different genetic coefficients and assessed for variation under climate change scenarios. Results showed a decrease in simulated days to maturity, ranging from 3 days under parameter 6 in Molo and parameter 2 in Gilgil in the 2030s to 32 days under parameter 1 and 3 in Molo in the 2050s under RCP4.5, and from 3 days under parameter 1 in Subukia in the 2030s to 34 days under parameter 1 in Molo in the 2050s under RCP8.5 (Fig. S5). The projected warming climate for all study sites in Nakuru County in the 2030s and 2050s under RCP4.5 and RCP8.5 (
Table S4) accelerated crop development and resulted in early flowering and maturity dates (Fig. S4 and Fig. S5). The variation in CO
2 levels between RCP4.5 and RCP8.5 also contributed to a higher reduction in maturation duration for maize under RCP8.5 compared to RCP4.5.
2.1.4. Impact of Future Climate Change on Maize Yield in Nakuru County, Kenya
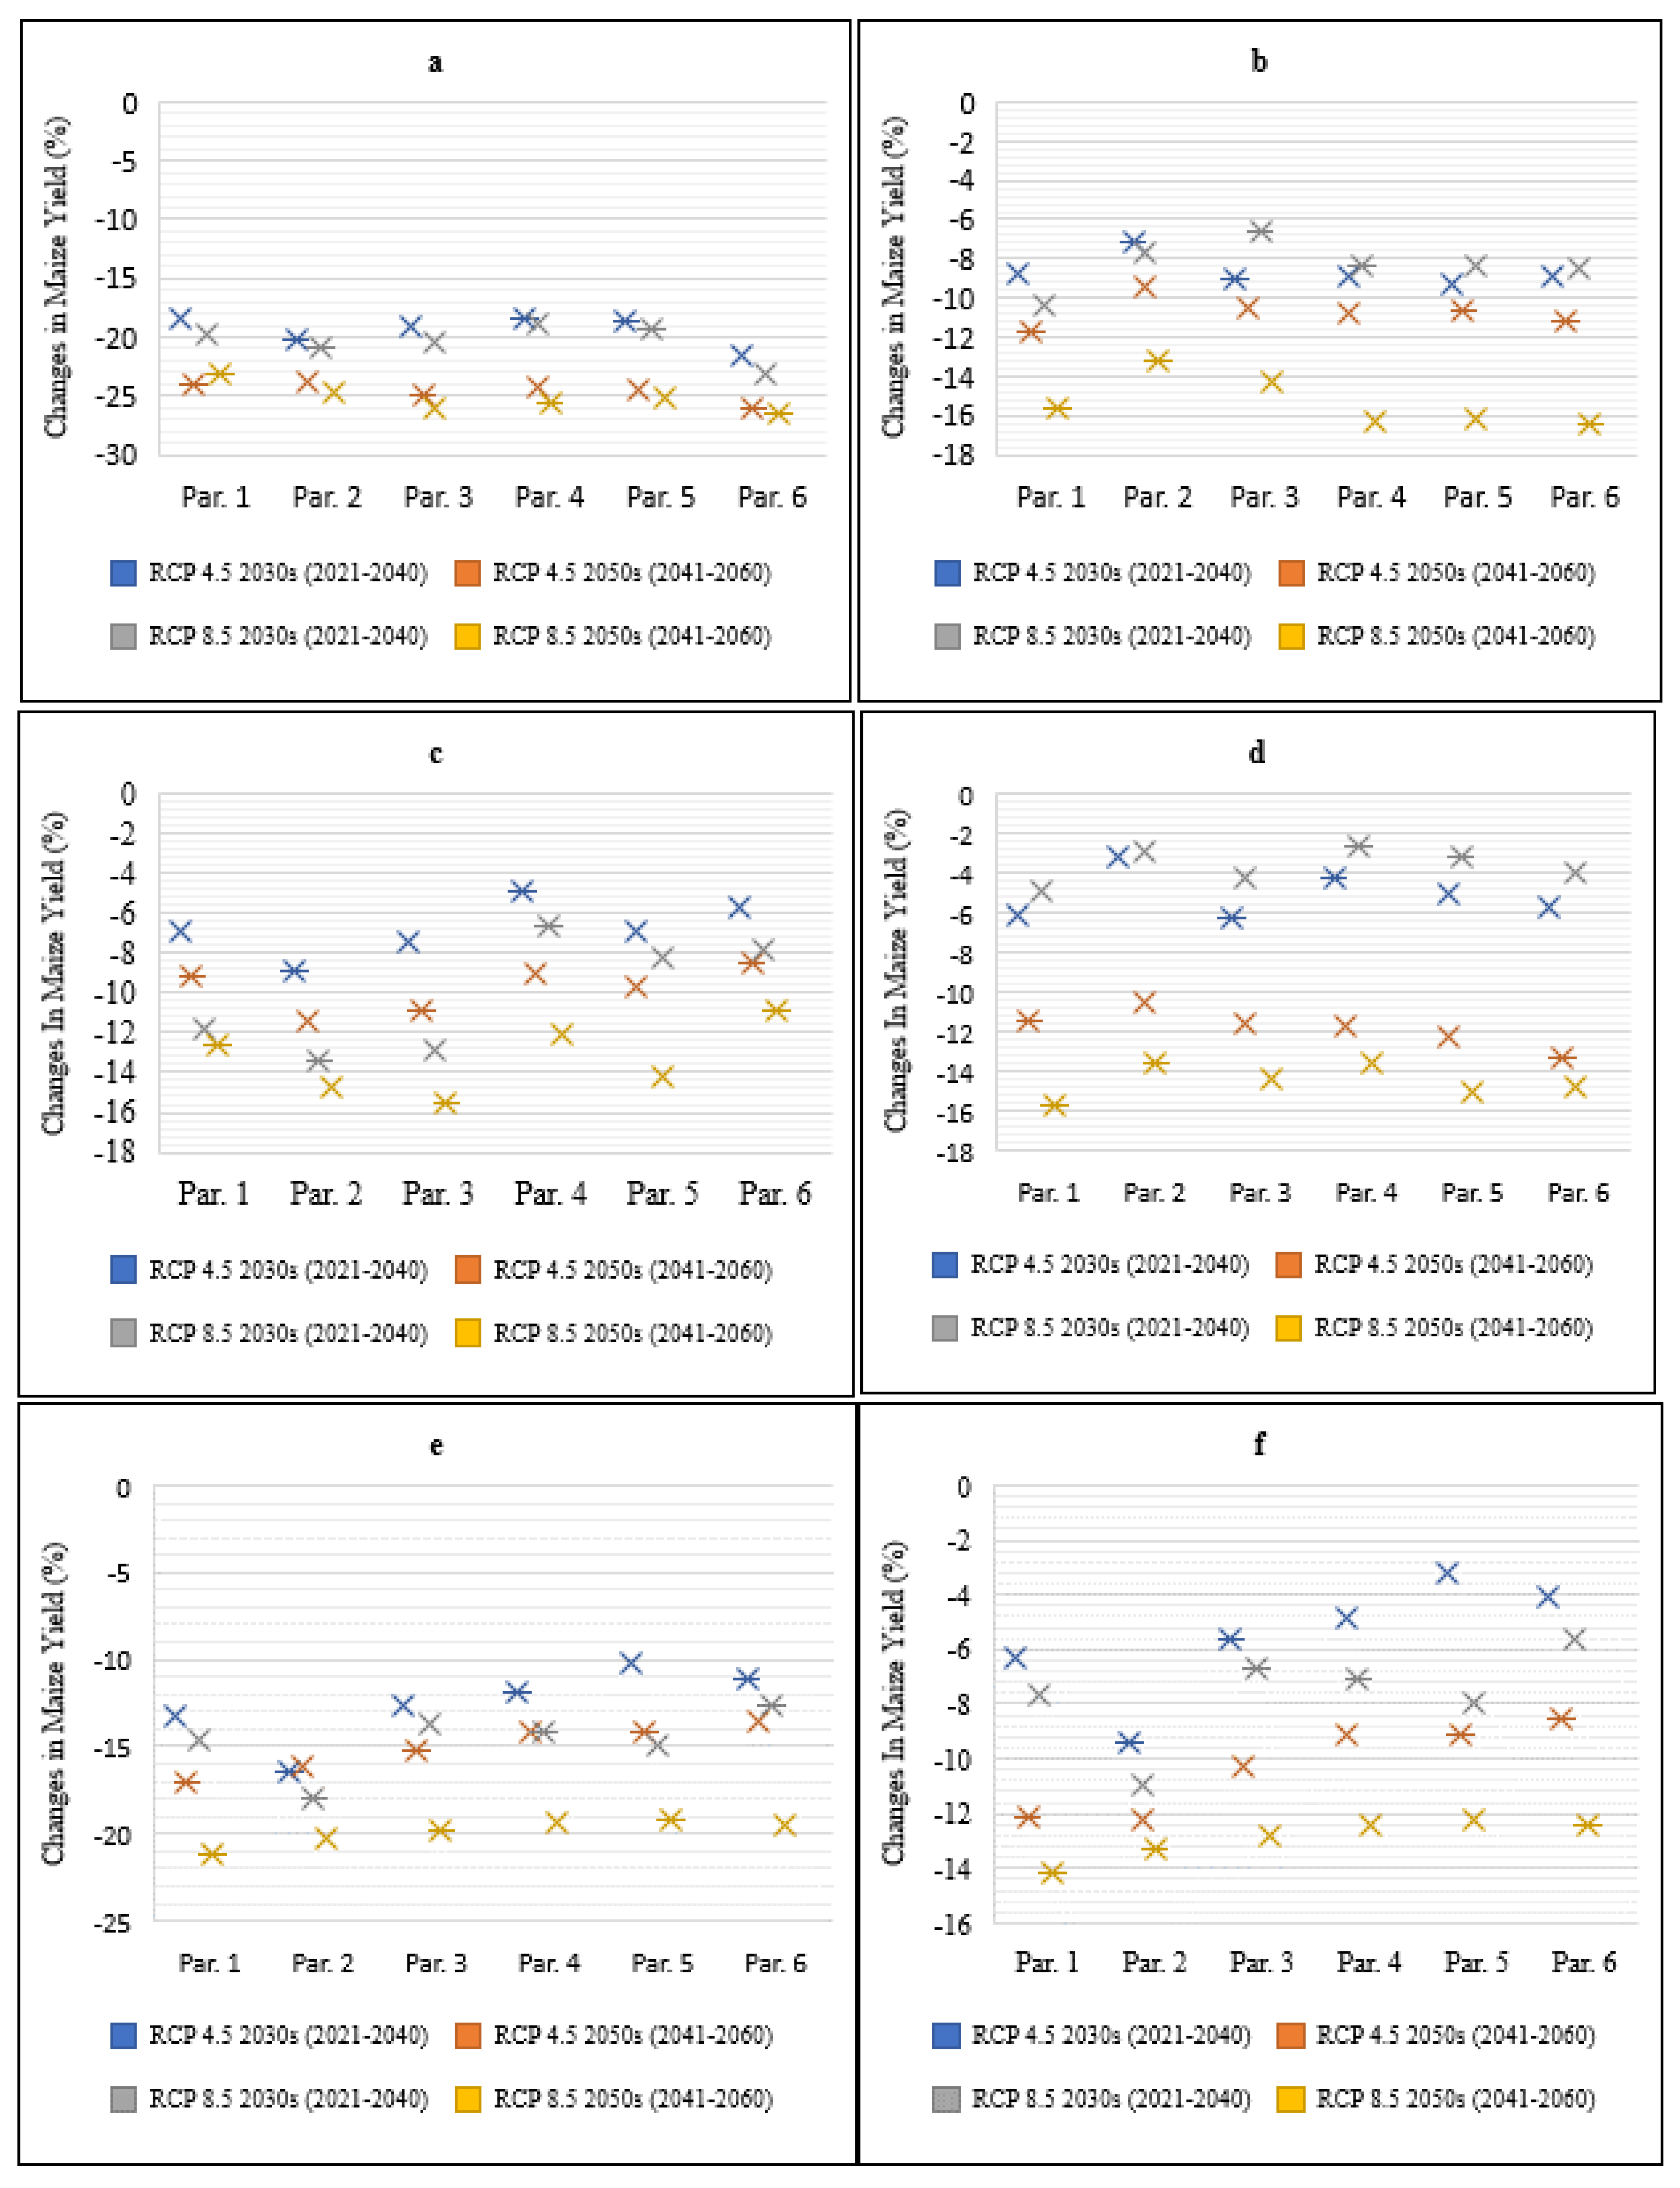
Maize yield percentage changes were calculated based on average maize yields in the 2030s and 2050s for climate change scenarios RCP4.5 and RCP8.5 without considering adaptation measures at six study sites (Fig. 1). The simulation results showed a decrease in mean maize yield, ranging from 3.2 to 26.1 % under RCP4.5 and 2.7 % to 26.5 % under RCP8.5 for the 2030s to 2050s. The highest reductions were recorded under RCP8.5, due to a projected increase in temperature and reduction in solar radiation compared to RCP4.5 since elevated CO2 had no significant impact on maize yield as a C4 plant (Fig. 1).
Figure 1.
Changes in maize yield (%) under future climate scenarios compared to the baseline year (1986-2005) in Kenya. (Notes: 1) Station a~f denotes Bahati, Gilgil, Molo, Naivasha, Njoro and Subukia respectively; 2) Par. 1~6 denotes the six situations with different group of modelling parameters).
2.1.5. Effect of Adaptation Measures on Maize Yield in Nakuru County, Kenya
Effect of Changing Planting Dates on Maize Yield in Nakuru County, Kenya
As shown in (Fig. 1), maize yield would decrease by 0 to 8.1 % if planting dates were advanced by 5 to 15 days under RCP4.5 in the 2030s, while it will increase by 0 to 14.3 % if planting dates were delayed by the same amount, based on different genetic coefficients. The delay of planting dates will result in higher grain yield, as it helps the maize crop avoid thermal stress during key developmental stages. The level of grain yield increase varies based on RCP scenarios (RCP4.5 and RCP8.5) which have varying CO2 levels. In the 2050s, maize yield will decrease by 0 to 12.8 % if planting dates were advanced under RCP4.5, and increase by 0 to 21.4 % if planting dates were delayed, according to (Fig. S7). Under RCP8.5 in the 2030s, maize yield will decrease by 0 to 7.5 % if planting dates were advanced and increase by 0 to 14.9 % if planting dates were delayed, according to (Fig. S8). In the 2050s, maize yield will decrease by 0 to 11.1 % if planting dates were advanced under RCP8.5, and increase by 0 to 24.6 % if planting dates were delayed, according to (Fig. S9).
Effect of Adding Irrigation Practices on Maize Yield
Under an appropriate irrigation practice expressed as with automatic irrigation in the modelling combined with early planting, the maize yield decreased 0 to 7.5 % for the 2030s and 0 to 10 % for the 2050s under RCP4.5 (Fig. S10 & S11) compared to that without these practices. Delaying the planting dates increased the maize yield levels by 13.2 % for the 2030s and 21.9 % for the 2050s under RCP4.5 (Fig. S10 & S11). Under RCP8.5 for the future period 2030s, maize yield decreased by 0 to 13.3 % with early planting and increased by 0 to 14.8 % with delayed planting (Fig. S12). For the future period 2050s under RCP8.5, maize yield decreased by 0 to 8.7 % with early planting and increased by 0 to 21 % with delayed planting (Fig. S13).
Effect of Replacing Cultivar on Maize Yield
The late-maturing maize cultivar H6218 was selected to replace the medium-maturing cultivars H519 and H513 at Njoro and Gilgil sites in Kenya, as it had a longer growing period and a lower decrease in yield compared to the shorter season cultivars under future climate conditions. According to simulations, replacing H519 with H6218 would result in an increase in maize yield by 17 to 22 % under RCP4.5 for the period 2030s and 2050s and by 15 to 14 % under RCP8.5 for the same periods. Similarly, replacing H513 with H6218 would increase the maize yield by 11.9 to 13.9 % under RCP4.5 and by 8.7 to 7.7 % under RCP8.5 for the period 2030s and 2050s. The late-maturing cultivar introduced from the lower altitude site increased the maize yields significantly compared to the local cultivars, as it takes advantage of the increased temperatures. Therefore, more benefits would come from developing high-temperature-tolerant crop cultivars with higher thermal requirements (Fig. S14).
Effect of Adopting Multiple Measures on Maize Yield
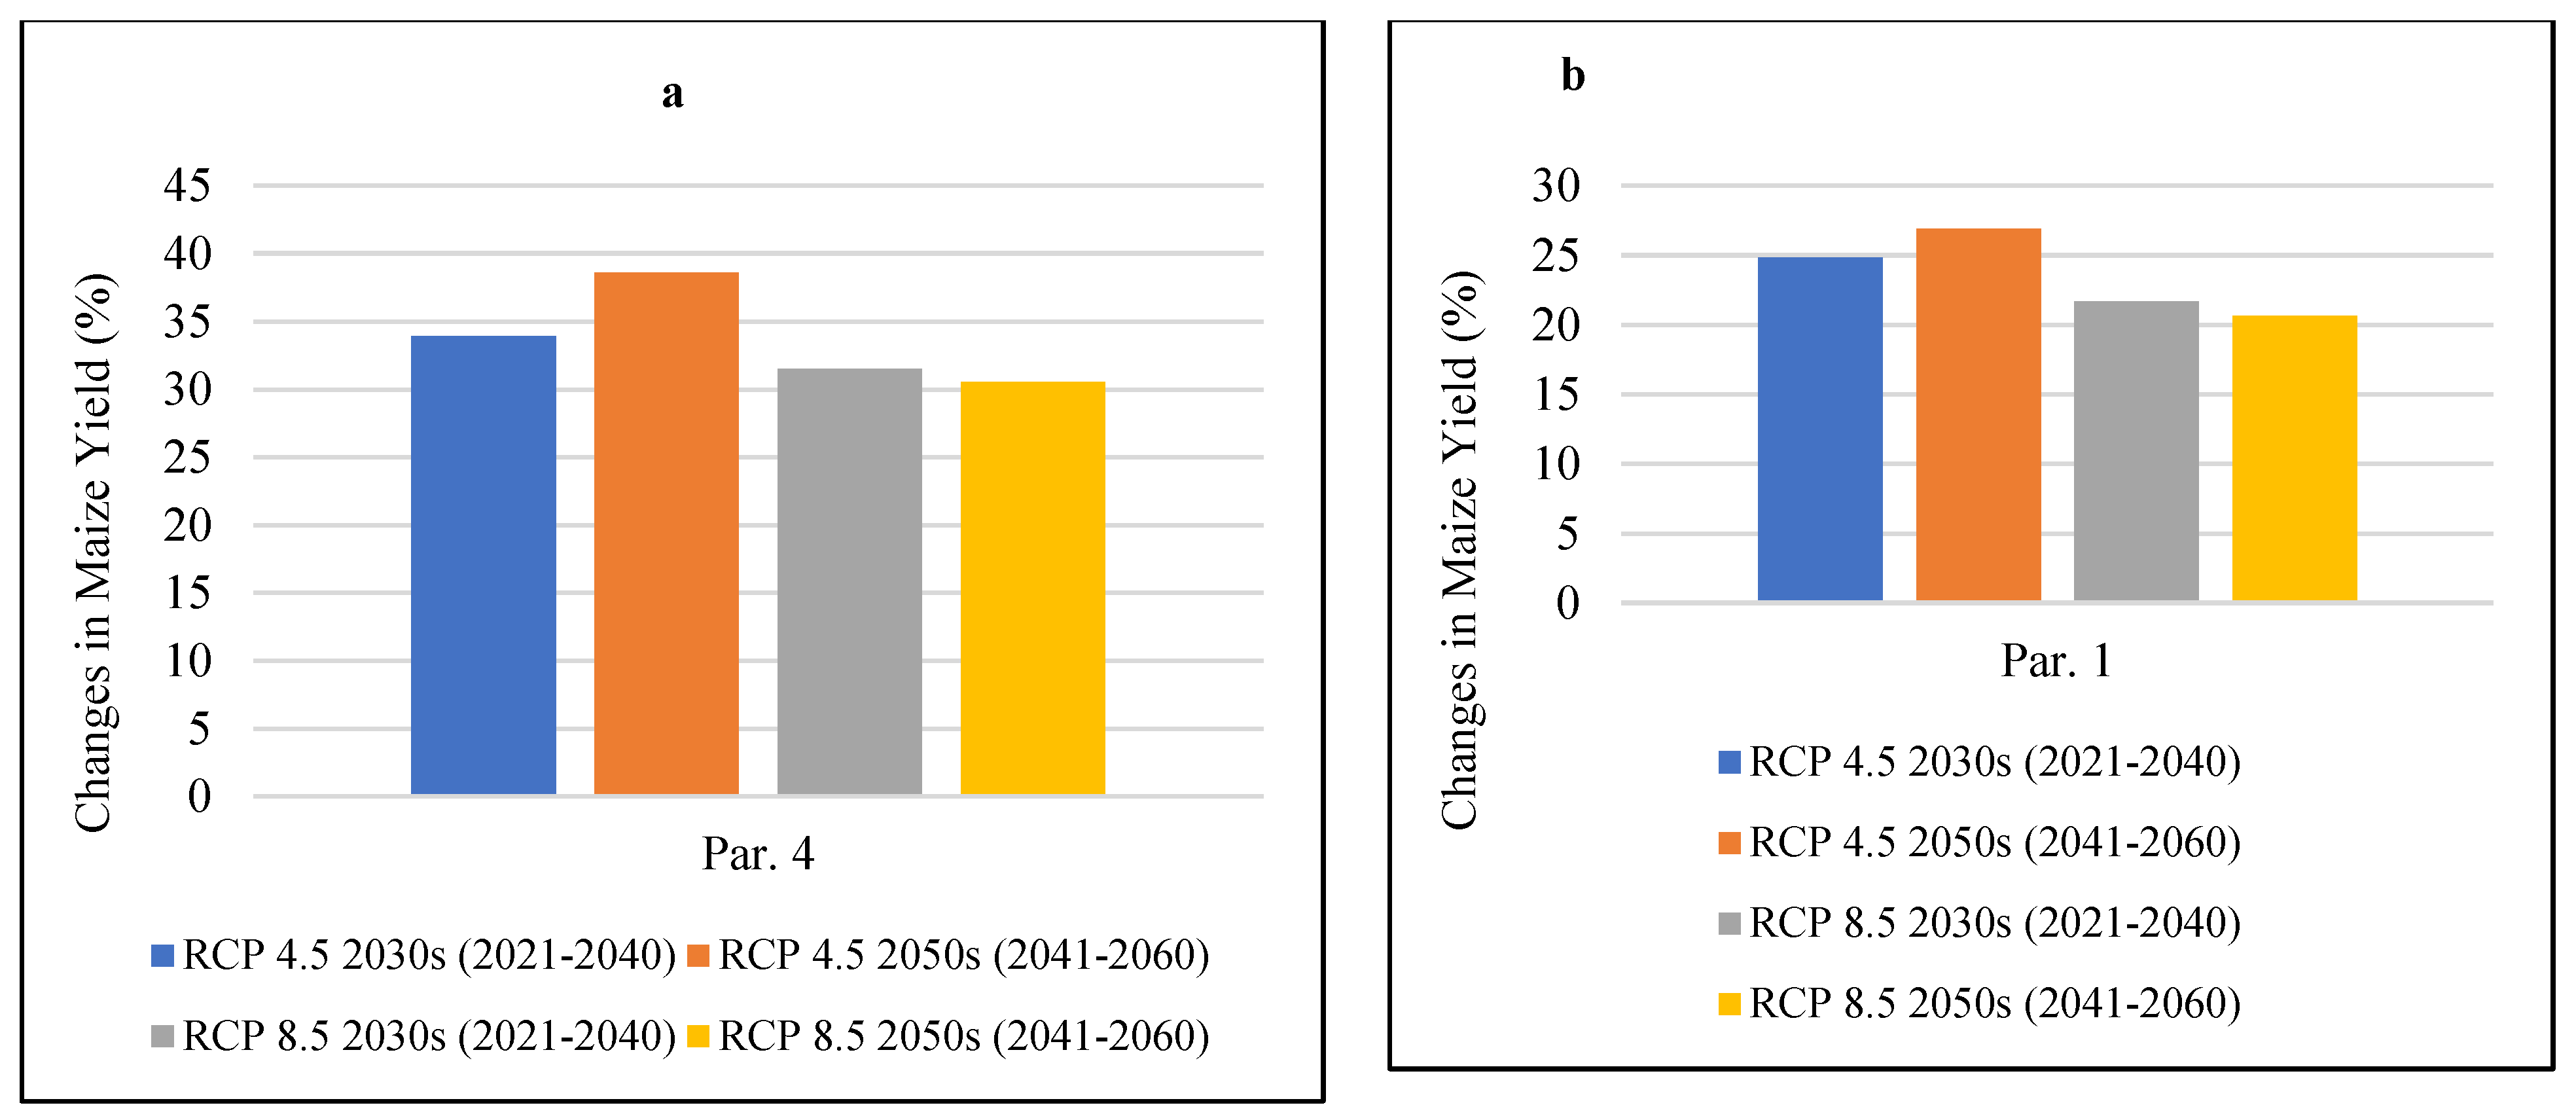
The study found that by adopting early planting dates, appropriate irrigation, and replacing medium maturing maize cultivars (H519 at Njoro and H513 at Gilgil) with the late maturing cultivar H6218, a significant increase in maize yield was projected. The projections showed an increase of 33.9 to 38.6 % in Njoro and 24.9 to 26.9 % in Gilgil under RCP4.5 for the period 2030s and 2050s based on optimal treatment parameters. This demonstrates that adapting planting dates, irrigation practices, and choosing suitable maize cultivars with longer growth periods can exploit the benefits of increased temperatures brought by climate change (Fig. 2).
Figure 2.
Changes in maize yield (%) after adopting early planting, appropriate irrigation and cultivar change with cultivar H6218 under future climate scenarios for Kenya. (Notes: 1) Station a and b denotes Njoro and Gilgil, respectively; 2) Results were based on adoption of all sets of optimal treatment parameters compared with the baseline year (1986-2005).
2.2. Impact of future climate change on maize yield in Northwest China
2.2.1. Model Calibration in Northwest China
Six set of genetic cultivar coefficients at each site in Northwest China were also got with appropriate modelling results versus observed data in Nakuru County, Kenya for each of the maize cultivars. The NMRSE for flowering period, maturation period and maize yield for all the six maize cultivars ranged between 0.7 to 5.9 % which is considered excellent. The predicted deviation values for all the six maize cultivars regarding the difference between simulated and observed flowering period, maturation period and maize yield ranged between -3.4 to 2.0 %. In conclusion, the CERES-Maize model, was able to simulate grain yield under various agricultural management strategies and soil conditions, which suggests that this model could be applied in Northwest China (
Table S7).
2.2.2. Changes in the Major Meteorological Elements in 2030s and 2050s in Northwest China
Table S6 shows projected changes in annual average temperature, precipitation, and solar radiation for six study sites in Northwest China (
Table S6), compared to the baseline (1986-2005), under RCP4.5 and RCP8.5 scenarios for 2030s and 2050s. The projected increase in mean temperature for 2030s and 2050s under RCP4.5 ranged from 1.02 to 1.50 °C and 1.77 to 2.46 °C respectively, and under RCP8.5 from 0.48 to 1.78 °C and 1.93 to 3.26 °C respectively which was higher than RCP4.5, especially for 2050s. The annual average precipitation under RCP4.5 was projected to increase from -0.35 to 24.96 % and 6.07 to 39.49 % for 2030s and 2050s, while under RCP8.5 it was projected to increase from -2.34 to 38.83 % and 12.30 to 54.31 % respectively which was an increase compared to RCP4.5. The solar radiation was projected to decrease from -0.40 to -1.98 % and -0.53 to -2.29 % under RCP4.5 and further decrease to -0.81 to -3.00 % and -1.36 to -3.31 % under RCP8.5 for 2030s and 2050s.
2.2.3. Impact of Future Climate Change on Maize Phenology by 2030s and 2050s
The phenological duration from phenology flowering period of maize under different genetic coefficients and climate change scenarios (RCP4.5 and RCP8.5). Results showed a decreasing trend in the number of days to flowering for the six cultivars if no adaptation measures were taken (Fig. S15). The reduction was due to the projected increase in temperature and decrease in solar radiation as well as higher CO
2 levels under RCP8.5 compared to RCP4.5. The decrease in the number of days to flowering ranged from 1 to 17 days across different regions and parameters. The largest reductions were observed in Hami at 17 days, Yulin at 14 days, and Hetian at 15 days (Fig. S15). The main factor for the large reduction was the projected rise in mean temperature under both RCP4.5 and RCP8.5 (
Table S6). The time-to-maturity, or the length of maize life cycle, was analysed based on six different genetic coefficient parameters to determine the variation under different climate change scenarios (RCP4.5 and RCP8.5). The results showed that the simulated days to maturity for all study sites declined, with the largest reduction ranging from 3 days under parameter 2 in Jingyuan in the 2030s to 34 days under parameter 4, 5, and 6 in Hami in the 2050s under RCP4.5, and from 10 days under parameter 2 and 6 in Hetian in the 2030s to 38 days under parameter 1 in Hami in the 2050s under RCP8.5 (Fig. S16). The declining trend in the time-to-maturity was due to the projected rise in temperature in all study sites in Northwest China (
Table S6), which accelerated crop development, resulting in earlier flowering and maturity dates (Fig. S15 and Fig. S16). The difference in CO
2 levels between RCP4.5 and RCP8.5 also contributed to the decline, with a higher reduction in the maturation duration for maize under RCP8.5 compared to RCP4.5. The highest reduction in maturation duration was recorded in Hami at 38 days under parameter 1 in Xinjiang, in Jingyuan at 28 days under parameter 1 in Gansu, and in Yulin at 22 days under parameter 1, 4, 5, and 6 in Shaanxi.
2.2.4. Impact of Future Climate Change on Maize Yield in Northwest China
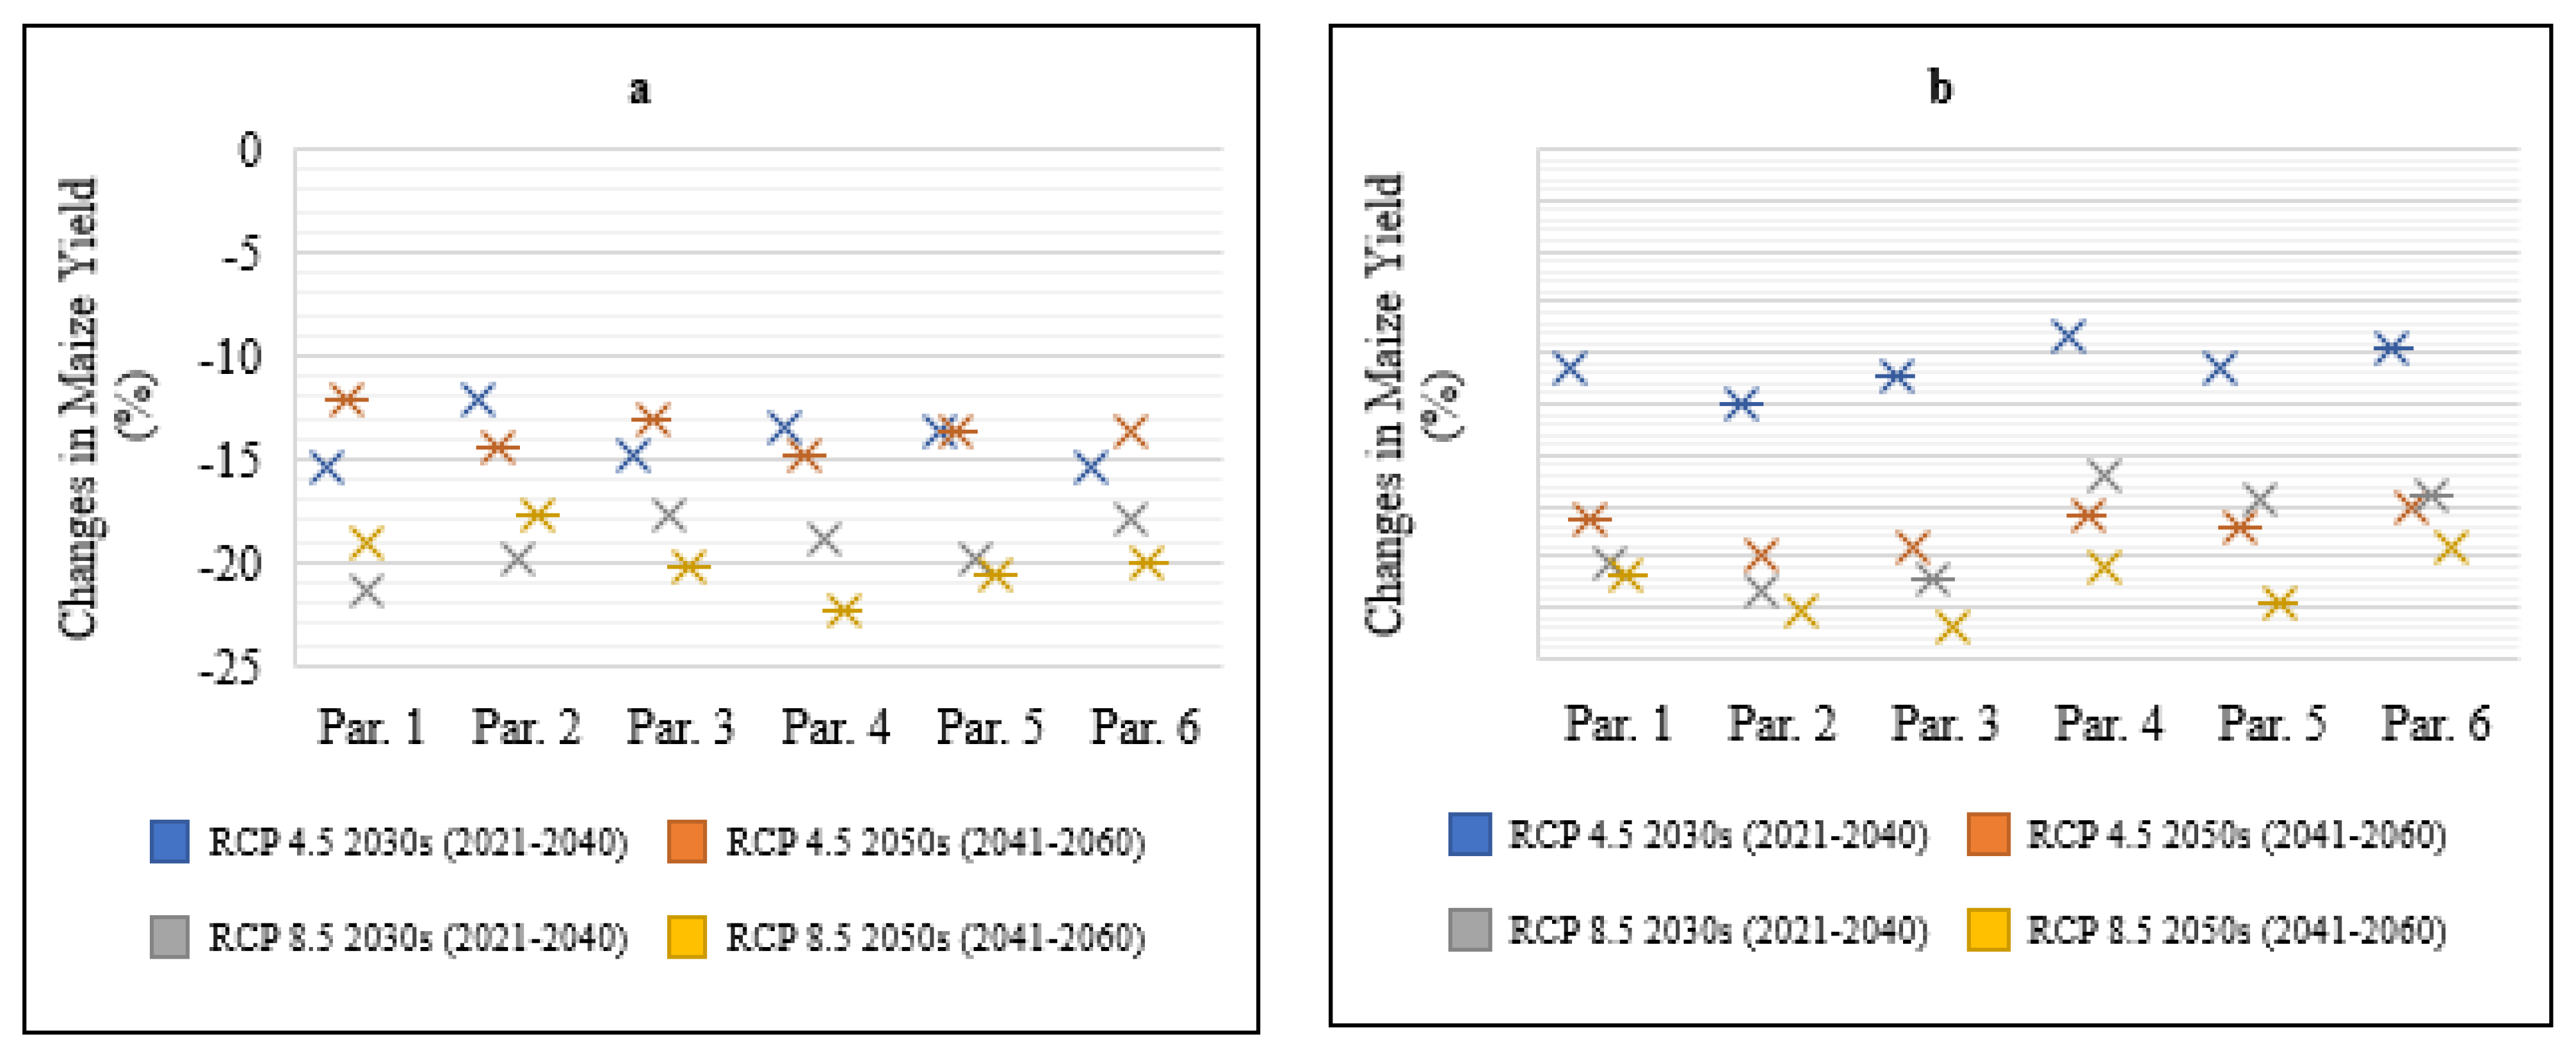
The results of the maize yield simulation showed that there will be a decrease in average maize yield under both RCP4.5 and RCP8.5 future climate change scenarios, ranging from 4.6 % in 2030s to 22.4 % in 2050s under RCP8.5 (Fig. 3). The highest reduction in maize yield was recorded in Hami at 22.4 % in Xinjiang province under parameter 4 and in Jingyuan at 19.3 % in Gansu province under parameter 4. The high reduction in maize yield was attributed to the projected increase in temperature and reduction in solar radiation under RCP8.5 compared to RCP4.5 for the future period 2021 to 2060 (
Table S6). The results showed that elevated CO
2 levels had no significant impact on maize yield, as maize is a C4 plant.
Figure 3.
Changes in maize yield (%) under future climate scenarios compared to the baseline year (1986-2005) in Northwest China. (Notes: 1) Station a~f denotes Bahati, Hami, Changji, Hetian, Jiuquan, Jingyuan and Yulin respectively; 2) Par. 1~6 denote the six situations with different group of modelling parameters).
2.2.5. Effect of Adaptation Measures on Maize Yield in Northwest China
Effect of Adjusting Planting Dates on Maize Yield in Northwest China
The simulation results showed that delaying planting dates by 5 to 15 days under RCP4.5 and RCP8.5 would increase maize yield for the period 2030s and 2050s, as shown in Fig. S17-S20. The maximum increase in yield was up to 18.1 % for RCP4.5 in 2050s, and the maximum decrease in yield was up to 24.5 % for RCP8.5 in 2050s compared to that without changing planting dates, respectively. The results indicated that delaying planting dates would help the maize crop avoid thermal stress during its key developmental stages.
Effect of Adding Irrigation Practices on Maize Yield
Under appropriate irrigation, early planting by 5-15 days showed the decrease in maize yield by 0 to 14.5% (Fig. S21) and 0 to 9.3 % (Fig. S22) under RCP4.5 for the 2030s and 2050s respectively. Meanwhile, delayed planting by 5-15 days would increase maize yield by 0 to 17 % (Fig. S21) and 0 to 19.8 % (Fig. S22) under RCP4.5 for the 2030s and 2050s respectively. Under RCP8.5, early planting decreased maize yield by 0 to 11.7 % (Fig. S23) and 0 to 16.5 % (Fig. S24) for the 2030s and 2050s respectively, while delayed planting increased maize yield by 0 to 17.6 % (Fig. S23) and 0 to 15.9 % (Fig. S24) for the 2030s and 2050s respectively.
Effect of Replacing Cultivar on Maize Yield
Late maturing cultivar Xinyu No.18 with a longer growing period of 153 days was selected to replace medium maturing cultivars SC704 that had a growing period of 139 days at Hami and Shendan No.16 that had a growing period of 149 days at Jingyuan due to its lower yield reduction relative to cultivars at higher latitudes. Xinyu No.18 replaced SC704 and Shendan No.16, increasing maize yield by 13.9 % to 18.6 % under RCP4.5, for the period 2030s and 2050s and 11.5 % to 10.6 % under RCP8.5, for the period 2030s and 2050s based on optimal treatment parameter 3, and 11.4 % to 16.1 % under RCP4.5, for the period 2030s and 2050s and 9.0 % to 8.1 % under RCP8.5, for the period 2030s and 2050s based on optimal treatment parameter 4 (Fig. S25). The late maturing cultivar at a lower altitude, with a longer growing period, benefits from increased temperatures and results in higher yields compared to local cultivars, which are affected and reduce yield. The development of high-temperature-tolerant cultivars with higher thermal requirements would lead to further benefits.
Effect of Adopting Multiple Measures on Maize Yield
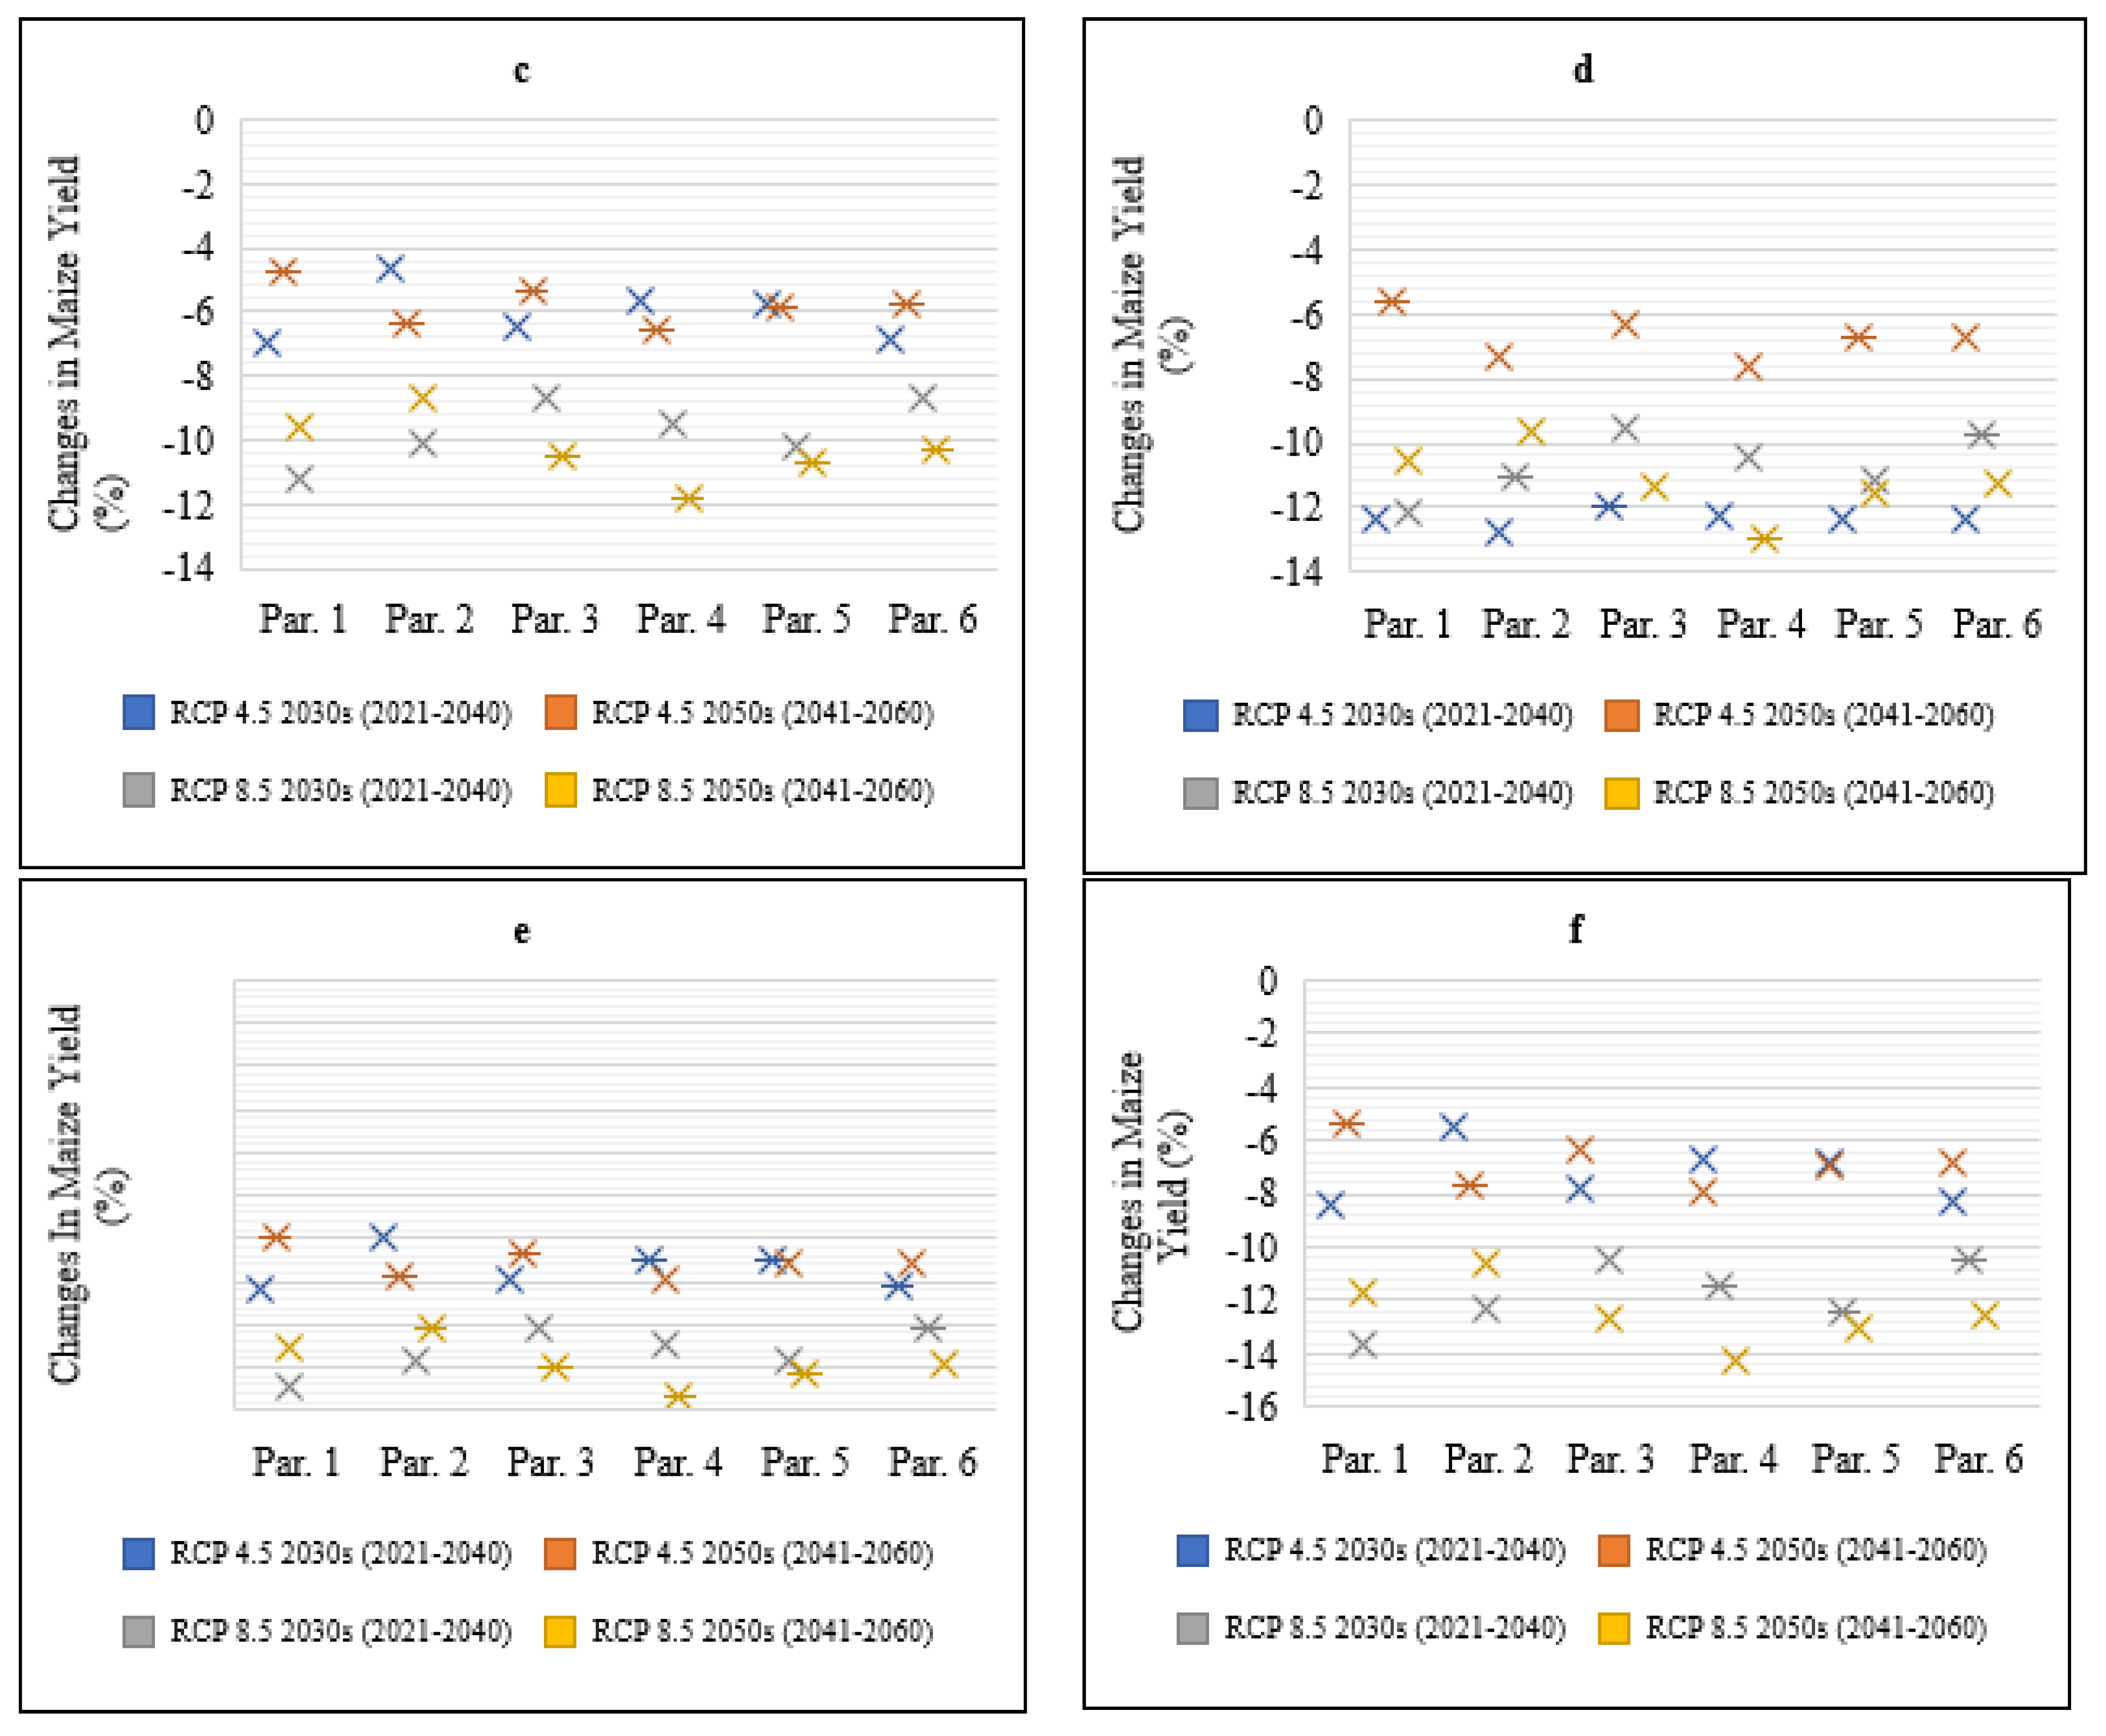
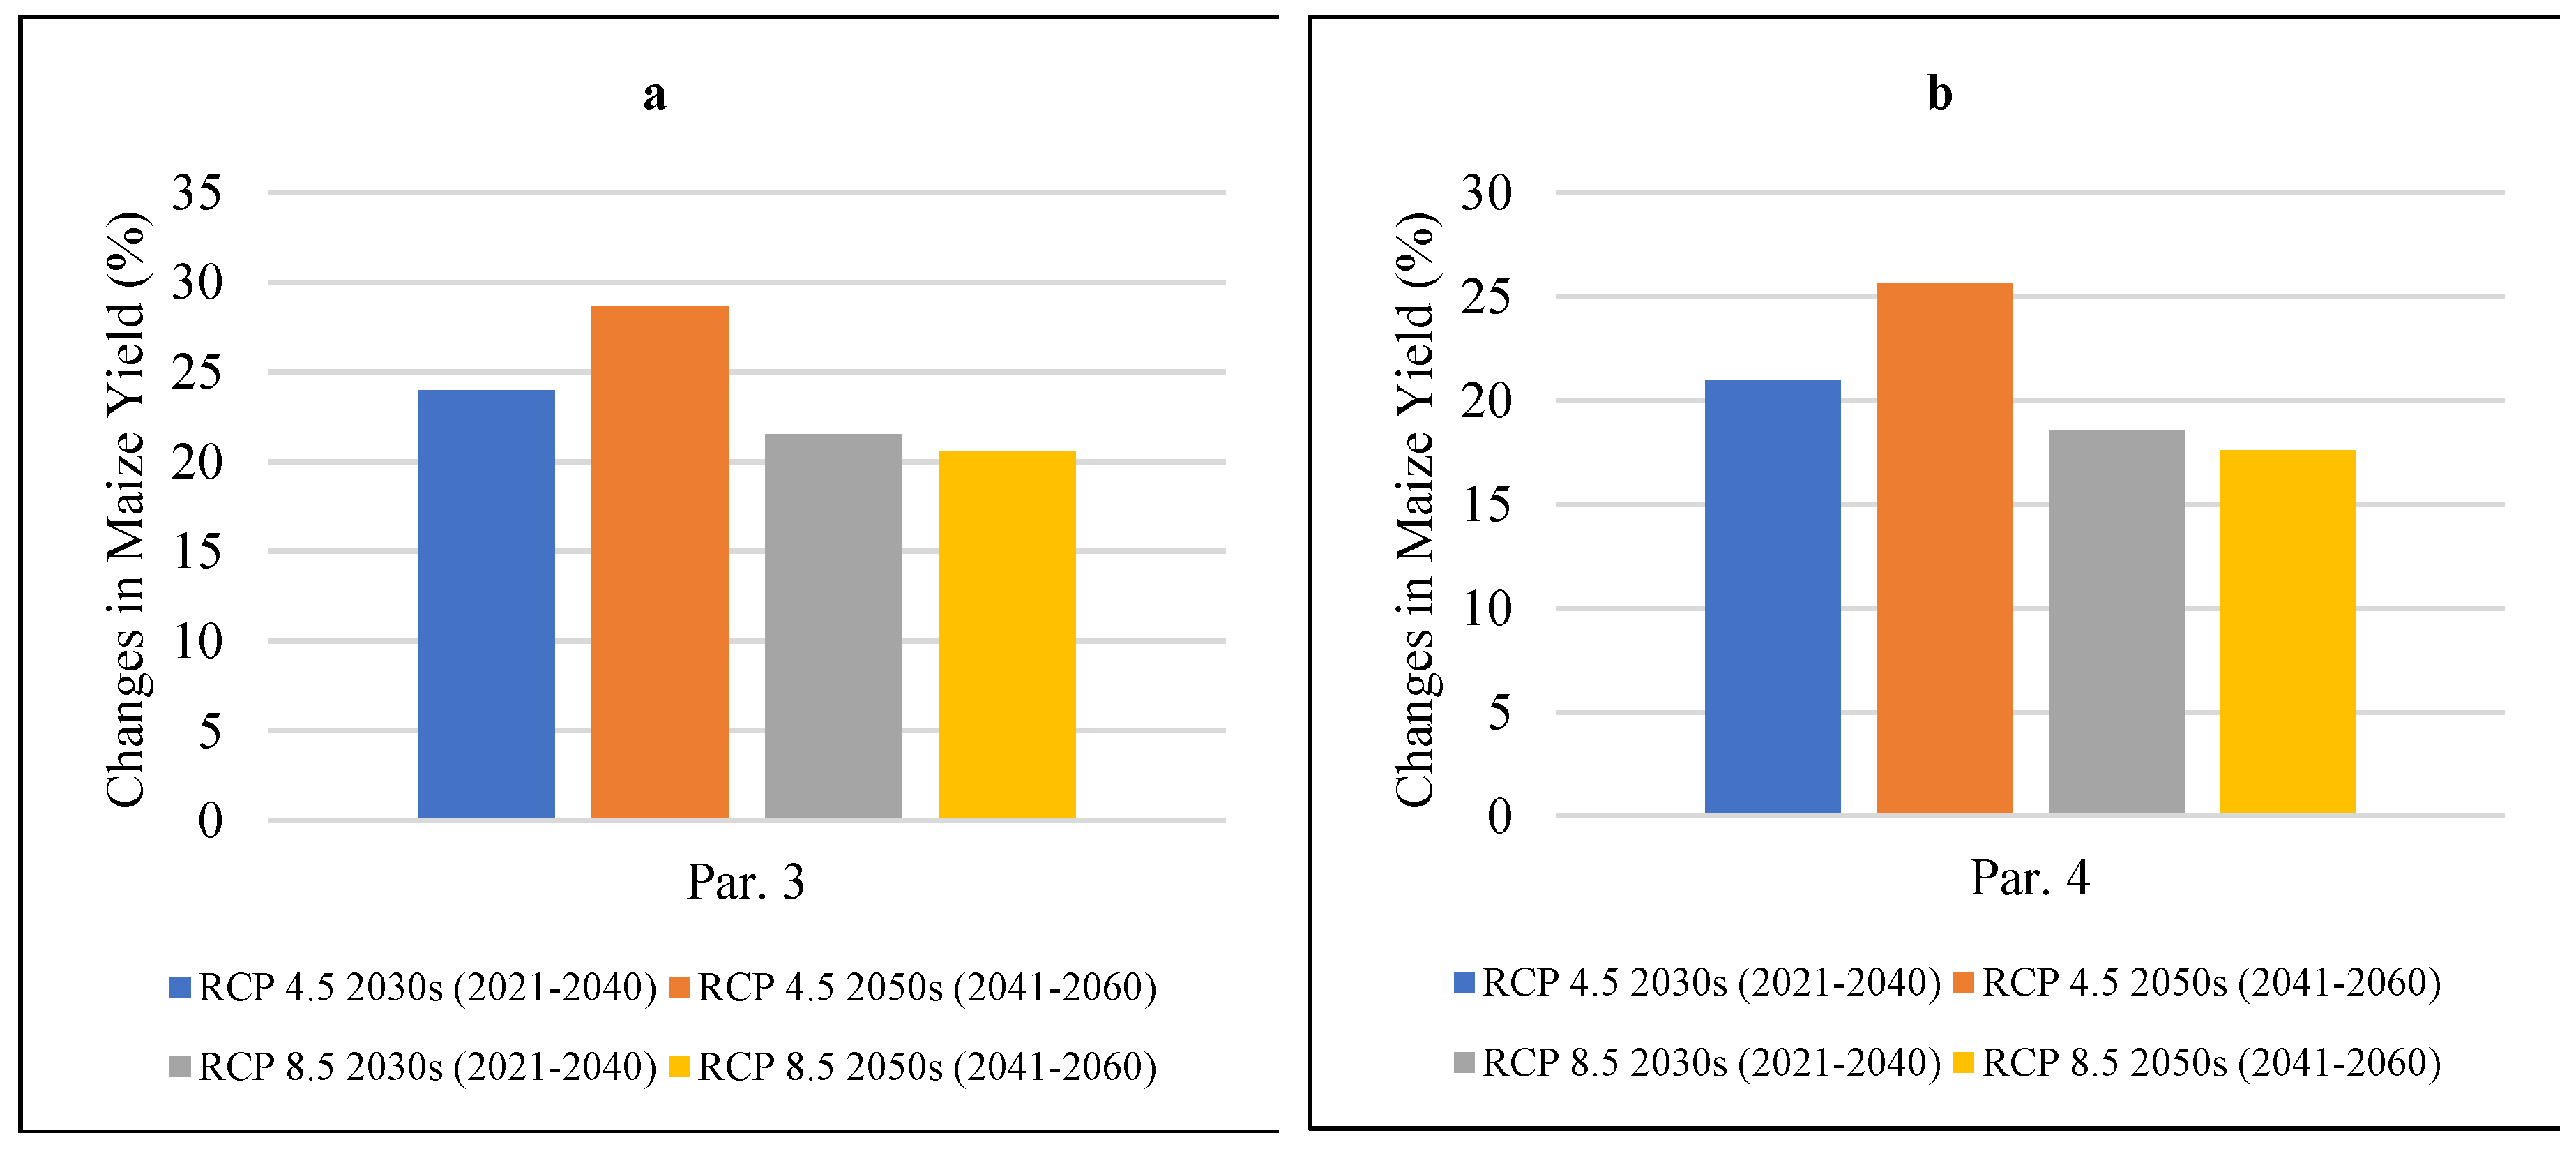
Adoption of early planting dates, appropriate irrigation, and late-maturing cultivar Xinyu No.18 showed increase in maize yield at both Hami and Jingyuan sites compared to the previous medium-maturing cultivars. In Hami, the yield increase was projected to be between 23.9 to 28.6 % under RCP4.5 and 21.5 to 20.6 % under RCP8.5 for the periods 2030s and 2050s respectively (Fig. 4). In Jingyuan, the yield increase was projected to be between 20.9 to 25.6 % under RCP4.5 and 18.5 to 17.6 % under RCP8.5 for the periods 2030s and 2050s respectively (Fig. 4). The results indicated that increased temperatures from climate change can be leveraged by using late-maturing maize cultivars, early planting dates, and appropriate irrigation.
Figure 4.
Changes in maize yield (%) after adopting early planting, appropriate irrigation and cultivar change with Xinyu No.18 under future climate scenarios for Northwest China. (Notes: 1) Station a and b denotes Hami and Jingyuan, respectively; 2) Results were based on adoption of one set of optimal treatment parameters compared with the baseline year (1986-2005).
3. Discussion
3.1. Impact of Future Climate Change on Maize Yield under different Parameters in Nakuru County, Kenya and Northwest China
In Kenya, maize is considered a staple food crop, but despite its economic and nutritional advantages, it remains highly vulnerable to climate variability [
22]. Our findings indicate that anticipated temperature and precipitation increases, ranging from 0.58 to 3.35 °C and 3.01 to 11.76%, respectively, with a projected decline in annual average solar radiation of −1.15 to −8.05% in NCK during the future periods of the 2030s and 2050s under RCP4.5 and RCP8.5, would result in a decrease in maize yield by 2.7 to 26.5% and shorten the maize growth duration by 1 to 34 days. In Kenya's Western and Central Highlands, there is a gradual reduction of maize yield projected to occur by an average of 10.8% and 23.7% in the time periods 2050s and 2070s, respectively, with the lowest and highest reductions recorded in Naivasha and Subukia at 3.2% under parameter 2 and 26.1% under parameter 6 due to climate change [
23]. These results are consistent with [
23], which projected increased temperature and rainfall during the 2050s and 2070s in Kenya based on five state-of-the-art climate models in the CMIP5 RCP8.5.
In Northwest China, higher maize yield reductions were found to result from temperature increases between 1979 and 2016 [
44]. Our study shows that the projected increases in temperature and precipitation, ranging from 0.48 to 3.26 °C and 2.34 to 54.31%, respectively, with a decline in annual average solar radiation of −0.40 to −3.31% during the future periods of the 2030s and 2050s in NWC under RCP4.5 and RCP8.5, would shorten maize growth durations by 0 to 38 days and decrease maize yield by 4.6 to 22.4%, with the lowest and highest reductions recorded in Hetian and Hami at 4.6% under parameter 2 and 22.4% under parameter 4, respectively. These findings align with [
26] and [
27], which projected an increase in temperature of approximately 6 °C, precipitation by more than 50 mm, and a downward trend in average daily solar radiation by the end of the 21st century using the latest regional climate model RegCM4.6, leading to maize yield reduction. The trend in current and future temperature increases during the maize growth period also aligns with other research studies [
29]. Additionally, our results are consistent with those of [
41] and [
44], where maize yield reduction was recorded in NWC due to increased temperatures.
3.2. Effect of Adaptation Measures on Maize Yield in Nakuru County, Kenya and Northwest China
Maize is a primary staple crop in Kenya, and addressing food insecurity requires implementing adaptation strategies, as suggested by [
1]. [
2] found that selective adoption of adaptation measures, such as using hybrid cultivars without applying fertilizers or changing planting dates, did not result in significant maize yield gains. In contrast, [
3] identified crop management practices, cultivar changes, soil fertility enhancement, and varying planting density as effective approaches to improve maize yield in Kenya's Eastern Provinces. In Kenya, delaying planting dates by 5–15 days was the most effective adaptation measure, resulting in a maize yield increase of between 14.3 to 21.4%. However, combining adaptation measures in this study was projected to lead to exponential maize yield increases ranging from 20.7 to 38.6% in the 2030s and 2050s, under RCP4.5 and RCP8.5.
In Northwest China, agriculture relies on rainfall, and [
4] and [
5] suggested irrigation practices as a way of adapting to climate change-induced temperature increases. [
6] also noted the dependence on rainfall in this region. Our study similarly found that appropriate irrigation measures were the most effective adaptation approach, leading to a maize yield increase of between 15.9 to 19.8%. When combined with other adaptation measures, maize yields in NWC were projected to increase by a range of 17.6 to 28.6% in the 2030s and 2050s under RCP4.5 and RCP8.5. [
7] recommended using hybrid cultivars and delaying sowing dates to avoid thermal heat stress, among other adaptation measures that could improve maize yields in NWC. However, future studies should examine additional factors like soil conditions, human resources, market prices, and local production levels, which were not considered in this study, that might influence maize yield variation.
4. Materials and Methods
4.1. Studies Area in Kenya and China
4.1.1. Nakuru County in Kenya
The study area of Nakuru County (Fig. S1), which is located in Southwest Kenya, consists of 11 sub-counties, of which 6 were selected for study in this paper, including Bahati, Gilgil, Molo, Naivasha, Njoro, and Subukia, since the other 5 sub-counties are non-agricultural dominated. The greater Nakuru County is in the Rift Valley Region and occupies an area of 7,242.3 km² with a population of 2,162,202 million [
1]. Nakuru County is found between longitudes 35°28' and 35° east and latitudes 0°13' and 10°10' South at an altitude of about 1912 meters above sea level. The climate of Nakuru County covers four zones that are strongly influenced by altitude and physical features, with mean annual rainfall ranging between 500 mm and 2700 mm and temperatures ranging between 10 °C and 20 °C during the cold months (July and August) and during the hot months (January to March), respectively [
2]. Maize production in Nakuru County accounts for about 61% of the total crop production, making Nakuru County one of the food baskets of Kenya [
3]. The county’s soil type presents a complex distribution of three main classifications that have been influenced by climatic conditions, volcanic activities, and the underlying rock type. The three major soil types in the county are Latosolic, Planosolic, and Alluvial [
4].
4.1.2. Northwest China
The study area, Northwest China (Fig. S2), consists of 5 provinces, namely Shaanxi, Xinjiang, Gansu, Qinghai, and Ningxia, covering a total area of approximately 3,100,000 km² and with a population of around 103.5 million [
1]. NWC lies between longitudes 73° East and latitudes 30° North (
Figure 3) and boasts various mountains such as the Qilianshan Mountains, Helanshan Mountains, Wushaoling Mountains, Tianshan Mountains, Altai Mountains, and Kunlun Mountains that could have an impact on the regional climate [
2]. NWC has various basins located in the rain shadow of these mountains, such as the Junggar Basin, Tarim Basin, and Qaidam Basin [
2,
3].
The climate in NWC is a typical temperate continental climate, with an annual mean temperature of 8 °C, an annual mean rainfall of less than 200 mm, and an annual mean evaporation of 1291 mm [
2,
4,
5]. In Northwest China, maize is one of the main crops grown, contributing to more than 50% of the region’s total grain yields and covering more than 30% of the total grain planting area, thereby playing a pivotal role in the regional agricultural economy [
6]. A vast area in NWC is characterized by continental arid conditions, partly attributed to the presence of deserts such as the Taklimakan Desert, Gurbantunggut Desert, Qaidam Desert, and Tengger Desert [
1]. The soil type of the region is Siltigi-Orthic Anthrosols, which developed over time from Calci-Orthic Aridisols due to long-term application of fertilizer, cultivation, and mineral-rich sediment water [
7].
4.2. CERES-Maize Model and Modeling Method
The most recent version of CERES-Maize (DSSAT v4.7) crop model was used to simulate spring maize development, growth, and yield in both Kenya and China as a function of weather data, soil characteristics, crop management practices, and crop genotype and phenotype. This new version of CERES-Maize (DSSAT v4.7) is the best in comparison to all the other previous versions of CERES-Maize (DSSAT) models, since it has more added functions and data that will help in the simulation process [
1]. According to the UNFCCC report, DSSAT crop model is cited as one of the best tools that can be integrated with other tools to simulate and evaluate climate change effects on crop production [
2]. According to Fig. S3, input data on crop management practices to be included are: crop type, cultivar, planting date, planting density, planting space and rows, fertilizer type and rate of application, irrigation method and amount, and tillage practices [
3]. Weather data to be included are: temperature (minimum and maximum), precipitation, humidity, and solar radiation. Soil data to be included are: soil type, soil texture, soil pH, soil moisture, soil organic carbon, and soil nitrogen levels [
4].
4.3. Criteria for Site Selection for modelling
In order to validate the CERES-Maize (DSSAT v4.7) crop model, we used measured data at six representative stations to calibrate and validate the model at either Nakuru County, Kenya (
Table S1) or Northwest China (
Table S2) before doing the future modelling. The criteria for validating the model was based on the following;
Maize cultivars must have been cultivated for a minimum of 3 years and at the same time they should not have been distressed by either diseases, pests, insects or severe climatic events.
Availability of records on good field management practices e.g., sowing dates, row spacing, cultivar change, fertilization and irrigation.
The location of the study sites are representative in the sub-areas and should be near the major Agricultural Meteorological Experimental Stations (AMESs) so as to ensure easy accessibility to accurate weather observation data.
4.4. Criteria for Climate Scenario Selection
In this particular study, two future climate scenarios, RCP4.5 and RCP8.5, were used to investigate the possible effects of anthropogenic and natural activities on future climate variability [
31]. Based on the possible future radiative forcing (W/m²) in 2100 and greenhouse gas emission pathways, RCP4.5 and RCP8.5 represent the medium- and high-emission scenarios, respectively, according to the IPCC Fifth Assessment Report (AR5) [
17,
24,
45].
4.5. Crop Model Input Data
Weather data: To calibrate or validate the CERES-Maize crop model using documented data from agrometeorological stations, specific weather input data for the selected sites were captured from the China Meteorological Data Network for each of the selected Agricultural Meteorological Experimental Stations (AMESs;
http://data.cma.cn/) for Northwest China and from the Kenya Meteorological Station (
https://meteo.go.ke/). The weather input data included daily maximum and minimum air temperatures, daily precipitation, daily humidity, and daily solar radiation. The daily solar radiation for each of the selected weather stations was calculated from the observed sunshine hours using the Angstrom–Prescott equation [
1]. Future climate elements at the daily level under RCP scenarios were generated using the GCM HadGEM2-ES model at a high spatial resolution of 0.50 × 0.50 (55.5 km × 55.5 km) and were bias-corrected before being incorporated into the CERES-Maize model. These data were downloaded from the following websites:
https://pcmdi.llnl.gov/?cmip5 and
https://esgf-node.llnl.gov/projects/esgf-llnl/. The site information used for calibrating and validating the model is listed in
Table S1 and
Table S2.
Soil data: The CERES-Maize (DSSAT v4.7) model required soil input data, including soil color, soil texture, soil particle size, soil organic carbon, soil pH, soil nitrogen levels, soil bulk density, soil type, soil cation exchange capacity, and soil drainage [
2]. These data were obtained from the local Agricultural Meteorological Experimental Stations (AMESs), the Chinese Soil Scientific Database (
http://vdb3.soil.csdb.cn), and the Kenya Soil Scientific Database (
https://data.isric.org), respectively.
Crop observation and management data: The input data on crop management practices for the selected study sites in Northwest China and Nakuru County, Kenya, covering the period from 2005 to 2009, were provided by Agricultural Meteorological Experimental Stations (AMESs) within the study areas. The study stations used to supply maize data were selected based on specific criteria to ensure data credibility: availability of up-to-date records on maize crop management practices, use of maize cultivars that had been continuously planted for a minimum of three years, and absence of significant stress from diseases, pests, insects, or severe climatic events [
3].
The crop management input data were used to parameterize the CERES-Maize (DSSAT v4.7) model and included crop type, cultivar, planting date, planting density, planting spacing and row configuration, fertilizer type and application rate, irrigation method and amount, harvesting date, and tillage practices [
4].
4.6. Genetic coefficients for Maize and Simulation Evaluation
Genetic coefficients in the CERES crop model are defined as a set of parameters that describe the interaction between crop genotype and environmental conditions [
1]. In the CERES-Maize (DSSAT v4.7) model, six genetic coefficients are used to characterize a maize cultivar (
Table S3), namely P1, P2, P5, G2, G3, and PHINT. These coefficients govern crop phenology, growth, and development processes [
2,
3].
DSSAT incorporates a coefficient estimator module known as the Generalized Likelihood Uncertainty Estimation (GLUE), which is used to estimate genotype-specific coefficients for crop cultivars within the model [
4,
5]. Of the six genetic coefficients, four parameters (P1, P2, P5, and PHINT) primarily control the timing of phenological stages, while the remaining two parameters (G2 and G3) define potential yield under optimal growth conditions (
Table S1). For each maize cultivar, a unique set of six genetic coefficients was derived using the GLUE approach by calibrating simulated outputs against observed data on maize phenological duration and grain yield.
Two statistical indicators were used for the evaluation: (i) normalized root mean square error (NRMSE), presenting relative error magnitude; and (ii) predicted deviation (PD), indicating possible over- or under-estimation. The simulated values for maize yield were considered excellent if NRMSE is < 10%, good if NRMSE is >10 % and < 20%, fair if NRMSE is > 20% and < 30%, and poor if NRMSE is > 30%. Additionally, a negative PD value indicates under-prediction, while a positive one indicates over-prediction.
where
and
are simulated and observed variables, respectively;
is the mean value of the observed data;
is the number of comparisons; and
denotes each comparison.
5. Conclusions
In this investigation, we produced six distinct hereditary parameters that corresponded with the observed maize growth data for CERES-Maize model v4.7 at six major locations in either Northwest China or Kenya. Our simulation outcomes revealed that the current maize varieties' phenological growth period would decline by 3 to 34 days in Kenya and 0 to 38 days in Northwest China, due to a rise in temperature from 1986 to 2005 to 2021 to 2060 under RCP4.5 and RCP8.5. The overall maize yield would decrease by 2.7 to 26.5% in Nakuru County, Kenya, due to the projected increase in temperature by 0.58 to 3.35 °C and rainfall by 3.01 to 11.76% and a decrease in solar radiation by -1.15 to -7.84% during the period 2021 to 2060 under RCP4.5 and RCP8.5 compared to the baseline year. Likewise, in Northwest China, the maize yield would decrease by 4.6 to 22.4% due to increased temperatures by 0.48 to 3.26 °C and a decrease in sunshine hours by -0.40 to -3.31% and precipitation by 2.34 to 54.31% during the period 2021 to 2060 under RCP4.5 and RCP8.5. The high CO2 emissions under RCP8.5 had a significant impact on maize, being a C4 plant, resulting in higher maize yields under RCP4.5 than RCP8.5 in both Nakuru County, Kenya, and Northwest China. The results of the adaptation measures indicated that adjusting planting dates, appropriate irrigation, and using suitable cultivars would increase maize yield to different extents in both Nakuru County, Kenya, and Northwest China, by 20.7 to 38.6% and 17.6 to 28.6%, respectively. In both regions, using the late maturing cultivar increased maize yield compared to the local early and medium maturing maize cultivars, as the late maturing cultivar has a more extended growing period and would benefit from warming resources at lower altitudes in both Nakuru County, Kenya, and Northwest China. Consequently, it is evident that for temperature-sensitive varieties, early planting, cultivar selection, and appropriate irrigation are effective adaptation options to decrease yield loss caused by climate change.
Supplementary Materials
The following supporting information can be downloaded at: Preprints.org
Author Contributions
Conceptualization, J.K.K.; methodology, J.K.K.; software, J.P.; validation, J.P.; formal analysis, S.W.; investigation, J.K.K.; resources, K.L.; data curation, S.W.; writing—original draft preparation, J.K.K.; writing—review and editing, S.W. and K.L.; visualization, J.P.; supervision, L.G. and K.L.; project administration, L.G.; funding acquisition, L.G. All authors have read and agreed to the published version of the manuscript.
Funding
This research was funded by the National Key R&D program of China Approval No. 2019YFA0607403 and 2017YFD0300301. The Agricultural Science and Technology Innovation Program of the Chinese Academy of Agricultural Sciences also supported this study.
Data Availability Statement
The data supporting the findings of this study are available from the corresponding author upon reasonable request. Access to some datasets is restricted due to data-sharing agreements with the China Meteorological Administration (CMA) and the Kenya Meteorological Department (KMD), which limit public dissemination of station-level meteorological and agronomic data. However, publicly available climate projection data used in this study can be accessed through the Earth System Grid Federation (ESGF) portal, including the HadGEM2-ES model outputs under RCP4.5 and RCP8.5 scenarios (
https://esgf-node.llnl.gov/projects/esgf-llnl/). Soil data were obtained from publicly accessible databases, including the Chinese Soil Scientific Database (
http://vdb3.soil.csdb.cn) and the ISRIC World Soil Information database (
https://data.isric.org).
Acknowledgments
Authors would especially like to thank the Graduate School of Chinese Academy of Agricultural Sciences and the Institute of Agro-Environment and Sustainable Development for the support they have given in carrying out the research through the two supervisors Prof. Guo Liping and Dr. Kuo Li. Special thanks should be given to China Meteorological Data Network and Chinese Soil Scientific Database for providing data. This study was financially supported by the National Key R&D program of China (Approval No. 2017YFD0300301).
Conflicts of Interest
The authors declare no conflicts of interest.
Abbreviations
The following abbreviations are used in this manuscript:
| AMESs |
Agricultural Meteorological Experimental Stations |
| AR5 |
Fifth Assessment Report of the Intergovernmental Panel on Climate Change |
| CERES |
Crop Environment Resource Synthesis |
| CIDP |
County Integrated Development Plan |
| CMA |
China Meteorological Administration |
| CMIP5 |
Coupled Model Intercomparison Project Phase 5 |
| DSSAT |
Decision Support System for Agrotechnology Transfer |
| ESGF |
Earth System Grid Federation |
| GCM |
General Circulation Model |
| GLUE |
Generalized Likelihood Uncertainty Estimation |
| IPCC |
Intergovernmental Panel on Climate Change |
| ISRIC |
International Soil Reference and Information Centre |
| KMD |
Kenya Meteorological Department |
| KNBS |
Kenya National Bureau of Statistics |
| NWC |
Northwest China |
| RCP |
Representative Concentration Pathway |
| UNFCCC |
United Nations Framework Convention on Climate Change |
References
- AGRA. (2017). Africa agriculture status report: The business of smallholder agriculture in Sub-Saharan Africa. Retrieved April 28, 2019, from https ://agra.org/wp-content/uploads/2017/09/Final -AASR-2017-Aug-28.pdf.
- Bryan, E.; Ringler, C.; Okoba, B.; Roncoli, C.; Silvestri, S.; Herrero, M. Adapting agriculture to climate change in Kenya: Household strategies and determinants. Journal of Environmental Management 2013, 114, 26–35. [Google Scholar] [CrossRef]
- Chen, P.; Liu, Y. The impact of climate change on summer maize phenology in the northwest plain of Shandong province under the IPCC SRES A1B scenario; Earth and Environmental Science: IOP Conference Series, 2014; Volume 17, 1, pp. 1–6. [Google Scholar] [CrossRef]
- Chen, S.; Jiang, T.; Ma, H.; He, C.; Xu, F.; Malone, R. W.; Feng, H.; Yu, Q.; Siddique, K. H. M.; Dong, Q.; He, J. Dynamic within-season irrigation scheduling for maize production in Northwest China: A Method Based on Weather Data Fusion and yield prediction by DSSAT. Agricultural and Forest Meteorology 2020, 285–286(23), 107928. [Google Scholar] [CrossRef]
- CIDP. County Government of Nakuru Integrated Development Plan (2018-2022) (Issue June). 2018. [Google Scholar]
- Edame, G. E.; Ekpenyong, A.; Fonta, W. M.; Duru, E. Climate change, food security and agricultural productivity in Africa: Issues and policy directions. International Journal of Humanities and Social Science 2011, 1(21), 205–223. [Google Scholar]
- GoK. National Climate Change Action Plan 2013 -2017; Government printers: Nairobi, Kenya, 2013. [Google Scholar]
- GoK. National climate change action plan (Kenya): 2018–2022; Government of Kenya: Nairobi, 2018; Available online: http://www.environmen.
- Gummadi, S; Kadiyala, MDM; Rao, KPC; Athanasiadis, I; Mulwa, R; Kilavi, M; et al. Simulating adaptation strategies to offset potential impacts of climate variability and change on maize yields in Embu County, Kenya. PLoS ONE 2020, 15(11), e0241147. [Google Scholar] [CrossRef]
- Herrero, M. T.; Ringler, C.; Steeg, J. V. D.; Thornton, P. K.; Zhu, T.; Bryan; et al. Climate variability and climate change: impacts on Kenyan agriculture. https://cgspace.cgiar.org/bitstream/handle/10568/2665/Kenya pro?sequence=2. 2010.
-
IPCC, 2021: Climate Change 2021: The Physical Science Basis. Contribution of Working Group I to the Sixth Assessment Report of the Intergovernmental Panel on Climate Change; Masson-Delmotte, V., Zhai, P., Pirani, A., Connors, S.L., Péan, C., Berger, S., Caud, N., Chen, Y., Goldfarb, L., Gomis, M.I., Huang, M., Leitzell, K., Lonnoy, E., Matthews, J.B.R., Maycock, T.K., Waterfield, T., Yelekçi, O., Yu, R., Zhou, B., Eds.; Cambridge University Press: Cambridge, United Kingdom and New York, NY, USA. [CrossRef]
- Jiang, Y.; Zhang, L.; Zhang, B.; He, C.; Jin, X.; Bai, X. Modeling irrigation management for water conservation by DSSAT-maize model in arid northwestern China. Agricultural Water Management 2016, 177, 37–45. [Google Scholar] [CrossRef]
- KNBS. Distribution of Population by Administrative Units. In 2019 Kenya Population and Housing Census: Vol. II. 2019. Available online: http://www.knbs.or.ke.
- Kogo, B. K.; Kumar, L.; Koech, R. Climate change and variability in Kenya: a review of impacts on agriculture and food security. In Environment, Development and Sustainability; Springer Science and Business Media B.V, 2021; Vol. 23, Issue 1, pp. 23–43. [Google Scholar] [CrossRef]
- Kwena, K.; Ndegwa, W.; Esilaba, A. O.; Nyamwaro, S. O.; Wamae, D. K.; Matere, S. J.; et al. Climate change adaptation planning in Kenya: Do scientific evidences really count? In Adapting African agriculture to climate change; Leal Filho, W., Esilaba, A. O., Rao, K. P. C., Sridhar, G., Eds.; Springer: Berlin, 2015; pp. 35–42. [Google Scholar]
- Li, C.; Wang, R.; Ning, H.; Luo, Q. Characteristics of meteorological drought pattern and risk analysis for maize production in Xinjiang, Northwest China. Theoretical and Applied Climatology 2018, 133(3–4), 1269–1278. [Google Scholar] [CrossRef]
- Lin, Y.; Feng, Z.; Wu, W.; Yang, Y.; Zhou, Y.; Xu, C. Potential impacts of climate change and adaptation on maize in Northeast China. Agronomy Journal 2017, 109(4), 1476–1490. [Google Scholar] [CrossRef]
- Lin, Y.; Wu, W.; Ge, Q. CERES-Maize model-based simulation of climate change impacts on maize yields and potential adaptive measures in Heilongjiang Province, China. Journal of the Science of Food and Agriculture 2015, Vol. 95(Issue 14), 2838–2849. [Google Scholar] [CrossRef]
- Liu, L.; Guo, Z.; Huang, G.; Wang, R. Water productivity evaluation under multi-GCM projections of climate change in oases of the Heihe river Basin, Northwest China. International Journal of Environmental Research and Public Health 2019, 16(10). [Google Scholar] [CrossRef]
- Muhunyu, J.G. Structural analysis of small-scale maize production in the Nakuru District: challenges faced in achieving stable and high maize productivity in Kenya. Journal of Developments in Sustainable Agriculture 2008, 3, 74–91. [Google Scholar]
- Muigua, K. Food security and environmental sustainability in Kenya. 2014. Available online: http://kmco.co.ke/wpcontent/uploa ds/2018/08/Food Security and Environmental Sustainability in Kenya.pdf.
- Mumo, L; Yu, J; Fang, K. Assessing Impacts of Seasonal climate Variability on Maize Yield in Kenya. Int J Plant Prod 2018, 12, 297–307. [Google Scholar] [CrossRef]
- Mumo, L.; Yu, J.; Ojara, M.; Lukorito, C.; Kerandi, N. Assessing changes in climate suitability and yields of maize and sorghum crops over Kenya in the twenty-first century. Theoretical and Applied Climatology 2021, 146(1–2), 381–394. [Google Scholar] [CrossRef]
- Ngwira, A. R.; Aune, J. B.; Thierfelder, C. DSSAT modelling of conservation agriculture maize response to climate change in Malawi. Soil and Tillage Research 2014, 143, 85–94. [Google Scholar] [CrossRef]
- Ochieng, J.; Kirimi, L.; Mathenge, M. Effects of climate variability and change on agricultural production: The case of small-scale farmers in Kenya. NJAS-Wageningen Journal of Life Sciences 2016, 77, 71–78. [Google Scholar] [CrossRef]
- Pan, X. D.; Zhang, L.; Huang, C. L. Future climate projection in Northwest China with RegCM4.6. Earth and Space Science 2020, 7, e2019EA000819. [Google Scholar] [CrossRef]
- Li, PeiDu; Gao, XiaoQing; Jiang, JunXia; Yang, LiWei; Li, YuJie. Spatial and temporal patterns of solar radiation in China from 1957 to 2016[J]. Sciences in Cold and Arid Regions 2022, 14(1), 68–78. [Google Scholar]
- Shah, M.; Fischer, G.; van Velthuizen, H. Food security and sustainable agriculture the challenges of climate change in Sub-Saharan Africa; International Institute for Applied Systems Analysis: Laxenburg, 2008. [Google Scholar]
- Shang, SS; Lian, LZ; Ma, T; Zhang, K; Han, T. Spatiotemporal variation of temperature and precipitation in northwest China in recent 54 years. Arid Zone Res 2018, 35(1), 68–76. [Google Scholar]
- Shi, Y.; Shen, Y.; Kang, E.; Li, D.; Ding, Y.; Zhang, G.; Hu, R. Recent and future climate change in northwest China. Climatic Change 2007, 80(3–4), 379–393. [Google Scholar] [CrossRef]
- Sorech, E.; Kibebew, K.; Gebre, H. Climate Characterization and Modelling the Impacts (Issue March). Masters Thesis, Haramaya University, Haramaya, 2016. [Google Scholar]
- Su, Y. Zhong; Wang, F.; Zhang, Z. Hui; Du, M. Wu. Soil Properties and Characteristics of Soil Aggregate in Marginal Farmlands of Oasis in the Middle of Hexi Corridor Region, Northwest China. Agricultural Sciences in China 2007, 6(6), 706–714. [Google Scholar] [CrossRef]
- Sultan, B.; Gaetani, M. Agriculture in West Africa in the twenty-first century: Climate change and impacts scenarios, and potential for adaptation. Frontiers in Plant Science 2016, 7, 20. [Google Scholar] [CrossRef]
- Tao, F.; Zhang, Z. Climate change, wheat productivity and water use in the North China Plain: A new super-ensemble-based probabilistic projection. Agricultural and Forest Meteorology 2013, 170, 146–165. [Google Scholar] [CrossRef]
-
The World Bank annual report 2007 (English); World Bank Group: Washington, D.C.; Available online: https://documents.worldbank.org/curated/en/732761468779449524/The-World-Bank-annual-report-2007.
- Turner, N. C.; Molyneux, N.; Yang, S.; Xiong, Y. C.; Siddique, K. H. M. Climate change in south-west Australia and north-west China: Challenges and opportunities for crop production. Crop and Pasture Science 2011, 62(6), 445–456. [Google Scholar] [CrossRef]
- UNFCCC. Compendium on methods and tools to evaluate impacts of, and vulnerability and adaptation to, climate change UNFCCC (Issue February). 2008. [Google Scholar]
- Vermeulen, S. J.; Aggarwal, P. K.; Ainslie, A.; Angelone, C.; Campbell, B. M.; Challinor, A. J.; et al. Options for support to agriculture and food security under climate change. Environmental Science & Policy 2012, 15(1), 136–144. [Google Scholar] [CrossRef]
- Wang, H.; Chen, Y.; Pan, Y. Characteristics of drought in the arid region of northwestern China. Climate Research 2014, 62(2), 99–113. [Google Scholar] [CrossRef]
- Wang, Y.; Zhao, W.; Zhang, Q.; et al. Characteristics of drought vulnerability for maize in the eastern part of Northwest China. Sci Rep 2019, 9, 964. [Google Scholar] [CrossRef]
- Wang, Y.; Wang, C.; Zhang, Q. Synergistic effects of climatic factors and drought on maize yield in the east of Northwest China against the background of climate change. Theor Appl Climatol 2021, 143, 1017–1033. [Google Scholar] [CrossRef]
- World Meteorological Organization (WMO). State of the Climate in Asia 2021 (WMO-No.1303); Chair, Publications Board World Meteorological Organization (WMO) 7 bis, avenue de la Paix: CH-1211 Geneva 2, Switzerland, 2022a; Available online: https://library.wmo.int/doc_num.php?explnum_id=11388.
- World Meteorological Organization (WMO). State of the Climate in Africa 2021 (WMO-No.1300); Chair, Publications Board World Meteorological Organization (WMO) 7 bis, avenue de la Paix: CH-1211 Geneva 2, Switzerland, 2022b; Available online: https://library.wmo.int/doc_num.php?explnum_id=11304.
- Wu, J. Zhai; Zhang, J.; GE, Z. ming; Xing, L. wei; Han, S. qing; Shen, C.; Kong, F. tao. Impact of climate change on maize yield in China from 1979 to 2016. Journal of Integrative Agriculture 2021, 20(1), 289–299. [Google Scholar] [CrossRef]
- Xia, J.; Ning, L.; Wang, Q.; Chen, J.; Wan, L.; Hong, S. Vulnerability of and risk to water resources in arid and semi-arid regions of West China under a scenario of climate change. Climatic Change 2017, 144(3), 549–563. [Google Scholar] [CrossRef]
- Xiong, W.; Matthews, R.; Holman, I.; Lin, E.; Xu, Y. Modelling China’s potential maize production at regional scale under climate change. Climatic Change 2007, 85(3–4), 433–451. [Google Scholar] [CrossRef]
- Yang, M X; Mou, Y L; Meng, Y R; Liu, S; Peng, C H; Zhou, X L. Modeling the effects of precipitation and temperature patterns on agricultural drought in China from 1949 to 2015. Science of the Total Environment 2020, 711, 135–139. [Google Scholar] [CrossRef]
- Yin, Y.; Tang, Q.; Liu, X. A multi-model analysis of change in potential yield of major crops in China under climate change. In Earth System Dynamics; 2015; pp. 45–59. [Google Scholar] [CrossRef]
- Zhao, Jincai; Wang, Z. Future trends of water resources and influences on agriculture in China. Plos One 2020, 15(4), e0231671. [Google Scholar] [CrossRef] [PubMed]
|
Disclaimer/Publisher’s Note: The statements, opinions and data contained in all publications are solely those of the individual author(s) and contributor(s) and not of MDPI and/or the editor(s). MDPI and/or the editor(s) disclaim responsibility for any injury to people or property resulting from any ideas, methods, instructions or products referred to in the content. |
© 2025 by the authors. Licensee MDPI, Basel, Switzerland. This article is an open access article distributed under the terms and conditions of the Creative Commons Attribution (CC BY) license (http://creativecommons.org/licenses/by/4.0/).