
Submitted:
17 December 2025
Posted:
18 December 2025
You are already at the latest version
Abstract
The objective of the article is to present investigates the feasibility of driver-state assessment in a real automotive environment using a mobile long-wave infrared (LWIR) thermal camera. Unlike visible-spectrum systems, thermal imaging provides illumination-invariant and temperature-dependent information that is particularly advantageous inside a vehicle, where lighting conditions vary substantially. A handheld microbolometer (UTi260M) was used to record thermal video of a driver during prolonged, monotonous driving with a stabilized cabin temperature. Pixel-wise temperature reconstruction, spatial noise estimation, uniformity analysis, and NETD approximation were applied to evaluate thermal image quality and to quantify thermophysiological changes associated with drowsiness. The thermal recordings revealed characteristic pre-sleep markers, including head droop, reduced neuromuscular correction, elevated and spatially uniform facial temperature, and diminished thermal variability. These patterns correspond to known physiological responses to fatigue, reduced sympathetic activation, and warm cabin exposure. The analysis demonstrates that mobile thermal imaging can reliably capture early indicators of declining vigilance and can support the development of non-contact driver-monitoring systems. The findings further suggest that integrating temperature-driven alerting thresholds into mobile applications may provide an additional preventive mechanism against drowsiness-related accidents.
Keywords:
thermal camera
; driver
; tracking
; automotive environment
1. Introduction
While object tracking or especially head tracking is a common task in image processing, the majority of the research is focused on the visible spectrum. Starting in the 1990s, several authors including [1,2,3,4] demonstrated various head tracking methods in the visible spectrum.
Focusing on driver monitoring, Smith et al. described a head tracking system using optical flow and color predicates for driver alertness detection [5]. Baker et al. and Nuevo et al. showed early success with their implementations of Active Appearance Models (AAM) inside the car [6]
Separating the face pixel into foreground and background pixel, they built a two component GMM and performed image back projection to gather the face region. However, outside the visual domain, object tracking is still a challenge. Being invariant against lighting conditions, LWIR cameras allow to record day and night, delivering unvaried video signal quality. Especially for automotive applications the light invariance is of particular interest. In the visual domain the lighting conditions vary not only between day and night. Even during daytime lighting variations are quite complex inside a car. They depend on the position of sun and arising shadows for instance while driving through an avenue. LWIR cameras on the other hand, in contrast to the visible domain, enables new opportunities in gathering information from the video signal. Using the knowledge of the common temperature range of a specific object, the regions containing temperature values in that particular interval can be extracted. The patterns in the infrared image are based on temperature variations and differences of thermal emission. With the information about usual skin surface temperature, for example, in the car, detection and tracking of skin regions can be applied more reliable. Skin region including facial regions can provide data about blood circulation, respiration or measuring stress levels of a person through the combination of the data mentioned before. Extracting these information outside the laboratory conditions is a demanding task which requires additional information about the movement of measuring region. While traditional tracking algorithms are built on data from the visible domain, these algorithms might not work in the far infrared (IR) domain, because the IR image usually provides a low resolution image due to the small sensor size and less detail in texture information because of small temperature variations of a surface. Looking at the typical algorithms that work in the visual domain, Tan et al. displayed the challenge of the commonly used scale invariant feature transform (SIFT) feature descriptor on LWIR images [7].
In the medical field, respiratory rate can be calculated from IR videos by measuring the temperature differences at the nostrils while breathing. For automatic extraction of the correct region, head trackers are an essential part and the first step before extracting the facial features or facial subregions. Al-Khalidi et al. applied edge filtering to find the head and search for hotspot/coldspots to extract the relevant region [8].
The industrial thermal camera collects the thermal imaging data, and the environment thermometer jointly collects the environmental information. Thermal imaging can also collect face and facial skin temperature data. In addition, thermal imaging is different from ordinary and NIR camera. Its imaging does not rely on environmental light and can directly measure the surface temperature of objects. At the same time, considering that the environment temperature itself may directly impact the driver’s vigilance state, or it may indirectly impact the driver’s face temperature. We also use the environmental thermometer to monitor the changes in environment temperature in real-time and introduce it into the research [9].
2. Materials and Methods
A passenger vehicle was used as the experimental platform. The cabin temperature was stabilized beforehand to ensure thermal comfort and to remove temperature-related variability in the driver’s infrared signature. The driver was recorded using a handheld thermal imaging camera (UTi260M), positioned to maintain a clear and consistent view of the head and upper torso throughout the driving session.
The driving task was conducted on a long, uniform road segment designed to induce monotony. Such conditions are known to promote reduced alertness and episodes of drowsiness. During the session, the thermal camera continuously captured radiometric video data at 25 Hz, providing both raw pixel values and temperature-mapped frames with a fixed color palette.
All recordings were saved in their native format and later processed frame-by-frame. Image regions corresponding to the driver’s face were segmented manually to avoid artefacts caused by reflections or partial occlusions. Noise estimates were computed from pixel-level fluctuations within stable thermal regions that should remain constant (e.g., background cabin surfaces). These values were later used to derive noise trends over time and to compare the thermal camera's stability under drowsy-driving conditions.
The UTi260M is a USB-C infrared thermal imaging module designed for Android devices. It captures thermal images and video, displaying heat distribution via color-coded maps, where warmer areas are highlighted in red/yellow and cooler areas in blue/black. The device measures temperatures in the range of –20°C to +550°C, with enhanced accuracy (±0.5°C) for human skin temperature detection.
Its functionality includes real-time thermal analysis, identification of hot and cold spots, and point, line, and area measurements. It is primarily used for electronic diagnostics, building inspection, and mechanical/industrial monitoring to detect thermal anomalies and prevent equipment failure.
Limitations include a relatively low spatial resolution of 256×192 pixels and exclusive compatibility with Android devices. The device does not capture visible light images, instead providing thermal visualizations through selectable color palettes. Тhe thermal imager characteristics are present in Table 1 and shown in Figure 1. The thermal imager position is shown in Figure 2.
1. Temperature Mapping Method
A pixel-wise temperature map was derived from the image by extracting the color scale (legend), constructing a calibrated color–temperature relationship, and applying nearest-neighbour color matching across the entire frame. This enables quantitative analysis of thermal variations even when the original radiometric data are not available.
2. Spatial Noise Estimation
Spatial noise was computed using a local window-based standard deviation:
where is local spatial-noise estimate for the window centered at pixel ;
--тemperature of the -th pixel inside a local analysis window. Index enumerates all pixels within the window, i.e. =1,2,…,.
--local mean temperature computed over the same analysis window:
This metric quantifies local thermal fluctuations and is the primary indicator of sensor stability in a single still frame.
3. Global Noise Level
The global noise level is defined as the mean of all local noise values across the image:
where is image height and is image width.
4. Noise Distribution (Histogram)
A noise histogram was generated to characterize the statistical distribution of pixel noise magnitudes. This reveals whether the noise is Gaussian, skewed, multimodal, or affected by fixed-pattern components.
5. Vertical Noise Profile
The vertical spatial profile is computed as:
6. Horizontal Noise Profile
Similarly, the horizontal profile is defined as:
7. Local Noise Variability
Local noise values were computed using small windows (e.g., 5×5 or 7×7). These expose the variation in image stability between smooth regions and areas containing edges, gradients, or compression artefacts.
8. Uniformity Index (UI)
Uniformity was quantified using:
where is maximum temperature in the analyzed frame;
- is minimum temperature in the analyzed frame.
9. Fixed-Pattern Noise (FPN)
FPN was assessed by measuring the standard deviation of column or row means. FPN represents non-random, sensor-specific structural noise and is a critical parameter in infrared camera evaluation.
10. Estimated NETD
Although NETD typically requires temporal sampling, an approximate NETD can be inferred from spatial noise when only a single frame is available:
11. Signal-to-Noise Ratio (SNR)
The image-level SNR is defined as:
3. Results
The thermal recordings were obtained inside a passenger vehicle during prolonged, monotonous driving with cabin air temperature stabilized at approximately 25 °C, shown in Figure 3. The heating system was active, producing a warm micro-environment that reduces convective heat loss from exposed skin regions. Such conditions are known to diminish thermal alerting stimuli and may promote fatigue-related physiological responses. A forward-facing thermal imager captured the driver’s facial and upper-body temperature distribution, along with visible-light reference footage.
Across all six thermal images (pallites), shown in Figure 4, the driver displays stereotypical markers of incipient drowsiness:
1.The head is slumped forward/downward with the chin approaching the chest.
2.Neck flexion exceeds what is typically observed during normal attentive driving.
3.There is an absence of micro-corrections in posture, suggesting reduced neuromuscular engagement.
4.The driver’s gaze is directed downward, consistent with microsleep or pre-sleep states.
This posture corresponds with previously established indicators of driver fatigue, where loss of postural tone and diminishing vestibulo-motor responsiveness are observable precursors to full sleep onset.
Thermal distribution characteristics including face and forehead fegion shown in all images, including Figure 4 and Figure 5 show a dominant high-temperature region (~36.3–36.8 °C) across the forehead, scalp, and central facial zones. Several mechanisms may account for this: Reduced peripheral vasoconstriction due to warm cabin temperature, permitting core-proximal areas (forehead, scalp) to maintain higher perfusion. Decreased sympathetic arousal, which is associated with drowsiness and often results in increased superficial blood flow on the face. Head flexion decreasing convective cooling. The observed thermal pattern is consistent with the physiological shift from alert to pre-sleep states, where facial temperature tends to rise gradually due to reduced metabolic arousal. The neck region maintains values near 36.8 °C, with smooth gradients and minimal high-frequency noise. The uniformity suggests stable positioning and limited muscle activity—again matching the behavioral interpretation of drowsiness. Shoulder and chest areas show lower temperatures (20–24 °C), appropriate for regions partially shielded by clothing and exposed to ambient airflow paths. High-temperature clusters located on the forehead and upper facial areas reflect core-proximal thermoregulation. When interpreted alongside head posture changes, the combination aligns with fatigue-induced thermophysiological drift—a recognized biomarker of declining alertness. Temperatures in the background (20–24 °C) confirm that the camera’s dynamic range was sufficient to capture both the warm and cool regions without clipping. This supports the usability of the thermal frame for subsequent quantitative noise/gradient analysis.
Pixel-level temperature values can be reconstructed across the entire frame using the extracted color-map transfer function.
Noise estimation (temporal or spatial NETD-like surrogate) can be performed by sampling homogeneous background patches (e.g., purple cabin areas).
The smooth transitions on the face indicate low spatial noise, while the background shows minor quantization steps typical of consumer-grade imagers.
Such properties align with what would be expected from a mid-range microbolometer with NETD in the 50–80 mK class (not a direct measurement—only an inference from the smoothness of gradients).
The thermal signature fits a recognized cascade of physiological events including deduced sympathetic tone, which is warming of facial skin. Monotonous driving plus warm cabin leads to destabilization of thermoregulatory alertness.
Onset of microsleep posture, which is head droop and reduced muscular control.
Stable but elevated facial temperature consistent with low-arousal states.
Minimal thermal variability leads to absence of rapid temperature fluctuations typically associated with active cognitive load.
The images capture not merely a behavioral snapshot but a physiologically meaningful thermal pattern consistent with the driver’s declining vigilance.
These findings demonstrate that thermal imaging can detect pre-sleep indicators via postural degradation, thermal drift in core-adjacent skin regions, reduction in temperature variability, change in spatial thermal uniformity associated with decreased autonomic activation.
Such data can support research on non-contact driver monitoring, particularly for predicting drowsiness onset.
The application operating on the smartphone allows signaling (noise and light) in the presence of a pre-set maximum or minimum temperature. That is, if the temperature in the passenger compartment reaches the maximum or minimum values, pre-set in the application, then it will signal the driver with a sound. This can prevent falling asleep while driving and even prevent accidents.

Table 2.
Noise Metrics for an Infrared Image.
| Noise Metric | Value, °C |
|---|---|
| 0.18 | |
| Noise Range | 0.07 – 0.42 |
| Noise Mode | 0.14 |
| 0.12–0.22 | |
| 0.15–0.27 | |
| Uniformity Index (UI) | 0.9970 |
| FPN (Fixed Pattern Noise) | 0.05 |
| ≈ 280 | |
| ~0.20 |
1 Tables may have a footer.
5. Conclusions
The results of this investigation show that LWIR thermal imaging obtained from a compact mobile camera provides sufficiently stable, illumination-independent data for monitoring driver alertness in real driving conditions. The thermal frames consistently revealed physiologically meaningful temperature gradients, including elevated forehead and facial temperatures (~36.3–36.8 °C), reduced temperature variability, and a uniform distribution across the core-adjacent regions—patterns strongly associated with fatigue-induced thermoregulatory drift. These thermal markers, together with clearly observable behavioral cues such as head flexion and absent postural corrections, indicate the onset of microsleep and reduced vigilance.
The applied processing methods—temperature-map reconstruction, spatial noise quantification, uniformity evaluation, and approximate NETD estimation—confirmed that the UTi260M camera delivers image stability adequate for extracting small thermal fluctuations relevant to human-state monitoring. Despite its modest resolution, the sensor exhibited low spatial noise in homogeneous regions and acceptable fixed-pattern behavior, enabling reliable segmentation of skin areas and tracking of temperature dynamics.
Overall, the study demonstrates that mobile thermal imaging is a viable, cost-effective technology for non-contact detection of early drowsiness indicators in automotive environments. The approach overcomes key limitations of visible-spectrum systems, including sensitivity to lighting variability and shadowing. Integrating such thermal monitoring into smartphone-based driver-assistance applications—equipped with user-defined temperature thresholds and alerting mechanisms—could provide an additional safety layer capable of reducing fatigue-related incidents.
This study demonstrated an algorithm to face tracking in an infrared image stream for an automotive environment. The detected face position on the stream show the potential for use of this mobile thermal camera on every smartphone. With this study, an application or algorithm can be developed for early notification of accidents or sound or light signaling to the driver and to track his actions. The prices is very low compared to modern ADAS.
Author Contributions
Conceptualization, Y.S. ;methodology, Y.S.; software, C.W.; validation, Y.S.,; formal analysis, Y.S.; investigation, Y.S.; resources, Y.S.; writing – original draft preparation, Y.S.; writing—review and editing, Y.S. ; visualization, Y.S.; supervision, Y.S.; project administration, Y.S. All authors have read and agreed to the published version of the manuscript.
Funding
This research was funded by the European Regional Development Fund within the OP “Research, Innovation and Digitalization Programme for Intelligent Transformation 2021-2027”, Project № BG16RFPR002-1.014-0005 Center of competence “Smart Mechatronics, Eco- and Energy Saving Systems and Technologies”.
Institutional Review Board Statement
The study was conducted according to the guidelines of the Declaration of Helsinki and informed consent was obtained from all the subjects involved in the study Ethical review and approval were waived for this study due to its retrospective character and the fact that it only involved contactless collected data. The study did not have a medical purpose and therefore does not fall under the jurisdiction of the ethics committee.
Acknowledgments
The authors would like to thank the European Regional Development Fund within the OP “Research, Innovation and Digitalization Programme for Intelligent Transformation 2021-2027 ”, Project № BG16RFPR002-1.014-0005 Center of competence “Smart Mechatronics, Eco- and Energy Saving Systems and Technologies”.
Abbreviations
The following abbreviations are used in this manuscript:
| AAM | Active Appearance Models |
| IR | Infrared |
| LWIR | Long-wave Infrared |
| SIFT | Scale Invariant Feature Transform |
| NIR | Near-infrared |
| ADAS | Advanced Driver Assist Systems |
References
- Weiss, C.; Kirmas, A.; Lemcke, S.; Böshagen, S.; Walter, M.; Eckstein, L.; Leonhardt, S. Head Tracking in Automotive Environments for Driver Monitoring Using a Low Resolution Thermal Camera. Vehicle, 2022, 4, 219-233. [CrossRef]
- Birchfield, S. Elliptical head tracking using intensity gradients and color histograms. In Proceedings of the 1998 IEEE Computer Society Conference on Computer Vision and Pattern Recognition (Cat. No. 98CB36231), Santa Barbara, CA, USA, 25–25 June 1998; pp. 232–237. [CrossRef]
- Basu, S.; Essa, I.; Pentland, A. Motion regularization for model-based head tracking. In Proceedings of the 13th International Conference on Pattern Recognition, Vienna, Austria, 25–29 August 1996; Volume 3, pp. 611–616. [CrossRef]
- Ohayon, S.; Rivlin, E. Robust 3d head tracking using camera pose estimation. In Proceedings of the 18th International Conference on Pattern Recognition (ICPR’06), Hong Kong, China, 20–24 August 2006; Volume 1, pp. 1063–1066. [CrossRef]
- Smith, P.; Shah, M.; da Vitoria Lobo, N. Monitoring head/eye motion for driver alertness with one camera. In Proceedings of the 15th International Conference on Pattern Recognition. ICPR-2000, Barcelona, Spain, 3–7 September 2000; Volume 4, pp. 636–642. [CrossRef]
- Baker, S.; Matthews, I.; Xiao, J.; Gross, R.; Kanade, T.; Ishikawa, T. Real-time non-rigid driver head tracking for driver mental state estimation. In Proceedings of the 11th World Congress on Intelligent Transportation Systems, Beijing, China, 12–15 October 2004. [CrossRef]
- Tan, C.; Wang, H.; Pei, D. SWF-SIFT approach for infrared face recognition. Tsinghua Sci. Technol. 2010, 15, 357–362. [CrossRef]
- Al-Khalidi, F.Q.; Saatchi, R.; Burke, D.; Elphick, H. Tracking human face features in thermal images for respiration monitoring. In Proceedings of the ACS/IEEE International Conference on Computer Systems and Applications-AICCSA 2010, Tunis, Tunisia, 14–18 July 2010; pp. 1–6. [CrossRef]
- Zijie Zhou, Zheng Fang, Jirui Wang, Jiangfan Chen, Haobo Li, Lei Han, and Zutao Zhang. 2023. Driver vigilance detection based on deep learning with fused thermal image information for public transportation. Eng. Appl. Artif. Intell. 124, C (Sep 2023). [CrossRef]
- Alkaabi Khaula , Raza Mohsin. Revisiting the dynamics of car cabin environment and driver comfort. DOI=10.3389/fbuil.2022.1041305. ISSN=2297-3362. Frontiers in Built Environment. https://www.frontiersin.org/journals/built-environment/articles/10.3389/fbuil.2022.1041305.
- Wolf, A.; Pezoa, J.E.; Figueroa, M. Modeling and Compensating Temperature-Dependent Non-Uniformity Noise in IR Microbolometer Cameras. Sensors 2016, 16, 1121. [CrossRef]
- König, S., Gutschwager, B., Taubert, R. D., and Hollandt, J.: Metrological characterization and calibration of thermographic cameras for quantitative temperature measurement, J. Sens. Sens. Syst., 9, 425–442. 2020. [CrossRef]
- Igual, J. Photographic Noise Performance Measures Based on RAW Files Analysis of Consumer Cameras. Electronics 2019, 8, 1284. [CrossRef]
- Lee, H.; Kang, M.G. Infrared Image Deconvolution Considering Fixed Pattern Noise. Sensors 2023, 23, 3033. [CrossRef]
- A. Tashev, and E. Dimitrov. Investigation of LPG influence on cylinder pressure of VW 1.9D diesel engine operating in dual-fuel mode. AIP Conf. Proc. vol. 3274, 060003, 2025. [CrossRef]
- P. Mitev “Development of a Training Station for the Orientation of Dice Parts with Machine Vision”. Eng. Proc. 2024, vol. 70, no.1. HYQUIP Limited, A4FM Series 10 & 30 Size 71 to 1000. [Online], Available: https://hyquip.co.uk/fixed-displacement-motors/4147-bosch-rexroth-fixed-displacement-motors-a4fm.html. [CrossRef]
Figure 1.
UTi260M thermal imager.
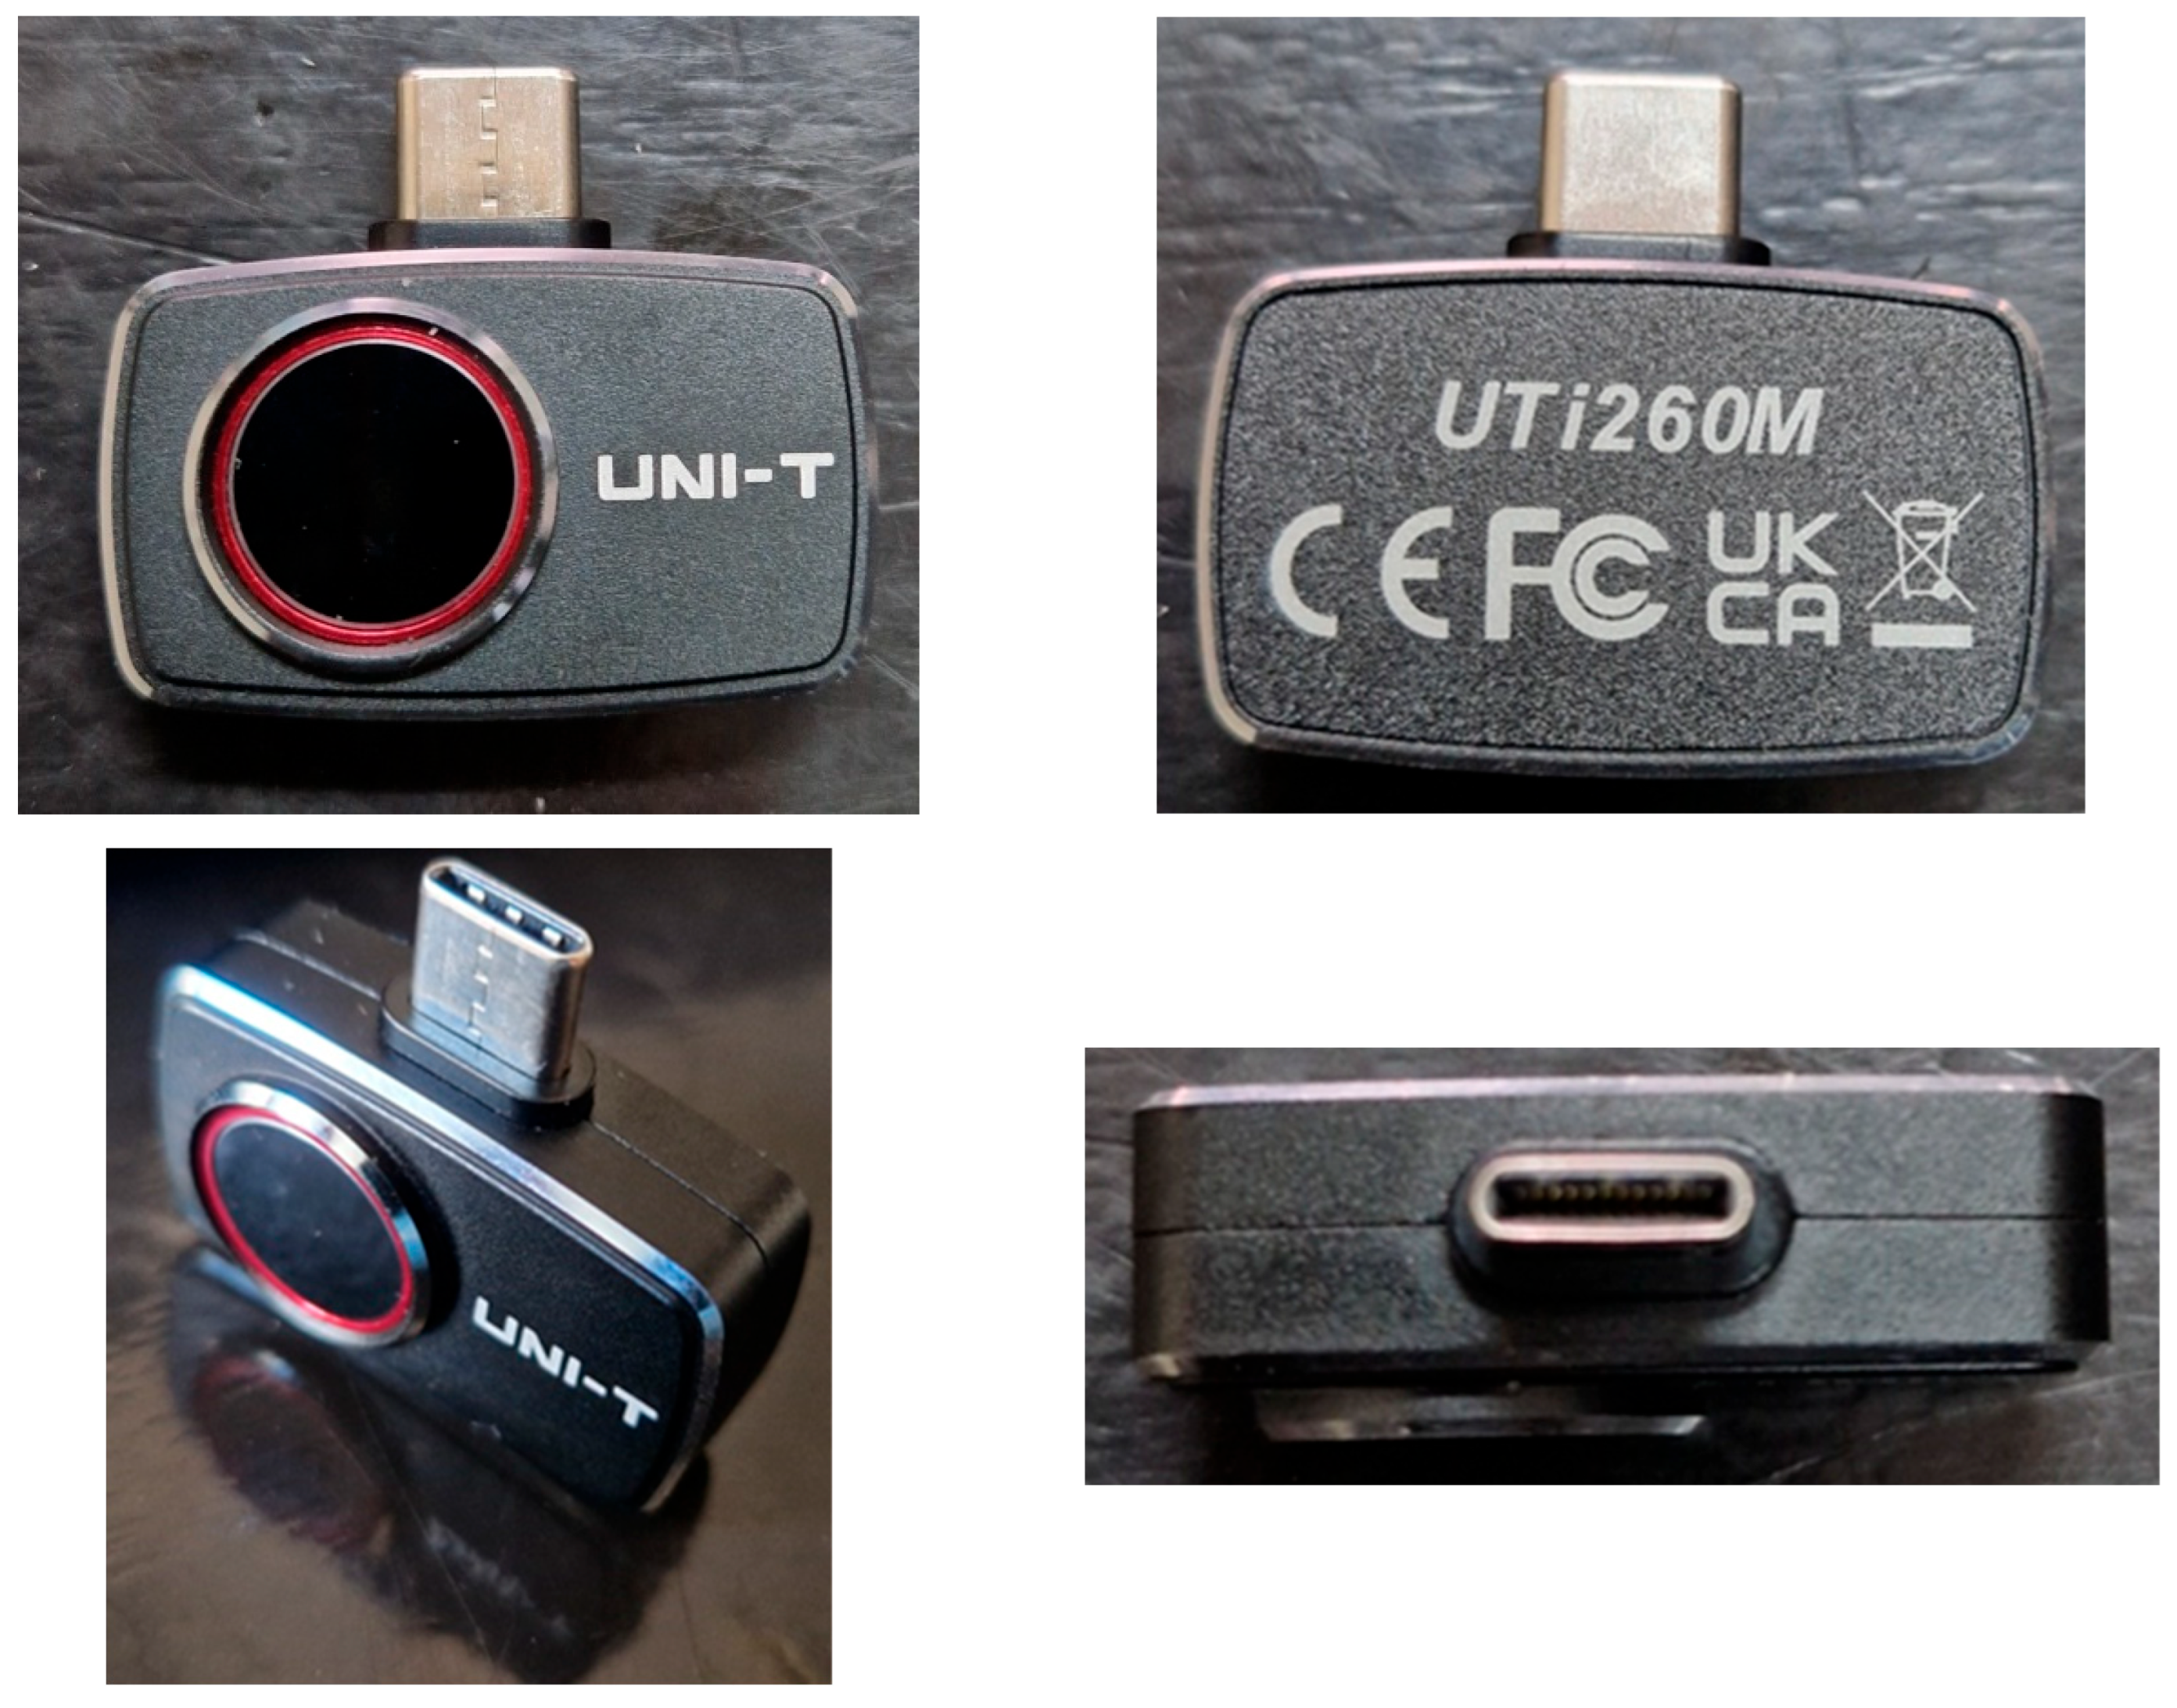
Figure 2.
Thermal camera position: (a) In Automotive Environment; (b) Thermal camera position: 1 thermal camera, 2 – human body.
Figure 2.
Thermal camera position: (a) In Automotive Environment; (b) Thermal camera position: 1 thermal camera, 2 – human body.
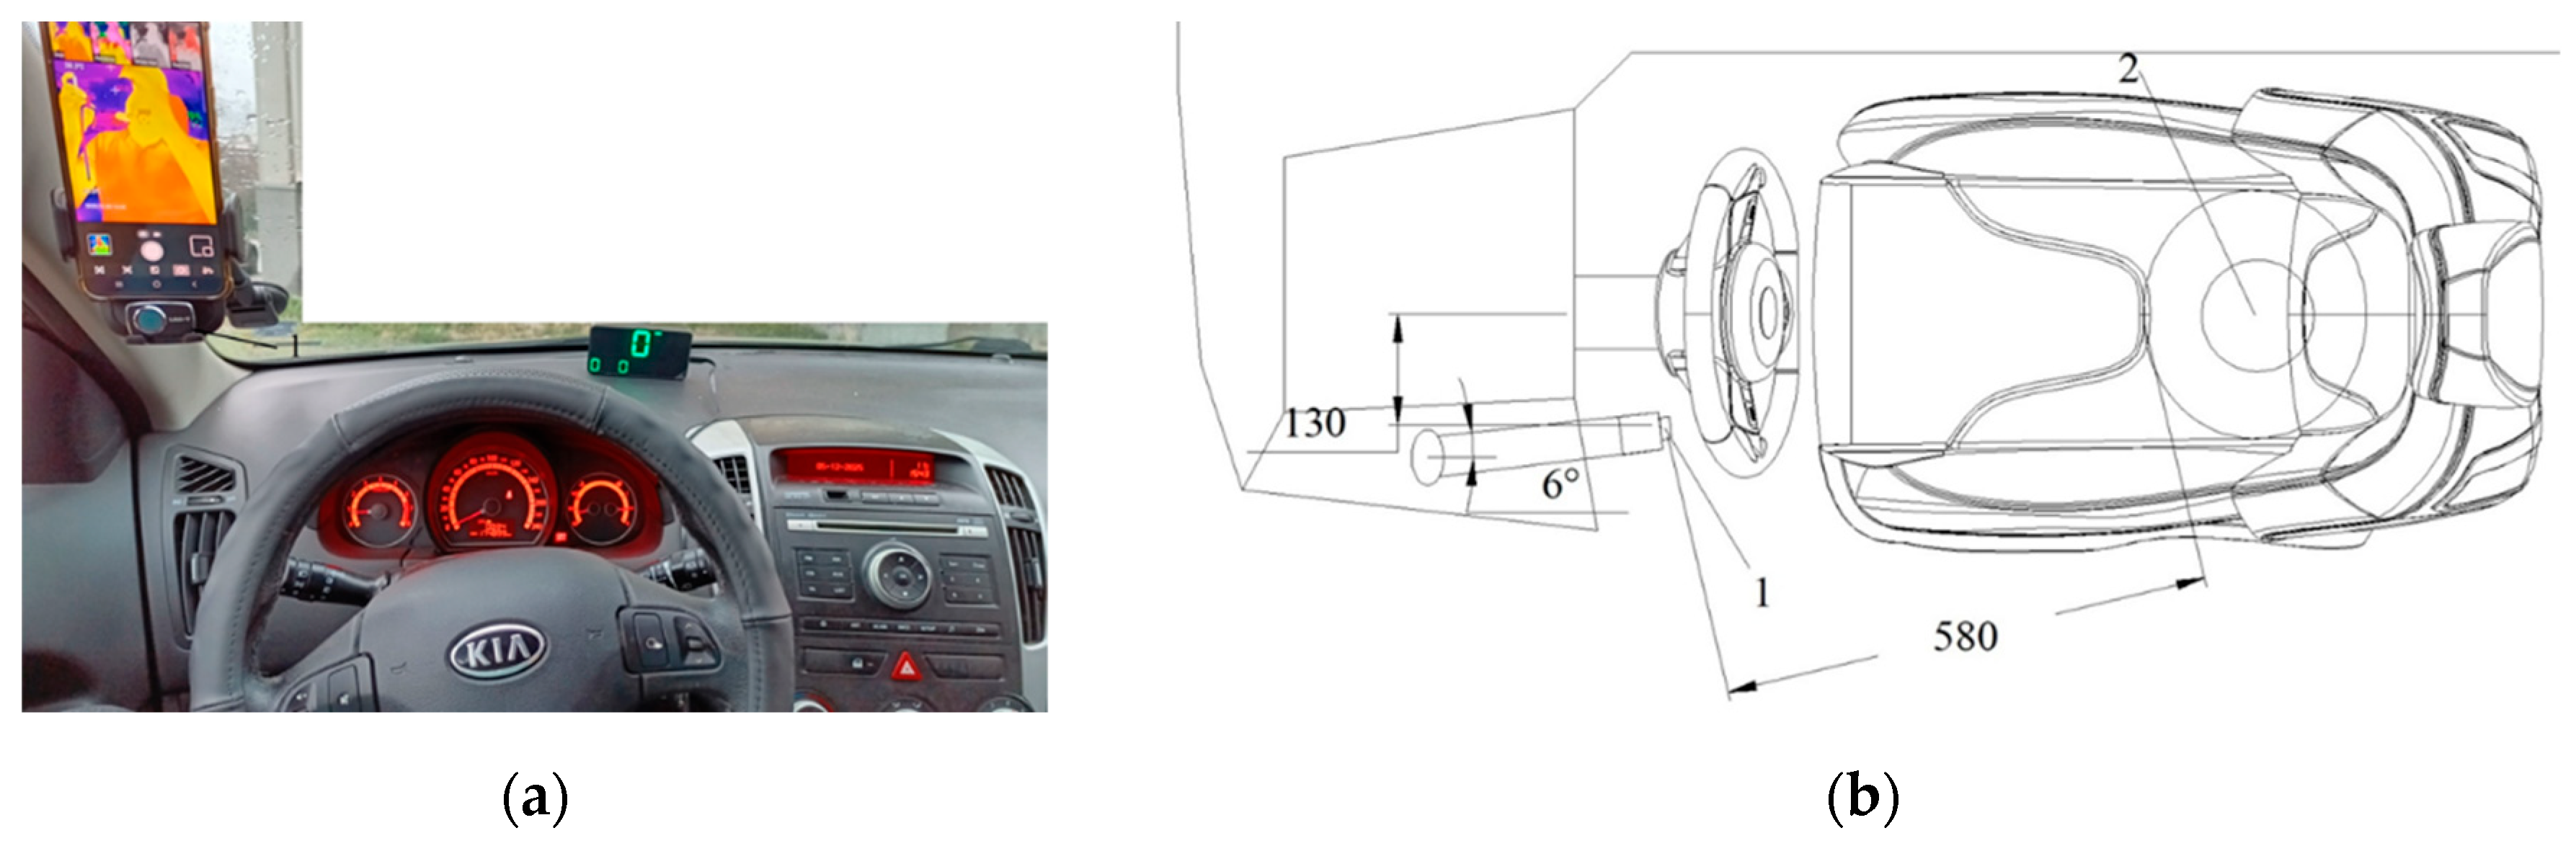
Figure 3.
Optimal heat exchange in the vehicle: (a) Outside of the vehicle; (b) Outside of the vehicle; (c) Inside of the vehicle; (d) Inside of the vehicle.
Figure 3.
Optimal heat exchange in the vehicle: (a) Outside of the vehicle; (b) Outside of the vehicle; (c) Inside of the vehicle; (d) Inside of the vehicle.
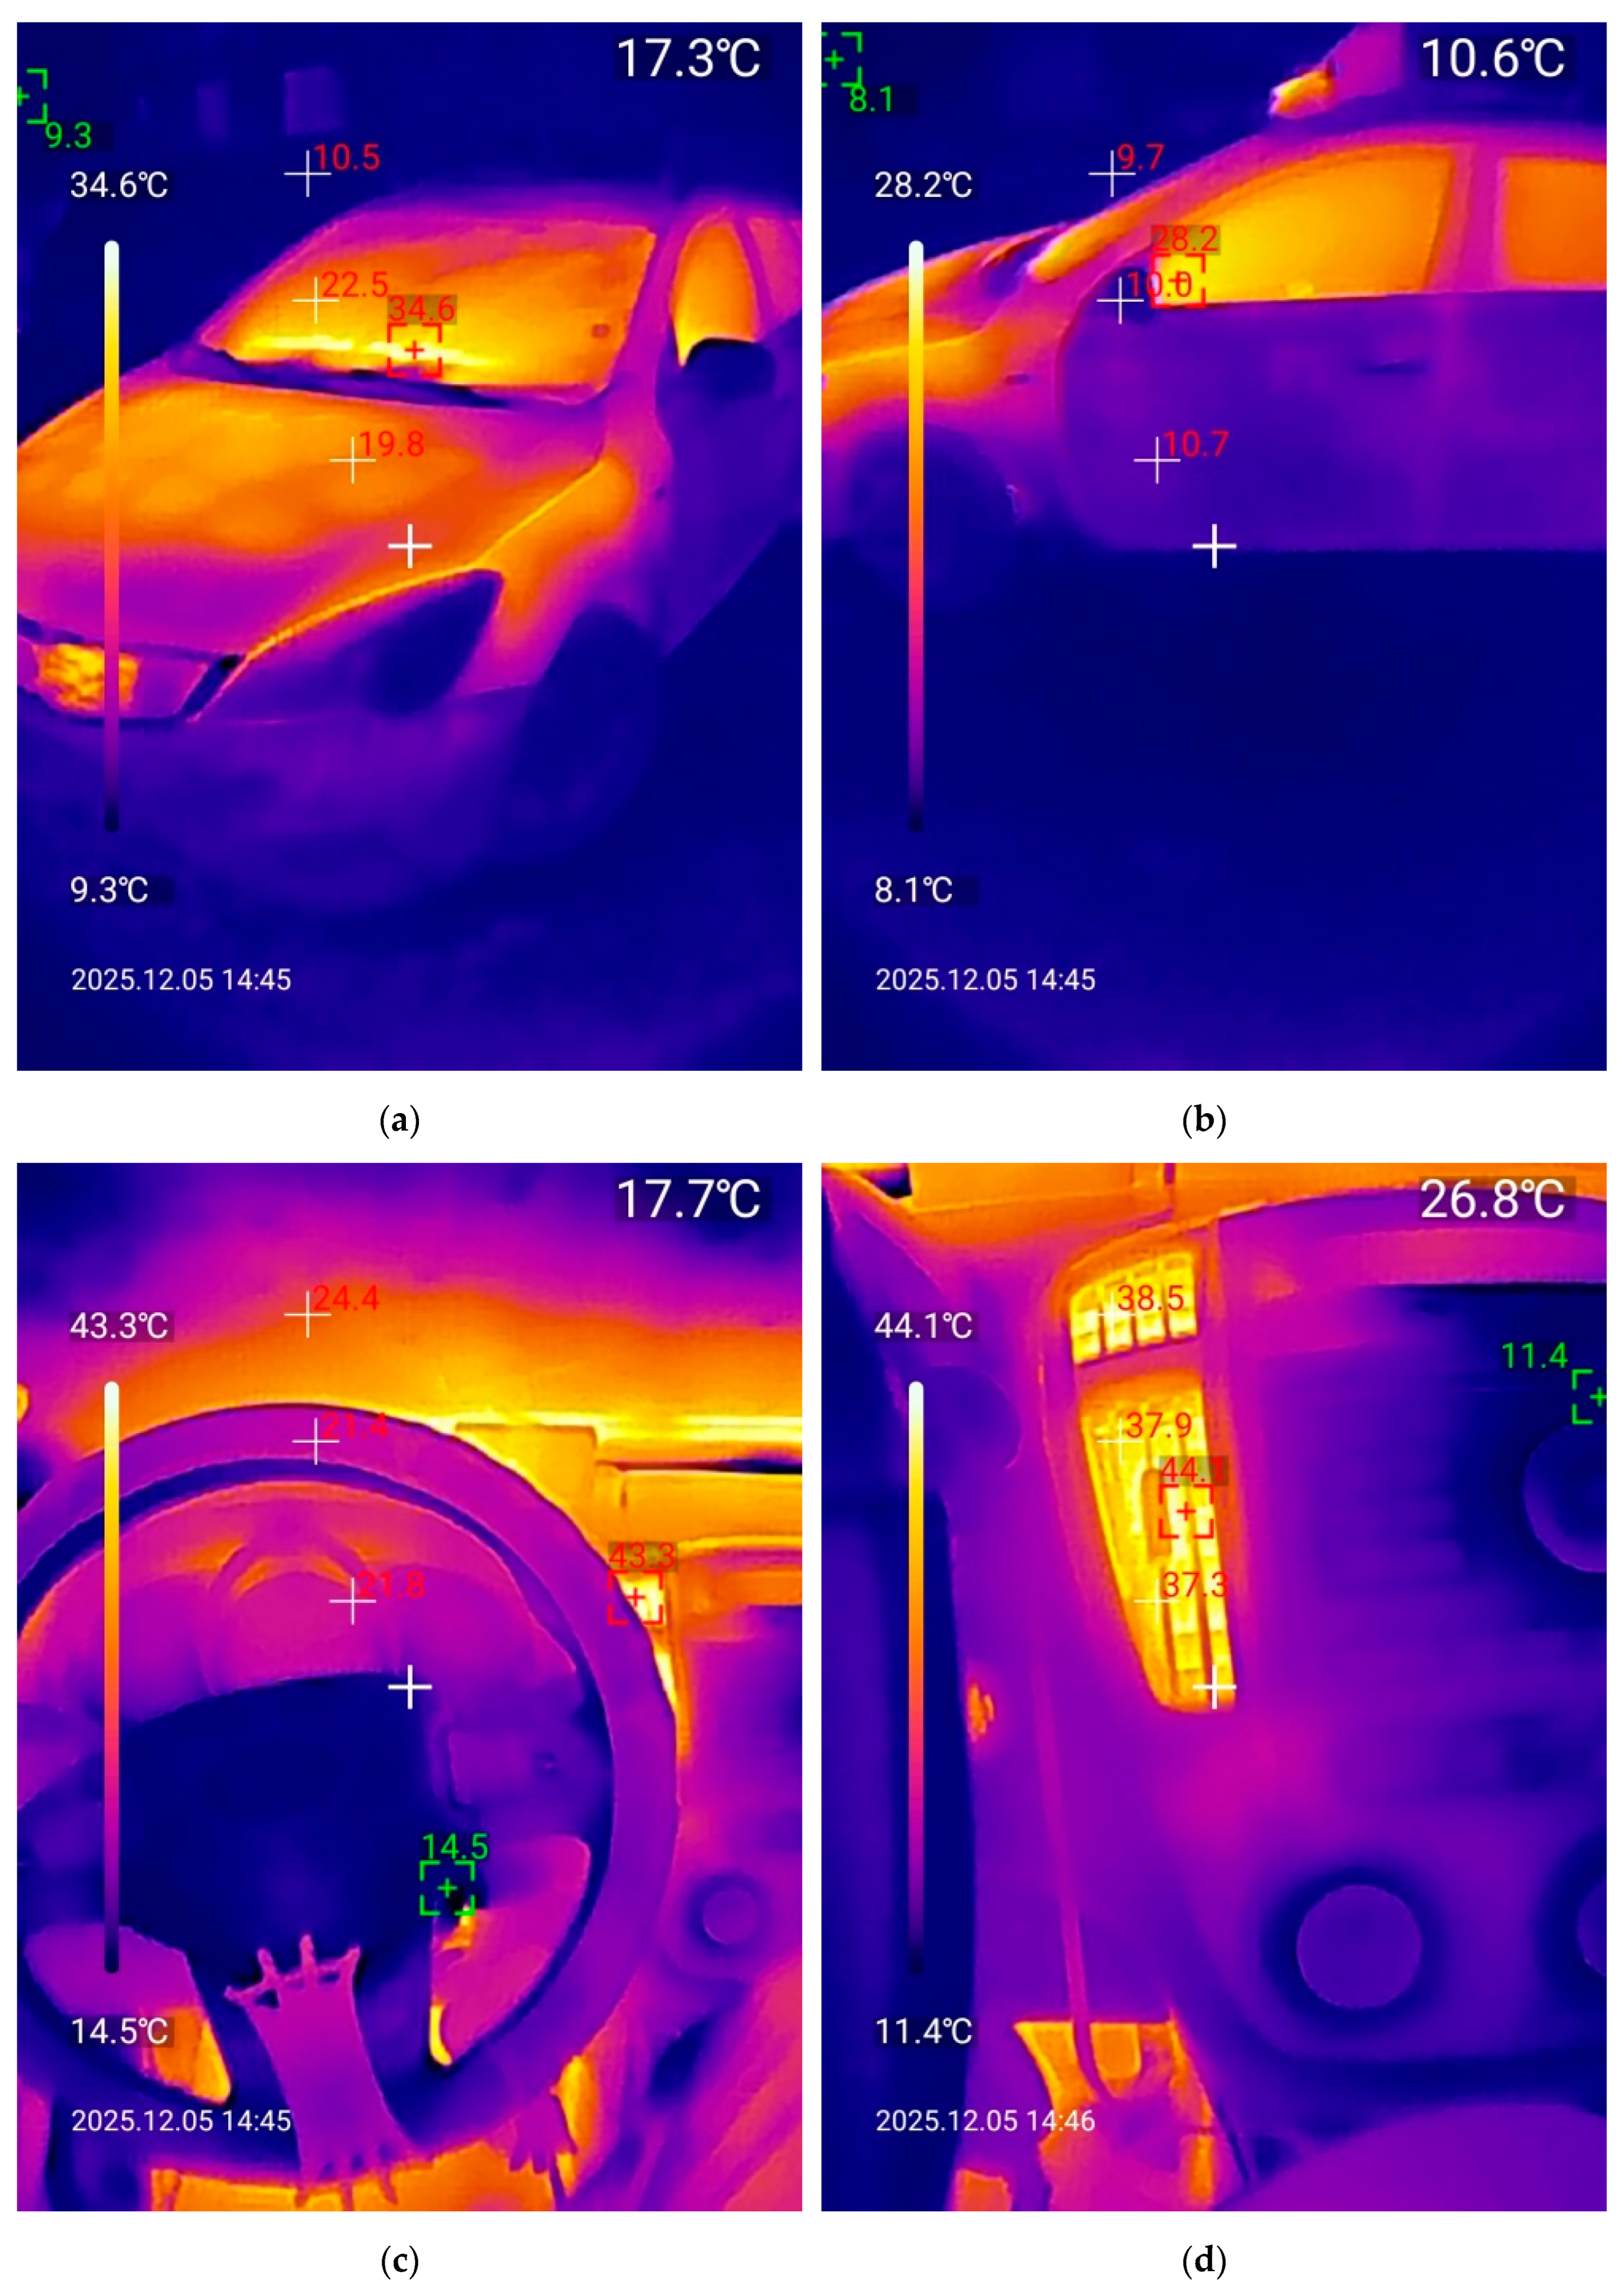
Figure 4.
Driver tracking in automotive ennvinronment in different pallites: (a) Iron red; (b) Rainbow; (c) Gray scale; (d) Red hot; (e)Black White; (f) Lava.
Figure 4.
Driver tracking in automotive ennvinronment in different pallites: (a) Iron red; (b) Rainbow; (c) Gray scale; (d) Red hot; (e)Black White; (f) Lava.
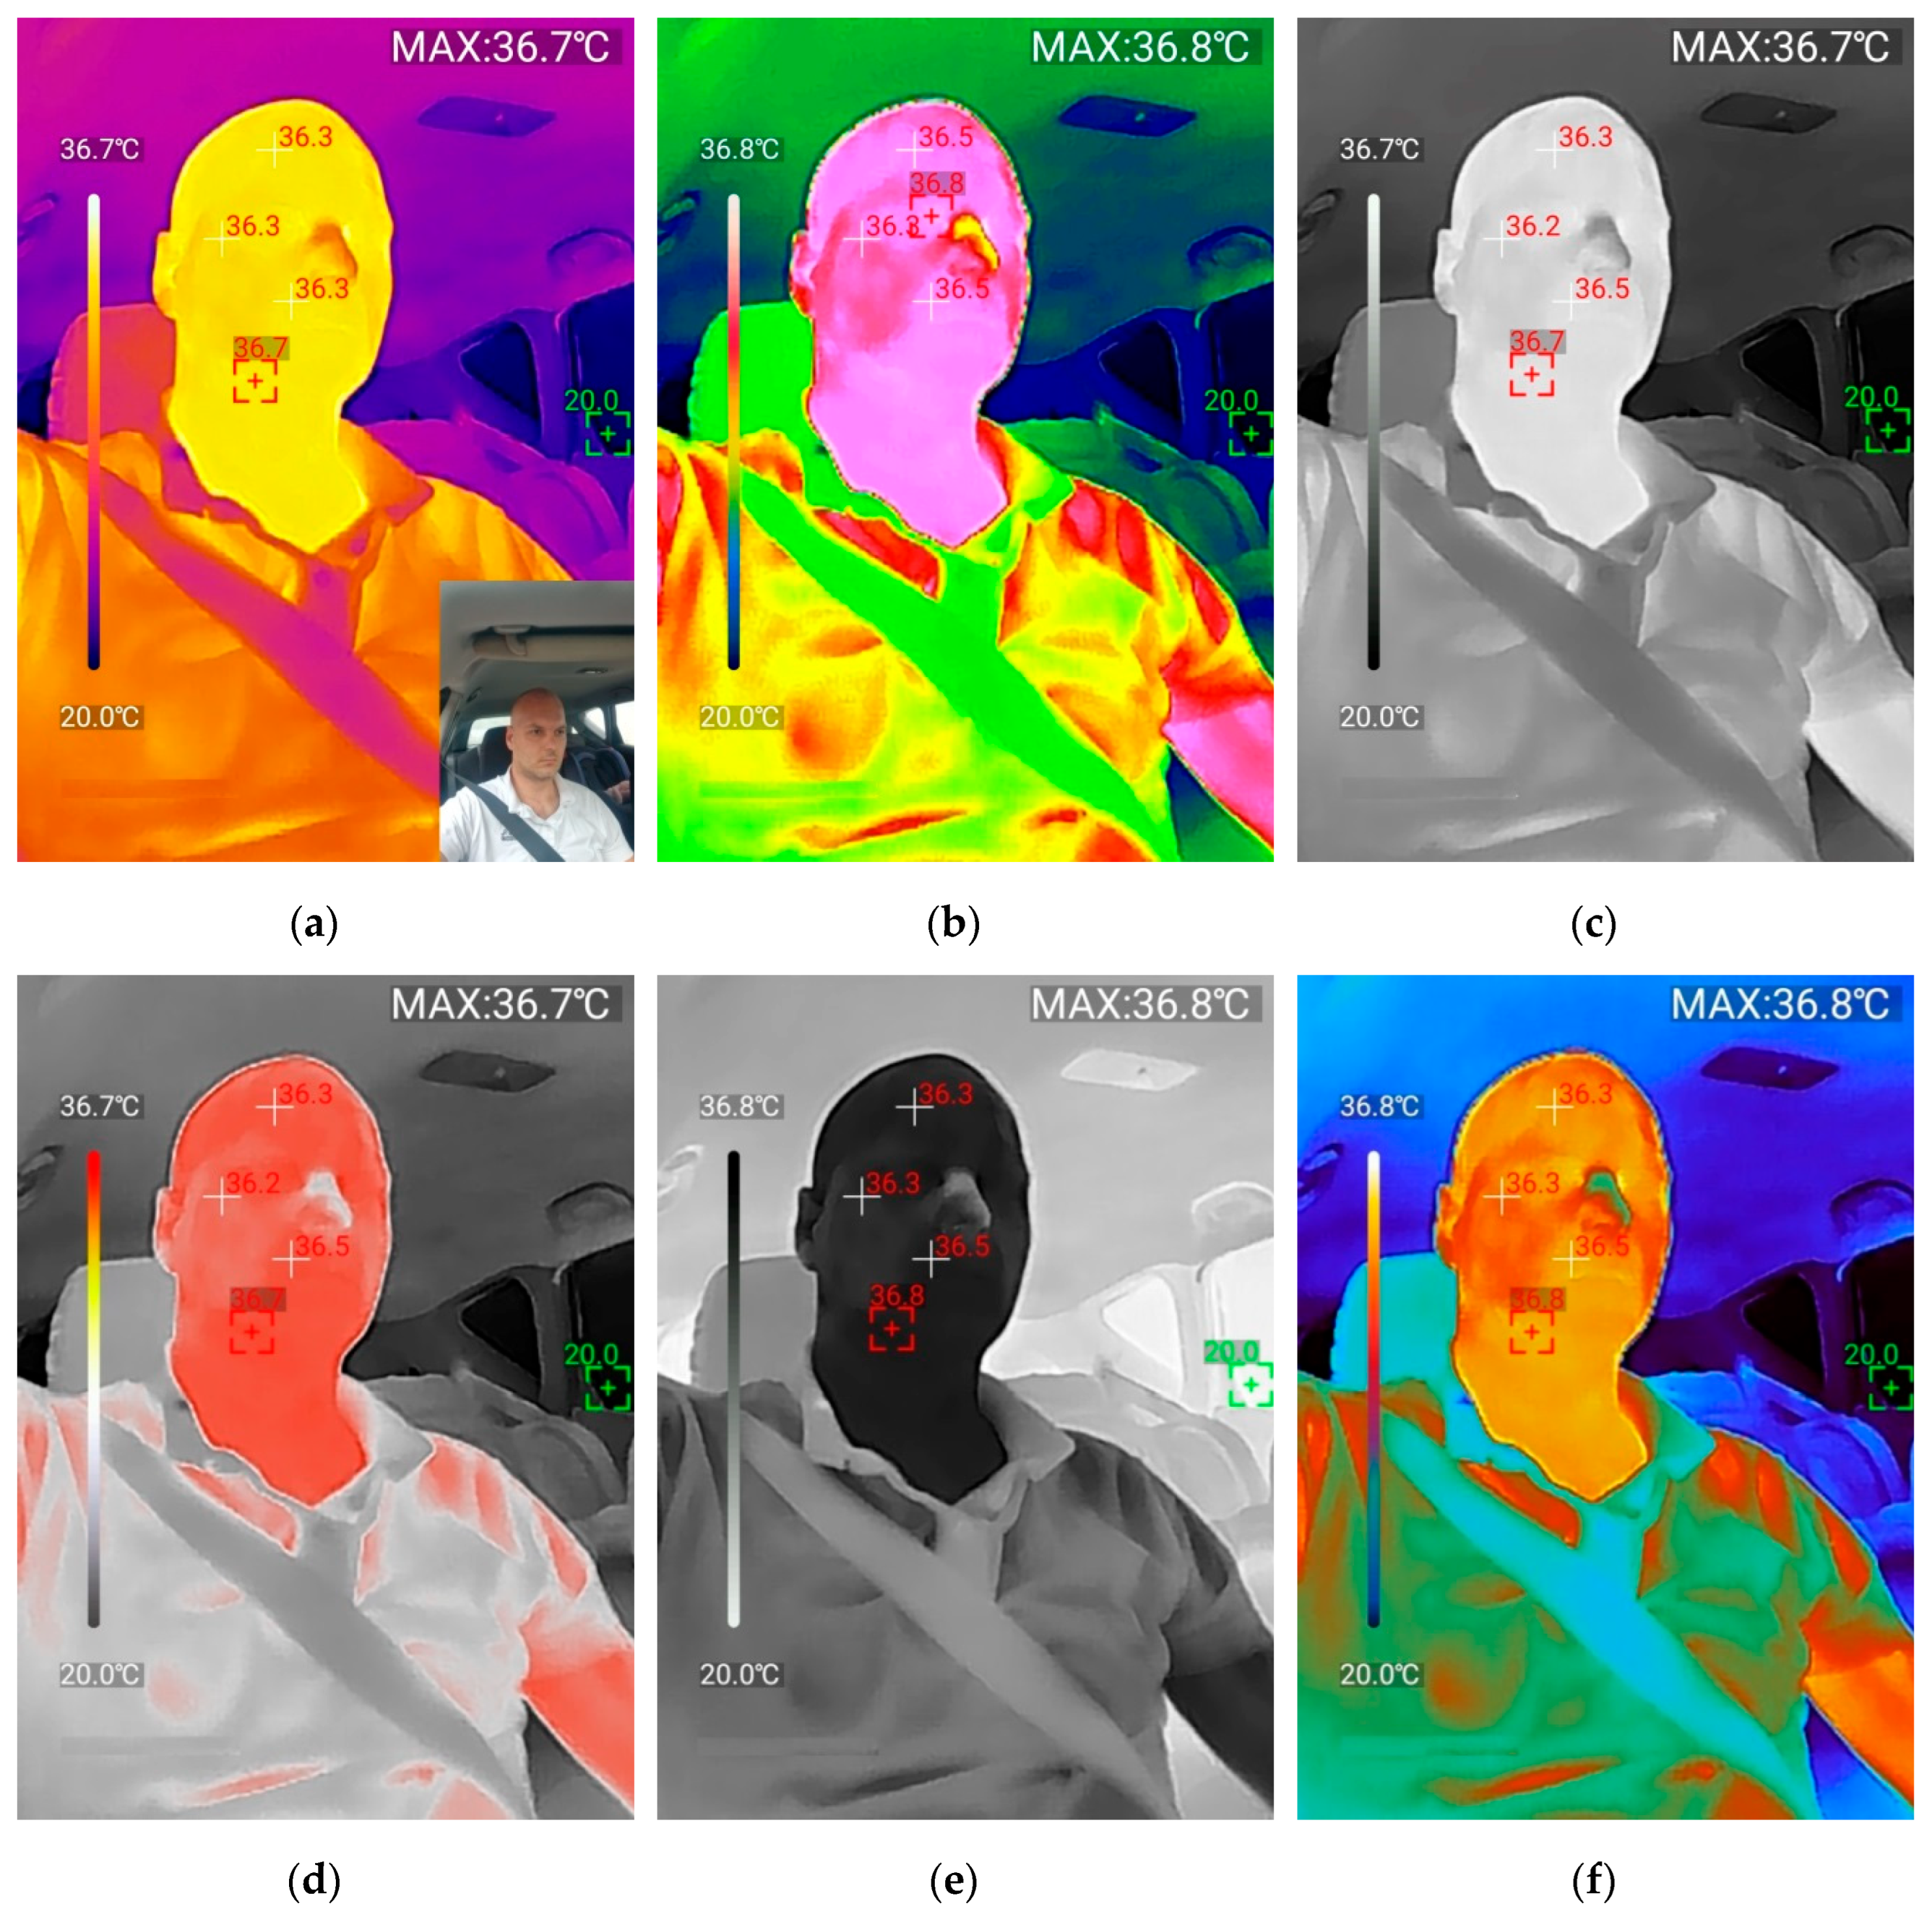
Figure 2.
Driver drowsy driving or sleep-related attentional lapses: (a) Iron red; (b) Rainbow; (c) Gray scale; (d) Red hot; (e)Black White; (f) Lava.
Figure 2.
Driver drowsy driving or sleep-related attentional lapses: (a) Iron red; (b) Rainbow; (c) Gray scale; (d) Red hot; (e)Black White; (f) Lava.
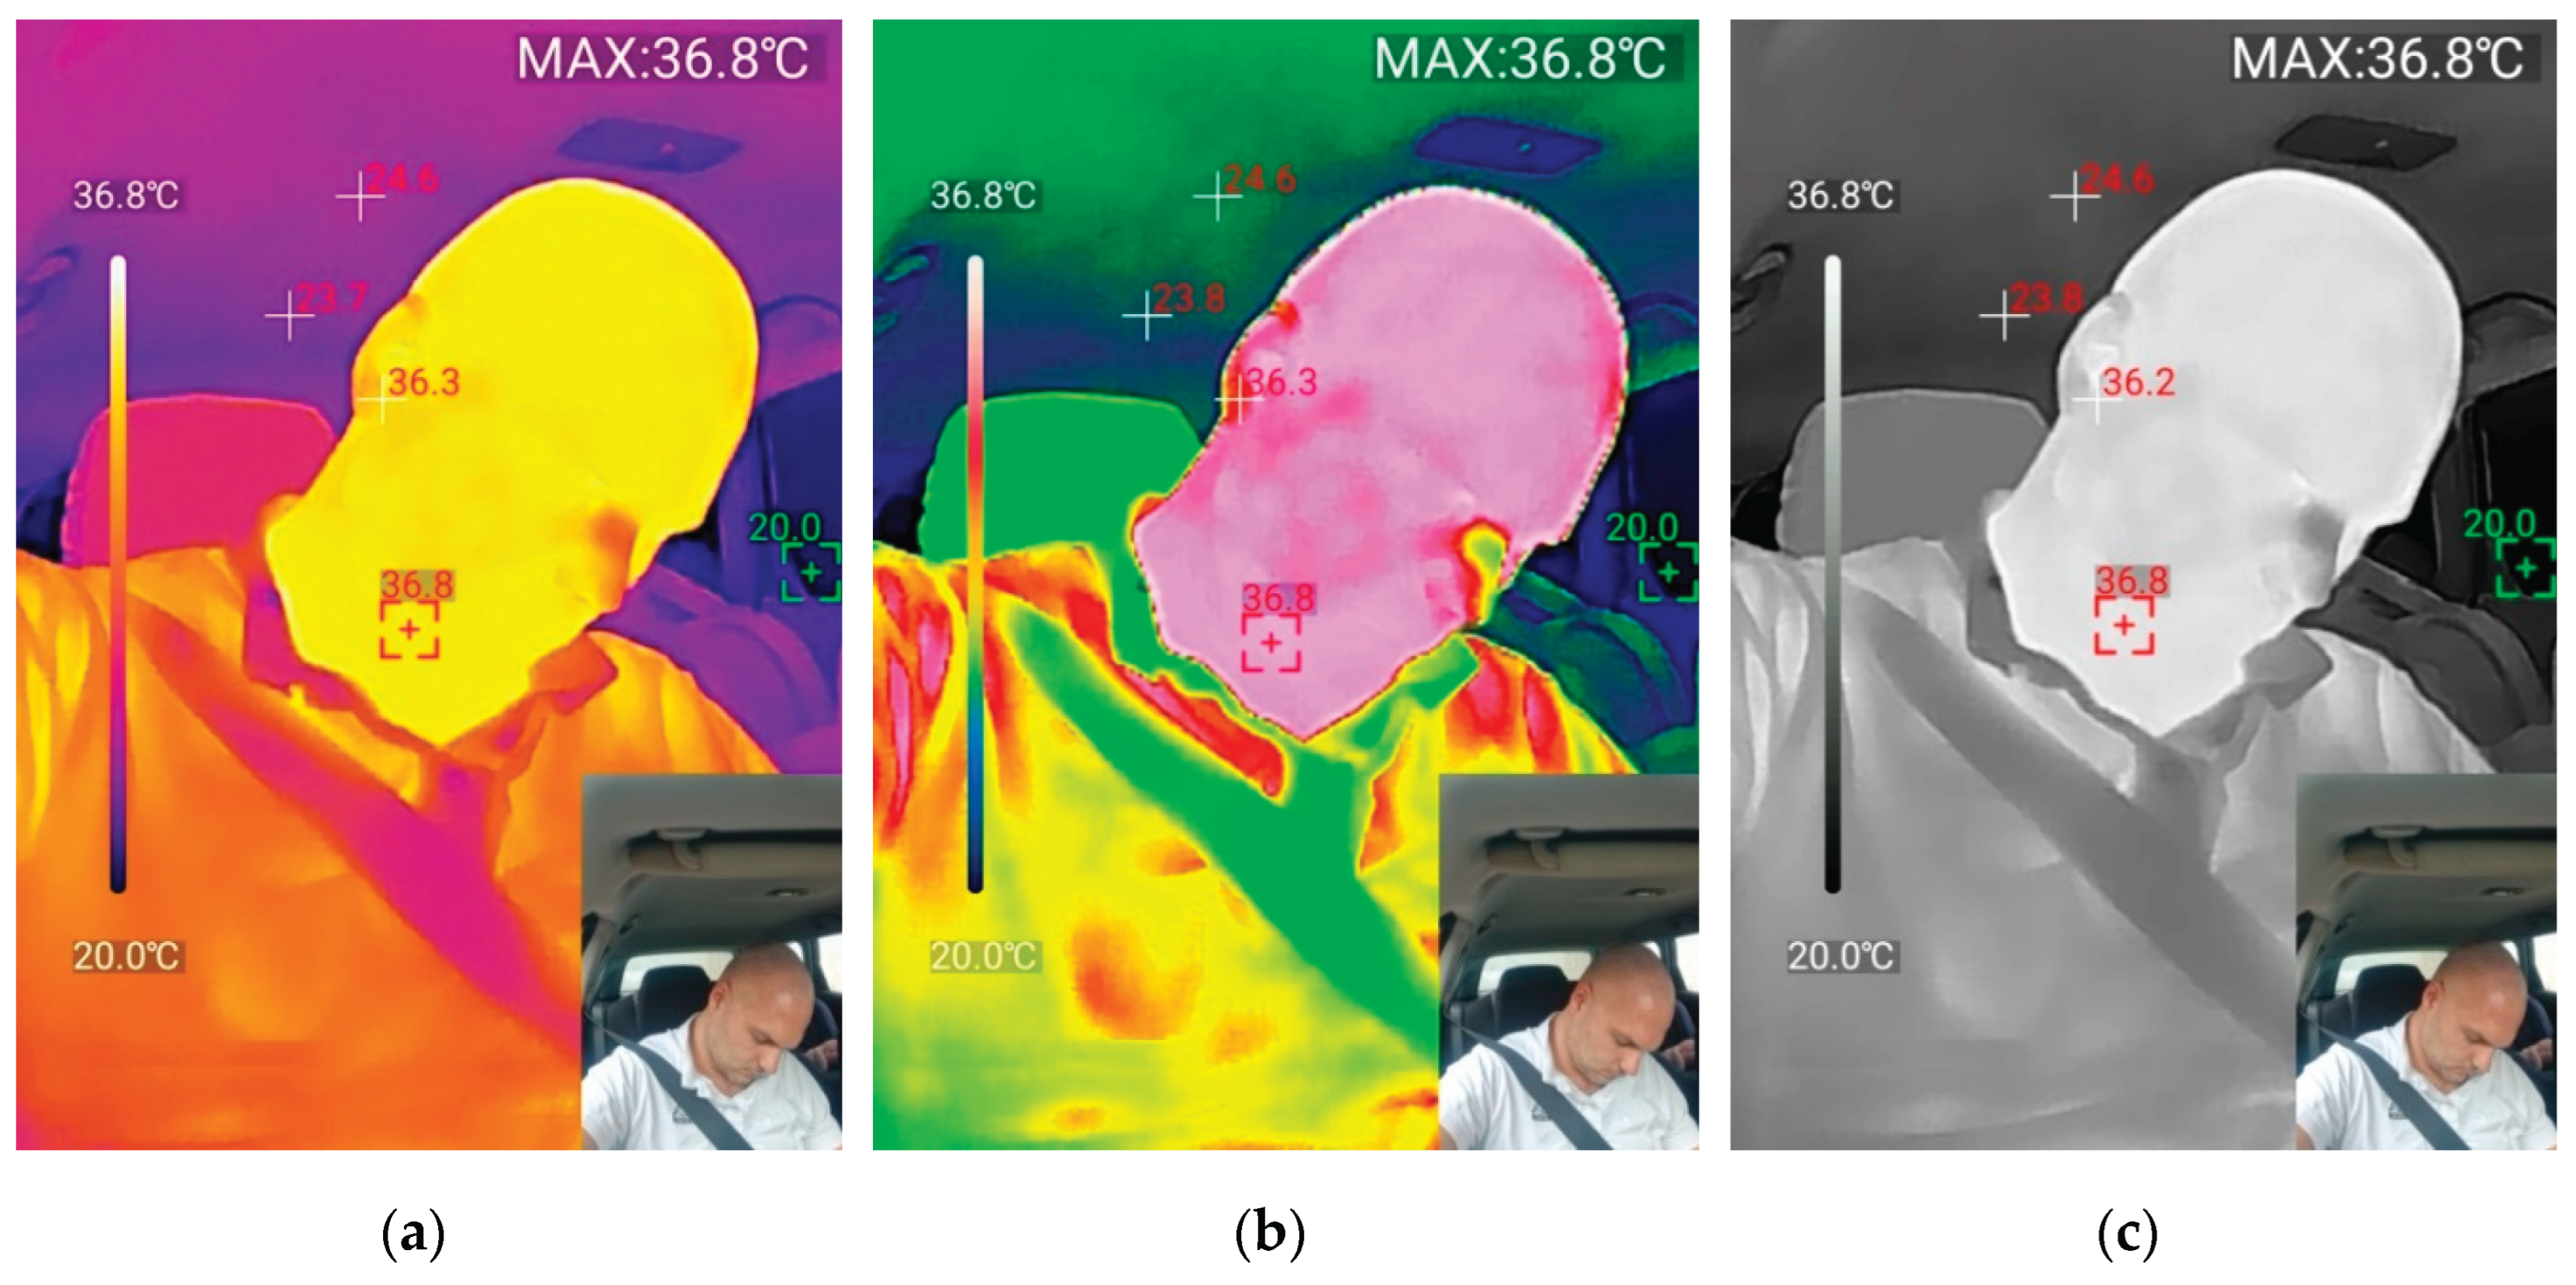
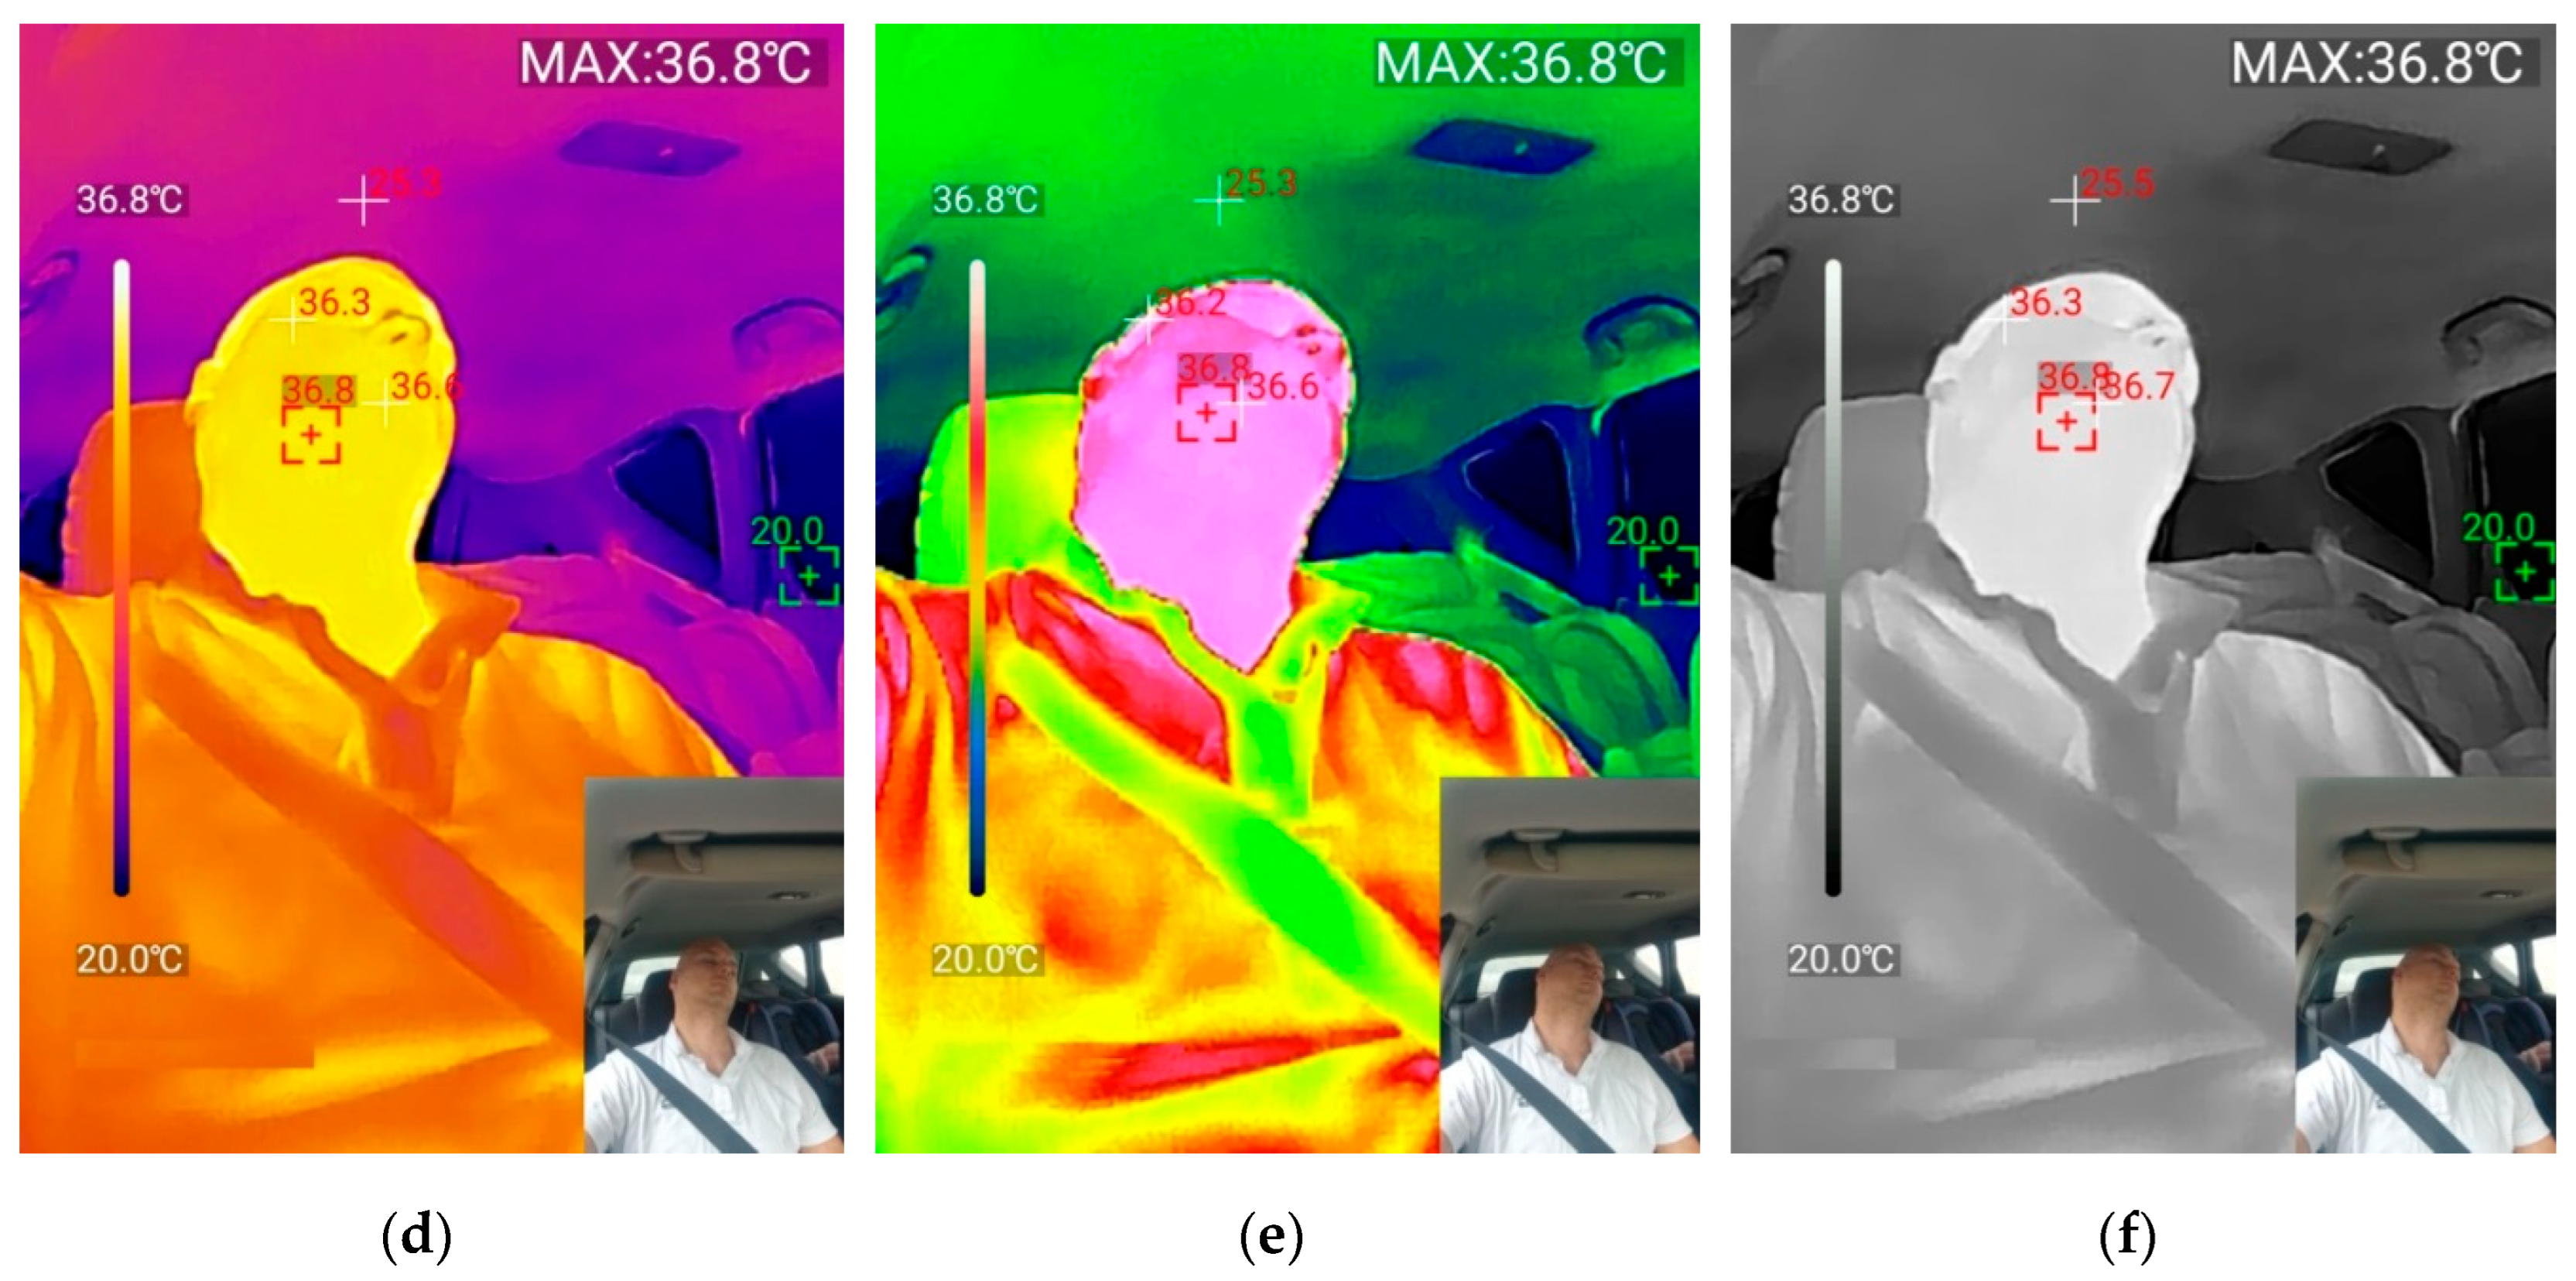
Table 1.
UTi260M thermal imager specifications.
| Sensor | Uncooled vanadium oxide |
|---|---|
| Range switching | Low temperature (-20°C-150°C), high temperature (0°C-550°C) (auto switching) |
| Modes | Industrial, human body |
| Emissivity | 0.95 (default) 0.01-1.00 |
| IR resolution | 256*192 (49152) |
| Infrared spectral bandwidth | 8-14 µm |
| Thermal sensitivity | <50mK |
| Frame rate | 25Hz |
Disclaimer/Publisher’s Note: The statements, opinions and data contained in all publications are solely those of the individual author(s) and contributor(s) and not of MDPI and/or the editor(s). MDPI and/or the editor(s) disclaim responsibility for any injury to people or property resulting from any ideas, methods, instructions or products referred to in the content. |
© 2025 by the authors. Licensee MDPI, Basel, Switzerland. This article is an open access article distributed under the terms and conditions of the Creative Commons Attribution (CC BY) license (http://creativecommons.org/licenses/by/4.0/).
Copyright: This open access article is published under a Creative Commons CC BY 4.0 license, which permit the free download, distribution, and reuse, provided that the author and preprint are cited in any reuse.


