1. Introduction
Intermolecular interactions within polymeric materials can have varied influence on their chemical and physical properties. Polyvinyl alcohol (PVA) is a synthetic polymer that is increasingly being used in biomedical applications due to its excellent biocompatibility, aqueous solubility, low toxicity, and tissue-mimicking properties [
1]. PVA can be manufactured with varying degrees of hydrolysis and molecular weight, resulting in an overall change on its chemical properties, solubility, and crystallinity behavior [
1]. Whereas the properties of single polymer systems are generally well-understood, physiochemical insight into multi-component polymer networks is poorly defined.
The properties of each individual polymer contribute to the overall physiochemical nature of the composite. Physical crosslinking is a more desirable, non-toxic method of hydrogel formulation that allows for the modification of physiochemical properties of PVA through hydrogen bonding with other polymers [
2]. Previously, Thomas et al. [
3] developed a PVA/Polyvinylpyrrolidone (PVP) hydrogel for nucleus pulposus replacement and found that swelling was dependent on the ratio of PVA/PVP, with higher amounts of PVP resulting in higher swelling ratios. The amorphous nature of the PVP and its higher affinity for water made PVP-dominant blends swell to a greater extent, which was also seen with higher molecular weights of both PVA and PVP [
3]. Conversely, Liu et al. [
4] developed a physically crosslinked PVA/Gelatin hydrogel and described identical thermal melting properties between hydrogels produced through PVA alone and hybrid materials. The authors attributed the similar thermal properties to the weak hydrogen bonding between polymers, minimally influencing the thermal characteristics of the hydrogel.
A less common method for producing PVA hydrogels is a hybrid approach developed by Ruberti and Braithwaite [
5]. In this technique, a gelling agent such as low molecular weight Polyethylene glycol (PEG) decreases the solvent quality (e.g., water) in the PVA solution. This causes phase separation in the PVA, forming polymer-rich and solvent-rich regions, with the PVA crystallizing in the polymer-rich areas without the need for freeze-thaw cycles [
6]. The addition of PEG to the aqueous PVA solution leads to phase separation, creating a polymer-dense gel phase and a dilute, water-dense supernatant when PEG with a molecular weight above 600 Da is used. Lim [
7] observed a reduction in hydrogen bonding in vinyl alcohol units caused by PEG, which was identified using FTIR analysis. Furthermore, Lim found that the molecular weight of PEG influences its plasticizing effect [
7] and impacts crystallite formation in PVA films (87% hydrolyzed), suggesting that PEG introduces defects into the PVA crystal lattice.
As phase-separated hydrogels present a multi-component system consisting of a polymer-rich hydrogel and aqueous-based supernatant, it is challenging to extrapolate molecular behavior of individual components to the entire characteristics and nature of the composite polymer matrix [
8]. Thus, it is necessary to use multiple methods of polymer analysis to determine the physiochemical and material properties of a multi-component polymer matrix, such as a PVA/PEG/PVP hydrogel for biomedical applications. Furthermore, as these hydrogels present two unique phase separations, it is important to understand the polymer composition of each component during manufacturing. Typically, the composition of multicomponent polymer systems is characterized by
1H Nuclear Magnetic Resonance (NMR) Spectroscopy [
9,
10]. It is particularly useful for polymer chemical structure and compositional analysis as nearly all polymers have unique protons for analysis. Gel permeation chromatography (GPC) and other similar size exclusion methods can be used for compositional analysis of blends [
11], but are oftentimes challenging due to overlapping peaks, requiring the need for peak deconvolution or use of another analysis method [
12]. In this work, we propose a novel method of individual polymer composition analysis using Advanced Polymer Chromatography (APC) and Thermal Gravimetric Analysis (TGA). Nuclear Magnetic Resonance (NMR) will be used to validate the proposed method and functional group interactions between polymer components will be identified and compared using Fourier Transform Infrared Spectroscopy (FTIR) to better understand physiochemical changes with composite hydrogels with varying polymer concentrations.
2. Materials and Methods
2.1. Materials
PVA with a molecular weight of 145000 g∙mol−1 and >99% hydrolyzed was obtained from EMD Millipore Corporation (Billerica, MA). PEG with a molecular weight of 1000 g∙mol−1 and PVP with a molecular weight of 40000 g∙mol−1 were obtained from Spectrum Chemical (New Brunswick, NJ). Deionized (DI) water was obtained on-site using a Millipore Milli-Q system (Darmstadt, Germany). For the APC eluent, sodium nitrate (NaNO3) was obtained from MilliporeSigma (Burlington, MA) and HPLC grade, 99.9% dimethyl sulfoxide (DMSO) was purchased from Thermo Fisher Scientific (Waltham, MA). Deuterium oxide (D2O) was purchased from TCI America (Portland, Oregon) for NMR analysis.
2.2. Hydrogel Preparation
Hydrogels were prepared using an adapted freeze-thaw method previously described by Peppas [
13] and LaMastro [
14]. Briefly, aqueous solutions of PVA were prepared by steam autoclaving sealed bottles containing the previously mentioned raw materials at 121°C at 30 psi for 30 minutes. Within 10 minutes after the first autoclave cycle, the solution was stirred manually by spatula to ensure complete dissolution of the two polymers. While the solutions were still hot, PEG and additional DI water was then added to sterile glass vials to make several different formulations summarized in
Table 1. The solutions were then stirred manually again and placed in a 100˚C thermal heating oven for 2 hours to ensure complete dissolution of polymer components and initiate phase separation. The solutions were then cooled at room temperature for 3 hours and then placed in a -20˚C freezer overnight to initiate the cryo-gel formation. The total mass of components was fixed at 10 g to ensure sufficient material for all testing procedures. Hydrogels were made with and without PVP to assess the potential intermolecular changes that a small addition of the polymer may initiate. Hydrogels made with PVP were prepared by autoclaving aqueous solutions of PVA and PVP (99:1 w/w%) following the same procedure outlined previously. PVP content was assumed negligible for subsequent quantitative analysis due to its minimal contribution to the total mass of the biomaterial and overlapping spectral and thermal properties with PVA.
2.3. Polymer Compositional Analysis
To understand the final hydrogel composition following phase separations, samples were lyophilized at -80˚C for at least 72 hours with a Labconco FreeZone 4.5 Liter Benchtop Freeze Dry System. Samples were then cryogenically milled using a RETSCH cryomill and liquid nitrogen feed supply to maximize polymer surface area and ensure polymer homogenization during further testing. The hydrogels were individually ground for a total of 5 cycles with a pre-cooling time of 1:30 minutes at 5 Hz, grinding time of 3:30 minutes at 30 Hz, and intermediate cooling time of 1:00 minute at 5 Hz.
2.3.1. NMR
10 mg of each ground hydrogel formulation was weighed and placed into sterile glass vials with 1 mL of deuterium oxide (D2O). Samples were heated at 100˚C for at least 1 hour to allow for complete dissolution before being pipetted to NMR testing tubes and subsequently analyzed. 1H NMR spectra were recorded on a Fourier transform nuclear magnetic resonance spectrometer (Bruker AV II-600 MHz, AV II-400 MHz; Bruker Corporation, Switzerland) at 25°C.
2.3.2. APC
Briefly, a 0.01M sodium nitrate (NaNO3) solution of 95/5 v/v % DI water and dimethyl sulfoxide (DMSO) was made to dissolve test articles and as the eluent in the mobile phase. A small amount of sample was weighed in a sterile glass vial and dissolved in enough mobile phase so that the concentration of the sample was 4mg/ml. The glass vial was then placed on a hot plate at 100˚C for 1 hour to allow for complete dissolution of the polymer. After complete dissolution, the sample was filtered through a 0.1µm PTFE syringe filter and transferred to a Waters® Clear Glass 12 x 32 mm Screw Neck Vial with PTFE/Silicone Preslit Septum.
An ACQUITY APC AQ BEH Column, 200Å, 2.5 µm, 4.6 mm X 75 mm and ACQUITY APC AQ BEH Column, 125 Å, 2.5 µm, 4.6 mm X 30 mm were connected in series with an XBridge Protein BEH SEC Guard Column, 125Å, 2.5 µm, 4.6 mm X 30 mm during testing. Samples were tested at a flow rate of 0.3mL/min and an injection volume of 10µL was used. The column and refractive index (RI) temperature were set to 50˚C on the Waters® Acquity APC System. The RI was purged with methanol for 70 minutes and the mobile phase was allowed to equilibrate for 30 minutes before subsequent testing.
To allow for individual quantification of PVA and PEG within the hydrogel composite, concentration curves for each polymer were made by making respective samples of 4, 3, 2, 1, 0.5, and 0.25 mg/mL. The area under the curve of each polymer was recorded and used to create a linear relationship between concentration and mV, where the slope of the model was used for theoretical concentration calculations. The concentration curves for PVA and PEG, respectively, can be found in
Figures S1 and S2.
2.3.3. PVA/PEG Hydrogel Component Analysis Through the Use of TGA
100µL platinum TGA sample pans were cleaned and tared before use. All TGA testing was conducted in air with a sample flow rate of 25mL/min and balance flow of 40mL/min. Preliminary testing of individual polymer materials of the hydrogel indicated complete decomposition of PEG and PVA at 250°C and 550°C, respectively (see
Figure S3 and
Figure S4). Minimal weight loss was identified for PVA until 300°C and the combination of both materials’ distinct thermal patterns, identified by plateaus for each corresponding polymer material (see
Figure S5), allows for development of a TGA method to quantify polymer content
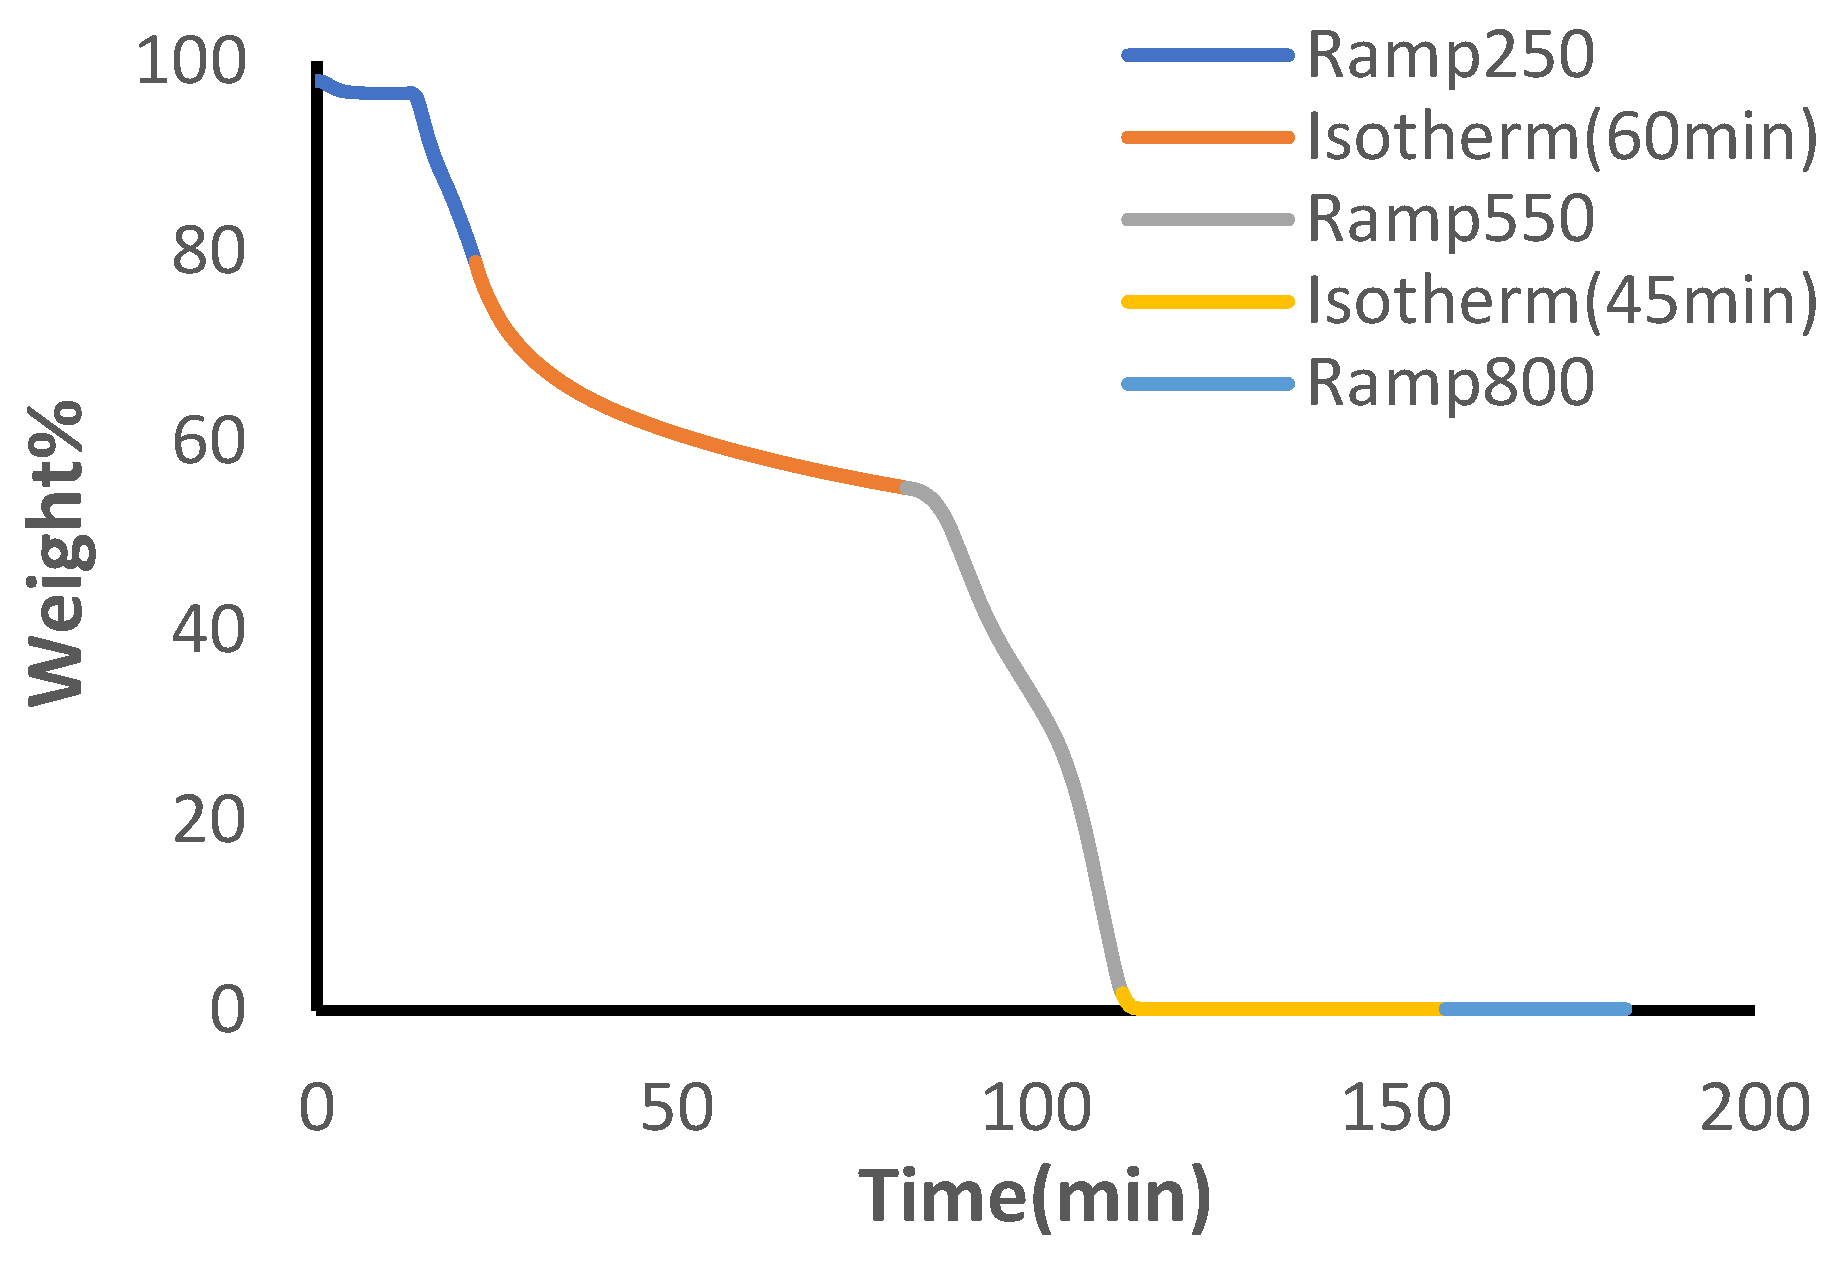
. The developed method applied a 10°C/min temperature ramp until 250°C after equilibration at 30°C, followed by 60 minutes of isothermal heating. A secondary temperature ramp was applied until 550°C and the temperature was held isothermally for an additional 45 minutes. Finally, a third temperature ramp was applied until 800°C.
Mass % calculations were obtained by subtracting weight percent values throughout isothermal holding cyles to get a representative indication of PEG and PVA content. For all calculations, the weight % of PVP was assumed negligible due to its minimal mass contribution to the overall components of the biomaterial. In order to calculate the weight percent of PEG in the sample, the initial weight percent at the start of the experiment was subtracted from the value at the end of the 250°C heating cycle (Equation 1.1).
To calculate the weight percent of PVA in the sample, the initial weight percent at the start of the experiment was subtracted from the value at the end of the 550°C isothermal heating cycle. This value is representative of the total PEG and PVA content in the whole sample. To calculate the PVA content, the previously found value for PEG weight % was subtracted from the total PEG and PVA content (Equation 1.2).
2.3.4. FTIR
FTIR spectra were collected using a Nicolet is50 Spectrometer equipped with a KBr beam splitter, and single reflection diamond Attenuated Total Reflectance (ATR) attachment. Spectra were obtained with 32 scans and 4 cm
-1 resolution in the range of 4000 cm
-1 to 650 cm
-1. Spectra were preprocessed and normalized using the Omnic
TM software suite from ThermoFischer Scientific. A modified specific area under band (SAUB) method from Wallis et al. [
15] was used to calculate the area of the -OH bonding region between 3650 cm
-1 - 3000 cm
-1.
3. Results
3.1. NMR
A representative NMR spectrum for the highest PVA content of manufactured hydrogels is shown in
Figure 1; characteristic methylene (CH
2) and methine (CH) peaks can be seen for PVA around 1.6 ppm and 3.9 ppm, respectively, matching prior literature findings [
16,
17]. A characteristic methylene peak at 3.7 ppm can also be seen for PEG that others have reported [
18]. By integrating the area of the methylene peaks for both PVA and PEG and accounting for the number of hydrogens at each peak location, the theoretical concentrations of dry mass can be determined in each hydrogel formulation. Spectra between samples with and without PVP were found to be identical and did not exhibit formation of a characteristic prominent signal from the CH
2 groups in the pyrrolidone ring around 2.4 – 2.5 ppm that others have identified [
19,
20].
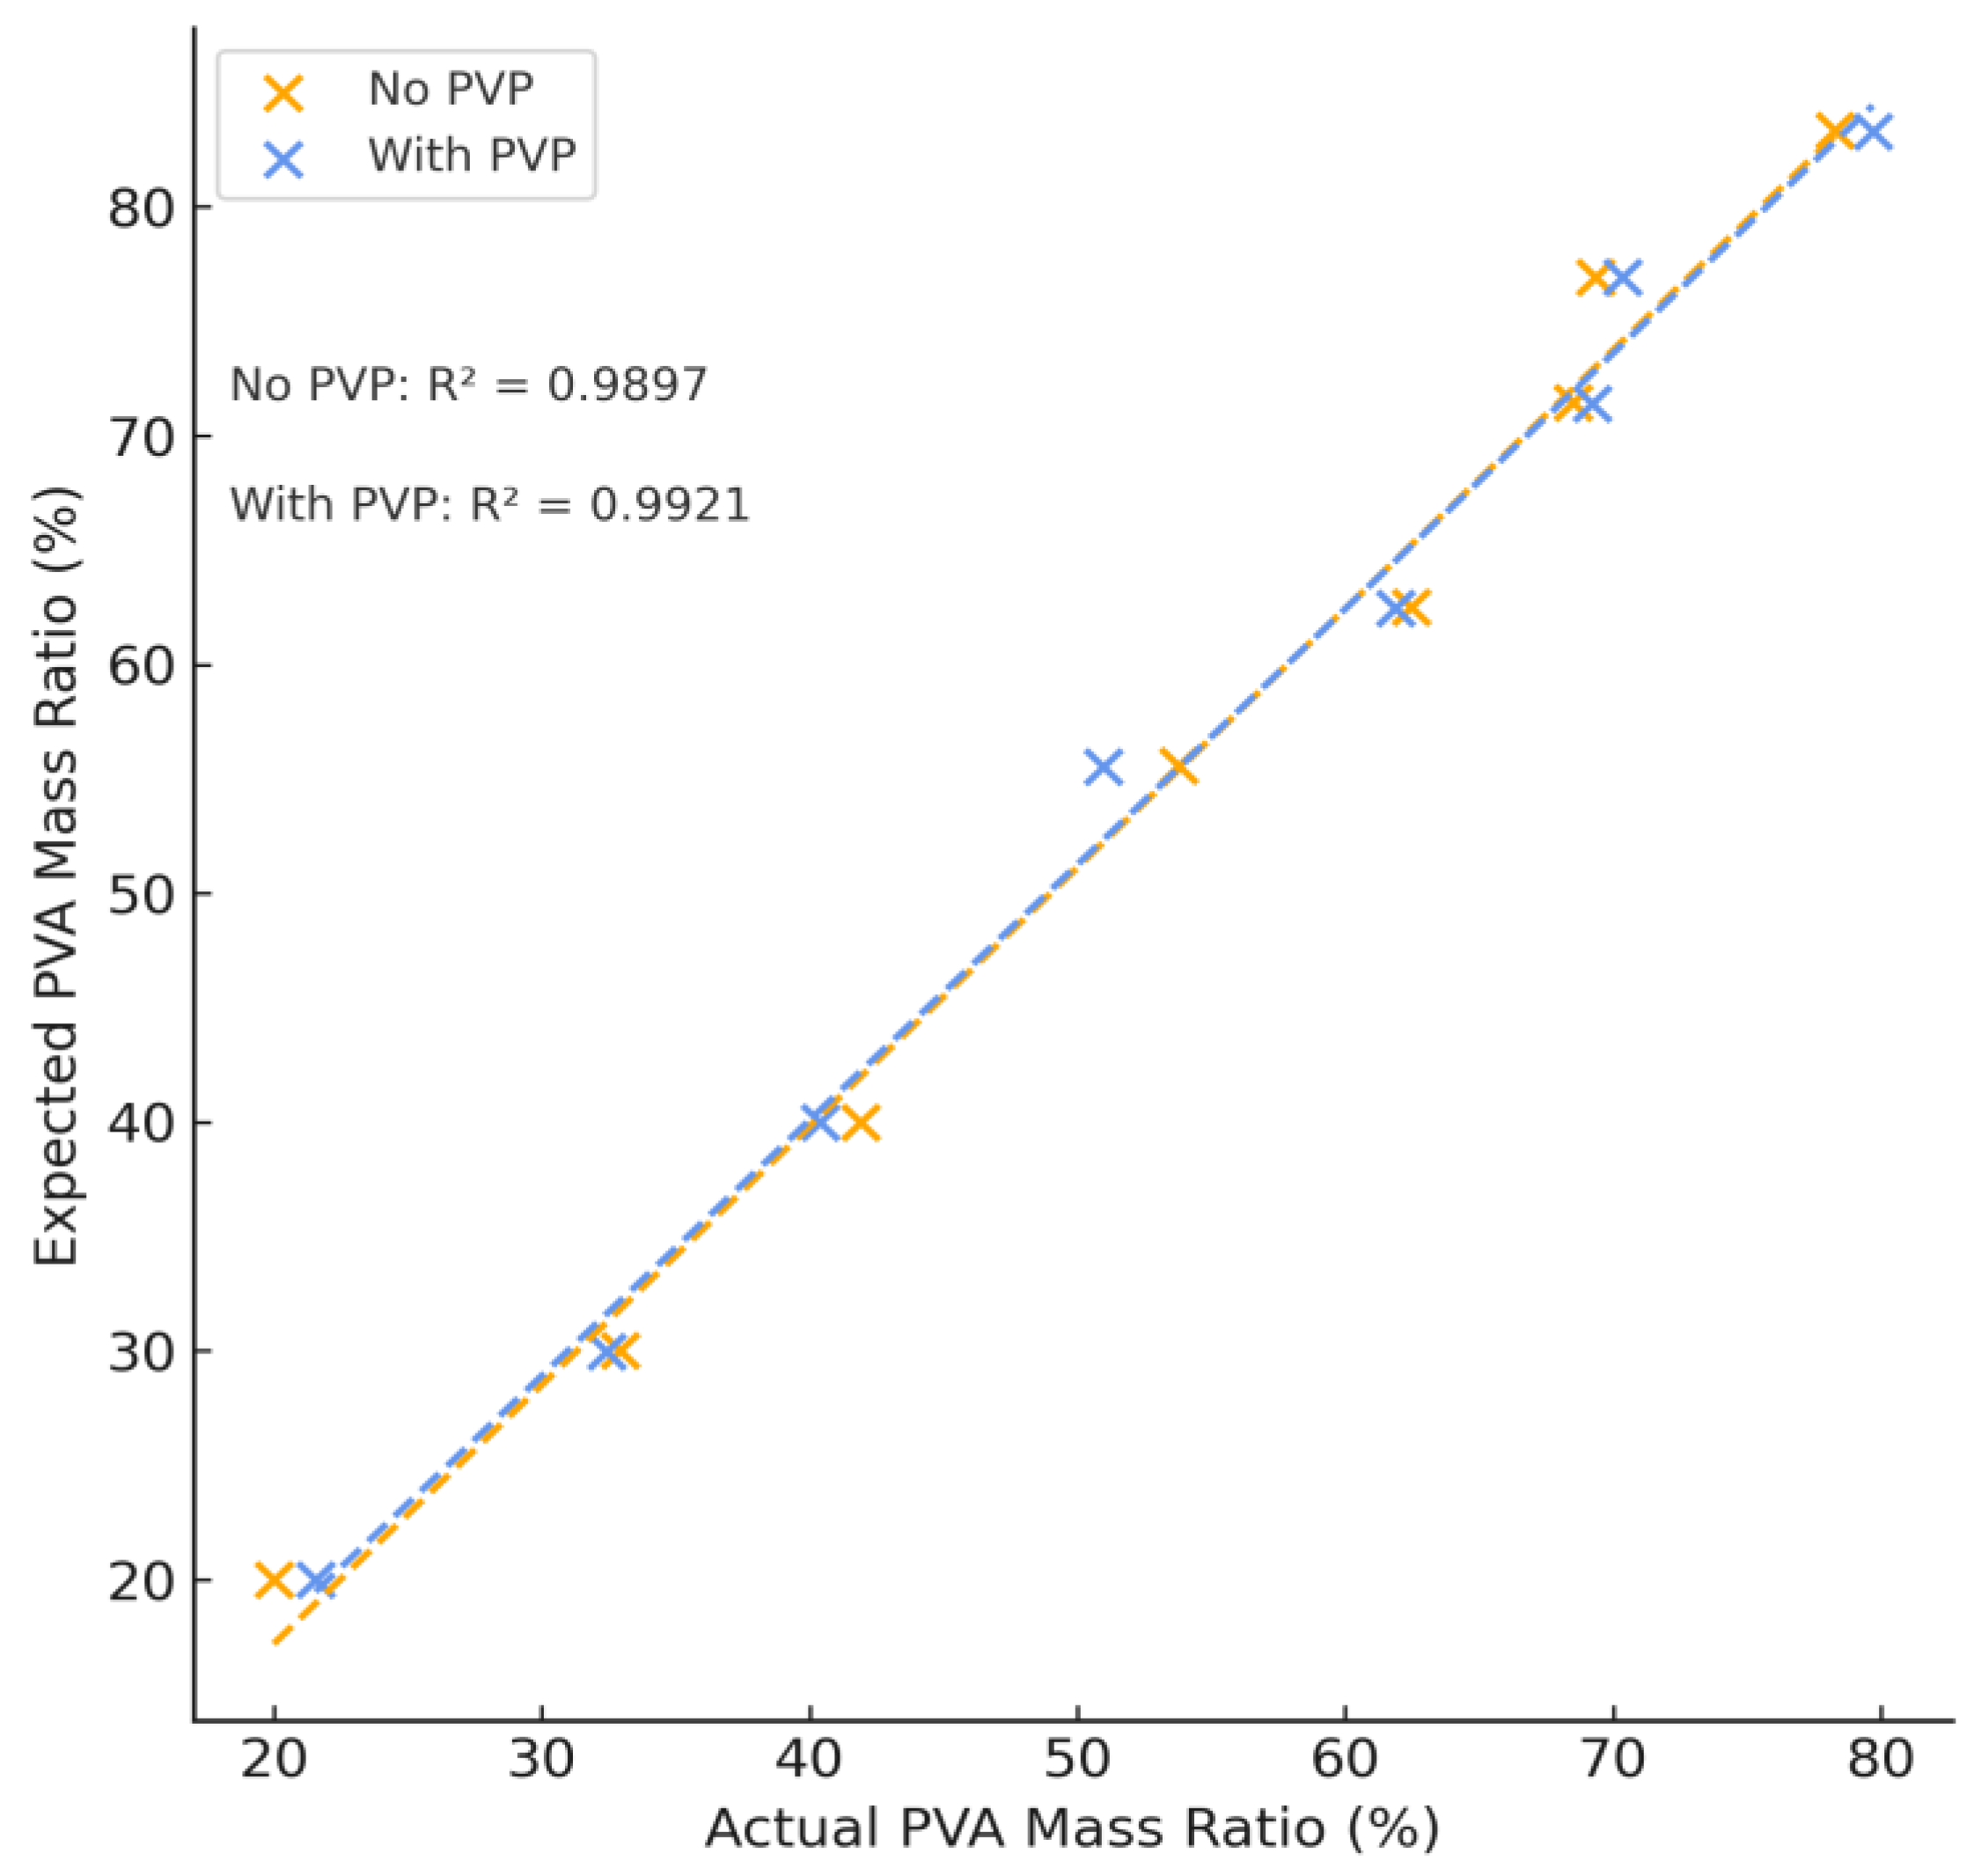
The theoretical and calculated mass percent ratio of dry PVA content to PEG content of each hydrogel formulation is summarized in
Figure 2 and agrees with expected values (see
Table S1). The average difference between expected and theoretical values was found to be (2.77 ± 2.24)% and showed a strong linear correlation between expected and actual values of PVA with and without PVA, confirming the use of NMR spectroscopy as a method of quantification in multi-phase polymer systems.
3.2. APC
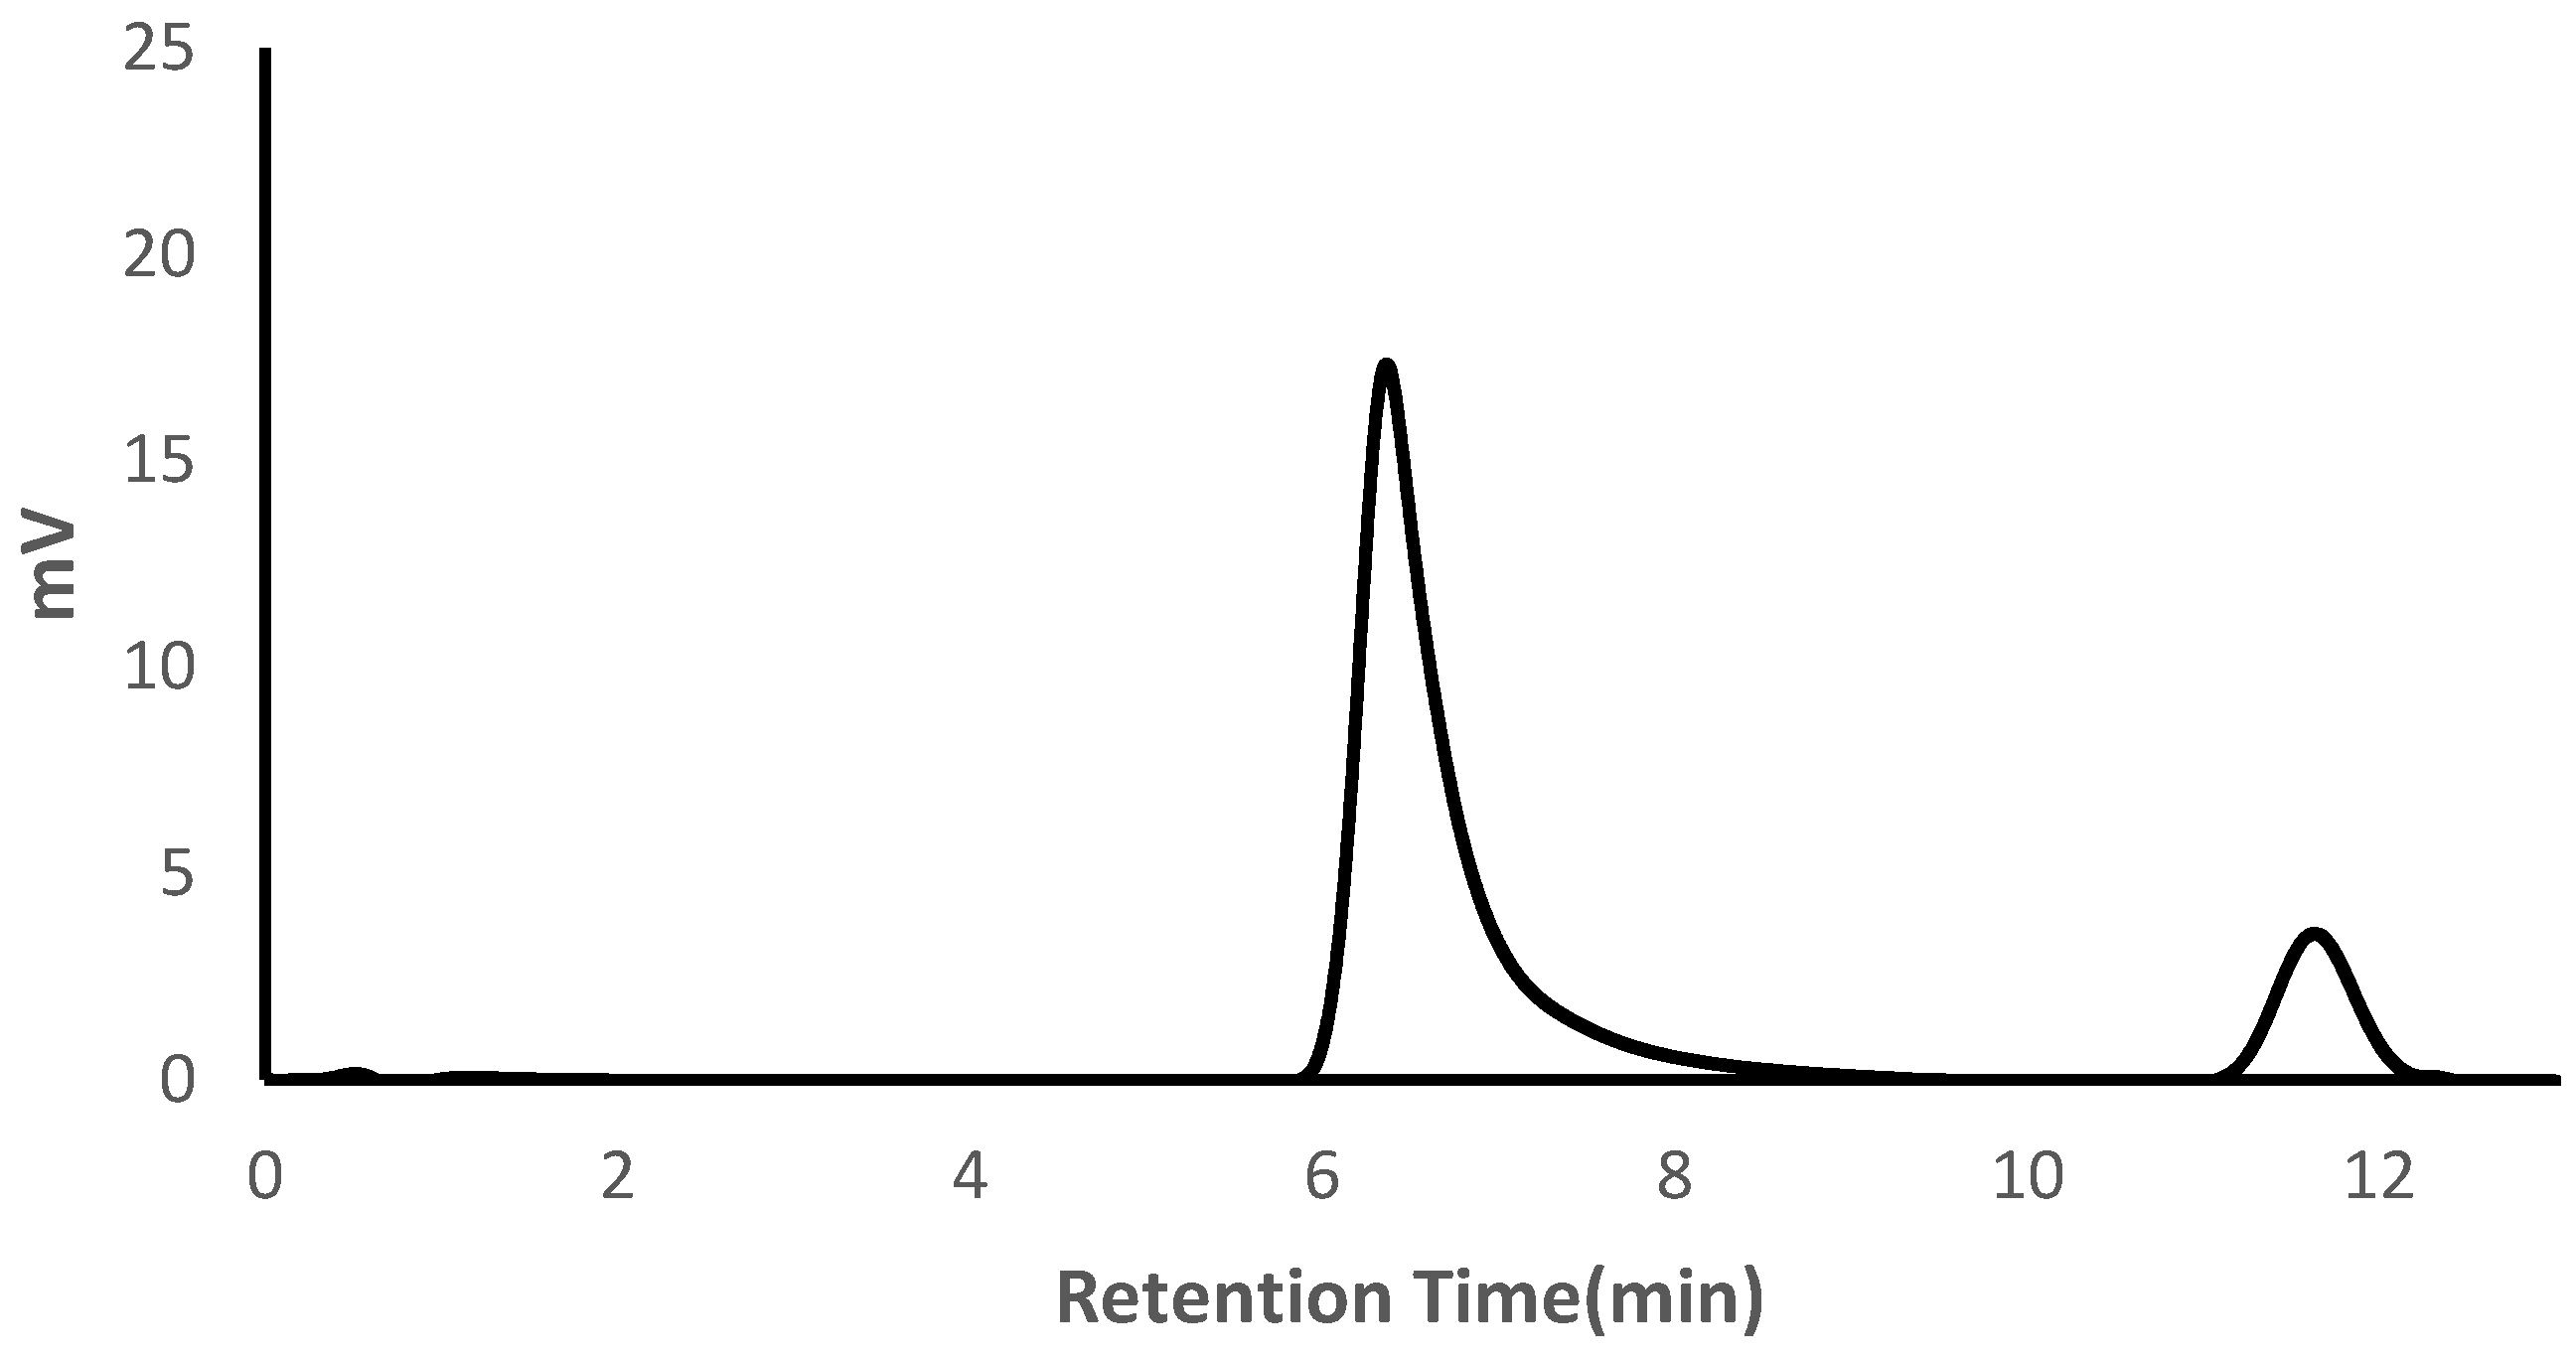
A representative APC chromatogram for the highest PVA content of manufactured hydrogels is shown in
Figure 3. In all collected chromatograms, retention time was independent of sample concentration and the presence or absence of PVP (see
Figure S5). The peak for PVA reaches a maximum at 6.4 minutes. The peak for PEG is narrower than that of PVA and reaches a maximum at 11.8 minutes
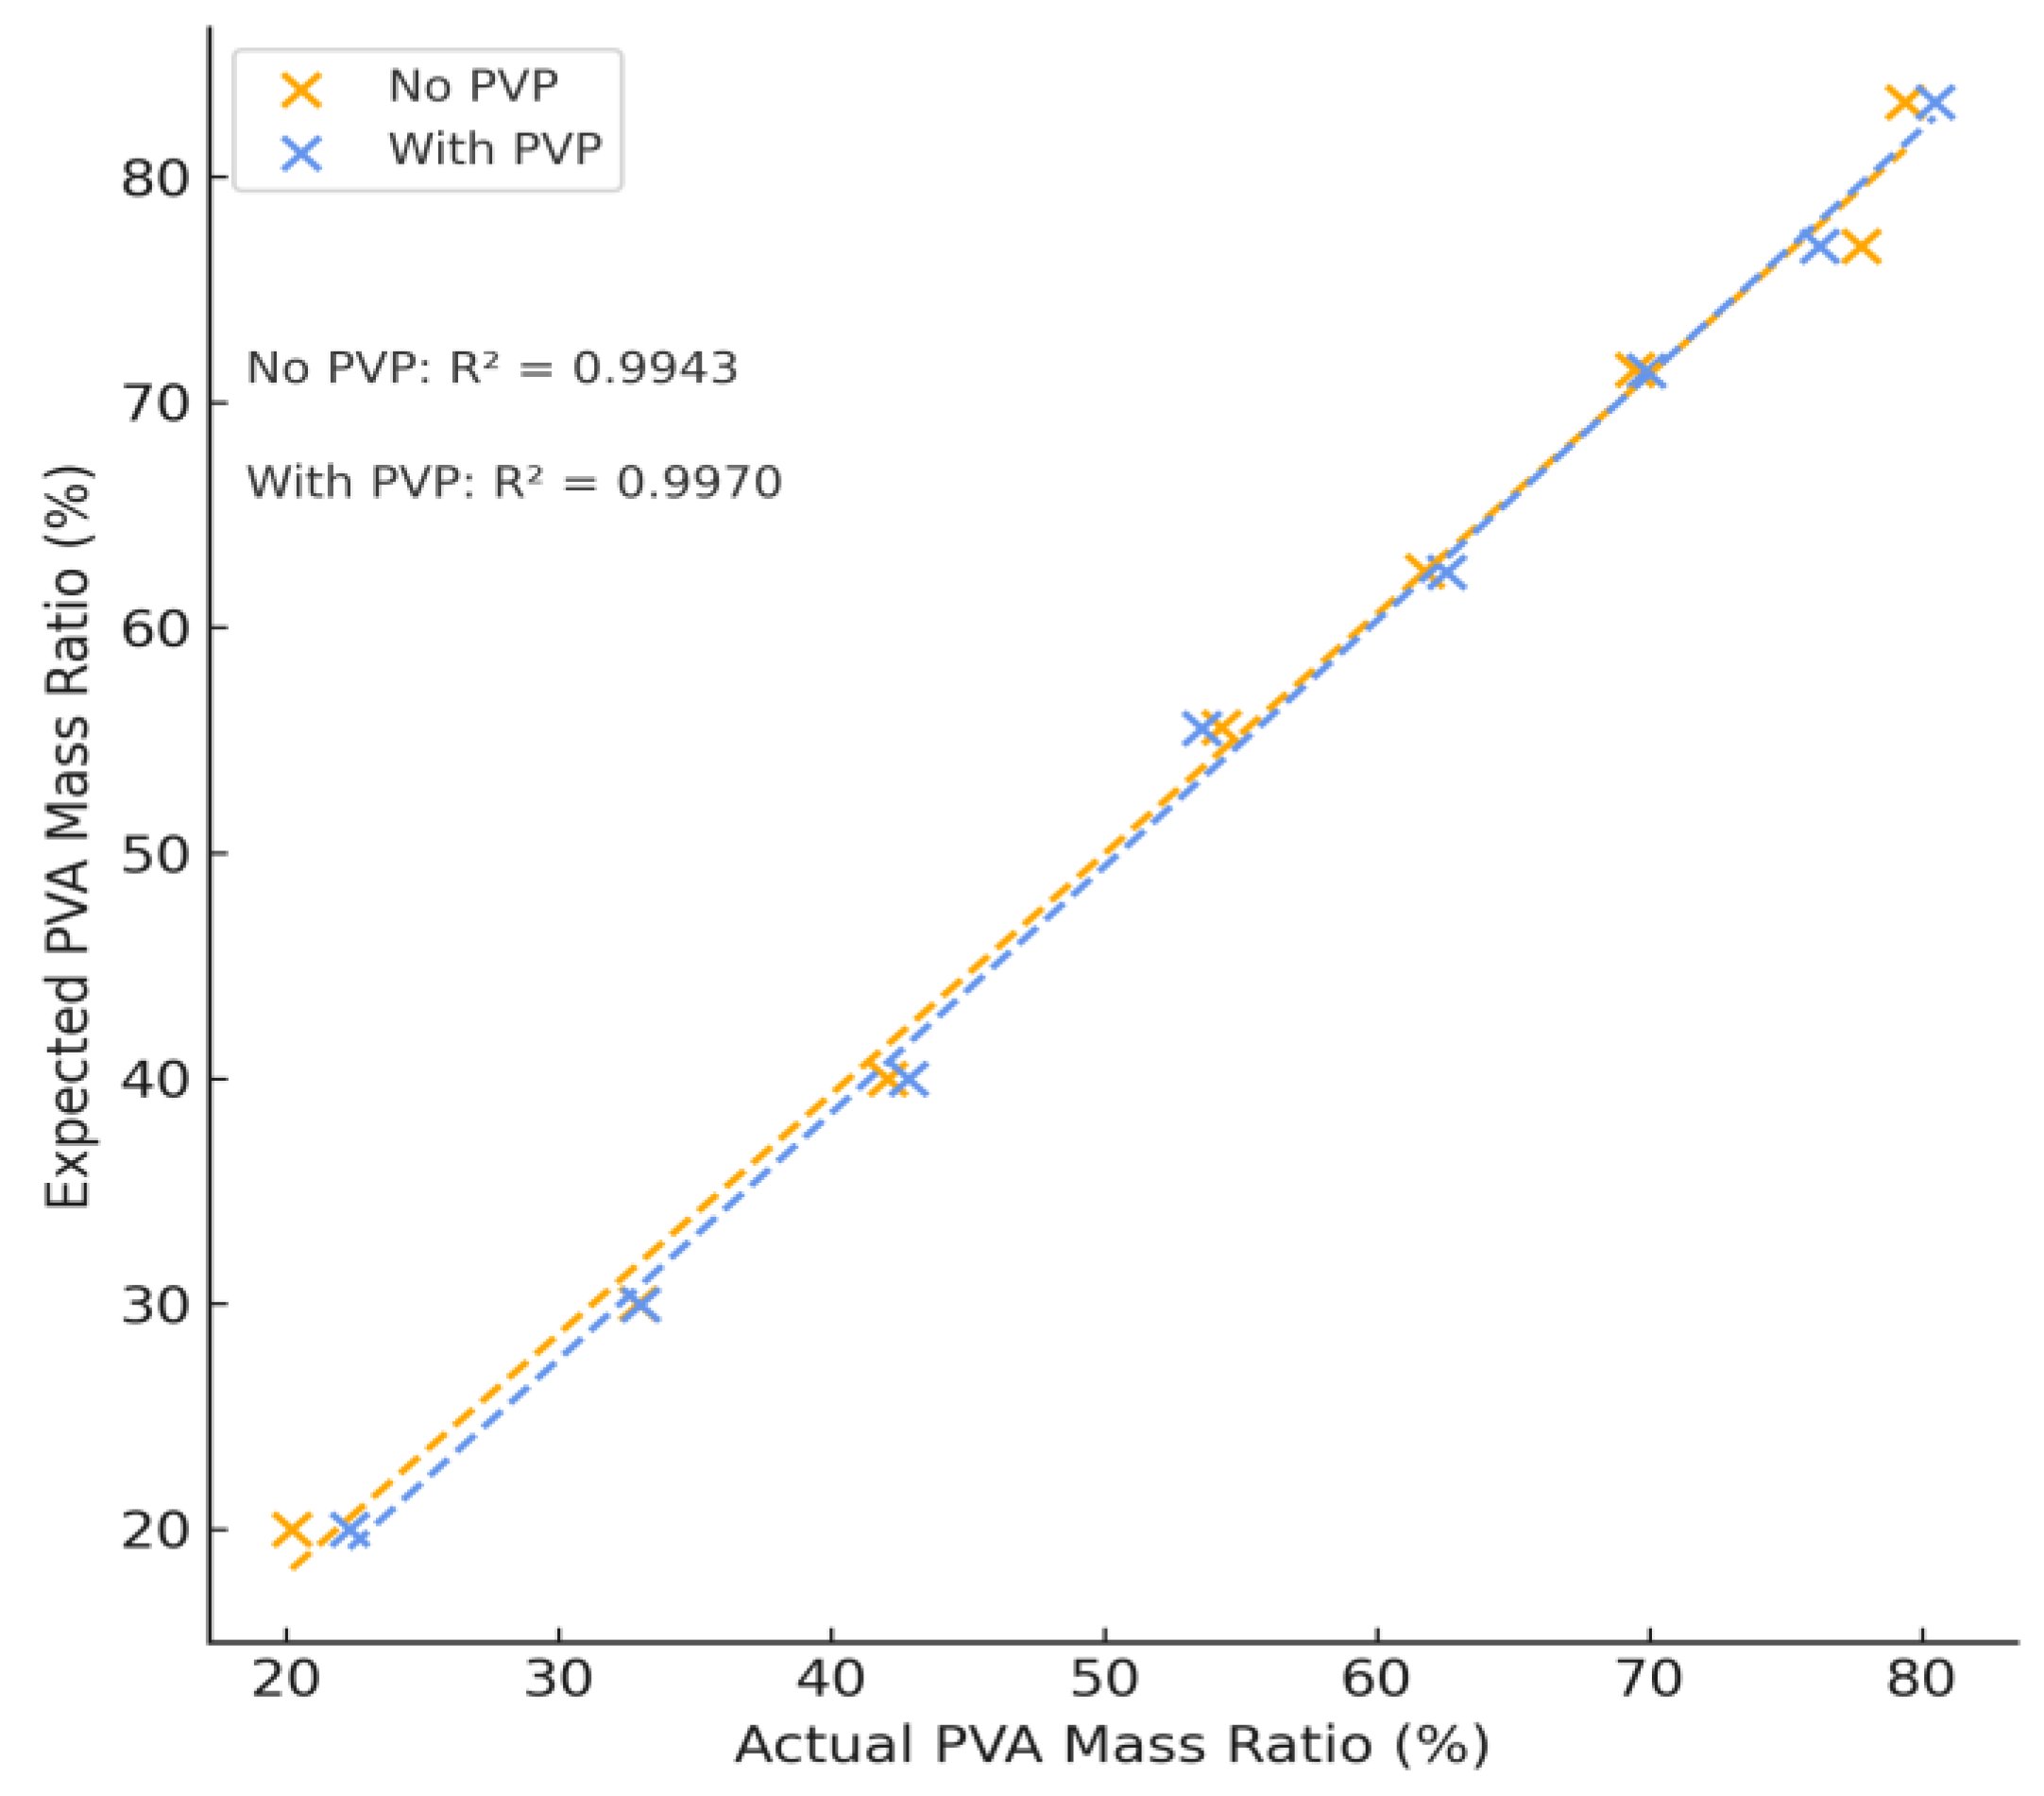
Variations in PVA and PEG content resulted in a complementary increase or decrease in each respective peak. After integrating the area of these peaks, the concentration of PVA and PEG was calculated according to the concentration curves for each individual component and the mass percent of PVA of each hydrogel formulation is summarized in
Figure 4 which shows a strong linear correlation between samples with and without PVP. The difference of this mass percentage can be used to calculate the mass percent of PEG. The calculated concentration agrees with expected values and the sample error of all samples tested was no greater than 4% (see
Table S2). The average difference between expected and theoretical values was found to be (2.01 ± 1.19)%, performing slightly better than NMR and confirming the use of APC as an analytical method of polymer quantification for complex polymer systems.
3.3. PVA/PEG Hydrogel Component Analysis Through the Use of TGA
Figure 5 shows the TGA decomposition pattern of a stock solution of PVA/PVP (99:1 w/w%) and non-crosslinked PEG. Arbitrary mass values of 7g of PVA and 8.5g of PEG were used corresponding to theoretical values of 45.16% PVA and 54.84% PEG if PVP content is assumed negligible. The distinct plateaus in the isothermal heating cycle of PEG show that equations 1.1 and 1.2 can be used to determine the independent weight percents of PVA and PEG which were found to be 42.39% and 57.61%, respectively. Theoretical values were comparable to experimental values for both PVA and PEG, validating the use of TGA as a method of polymer quantification.
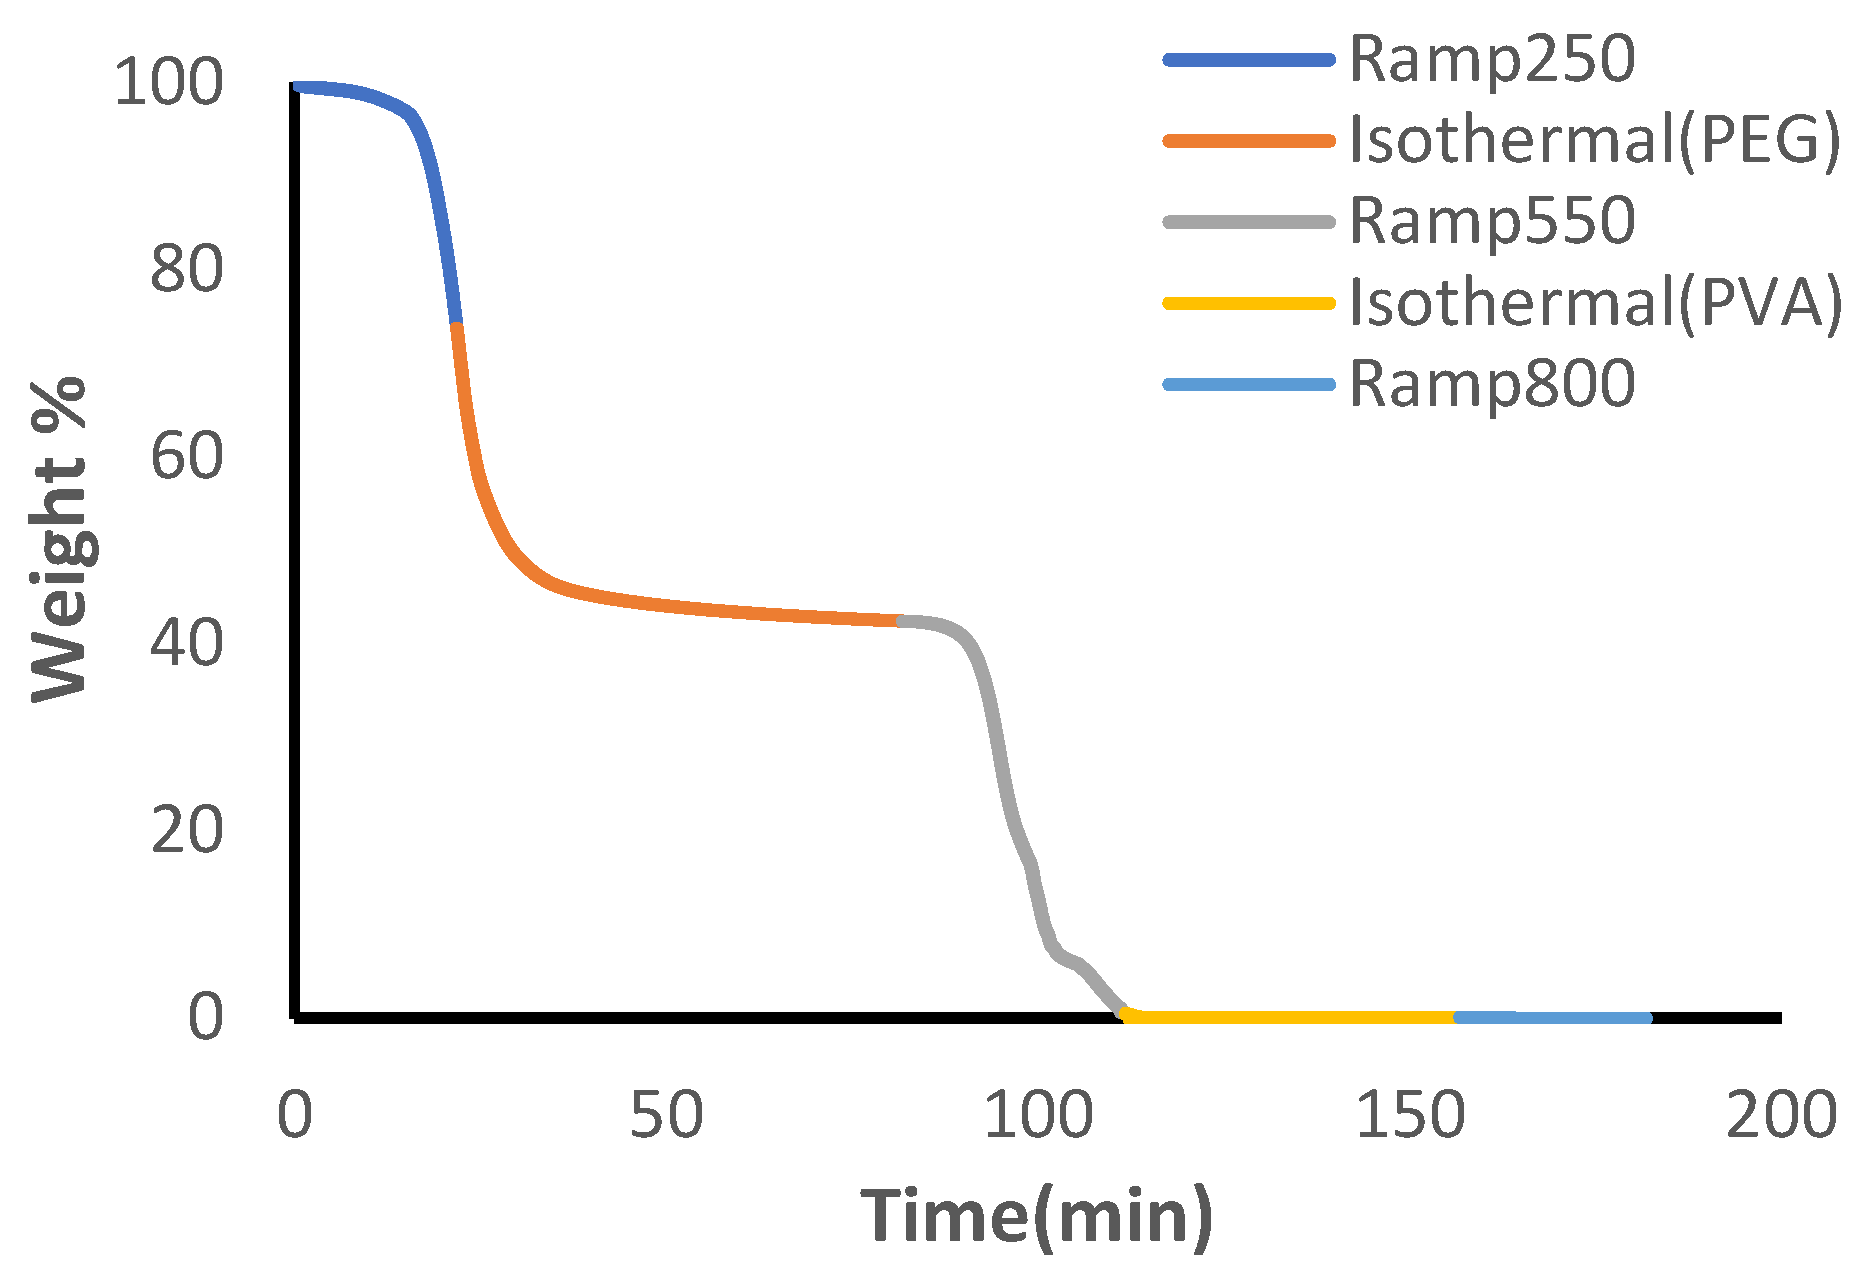
Changes in the composition of PVA and PEG were identified in the TGA curves across samples tested.
Figure 6 depicts the representative TGA curve for the highest PVA content of manufactured hydrogels. There were no observable changes noted between hydrogels made with or without PVP. In contrast to the curve in
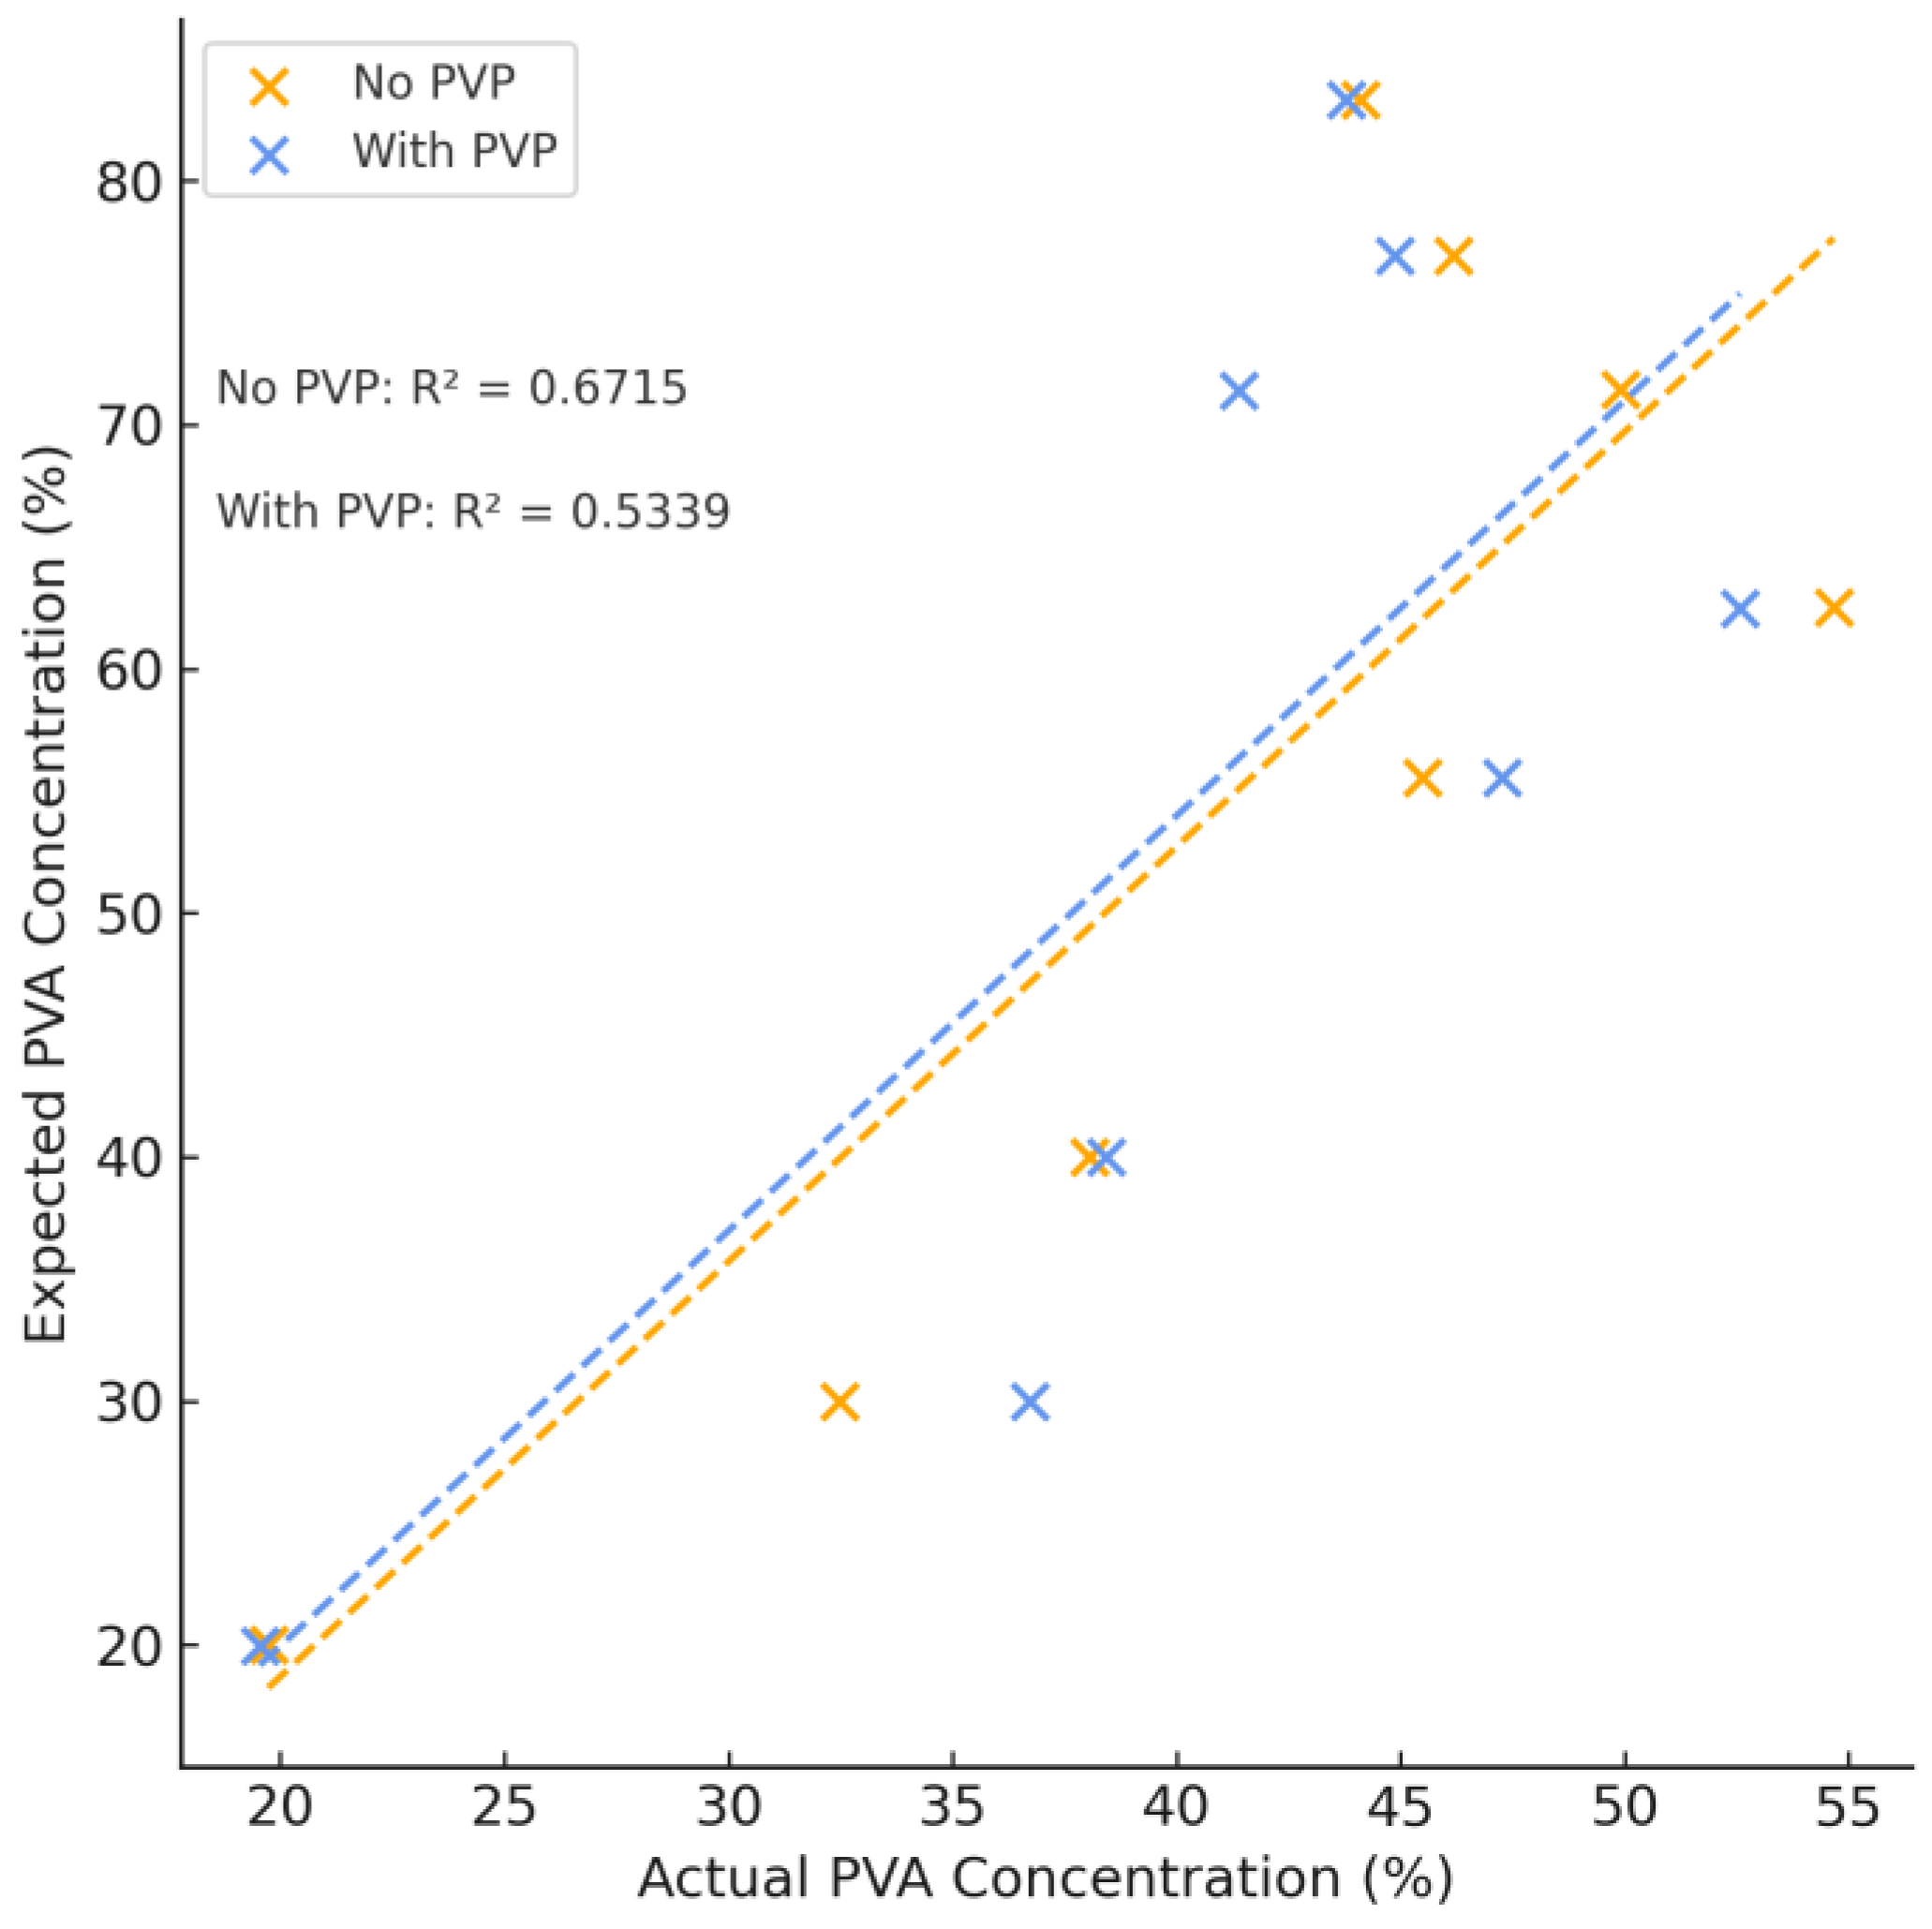
Figure 5, PEG did not produce a plateau across the isothermal heating stage at 250°C, possibly indicating intermediaries or intermolecular bonding interactions that altered the decomposition patterns. When PVA concentrations were below 62.5%, the calculated concentrations of PVA agreed with expected values and the average difference between theoretical and expected values was found to be (4.95 ± 3.97)%. The error was less than or equal to 10% in all hydrogel formulations tested (see
Table S3). The expected values of PVA, however, did not agree with those calculated from the TGA thermograms and the error was large when PVA concentrations exceeded 62.5% (see
Figure 7). When the concentration was above this range, the calculated value of PVA was underestimated in all instances.
3.4. FTIR
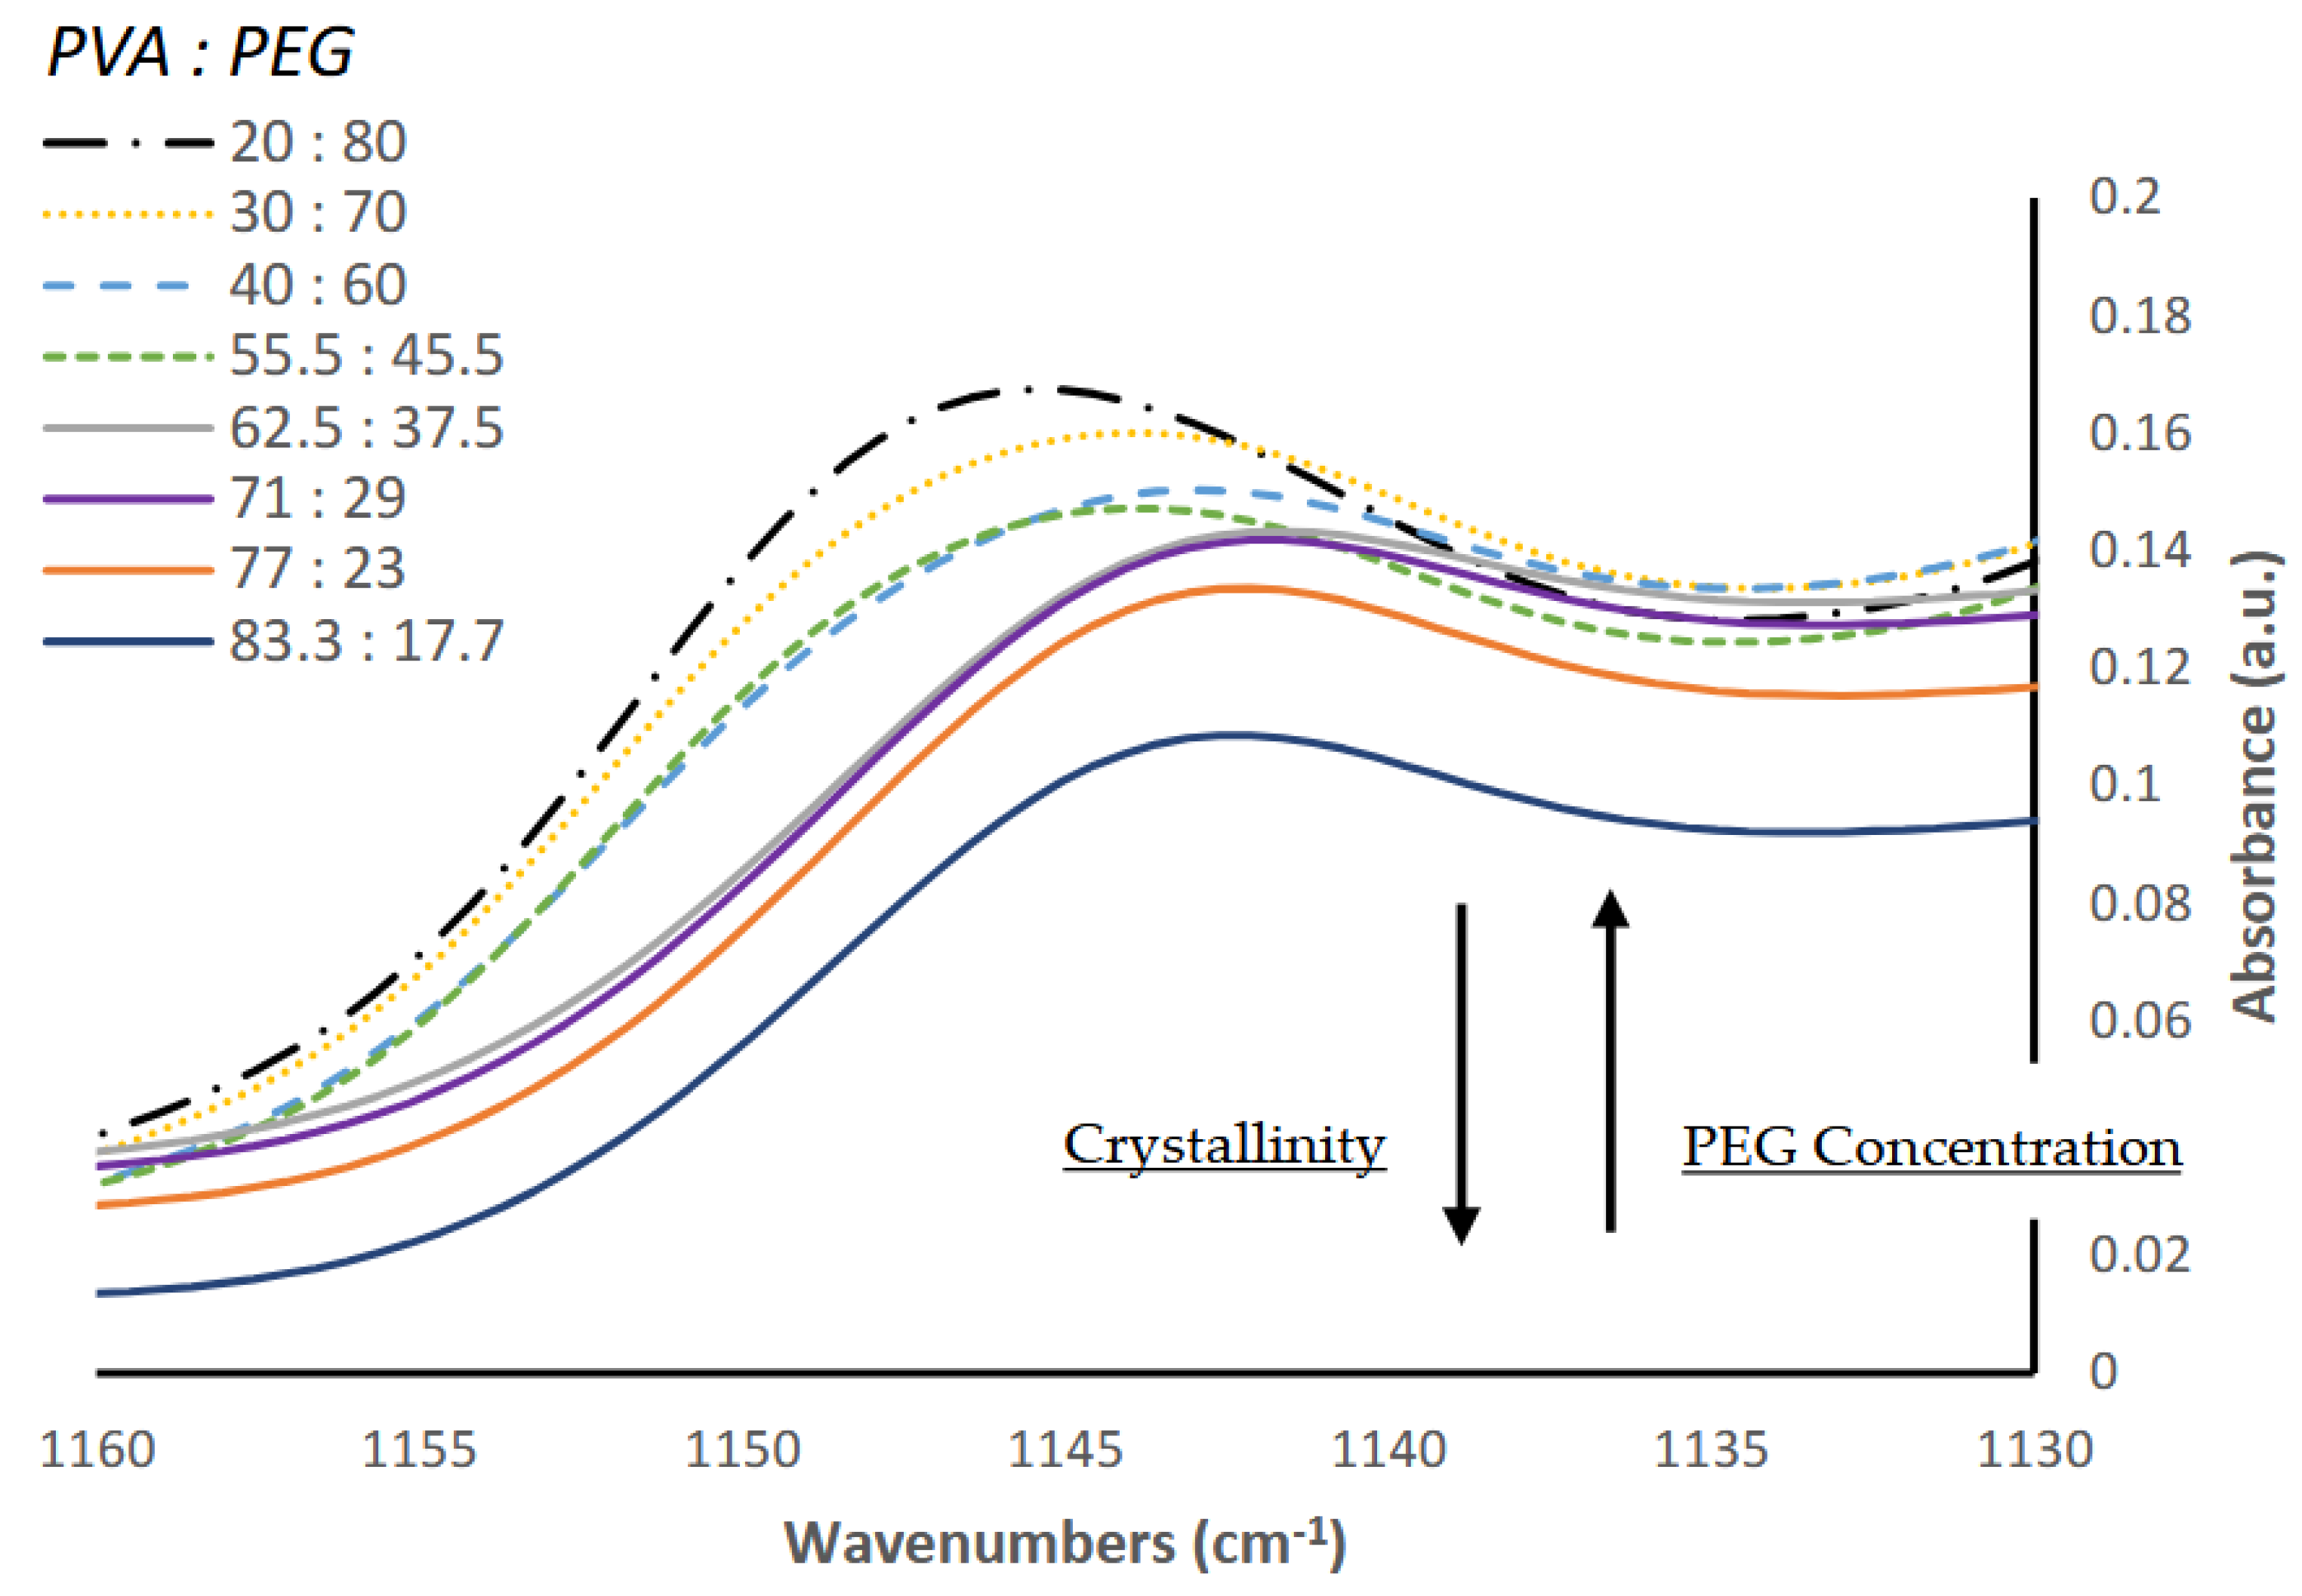
Figure 8 shows the FTIR region around 1140 cm
-1, which others have reported to correlate with PVA crystalline formation [
21]. The peak centered at 1146 cm
-1 presents a maximum at the lowest PVA concentration (20% PVA) and decreases gradually with a corresponding increase in PVA content. A shift towards lower wavenumbers of 1142 cm
-1 is identified as the concentration of PVA begins to exceed 62.5 w/w%. The spectra changes shape at this point and the intensity of this peak continues to decrease until it reaches a minimum when PVA concentration is highest at 83.3 w/w%.
Our results are consistent with previous reports that a low-molecular weight PEG promotes the crystallization of PVA [
22,
23] and increasing PEG concentration lowers the degree of crystallinity, as evidenced by the shift in wavenumbers of the peak around 1140 cm
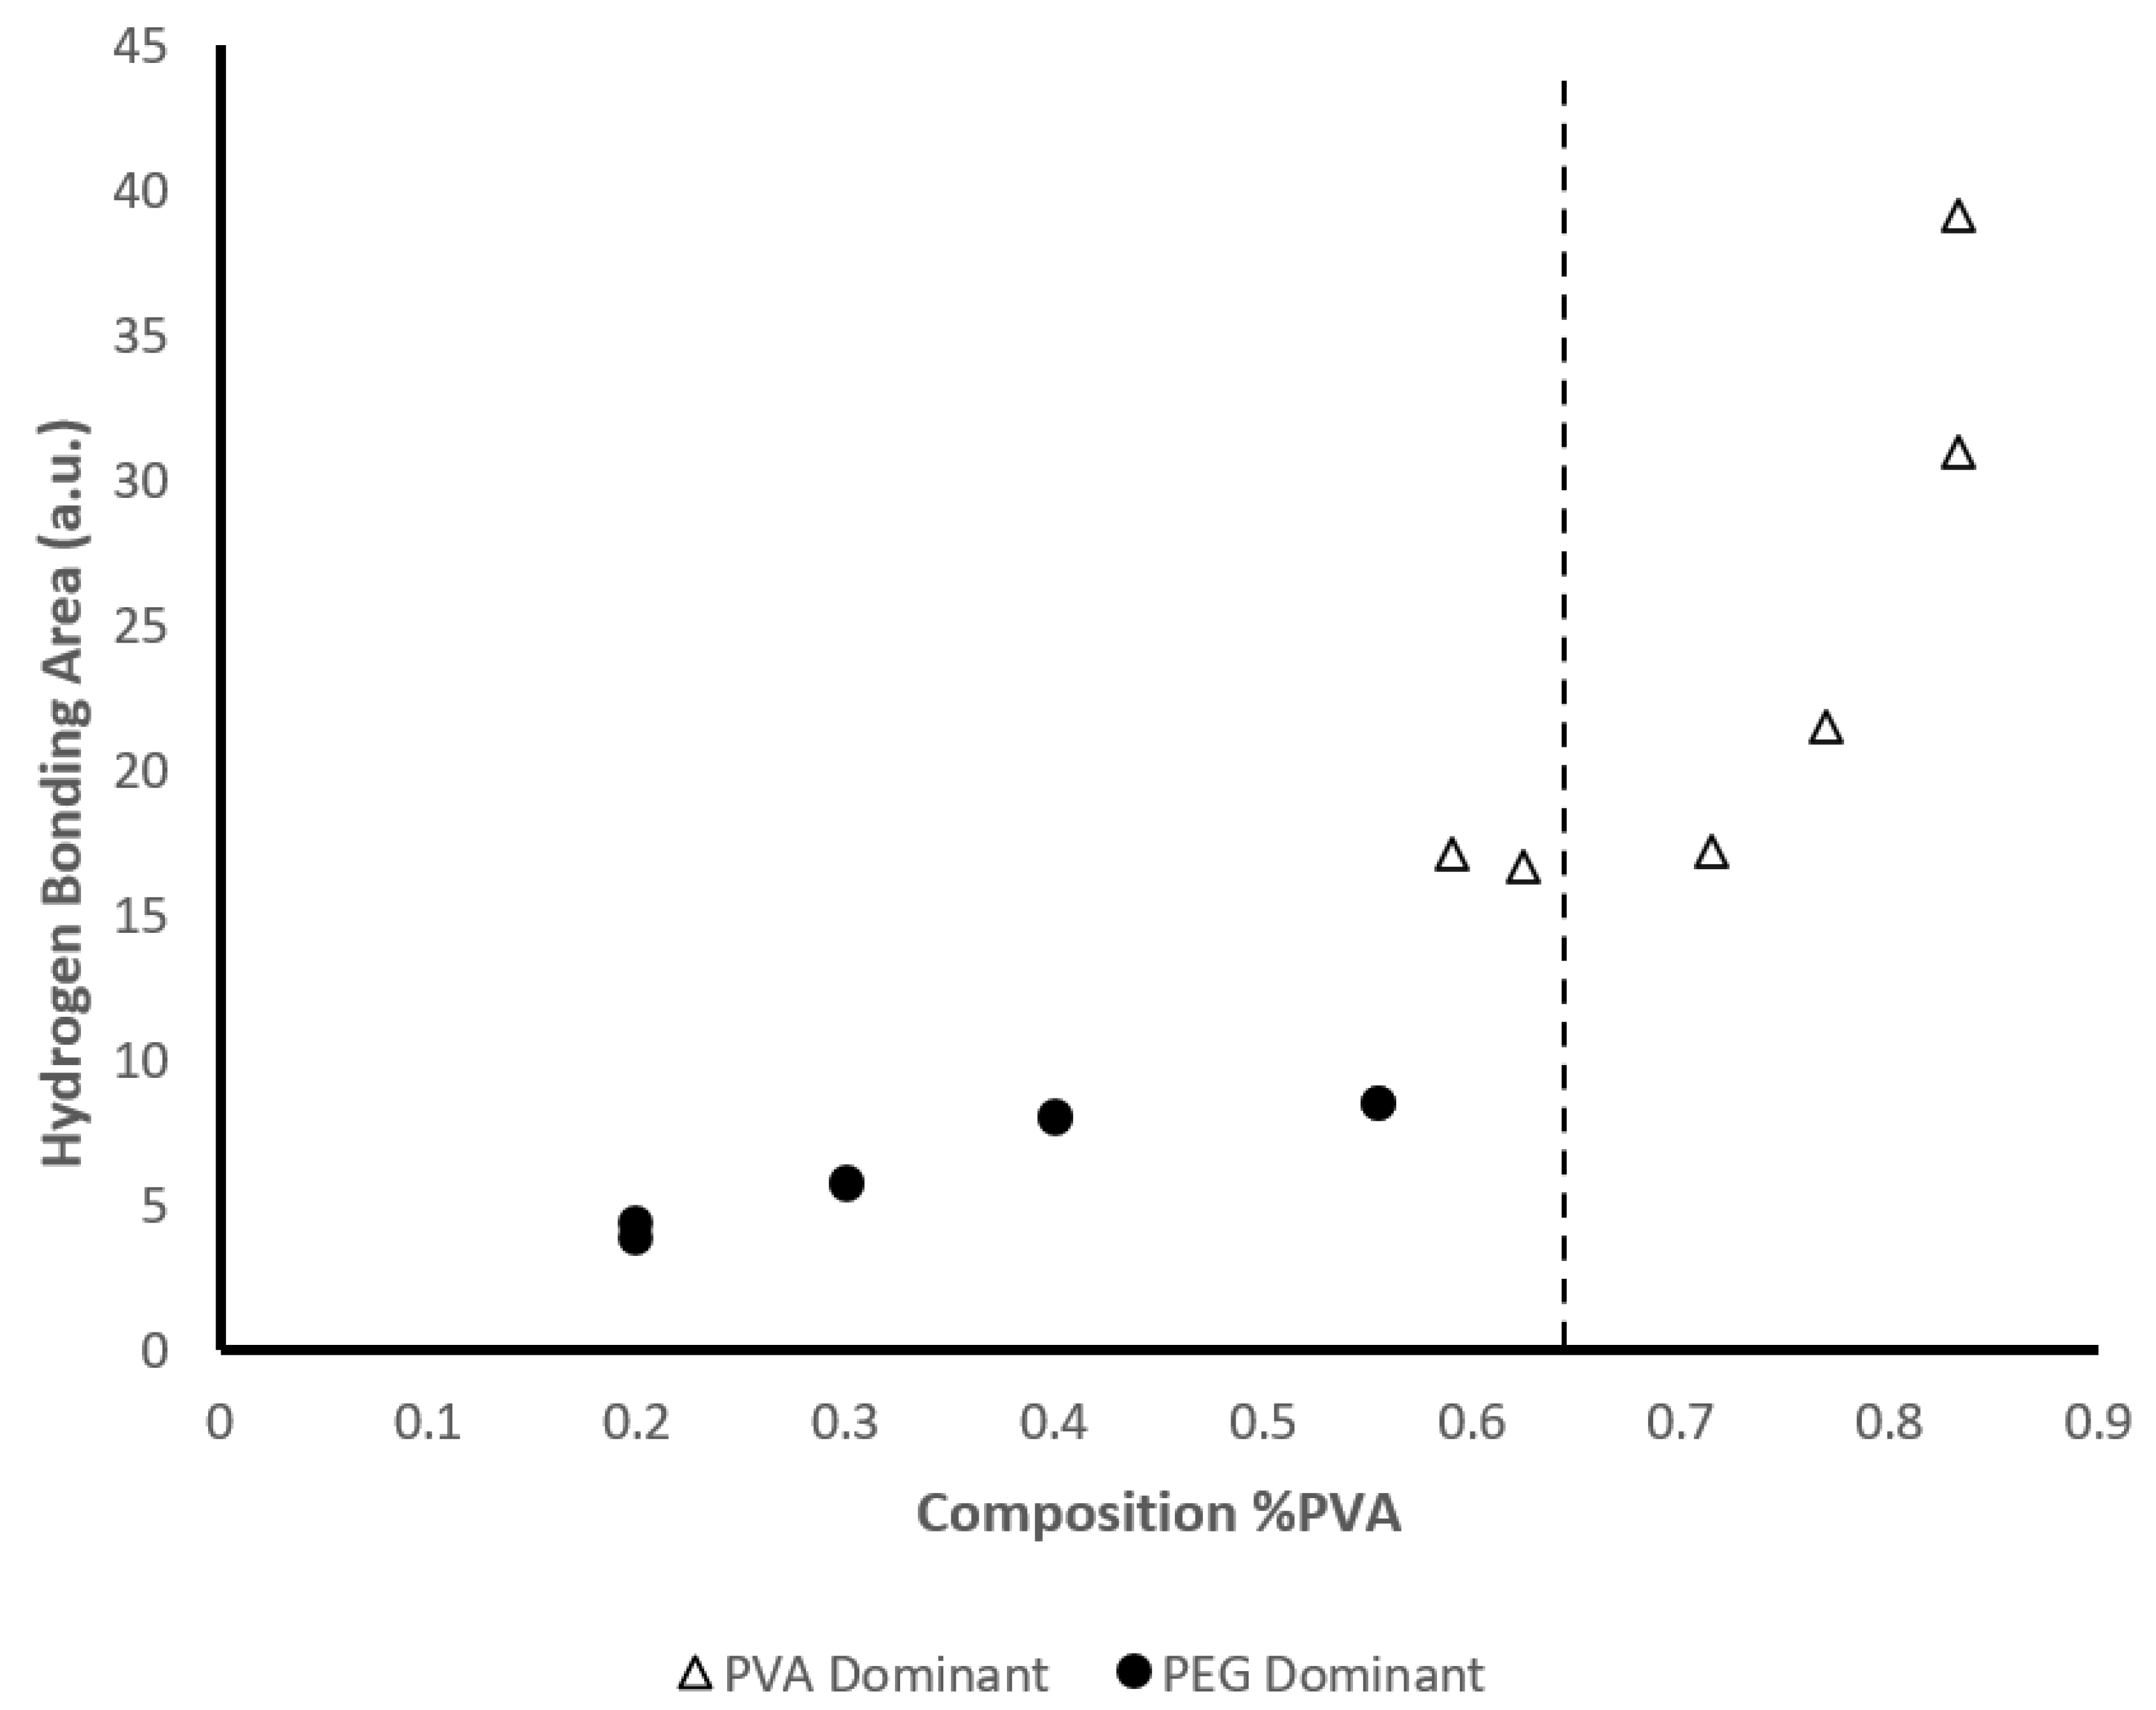
-1. The shift in wavenumbers at PVA concentrations greater than 62.5% suggests a conformational change in the crystalline structure of the hydrogel. It is suggested that at higher PVA concentrations, the plasticizing effect of PEG is limited, allowing for larger crystalline structures to form between PVA and water. We also determined the area of the -OH bonding region between 3650 cm
-1 and 3000 cm
-1 which is summarized in
Figure 9. The area of this region increases gradually for all samples in which PVA content is less than or equal to 55.5 w/w%. As this threshold is reached, the area increases sharply at 62.5 w/w% PVA and this marked increase is observed until its maximum at 83.3 w/w% PVA. The increase in the -OH bonding region further supports the crystalline conformational change between PVA and water observed by the shift in wavenumbers.
4. Discussion
NMR is widely recognized as a gold-standard method for determining polymer composition in multicomponent systems [
24,
25,
26], and it has been used extensively to quantify the relative contributions of PVA, PEG, and related polymers in hydrogel formulations [
27,
28,
29]. Here, NMR proved to be an effective tool to determine the polymer composition of both PVA and PEG across the different formulations of multi-component gels analyzed. NMR had a low average error of 2.77% and an R
2 value of 0.99 across all samples tested, proving to be impervious to physiochemical interactions between polymers as nearly all polymers have unique protons for analysis [
9,
10]. APC, while having demonstrated use in multi-component polymer composition characterization, has yet to be evaluated as extensively in hydrogel formulations. Here, it was demonstrated that APC had a similar effectiveness in determining multi-component polymer content, showing a low error between expected and theoretical values of PVA and PEG across all samples tested (2.01%) and an R
2 value of 0.99. Results were independent of physiochemical interactions within the hydrogel system and APC presented a higher-throughput method of analyzing polymer content when compared to NMR. Issues may arise, however, with overlapping peaks if the multi-component polymer system being analyzed has polymer components with similar molecular weights. Peak deconvolution may be necessary to accurately determine individual polymer content of a complex polymer matrix system.
TGA, a method classically employed for understanding the thermal stability and decomposition patterns of polymers [
30], similarly showed promise in characterizing the individual polymer content of our differing hydrogel formulations. At lower PVA concentrations below 62.5%, hydrogen bonding between PVA and PEG was low, allowing for quantification of individual polymer content as PVA and PEG exhibited their own unique thermal decomposition patterns with minimal contribution of inter-polymer physiochemical effects. However, as PVA content increased past this threshold, quantification was challenging and the R
2 value was between 0.53 and 0.67 for samples with and without PVP, respectively. Hydrogen bonding also increased as evidenced by the sharp increase of the area of this region due to FTIR analysis. This increase in hydrogen bonding suggests the formation of additional microcrystalline structures between PVA and water. Furthermore, FTIR analysis revealed a shift in the wavenumbers of the crystalline region of PVA, suggesting a conformational change that influenced the thermal properties of the hydrogel blend that made individual polymer content challenging through the use of TGA.
5. Conclusions
NMR and APC both served as effective methods to evaluate the individual polymer concentrations of PVA and PEG in our hybrid hydrogel formulations. Both methods were independent of the physiochemical interactions of our multi-component system and APC may serve as a more viable option due to ease of sample preparation and throughput. At lower PVA concentrations, we presented a method of TGA analysis that was able to effectively quantify the individual amount of PVA and PEG in our hydrogel blend. At higher concentrations of PVA, hydrogen bonding and larger crystalline formation between PVA and water was identified which altered the unique thermal decomposition patterns of our hydrogel. It may be necessary to impose a more robust, multi-stage heating cycle that takes into account the unique physiochemical and crystalline reactions occurring within the hydrogel.
Supplementary Materials
The following supporting information can be downloaded at the website of this paper posted on Preprints.org, Figure S1: AUC of Different Concentrations of PVA; Figure S2: AUC of Different Concentrations of PEG; Figure S3: TGA Curve of PEG; Figure S4: TGA Curve of PVA; Figure S5: Representative APC Chromatogram of 83.32% PVA, 16.68% PEG (Right, w/PVP) and 83.33% PVA, 16.67% PEG (Left, No PVP); Table S1: Theoretical and Calculated Values of PVA Mass % Due to NMR Analysis; Table S2: Theoretical and Calculated Values of PVA Mass % Due to APC Analysis; Table S3: Theoretical and Calculated Values of PVA Mass % Due to TGA Analysis.
Author Contributions
A.A.: Conceptualization, Methodology, Validation, Formal analysis, Investigation, Data curation, Writing—original draft, Writing—review and editing, Visualization. A.L.: Conceptualization, Resources, Writing—original draft, Writing—review and editing, Supervision, Project Administration, Funding acquisition. E.B.: Conceptualization, Resources, Writing—original draft, Writing—review and editing, Supervision, Project Administration. All authors have read and agreed to the published version of the manuscript.
Funding
Funding for this project was provided by ReGelTec, Inc., which is investigating injectable polymers for commercial applications.
Institutional Review Board Statement
Not applicable.
Data Availability Statement
The original contributions presented in this study are included in the article. Further inquiries can be directed to the corresponding author.
Conflicts of Interest
Authors Antonio Abbondandolo and Erik Brewer are employed by the company ReGelTec, Inc. Author Anthony Lowman is the founder and CTO of ReGelTec, Inc. The authors declare that the research was conducted in the absence of any commercial or financial relationships that could be construed as a potential conflict of interest.
Abbreviations
The following abbreviations are used in this manuscript:
| PVA |
Polyvinyl Alcohol |
| PEG |
Polyethylene Glycol |
| PVP |
Polyvinylpyrrolidone |
| NMR |
Nuclear Magnetic Resonance |
| APC |
Advanced Polymer Chemistry |
| FTIR |
Fourier Transform Infrared Spectroscopy |
| TGA |
Thermal Gravimetric Analysis |
References
- C. M. Hassan and N. A. Peppas, “Structure and applications of poly(vinyl alcohol) hydrogels produced by conventional crosslinking or by freezing/thawing methods,” 2000. [CrossRef]
- C. M. Hassan and N. A. Peppas, “Structure and Applications of Poly(vinyl alcohol) Hydrogels Produced by Conventional Crosslinking or by Freezing/Thawing Methods,” in Biopolymers · PVA Hydrogels, Anionic Polymerisation Nanocomposites. Advances in Polymer Science, vol. 153, Berlin, Heidelberg.: Springer, Berlin, Heidelberg, 2000, ch. 2, pp. 37–65. [CrossRef]
- J. D. Thomas, “Novel Associated PVA/PVP Hydrogels for Nucleus Pulposus Replacement,” 2001.
- Y. Liu, L. M. Geever, J. E. Kennedy, C. L. Higginbotham, P. A. Cahill, and G. B. McGuinness, “Thermal behavior and mechanical properties of physically crosslinked PVA/Gelatin hydrogels,” J Mech Behav Biomed Mater, vol. 3, no. 2, 2010. [CrossRef]
- J. W. Ruberti and G. J. C. Braithwaite, “Systems and methods for controlling and forming polymer gels,” 20040092653, Feb. 2010.
- I. Inamura, “Liquid-liquid phase separation and gelation in the poly(vinyl alcohol)-poly(ethylene glycol)-water system. dependence on molecular weight of poly(ethylene glycol),” Polym J, vol. 18, no. 3, pp. 269–272, 1986. [CrossRef]
- L. Y. Lim and L. S. C. Wan, “The effect of plasticizers on the properties of polyvinyl alcohol films,” Drug Dev Ind Pharm, vol. 20, no. 6, pp. 1007–1020, 1994. [CrossRef]
- S. P. O. Danielsen et al., “Molecular Characterization of Polymer Networks,” Chem Rev, vol. 121, no. 8, pp. 5042–5092, 2021. [CrossRef]
- B. H. Stuart, Polymer Analysis. 2007. [CrossRef]
- Y. Tanaka, Y. Takeuchi, M. Kobayashi, and H. Tadokoro, “Characterization of diene polymers. I. Infrared and NMR studies: Nonadditive behavior of characteristic infrared bands,” Journal of Polymer Science Part A-2: Polymer Physics, vol. 9, no. 1, 1971. [CrossRef]
- A. M. Striegel, “Method development in interaction polymer chromatography,” 2020. [CrossRef]
- Roy et al., “Development of Comprehensive Two-Dimensional High Temperature Liquid Chromatography x Gel Permeation Chromatography for Characterization of Polyolefins,” Macromolecules, vol. 43, no. 8, 2010. [CrossRef]
- S. R. Stauffer and N. A. Peppast, “Poly(vinyl alcohol) hydrogels prepared by freezing-thawing cyclic processing,” Polymer (Guildf), vol. 33, no. 18, 1992. [CrossRef]
- V. LaMastro, E. Brewer, and A. Lowman, “Crystallinity, reversibility, and injectability of physically crosslinked poly(vinyl alcohol) and poly(ethylene glycol) hydrogels,” J Appl Polym Sci, vol. 137, no. 25, 2020. [CrossRef]
- J. Almond, P. Sugumaar, M. N. Wenzel, G. Hill, and C. Wallis, “Determination of the carbonyl index of polyethylene and polypropylene using specified area under band methodology with ATR-FTIR spectroscopy,” E-Polymers, vol. 20, no. 1, pp. 369–381, 2020. [CrossRef]
- D. A. Ossipov, K. Brännvall, K. Forsberg-Nilsson, and J. Hilborn, “Formation of the first injectable poly (vinyl alcohol) hydrogel by mixing of functional PVA precursors,” J Appl Polym Sci, vol. 106, no. 1, pp. 60–70, Oct. 2007. [CrossRef]
- S. G. Rotman, T. F. Moriarty, B. Nottelet, D. W. Grijpma, D. Eglin, and O. Guillaume, “Poly(Aspartic acid) functionalized poly(ϵcaprolactone) microspheres with enhanced hydroxyapatite affinity as bone targeting antibiotic carriers,” Pharmaceutics, vol. 12, no. 9, pp. 1–17, Sep. 2020. [CrossRef]
- S. Zou et al., “Enhanced apoptosis of ovarian cancer cells via nanocarrier-mediated codelivery of siRNA and doxorubicin,” Int J Nanomedicine, vol. 7, pp. 3823–3835, 2012. [CrossRef]
- T. Wang et al., “In situ gelation behavior of thermoresponsive poly(N-vinylpyrrolidone)/poly(N-isopropylacrylamide) microgels synthesized by soap-free emulsion polymerization,” Polymer Bulletin, vol. 75, no. 10, 2018. [CrossRef]
- A. Petrova et al., “Magnetic Resonance Based Analytical Tools to Study Polyvinylpyrrolidone—Hydroxyapatite Composites,” Oct. 09, 2023. [CrossRef]
- H. S. Mansur, C. M. Sadahira, A. N. Souza, and A. A. P. Mansur, “FTIR spectroscopy characterization of poly (vinyl alcohol) hydrogel with different hydrolysis degree and chemically crosslinked with glutaraldehyde,” Materials Science and Engineering C, vol. 28, no. 4, pp. 539–548, 2008. [CrossRef]
- M. I. Mohammed and F. El-Sayed, “PEG’s impact as a plasticizer on the PVA polymer’s structural, thermal, mechanical, optical, and dielectric characteristics,” Opt Quantum Electron, vol. 55, no. 13, Dec. 2023. [CrossRef]
- F. H. Falqi, O. A. Bin-Dahman, M. Hussain, and M. A. Al-Harthi, “Preparation of miscible PVA/PEG blends and effect of graphene concentration on thermal, crystallization, morphological, and mechanical properties of PVA/PEG (10wt%) blend,” Int J Polym Sci, vol. 2018, 2018. [CrossRef]
- S. B. Chakrapani, M. J. Minkler, and B. S. Beckingham, “Low-field 1H-NMR spectroscopy for compositional analysis of multicomponent polymer systems,” Analyst, vol. 144, no. 5, 2019. [CrossRef]
- J. U. Izunobi and C. L. Higginbotham, “Polymer molecular weight analysis by 1H NMR spectroscopy,” J Chem Educ, vol. 88, no. 8, 2011. [CrossRef]
- D. Sainju, R. Lucas, and A. Le Gresley, “Evaluation of nuclear magnetic resonance spectroscopy for characterisation and quantitation of water-soluble polymers in river water,” Water Res, vol. 245, 2023. [CrossRef]
- Y. E. Shapiro, “1H NMR self-diffusion study of morphology and structure of polyvinyl alcohol cryogels,” J Colloid Interface Sci, vol. 212, no. 2, 1999. [CrossRef]
- J. L. Valentín, D. López, R. Hernández, C. Mijangos, and K. Saalwächter, “Structure of polyvinyl alcohol cryo-hydrogels as studied by proton low-field NMR spectroscopy,” Macromolecules, vol. 42, no. 1, pp. 263–272, Jan. 2009. [CrossRef]
- G. R. da Silva et al., “PLGA-PVA-PEG Single Emulsion Method as a Candidate for Aminolevulinic Acid (5-ALA) Encapsulation: Laboratory Scaling Up and Stability Evaluation,” Molecules, vol. 27, no. 18, 2022. [CrossRef]
- J. H. Flynn and L. A. Wall, “General Treatment of the Thermogravimetry of Polymers.”.
|
Disclaimer/Publisher’s Note: The statements, opinions and data contained in all publications are solely those of the individual author(s) and contributor(s) and not of MDPI and/or the editor(s). MDPI and/or the editor(s) disclaim responsibility for any injury to people or property resulting from any ideas, methods, instructions or products referred to in the content. |
© 2025 by the authors. Licensee MDPI, Basel, Switzerland. This article is an open access article distributed under the terms and conditions of the Creative Commons Attribution (CC BY) license (http://creativecommons.org/licenses/by/4.0/).