1. Introduction
Alzheimer’s disease (AD) is a crippling neurodegenerative disorder, which is both progressive and irreversible, centrally characterized by significant cognitive deficits, memory losses and impaired functional independence [
1]. Rivastigmine, a dual-sensitive inhibitor of acetyl- and butyrylcholinesterase is still commonly used to treat symptoms from among the currently approved drug for symptomatic treatment. Nevertheless, its therapeutic utility is restricted by low oral bioavailability, significant first-pass metabolism, and dose-related gastrointestinal side effects that can lead to lack of adherence. These obstacles have led to a keen interest in alternative non-invasive routes of drug delivery, which can enhance absorption and circumvent gastric metabolism [
2].
These mucosal routes, such as nasal or buccal administration, provide unique advantage for CNS targeting, including rapid onset of effect due to bypassing hepatic first-pass metabolism and better patient compliance and direct or enhanced brain delivery opportunity. However, ensuring the prolonged residence time and efficient penetration through the mucosal barriers remains a big challenge of their formulation [
3]. Solid lipid nanoparticles have gained attention as promising system for lipophilic drugs such as rivastigmine because of their stable nature, high drug entrapment, sustained-release behavior and ability to enhance the mucosal permeation potential. Adding biocompatible mucoadhesive polymers improves the performance of mucosal formulations [
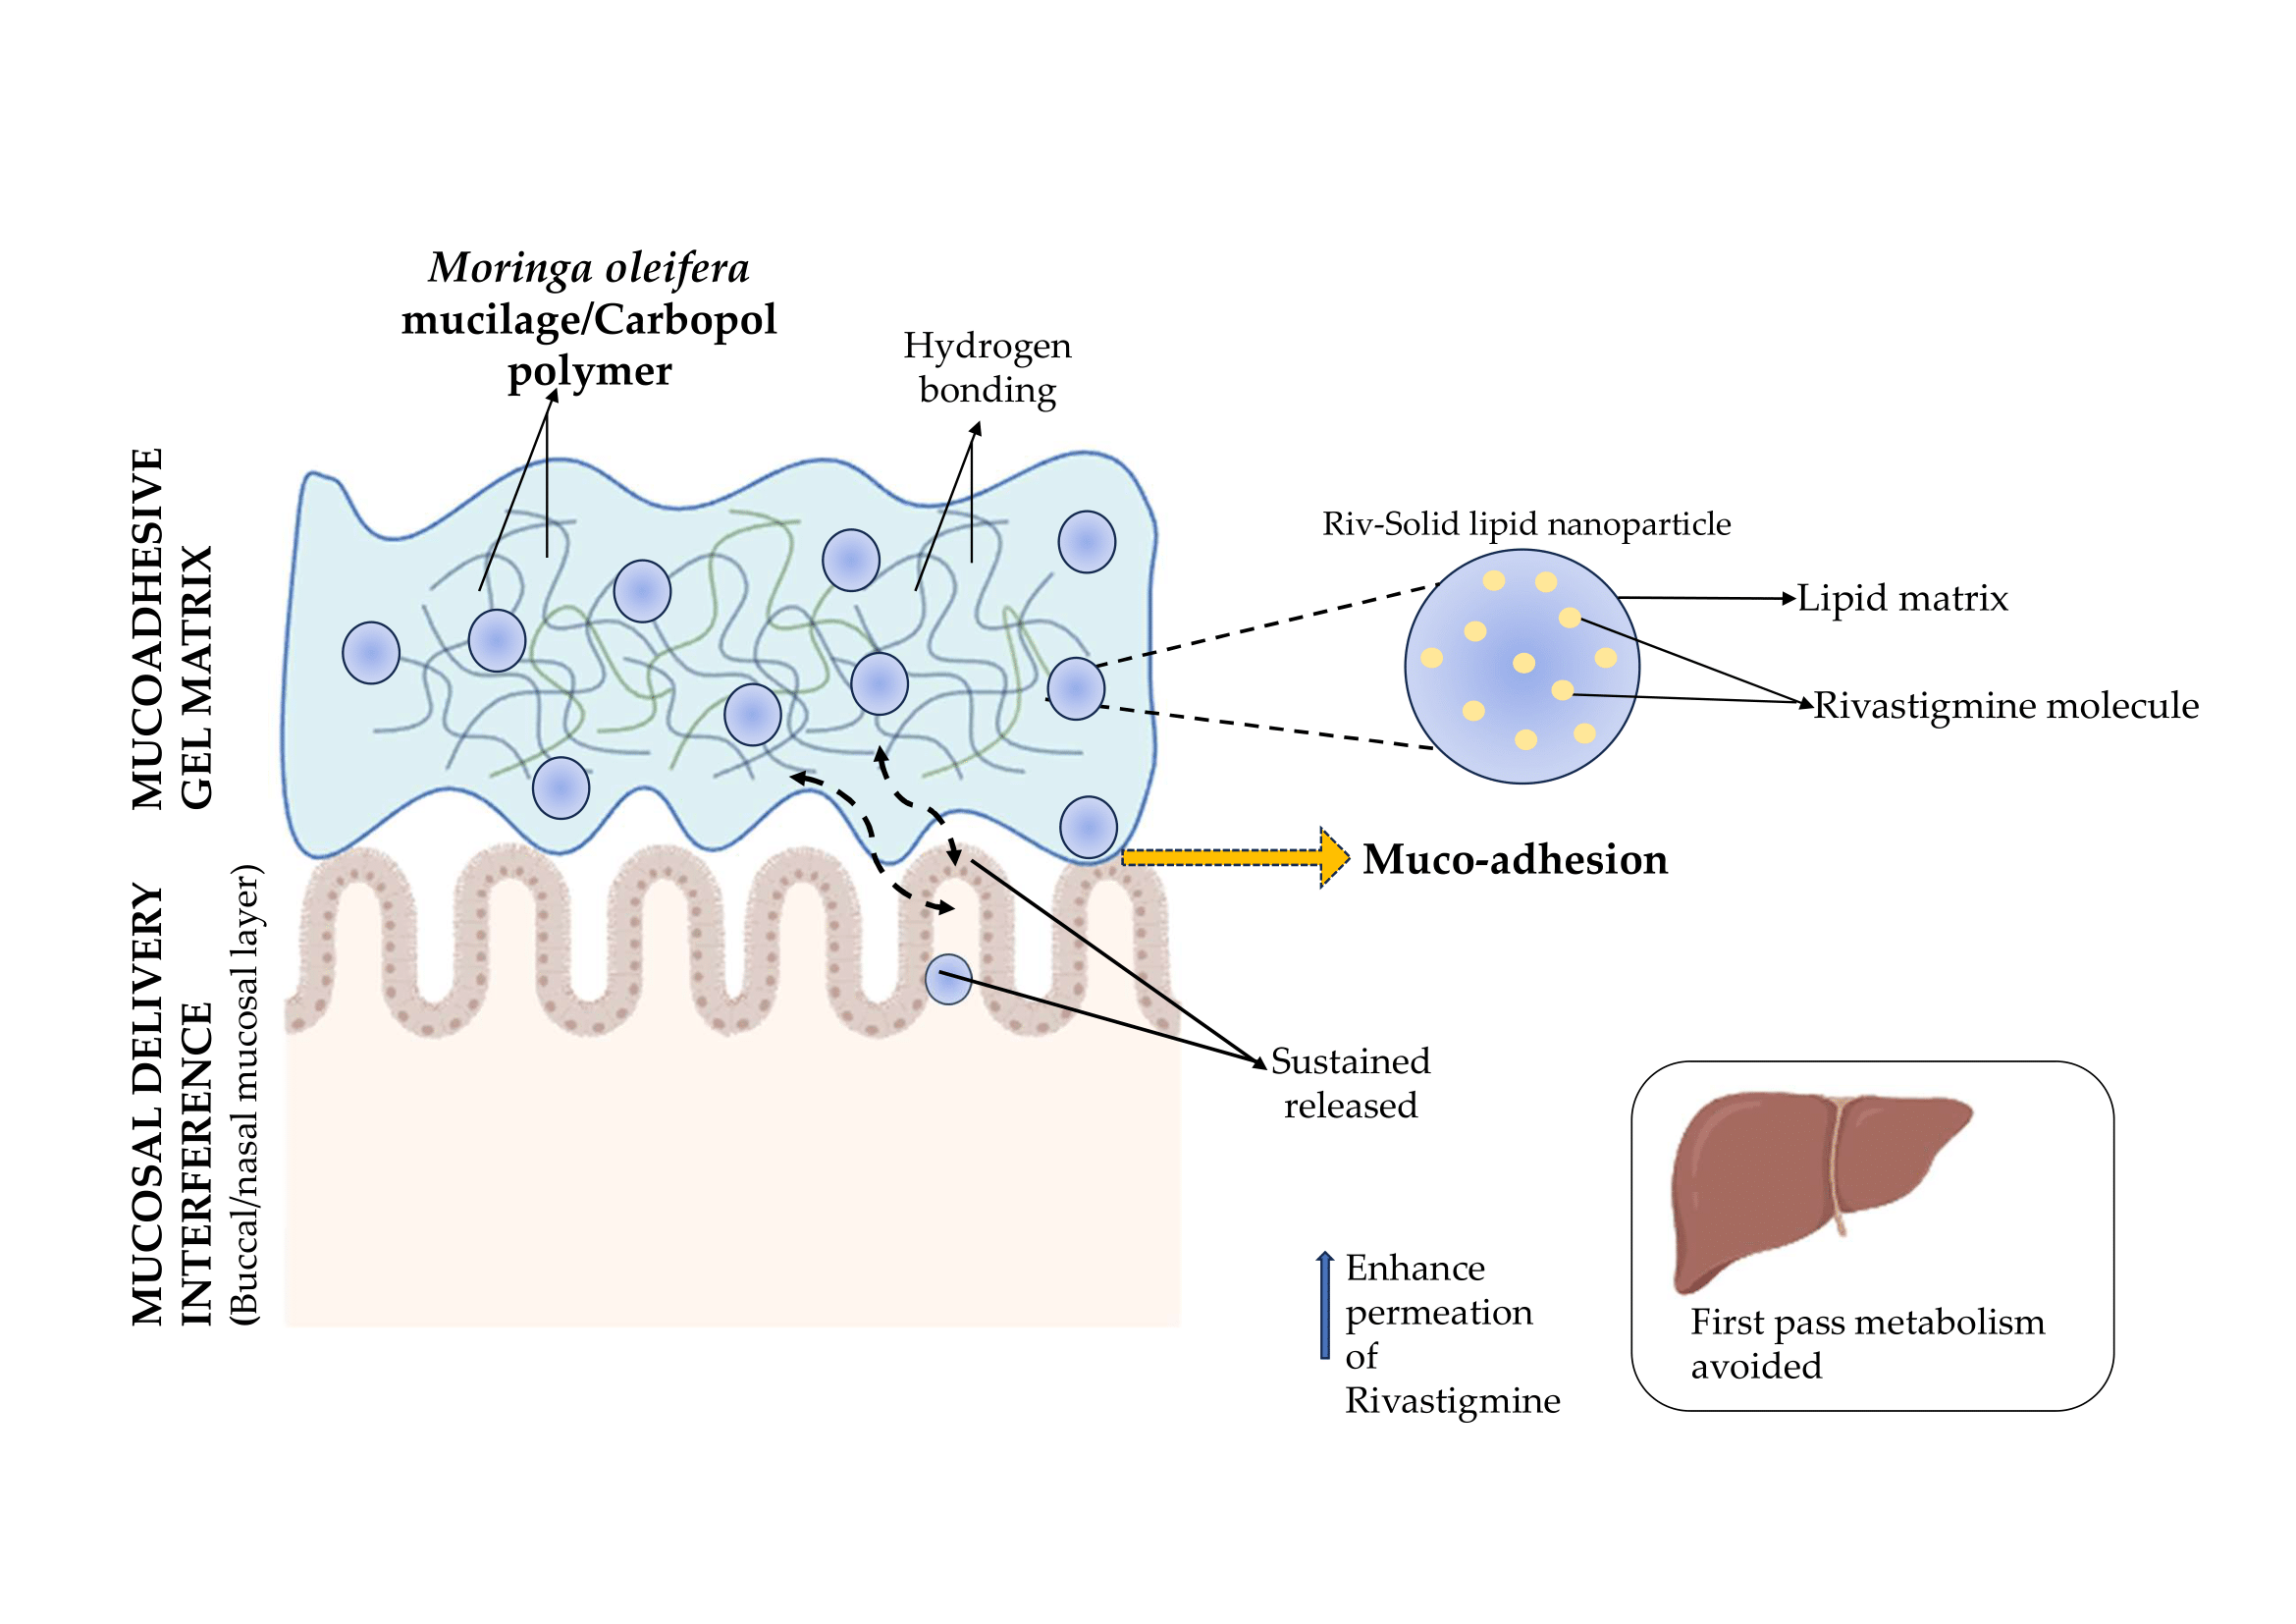
4]. Natural polymers have sparked widespread interest due to their safety, biodegradability, and functional versatility. Moringa oleifera mucilage, a plant-derived polysaccharide, has exceptional swelling behavior, hydrogen bonding capabilities, and innate mucoadhesive qualities, making it a promising choice for improving mucosal retention and intimate contact with biological membranes [
5].
The current study focusses on the development of a rivastigmine-loaded solid lipid mucoadhesive gel using Moringa oleifera mucilage to provide extended retention, increased permeability, and sustained release for both nasal and buccal administration. This is a unique application of Moringa-derived mucilage in solid lipid-based gels for Alzheimer’s disease therapy. The study’s goal is to create a patient-friendly platform that improves rivastigmine bioavailability and supports more effective and sustained Alzheimer’s disease management by combining nanostructured lipid carriers with a natural mucoadhesive polymer.
2. Results and Discussion
2.1. Characterisation of Mucilage
2.1.1. Phytochemical Screening and Ruthenium Red Test
The Ruthenium red reagent is used to identify an acidic polysaccharide such as Pectin and Mucilage, which produces a red colour when binding with both polysaccharides.
Table 1 shows the results of Phytochemical Screening for Moringa oleifera’s mucilage. Phytochemical screening revealed that Saponins, Flavonoids, Phenols and Carbohydrates were present; there were no Alkaloids, Steroids, Tannins, Proteins, Lipids or Glycosides. Carbohydrates (such as Mucilage and Gums), which are composed of many Hydroxy (-OH) functional groups and sometimes Carboxyl (-COOH) functional groups, can hydrogen bond with the mucin layer of the mucosa, swell in water, penetrate and adhere to the mucosal surface.
2.1.2. FTIR of Mucilage
The extracted mucilage’s FTIR spectrum (
Figure 1) revealed a prominent broad band at 3288 cm⁻¹, which is indicative of O–H stretching and validates the sample’s polysaccharide composition. A peak at 2920 cm⁻¹ indicates that the carbohydrate rings are stretching from C to H. O–H bending of bound water, characteristic of hydrophilic mucilage, is indicated by the prominent band at 1625 cm⁻¹. Glycosidic linkages’ C–O–C and C–O stretching vibrations are represented by strong absorptions at 1037–1313 cm⁻¹. When taken as a whole, these peaks verify that the extracted material is a naturally occurring mucilage that is high in carbohydrates.
2.1.3. 1H NMR of Mucilage
The
1H NMR spectrum of the extracted mucilage (
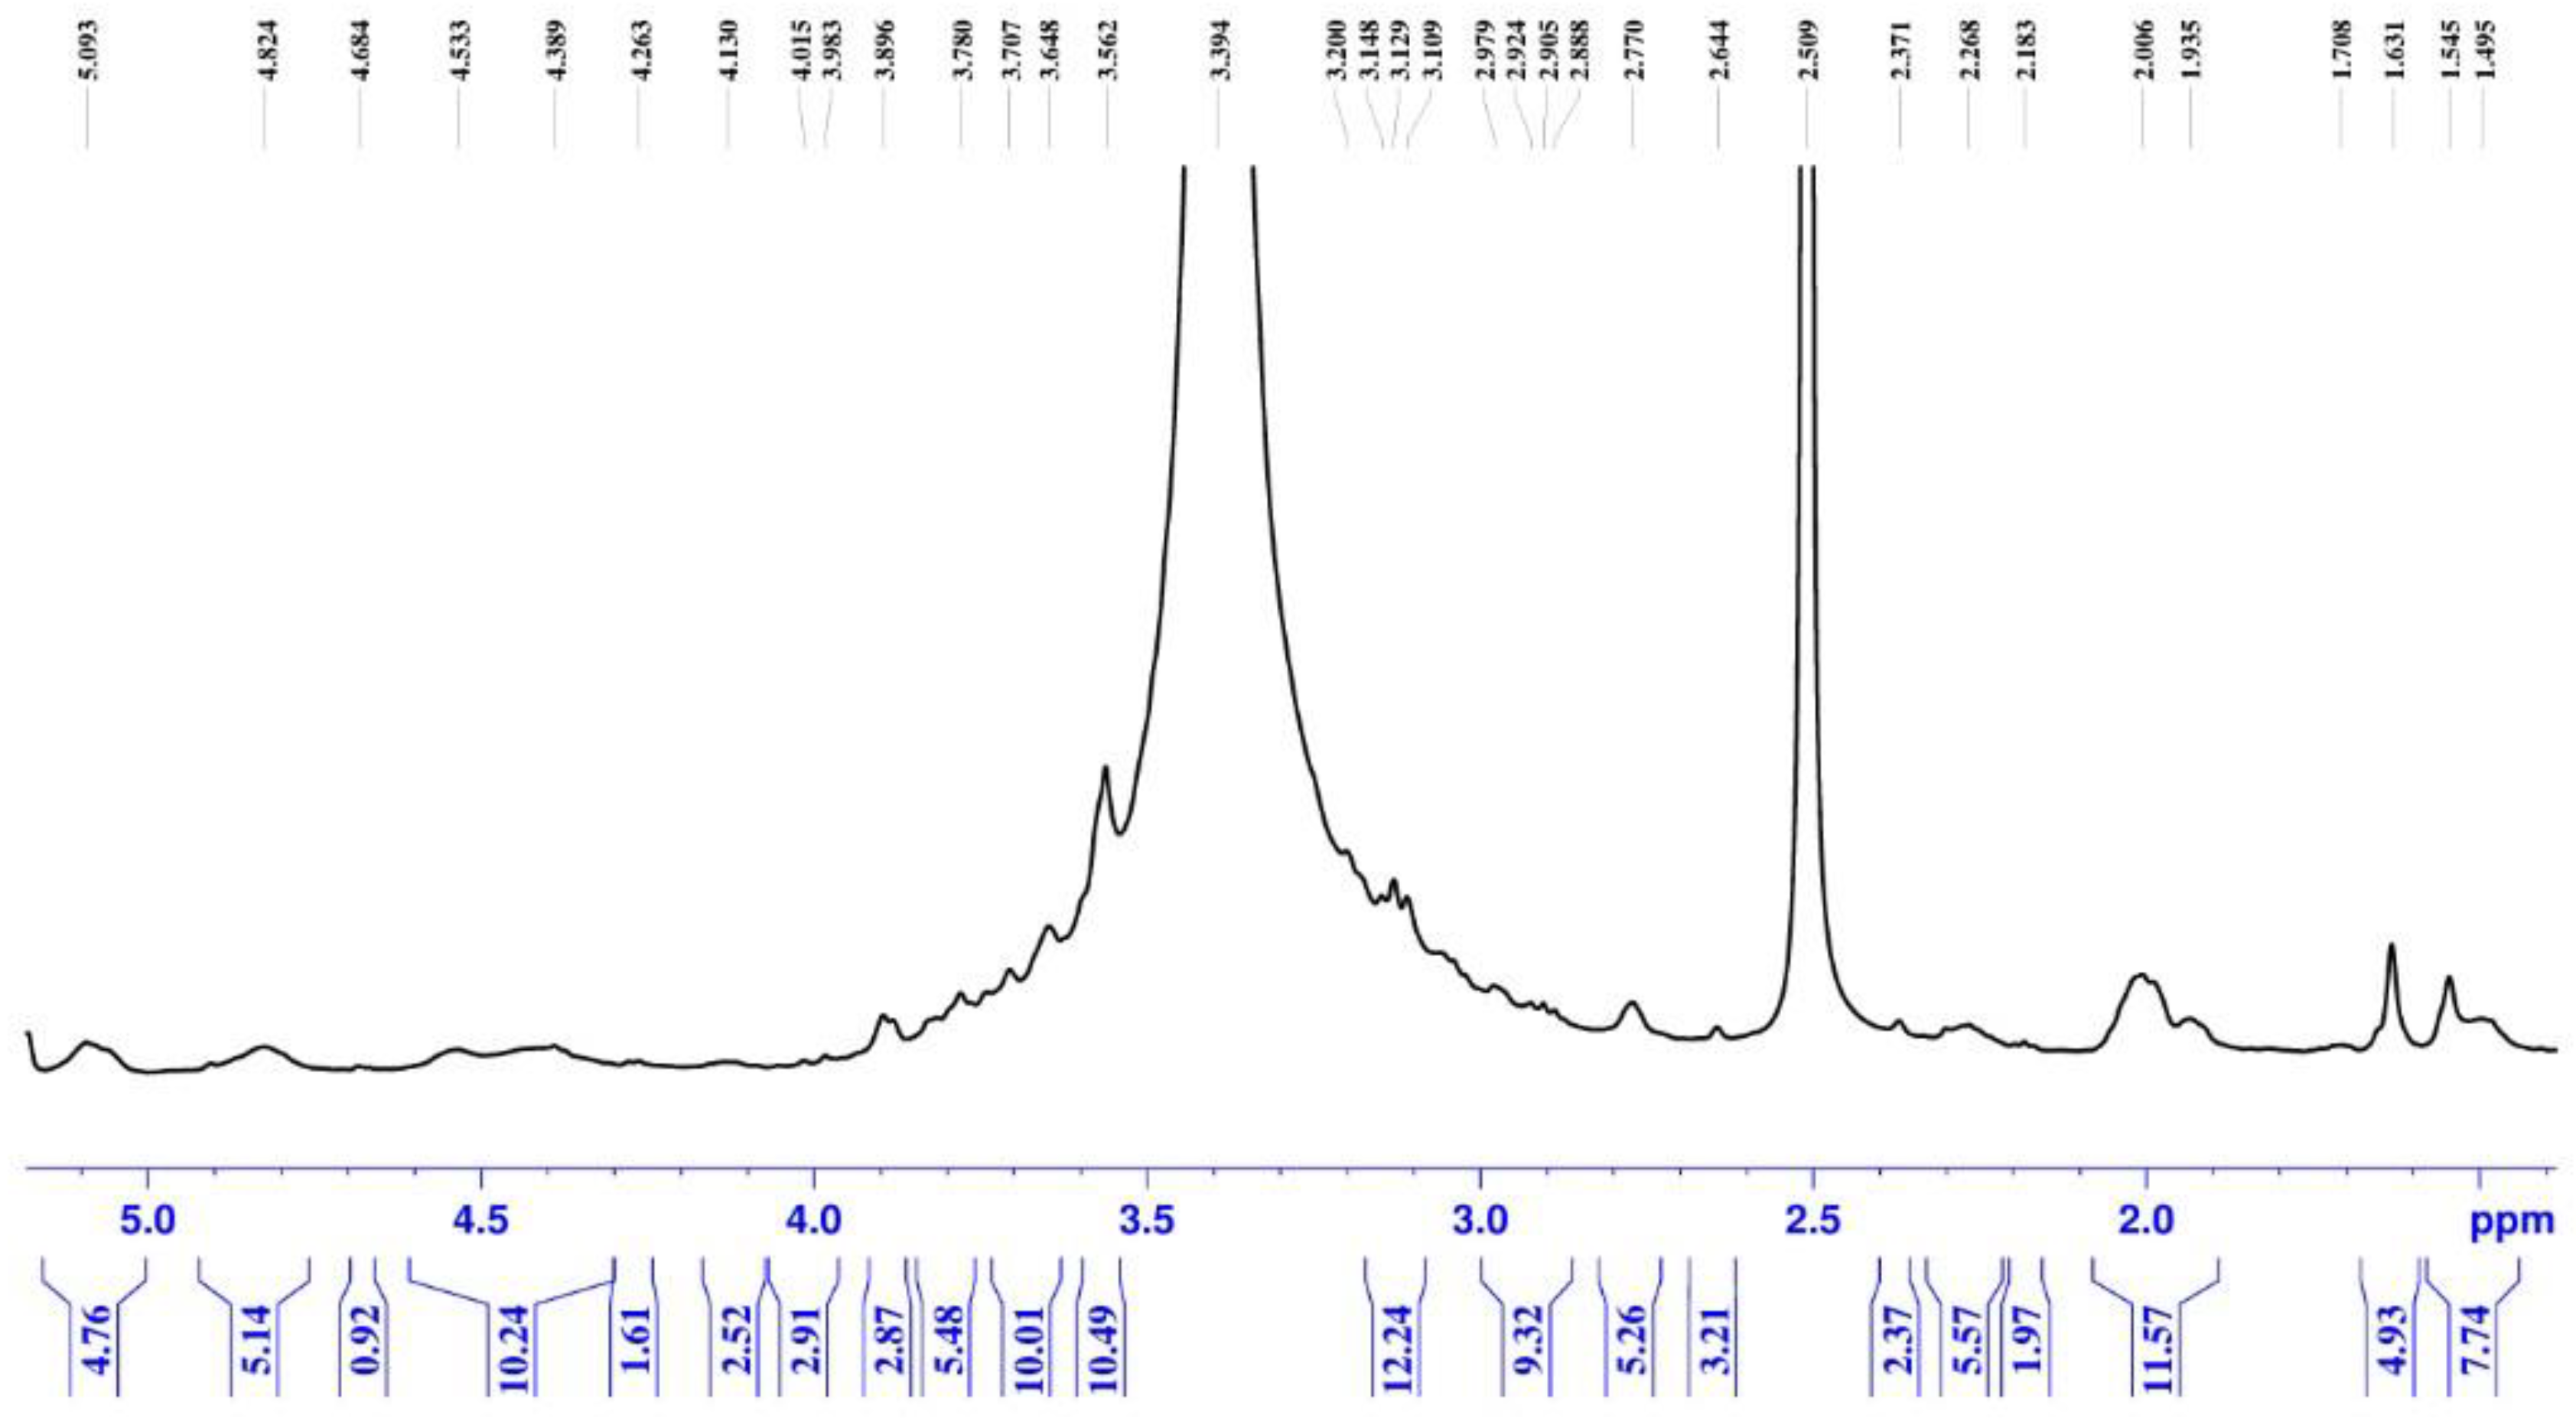
Figure 2) displays the distinctive resonances anticipated for polysaccharide-dominant biopolymers. Consistent with carbohydrate structures, most proton signals are densely clustered in the 3.0–5.0 ppm range. This concentrated aggregation of peaks indicates singles of polysaccharides composition of the mucilage. The spectrum pattern robustly confirms that the recovered mucilage predominantly comprises polysaccharide components exhibiting structural characteristics typical of natural plant-derived mucilage. The complete
1H NMR spectrum analysis report is available in Supplementary Material S1.
2.2. Formulation of Rivastigmine Loaded SLN
2.2.1. Solubility Study
The solubility of rivastigmine was preliminarily evaluated in various lipids and oils, including stearic acid, oleic acid, glyceryl monostearate, and medium-chain triglycerides. Following equilibration and spectrophotometric analysis, rivastigmine was most soluble in stearic acid, followed by oleic acid, and significantly less soluble in the other lipids. Rivastigmine’s superior solubility is likely due to its weakly basic nature, which makes it dissolve more easily in the acidic environment created by free fatty acids. Stearic acid was chosen as the main lipid for SLN preparation due to its high solubilizing capacity and proven safety in pharmaceutical formulations. These findings align with how weakly basic medications have been observed to behave in lipid-based systems.
2.2.2. Calibration Curve
A calibration curve for rivastigmine was constructed in the concentration range of 2–20 µg/mL using UV–Visible spectrophotometry. The absorbance of each standard solution was recorded at 203 nm, and a linear relationship was observed between concentration and absorbance. The calibration plot (
Figure 1) showed a regression equation with a high correlation coefficient (R² = 0.9962), indicating excellent linearity. This standard curve was used for quantifying rivastigmine in drug content, entrapment efficiency, and permeation studies.
2.2.3. DOE Experimental Design for SLN
For formulation optimization, statistical methods based upon “Design of Experiments” (DOE) were utilized for optimally developing formulations. A (2- factor) CCD was selected as an appropriate method for optimizing lipid concentrations (mg) and sonication duration (min) as the two main predictive factors; as well as particle size and entrapment efficiency respectively (R1 & R2).
Table 2 consist of overview of experimental design. The design was conducted in 13 batches, representing a combination of factorial, axial and repeated centre-point runs to verify accuracy/reproducibility of results and the curvilinear response to lipid concentration and sonication period as they impacted particle sizes/entrapment of drug products.
Response 1: Particle size
ANOVA results indicated that the quadratic model for particle size was significant, with an F-value of 7.90 (p = 0.0087). Among the two independent variables, lipid concentration (Factor A) was found to be the only significant model term (p = 0.0027), whereas sonication time (Factor B) did not show statistical significance (p = 0.6784).
Table 3.
ANOVA for Particle size.
Table 3.
ANOVA for Particle size.
| R² |
0.6125 |
| Adjusted R² |
0.5350 |
| Predicted R² |
0.2981 |
| Adequate Precision |
7.444 |
Table 4.
Fit Statistics for Particle size.
Table 4.
Fit Statistics for Particle size.
| Source |
Sum of Squares |
df |
Mean Square |
F-value |
p-value |
Results |
| Model |
31905.67 |
2 |
15952.83 |
7.90 |
0.0087 |
significant |
| A-Lipid |
31537.50 |
1 |
31537.50 |
15.62 |
0.0027 |
| B-Sonication time |
368.17 |
1 |
368.17 |
0.1824 |
0.6784 |
| Residual |
20186.64 |
10 |
2018.66 |
|
|
| Lack of Fit |
20186.64 |
6 |
3364.44 |
|
|
| Pure Error |
0.0000 |
4 |
0.0000 |
|
|
| Cor Total |
52092.31 |
12 |
|
|
|
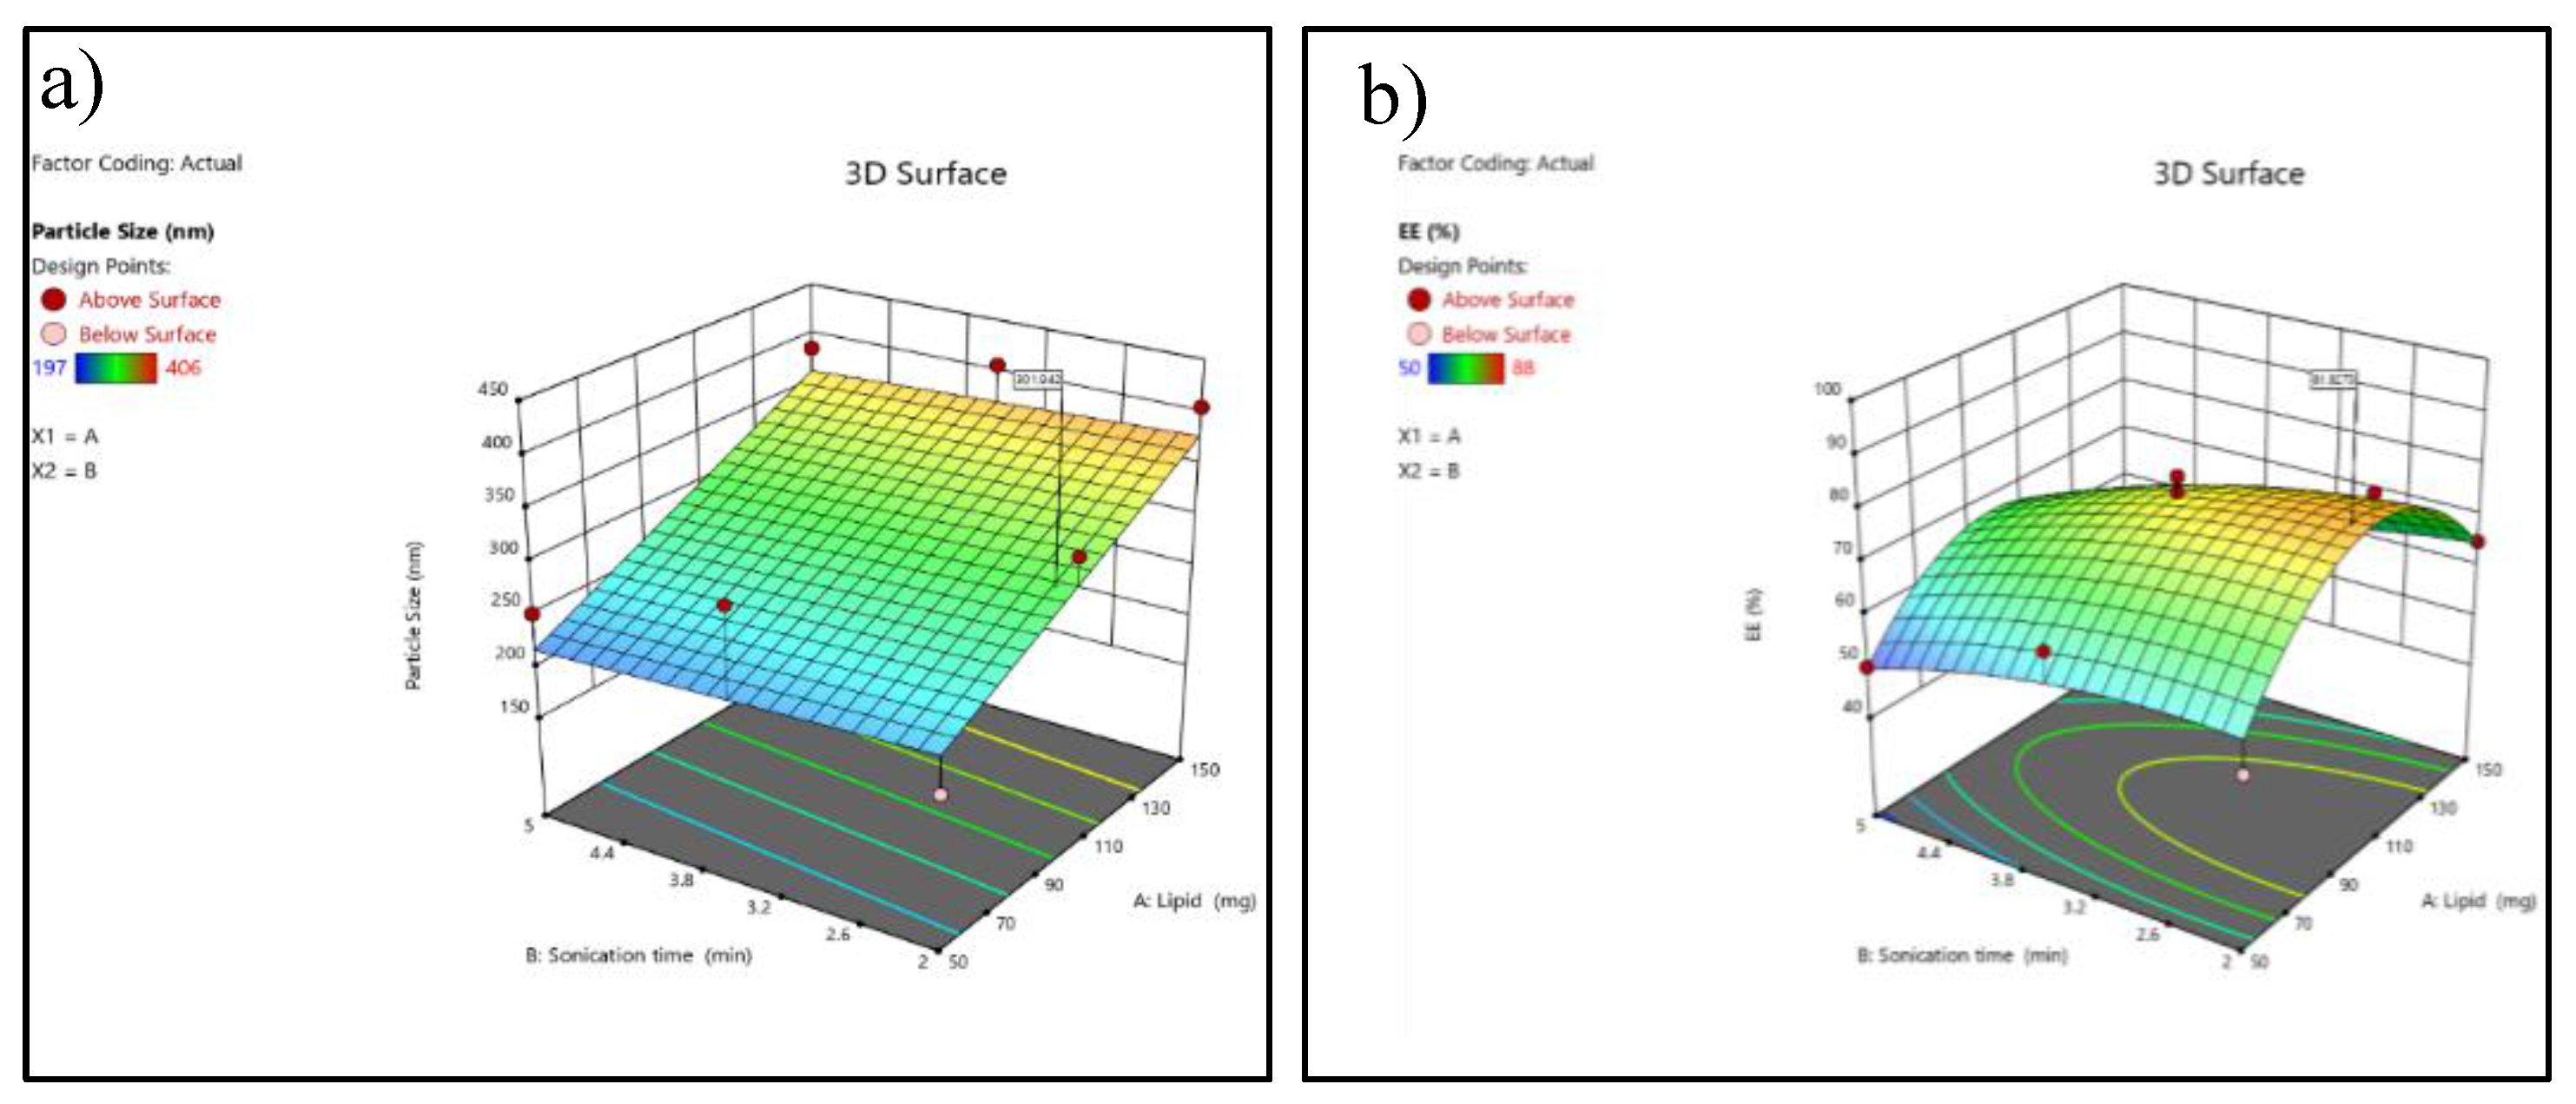
The adequate precision value (>4) confirms that the model has a sufficient signal to explore the design space. Higher lipid concentrations consistently produced larger particle sizes, which was evident in runs containing 150 mg lipid, showing particle sizes above 380 nm, compared with 50–100 mg lipid runs, which produced smaller particles (197–332 nm).
Response 2: Entrapment efficiency
The quadratic model for EE% was statistically significant (F = 5.90, p = 0.0188). Among all model terms, A² (Lipid squared term) was the only significant factor (p = 0.0041), indicating a strong curvature effect of lipid concentration on entrapment efficiency.
Table 5.
ANOVA for Entrapment efficiency.
Table 5.
ANOVA for Entrapment efficiency.
| Source |
Sum of Squares |
df |
Mean Square |
F-value |
p-value |
Results |
| Model |
1848.41 |
5 |
369.68 |
5.90 |
0.0188 |
significant |
| A-Lipid |
0.1667 |
1 |
0.1667 |
0.0027 |
0.9603 |
| B-Sonication time |
322.67 |
1 |
322.67 |
5.15 |
0.0575 |
| AB |
25.00 |
1 |
25.00 |
0.3992 |
0.5476 |
| A² |
1102.86 |
1 |
1102.86 |
17.61 |
0.0041 |
| B² |
33.50 |
1 |
33.50 |
0.5350 |
0.4883 |
| Residual |
438.36 |
7 |
62.62 |
|
|
|
| Lack of Fit |
269.16 |
3 |
89.72 |
2.12 |
0.2403 |
|
| Pure Error |
169.20 |
4 |
42.30 |
|
|
|
| Cor Total |
2286.77 |
12 |
|
|
|
|
Table 6.
Fit Statistics for Particle size.
Table 6.
Fit Statistics for Particle size.
| R² |
0.8083 |
| Adjusted R² |
0.6714 |
| Predicted R² |
-0.3028 |
| Adequate Precision |
6.879 |
The negative predicted R² suggests that although the model fits the existing data reasonably well, its predictive ability outside the design space is poor and may require model refinement or additional experiments. Entrapment efficiency showed a non-linear trend, with moderate lipid levels (around 100 mg) producing the highest EE values (82–88%), while both low and high lipid concentrations reduced EE% (50–65%).
Figure 3.
3D response surface plot (a) 3D response surface plot showing the effect of lipid concentration (A) and sonication time (B) on particle size (nm). (b) response surface plot showing the effect of lipid concentration (A) and sonication time (B) on entrapment efficiency (EE%).
Figure 3.
3D response surface plot (a) 3D response surface plot showing the effect of lipid concentration (A) and sonication time (B) on particle size (nm). (b) response surface plot showing the effect of lipid concentration (A) and sonication time (B) on entrapment efficiency (EE%).
Figure 4.
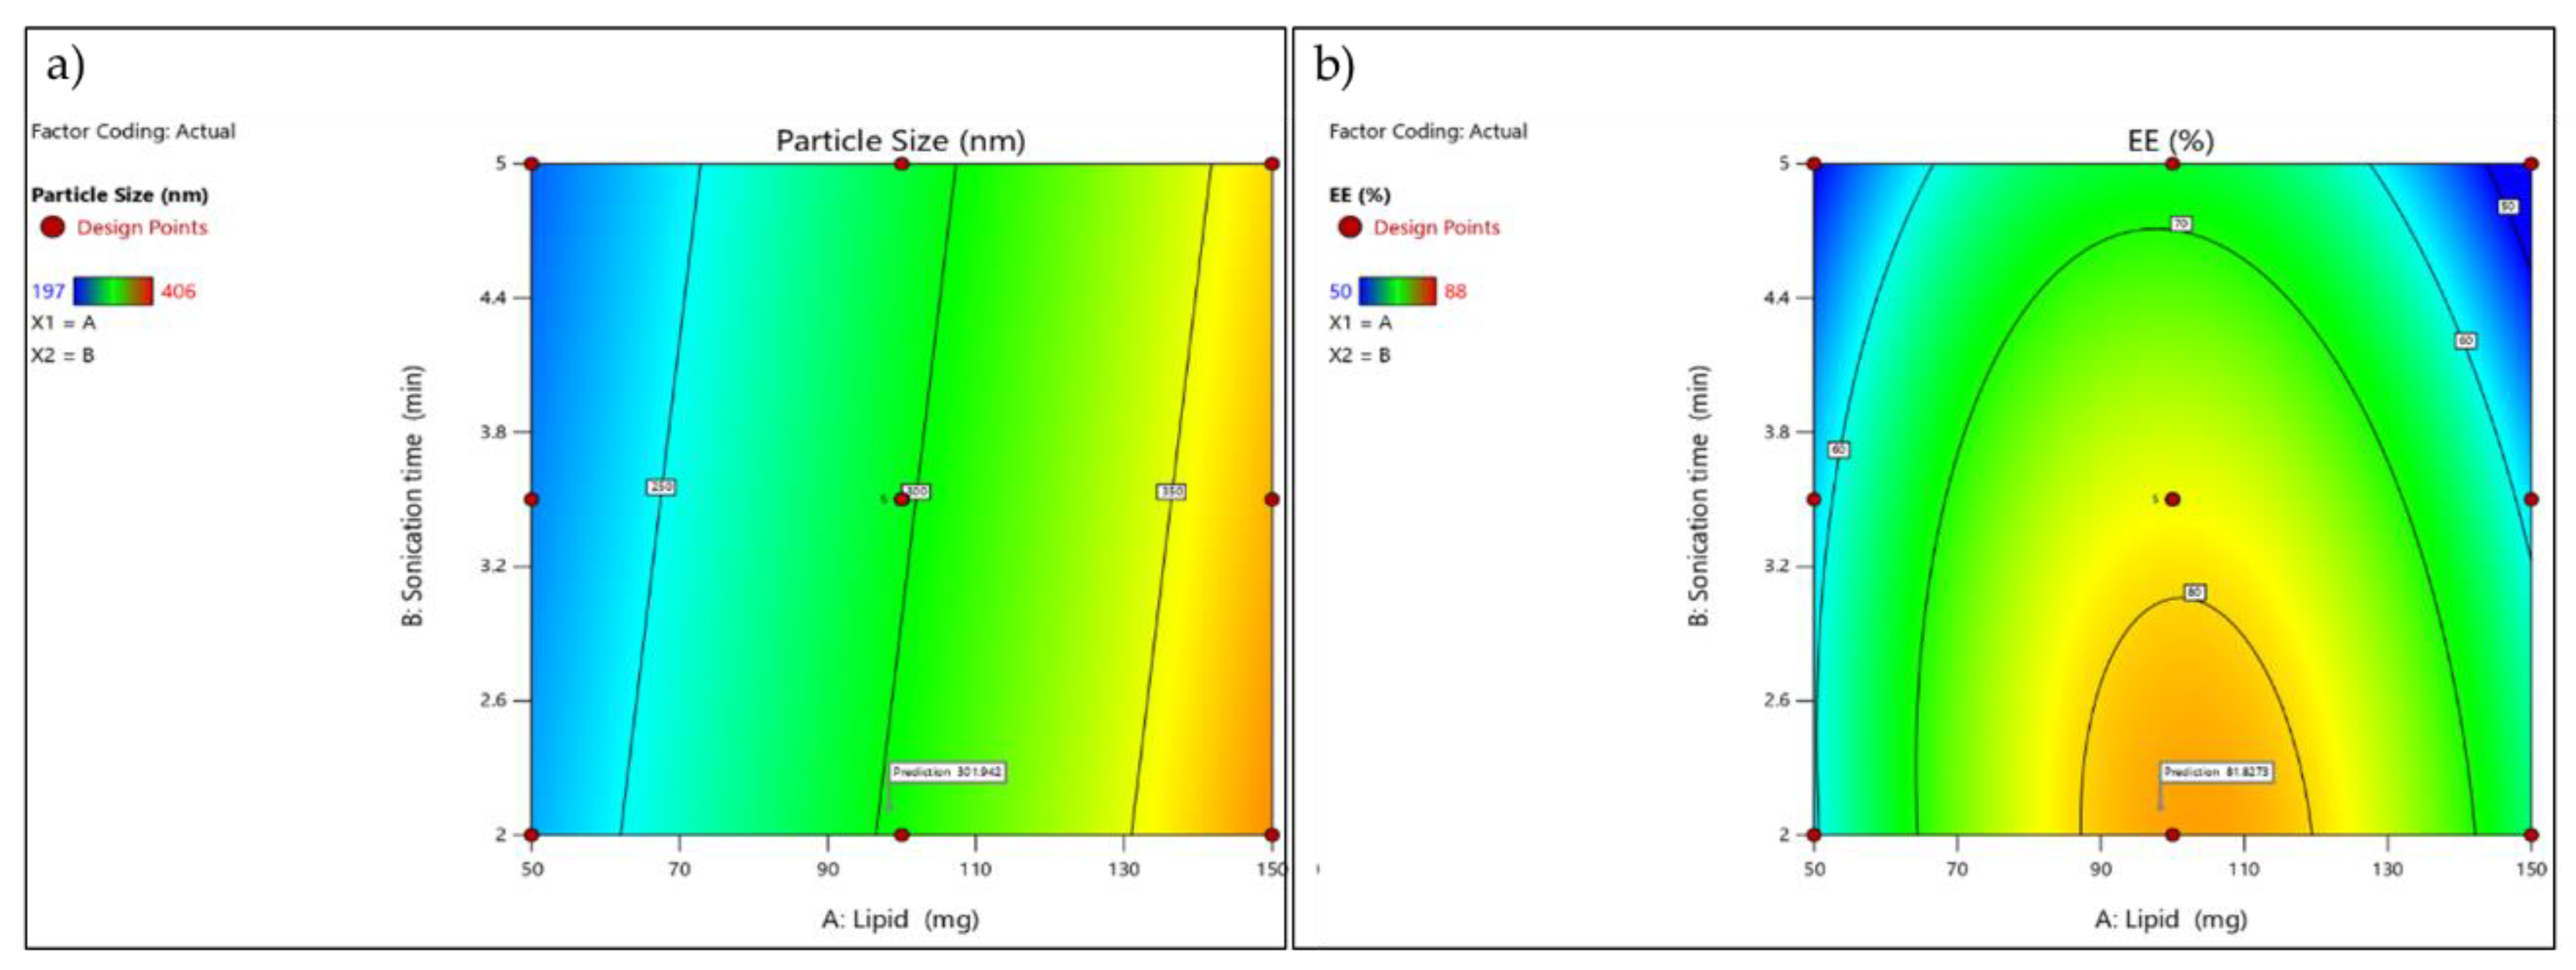
Contour plot(a) Contour plot illustrating the influence of lipid concentration (A) and sonication time (B) on particle size (nm).(b) Contour plot illustrating the influence of lipid concentration (A) and sonication time (B) on entrapment efficiency (EE%).
Figure 4.
Contour plot(a) Contour plot illustrating the influence of lipid concentration (A) and sonication time (B) on particle size (nm).(b) Contour plot illustrating the influence of lipid concentration (A) and sonication time (B) on entrapment efficiency (EE%).
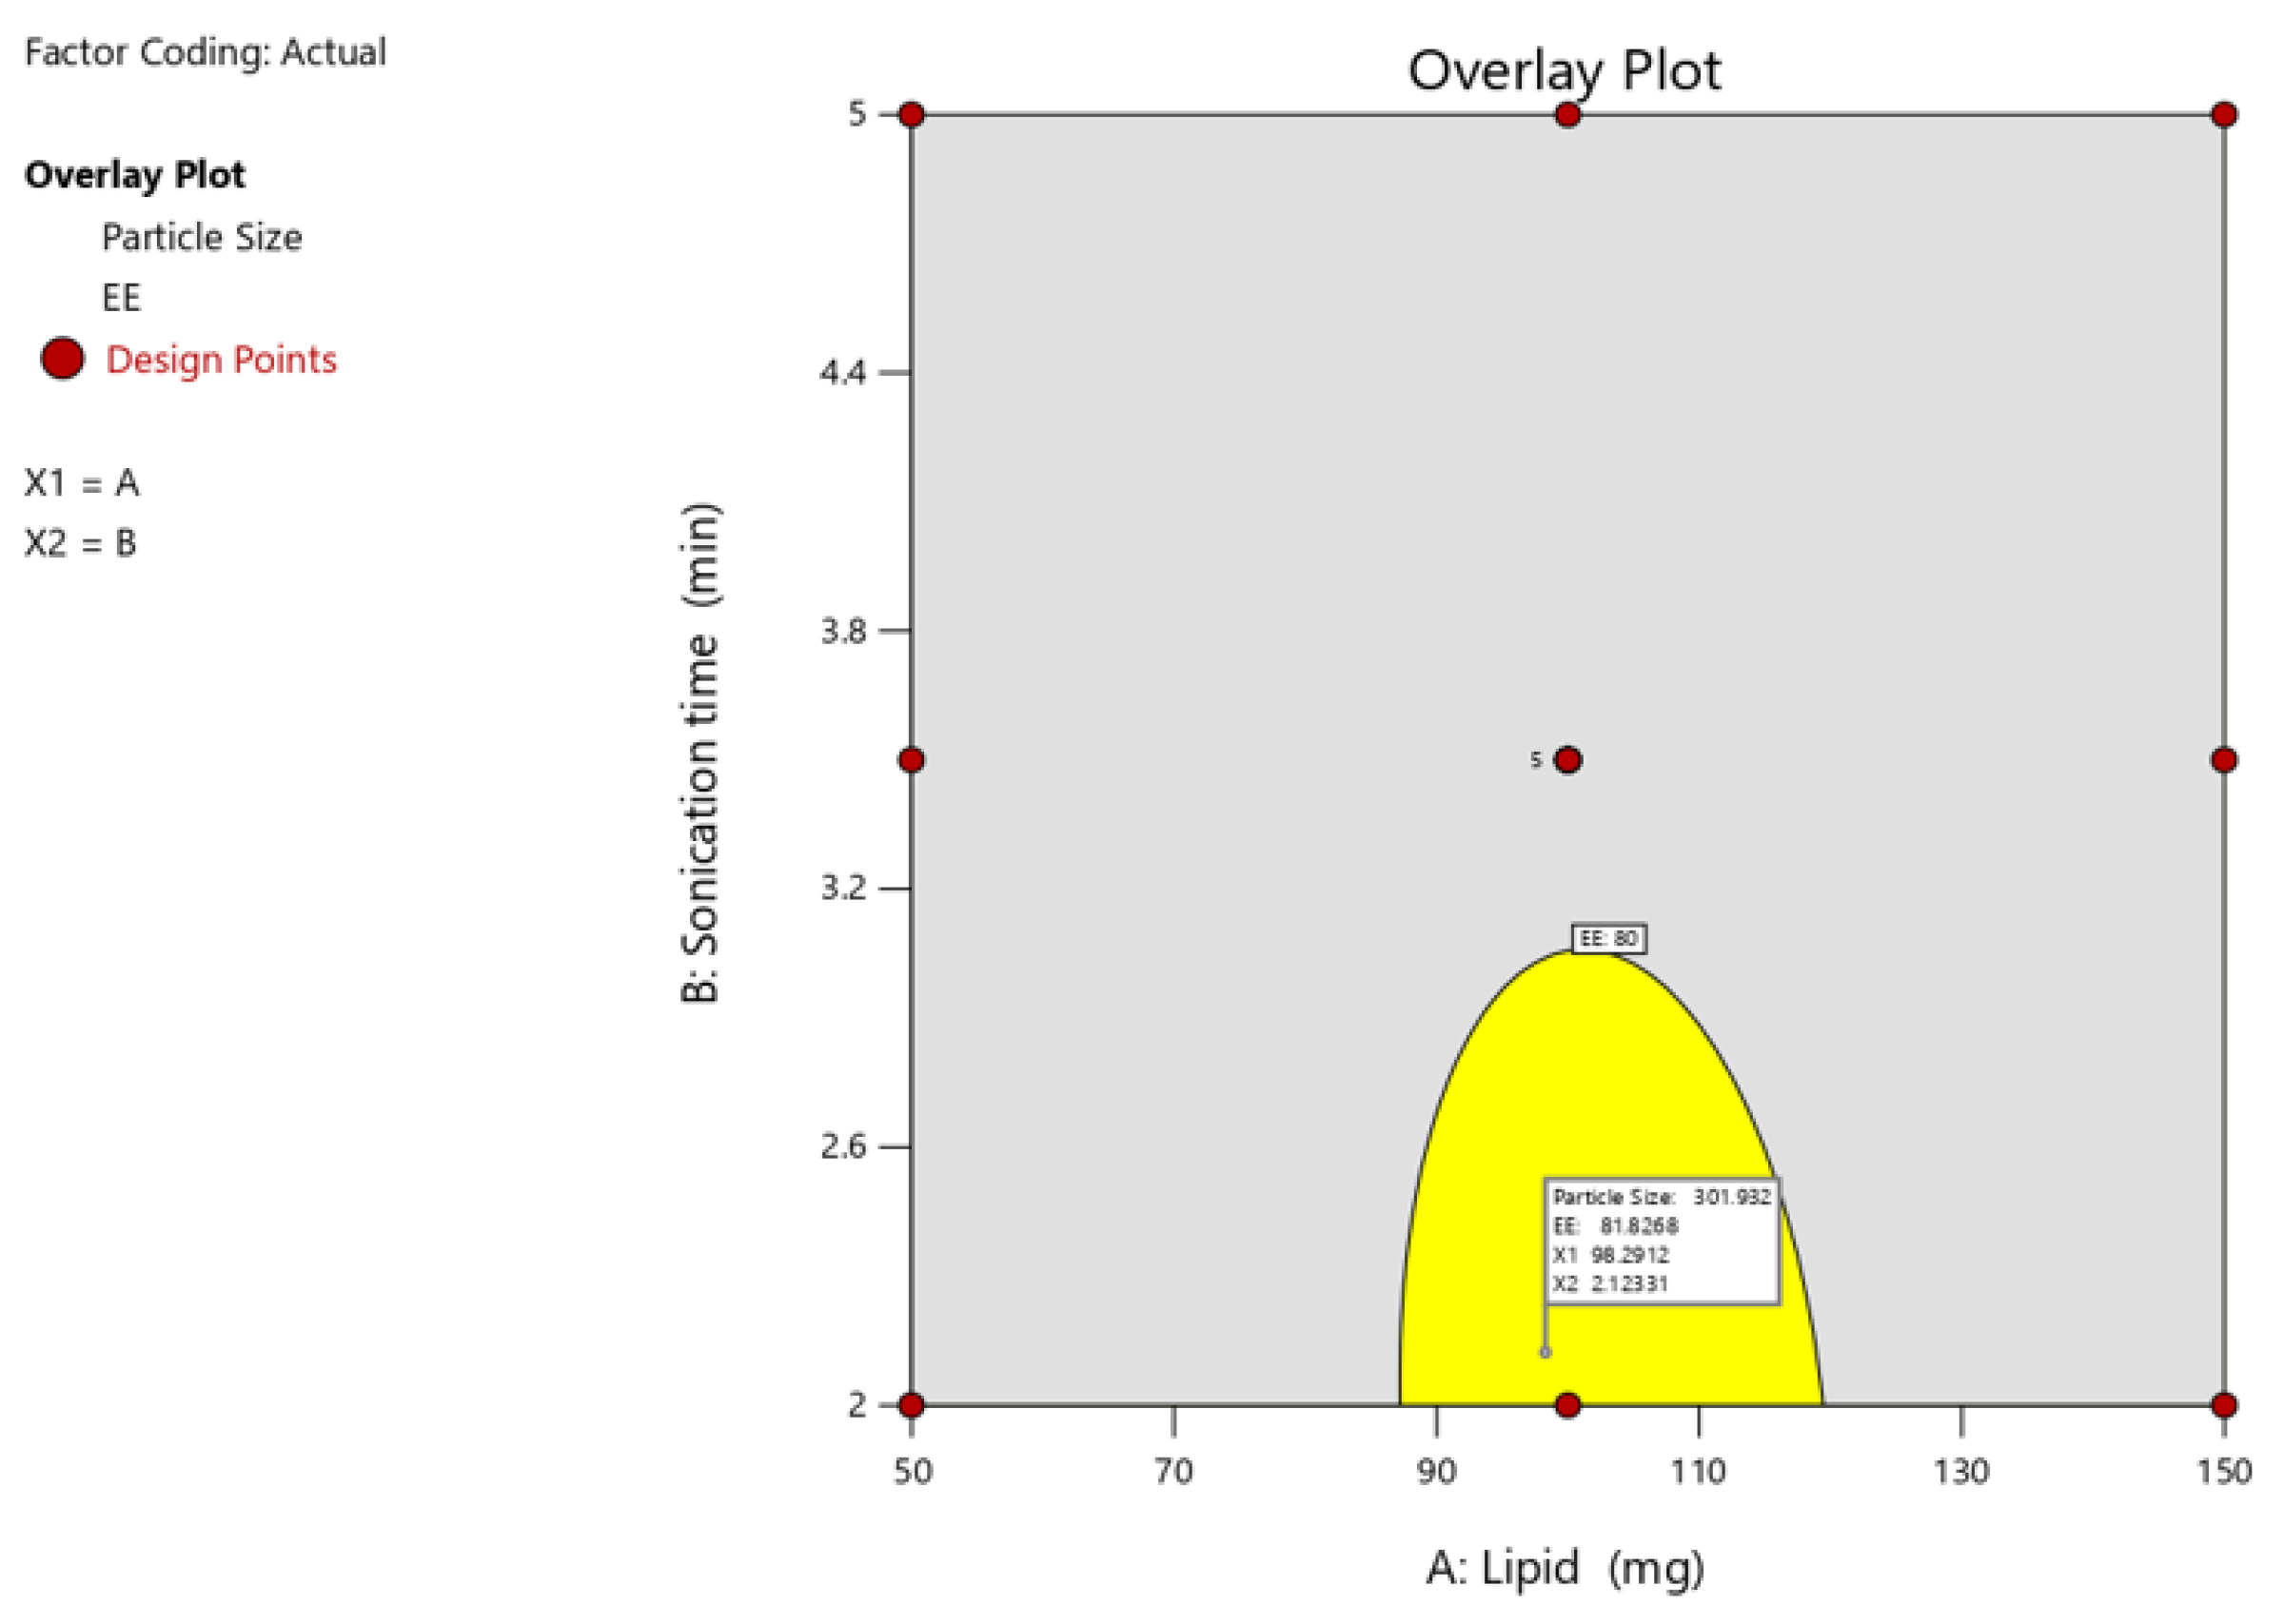
2.2.4. Optimization of Independent Variable and Validation
Optimization of the independent variable and validation following the analysis of the polynomial equations, which depicted the dependent and independent variables, a further optimization and validation process was carried out using the Design Expert program with required qualities to probe the optimal SLN formula solution. This was dependent on the prescriptive criteria of maximum EE and particle size. The optimum formulation was determined to contain 100 mg of lipid and 3.5 minutes of probe sonication, which met the optimization requirements. At these levels, the projected values for Y1 (particle size), Y2 (EE), and Y3 were 265nm and 82.0%, respectively. To confirm the expected model, a second batch of SLNs was generated using the optimal formulation factor levels. The improved formulation had an EE of 83.34 ± 0.52% and particle size of 1.4 ± 263.2 nm, which were consistent with projected values. A comparison of the observed outcomes to theoretical predictions demonstrated CCD’s reliability in predicting a desired SLN formulation.
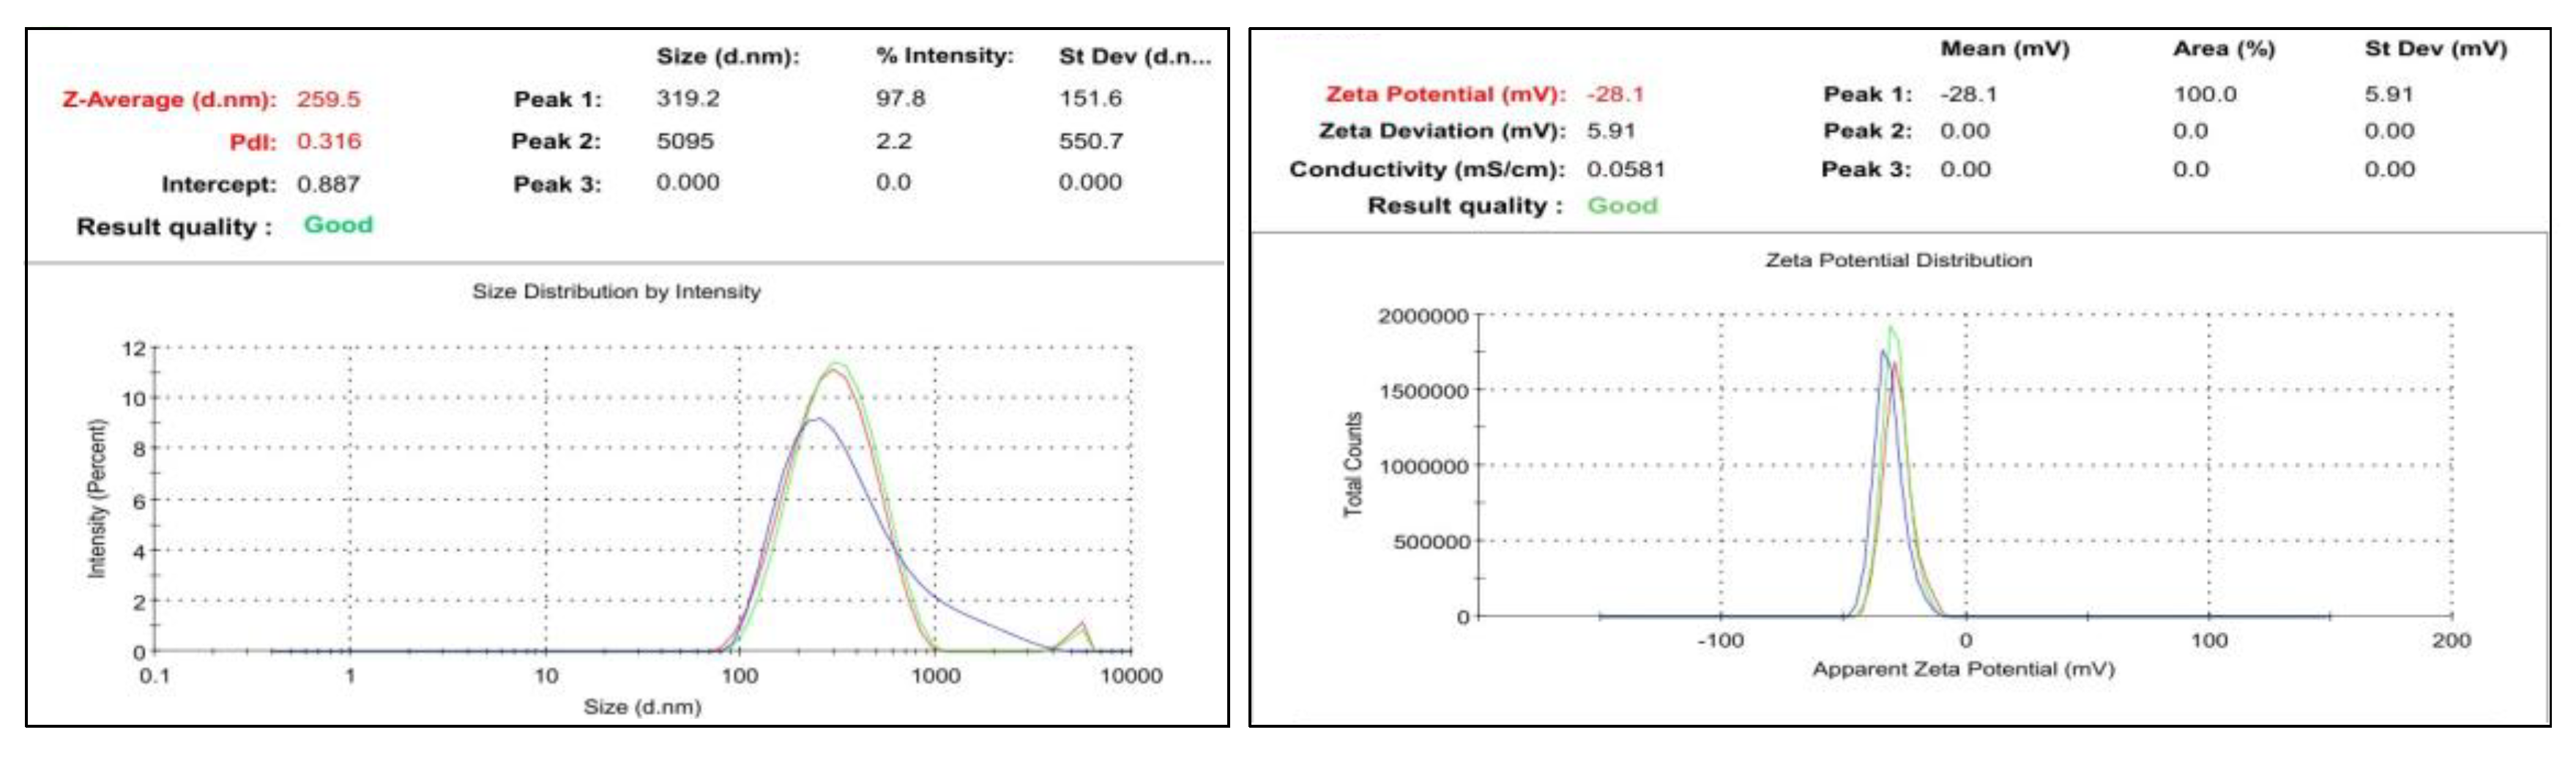
2.2.5. Particular Size, Polydispersity Index and Zeta Potential Evaluation of SLN
The particular formulation was selected by observing their range of particle size, zeta potential and PDI. If the particle size is lesser compared to others it has more penetration activity and the polydispersity index (PI) is a measure of the heterogeneity of a sample based on size. Polydispersity can occur due to size distribution in a sample or agglomeration or aggregation of the sample during isolation or analysis. Zeta potential is a scientific term for electrokinetic potential in colloidal system which has a major effect on the various properties of nano-drug delivery systems. Presently, colloidal nano-carriers are growing at a remarkable rate owing to their strong potential for overcoming old challenges such as poor drug solubility and bioavailability, as compared to the other runs first run with 100mg lipid and 3.5 sonication time has obtained optimized ratio it has been selected
Figure 10. It has been predicted to particulate size and PDI. The sample used was 221.5nm small particle size. They were also distributed in wide size. Moreover, in comparison with other samples, the PDI of 0.358 was likewise within the range. It was observed that the maximum particle intensity was 25 percent in this formulation. Zeta’s typical value ranges from -30 mV to +30 mV. It was determined to be -39.5mV for the produced formulation. So, we have selected it as optimized formulation.
Figure 6.
PS, PDI and Zeta Rivastigmine-loaded SLNs.
Figure 6.
PS, PDI and Zeta Rivastigmine-loaded SLNs.
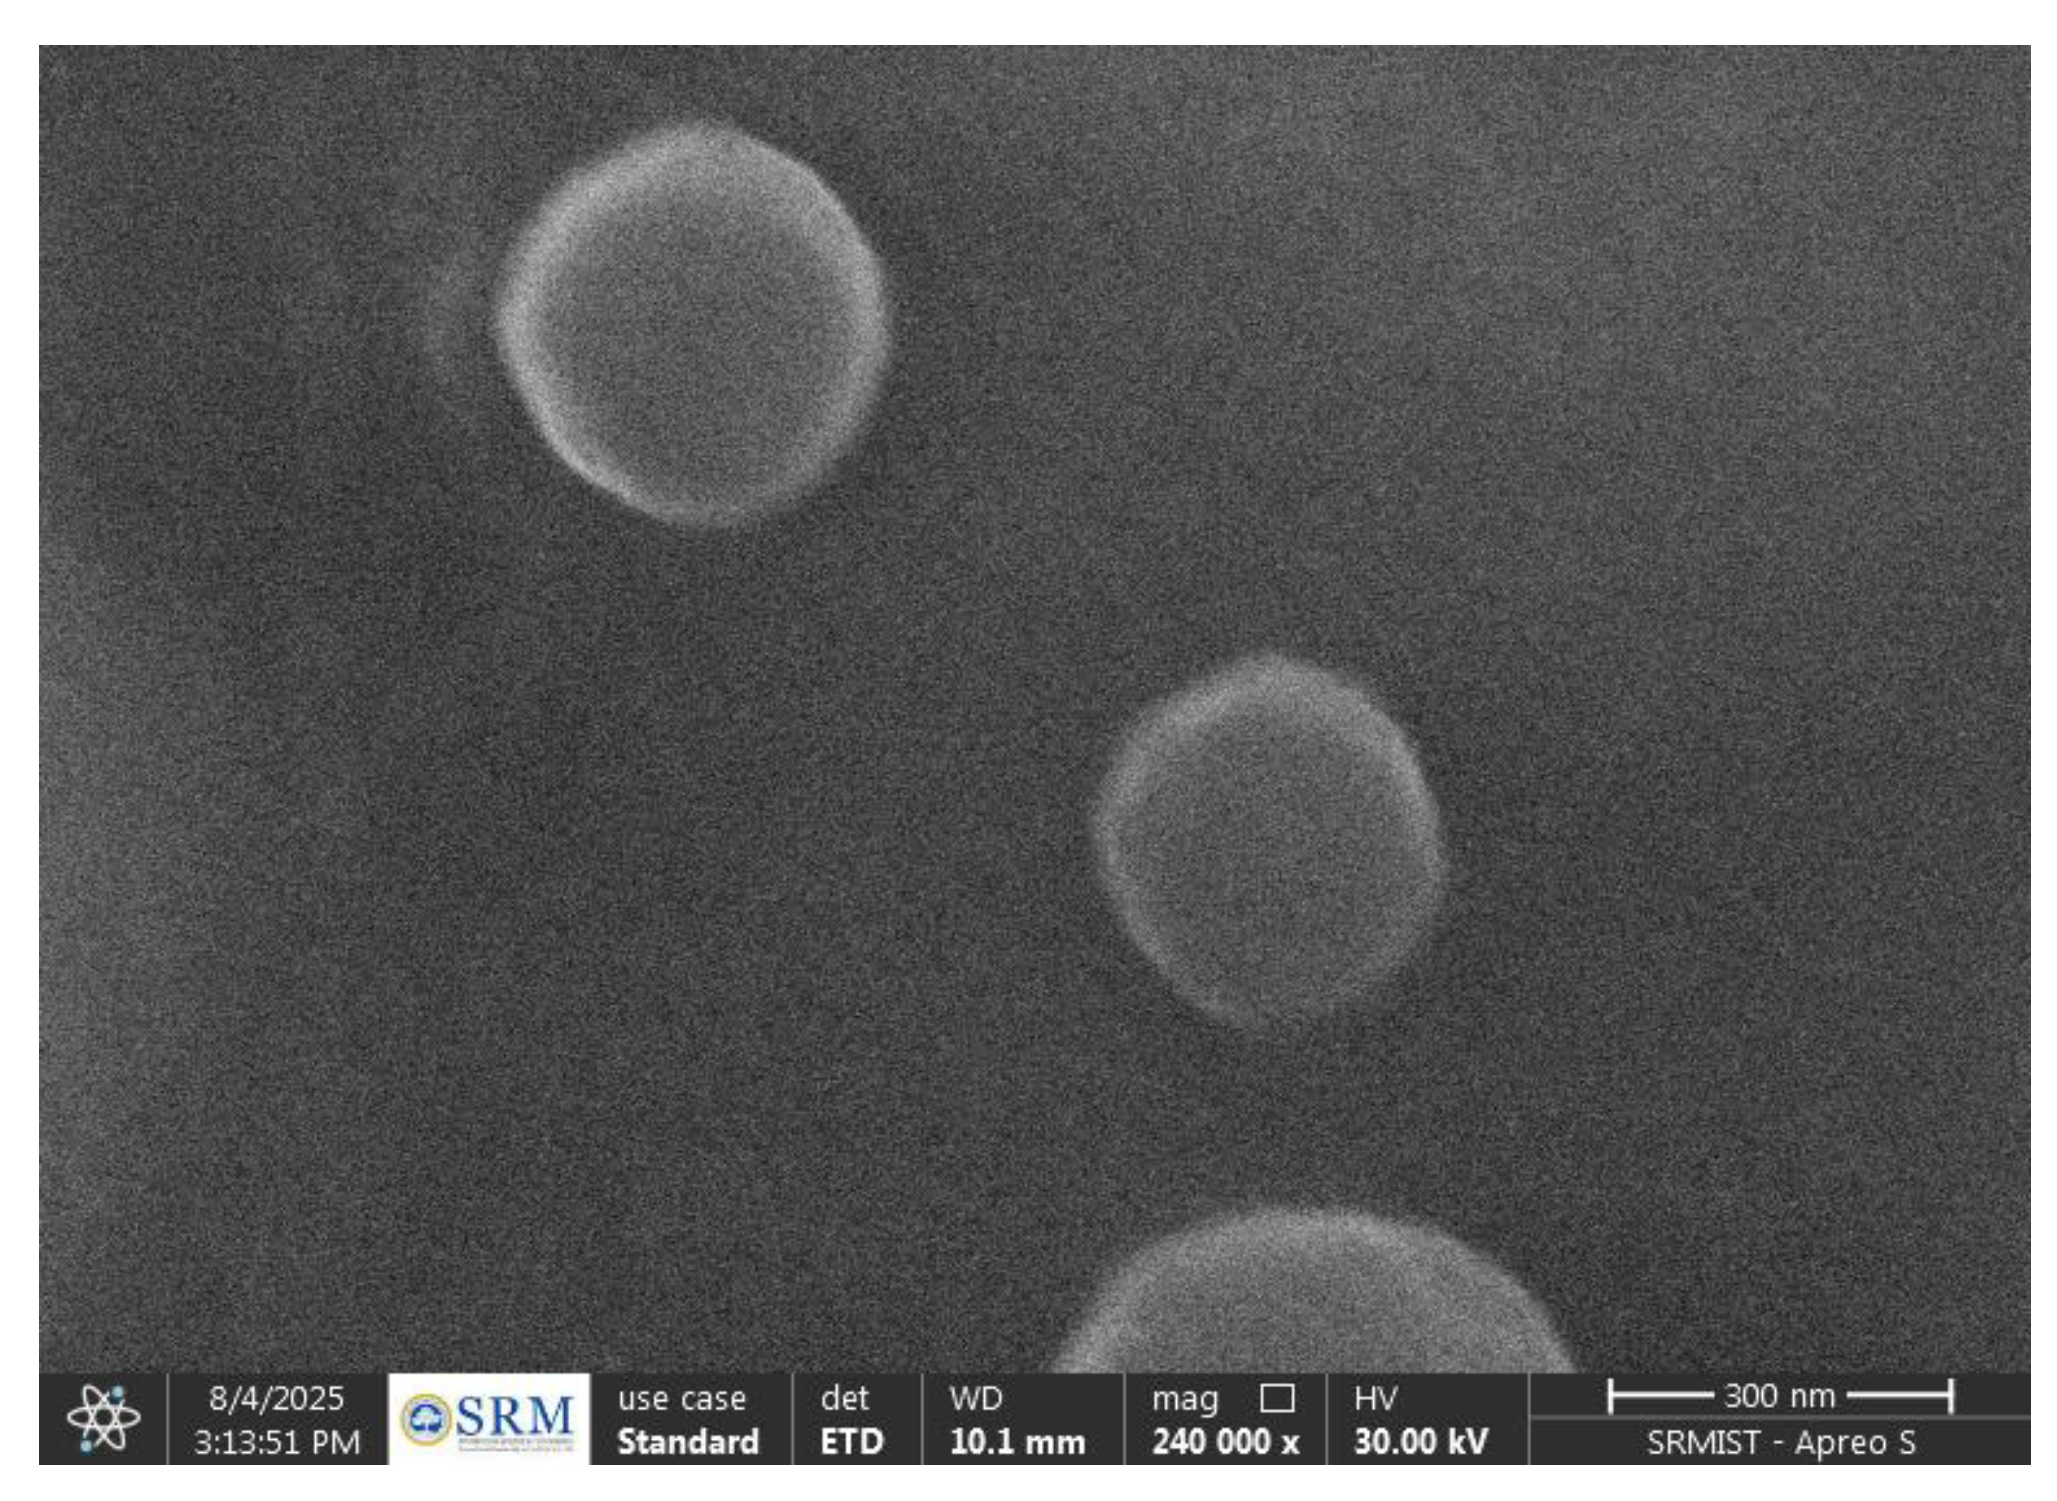
2.2.6. SEM Analysis of Rivastigmine-Loaded SLNs
SEM analysis showed that the Rivastigmine-loaded SLNs were spherical, smooth, and uniformly dispersed. The particles appeared discrete with no notable aggregation, confirming good stability and proper solidification of the lipid matrix. The observed morphology visually corresponded with the nanoscale size obtained from particle size analysis, indicating successful formation of well-structured Riv-SLNs.
Figure 7.
Sem image of Rivastigmine-loaded SLNs.
Figure 7.
Sem image of Rivastigmine-loaded SLNs.
2.2.7. Entrapment Efficiency
The entrapment efficiency of Rivastigmine-loaded SLNs determined by the indirect centrifugation method was found to be 88%. After centrifugation, the free drug present in the supernatant was quantified using UV spectrophotometry, and the entrapped drug was calculated by difference. The high EE% indicates efficient incorporation of rivastigmine within the lipid matrix and confirms the suitability of the formulation and process parameters for achieving optimal drug loading.
2.3. Characterization of Natural Polymer Based Riv Loaded SLN Gel Formulation
2.3.1. FTIR Analysis of Pure Drug, Blank SLN, Drug-Loaded SLN and Natural Polymer Based Riv -SLN Loaded Gel Formulation
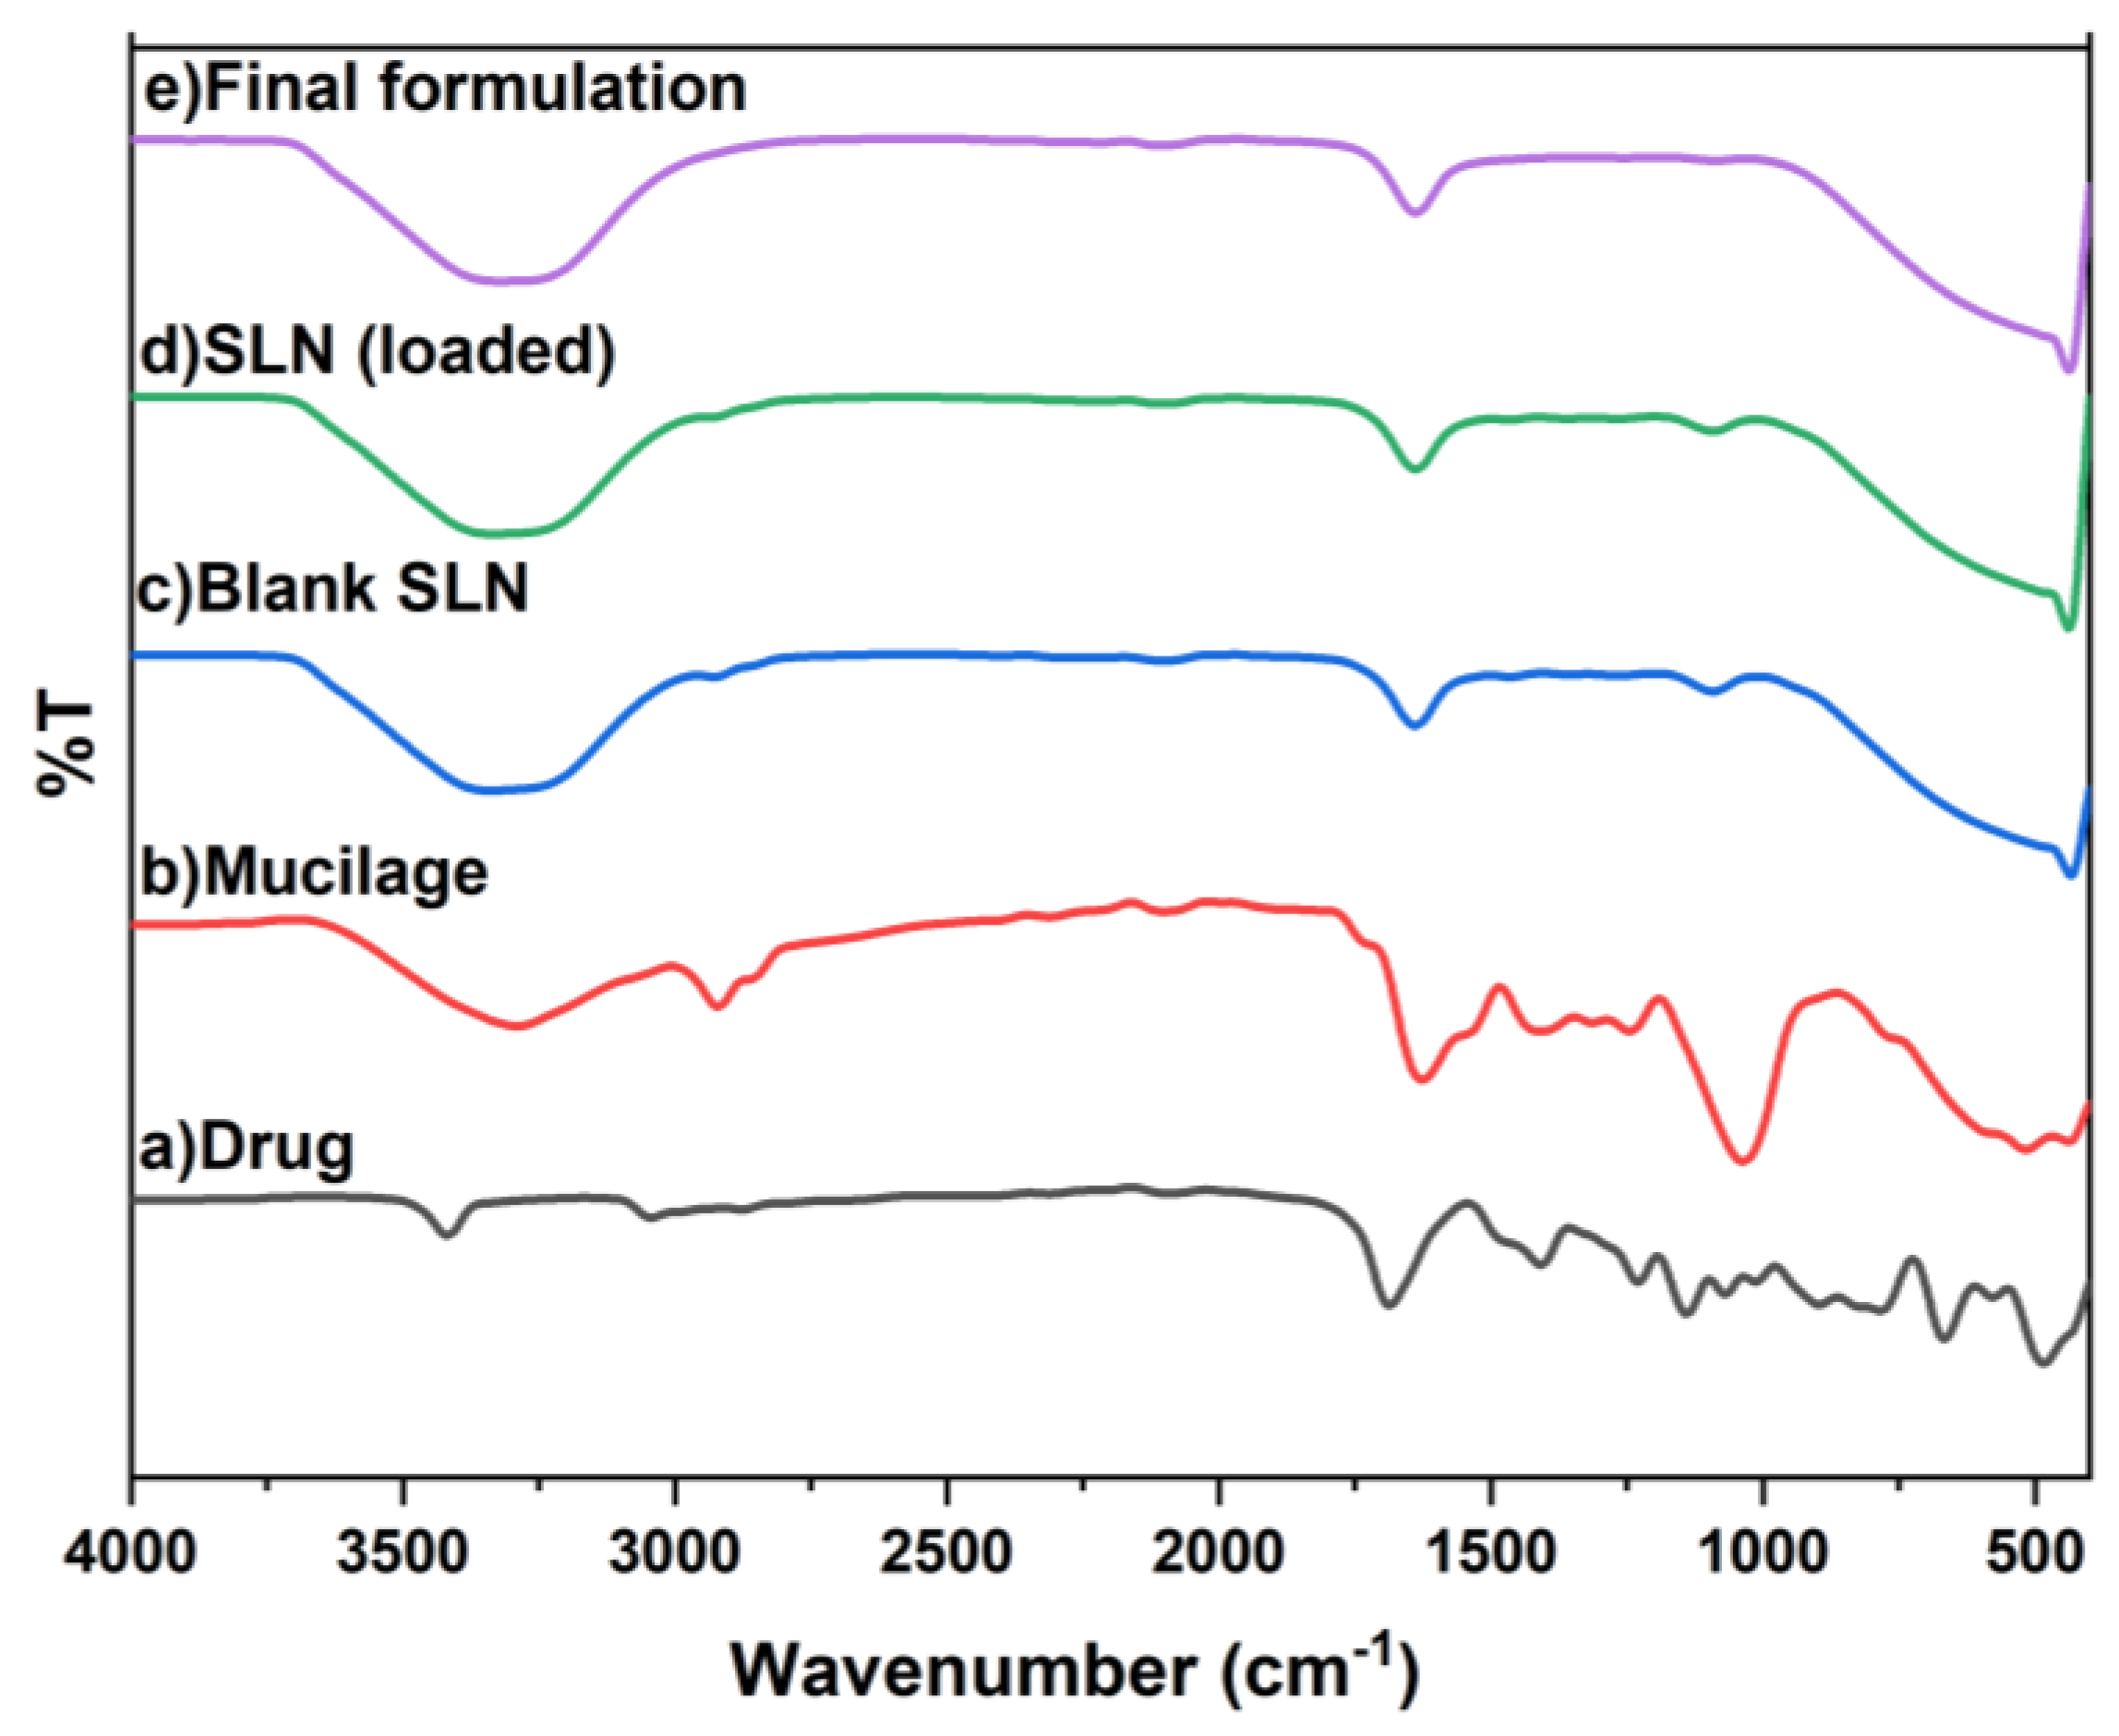
In FTIR Spectrum (
Figure 1) shows the pure drug Rivastigmine spectrum peaks between 484 and 3417 cm⁻¹. While blank SLN had peaks (433–3336 cm⁻¹), but it didn’t have any bands that were specific to the drug. In the drug-loaded SLN, the major drug peaks show small shifts and lower intensity, this reduce intensity of the drug peak is due to encapsulation of the drug within the lipid. In addition, there have been no new peaks appeared. It consequently demonstrates that drugs and excipients are compatible. Also, the drug loaded SLN interact with the gel. There were no new peaks, which means that the drug loaded SLN and mucoadhesive gel worked well together and didn’t react with each other.
2.3.2. pH
pH is found to be 6.6-6.7, comparable to the pH of the buccal and nasal mucosal epidermis. Therefore, formulations can be considered to be compatible with the nasal mucosal epidermis.
2.3.3. Swelling Index
Table 7 shows the swelling index of the formulation over 24 hrs, with a maximum swelling index of 100%. The high swelling index enhances mucoadhesiveness and promotes polymer interpenetration through the mucus layer.
2.3.4. Texture Analysis
Table 8 shows different texture parameters, namely, firmness, spreadability, and extrudability. The Riv-loaded natural polymeric gel (Riv- SLN gel) demonstrated suitable mechanical characteristics based on texture analysis. The formulation exhibited a firmness of 48.33 ± 0.67 g, indicating adequate structural integrity. Its spreadability was measured as 95.55 ± 0.55 mJ, reflecting smooth and effortless application. The extrudability value of 715.67 ± 9.21 mJ confirmed that the gel could be easily dispensed from its container without excessive force. Overall, the texture parameters indicate that the gel possesses optimal consistency, ease of application, and user-friendly handling properties.
2.3.5. Viscosity Determination
Viscosity of Riv- SLN gel is found to be 570.14±6.5 mPa which is optimize for mucoadhesive buccal and nasal gel which is generally regarded as a suitable for the mucoadhesive gel formulation.
2.3.6. Ex vivo Retention Time in Mucus Layer
A significant buccal formulation must exhibit sufficient residence time, as shorter adhesion times may lead to dislodgement due to continuous salivary flow. The fabricated mucoadhesive SLN-loaded gels demonstrated excellent retention, with a buccal mucosal residence time of 9 ± 0.5 hours and nasal retention time of 10 ± 0.3 hours. These prolonged adhesion times indicate strong polymeric interactions and robust mucoadhesive strength, confirming the gel’s suitability for sustained buccal and nasal delivery.
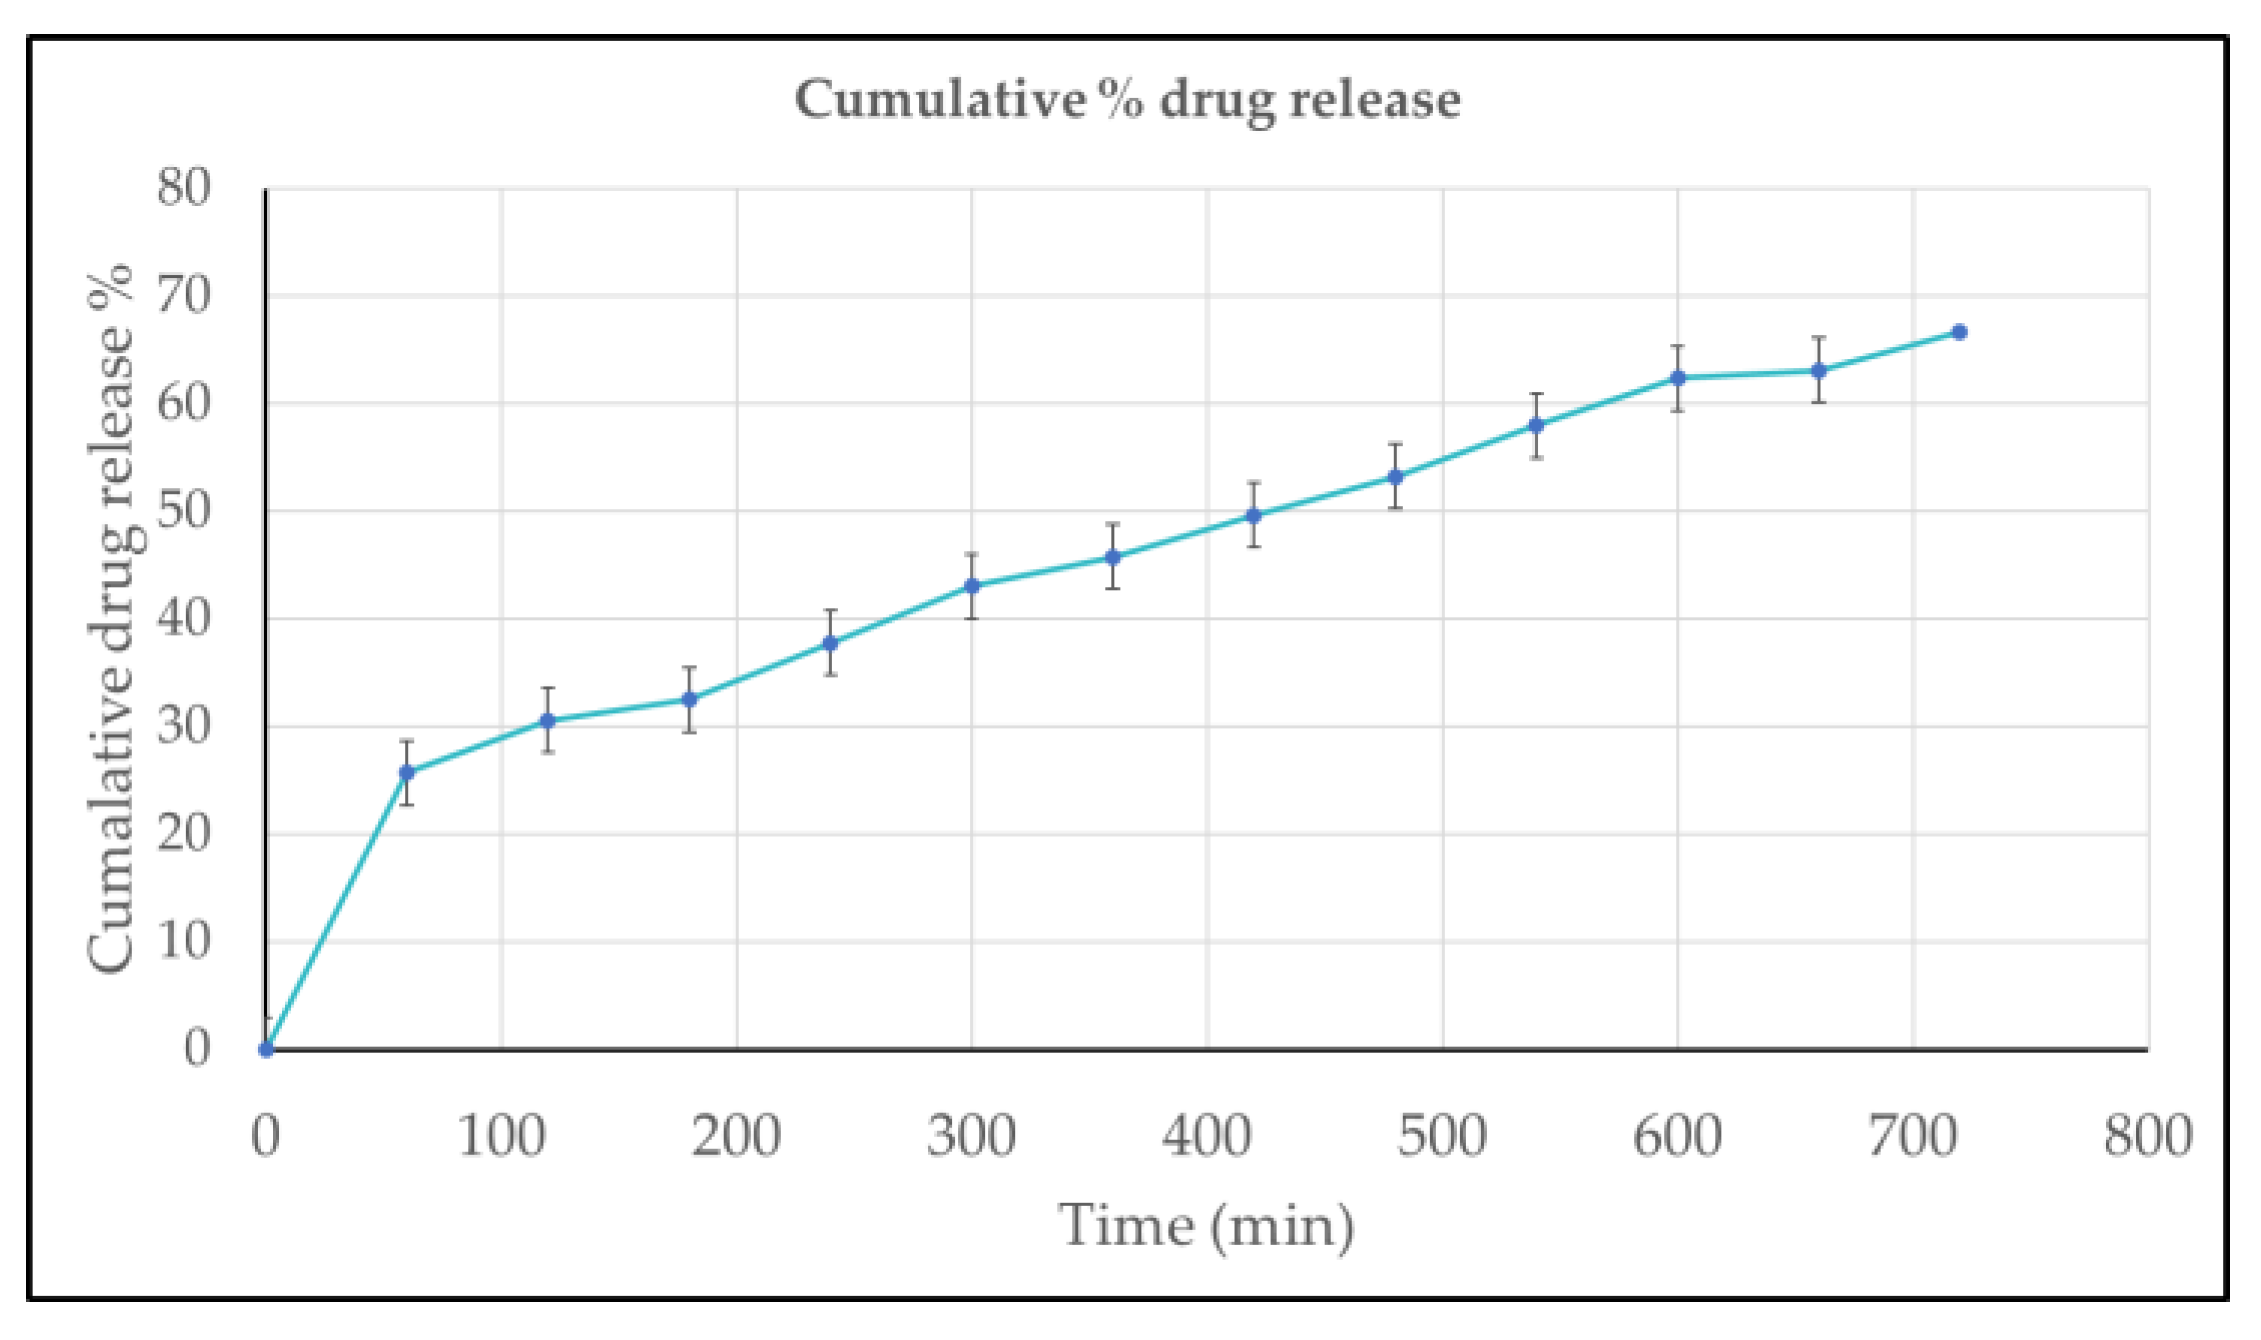
2.3.7. In-Vitro Drug Release Study
The in-vitro drug release study showed a sustained and controlled release pattern for the formulation. The cumulative drug release increased gradually from 26% at 60 minutes to approximately 68% at 720 minutes. The release data exhibited excellent linearity with time, following zero-order kinetics, as indicated by the high correlation coefficient (R² = 0.9934). The regression equation (y = 0.0634x + 22.634) further confirms the steady and constant release rate, demonstrating that the formulation enables prolonged and controlled delivery of the drug over 12 hours.
Figure 8.
In-vitro drug release percentage of Riv- SLN loaded natural polymeric gel formulations over time, expressed as mean ± standard deviation (n = 3).
Figure 8.
In-vitro drug release percentage of Riv- SLN loaded natural polymeric gel formulations over time, expressed as mean ± standard deviation (n = 3).
2.3.8. Ex-Vivo Mucoadhesion Result
Mucoadhesive strength was tested 3 times and average is calculated. The average Mucoadhesive strength for buccal mucosa is found to 8895±1.3 dyne/cm2 and for nasal mucosa is 8320±1.5 dyne/cm2. within safe limits for mucosal retention without causing damage. Increased mucoadhesive strength correlates with reduced formulation leakage from the nasal cavity, resulting in improved retention and consequently more absorption through the nasal mucosal epithelium. Excessive mucoadhesive strength (i.e., exceeding 10,000 dyne/cm2) of the gel can harm the nasal mucosal membrane. All formulas remained inside the upper limit.
2.3.9. Ex Vivo Retention Time in Mucus Layer
A significant buccal/nasal formulation is critical since lower values of time may cause dislocation of the dosage form due to the drooling action of saliva or nasal fluid. In this fabricated mucoadhesive SLNs buccal/nasal gels exhibit a significant retention time 9± 0.5 hours for buccal/nasal mucosal and 10 ± 0.3 indicating strong polymeric interaction and adequate mucoadhesion necessary for sustained buccal and nasal retention.
2.3.10. Ex Vivo Permeation Test
The ex vivo permeation study demonstrated a time-dependent increase in drug permeation across both buccal and nasal mucosa. At 1 hour, permeation was minimal (~8–9%), gradually rising to ~30–32% by 3 hours. A significant enhancement was observed after 6 hours, with buccal and nasal permeation reaching approximately 60% and 55%, respectively. By the end of 7 hours, buccal mucosa showed slightly higher permeation (~85%) compared to nasal mucosa (~78%). Although both routes exhibited efficient permeation, the buccal route consistently showed marginally superior transport throughout the study duration. These findings indicate that the mucoadhesive gel formulation supports effective drug permeation through both buccal and nasal mucosa, with the buccal route offering a slight advantage.
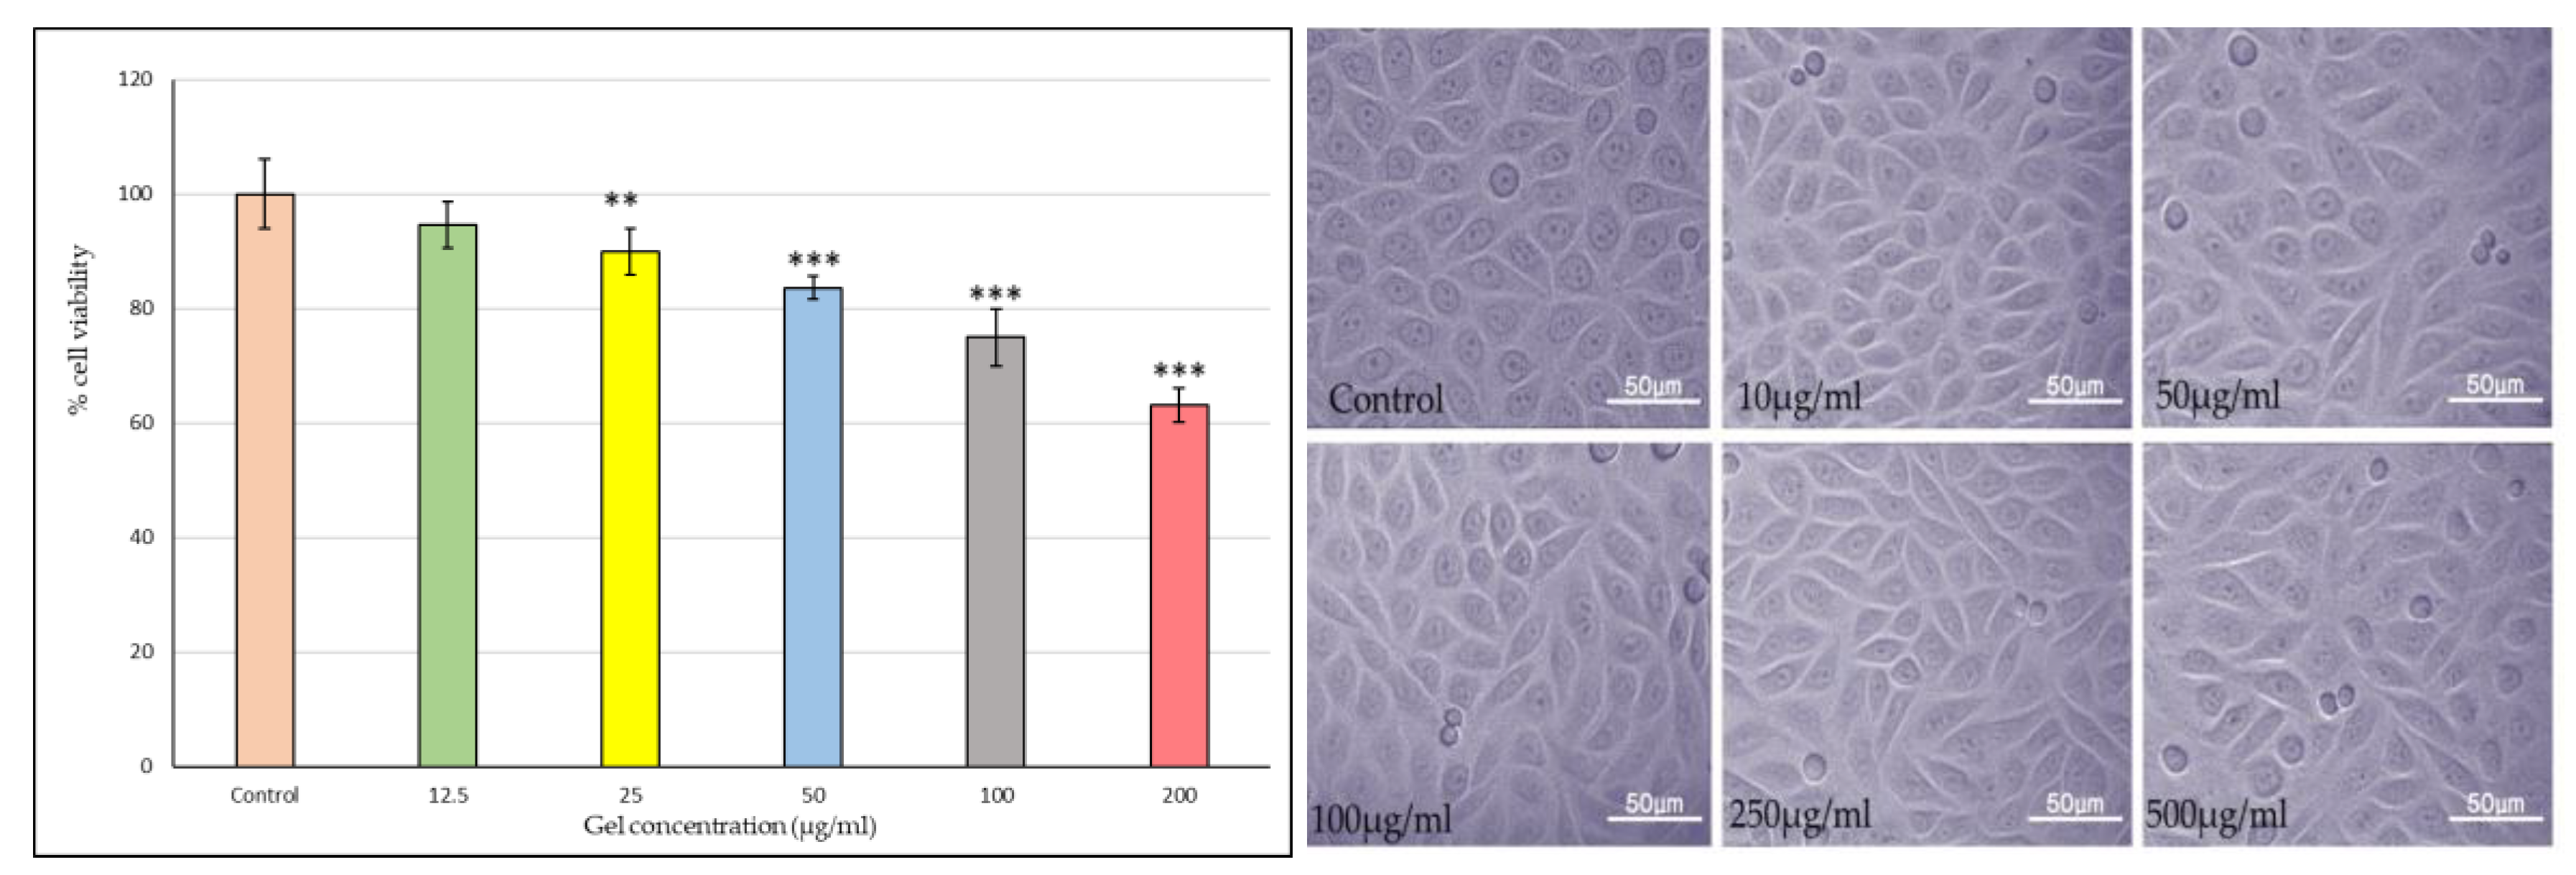
2.3.11. Buccal Toxicity
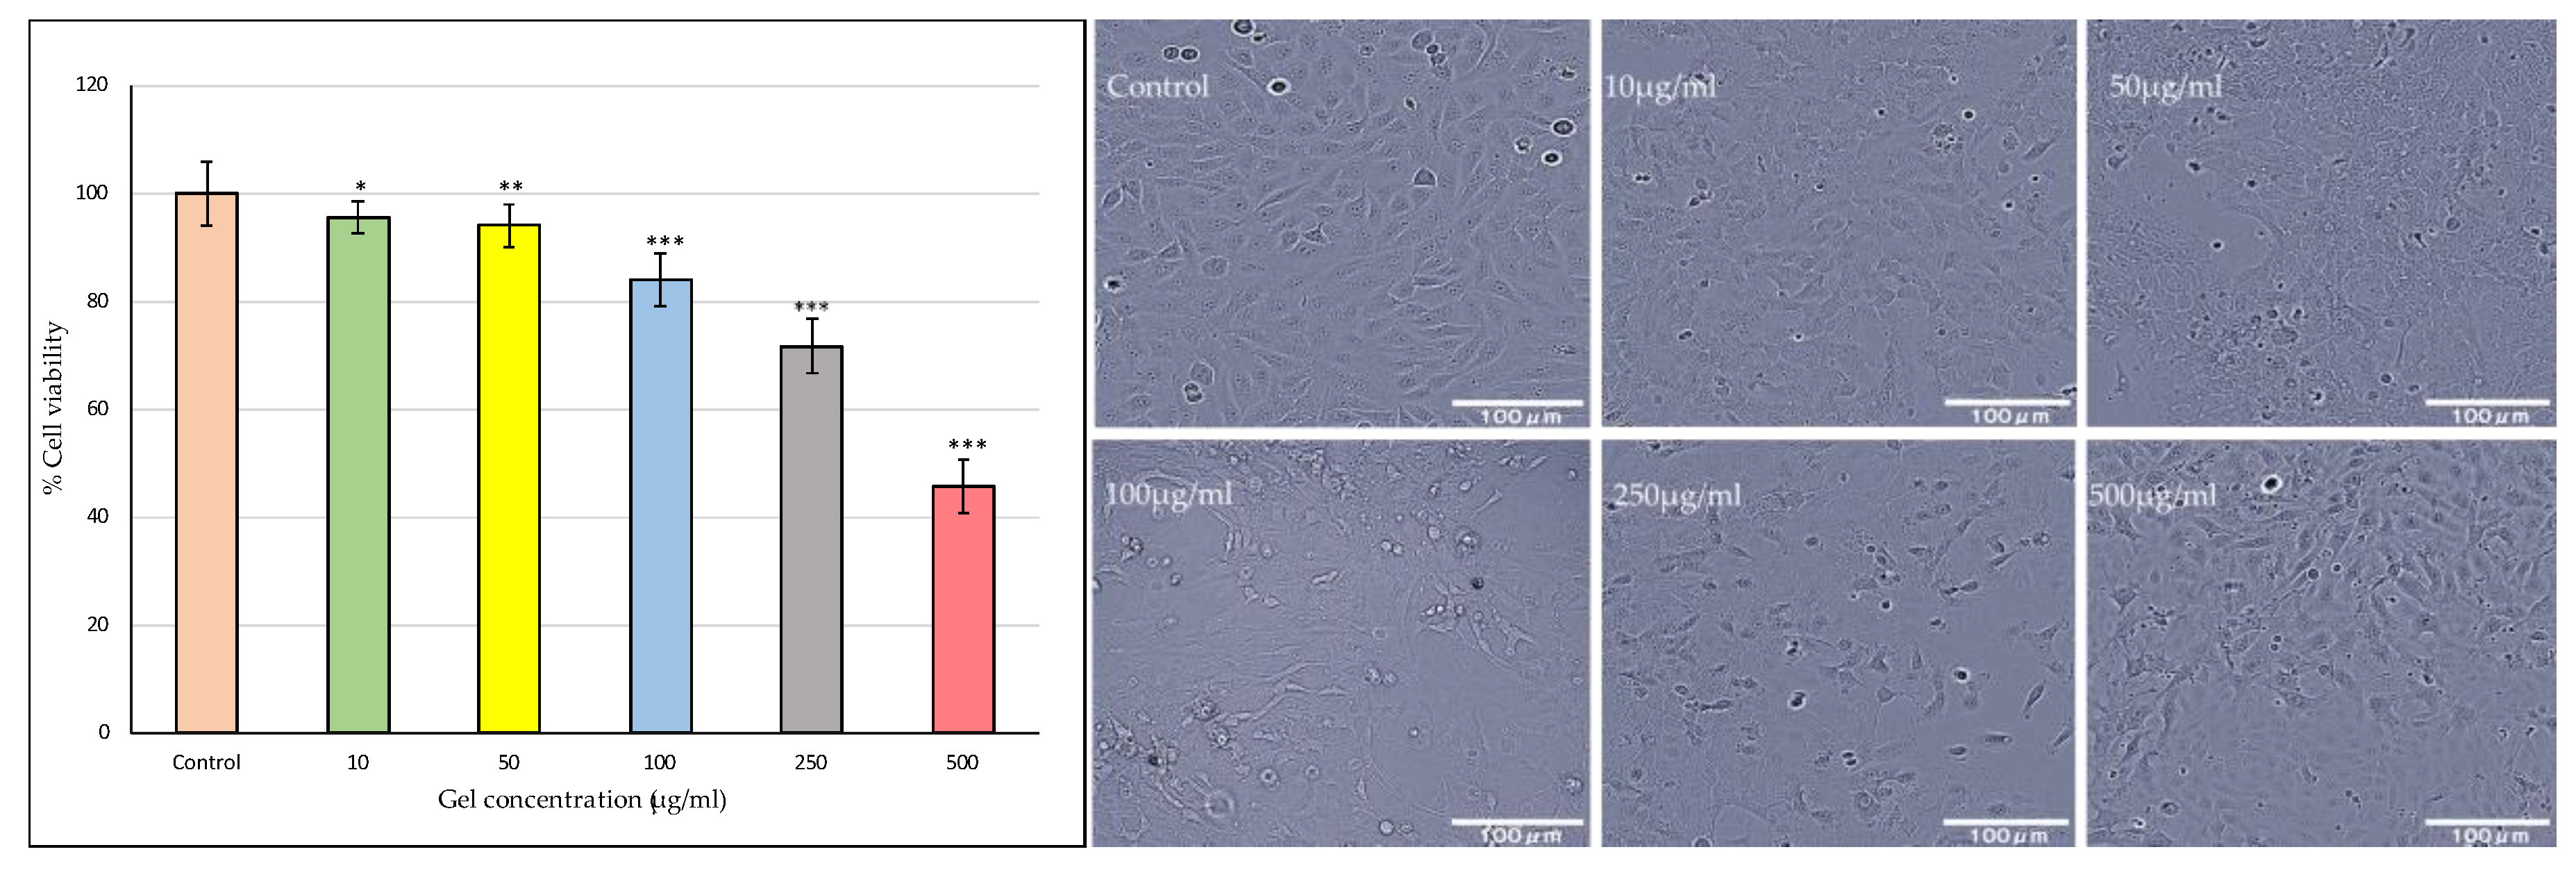
As shown in the bar graph
Figure 9, Riv-SLN loaded natural polymeric gel formulation treatment exhibited a concentration-dependent reduction in cell viability. The quantitative MTT (or similar viability assay) results further substantiated the microscopic observations. The viability remained above 90% at 10 and 50 µg/ml, suggesting good biocompatibility at these doses. A significant decline (p < 0.05) in cell viability was observed at concentrations above 100 µg/ml, with the maximum reduction (~40% viability) recorded at 500 µg/ml. This pattern implies that the gel formulation is non-toxic at lower concentrations but exerts cytotoxic effects at higher doses, likely due to excessive drug release or oxidative stress induction.
Overall, these findings indicate that gel formulation maintains excellent cellular compatibility at therapeutically relevant concentrations while demonstrating dose-dependent cytotoxicity at elevated levels. The preserved cell morphology and high viability at ≤100 µg/ml confirm the safety of the gel formulation for further pharmacological and drug delivery studies.
These findings confirm that the formulation is non-toxic at therapeutically relevant doses, establishing its promising potential for safe and effective oral mucosal drug delivery, while highlighting the importance of dose optimization to prevent local toxicity.
2.3.12. Nasal Toxicity
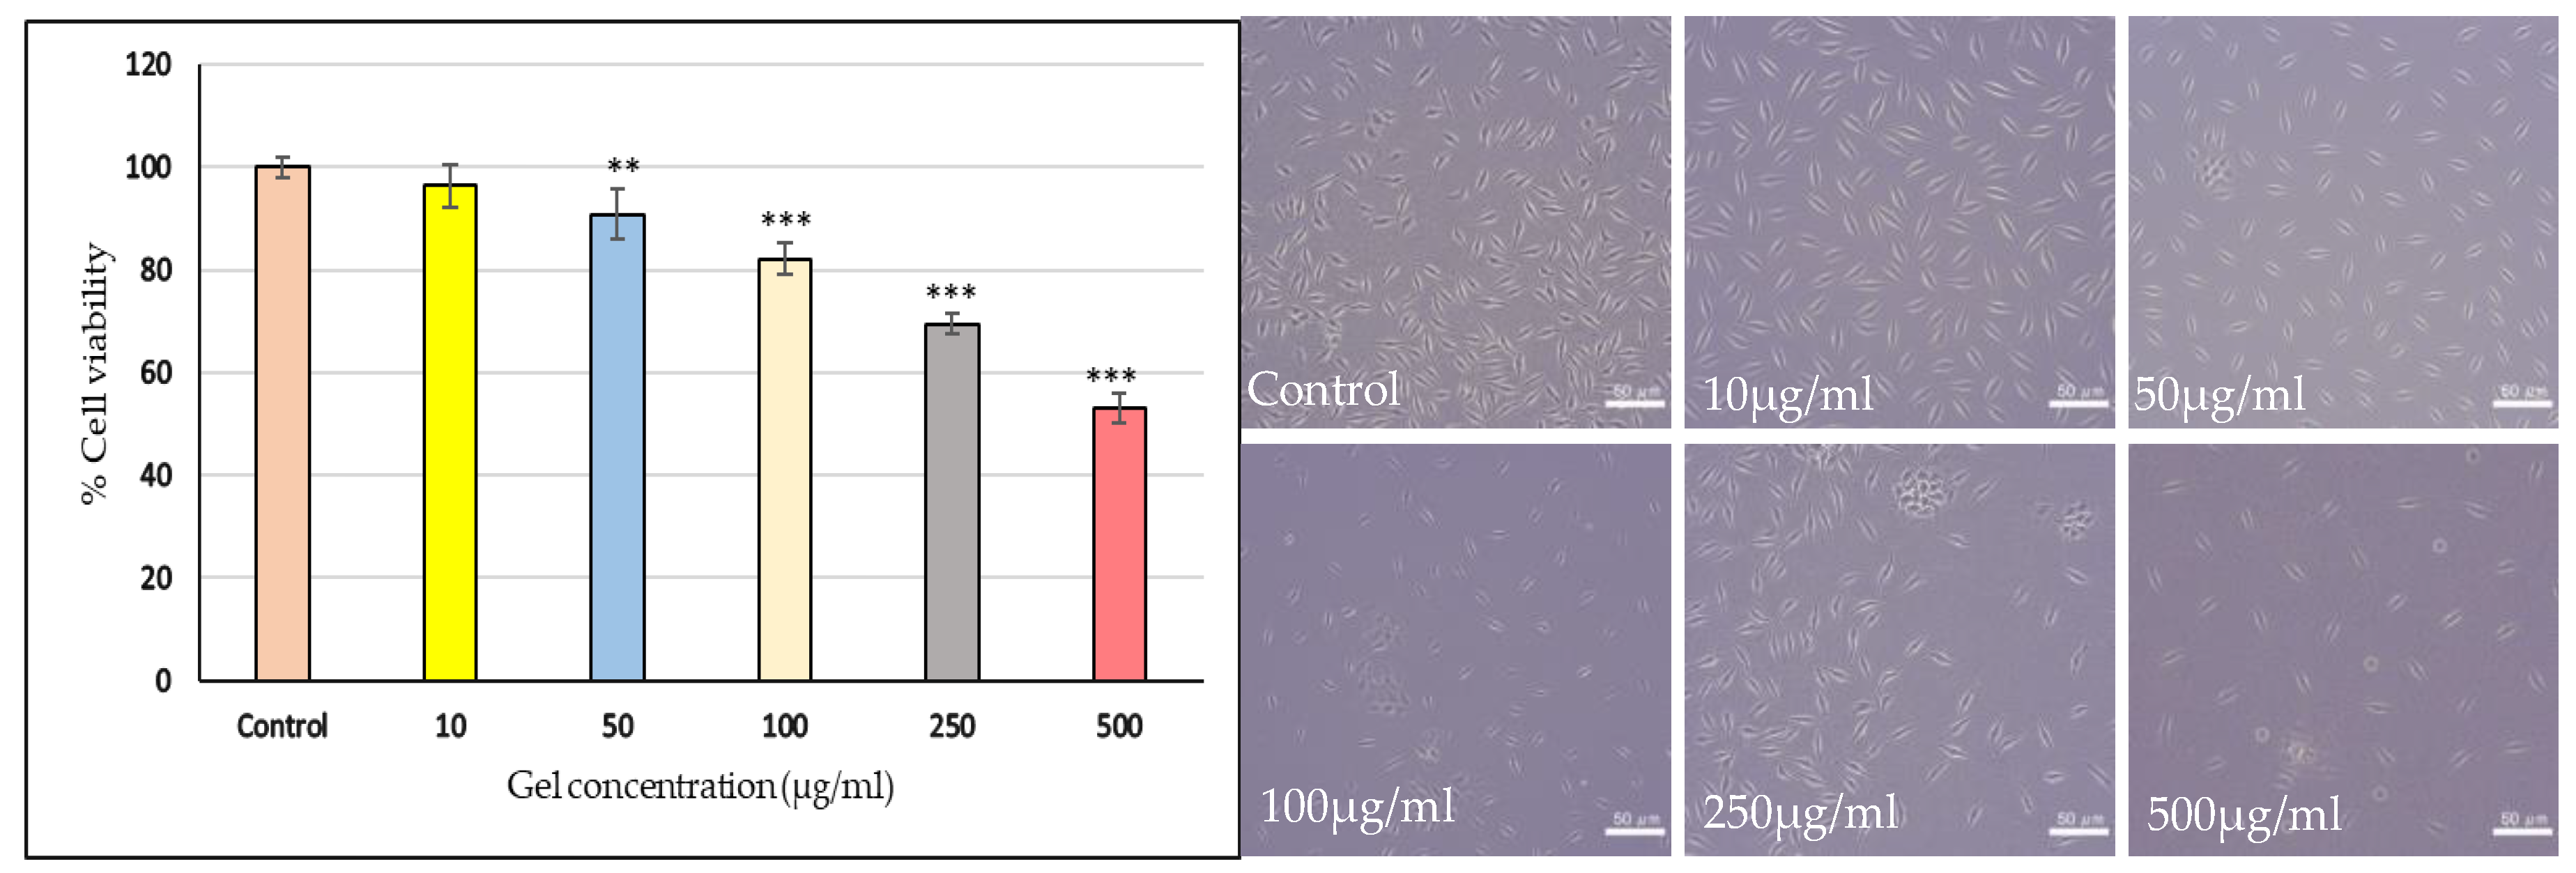
The Riv-SLN loaded natural polymeric gel exhibited a concentration-dependent reduction in the viability of HNEp cells after treatment
Figure 10. Lower concentrations (6.25 and 12.5 μg/mL) showed no significant cytotoxicity, with cell viability remaining high at 96.25% and 94.65%, respectively. A significant decline in viability began at 25 μg/mL, where viability dropped to 89.88% (p<0.01). Further increases in concentration produced progressively stronger cytotoxic effects, with viability decreasing to 83.59% at 50 μg/mL (p<0.001), 74.99% at 100 μg/mL (p<0.001), and 63.12% at 200 μg/mL (p<0.001). The calculated IC₅₀ value of 390.7 μg/mL indicates moderate cytotoxicity, with higher doses required to achieve substantial cell growth inhibition. In the cell morphology studies observed under phase-contrast microscopy, the control cells appeared healthy, polygonal, and well-attached, exhibiting normal epithelial morphology. At low concentrations, the cells retained their structural integrity and confluence. With increasing concentrations, gradual morphological changes such as cell shrinkage, rounding, detachment, and loss of membrane integrity were noted. Overall, the results suggest that the gel formulation is relatively safe at lower concentrations but exhibits cytotoxic effects at higher doses above 200 μg/ml.
Figure 10.
Nasal toxicity evaluation of Riv-SLN loaded natural polymeric gel on HNEp human nasal epithelial cell line. % cell viability at different concentration (12.5 μg/ml ,25 μg/ml,50 μg/ml,100 μg/ml,200 μg/ml) % Cell viability is presented as mean ± SD (n = 3). Statistical comparison was performed using one-way ANOVA with significance at p < 0.05.
2.3.13. Invitro Cytotoxicity Assay on SHSY5Y Cell Lines
Figure 11 represents the Riv-SLN loaded natural polymeric gel formulation exhibited a clear dose-dependent decline in mitochondrial activity. Lower concentrations (5–10 μg/mL) maintained high viability (99–96%), with no significant cytotoxicity. Significant reductions were observed from 50 μg/mL onward (90.8%, p<0.01), with further decreases at higher doses. At 250 μg/mL and 500 μg/mL, viability dropped to 69.4% and 53.1%, respectively (p<0.001).The calculated IC₅₀ value was 588.4 μg/mL, indicating only moderate cytotoxicity.
2.3.14. Cell Viability Assay Compared to Standard on SHSY5Y Cell Lines
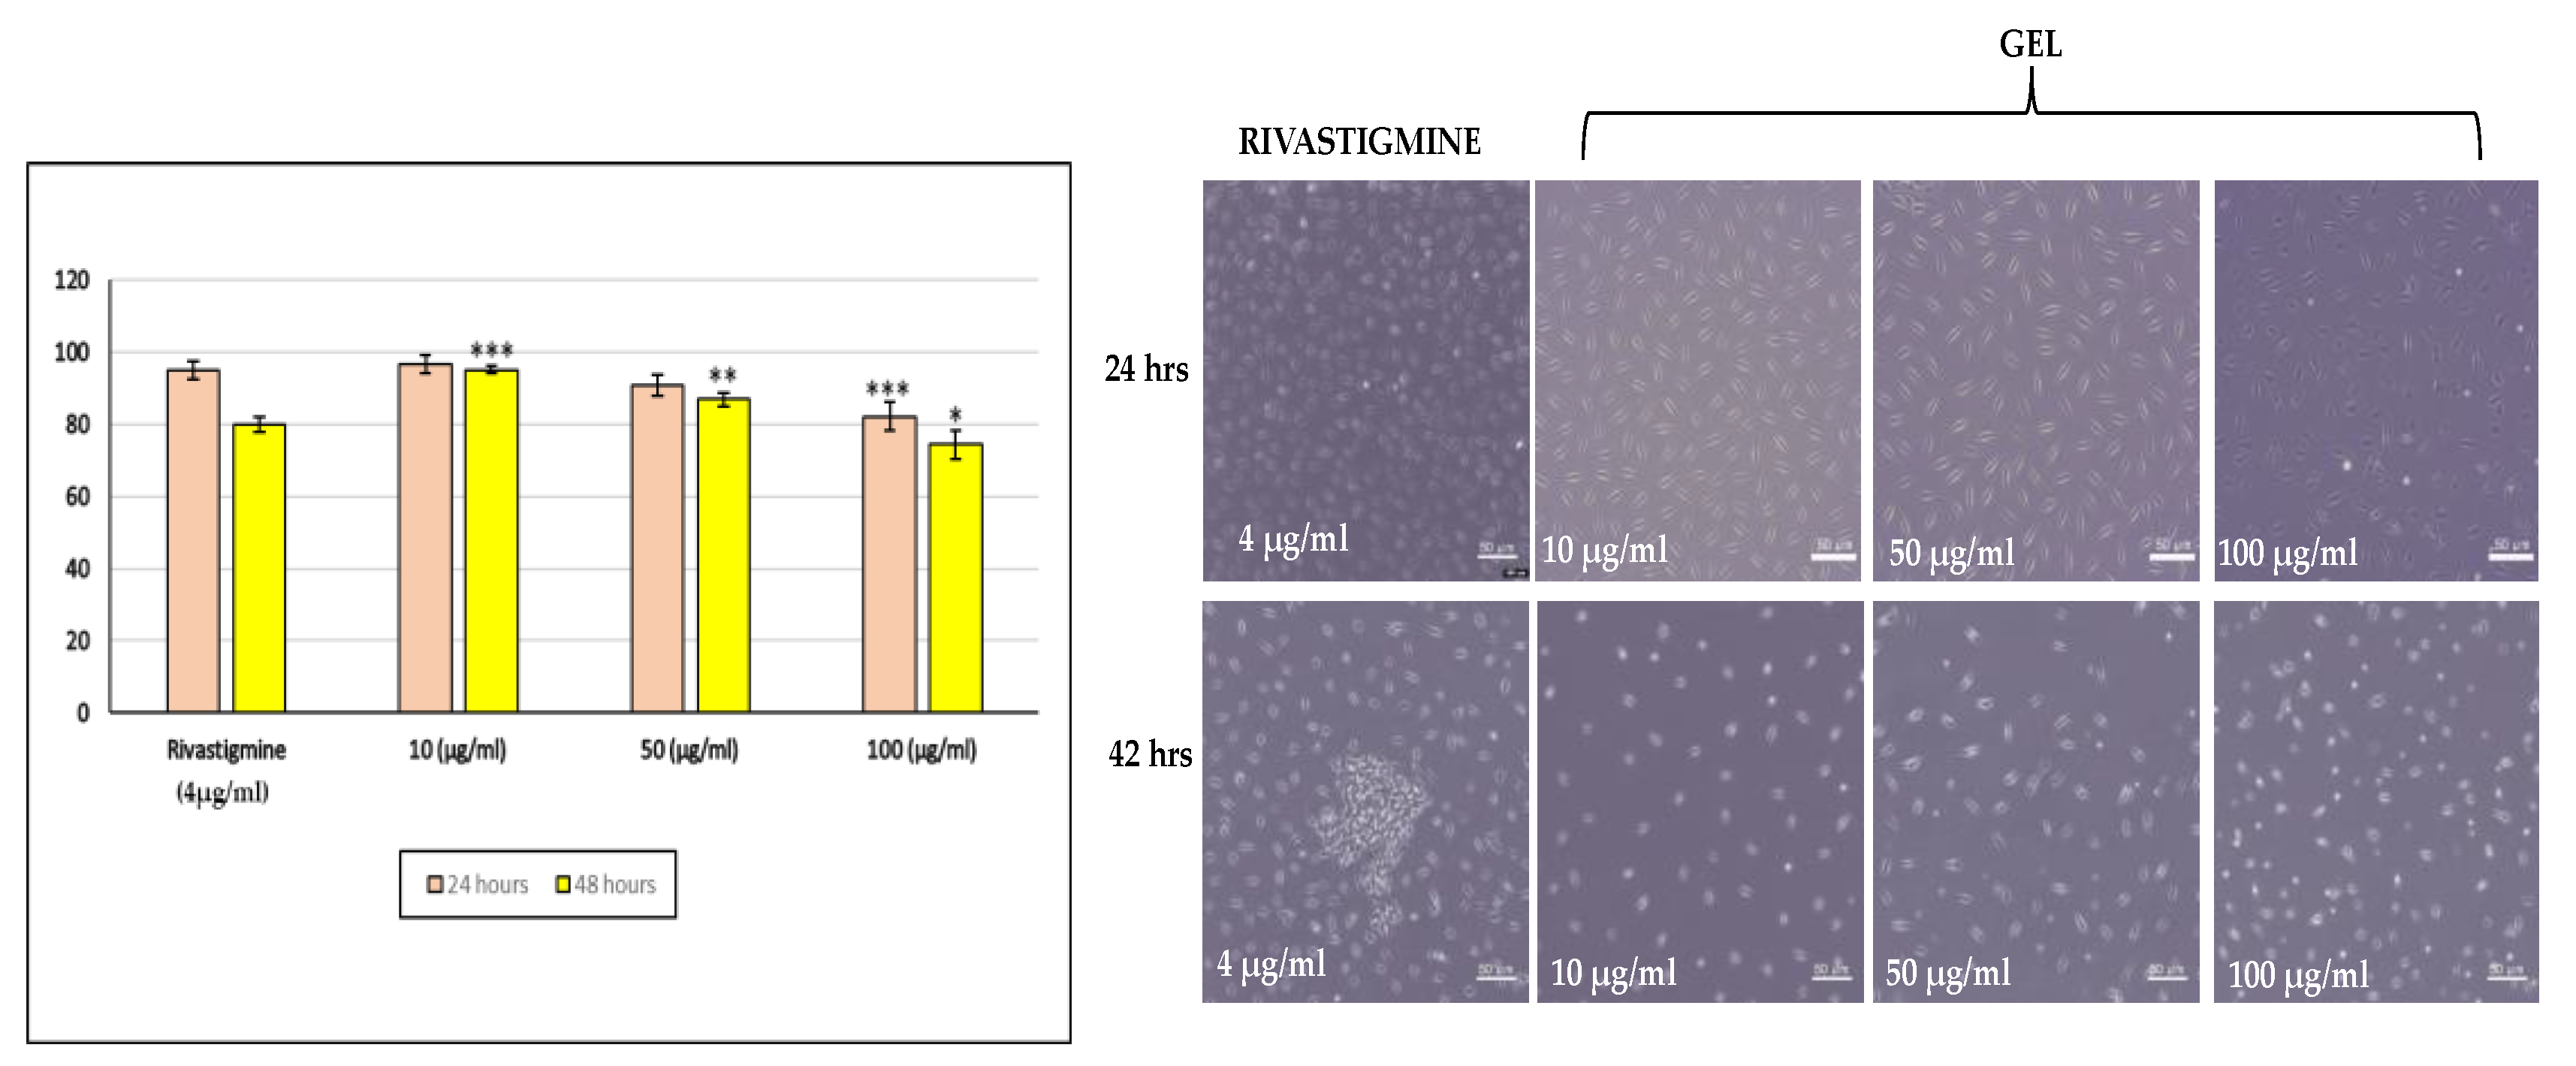
The cell viability results showed a clear dose- and time-dependent decline in SH-SY5Y cell survival. At 10 μg/mL, viability remained high at both time points (96.7% at 24 h and 95.1% at 48 h), indicating good tolerance. At 50 μg/mL, viability decreased to 90.8% and 86.9%, while the highest dose (100 μg/mL) caused a more noticeable reduction to 82.1% at 24 h and 74.5% at 48 h.Rivastigmine (4 μg/mL) also showed reduced viability, especially at 48hours Overall, the Riv-SLN loaded natural polymeric gel exhibited increasing cytotoxicity with higher concentrations and longer exposure.
Figure 12.
% cell viability at different concentration (10 μg/ml ,50 μg/ml,100 μg/ml) and standard solution(4 10 μg/ml) for 12 hours and 24 hours. % Cell viability is presented as mean ± SD (n = 3). Statistical comparison was performed using one-way ANOVA with significance at p < 0.05.
Figure 12.
% cell viability at different concentration (10 μg/ml ,50 μg/ml,100 μg/ml) and standard solution(4 10 μg/ml) for 12 hours and 24 hours. % Cell viability is presented as mean ± SD (n = 3). Statistical comparison was performed using one-way ANOVA with significance at p < 0.05.
2.3.15. AChE Inhibition Assay
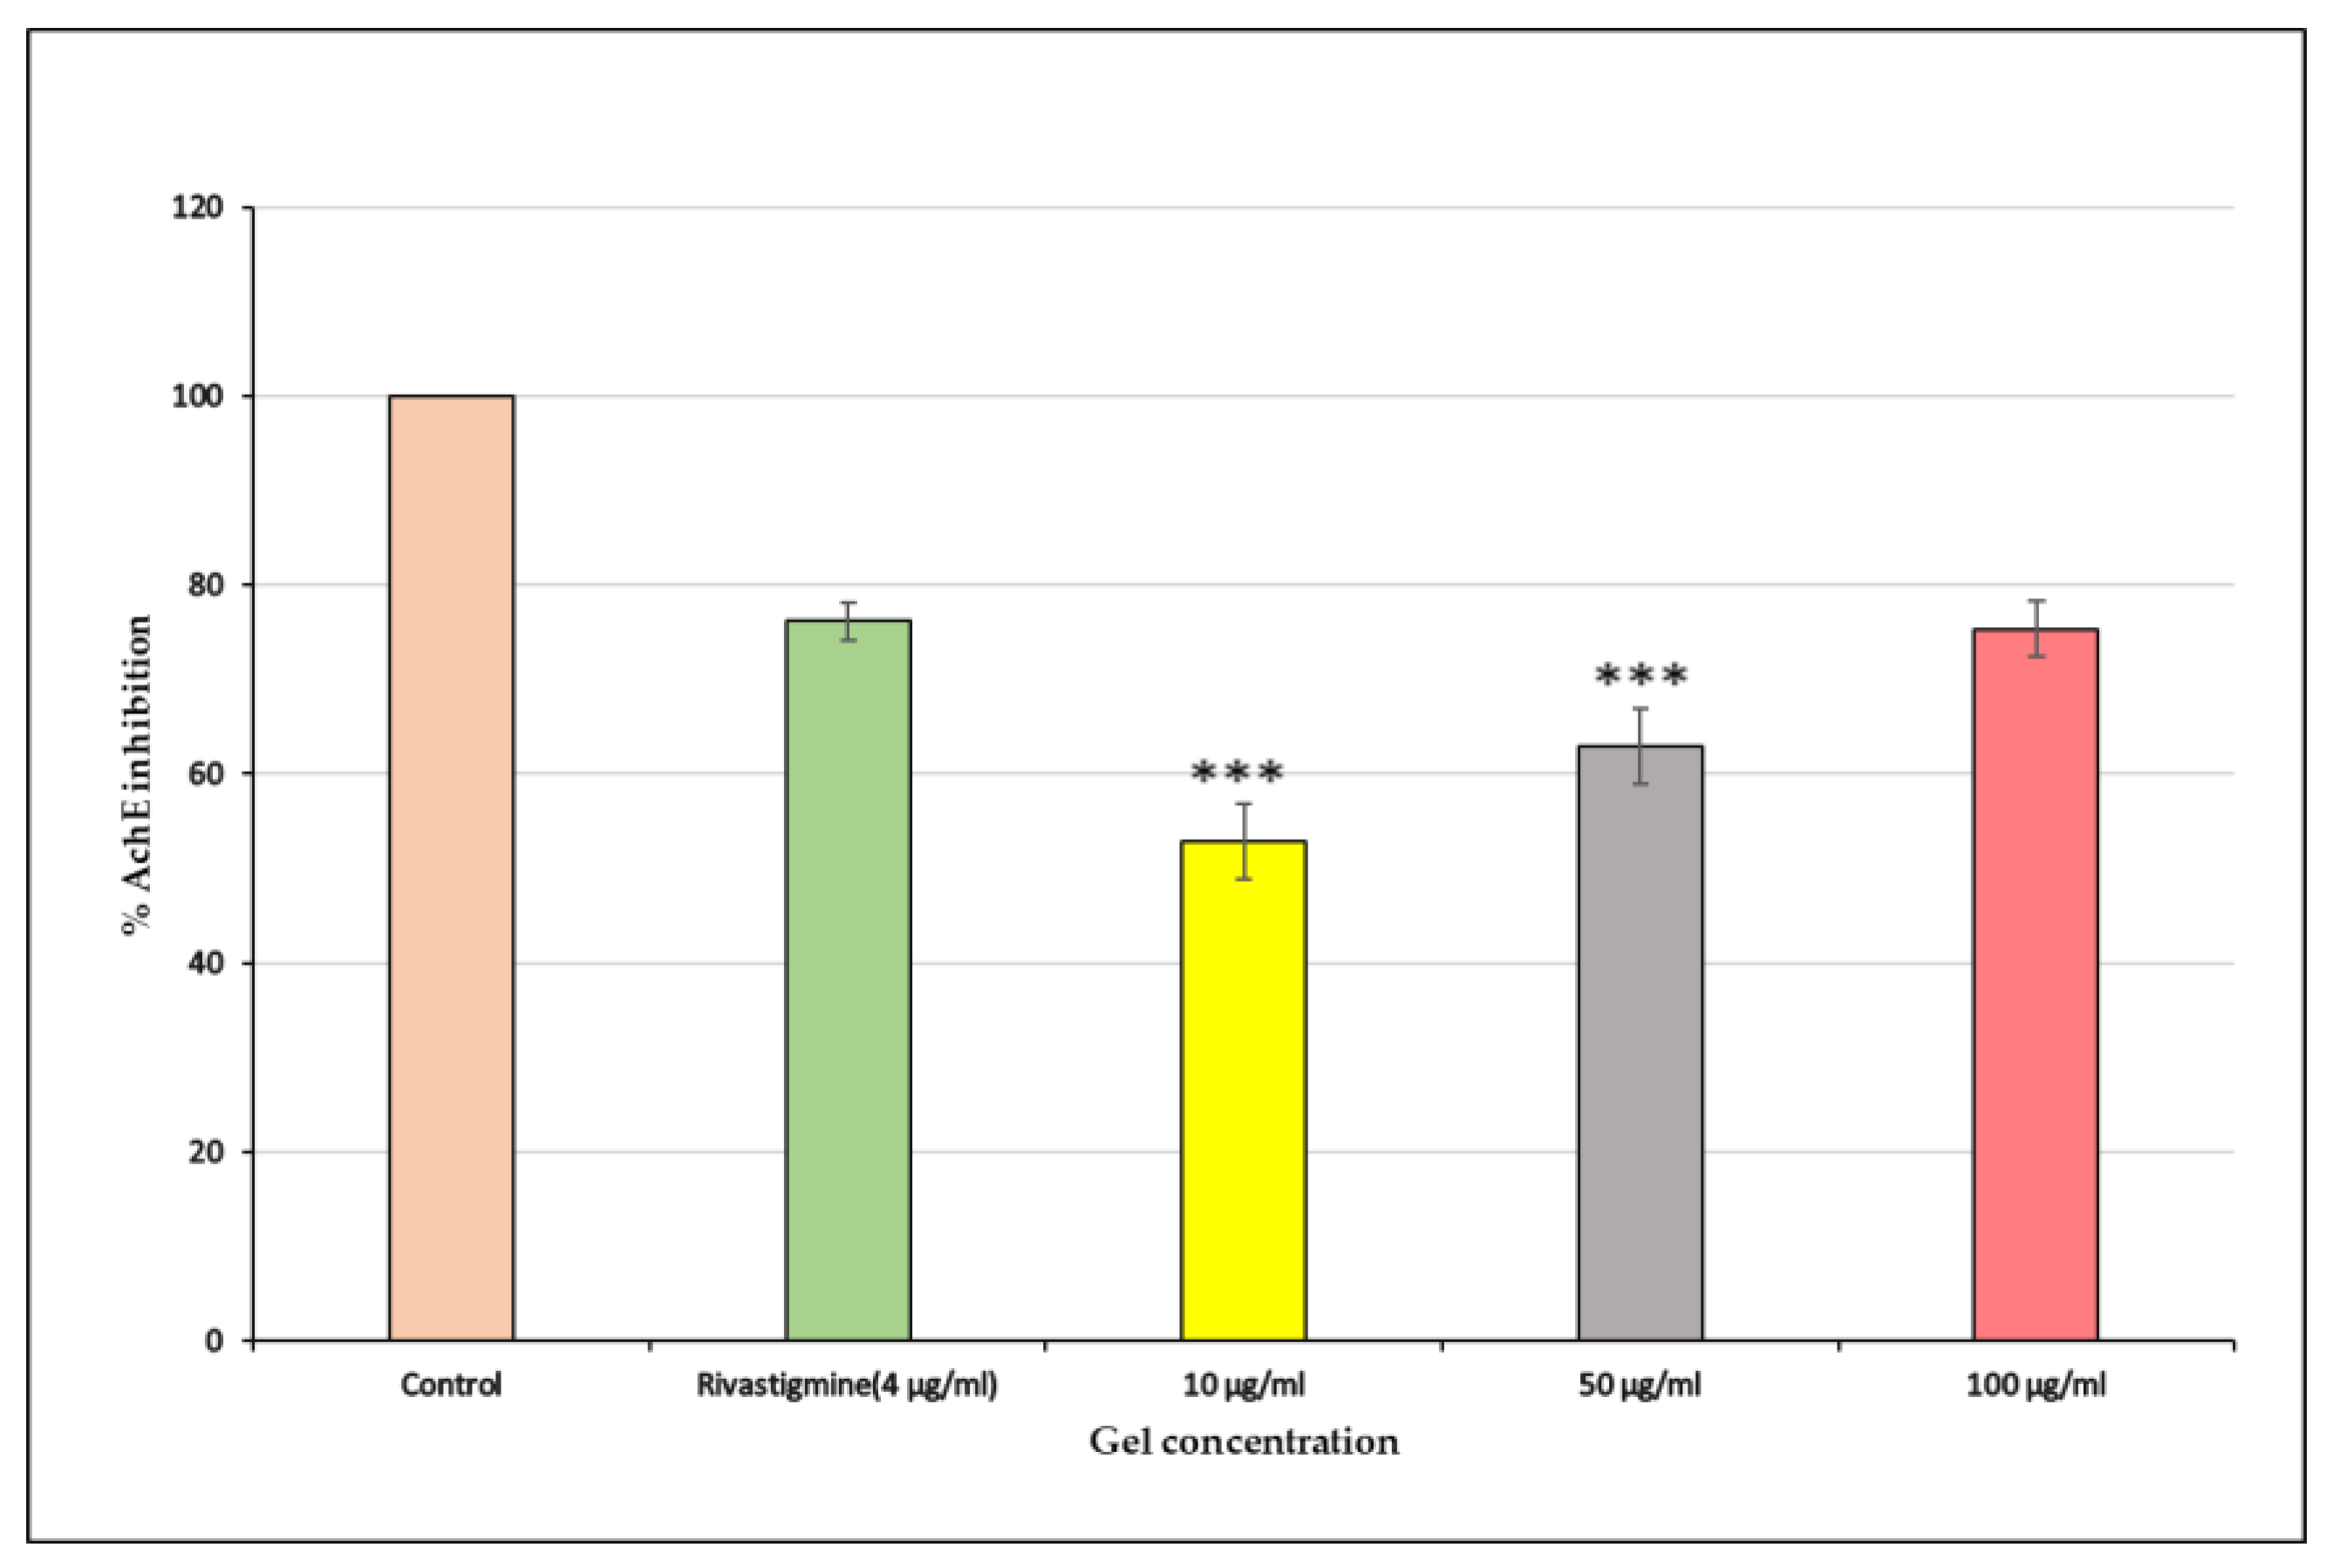
The Riv-SLN loaded natural polymeric gel showed a strong dose-dependent inhibition of acetylcholinesterase activity.Fihure 13 At 10 μg/mL, the sample produced moderate inhibition (52.89%), which increased to 62.95% at 50 μg/mL. The highest concentration, 100 μg/mL, demonstrated potent inhibition (75.34%), closely matching the standard drug Rivastigmine (76.17%).
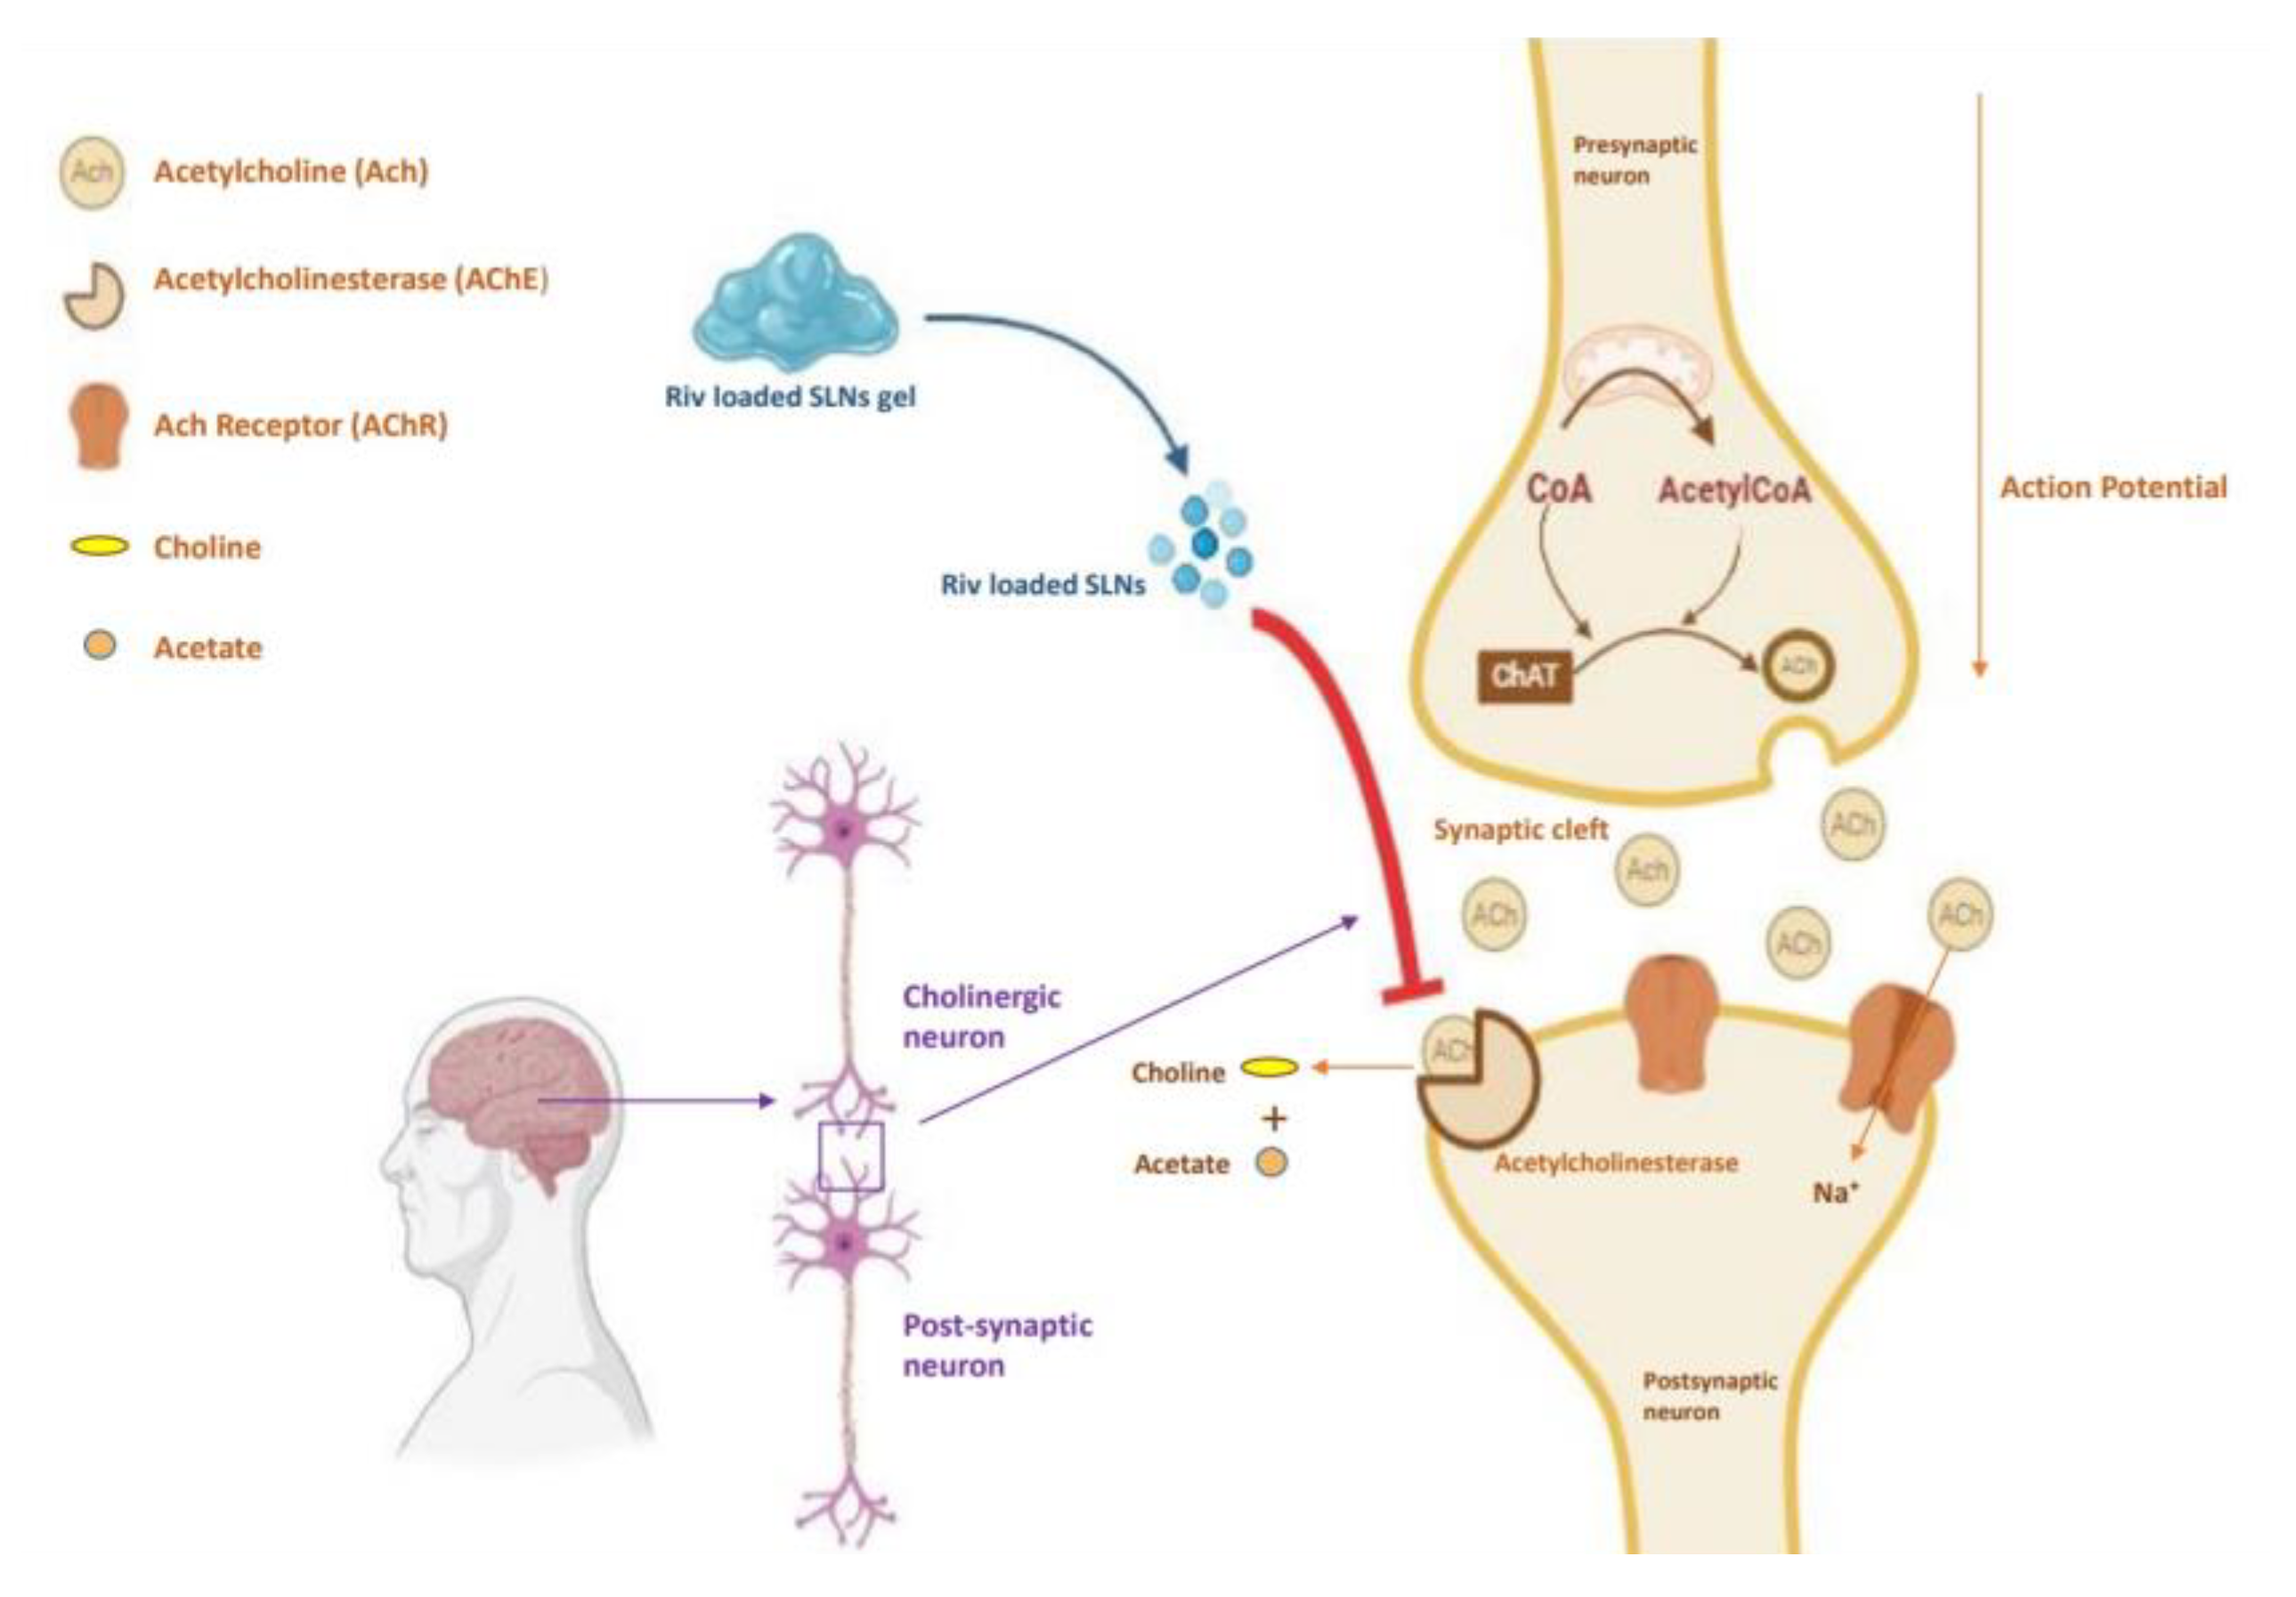
Figure 14 since the rivastigmine-loaded SLNs are predominantly composed of biocompatible lipids, they can interact favourably with cellular membranes.This behaviour enhances the intracellular retention of rivastigmine and supports sustained AChE inhibition in Alzheimer’s therapy. The results also indicate that the formulation effectively suppresses AChE activity, with higher doses showing near-standard inhibitory potential.
Figure 13.
% AchE inhibition of Riv-SLN loaded natural polymeric gel on SHSY5Y Cell lines at different concentration (10, 50 and 100 μg/ml) and standard solution.% Cell viability is presented as mean ± SD (n = 3). Statistical comparison was performed using one-way ANOVA with significance at p < 0.05.
Figure 14.
Schematic representation of rivastigmine SLNs loaded natural polymeric gel releasing Riv-SLN interact with cellular membrane enhances the intracellular retention of rivastigmine and supports AChE inhibition in Alzheimer’s therapy. Figure created in BioRender.
Figure 14.
Schematic representation of rivastigmine SLNs loaded natural polymeric gel releasing Riv-SLN interact with cellular membrane enhances the intracellular retention of rivastigmine and supports AChE inhibition in Alzheimer’s therapy. Figure created in BioRender.
2.3.16. Stability Studies
The
Table 9 presents the stability of the formulation conducted over three months, revealing no drastic or noteworthy changes over this period. No alterations in color, odor, pH, drug release were observed; however, a slight shift in mucoadhesiveness and drug release was noted. The formulation produced demonstrated commendable stability and stability studies provide sta-tistics that indicate a RIV-SLNPs relative stability throughout 3 months.
3. Conclusions
The present study successfully formulated and optimized a rivastigmine-loaded solid lipid carrier incorporated into a Moringa oleifera mucilage based mucoadhesive gel with the aim of improving therapeutic delivery for Alzheimer’s disease (AD). Oral rivastigmine therapy is limited by low bioavailability, extensive first-pass metabolism, and gastrointestinal side effects, making alternative delivery routes essential. By exploring nasal and buccal mucosal pathways, this work sought to develop a non-invasive, patient-friendly system capable of bypassing gastrointestinal degradation and enhancing drug permeation toward the central nervous system.
The optimized solid lipid formulation, developed using a central composite design, achieved nanoscale particle size, high entrapment efficiency, and good stability parameters. Analytical characterization through FTIR and ¹H NMR confirmed the compatibility of rivastigmine with lipid excipients, while SEM revealed spherical, smooth-surfaced nanoparticles suitable for mucosal application. Incorporation into a Carbopol gel base enriched with Moringa mucilage significantly improved mucoadhesive strength, swelling behavior, and residence time, demonstrating the contribution of natural polysaccharides to prolonged mucosal retention. The gel maintained physiologically acceptable pH and viscosity while offering desirable spreadability and extrudability essential for patient compliance.
In vitro drug release studies showed a sustained zero-order release profile, ensuring controlled and prolonged delivery of rivastigmine. Ex vivo permeation studies demonstrated enhanced drug transport across buccal and nasal mucosa, with the buccal route exhibiting slightly superior permeation. Extended retention times of 9–10 hours further emphasized the potential for prolonged therapeutic action. Cytotoxicity analysis confirmed the biocompatibility of the formulation, indicating safety at therapeutic concentrations.
Overall, the study demonstrates that integrating rivastigmine-loaded solid lipid nanoparticle into a mucoadhesive gel system offers a promising strategy to overcome the limitations associated with conventional delivery. The combined advantages of nanoscale lipid carriers, natural mucoadhesive polymers, and alternative mucosal routes create a formulation capable of improving drug bioavailability, reducing dosing frequency, and enhancing patient adherence. This system holds strong potential as an effective, non-invasive delivery platform for rivastigmine in the management of Alzheimer’s disease, warranting further in vivo and clinical investigations to validate its therapeutic applicability and long-term benefits.
4. Materials and Methods
The plant material Moringa oleifera fruit is collected from local market at Chennai and it was authenticated at Siddha Central Research Institute, Chennai, India (authentication certificate number 1451.31102501).Sigma-Aldrich (St. Louis, Missouri, USA) supplied rivastigmine tartrate, stearic acid, tween 80 and acetone. Carbopol 934 was acquired from Analab Fine Chemicals in Mumbai, India. The remaining reagents and solvents employed in the investigation were of analytical grade.
4.1. Extraction of Mucilage
Mucilage was isolated using a modified technique.
Moringa oleifera fruit is cleaned, dried and crushed into powder.1 g of
Moringa oleifera fruit powder was distributed in 50 mL of distilled water and allowed to stand at room temperature (~25 °C) for 24 hours. The hydrated mixture was filtered through a muslin cloth with a pore size of approximately 100 µm to remove insoluble residues. To promote mucilage precipitation, a 4:1 ethanol-to-water combination (50 mL total) was added to the filtrate and left undisturbed overnight. The precipitated mucilage was separated, dried, and stored in an airtight container within a desiccator until ready for use [
6].
4.1.1. Phytochemical Screening [7,8]
Ruthenium red test was used to confirm the presence of mucilage. The test involved adding five drops (~0.25 mL) of 0.1% Ruthenium Red solution to 1 mL of mucilage solution, resulting in a pink-red colouration. Following confirmation, the extract underwent qualitative phytochemical screening according to conventional protocols. Alkaloids were determined by dissolving 10 mg of mucilage extract in 50 mL of distilled water, filtering, acidifying 2 mL of the filtrate with three drops of 1% HCl, and adding 6 mL of Mayer-Wagner reagent; the presence of a creamy precipitate indicated a positive result.Flavonoids were identified by dissolving 200 mg of extract in ethanol, straining it, then treating 2 mL of the filtrate with magnesium ribbon and concentrated HCl to produce a pink or red colouration.
Glycosides were discovered by mixing 0.5 mL of crude extract with 1 mL of distilled water and NaOH, which resulted in a yellow colour. Saponins were identified by prolonged froth formation after vigorously shaking 0.5 mL extract with 5 mL water.Tannins were discovered by boiling 200 mg of mucilage in 10 mL of distilled water, straining it, and adding 0.1% ferric chloride, which produced a blue-black colouration.Phenols were detected by combining 1 mg of extract with potassium ferricyanide and ferric chloride, which produced a greenish-blue colour.Terpenoids were tested using the Salkowski reaction, which involved adding 2 mL chloroform and 3 mL concentrated sulphuric acid to 0.5 mg of extract, resulting in a reddish-brown interface. Molisch’s test verified the presence of carbohydrates, as the addition of Molisch reagent followed by strong sulphuric acid formed a violet-purple ring at the phase boundary.
4.1.2. FTIR Analysis of Mucilage [9]
The presence carbohydrate groups and other groups in the mucilage are detect using FTIR analysis. FTIR spectra for the mucilage were obtained over the wavenumber range from 4000 cm⁻¹ to 400 cm⁻¹ with a spectral resolution of 4 cm⁻¹. Cubes of each of the samples were created by mixing the sample with IR-grade potassium bromide (KBr) and compressing the mixture to form a transparent disc (the pellets) to be used for the FTIR analysis. The obtained spectra was interpreted to identify the functional groups in the mucilage.
4.1.3. 1H Nuclear Magnetic Resonance (¹H NMR) Spectroscopy
The extracted mucilage sample was analyzed using proton nuclear magnetic resonance (¹H NMR) spectroscopy. A known quantity of dried mucilage was dissolved in deuterated dimethyl sulfoxide (DMSO-d₆) to ensure proper signal resolution and minimize solvent interference. The solution was transferred into a clean 5 mm NMR tube. Spectra were recorded using a Bruker Avance™ NEO 500 MHz NMR spectrometer under standard acquisition parameters. Chemical shifts (δ) were expressed in parts per million (ppm), using the residual DMSO peak as an internal reference. The obtained spectra were processed and interpreted to identify characteristic proton signals of the mucilage [
10].
4.2. Formulation of SLN
DoE Experimental Design
Central Composite Design (CCD) with a Face-Centred (CCF) configuration was employed to investigate and optimise the formulation variables. CCD is a structured and widely accepted response surface methodology (RSM) design that combines factorial points, axial (star) points, and centre points. The face-centred version places all axial points at the centre of each face of the factorial cube (α = 1), making the design well-suited for formulations where factor levels cannot exceed practical or experimental limits[
11].
The critical formulation variables selected as independent factors were Lipid concentration (X₁) and Probe sonication time (X₂). Each factor was studied at three levels, coded as –1 (low), 0 (centre), and +1 (high). The measured dependent variables were particle size (Y1), Entrapment (Y2).
Table 10.
presents the independent factors with their actual low, medium, and high levels.
Table 10.
presents the independent factors with their actual low, medium, and high levels.
| Factor |
Name |
Units |
Type |
SubType |
Minimum |
Maximum |
Coded Low |
Coded High |
Mean |
Std. Dev. |
| A |
Lipid cocentration |
% |
Numeric |
Continuous |
50.00 |
150.00 |
-1↔50.00 |
+1↔150.00 |
100.00 |
35.36 |
| B |
Sonication time |
% |
Numeric |
Continuous |
2.00 |
5.00 |
-1↔2.00 |
+1↔5.00 |
3.50 |
1.06 |
To fit a response surface, Design-Expert generated a quadratic polynomial model, expressed asY=β0+β1X1+β2X2+β12X1X2+β11X12+β22X22
Rivastigmine (Riv)-loaded solid lipid nanoparticles (SLNs) were produced by the hot emulsification-probe sonication technique using the design of experiments (DOE) approach. The lipid steric acid amount varied between 50 and 150 mg and the amount of time used for sonication varied between two to five minutes depending on which DOE run the SLNs were made.Riv was added to the melted stearic acid at a temperature of 70 °C as a solution in acetone (2 mL), and mixed with the melted lipid at a constant rate to ensure uniform mixing of the drug and lipid. After mixing, the melted drug-lipid solution was added to the aqueous surfactant phase tween 80 while still at a temperature of 70 °C, and then the two phases were combined via high-speed homogenization (10,000 rpm for five minutes) to obtain a coarse hot nanoemulsion [
12].
The coarse hot nanoemulsion was sonicated using a probe sonicator for two to five minutes at 50% amplitude (30 seconds on, ten seconds off) depending on which DOE run the hot nanoemulsion was made. After sonication, the coarse hot nanoemulsion was cooled down to room temperature with gentle stirring to permit SLN solidification. The hot nanoemulsion was then refrigerated in amber vials at a temperature of 4 °C.To ensure complete removal of the acetone, the hot nanoemulsion was kept at a temperature of 70 °C with continuous stirring for 30 minutes and then, with the lid opened, placed in the fume hood for an additional hour to permit evaporation of any remaining acetone. The resulting SLN formulation exhibited good stability and drug loading performance and was incorporated into a mucoadhesive gel systems.
4.2.1. Particle Size, Polydispersity Index and Zeta Potential of SLNs
Using photon correlation spectroscopy and an Anton Paar Litesizer (Mumbai, India), we assessed the particle size (PS), polydispersity index (PDI), and zeta potential (ZP) of Riv-SLNs. For PS and PDI measurements, we used disposable polystyrene cuvettes at 25 °C, while we analysed ZP using disposable folded capillary cells. All samples were adequately diluted with ultrapure water prior to these analyses to ensure proper scattering intensity for accurate results [
13].
4.2.2. Scanning Electron Microscopy (SEM)
The structural and surface morphology of Rivastigmine-loaded solid lipid nanoparticles (Riv-SLN) were evaluated with the aid of scanning electron microscopy (SEM). To prepare for the SEM evaluations, lyophilized powder from the nanoparticle formulation was evenly distributed on a two-sided carbon adhesive tape adhered to an aluminium stub and was gently blown off by a pneumatic device to achieve uniform distribution. Subsequently, samples were deposited onto the stub by automated sputter coating for 60-90 seconds so that a thin layer of gold provided sufficient electrical conductivity to allow proper functioning of SEM. Employing SEM, images of coatings were captured using accelerating voltages from 10 to 15 kV to evaluate and identify the shape, smoothness and extent of properties indicating aggregation for Riv-SLN. Micrographic images were also utilized to confirm the production of spherical, discrete and appropriately dispersed nanoparticles containing Rivastigmine [
13].
4.2.3. Entrapment Efficiency (EE%) and Drug Loading (DL%)
An indirect centrifugation method was used to determine Riv-SLNs entrapment efficiency. To do this, a precise volume of the nanoformulation was placed in centrifuge tubes and subjected to centrifugation for 30 minutes at 15,000 RPM to 4 °C, which allowed for separation of any non-entrapped (free) drug versus the encapsulated nanoformulation of nanoparticles. The resulting supernatant, containing the non-entrapped drug, was carefully harvested, diluted in an appropriate amount of phosphate buffer solution (pH 6.8), and passed through UV spectrophotometry at the maximum absorption of rivastigmine (λmax) running between 400 nm and 800 nm wavelengths before entering the high-performance liquid chromatography (HPLC) machine. From the calibration curves, the amount of free (non-encapsulated) drug was determined, and the quantity of entrapped (encapsulated) drug was determined by subtracting the amount of free drug from the original amount of drug present at the time of formulation [
14].
The following equations were used to calculate the drug loading (DL%) and entrapment efficiency (EE%) values:EE% = [(Total drug – Free drug) / Total drug] × 100
This method ensured accurate quantification of encapsulated rivastigmine and assessment of formulation efficiency.
4.3. Formulation of Riv-SLNs Loaded Natural Polymeric Gel
To produce a gel of rivastigmine, gelling agent is selected first we compared to 0.2%, 0.4%,0.6 and 0.8%, the concentration of 0.6% Carbapol 934 was only free flowing until external tension had been applied and also had good viscosity. Thus 0.6% gel was made to it 5% w/w SLN was added. The optimized SLNs were incorporated into a natural polymer gel. Pure glycerin (3–5% w/w) as a humectant and moringa oleifera mucilage (1–2%) were hydrated in distilled water at room temperature for 2–4 hours before they hydrophilically interact with the mucilage to form a homogenous gel. The rivastigmine-loaded SLN dispersion was allowed to cool down to room temperature prior to being added to the hydrated gel slowly so that the nanoparticles would be evenly dispersed with minimal disturbance to the integrity. If necessary, a small amount of Carbopol 934 (0.2%) was pre-dispersed in water and neutralized with triethanolamine (TEA) to pH 6–6.5 and then this Carboxy-Methyl-Cellulose gel was incorporated into the mucilage–SLN blend to provide enhanced mechanical strength. The pH of the final formulation was adjusted from to nasal-compatible pH 5.5-6.5 before adding purified water to bring it up to the final volume. The mucoadhesive gel with the SLNs was deaerated by standing and then placed in light resistant amber containers for storage at 4-8 °C until further use.
4.3.1. Physical Appearance and Homogeneity of Riv-SLN Gel
Gel form is opaque, white in color, with no discoloration or visible particles, indicting successful dispersion of excipients. The prepared mucoadhesive gel exhibited t homogeneity, as confirmed by the absence of lumps, phase separation, or air bubbles upon visual and microscopic inspection.
4.3.2. pH
The pH level was measured by using the digital pH meter at 250 °C as follows: 100 ml distilled water was added to the 2-hour-old gel, and 1 gram of gel was taken from the gel. The pH of the gel was measured using three trials, and the mean value of these trials was calculated [
15].
4.3.3. Viscosity
The Brookfield DV-6 Programmable Viscometer was employed to measure the viscosity of the prepared formula. The instrument was set to rotate the spindle at 50 RPM for 10 minutes and was hydrated in the environment at 19 °C without dilution. The sample collected was analysed using Spindle No. 6, and two values were obtained for viscosity over the 10 minutes [
16].
4.3.4. Spreadability
We used the standard two-glass slide method to determine how well our gel with Riv-SLNs could spread. We started by putting 1 g of gel in the middle of a clean glass slide, then we placed a second slide on top of it. We put a weight of 500 g on top of the second slide for 5 minutes to help spread the gel evenly and to get rid of any trapped air bubbles. After that, we put a weight of 50 g on top of the second slide and timed how long it took for the second slide to move a certain amount [
17].
The spreadability (S) of the gel was calculated using the formula S = M × L / T
where M = mass applied, L = distance moved by upper slide and T = time taken.
4.3.5. Swelling Index
To measure the swelling index 1gm of the SLN-Loaded natural polymeric Gel is placed in a glass slide which is already been emerged in petri dish filled with 10 ml of pH 7.4 phosphate buffer and allow it to swell for 8 hours then weight the swollen gel. Through the application of an electronic weighing balance, the increase in weight of the formulation over time was measured in intervals and denoted by W2, and the SI at every time interval was estimated utilizing the following equation [
18]:
4.3.6. Texture Analysis
Texture characteristics of the formulated gel were assessed using a CT3 Texture Analyzer (Brookfield Engineering Laboratories, USA). The parameters evaluated included firmness, spreadability, and extrudability, each measured using appropriate probes and test settings recommended by the manufacturer. Instrumental texture analysis was conducted to mimic human sensorial perception of semisolid formulations, enabling quantitative determination of the gel’s mechanical properties [
19].
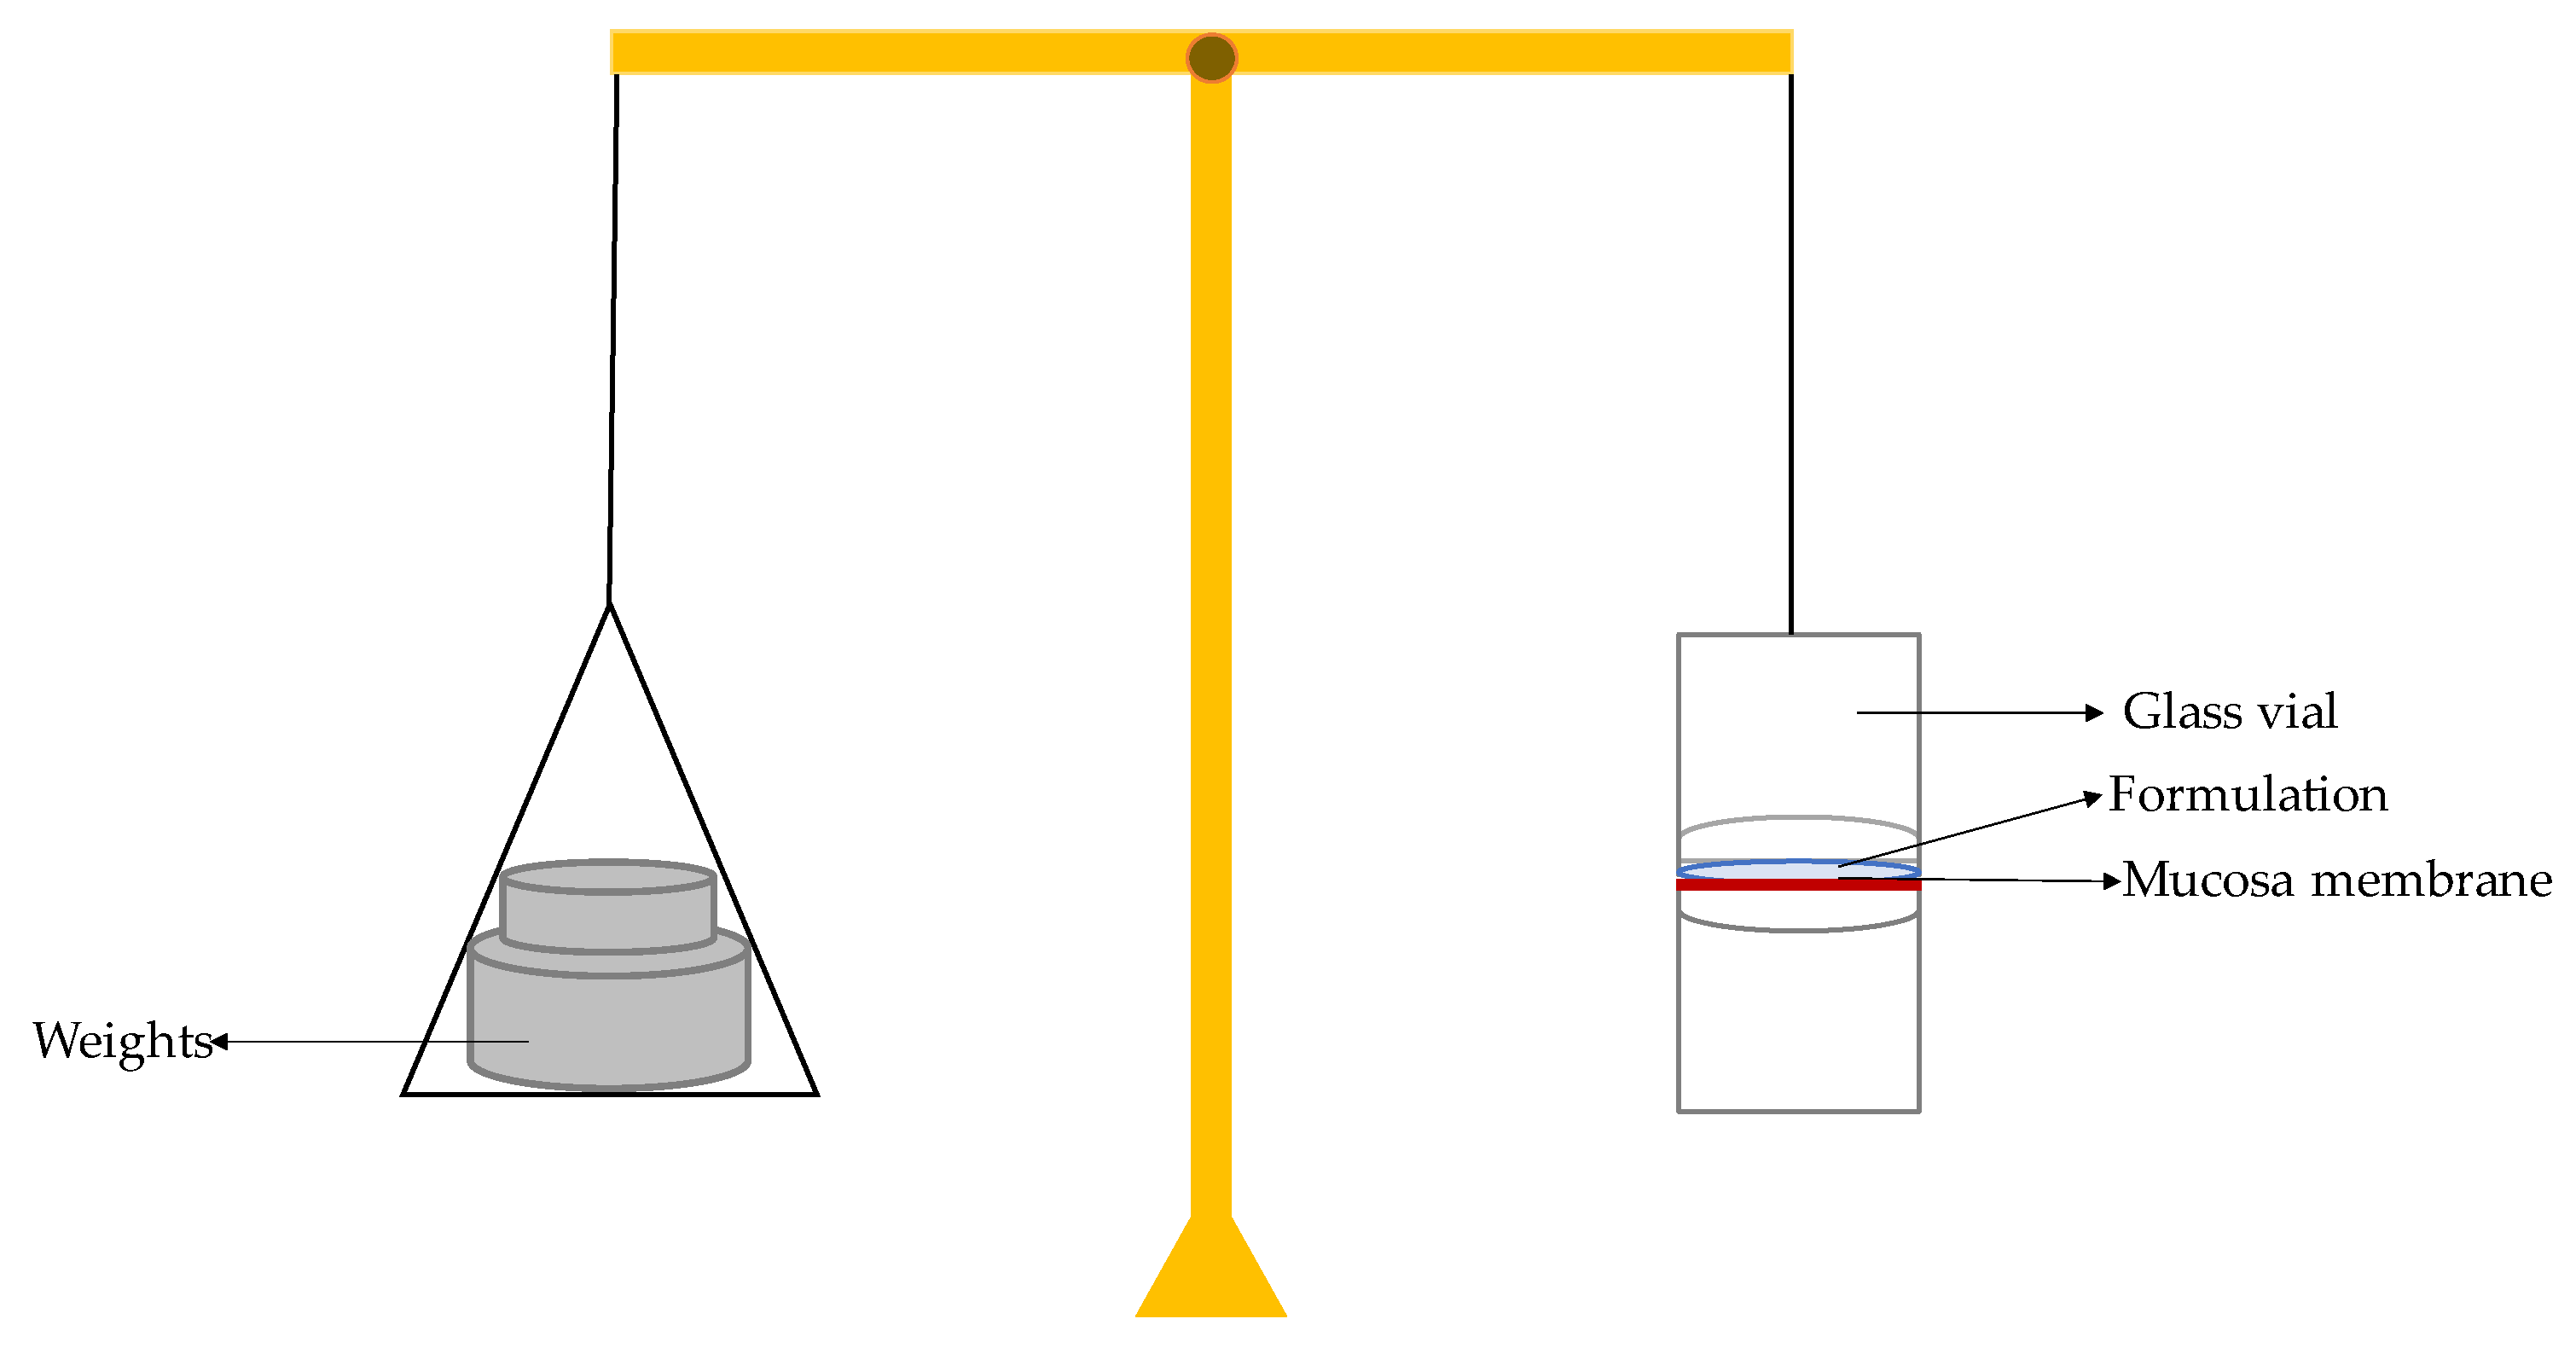
4.3.7. Mucoadhesive Strength
For evaluation of the mucoadhesive strength of the formulation a modified physical balance approach was employed. Goat nasal mucosal tissue was obtained from a local slaughterhouse and used within 2 hours after collection. The right side of the balance was used for weighted increments whereas the left side had a fixed glass slide (top support). A second glass slide was placed under the top support to act as the bottom support. The mucosa was affixed to the top support layer using thread and adhesive tape and hydrated with simulated nasal fluid (SNF, pH 5.0) for 5 minutes before the start of the evaluation procedure. Test formulation (RIV–SLNs gel) was placed on the bottom support; the mucosa slide was placed on top of the bottom support for 50 g preload for 2 minutes to ensure a uniform bond. Weights would then be applied in increments to the right hand side of the balance until the two mucosal surfaces completely separated. A schematic of the modified physical balance apparatus.The smallest amount (in grams), m, of weight necessary to completely separate the mucosa from the formulation surface was recorded [
20]
Mucoadhesive strength was calculated using the following equation:
Where:
m = weight required for detachment (g)
g = acceleration due to gravity (980 cm/s²)
A = area of exposed mucosa (cm²)
4.3.8. Washability
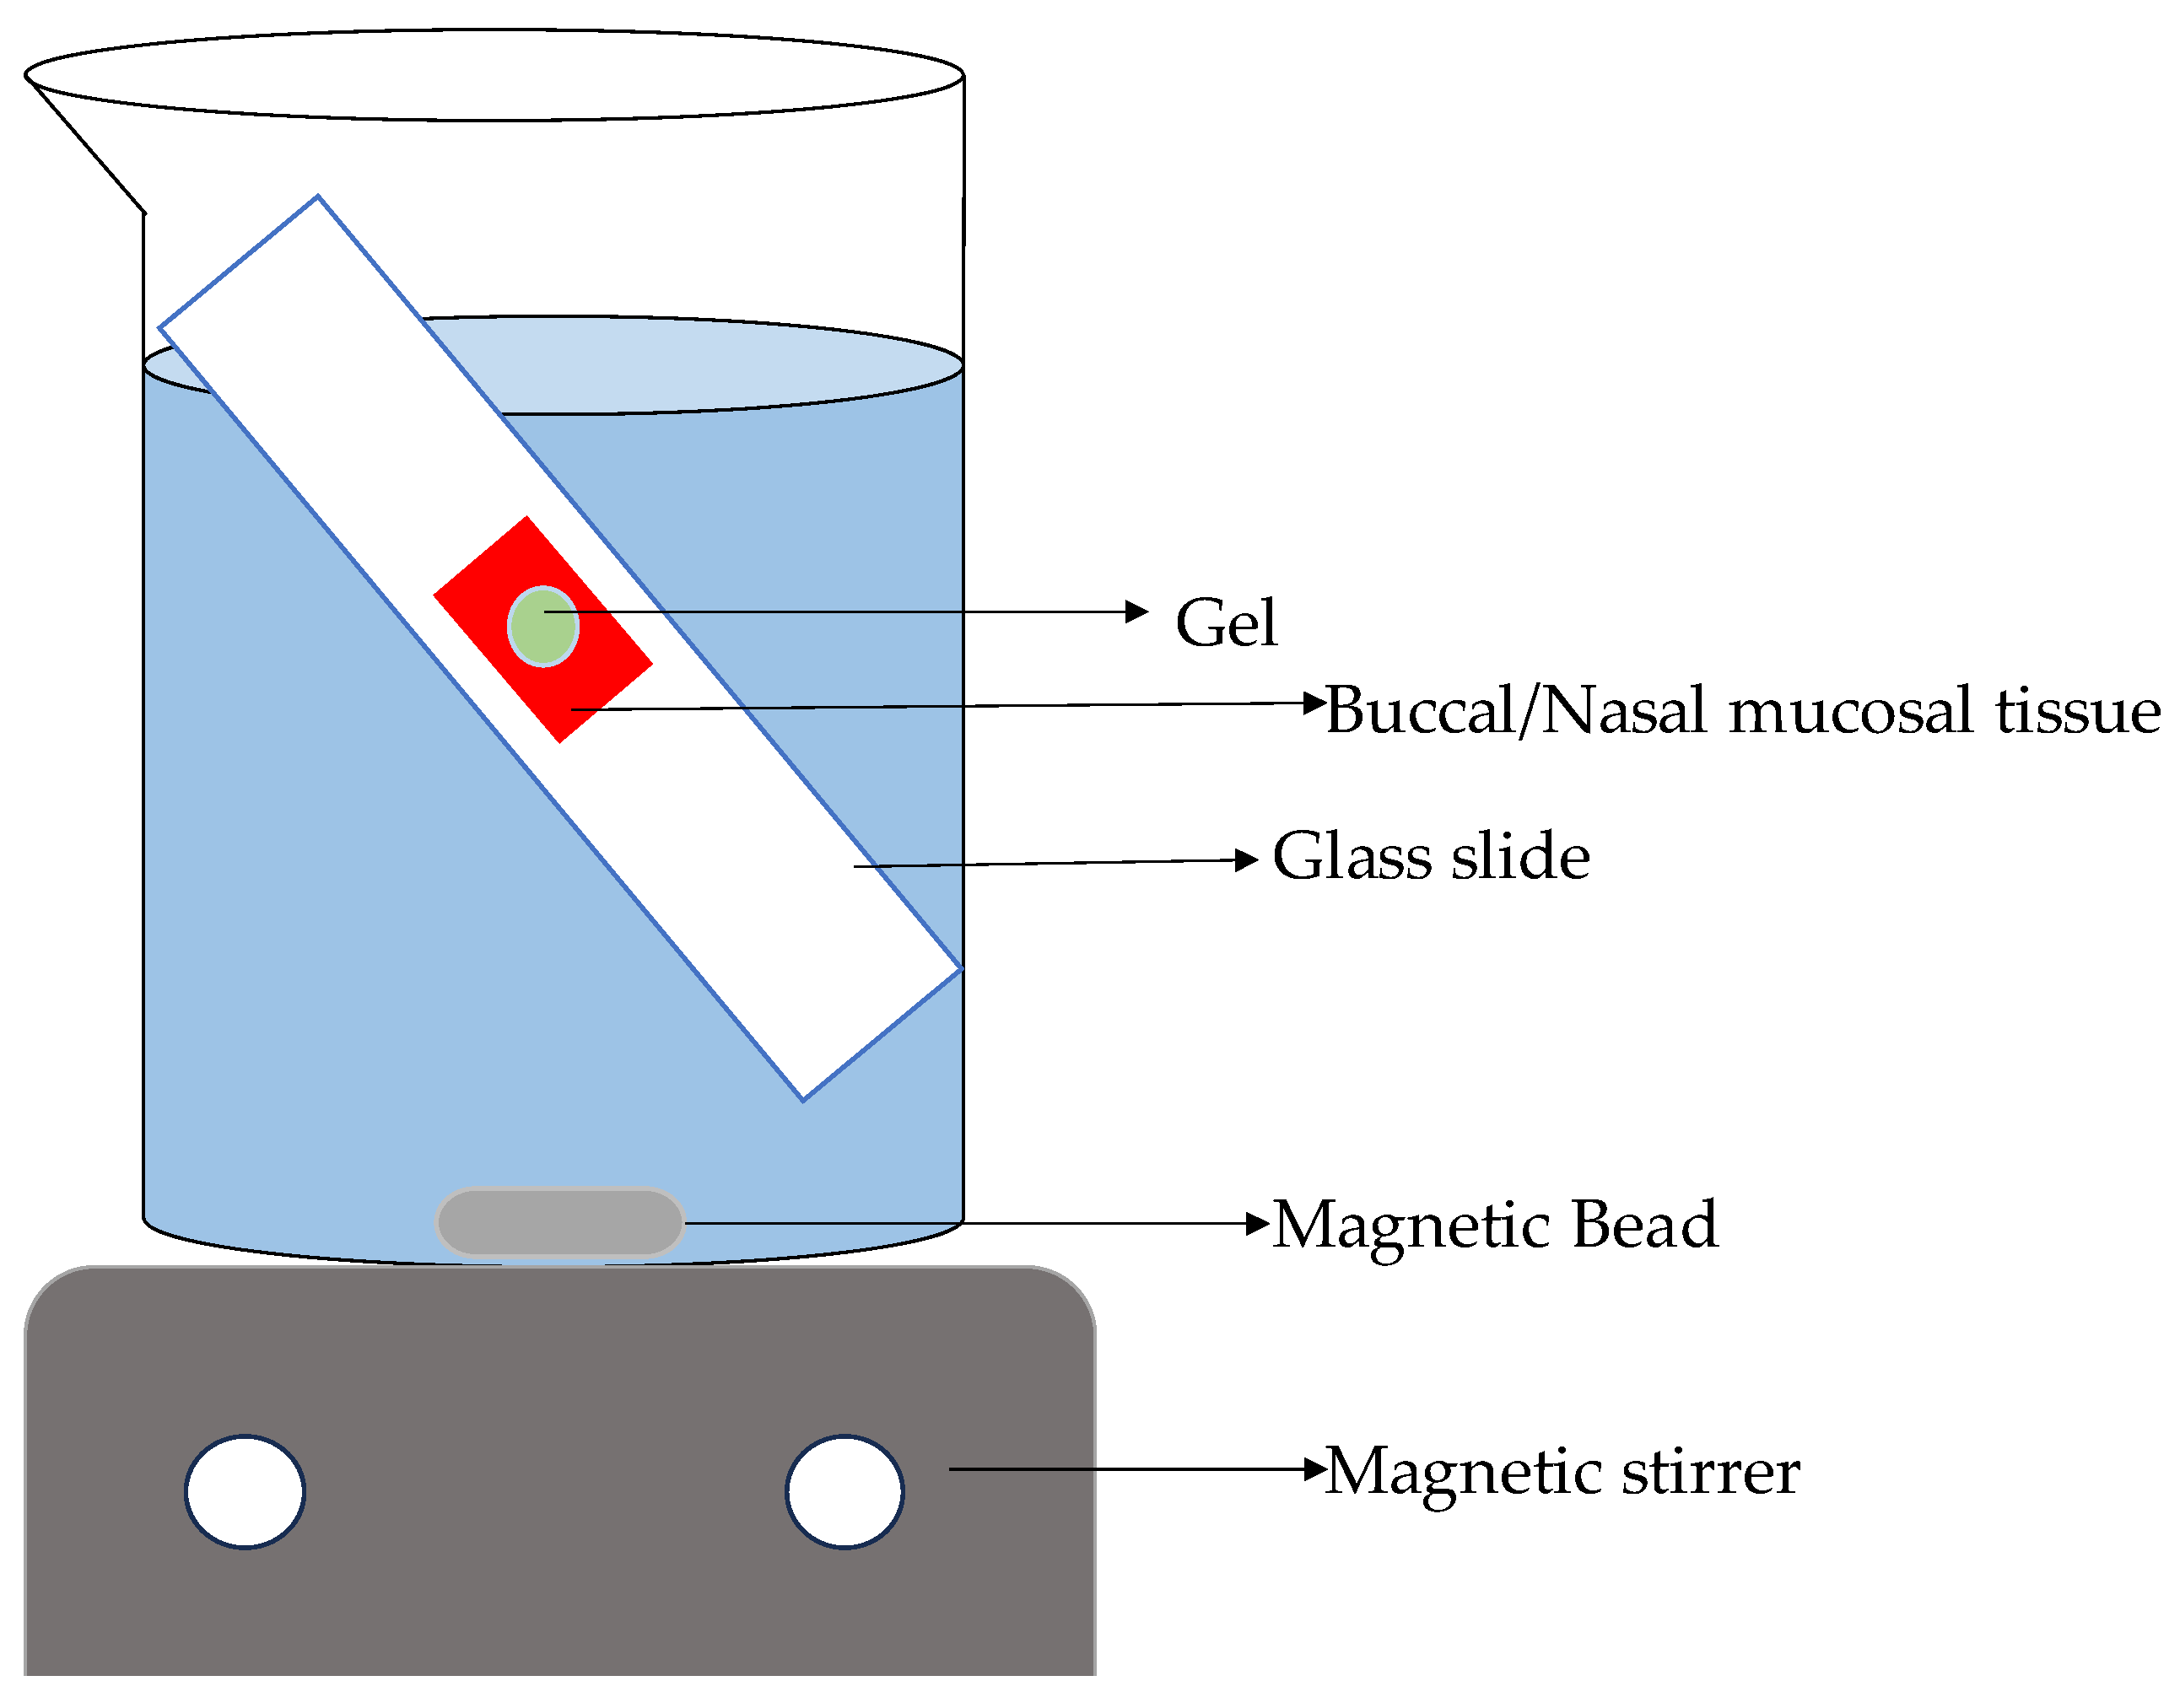
As reported in the literature, the gel formulation’s retention time was estimated under experimental conditions. An inclined glass slide at 45° was placed in a beaker with freshly excised goat buccal and pig nasal mucosa for retention time. The
Figure 15 shows acrylate adhesive fixing mucosal tissue. The setup was submerged in 800 mL of pH 6.8 PBS. 3 g of gel formulation was applied to a 4 cm² mucosal surface and left undisturbed for almost 20 s to develop mucoadhesion before immersing the slide. The slide was gently immersed, and time required for eroded or detachment of gel from the mucosal surface is recorded. The buccal and nasal mucosal experiment was repeated three times. [
21]
4.3.9. Ex- Vivo Permeation Test
Ex-vivo permeation studies were performed using sheep nasal mucosa and goat buccal mucosa mounted in Franz-type diffusion cells. The tissues were obtained from licensed sources after the animal was slaughtered. Mucosal integrity was confirmed by TEER measurements (>500 Ω·cm²). Riv-SLNPs loaded natural polymeric gel was applied to the mucosal surface to measure drug permeation across biological tissue, providing information on absorption potential in vivo. Samples from the receptor compartment were analyzed at 203 nm using UV spectrophotometry, and permeability coefficients and steady-state flux were calculated [
22].
Figure 16.
Schematic representation of the washability test. Mucosal tissue are fixed in slide and formulation is applied to it which was submerged in buffer and time required by the gel to detached from mucosal surface is noted.
Figure 16.
Schematic representation of the washability test. Mucosal tissue are fixed in slide and formulation is applied to it which was submerged in buffer and time required by the gel to detached from mucosal surface is noted.
4.3.10. In-Vitro Drug Release Study
The in-vitro release behavior of rivastigmine from Riv-SLNs loaded natural polymeric was evaluated using the dialysis bag diffusion technique. A pre-activated dialysis membrane (MWCO 12–14 kDa) was filled with a known amount of the nanoparticle dispersion and tightly sealed at both ends. The dialysis bag was then immersed in 50 mL of phosphate buffer pH 6.8 containing 0.5% Tween-80 to maintain sink conditions. The release medium was maintained at 37 ± 0.5 °C under continuous magnetic stirring at 100 rpm to simulate physiological conditions. At predetermined time intervals (0, 0.5, 1, 2, 4, 6, 8, 12, and 24 hours), 2 mL aliquots were withdrawn from the release medium and replaced with an equal volume of fresh buffer to maintain constant volume. The samples were filtered, diluted if necessary, and analyzed at rivastigmine’s λmax using UV spectroscopy. The cumulative percentage of drug released was calculated and plotted as a function of time to understand the release profile and mechanism [
23].
4.3.11. FTIR Analysis of Drug, SLN and Natural Polymer Based Riv- SLN Loaded Natural Polymeric Gel Formulation [11]
FTIR spectra for each of the individual formulation components as well as the formulations were obtained over the wavenumber range from 4000 cm⁻¹ to 400 cm⁻¹ with a spectral resolution of 4 cm⁻¹. Cubes of each of the samples were created by mixing the sample with IR-grade potassium bromide (KBr) and compressing the mixture to form a transparent disc (the pellets) to be used for the FTIR analysis. The FTIR spectral data was then reviewed for changes in peak height, change in peak position, and disappearance or creation of new peaks, which indicated that some type of physical or chemical interaction was occurring between the formulation components.
4.3.12. Buccal Epithelial (TR146) Cytotoxicity Assay
TR146 cells were cultured in 75 cm² flasks containing 15 mL of DMEM and transferred into 96-well plates after several passages. Once the cultures reached 70–80% confluence, cells were seeded at a density of 1×10⁵ cells/200 μL per well and incubated for 24 hours at 37 °C in 5% CO₂. After incubation, the medium was replaced with 100 μL of the test sample at concentrations of 1, 10, 50, 100, 250, and 500 μg/mL and allowed to act for 2 hours. The plates were then incubated for an additional 48 hours, after which cell viability was determined using the MTT assay, which measures mitochondrial dehydrogenase activity in viable cells. A volume of 20 μL MTT reagent (5 mg/mL in PBS) was added to each well and incubated for 2–4 hours. The resulting formazan crystals were dissolved in 150 μL DMSO with shaking for 10 minutes at 120 rpm [
24].
Absorbance was recorded at 570 nm, and cell proliferation was calculated using the formula:
4.3.13. Human Nasal Epithelial Cytotoxicity Assay:
HNEp cells were cultured in 75 cm² flasks containing 15 mL DMEM and subsequently transferred into 96-well plates after several passages. Once cells reached 70–80% confluence, they were seeded at a density of 1×10⁵ cells/200 μL per well and incubated for 24 hours at 37 °C in 5% CO₂. After incubation, the medium was replaced with 100 μL of the test sample at concentrations of 6.25, 12.5, 25, 50, 100, and 200 μg/mL and exposed for 2 hours. Following treatment, the plates were further incubated for 48 hours, after which cell viability was assessed using the MTT assay, which measures mitochondrial dehydrogenase activity in viable cells. A volume of 20 μL MTT (5 mg/mL in PBS) was added to each well and incubated for 2–4 hours, and the resulting formazan crystals were dissolved in 150 μL DMSO with shaking for 10 minutes at 120 rpm [
25].
Absorbance was measured at 570 nm, and cell proliferation was calculated using the formula:
4.3.14. MTT Cytotoxicity Assay (24-Hour Exposure)
SH-SY5Y neuroblastoma cells were cultured in DMEM supplemented with 10% FBS, penicillin (100 U/mL), and streptomycin (100 μg/mL) under 5% CO₂ at 37 °C. Cells were seeded in 96-well plates at a density of 1×10⁵ cells/200 μL per well and incubated for 24 hours. After attachment, the medium was replaced with 100 μL of sample solutions at concentrations of 5, 10, 50, 100, 250, and 500 μg/mL. After 24 hours of exposure, 20 μL of MTT (5 mg/mL in PBS) was added to each well and incubated for 2–4 hours. The resulting formazan crystals were dissolved in 150 μL DMSO, and absorbance was measured at 570 nm [
26].
where Ab1=absorbance of the test; Ab0=absorbance of the control
4.3.15. Cell Viability Assay (MTT at 24 & 48 Hours)
The same cell culture procedure and seeding density were followed as above. After 24 hours of incubation, cells were treated with sample concentrations of 10, 50, and 100 μg/mL, and Rivastigmine tartrate (4 μg/mL) served as the reference drug. Viability was assessed at two time points: 24 hours and 48 hours using the MTT procedure described earlier. Absorbance was recorded at 570 nm, and percentage viability was calculated relative to the untreated control.
4.3.16. Acetylcholinesterase (AChE) Inhibition Assay
SH-SY5Y cells were seeded in 96-well plates (1×10⁵ cells/200 μL per well) and allowed to attach for 24 hours. Cells were then treated with sample concentrations of 10, 50, and 100 μg/mL, along with Rivastigmine tartrate (4 μg/mL) as the standard inhibitor, for 24 hours. After treatment, the culture media was collected, and cells were scraped into 0.1 M Tris-HCl buffer (pH 8.0). AChE activity was quantified by mixing the cell suspension with DTNB (0.5 mM) and acetylthiocholine iodide (1 mM). Absorbance was measured at 412 nm for 10 minutes [
27].
AChE inhibition (%) was calculated as:
4.3.17. Stability Studies
The Riv-SLNP formulation was stored at room temperature (25 °C) for 3 months, and organoleptic properties, pH, mucoadhesive strength and drug release were periodically monitored. While these results indicate preliminary stability, future studies will include long-term and accelerated ICH conditions to fully establish formulation robustness over extended periods.
4.3.18. Statistical Analysis
All experiments were performed in triplicate (n = 3), and results are expressed as mean ± standard deviation (SD). Statistical analysis was carried out using one-way analysis of variance (ANOVA) followed by Tukey’s post hoc test for multiple comparisons. A p-value of less than 0.05 was considered statistically significant. Data analysis was performed using Microsoft Excel.
Supplementary Materials
The following supporting information can be downloaded at: preprints.org, Figure S1 Full NMR Spectra of moringa mucilage.
Author Contributions
Conceptualization, B.D. and M.S.U.; methodology, B.D. and M.S.U.; investigation, B.D. and M.S.U.; resources, B.D. and M.S.U.; data curation, B.D. and M.S.U.; writing—original draft preparation, B.D.; writing—review and editing, B.D. and M.S.U.; visualization, B.D. and M.S.U.; supervision, M.S.U.; project administration, B.D. and M.S.U. All authors have read and agreed to the published version of the manuscript.
Funding
This research received no external funding.
Institutional: Review Board Statement
Not applicable.
Informed Consent Statement
Not applicable.
Data Availability Statement
The data generated in this study can be requested from the corresponding author.
Acknowledgments
The authors gratefully acknowledge SRM College of Pharmacy, SRM Institute of Science and Technology, Kattankulathur , Interdisciplinary Institute of Indian System of Medicine (IIISM) at SRMIST and SCIF at SRMIST for providing the instrumentation and valuable support and cooperation in facilitating this research project.
Conflicts of Interest
The authors declare no conflicts of interest.
Abbreviations
The following abbreviations are used in this manuscript:
| SLN |
Solid Lipid Nanoparticle |
| Riv-SLNs |
Rivastigmine Solid Lipid Nanoparticles |
| PDI |
Polydispersity Index |
| ZP |
Zeta Potential |
| SEM |
Scanning Electron Microscopy |
| PBS |
Phosphate Buffered Saline / Phosphate Buffer Solution |
| MWCO |
Molecular Weight Cut-Off |
| SNF |
Simulated Nasal Fluid |
| ANOVA |
Analysis of Variance |
| MTT |
3-(4,5-Dimethylthiazol-2-yl)-2,5-Diphenyltetrazolium Bromide |
| TEER |
Transepithelial Electrical Resistance |
| rpm |
Revolutions Per Minute |
| SD |
Standard Deviation |
| UV |
Ultraviolet (spectrophotometry) |
| AChE |
Acetylcholinesterase |
| FTIR |
Fourier Transform Infrared Spectroscopy |
| NMR |
Nuclear Magnetic Resonance |
References
- Breijyeh, Z.; Karaman, R. Comprehensive Review on Alzheimer’s Disease: Causes and Treatment. Molecules 2020, 25, 5789. [Google Scholar] [CrossRef]
- Xing, H.; Yue, S. Recent Advances in Drug Development for Alzheimer’s Disease: A Comprehensive Review. Int. J. Mol. Sci. 2025, 26, 3905. [Google Scholar] [CrossRef]
- Brako, F.; Boateng, J. Transmucosal drug delivery: prospects, challenges, advances, and future directions. Expert Opin. Drug Deliv. 2025, 22, 525–553. [Google Scholar] [CrossRef] [PubMed]
- Elmowafy, M.; Al-Sanea, M.M. Nanostructured Lipid Carriers (NLCs) as Drug Delivery Platform: Advances in Formula-tion and Delivery Strategies. Saudi Pharm. J. 2021, 29, 999–1012. [Google Scholar] [CrossRef]
- Badwaik, H.R.; Hoque, A.A. Moringa Gum and Its Modified Form as a Potential Green Polymer Used in Biomedical Field. Carbohydrate Polymers 2020, 249, 116893. [Google Scholar] [CrossRef]
- Sharma, K.; Kumar, M. Moringa (Moringa Oleifera Lam.) Polysaccharides: Extraction, Characterization, Bioactivities, and In-dustrial Application. Int. J. Bio. Macromol 2022, 209, 763–778. [Google Scholar] [CrossRef] [PubMed]
- Kumar, S. Physicochemical, Phytochemical and Toxicity Studies on Gum and Mucilage from Plant Abelmoschus Escu-lentus. J. Phytopharmacol. 2014, 3, 200–203. [Google Scholar] [CrossRef]
- Trease, G.E.; Evans, W.C. Trease and Evans Pharmacognosy, 16th ed.; Saunders Elseviers: London Etc., 2009; p. 210. [Google Scholar]
- Monrroy, Mariel; García, Erick; Ríos, Katherine; Renán García, José. Extraction and Physicochemical Characterization of Mucilage from Opuntia cochenillifera (L.) Miller. Hindawi Journal of ChemistryVolume 2017, 1–9. [Google Scholar] [CrossRef]
- Dubois, F.; Musa, C. Nuclear Magnetic Resonance and Calorimetric Investigations of Extraction Mode on Flaxseed Gum Composition. Polymers 2020, 12, 2654. [Google Scholar] [CrossRef]
- Momen, S.B.; Siadat, S.D. Applying Central Composite Design and Response Surface Methodology to Optimize Growth and Biomass Production of Haemophilus Influenzae Type B. Jundishapur J. of Micro 2016, 9, 25246. [Google Scholar]
- Solid Lipid Nanoparticle Preparation Techniques. Available online: https://encyclopedia.pub/entry/27475 (accessed on 10 Dec 2025).
- Musielak, E.; Feliczak-Guzik, A. Optimization of the Conditions of Solid Lipid Nanoparticles (SLN) Synthesis. Molecules 2022, 27, 2202. [Google Scholar] [CrossRef] [PubMed]
- Mura, P.; Maestrelli, F. Evaluation and Comparison of Solid Lipid Nanoparticles (SLNs) and Nanostructured Lipid Car-riers (NLCs) as Vectors to Develop Hydrochlorothiazide Effective and Safe Pediatric Oral Liquid Formulations. Pharmaceu-tics 2021, 13, 437. [Google Scholar] [CrossRef]
- Talele, S.; Nikam, P. A Research Article on Nanogel as Topical Promising Drug Delivery for Diclofenac Sodium. Ind. J. Pharm. Ed. Res. 2017, 51, 580–s587. [Google Scholar] [CrossRef]
- Khan, Barkat Ali; Ahmad, N. Formulation Development of Pharmaceutical Nanoemulgel for Transdermal Delivery of Feboxostat: Physical Characterization and in Vivo Evaluation. European J. Pharm. Sci. 2024, 195, 106665–106665. [Google Scholar] [CrossRef]
- Al-Bazzaz, Fadia Yassir; Ismail, S.T. Topical HPMC/Carbopol 934 Gel for Wound Healing: Formulation and In-Vivo Evalua-tion. Pharmakeftiki 2024, 36. [Google Scholar]
- Alagusundaram, M.; Jain, N.K. Development and Characterization of Gel-Based Buccoadhesive Bilayer Formulation of Nife-dipine. Gels 2023, 9, 688. [Google Scholar] [CrossRef]
- Paleekui, P.; Rattanamato, B.; Kanha, N.; Rakariyatham, K.; Klangpetch, W.; Osiriphun, S.; Laokuldilok, T. Tex-ture-Modified Soy Protein Gels Using Transglutaminase and Agar for Elderly Dysphagia Management. Gels 2025, 11, 303. [Google Scholar] [CrossRef] [PubMed]
- Basu, S.; Chakrabatorty, S. Development and Evaluation of a Mucoadhesive Nasal Gel of Midazolam Prepared with Linum usitatissimum L. Seed Mucilage. Sci. Pharm. 2009, 77, 899–910. [Google Scholar] [CrossRef]
- Syed, M.A.; Aziz, G.; Jehangir, M.B.; Tabish, T.A.; Zahoor, A.F.; Kha-lid, S.H.; Khan, I.U.; Hosny, K.M.; Rizg, W.Y.; Hanif, S.; Arshad, R.; Qayyum, M.A.; Irfan, M. Evaluating Novel Agarose-Based Buccal Gels Scaffold: Mucoadhesive and Pharmacokinetic Profiling in Healthy Volunteers. Pharmaceutics 2022, 14, 1592. [Google Scholar] [CrossRef] [PubMed]
- Jamshidnejad-Tosaramandani, T.; Kashanian, S. Synthesis of a Rivastigmine and Insulin Combinational Mucoadhesive Na-noparticle for Intranasal Delivery. Polymers 2024, 16, 510. [Google Scholar] [CrossRef]
- Cunha, S.; Costa, C.P. Double Optimization of Rivastigmine-Loaded Nanostructured Lipid Carriers (NLC) for Nose-to-Brain Delivery Using the Quality by Design (QbD) Approach: Formulation Variables and Instrumental Parame-ters. Pharmaceutics 2020, 12, 599. [Google Scholar] [CrossRef] [PubMed]
- Keum, T.; Noh, G.; Seo, J.-E. In Vitro and Ex Vivo Evaluation of Penetratin as a Non-invasive Permeation Enhancer in the Penetration of Salmon Calcitonin through TR146 Buccal Cells and Porcine Buccal Tissues. Pharmaceuticals 2020, 13, 408. [Google Scholar] [CrossRef] [PubMed]
- El-Amouri, S.S.; Zhu, H. Neprilysin: An Enzyme Candidate to Slow the Progression of Alzheimer’s Disease. Ameri. J. Path 2008, 172, 1342–1354. [Google Scholar] [CrossRef] [PubMed]
- Feles, S.; Overath, C. Streamlining Culture Conditions for the Neuroblastoma Cell Line SH-SY5Y: A Prerequisite for Functional Studies. Methods Protoc. 2022, 5, 58. [Google Scholar] [CrossRef]
- Li, S.; Li, A.J. Acetylcholinesterase Inhibition Assays for High-Throughput Screening. Methods in Mol. Bio 2022, 47–58. [Google Scholar]
|
Disclaimer/Publisher’s Note: The statements, opinions and data contained in all publications are solely those of the individual author(s) and contributor(s) and not of MDPI and/or the editor(s). MDPI and/or the editor(s) disclaim responsibility for any injury to people or property resulting from any ideas, methods, instructions or products referred to in the content. |
© 2025 by the authors. Licensee MDPI, Basel, Switzerland. This article is an open access article distributed under the terms and conditions of the Creative Commons Attribution (CC BY) license (http://creativecommons.org/licenses/by/4.0/).