1. Introduction
Consumer demand for wines without added sulfur dioxide (SO₂) has increased significantly in recent years [
1]. However, producing wines under these conditions may result in organoleptic defects or health risks due to the uncontrolled growth of undesirable microorganisms during alcoholic fermentation. Traditionally, SO₂ has been used as a preservative and antimicrobial agent in winemaking, efficiently inhibiting malolactic fermentation and microbial deterioration [
2]. Nevertheless, the presence of residual sulfites in wine remains controversial due to their potential to cause adverse effects in sensitive consumers, including allergic reactions, headaches, and nausea [
3,
4].
Sulfur dioxide is one of the most effective additives in enology and has been used in winemaking since the 17th century. Its antiseptic, antioxidant and enzymatic inhibition properties make it a preferred tool for preserving wine quality [
5]. Its antioxidant activity protects wines from oxidation by removing oxygen and preventing the degradation of phenolic and aromatic compounds, both essential for maintaining the wine’s sensory profile [
2]. Additionally, SO₂ inhibits the growth of yeasts, lactic acid bacteria, and acetic acid bacteria, contributing to microbial stability throughout the winemaking and storage processes [
5].
Sulfur dioxide and its sulfite salts are authorized as food additives in many countries for winemaking, and the World Health Organization has established an Acceptable Daily Intake (ADI) of 0.7 mg/kg body weight per day [
2]. Due to the health-related issues associated with SO₂ consumption, the International Organization of Vine and Wine (OIV) has progressively reduced the maximum allowable concentration in wines. Excessive doses should be avoided not only for health considerations but also, from an oenological perspective, as they can lead to organoleptic alterations in the final product, including aroma neutralization and the development of characteristic off-flavors [
5].
The permitted level of SO₂ in wine has changed over time. Prior to 1998, there was no unified regulatory framework within the OIV, and limits varied according to national legislation in each country. From 1998 onwards, the OIV adopted Resolution OENO 9/98, which set a maximum limit of 150 mg/L of total SO₂ for red wines at the time of marketing [
6]. Subsequently, in 2018, the OIV revised certain limit values and promoted the development of technical documents and guidelines to encourage a progressive reduction in SO₂ use. These initiatives include recommendations for more efficient vineyard and winery management, as well as the implementation of alternative practices to minimize the necessary doses of this additive [
2]. The most recent edition of the International Code of Oenological Practices (Codex OIV), particularly the 2023/2025 consolidated version, systematize historical resolutions, including OENO 9/98, and reflect current recommendations in terms of both permitted limits and strategies for reducing SO₂ use. While technical updates have been incorporated, the numerical limits set out in Resolution OENO 9/98 remain in force [
7].
Therefore, in the context of an increasingly competitive global wine market, it is essential to reduce or even replace SO
2 as a preservative and to seek new, safer, and healthier alternative strategies. There is growing interest in finding such alternatives or complementary agents that can reduce SO₂ usage without compromising wine quality or safety. Among these, compounds such as chitosan and lysozyme have shown promising antimicrobial properties [
4].
Chitosan is a natural polysaccharide derived primarily from fungal cell walls [
8]. It is considered safe for humans and has been approved for use in enology since 2009 at doses up to 100 mg/L [
7]. The antimicrobial activity is mainly attributed to its polycationic nature, which disrupts the cell membranes of spoilage yeasts (
Brettanomyces spp.) [
9], acetic acid bacteria [
10] and lactic acid bacteria [
11], leading to cell death or growth inhibition. Studies show that chitosan can selectively inhibit
Brettanomyces spp. growth while sparing beneficial
Saccharomyces spp. yeast during fermentation [
12]. Moreover, its application can reduce microbial activity not only during fermentation but also in wine storage, enhancing the wine’s shelf life. Results reported by Paulin et al. (2020) [
9] found that, a dose of 40 mg/L of chitosan was effective in reducing populations of
Brettanomyces bruxellensis in most of the tested strains, but its efficacy varied depending on the yeast genotype and the batch of chitosan used. On the other hand, Elmaci et al. (2015) [
11], evaluated the effectiveness of chitosan against wine-related microorganisms using concentrations ranging from 200 to 2000 mg/L. They found that
Brettanomyces bruxellensis,
Lactobacillus hilgardii and
Oenococcus oeni were completely inhibited at 200 mg/L, whereas
Saccharomyces cerevisiae showed greater resistance, remaining unaffected at these concentrations. During fermentation, chitosan delayed the onset of fermentative activity, but did not prevent
Saccharomyces cerevisiae from becoming viable or completing fermentation. Chitosan also exhibits antioxidant properties by chelating transition metal ions involved in oxidative reactions, thus preventing wine browning and preserving sensory attributes [
8,
13].
Lysozyme, an enzyme derived mainly from egg white, selectively targets Gram-positive bacteria, particularly lactic acid bacteria (
Pediococcus spp
., Oenococcus spp. and
Lactobacillus spp.), making it useful for controlling malolactic fermentation and reducing volatile acidity [
4]. Lysozyme has been approved for use in winemaking at a maximum dose of 500 mg/L and is especially effective in wines with high pH, where SO₂ efficacy is limited. However, lysozyme does not replace the antioxidant effect of SO₂, and has limited activity against Gram-negative bacteria and yeasts [
14]. It can be used in combination with other antimicrobial strategies to ensure comprehensive microbial control [
15]. The allergens responsible for wine allergies could be enzymes such as lysozyme, so it is important to use low doses [
16]. In their study, Gao et al. (2015) [
14] evaluated the effectiveness of lysozyme at concentrations of 200 mg/L and 400 mg/L during alcoholic fermentation. They discovered that lysozyme effectively inhibited the growth of lactic acid bacteria responsible for spoilage without adversely affecting the fermentative activity or viability of
Saccharomyces cerevisiae. These results suggest that lysozyme is an effective agent for controlling undesirable lactic acid bacteria during winemaking, helping to prevent sensory defects and microbiological problems.
The growing demand for sustainable viticulture practices has encouraged the adoption of strategies to reduce/limit sulfite use in winemaking. This promotes more responsible production and enhanced traceability, as has been observed in several winemaking countries, including Uruguay [
17]. This study aims to evaluate strategies for reducing or replacing SO₂ using chitosan and lysozyme, in Tannat red winemaking, evaluating their impact on microbial composition and stability as well as physicochemical and sensory properties. Additionally, it was considered that the proposed strategies for reducing or replacing SO₂ should not involve the addition of substances at levels that could result in a risk for consumer health. Therefore, lower-than-recommended doses of lysozyme were evaluated.
3. Results
3.1. Grape Juice Fermentation Kinetics
The evolution of density and temperature during alcoholic fermentation exhibited a similar behavior across all treatments evaluated (
Figure 2). Density decreased markedly during the first six days of fermentation, reaching values below 1000 g/L from day 7, with no significant difference observed in the fermentative kinetics among treatments. At the end of the process, all winemaking processes stabilized at values close to 995 g/L. Additionally, must temperature showed a progressive increase during the initial days, peaking between 27 and 28 °C around days 4–6, followed by a gradual decline until stabilization at approximately 26–27 °C by the end of fermentation.
3.2. Microbial Population Dynamics
Microbial counts varied across treatments and stages of winemaking (
Table 1). Total aerobic counts were initially high at the vatting stage (around 7 log c.f.u./ml) and similar among most treatments, except for TW, which showed significantly lower values (6.28 ± 0.15 log c.f.u./ml). However, before devatting, the total aerobic count increased slightly in the TW treatment. After devatting, viable aerobic populations markedly decreased, only the C and RS+C treatments still showed detectable values (5.59 ± 0.02 and 2.74 ± 0.37 log c.f.u./ml, respectively). In contrast, counts were below the detection limits of the method in the RS, RS+L and TW treatments, and remained below the detection limit throughout the rest of the study period. Yeasts population displayed high initial loads (~7 log c.f.u./ml) during vatting, remaining relatively stable until devatting. A strong decline occurred after devatting, especially in treatments RS, RS+C, RS+L and TW, while C treatment maintains a significantly higher value (5.07 ± 0.10 log c.f.u./ml). After bottling, yeast populations recovered slightly in C, RS+C, and RS+L, while TW and RS showed lower counts. During storage, yeast levels increased again, reaching values between 2.56 and 3.65 log c.f.u./ml, with RS showing the lowest counts.
Lactic acid bacteria (LAB) were initially present at moderate levels (5.7 - 6.1 log c.f.u./ml) at vatting. Counts decreased before devatting and reached lower levels after devatting, for all treatments. After bottling, C and RS wines exhibited the highest LAB counts, representing an increase compared to the previous sampling time. On the contrary, other treatments continued to decrease. During storage, LAB counts were below the detection limits of the TW wines, while in RS+C and RS+L treatments LAB slightly increased (~3 log c.f.u./ml). Acetic acid bacteria (AAB) were detected only at vatting, with comparable counts among treatments (3.7–4.1 log c.f.u./ml), and were not recovered in later stages.
3.3. Diversity of Microbial Community
In this study, we assessed and compared the microbial community of different treatments applied during winemaking, at fifteen days after bottling by DNA sequencing of 16S rDNA. Hence, the results provide a ‘snapshot’ of the bacterial microbiota after 15 days storage. The deep sequencing of microbial communities generated a total of 1,494,432 sequences of V4 region from C, RS, RS+C, RS+L and TW. After quality filtering, trimming, error learning, dereplication, and chimera removal, a total of 2,029 V4 amplicon sequence variants (ASVs) were inferred. In order to assess the variations of microbial biodiversity, the Chao1 richness estimator and Shannon diversity index were used to compare all treatments (
Table 2). The sequencing results revealed marked differences in bacterial diversity and richness among the Tannat wines. The total number of raw reads was of similar magnitude across samples, but the number of ASVs and genera detected varied considerably between treatments. Although results should be interpreted with caution since differences were observed between duplicates in some treatments, the high genus-level assignment percentage (>99% in most samples) supports good sequencing quality and reliable taxonomic resolution. The traditional winemaking sample (TW) displayed moderate richness and diversity (Chao1 183 and Shannon 2.0), representing a moderate microbial complexity compared to the rest of the treatments (
Table 2). The RS treatment showed the lowest diversity and richness, suggesting a strong dominance of a few bacterial taxa or less diverse communities. In contrast, the RS+C treatment presented the highest values for both Shannon and Chao1 indices, indicating a complex and diverse bacterial community structure (
Table 2). Additionally, the rarefaction curves in all cases reached a sufficient sequencing depth to capture the full diversity present in the samples (data not shown), indicating that the sequencing effort was adequate and that the microbial communities were comprehensively represented.
The dynamics of bacterial population in all wines is shown in
Figure 3. Two different repetitions for each treatment are represented. Replicates were comparable for all samples but for C treatment, in which replicate 1 shows a high presence of a non oenological aerobic bacteria,
Acinetobacter johnsonii (84%) (
Figure 3a and b). For all treatments, except for RS+C, the taxonomic bacterial microbiota composition could be resumed to
Tatumella spp., acetic acid bacteria (AAB) and lactic acid bacteria (LAB). Nevertheless, the relative abundances of these groups varied among treatments (
Figure 3a). The genus
Tatumella spp. from the phylum Proteobacteria was the most abundant bacterial taxon in TW, in terms of relative abundance (55.6%). While the relative abundance of
Tatumella spp. was higher in TW compared to other strategies of winemaking, it remains present in all treatments with relative abundances that vary between 1.8 to 30.4%. For our analysis, all ASVs from those genera typically assigned to AAB (i.e.,
Gluconobacter, Acetobacter) and LAB (i.e.,
Oenococcus, Lactobacillus) were combined (
Figure 3a). AAB relative abundance ranges from less than 1% in RS1 to 25% in TW. The AAB population was higher in TW than others winemaking strategies (
Figure 3a).
Gluconobacter oxydans and
Komagataeibacter saccharivorans were the most abundant species in TW. These species were the most abundant AAB in all winemaking strategies (
Figure 3b). Concerning LAB population, this group was the most abundant in C2, RS and RS+L treatments, with relative abundances between 46 to 89% (
Figure 3a). This dominance was not evident in RS+C and TW wines, showing relative abundances around 15%. Considering the taxonomic composition of LAB communities, there were differences at the species level between treatments. Overall, the most abundant genera were
Oenococcus, Fructobacillus and
Apilactobacillus. Due to its tolerance to wine conditions,
Oenococcus oeni is the predominant lactic acid bacteria in wines and plays a crucial role in malolactic fermentation. According to the results presented in
Figure 3b,
Oenococcus oeni was the most represented LAB species in C2 and RS wines. On the opposite, the relative abundance of
Oenococcus oeni was less than 1% in RS+L, RS+C and TW wines.
Fructobacillus spp. was detected for all treatments but was the predominant LAB genera only in traditional vinification (
Figure 3b).
Apilactobacillus spp. was predominant in samples where
Oenococcus spp. was not the dominant genus, as it was observed for RS+L treatment (
Figure 3b). Despite the differences observed in LAB communities’ composition, winemaking where
Oenococcus oeni predominated, presented the highest LAB counts (
Figure 3a). RS+C winemaking was the only treatment in which bacterial composition could not be explained only by
Tatumella spp., AAB and LAB genera. ASVs recovered were 608 and 351 for RS+C1 and RS+C2, respectively.
Tatumella spp., AAB and LAB genera represented 1.9%, 7.3% and 14.5% of the bacterial population, respectively. The other 76% includes diverse genera such as
Cutibacterium, Corynebacterium, Staphylococcus, Pseudomonas, Clostridium and
Sphingomonas. It is worth noting that the LAB group was more diverse in these samples, including genera such as
Lactococcus spp. and
Streptococcus spp. (
Figure 3b).
3.4. General Composition of Tannat Wines
Strategies aimed at replacing or reducing added sulfite content modified the basic composition of wines (
Table 3). In terms of ethanol content, the RS, RS+L and RS+C treatments showed the lowest levels (between 12.6 and 12.7% v/v), which were significantly lower than those observed in the C treatment (13.1 ± 0.2% v/v). TW wines showed intermediate ethanol levels, with no significant differences compared to the other treatments.
Slight variations in pH were observed between the different treatments. The RS (3.73 ± 0.03) and RS+C (3.76 ± 0.02) treatments had significantly lower pH values. By contrast, the highest pH values were observed in C wines (3.89 ± 0.01).
Titratable acidity ranged from 3.57 to 4.32 g/L of H₂SO₄. The highest value (4.32 ± 0.79 g/L) was observed in RS+C wines. TW wines had the highest content of malic acid (2.30 ± 0.09 g/L) and the lowest of lactic acid (1.18 ± 0.17 g/L). RS+C and RS+L wines showed a different acid profile, with the lowest content of malic acid (between 1.42 and 1.73 g/L) and the highest lactic acid (between 2.23 and 2.50 g/L). Volatile acidity remained low across all treatments (0.33–0.47 g/L), with no statistically significant differences observed.
Regarding residual sugars, fructose concentrations were low and consistent among treatments (between 0.82 and 0.98 g/L), indicating that alcoholic fermentation was largely completed. However, glucose concentrations showed variations, with higher levels observed in the RS+C treatments (3.20 ± 0.23 g/L). This trend is reflected in the glucose/fructose ratio, which was lower in the RS+C treatment (1.25 ± 0.10), while higher ratios were observed in RS, TW and C wines (between 2.17 ± 0.16 and 2.40 ± 0.18).
3.5. Phenolic Composition of Tannat Wines
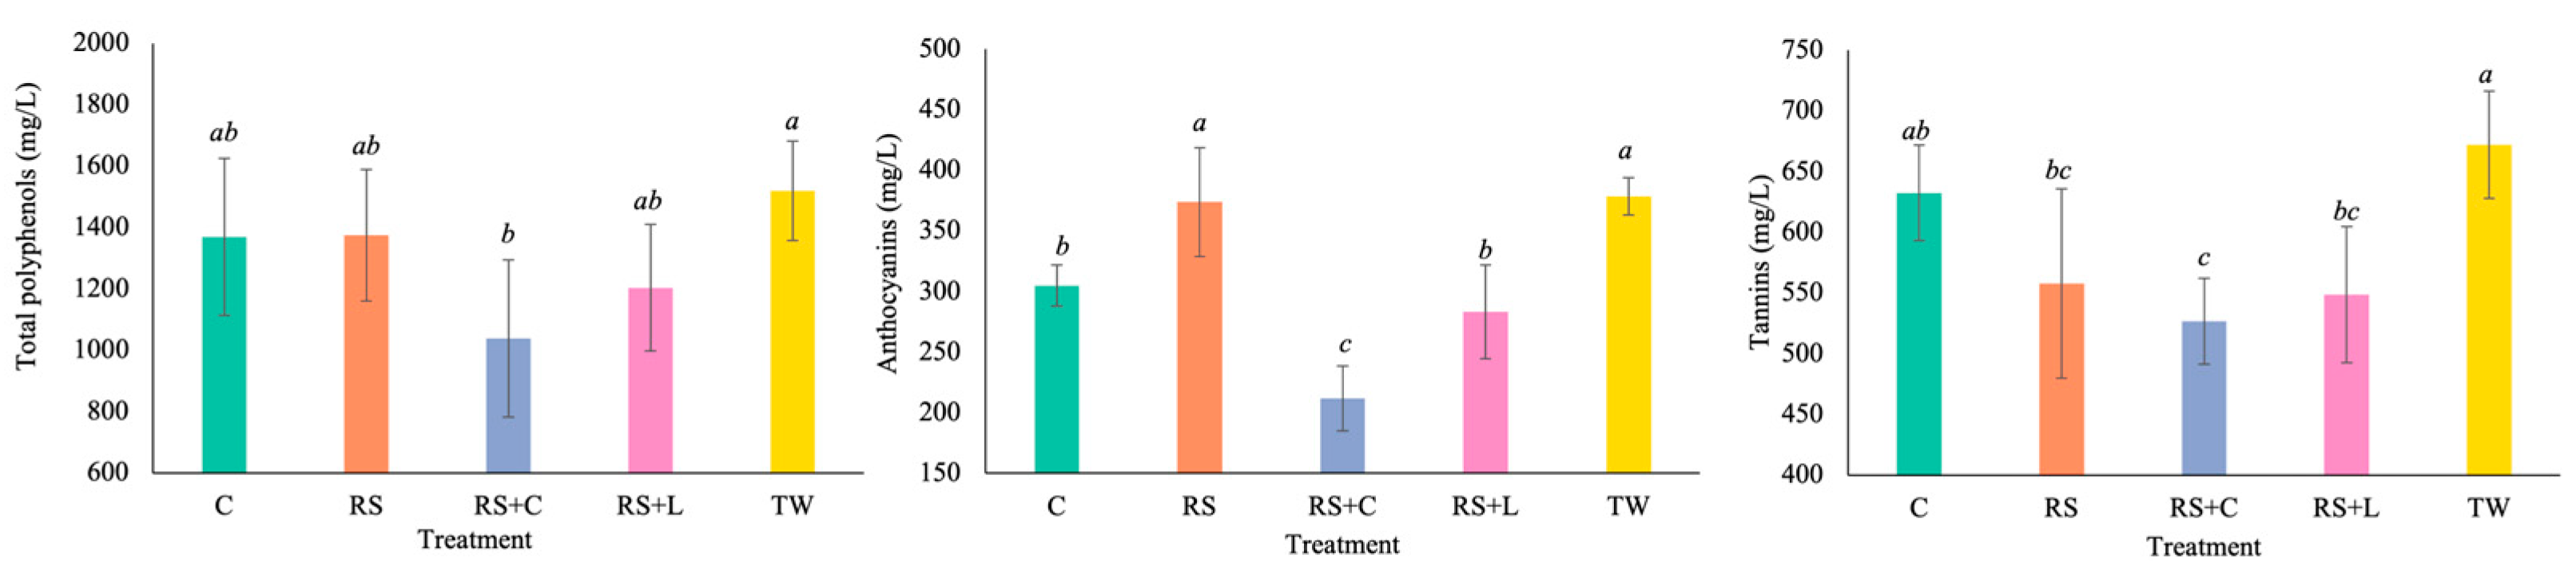
The different treatments evaluated modified the phenolic compounds of wines (
Figure 4). Total phenolic compound concentrations were higher in TW wines (1519 ± 161 mg/L), followed by the other treatments. The highest concentration of anthocyanins were found in the RS and TW wines (374 ± 45 and 379 ± 15 mg/L, respectively). The RS+L and C wines (283 ± 39 and 305 ± 17 mg/L, respectively) had slightly lower anthocyanin concentrations, while the lowest values were observed in RS+C wines (212 ± 27 mg/L). The TW wines had the highest tannin content (672 ± 44 mg/L), while the other treatments had lower values, with the RS+C treatment having the lowest concentration (527 ± 36 mg/L).
The anthocyanins profile of the wines (
Table 4) showed different proportions between the treatments. The RS+C wines had the highest non-acylated anthocyanins (83.8 ± 0.5), while RS wines had the lowest proportion (80.6 ± 1.1). However, the proportion in C and RS+L wines (82.8 ± 0.2 and 82.3 ± 0.9, respectively) were similar to TW (80.9 ± 0.1). Regarding the proportions of acetylated anthocyanins, RS wines had the highest value (19.4 ± 0.9), although there were no significant differences between TW and RS. The other treatments showed intermediate results. The RS wines showed the highest concentration of comarylated anthocyanins (0.61 ± 0.25), which was similar to TW wines (0.37 ± 0.04). The other treatments showed intermediate values and RS+C wines had the lowest proportion (0.03 ± 0.03).
Of the most important anthocyanins found in wine, malvidin was the most abundant in all treatments, followed by petunidin. TW wines had the highest proportion of all anthocyanins, except for malvidin, for which the highest values were shown by RS+C, RS+L and RS.
3.6. Color Parameters of Tannat Wines
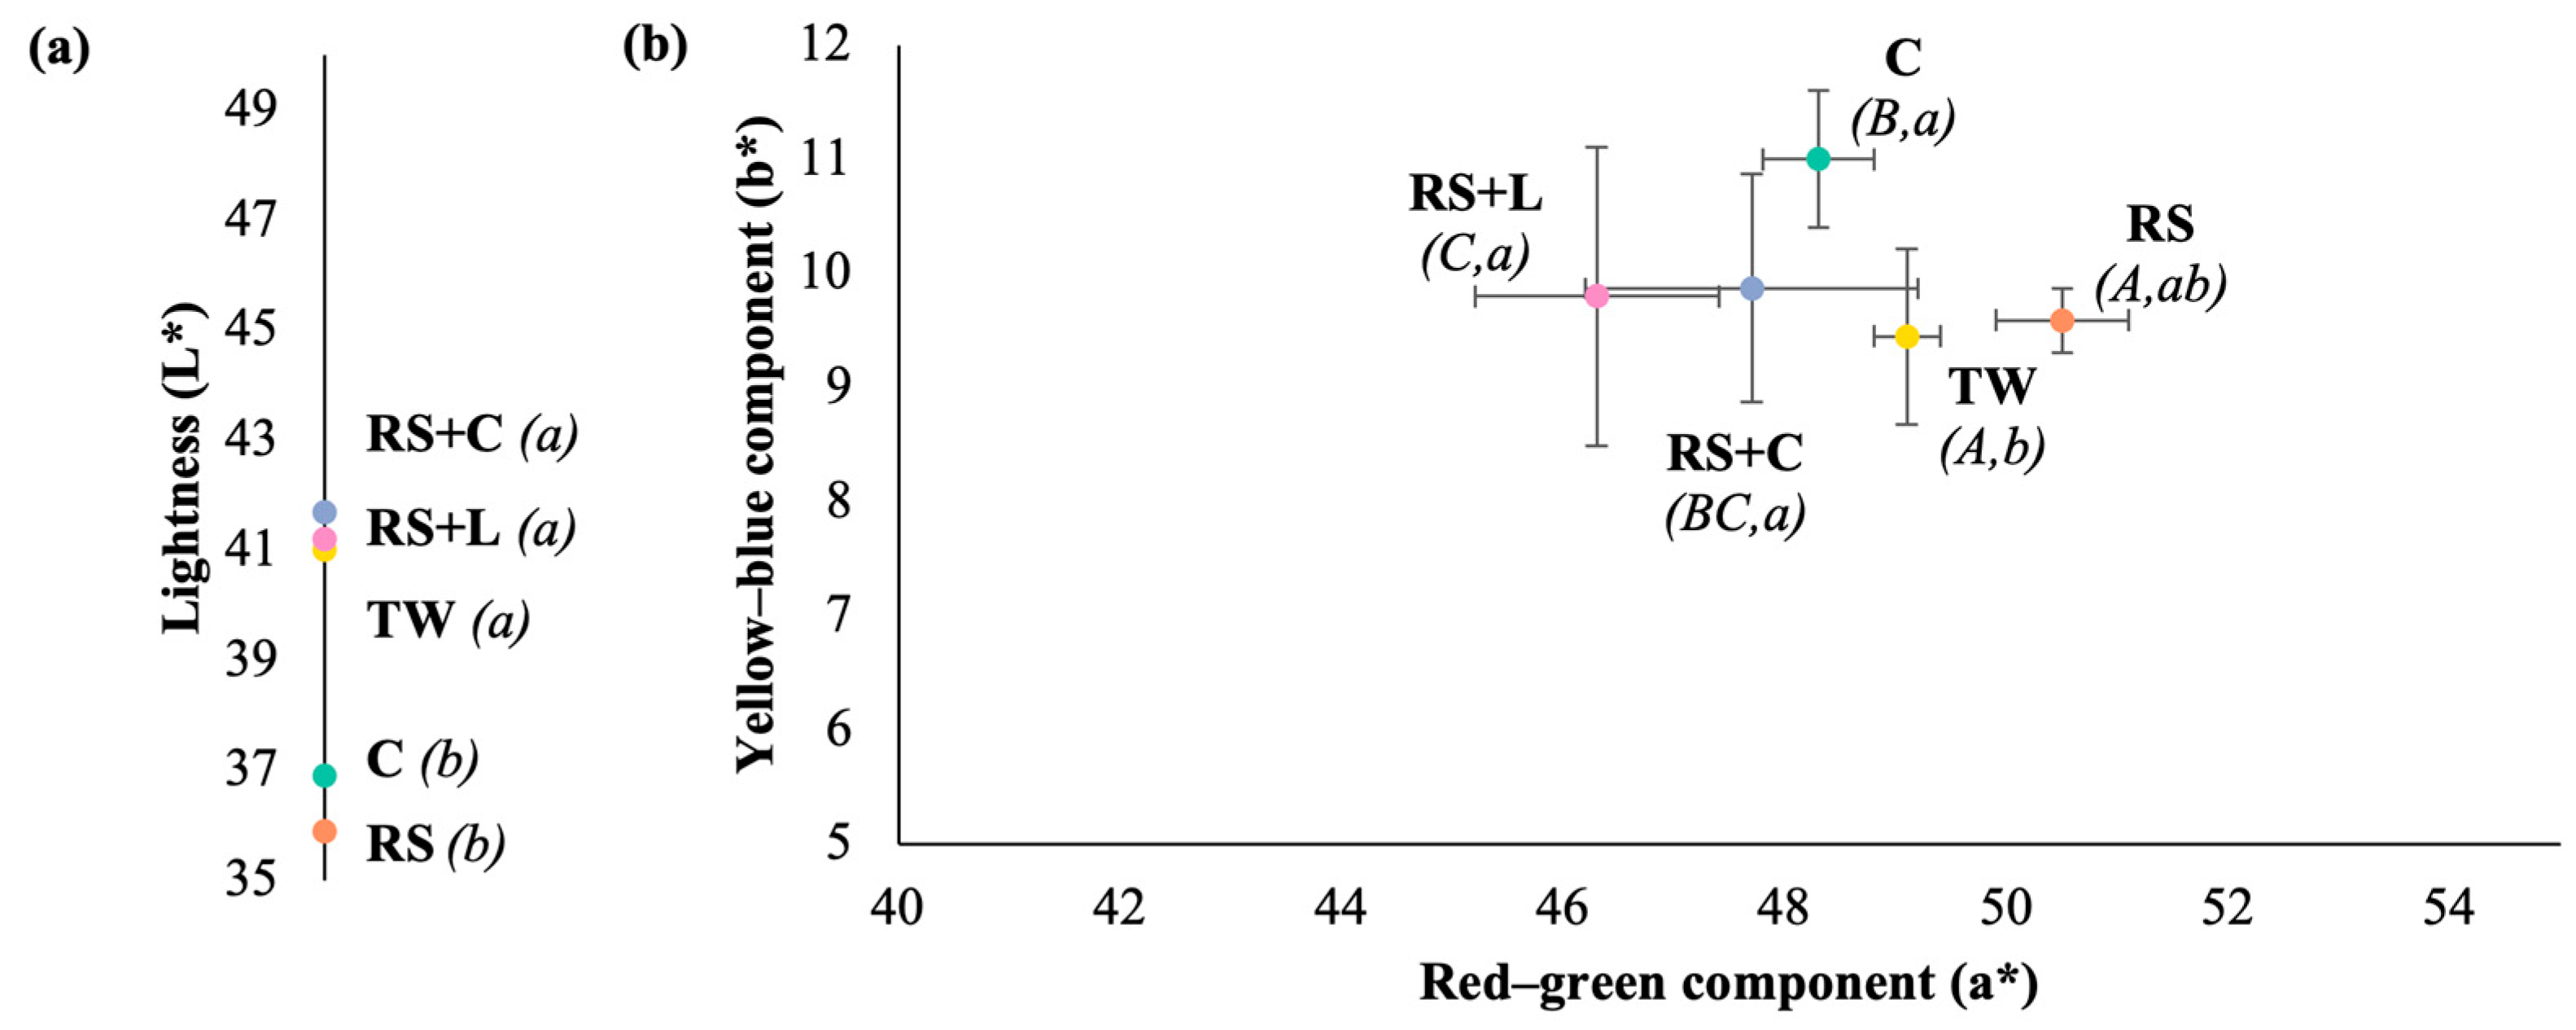
The colorimetric evaluation based on the CIELab parameters (L*, a* and b*) showed significant differences in the visual characteristics of the wines depending on the treatment (
Figure 5). The C and RS wines presented the lowest L* values (36.9 ± 0.5 and 35.9 ± 2.6, respectively), while TW, RS+L, and RS+C treatments showed highest L* values suggesting a lighter color. All samples showed positive values for a* and b* coordinates, confirming a chromatic profile dominated by red and yellow hue, respectively. The RS wines recorded the highest a* value, indicating a more intense red color, although it did not differ significantly from the TW wines. Regarding the b* coordinate, the C, RS+L and RS+C treatments showed the highest values, indicating a more pronounced yellow hue. In contrast TW treatment presented lower b* values, following by RS wines.
Chroma (C*ab) and hue angle (h ab) presented significant differences among treatments (
Table 5). The RS wines showed the highest chroma value (51.4 ± 0.6), indicating a more vivid and saturated color. This was followed by the TW (50.0 ± 0.4) and the C wines (49.5 ± 0.5), which were statistically similar. RS+L wines showed the lowest value (47.3 ± 1.4).
With respect to hue (h ab), values reached from 10.8 to 12.9, indicating variations in the perceived shade of color. The C wines showed the highest hue (12.9 ± 0.6). The remaining treatments showed lower values with no statistically significant differences from each other.
3.7. Tannat Wines Sensory Attributes
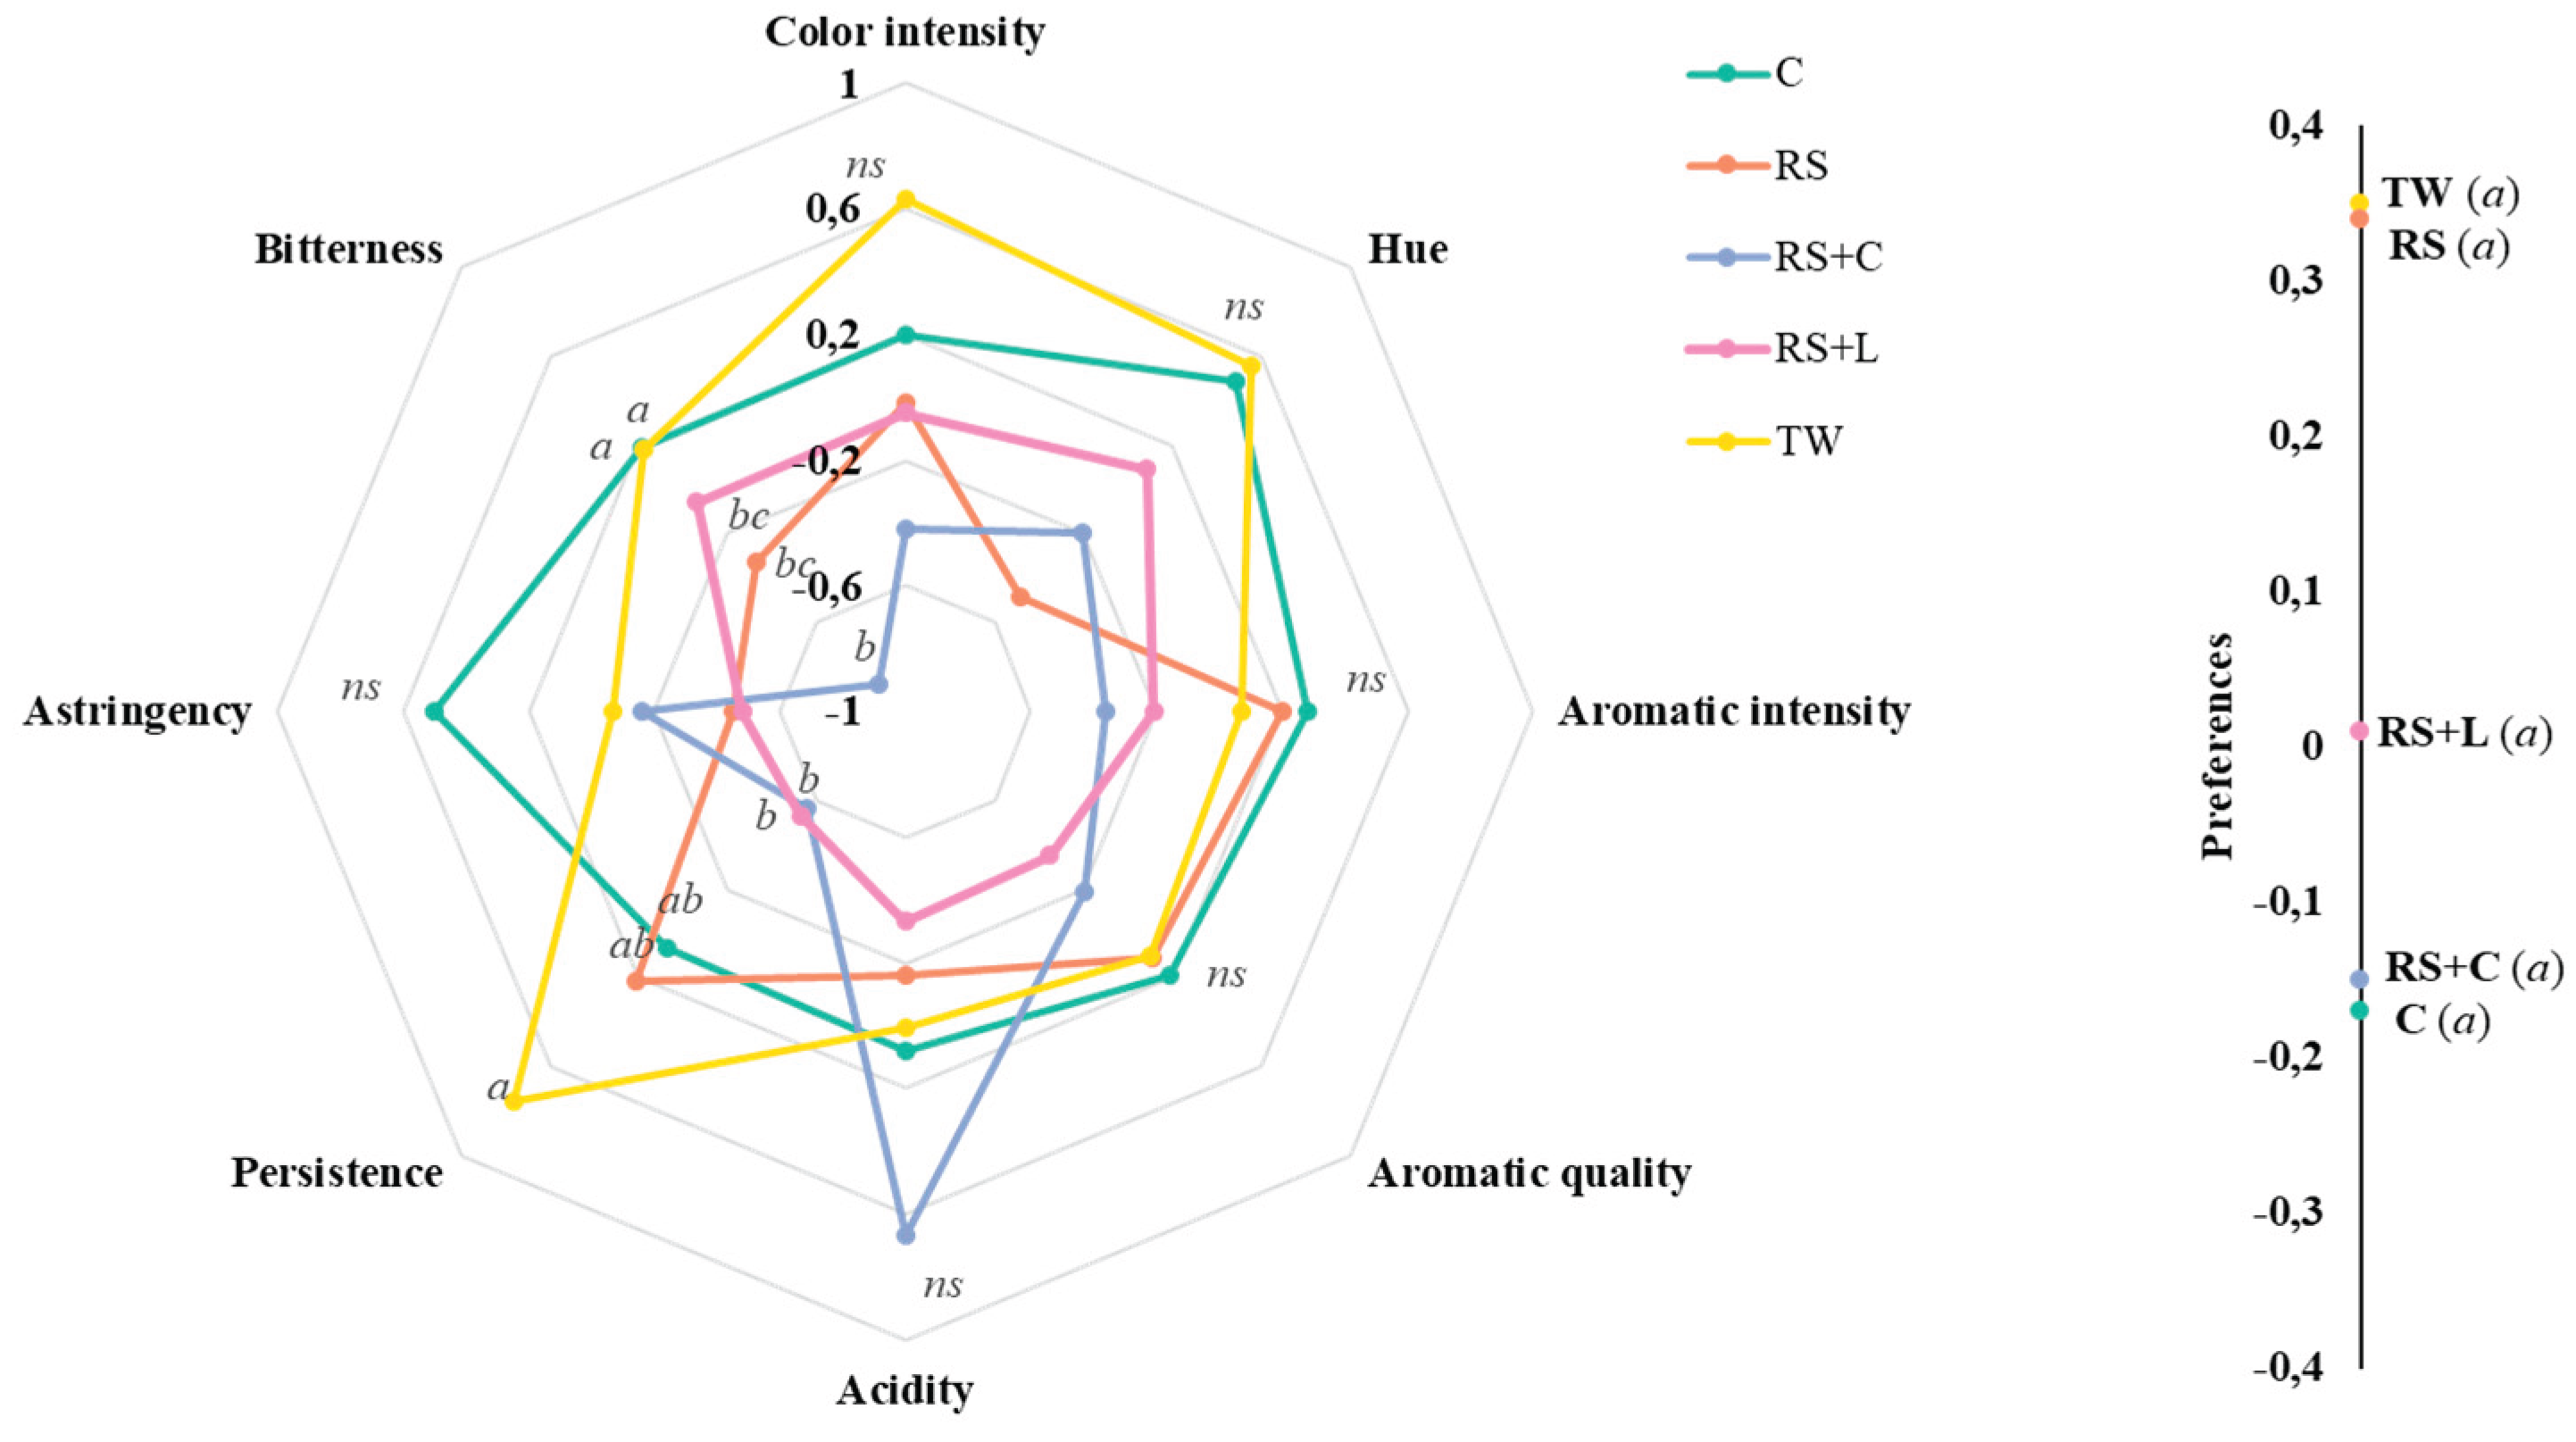
The sensory descriptive analysis revealed significant differences in several organoleptic attributes among the evaluated wine treatments (
Figure 6). Statistical analysis indicated significant differences (p < 0.05) among treatments for bitterness, and persistence. While, no significant differences were observed in color intensity, hue, aromatic intensity, aromatic quality, astringency, and acidity, indicating that these characteristics were perceived similarly across all treatments by the assessors.
TW wines consistently showed the highest color intensity and hue. C wines also achieved elevated values in color related attributes and aromatic intensity and quality, comparable to TW.
About wine persistence, TW wines showed the highest score, suggesting a longer-lasting flavor perception. RS+C and RS+L wines showed intermediate values across most attributes. However, RS+C showed the highest acidity without significant differences between other treatments.
The sensory preference evaluation showed no statistically significant differences among the treatments (
Figure 6). Mean preference scores were slightly higher for the TW and RS wines, while C and RS+C presented the lowest mean values.
4. Discussion
The evolution of density and temperature indicated that alcoholic fermentation proceeded rapidly and was completed in all treatments, with no statistically significant differences observed. This suggests that the selected yeast Saccharomyces spp. inoculated, colonize the must efficiently without altering fermentation kinetics, even in treatments C, RS, RS+C and RS+L, where no additives were added before fermentation. The SO₂ reduction or substitution strategies evaluated did not affect the completion of fermentation or the production of ethanol on a practical scale.
Microbial counts showed different responses depending on the treatment and stage of winemaking. The reduction in microbial populations after devatting and bottling in RS, RS+L and TW wines suggests that SO
2 has a selective effect on the survival of susceptible microorganisms, regardless of the dose used [
38]. In contrast, treatment with chitosan (C) maintained higher counts of yeasts and LAB at certain stages, suggesting that the fractional application of 100 mg/L was not completely effective in suppressing these microbial populations in all winemaking. This coincides with reports from other studies, which observed heterogeneous responses of microbial groups to chitosan depending on species, strain and dose [
39]. Chitosan may be effective against certain microorganisms such as
Brettanomyces spp. and some LAB, but its efficacy is variable and depends on the concentration and origin of the product [
40]. Similarly, the reduction in counts observed in RS+L compared to LAB supports the activity of lysozyme on Gram-positive bacteria, although the quantitative effects depend on the dose and the initial microbial composition [
41,
42].
The dynamics of bacterial communities observed among different vinification treatments reveal that SO
2 reduction and the use of antimicrobial strategies such as lysozyme and chitosan significantly affected microbial composition. The dominance of
Tatumella spp., AAB, and LAB in most treatments supports previous findings reporting these taxa as major constituents of the bacterial microbiota in wines [
43,
44].
The occurrence of
Tatumella spp. as a predominant genus in almost all treatments, is consistent with its known association with must and early fermentation stages treatments, especially under conditions favoring Proteobacteria [
45,
46]. A high abundance of AAB was observed in TW and C2 treatments, mainly
Gluconobacter and
Komagataeibacter. These bacteria can influence wine quality by producing acetic acid and other volatile compounds that contribute to spoilage [
47]. However, the count of these microorganisms was under the detection limits of the method and did not affect the physicochemical or sensory characteristics of the wines.
Conversely, treatments as RS and RS+L, showed a clear dominance of LAB, particularly
Oenococcus oeni,
Fructobacillus, and
Apilactobacillus. This pattern reflects the selective pressure of low sulfite levels and the presence of lysozyme. Treatments with reduced sulfite doses showed a clear increase in the relative abundance of LAB, compared with TW, particularly
Oenococcus oeni in RS1 and a greater proportion of
Apilactobacillus spp. and
Fructobacillus spp. in RS2. According to Prusova et al. (2023) [
48], alternative treatments with lower sulfite effectiveness showed greater LAB related metabolic activity, suggesting reduced inhibition. This pattern indicates that lowering sulfite levels favors the growth and persistence of indigenous LAB throughout winemaking. Therefore, the reduced sulfite doses tested in this study allowed the establishment of LAB populations able of running malolactic fermentation.
The addition of low doses of lysozyme with reduced sulfite (RS+L) resulted in a different outcome. In these wines, the relative abundance of
Oenococcus oeni was noticeably lower compared to the RS treatments, while
Apilactobacillus spp. and
Fructobacillus spp. became the dominant LAB genus. It should be noted that the LAB population in RS+L also decreased in terms of microbial counts. Lysozyme is known to target the peptidoglycan layer of Gram-positive bacteria, thereby limiting LAB growth [
49]. The RS+L treatments therefore moderate the growth of LAB populations despite reduced sulfite availability. This suggests that low doses of lysozyme can partially compensate for the decreased antimicrobial pressure when sulfite levels are lowered, helping to prevent excessive or premature LAB proliferation. As reported by Delfini et al. (2004) [
50], based on the composition of their cell wall, LAB show different degrees of sensitivity or resistance to lysozyme:
Oenococcus oeni is more sensitive than
Lactobacillus spp. and
Pediococcus spp., which are resistant even at high concentrations of lysozyme.
The predominance of
Oenococcus oeni in RS wines confirms its role in malolactic fermentation and wine stabilization [
51]. The detection of
Apilactobacillus spp. in RS+L wines where
Oenococcus oeni was not dominant is also significant. Members of this genus are facultatively heterofermentative and able to perform malolactic fermentation [
52]. Their presence suggests potential functional redundancy within LAB communities, which may ensure fermentation conclusion under stress conditions or alternative winemaking strategies. The occurrence of other LAB genera, especially in wines in which
Oenococcus oeni is not predominant, suggests the efficient adaptation to ethanol and low-pH conditions, of these genera [
53].
In contrast, RS+C treatment showed a distinct bacterial profile, with a notably higher richness and the presence of diverse genera such as
Cutibacterium,
Corynebacterium,
Pseudomonas, and
Sphingomonas. Chitosan is known to have broad-spectrum antimicrobial activity, particularly against Gram-negative bacteria, but its effect depends on pH and molecular structure [
49]. The heterogeneous microbiota detected could indicate partial inhibition of dominant taxa, allowing minor groups to proliferate. Similar results have been reported in studies evaluating chitosan as a microbial control agent in wine and other fermented beverages [
40,
54].
Results highlight that sulfur dioxide reduction and the use of antimicrobial substitutes significantly modify the bacterial composition of wines. Reduced sulfite alone promotes LAB dominance, which may facilitate earlier or spontaneous malolactic fermentation. By contrast, lysozyme addition in RS+L serves as a selective control strategy, maintaining LAB at moderate levels and potentially contributing to a more predictable fermentation progression and microbial stability. However, the higher diversity observed in chitosan wines warrants further investigation to determine its impact on wine stability and sensory characteristics.
Significant differences in ethanol content were observed, with wines from C treatment showing the highest values compared with RS, RS+L, and RS+C treatments. Similarly, wines from C treatment showed the highest pH values and the lowest titratable acidity. Variations in malic and lactic acid concentrations were also recorded depending on the treatment applied. The lower pH observed in RS and RS+C wines could be attributed to the higher activity of LAB, which produces lactic acid that lower the pH, resulting from the reduction in SO₂ doses [
55]. Additionally, the more oxidizing redox conditions associated with lower SO₂ levels could have altered the ionic and acid-base balance of the medium, promoting a slight acidification of the wine [
56]. The increase in lactic acid observed in the RS+C and RS+L treatments suggests partial malolactic fermentation occurred during storage, as indicated by the higher LAB count. In contrast, TW wines showed a higher malic acid content and lower lactic acid content, indicating less advanced malolactic fermentation due to the higher total SO₂ dose used. The higher residual glucose content in RS+C wines could indicate lower fermentation efficiency, however, given that the recorded values are low, it can be concluded that this has no practical effect on the composition of the wine [
8].
The treatments applied had a significant effect on the total concentration of phenolic compounds, anthocyanins and tannins in the wines. TW wines had the highest levels of these compounds, while RS+C wines had the lowest concentrations. These differences can be attributed to the antioxidant function of SO₂, which protects anthocyanins and tannins from oxidation and degradation reactions, while promoting their involvement in controlled polymerizations that stabilize color [
56]. In contrast, reducing the SO₂ content increases the exposure of phenols to oxidative and condensation processes, thus promoting their transformation or loss [
58]. Furthermore, the increased presence and metabolic activity of microorganisms in wines with low SO₂ levels can facilitate processes such as the action of microbial laccases and peroxidases that alter the extraction, transformation and stability of phenolic compounds during winemaking and ageing [
38,
59].
Using chitosan also reduced the concentration of anthocyanins and tannins, as this polysaccharide interacts with phenolic compounds through adsorption or coagulation, followed by precipitation. This process removes some of the compounds from the liquid phase [
60,
61]. Additionally, the higher microbial diversity detected in RS+C may have facilitated enzymatic or non-enzymatic reactions that intensified the loss of phenols compounds. In the case of RS+L wines, the intermediate values of total phenols, anthocyanins and tannins compared to TW and RS+C suggest a moderate effect of lysozyme on phenolic stability. The partial antibacterial action of lysozyme, which is mainly directed at LAB, may limit the release of β-glucosidase enzymes that are responsible for the degradation of anthocyanins [
62]. However, it has also been reported that lysozyme can interact directly with polyphenols to form protein-phenol complexes that precipitate or reduce the quantifiable free fraction [
63]. Regarding the anthocyanin profile, the results reveal qualitative differences indicating the interaction between the antioxidant effect of SO₂, the action of additives, and microbial dynamics.
Although the RS+C treatment had the lowest concentration of total phenols, it presented the highest relative percentage of malvidin. Meanwhile, RS showed a higher proportion of comarylated anthocyanins. This behavior indicates that the treatments selectively modify the anthocyanin profile of the wine. In wines containing chitosan, it could be differential adsorption of anthocyanins and tannins via electrostatic and hydrogen bonding reduces the free pigment fraction and modify their relative proportions [
60,
61]. In contrast, a decrease in SO₂ provides less protection against oxidation, promoting the degradation of less stable anthocyanins or their conversion into less colored polymeric pigments, as discussed above [
57,
58].
The differences in the analyzed chromatic parameters are a consequence of the changes in anthocyanin and tannin concentrations in the wines. RS and C wines had a lower L*, while RS wines had a higher a* value, although not significantly different to TW wines. This may be due to a higher proportion of anthocyanins or the preservation of colored species in these treatments. In contrast, RS+C wines, which presented greater anthocyanin loss, showed higher lightness and lower chroma. The antioxidant function of SO₂ includes reducing quinones and preventing reactions that lead to the formation of less coloring pigment [
64]. The reduction of SO₂, combined with the possibility of a physicochemical interaction with chitosan, would explain the color variations observed. Similar results were observed in the RS+L wines, which exhibited the least color on the red-green component.
Sensory analysis revealed significant differences in only two parameters: bitterness and persistence. The absence of significant differences in preference suggests that, despite the physicochemical and microbial alterations detected, the panelists’ overall perceptions did not indicate a preference for any treatment. The greater persistence and slightly higher TW scores for certain attributes could be associated to a higher tannin and total phenolic compound content. These compounds are associated with wine structure. The greater bitterness observed in TW and C wines may be related to changes in the origin of tannins or microbial degradation products. In practical terms, this suggests that alternative strategies such as RS+L or RS+C wines may produce detectable sensory changes in specific attributes without necessarily leading to lower acceptability by trained tasters.
5. Conclusions
The results of this study show that the tested strategies for reducing or replacing SO₂ significantly affect the microbiological, physicochemical and phenolic composition of Tannat wines.
In terms of microbiology, alcoholic fermentation occurred as expected in all treatments, suggesting that the evaluated strategies (chitosan, lysozyme, and reduced doses of SO₂) did not impact the fermentative activity of Saccharomyces cerevisiae. However, the post-fermentation microbial dynamics were different. The treatments that included sulfur dioxide showed a marked reduction in lactic acid bacteria populations after bottling. In contrast, those incorporating chitosan or lysozyme maintained, at the same stage, levels of these microorganisms similar to the traditional winemaking wines. Metagenomic analysis revealed lower bacterial diversity in wines treated with sulfur dioxide, whereas wines containing chitosan presented a more complex microbiota. Treatments including lysozyme caused a selective reduction in lactic acid bacteria, primarily affecting Oenococcus spp. Partial malolactic fermentation was observed with reduced doses of sulfur dioxide in combination with chitosan or lysozyme. These results highlight the impact of antimicrobial strategies on bacterial activity and the acid balance of wine, potentially influencing its sensory profile and biological stability.
Reducing sulfur dioxide increased the susceptibility of phenolic compounds to oxidation and condensation processes, whereas adding chitosan could promote interactions that reduced the concentration of anthocyanins and tannins. Low doses of lysozyme could promote the formation of protein-phenol complexes that may have decreased their concentration. These changes were observed in the colorimetric parameters.
The results suggest that strategies aimed at reducing or replacing sulfites in wines affect not only microbiota and its dynamics during winemaking, but also the acidity, phenolic structure and color. While the evaluated strategies proved to be technologically viable, careful process management is required, particularly regarding microbiological control and phenolic stability, to preserve the sensory quality and varietal identity of the wine.
Figure 1.
Experimental design.
Figure 1.
Experimental design.
Figure 2.
Evolution of density (g/L) and temperature (°C) in Tannat must during alcoholic fermentation by treatment. The solid line represents density, while the dashed line corresponds to temperature. ns indicates the absence of significant differences among the treatments evaluated according to Tukey’s test (α ≤ 0.05). C refers to chitosan, RS to reduce sulfur dioxide, RS+C to reduce sulfur dioxide and chitosan, RS+L to reduce sulfur dioxide and lysozyme, and TW to traditional winemaking.
Figure 3.
Relative abundances of bacterial community for Tannat wines after bottling stage. Columns represents a replicate (1 and 2) sample obtained from each treatment (C, RS, RS+L, RS+C) and traditional winemaking wine (TW). The most abundant bacterial groups are shown at (a) and at genus level (b). The category “Other” includes taxa that were either unclassified at the genus level or classified genera with very low relative abundance.
Figure 4.
Phenolic compounds of Tannat wines by treatment. Means with different letters indicate significant differences among the evaluated treatments according to Tukey’s test (α ≤ 0.05). C refers to chitosan, RS to reduce sulfur dioxide, RS+C to reduce sulfur dioxide and chitosan, RS+L to reduce sulfur dioxide and lysozyme, and TW to traditional winemaking.
Figure 5.
Lightness (a) and distribution of Tannat wines in the CIELAB a*–b* plane (b) by treatment. Means with lowercase letters indicate significant differences in lightness (L*) and the yellow–blue component (b*) according to Tukey’s test (α ≤ 0.05). Means with uppercase letters indicate significant differences in the red–green component (a*) according to Tukey’s test (α ≤ 0.05). C refers to chitosan, RS to reduce sulfur dioxide, RS+C to reduce sulfur dioxide and chitosan, RS+L to reduce sulfur dioxide and lysozyme, and TW to traditional winemaking.
Figure 6.
Sensory attributes. Means with different letters indicate significant differences in persistence and bitterness according to Tukey’s test (α ≤ 0.05). ns indicates the absence of significant differences among the treatments evaluated according to Tukey’s test (α ≤ 0.05). C refers to chitosan, RS to reduce sulfur dioxide, RS+C to reduce sulfur dioxide and chitosan, RS+L to reduce sulfur dioxide and lysozyme, and TW to traditional winemaking.
Table 1.
Microbial population dynamics in Tannat wines during vinification stages under different treatments.
Table 1.
Microbial population dynamics in Tannat wines during vinification stages under different treatments.
| Microbial count |
Analysis stage |
Treatments |
|
| (c.f.u./ml) |
C |
RS |
RS+C |
RS+L |
TW |
| Total aerobic count |
Vatting |
7,11 ± 0,77 a
|
7,56 ± 0,01 a
|
7,11 ± 0,77 a
|
7,56 ± 0,01 a
|
6,28 ± 0,15 b
|
| Before devatting |
7,00 ± 0,47 b
|
6,67 ± 0,23 b
|
7,00 ± 0,47 b
|
6,67 ± 0,23 b
|
7,67 ± 0,01 a
|
| After devatting |
5,59 ± 0,02 a
|
- |
2,74 ± 0,37 b
|
- |
- |
|
Afterbottling
|
- |
- |
- |
- |
- |
| Storage |
- |
- |
- |
- |
- |
| Yeast |
Vatting |
7,24 ± 0,03 a
|
7,24 ± 0,02 a
|
7,24 ± 0,03 a
|
7,24 ± 0,02 a
|
7,32 ± 0,14 a
|
| Before devatting |
7,14 ± 0,15 a
|
6,92 ± 0,32 a
|
7,14 ± 0,15 a
|
6,92 ± 0,32 a
|
7,63 ± 0,18 a
|
| After devatting |
5,07 ± 0,10 a
|
1,00 ± 0,10 b
|
1,00 ± 0,10 b
|
1,00 ± 0,10 b
|
1,00 ± 0,10 b
|
|
Afterbottling
|
1,60 ± 0,10 a
|
1,00 ± 0,10 b
|
1,70 ± 0,10 a
|
1,66 ± 0,26 a
|
1,15 ± 0,21 ab
|
| Storage |
3,34 ± 0,31 a
|
2,58 ± 0,25 b
|
3,65 ± 0,77 a
|
3,09 ± 0,73 a
|
3,52 ± 0,06 a
|
| Lactic acid bacteria |
Vatting |
6,03 ± 0,17 a
|
5,70 ± 0,05 a
|
6,03 ± 0,17 a
|
5,70 ± 0,06 a
|
6,12 ± 0,41 a
|
| Before devatting |
3,80 ± 0,28 a
|
4,06 ± 0,08 a
|
3,80 ± 0,28 a
|
4,06 ± 0,08 a
|
3,00 ± 0,10 a
|
| After devatting |
2,08 ± 0,34 b
|
3,31 ± 0,15 a
|
2,48 ± 0,10 b
|
2,48 ± 0,10 b
|
1,59 ± 0,16 b
|
|
Afterbottling
|
3,37 ± 0,04 b
|
4,48 ± 0,10 a
|
1,95 ± 0,10 c
|
1,70 ± 0,10 c
|
1,30 ± 0,43 c
|
| Storage |
2,58 ± 0,37 b
|
2,25 ± 0,26 b
|
3,07 ± 0,71 a
|
3,01 ± 0,64 a
|
- |
| Acetic acid bacteria |
Vatting |
3,72 ± 0,36 a
|
3,72 ± 0,36 a
|
3,72 ± 0,36 a
|
3,72 ± 0,36 a
|
4,06 ± 0,27 a
|
| Before devatting |
- |
- |
- |
- |
- |
| After devatting |
- |
- |
- |
- |
- |
|
Afterbottling
|
- |
- |
- |
- |
- |
| Storage |
- |
- |
- |
- |
- |
Table 2.
Summary of Illumina sequencing data, ASVS richness, sample coverage and indices (Shannon and Chao1) for bacterial 16S rDNA libraries from Tannat wines.
Table 2.
Summary of Illumina sequencing data, ASVS richness, sample coverage and indices (Shannon and Chao1) for bacterial 16S rDNA libraries from Tannat wines.
| |
Treatments |
| |
C |
RS |
RS+C |
RS+L |
TW |
| |
1 |
2 |
1 |
2 |
1 |
2 |
1 |
2 |
1 |
| Raw reads |
109816 |
179059 |
183538 |
175799 |
180056 |
184566 |
130254 |
185791 |
165553 |
| ASVs |
94 |
294 |
132 |
37 |
608 |
351 |
165 |
167 |
181 |
| % reads assigned at genus level |
0,995 |
0,993 |
0,999 |
1 |
0,893 |
0,938 |
0,999 |
0,997 |
0,997 |
| Number of genus |
54 |
124 |
73 |
15 |
233 |
141 |
107 |
103 |
102 |
| Shannon diversity index |
1,59 |
2,58 |
0,59 |
1,64 |
5,25 |
4,37 |
1,73 |
1,52 |
2,00 |
| Chao1 richness index |
94 |
294 |
133 |
36 |
611 |
352 |
166 |
164 |
183 |
Table 3.
General analytic parameters of Tannat wines by treatment.
Table 3.
General analytic parameters of Tannat wines by treatment.
| Analytical parameter |
Treatments |
| C |
RS |
RS+C |
RS+L |
TW |
| Ethanol (% V/V) |
13,1 ± 0,2 a
|
12,6 ± 0,1 b
|
12,7 ± 0,3 b
|
12,6 ± 0,1 b
|
12,8 ± 0,2 ab
|
| pH |
3,89 ± 0,01 a
|
3,73 ± 0,03 c |
3,76 ± 0,02 c
|
3,81 ± 0,03 b
|
3,85 ± 0,02 b
|
| Titratable acidity (g/L) |
3,57 ± 0,08 b
|
3,97 ± 0,12 ab
|
4,32 ± 0,79 a
|
3,62 ± 0,16 b
|
3,57 ± 0,08 b
|
| Malic acid (g/L) |
1,53 ± 0,05 cd
|
1,97 ± 0,08 b
|
1,73 ± 0,34 bc
|
1,42 ± 0,12 d
|
2,30 ± 0,09 a
|
| Lactic acid (g/L) |
1,78 ± 0,04 b
|
1,58 ± 0,10 b
|
2,50 ± 0,43 a
|
2,23 ± 0,08 a
|
1,18 ± 0,17 c
|
| Volatile acidity (g/L) |
0,43 ± 0,02 a
|
0,44 ± 0,07 a
|
0,47 ± 0,10 a
|
0,46 ± 0,04 a
|
0,33 ± 0,04 a
|
| Fructose (g/L) |
0,95 ± 0,14 a
|
0,98 ± 0,08 a
|
0,82 ± 0,19 a
|
0,90 ± 0,14 a
|
0,97 ± 0,10 a
|
| Glucose (g/L) |
1,80 ± 0,11 d
|
2,32 ± 0,12 c
|
3,20 ± 0,23 a
|
2,77 ± 0,19 b
|
1,57 ± 0,08 d
|
| Glucose/Fructose ratio |
2,40 ± 0,18 a
|
2,17 ± 0,16 a
|
1,25 ± 0,10 c
|
1,72 ± 0,38 b
|
2,27 ± 0,18 a
|
Table 4.
Anthocyanins profile of Tannat wines by treatment.
Table 4.
Anthocyanins profile of Tannat wines by treatment.
| Anthocyanins profile (%) |
Treatments |
| C |
RS |
RS+C |
RS+L |
TW |
| Non-acylated anthocyanins |
82,8 ± 0,2 ab
|
80,6 ± 1,1 d
|
83,8 ± 0,5 a
|
82,3 ± 0,9 abc
|
80,9 ± 0,1 cd
|
| Acetylated anthocyanins |
17,0 ± 0,2 cd
|
19,4 ± 0,9 a
|
16,2 ± 0,5 d
|
17,6 ± 0,9 bcd
|
18,7 ± 0,1 ab
|
| Comarylated anthocyanins |
0,19 ± 0,01 bc
|
0,61 ± 0,25 a
|
0,03 ± 0,03 c
|
0,11 ± 0,13 bc
|
0,37 ± 0,04 ab
|
| Delphinidin |
2,20 ± 0,17 ab
|
3,00 ± 0,47 a
|
0,95 ± 0,24 c
|
1,27 ± 0,60 bc
|
2,50 ± 0,11 a
|
| Cyanidin |
- |
- |
- |
- |
- |
| Petunidin |
7,00 ± 0,29 a
|
7,79 ± 0,63 a
|
4,89 ± 0,33 b
|
5,35 ± 0,67 b
|
6,85 ± 0,20 a
|
| Peonidin |
1,06 ± 0,11 bc
|
1,90 ± 0,33 b
|
0,73 ± 0,50 c
|
0,80 ± 0,32 c
|
2,76 ± 0,14 a
|
| Malvidin |
89,7 ± 0,6 bc
|
87,3 ± 1,3 c
|
93,4 ± 1,1 a
|
92,6 ± 1,6 a
|
87,9 ± 0,3 c
|
Table 5.
Chroma (C*ab) and Hue (h ab) in Tannat wines by treatment.
Table 5.
Chroma (C*ab) and Hue (h ab) in Tannat wines by treatment.
| Color parameter |
Treatments |
| C |
RS |
RS+C |
RS+L |
TW |
| C*ab |
49,5 ± 0,5 b
|
51,4 ± 0,6 a
|
48,7 ± 1,7 bc
|
47,3 ± 1,4 c
|
50,0 ± 0,4 ab
|
| h ab |
12,9 ± 0,6 a
|
10,8 ± 0,3 b
|
11,7 ± 0,9 ab
|
11,9 ± 1,3 ab
|
10,9 ± 0,8 b
|