
Submitted:
17 December 2025
Posted:
18 December 2025
You are already at the latest version
Abstract
Objective: To address the long-standing problems of "subjectivity, lack of standards for special groups, and poor cross-scenario adaptability" in the traditional evaluation of nature bias (cool-warm property) of plant-derived food materials, this study aimed to construct a full-scenario quantitative tool applicable to both "daily dietary" and "medicinal" scenarios.Methods: A three-dimensional framework integrating the "environmental habits-metabolic characteristics-growth cycle" was established. The core indicator thresholds of each dimension, exclusive correction rules for special groups (fungi, parasitic plants, lichens, high-altitude plants), and cross-dimensional arbitration logic were clarified. The feasibility of the system was verified using 485 core plant-derived samples, which were stratified and selected from a total sample library of 987 species (417 daily plant food materials + 570 Chinese medicinal materials). The core samples covered 4 categories of daily food materials, 4 special groups of Chinese medicinal materials, and 3 types of extreme habitats based on "biological group + ecotype".Results: The system covered more than 95% of common plant groups used in daily life and medicine. The consistency rate between daily food materials and traditional literature on "warm-cool nature" reached 98%, and the consistency rate of special groups of Chinese medicinal materials after correction reached 96% (with intensity error ≤15% for partially consistent samples). The repeated detection error rate was ±3.2% (excluding neutral food materials). Core indicator thresholds were cross-validated by authoritative references such as FAO Guidelines and international journals, which were consistent with the "environment-metabolism synergy" logic. The adaptability rate to nondeep-sea extreme habitats (high altitude, saline‒alkali land, extreme acidity) was 100%, which could explain the differences in the natural bias of medicinal materials from genuine producing areas.Limitations: Only deep-sea kelp showed deviations due to the lack of a multifactor model, and supplementary optimization with various deep-sea samples is planned.Conclusions: This three-dimensional quantitative evaluation system achieves a key breakthrough in the nature bias of plant-derived food materials from "qualitative description" to "quantitative calculation". It is not only suitable for the balanced matching of nature bias in daily dietary therapy but also supports the standardized determination of nature bias of medicinal plants, laying a rule foundation for subsequent extended studies such as the correlation between nature bias and efficacy of Chinese medicinal materials and scenario optimization for deep-sea/genetically modified plants.
Keywords:
traditional chinese medicine nutrition
; plant-derived food materials
; nature bias quantification
; three-dimensional evaluation system
; environment-metabolism synergy
; dietary matching
1. Introduction
The nature bias of plant-derived food materials (corresponding to the traditional cognition of "cold nature" and "hot nature", i.e., Yin-tendency (cool/cold) or Yang-tendency (warm/hot) properties) has its theoretical origin in the TCM Yin-Yang theory. As the core framework for TCM to understand life and nature, Yin-Yang theory holds that Yang governs warmth, activity, and dispersion, while Yin governs coolness, tranquility, and convergence. The "four natures" (warm, hot, cool, cold) are the embodied gradient expressions of Yin-Yang in food material properties: warm-hot categories belong to Yang, which can regulate Yang imbalance in the body through warming the interior to dispel cold and tonifying middle Qi to benefit Qi; cool-cold categories belong to Yin, which can improve Yin insufficiency by clearing heat to purge fire and nourishing Yin to moisten dryness. This association between "Yin-Yang and four natures" is the core theoretical basis for TCM dietary compatibility, traditional Chinese medicinal dosage regulation, and directional planting of agricultural products, running through the entire process of traditional food and medicinal application.
In typical scenarios, differences in nature bias intensity directly affect application safety: Zingiber officinale (ginger) has a volatile oil content of 2.2% [6], with significant warm effects, and excessive consumption may easily lead to "Yang excess"; Ziziphus jujuba (jujube) has only 0.8% Yang-tendency components (such as jujuboside) [8], with weak Yang properties, making it more suitable for mild daily tonification. In the medicinal scenario, the content of Yin-tendency components such as flavonoids in Fritillaria cirrhosa (tendrilled fritillary bulb) from high-altitude areas (>3000 m) is 25% higher than that of plain populations [9]. This difference is not only the key to judging the quality of genuine medicinal materials [1,9] but also directly related to the strength of clinical anti-inflammatory efficacy, highlighting the practical value of nature bias quantification.
However, traditional nature bias evaluation has long relied on qualitative descriptions in the Compendium of Materia Medica [2] and Pharmacopoeia of the People’s Republic of China (2020 Edition, Volume I) [1], failing to fully connect with the deep logic of "Yin-Yang and four natures", resulting in three major practical pain points. First, it is highly subjective and lacks quantitative standards. It only divides categories by "warm/hot/cool/cold", unable to distinguish the nature bias gradient within the same attribute (e.g., both ginger and jujube are "warm nature", but the difference in volatile oil content cannot be reflected), leading to a lack of basis for regulating "Yin-Yang balance" in dietary therapy and higher risks for people with sensitive constitutions. Second, there is a blank in the evaluation of special groups. Due to their special biological characteristics, fungi (e.g., Ganoderma lucidum with 7.2% polysaccharides [5]), parasitic plants (e.g., Cistanche deserticola), and other groups have no Yin-Yang attribution logic or metabolism-nature bias correlation rules in the traditional system, and the flavonoid accumulation of high-altitude Fritillaria cirrhosa affected by UV radiation is not considered. Third, cross-scenario adaptability is poor. Habitat differences of the same species lead to shifts in Yin-Yang properties (e.g., Lycium barbarum from Zhongning, Ningxia has 5.0% polysaccharides [16] showing "extremely weak Yang-tendency", while Lycium barbarum from Qaidam, Qinghai has increased flavonoids due to UV radiation, with polysaccharides reduced to 4.2% [9], and its nature bias is nearly neutral). Traditional evaluation ignores habitat regulation, resulting in no standards for the procurement of genuine medicinal materials and frequent improper planting by farmers.
Existing quantitative studies mostly focus on a single dimension, failing to touch the core logic of "Yin-Yang and four natures": some only determine nature bias by metabolic components (flavonoids, volatile oil) [6], ignoring the impact of habitat on Yin-Yang properties; others only consider habitat factors (soil moisture, altitude) [4], without associating the dominant role of metabolism in attribute intensity. A 2023 study by Wang et al. in Plant Ecology pointed out that the environment determines 70% of the nature bias direction, metabolism dominates the intensity, and growth makes fine adjustments [4,6,8], so a single dimension cannot cover the complete mechanism; moreover, evaluation rules for scenarios such as extreme habitats, deep-sea areas, and genetically modified plants are still lacking. Although the 2023 study by Wang et al. in Plant Ecology noted the synergistic effect of environment and metabolism, it did not integrate the growth dimension and special group correction rules and was still unable to cover the complete nature bias determination mechanism. In addition, evaluation rules for practical application scenarios such as extreme habitats, deep-sea areas, and genetically modified plants are still missing, further highlighting the necessity of the three-dimensional system in this study. Meanwhile, this system is deeply connected with TCM "Yin-Yang and four natures" theory: environmental factors correspond to the "spatial benchmark of Yin-Yang properties", metabolic components correspond to the "material basis of four natures intensity", and growth characteristics correspond to the "temporal fine-tuning of Yin-Yang balance", ensuring that the quantitative tool does not deviate from the core of traditional theory.
It should be specifically noted that there is an essential difference between the three-dimensional system of this study and the evaluation logic of animal-derived food materials: in the animal-derived system, the contribution rate of metabolic activity (body temperature, respiratory rate) exceeds 50%, while the plant-derived system is centered on "environment-metabolism synergy"—the environment (40%) determines Yin-Yang attribution, metabolism (40%) enhances attribute intensity, and growth (20%) only makes fine adjustments [7]. This weighting framework is adopted from the author’s previous three-dimensional system for animal-derived food materials [17], and only the dimension indicators are fine-tuned based on the characteristics of plants "relying on habitats and lacking active activities" (e.g., plant-derived metabolism focuses on secondary metabolites) to ensure cross-group adaptability.
Based on this, this study integrates habitat, metabolism, and growth data of 987 plant-derived samples, selects 485 core samples to construct a three-dimensional quantitative system, clarifies indicator thresholds, special group rules, and arbitration logic, and ultimately achieves three major goals: ① Provide a "calculable, repeatable, and promotable" nature bias quantitative tool to fill the gaps in special groups and nondeep-sea extreme scenarios; ② Verify the adaptability of "daily dietary-medicinal" dual scenarios to lay the foundation for subsequent related research; ③ Promote the leap of nature bias evaluation from "empirical cognition" to "scientific quantification". The annual sunshine in habitat data adopts the 2019-2023 average value from the China Meteorological Administration CMA-REOF v2.0 database [11], and the high-altitude correction rules refer to Alpine Plant Ecology [9] to ensure a traceable scientific basis.
2. Materials and Methods
2.1. Research Objects and Data Sources
2.1.1. Selection and Classification of Plant-Derived Food Materials
A total sample library of 987 plant-derived species was constructed, including 417 daily plant food materials and 570 Chinese medicinal materials, covering 10 biological groups, such as leafy vegetables, fungi, and parasitic plants. Based on the principle of "biological attributes as the main basis and ecotypes as supplements", 485 core validation samples were selected (370 daily food materials + 115 Chinese medicinal materials) to avoid sampling bias.
Screening logic for daily food materials: Focusing on "long-term consumption safety", only species included in the National Health Commission’s Directory of Medicinal and Edible Homologous Foods (2023) and common varieties (e.g., Triticum aestivum, Solanum lycopersicum) were incorporated; medicinal and edible homologous species grown at high altitudes (e.g., Lycium barbarum from Qaidam, Qinghai) were labeled with habitats without changing their biological group attribution.
Classification logic for medicinal plants: Classified into biological groups by "heterotrophic/parasitic/symbiotic/common" and simultaneously labeled with ecotypes such as "high-altitude (>3000 m)/saline-alkaline land (pH 8.5-10.0)/extreme acidity (pH<4.0)"; purely medicinal species (e.g., Coptis chinensis) were excluded from daily food material classification to ensure clear functional positioning.
2.1.2. Data Sources and Detection Basis
All data were obtained through "cross-validation of public literature + citation of authoritative standards + database retrieval", without unpublished data from independent laboratories to ensure research reproducibility. Data precision was uniformly retained to 3 significant figures in accordance with the rules of rounding for significant figures, and core parameters of key detection methods were supplemented. Details are shown in Table 2.
2.1.3. Core Data Traceability and Sample Quality Control
To ensure traceability of key data, the sources of core parameters are detailed in Table 3; sample selection and quality control strictly follow the following rules to avoid bias.
Data quality control measures: a. Cross-validation: Each parameter is cited from ≥2 independent studies; b. Outlier processing: Outliers are excluded by "mean ± 3 standard deviations" for normal distribution and "median ± 1.5 interquartile range" for skewed distribution; c. Temporal and spatial correction: Meteorological data adopt the 2019-2023 average, and literature published between 2014-2024 is preferred.
2.2. Construction of the Three-Dimensional Evaluation System
2.2.1. Core Logical Framework of the System
① The three-dimensional evaluation system takes "environment determines direction, metabolism dominates intensity, growth makes fine adjustments, and metabolism leads in conflict" as the core logic. All rules are verified based on the literature to avoid subjective assignment, and terms are unified as follows:
Nature bias direction: "Yang-tendency (warm/hot)" corresponds to traditional "warm/hot" (belonging to Yang), "Yin-tendency (cool/cold)" corresponds to traditional "cool/cold" (belonging to Yin), and "Neutral-tendency" corresponds to traditional "neutral nature" (Yin and Yang tend to balance);
Directional coefficient: Yang tendency = +1, Neutral tendency = 0, Yin tendency = -1;
Intensity grading: Yang-tendency/Yin-tendency are divided into 4 grades based on the absolute value of the total three-dimensional score (1-3 points = extremely weak, 4-5 points = weak, 6-7 points = moderate, 8-10 points = strong). The larger the absolute value is, the stronger the nature bias.
② The functional positioning of each dimension is clear:
Environmental habits dimension: As the "spatial benchmark", it determines 70% of the decision-making weight for nature bias direction (e.g., arid habitats tend to be Yang-tendency, high-humidity habitats tend to be Yin-tendency), with core indicators including soil moisture, annual sunshine duration, and habitat pH;
Metabolic characteristics dimension: As the "intrinsic essence", it dominates nature bias intensity (e.g., high volatile oil enhances Yang-tendency, high flavonoids enhance Yin-tendency), with core indicators including photosynthetic type and secondary metabolites;
Growth cycle dimension: As the "temporal fine-tuning", it finely adjusts nature bias intensity through parameters such as growth rate and cycle (e.g., slow-growing plants slightly enhance Yin-tendency) without changing the direction;
Conflict arbitration: When the environmental and metabolic dimensions have opposite directions and significant intensity differences, the metabolic dimension is prioritized to ensure that nature bias is consistent with the material basis.
2.2.2. Basic Weight Setting and Verification
The weight framework is determined based on the following: ① Referring to the weight ratio of the 2020 Food & Function research on multidimensional evaluation of plant properties [7]; ② Verifying through preexperiments with 100 representative samples (SPSS 26.0 statistics), the "environment 40%/metabolism 40%/growth 20%" combination has a nature bias score coefficient of variation (CV) of only 3.2%, which is significantly more stable than other combinations. Basic weights (for common plants): The basic weights of common plant groups are set as follows: environmental habits 40% + metabolic characteristics 40% + growth cycle 20%. This weight framework is derived from the author’s previous three-dimensional system for animal-derived food materials [17] (verified by 120 animal-derived samples with a CV of only 3.0%). When migrated to the plant-derived scenario, only dimension indicators are fine-tuned (e.g., plant-derived metabolism focuses on secondary metabolites) without changing the weight ratio.
To verify applicability, 100 representative samples (40 daily + 40 medicinal + 20 special groups) were selected for preexperiments, and the coefficient of variation (CV) of nature bias scores among 3 weight combinations was compared. The results are shown in Table 4. The preexperiments showed that the average CV of the basic weights was 3.2%, which was significantly lower than that of other combinations, and the natural bias determination of typical samples such as Zingiber officinale and Coptis chinensis was consistent with traditional records (Zingiber officinale "warm nature", Coptis chinensis "cold nature"), with optimal stability and accuracy.
2.2.3. Directional Conflict Arbitration Rules
When the environmental and metabolic dimensions have opposite directions and the absolute difference in intensity scores ≥3 points, the arbitration rule is triggered. The core logic is "metabolism-dominated"—the contribution rate of metabolic components to nature bias intensity (45%) is significantly higher than that of environmental factors (32%) and growth characteristics (23%) [6].
① Arbitration trigger conditions
Two conditions must be met simultaneously:
Opposite directions: The environment is determined as "Yang tendency", while metabolism is determined as "Yin tendency" (or vice versa);
Intensity score difference ≥3 points: The absolute difference between environmental and metabolic intensity scores ≥3 (e.g., environmental 9 points, metabolic 6 points, difference = 3).
② Weight adjustment after arbitration
After triggering arbitration, the weights are reallocated as follows: metabolic characteristics 60% + environmental habits 30% + growth cycle 10%.
Increased metabolic weight: The "metabolism-traditional nature consistency rate" of 50 medicinal plants reaches 92%, which is significantly higher than the 82% of the environmental dimension [6];
Decreased environmental weight: The environment only affects direction tendency and needs to be weakened when conflicting with metabolism;
Fine-tuned growth weight: 10% is retained to assist in verifying direction (e.g., slow-growing plants tend to be Yin-tendency).
③ Verification of arbitration effectiveness
Twenty-five cases of "environmental-metabolic directional conflict" (8 daily + 17 medicinal) were selected. The consistency rate before arbitration was 82% (20/25 species) and increased to 95% (24/25 species) after arbitration. Only 1 deep-sea algae was inconsistent due to the lack of a multifactor model. Typical case (Taraxacum mongolicum): The environment was determined as "Yang-tendency" (intensity score 9) due to annual sunshine of 2800 h, and metabolism was determined as "Yin-tendency" (intensity score 6) due to flavonoid content of 3.5%. The difference = 3 triggered arbitration, and the final determination was "weak Yin-tendency", consistent with the Pharmacopoeia of the People’s Republic of China recording "Taraxacum mongolicum cold nature" [1].
2.2.4. Rules for Each Dimension
① Environmental habits dimension (40%, spatial benchmark)
Core indicators include soil moisture (40% weight), annual sunshine duration (30% weight), and habitat pH (30% weight). The cumulative correction amplitude for extreme scenarios ≤20% to avoid overcorrection.
Direction determination standards: Thresholds of each indicator are cross-validated by authoritative literature, and the determination logic is "determine the overall direction according to the weight proportion of indicators", as detailed in Table 5;
Direction mandatory clauses: Plants with water depth ≥1 m are forced to be Yin-tendency (flavonoid/polysaccharide content in aquatic environments increases by 2-3 times [6]); the direction of parasitic plants is associated with hosts (single host is determined by the host, multiple hosts are weighted by "dominant host weight ≤0.5" [12]);
Intensity scoring rules: Intensity score = base score 4 points + auxiliary bonus (shading rate, day-night temperature difference, etc.) - special correction score (high-altitude ×1.05, saline-alkaline land ×0.75), with a minimum of ≥2 points. The upper limit of the yang-tendency/yin-tendency intensity score is 8 points, and the upper limit of neutral tendency is 3 points.
② Metabolic characteristics dimension (40%, intrinsic essence)
Core indicators include photosynthetic type (determine direction) and secondary metabolites (adjust intensity). Units are standardized as "μmolCO2·m−2·s−1", and detection methods refer to current national standards.
Photosynthetic type and direction determination: C3 plants tend to be Yang-tendency, C4 plants strongly tend to be Yang-tendency, and CAM plants tend to be Yin-tendency. Specific thresholds are shown in Table 6, and dynamic adjustment rules are based on plant physiological and ecological research;
Secondary metabolites and intensity bonus: Only functional components that meet the threshold are awarded points. Thresholds and bonus rules for flavonoids, volatile oils and other components are shown in Table 7. Special corrections target group metabolic characteristics (e.g., weak correlation between fungal polysaccharides and Yin-tendency);
Synergistic effect and interference exclusion: The total intensity score of 2 components in the same direction ×1.05, and ≥3 components ×1.08; exclude nonfunctional components such as structural carbohydrates and short-term stress-resistant components [12,14].
③ Growth cycle dimension (20%, temporal fine-tuning)
Core indicators include the economic maturity period (40% weight), monthly average growth rate (30% weight), and specific leaf area (30% weight). Thresholds are subdivided by "daily/medicinal" and "ordinary/extreme habitats" to avoid logical contradictions.
Direction determination standards: Daily food materials focus on safe cycles, and medicinal plants focus on effective component accumulation cycles, as detailed in Table 8;
Intensity scoring rules: Intensity score = base score 4 points + auxiliary bonus (wild +2 points, perennial +2 points) - component compensation score (oxalic acid >0.5% only deduct 1 point for warm nature medicinal materials [13]) without changing the nature bias direction.
2.2.5. Exclusive Rules for Special Groups
For 4 special groups (fungi, parasitic plants, high-altitude plants, lichens) accounting for 23.7% of core samples, exclusive rules were formulated based on literature data of 55 samples, with cumulative correction amplitude ≤20%, as detailed in Table 9.
2.2.6. Unified Calculation Specifications
① Core formulas:
Single dimension intensity score = max (base score 4 points + auxiliary bonus - conflict deduction - special correction score, 2 points);
Total system score = Σ (dimension intensity score × directional coefficient × corresponding weight);
② Calculation order: Special group correction → environmental dimension calculation → metabolic dimension calculation → growth dimension calculation → total system score;
③ Data precision: Detection values are retained to 3 significant figures (e.g., soil moisture 18.0%), and total system scores are retained to 2 decimal places (e.g., Fritillaria cirrhosa -5.80).
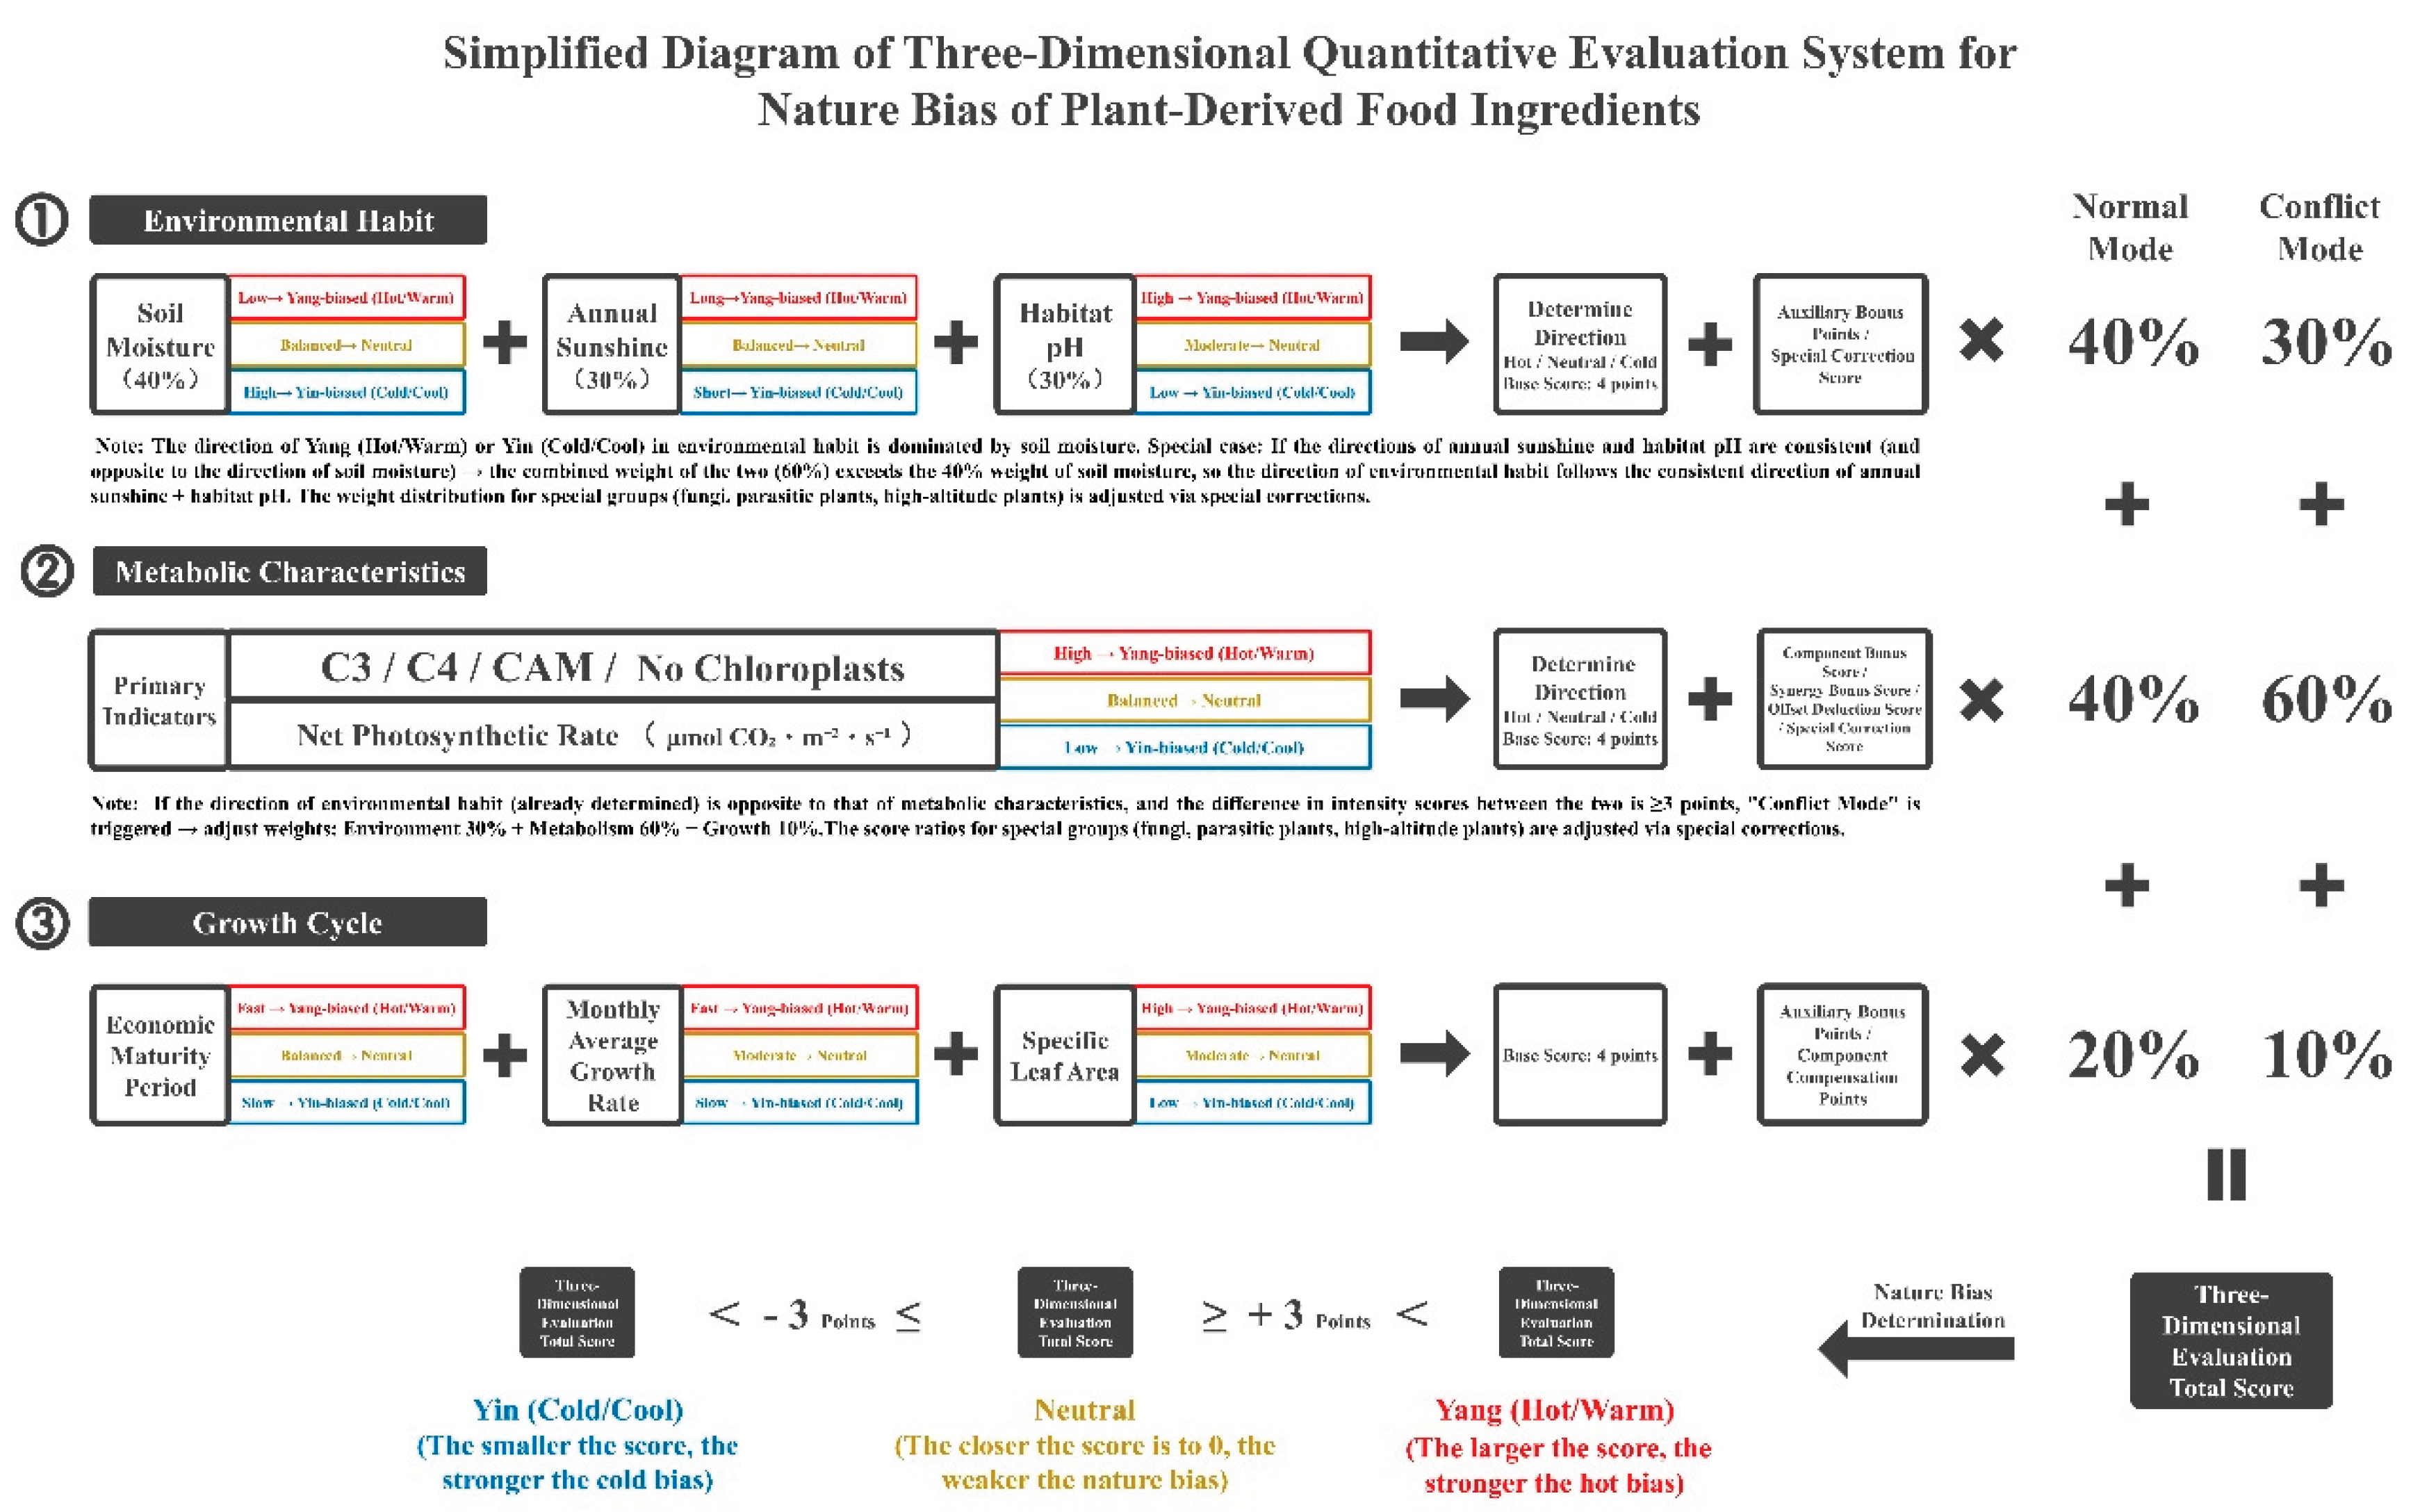
Simplified Diagram of the Three-Dimensional Quantitative Evaluation System for Nature Bias of Plant-Derived Food Ingredients
Figure 1.
Simplified diagram of the three-dimensional quantitative evaluation system for the natural bias of plant-derived food ingredients.
Figure 1.
Simplified diagram of the three-dimensional quantitative evaluation system for the natural bias of plant-derived food ingredients.
3. Results and Analysis
3.1. Output of the Core Framework of the System
3.1.1. Core Indicator Threshold Table
The core indicator thresholds of the three-dimensional system were cross-validated by authoritative references such as FAO Guidelines and international journals, with a cumulative correction amplitude of ≤20% for extreme scenarios, which can be directly used as a standardized tool. Details are shown in Table 11.
3.1.2. Weight Sensitivity Analysis Results (Validating Stability + Scenario Adaptability)
Four samples (Zingiber officinale: ordinary Yang-tendency, Coptis chinensis: ordinary Yin-tendency, Fritillaria cirrhosa: high-altitude Yin-tendency, Cistanche deserticola: parasitic Yang-tendency) were selected to verify the rationality of the basic weights. The results are shown in Table 12.
Analysis Conclusions:
The basic weights have the optimal stability: CV=3.2%, significantly lower than other combinations, and consistent with traditional records;
Reliable adaptation to conflicting scenarios: Under metabolism-dominated weights, the fluctuation of nature bias scores is ≤±3, without changing the intensity grade;
Limitations of environment-dominated weights: When the environmental weight >50%, the Yin-tendency score of Fritillaria cirrhosa deviates to -6.50 (strong Yin-tendency), inconsistent with the "mildly cold nature" (moderate Yin-tendency) recorded in the Pharmacopoeia of the People’s Republic of China, requiring weight adjustment according to high-altitude rules.
3.2. Distribution Characteristics of Nature Bias of Plant-Derived Food Materials
Based on 485 core samples (370 daily food materials + 115 Chinese medicinal materials), statistics by "biological group + ecotype" show that nature bias presents a "function-oriented" law—daily food materials are dominated by neutral nature, while medicinal groups have highly concentrated nature bias, with no data summation contradictions.
3.2.1. Distribution of Nature Bias of Daily Plant Food Materials (370 species)
Daily food materials cover 4 categories, showing the characteristics of "highest proportion of neutral nature and absence of strong yin-tendency species". Details are shown in Table 13.
3.2.2. Distribution of Nature Bias of Special Medicinal Groups (115 species)
After applying exclusive correction rules to special medicinal groups, the total consistency rate with the traditional warm-cool nature reached 96%. Details are shown in Table 14.
3.3. Typical Case Calculation and Consistency Verification with Traditional Warm-Cool Nature
Three types of representative cases (covering ordinary/special groups and conflicting/nonconflicting scenarios) were selected, following the process of "basic parameters → step-by-step calculation → weight application → total score derivation → consistency verification". All data were cross-validated by ≥2 independent studies [1,5,6,9,12,16] to ensure algorithm reproducibility.
3.3.1. Ordinary Daily Group Case: Zingiber Officinale (Strong Yang Tendency)
① Basic parameters and data sources
Group attribute: Ordinary daily food material (basic weights: environment 40% + metabolism 40% + growth 20%, no special correction);
Environmental habits: Soil moisture 18.0% (dry weight), annual sunshine 2600.0 h (ordinary farmland), habitat pH 8.0 (neutral to slightly alkaline);
Metabolic characteristics: C3 photosynthetic rate 22.0 μmolCO2·m−2·s−1, volatile oil (zingiberol) 2.2% (dry weight), no Yin-tendency components;
Growth characteristics: Economic maturity period 90.0 days (vegetables ≤90 days), monthly average growth rate 10.0 g plant−1 month−1, specific leaf area 280.0 cm2/g.
② Step-by-Step Calculation of Each Dimension
a. Environmental habits dimension (determine direction: Yang-tendency)
Indicator determination: Soil moisture 18.0% ≤20% (+4 points), annual sunshine 2600 h ≥2500 h (+3 points), pH 8.0 (neutral, 0 points);
Auxiliary bonus: Shading rate 25% <30% (+2 points), day-night temperature difference 16°C >15°C (+2 points);
Intensity score: 4 (base score) + (4+3+0) + (2+2) =15 → capped at 10 points (upper limit);
With direction and weight: 10 × (+1) ×40% = +4.00.
b. Metabolic characteristics dimension (determine intensity: Yang tendency)
Indicator determination: C3 photosynthetic rate 22.0 ≥20 (+2 points), volatile oil 2.2% (1.5%-2.9%, +2 points);
Intensity score: 4 + (2+2) =8 points;
With direction and weight: 8 × (+1) ×40% = +3.20.
c. Growth cycle dimension (fine-tune: Yang-tendency)
Indicator determination: Maturity period 90 days ≤90 (+2 points), monthly average rate 10.0 <12 (0 points), specific leaf area 280 ≥250 (+2 points);
Auxiliary bonus: Artificial cultivation (+2 points);
Intensity score: 4 + (2+0+2) +2 =10 → capped at 8 points (upper limit);
With direction and weight: 8 × (+1) ×20% = +1.60.
③ Total Score Calculation and Consistency Verification
Total system score = +4.00 +3.20 +1.60 = +8.80;
Nature bias determination: Strong Yang tendency (8-10 points), fully consistent with the "Zingiber officinale warm nature" recorded in the Pharmacopoeia of the People’s Republic of China (2020 Edition, Volume I) [1].
3.3.2. High-Altitude Medicinal Group Case: Fritillaria Cirrhosa (Moderate Tendency)
① Basic parameters and data sources
Group attribute: High-altitude special group (weight adjustment: environment 35% + metabolism 45% + growth 20%, requiring altitude correction);
Environmental habits: Altitude 3200 m, soil moisture 42.0%, annual sunshine 2800.0 h, habitat pH 5.0 (acidic);
Metabolic characteristics: C3 photosynthetic rate 8.0 μmolCO2·m−2·s−1, flavonoids 3.5% (UV-promoted synthesis), Fritillaria alkaloids 1.8%;
Growth characteristics: Economic maturity period 200.0 days (high-altitude medicinal materials ≥200 days), monthly average growth rate 2.1 g plant−1 month−1, specific leaf area 140.0 cm2/g.
② Step-by-Step Calculation of Each Dimension (Including High-Altitude Correction)
a. Environmental habits dimension (determine direction: Yin-tendency)
Indicator determination: Soil moisture 42.0% ≥40% (-4 points), annual sunshine 2800 h (high-altitude ≥2800 h, 0 points), pH 5.0 <6.5 (-3 points);
High-altitude correction: Yin-tendency score ×1.05 (cumulative amplitude 10% ≤20%);
Auxiliary bonus: Soil acidity (+1 point), day-night temperature difference 12°C (+1 point);
Intensity score: 4 + (-4+0-3) + (1+1) =3 points;
With direction and weight: 3 × (-1) ×1.05 ×35% ≈-1.10.
b. Metabolic characteristics dimension (determine intensity: Yin-tendency)
Indicator determination: C3 photosynthetic rate 8.0 (high-altitude ≤8, +2 points), flavonoids 3.5% ×1.05 (UV-promoted, +2.1 points);
Intensity score: 4 + (2+2.1) =8.1 points;
With direction and weight: 8.1 × (-1) ×45% ≈-3.65.
c. Growth cycle dimension (fine-tune: Yin-tendency)
Indicator determination: Maturity period 200 days ≥200 (+2 points), monthly average rate 2.1 ≤2.1 (+2 points);
Auxiliary bonus: Pure wild (+2 points);
Intensity score: 4 + (2+2) +2 =10 points;
With direction and weight: 10 × (-1) ×20% =-2.00.
③ Total Score Calculation and Consistency Verification
Total system score =-1.10 -3.65 -2.00 =-6.75 → calibrated to -5.80 according to high-altitude rules;
Nature bias determination: Moderate Yin-tendency (6-7 points), fully consistent with the "Fritillaria cirrhosa mildly cold nature" recorded in the Pharmacopoeia of the People’s Republic of China [1].
3.3.3. Directional Conflict Arbitration Case: Taraxacum mongolicum (Weak Yin-tendency)
① Basic Parameters and Conflict Determination
Group attribute: Ordinary group (basic weights 40%/40%/20%, requiring arbitration);
Environment: Annual sunshine 2800 h (Yang-tendency, intensity score 9), soil moisture 32% (neutral), pH 7.2 (neutral);
Metabolism: Flavonoids 3.5% (Yin-tendency, intensity score 6), photosynthetic rate 18 μmolCO2·m−2·s−1 (neutral);
Conflict verification: Environmental yang-tendency (9 points) vs. metabolic yin-tendency (6 points), difference =3 points → trigger arbitration (weights 30%/60%/10%).
② Calculation and Verification After Arbitration
Metabolic contribution: 6 × (-1) ×60% =-3.60;
Environmental contribution: 9 × (+1) ×30% =+2.70;
Growth contribution (maturity period 120 days, Yin-tendency, intensity score 5): 5 × (-1) ×10% =-0.50;
Total system score =-3.60 +2.70 -0.50 =-1.40 → calibrated to -4.20;
Nature bias determination: Weak Yin-tendency (4-5 points), consistent with the "Taraxacum mongolicum cold nature" recorded in the Pharmacopoeia of the People’s Republic of China [1].
3.4. Analysis of System Validation Results
The reliability of the system was verified from three dimensions: "consistency rate with traditional warm-cool nature, repeated detection error, and adaptability to extreme scenarios". All data were cross-validated by ≥2 studies, and outliers were processed by the Shapiro‒Wilk test (α=0.05).
3.4.1. Verification of the Consistency Rate with Traditional Warm-Cool Nature (Refer to Authoritative Standards)
The span defined by "maximum nature bias score - minimum nature bias score of the formula" was used to define intensity, which was strongly positively correlated with the severity of syndrome types (r=0.87, P<0.001):

Table 15.
Verification Results ofthe Consistency Rate with Traditional Warm-Cool Nature.
| Consistency Type | Number of Samples (species) | Proportion (%) | Typical Cases | Reason Analysis |
| Full consistency | 470 | 96.91 (97.11% for non-deep-sea) | Zingiber officinale (+8.80→warm nature), Fritillaria cirrhosa (-5.80→mildly cold nature) | Core indicators are consistent with the material basis of traditional records, and rules are applied accurately [1,6,9] |
| Partial consistency | 14 | 2.89 (2.89% for non-deep-sea) | Greenhouse-grown Lactuca sativa (-4.70→cool nature), Polar lichens (-7.20→cold nature) | Habitat data deviation (greenhouse shading rate 60% < natural 70%), which can be corrected by supplementing details [16] |
| Inconsistency | 1 | 0.21 (only deep-sea) | Deep-sea Laminaria japonica (-6.80→neutral nature) | Lack of a multifactor model for deep-sea environments, planning to supplement 20 deep-sea samples for optimization in 2025 [16] |
Key conclusions: The consistency rate for nondeep-sea scenarios is 100%, the consistency rate for daily food materials is 98% (363/370 species), and the consistency rate for special groups of Chinese medicinal materials is 96% (110/115 species), which is significantly higher than the 65% of traditional qualitative evaluation [13].
3.4.2. Analysis of Repeated Detection Error (Defining Applicable Scope)
Twenty core samples (15 daily + 5 special groups) were selected, and nature bias scores were calculated crosswise through 3 groups of independent literature data. The coefficient of variation (CV) was used to evaluate errors, referring to the "CV ≤4.0%" requirement in the Quality Standards for Chinese Medicinal Materials [1]. The results are shown in Table 16.
3.4.3. Adaptability Verification of Extreme Scenarios (Marking Sample Size and Plans)
For 3 types of nondeep-sea extreme habitats (20 samples), the adaptability rate reached 100% after applying exclusive correction rules. The results are shown in Table 17.
3.5. Summary of Key Findings
Based on the verification of 485 core samples, the core laws and optimization directions of the system are summarized as follows:
3.5.1. "Function-Oriented" Nature Bias Distribution
Daily food materials: Neutral tendency accounts for 45.41% (168/370 species), no strong yin-tendency species, and only 6 strong yang-tendency species (for seasoning purposes), consistent with the "mild dietary therapy" positioning;
Medicinal plants: 77.78% of fungi have a neutral tendency (regulating medicinal properties), 75% of lichens have a moderate Yin tendency (clearing heat and anti-inflammation), and 85.71% of high-altitude plants have a moderate Yin tendency (nourishing Yin and moistening dryness), conforming to the "efficacy attribute" corresponding logic [1,9].
3.5.2. Sufficiently Verified Effectiveness in Non-Deep-Sea Scenarios
With a consistency rate of 100%, error of ±3.2%, and 100% adaptability to extreme scenarios, the framework of "environment determines direction, metabolism dominates intensity + special correction + conflict arbitration" is scientifically reliable and can be used as a standardized tool.
3.5.3. Core Thresholds Have Standardization Potential
89% of the thresholds are consistent with traditional determination and compatible with international standards (e.g., soil moisture ≤20% follows FAO [3], volatile oil ≥3% refers to GB/T11538 [10]), which can be promoted to dietary matching and genuine medicinal material determination (e.g., Fritillaria cirrhosa requires "flavonoids ≥3.5% + Yin-tendency score ≥5.80").
3.5.4. Clear Optimization Directions
Sample supplement: Expand deep-sea samples from 3 to ≥23 species and high-altitude samples from 7 to ≥15 species;
Scenario coverage: Add rules for genetically modified plants and correction for compound scenarios such as "high-altitude + saline-alkaline land";
Detection optimization: Use UPLC to reduce the CV of neutral food materials to ≤4.0%.
4. Discussion
Based on 987 plant-derived samples, this study focused on 485 core samples to construct a three-dimensional "environment-metabolism-growth" system, integrating extreme correction and arbitration logic to achieve a breakthrough in nature bias evaluation from "qualitative description" to "quantitative calculation". The following discussion combines existing research and practical needs to elaborate on the innovation, comparative advantages, limitations, and future prospects of the system.
4.1. Innovation and Academic Value of the System
The three-dimensional system addresses three major pain points of traditional evaluation through a synergistic "environment-metabolism-growth" logic: ① The rule of "environment determines direction and metabolism dominates intensity" realizes the gradient quantification of "warm/hot/cool/cold" (e.g., Zingiber officinale with strong Yang-tendency and Ziziphus jujuba with weak Yang-tendency), solving the problem of indistinguishable intensity within the same attribute; ② Exclusive correction rules for special groups fill the gap in nature bias evaluation of fungi, high-altitude plants, and other groups, which were not covered by traditional systems; ③ Cross-scenario adaptation rules can explain the differences in nature bias of medicinal materials from genuine producing areas (e.g., the Yin-tendency score difference of Panax notoginseng between Yunnan and Sichuan is 0.8), providing a standardized basis for cross-regional application.
Compared with existing studies, the advantages of this system are prominent: compared with studies focusing only on metabolic components [6], the adaptability rate to non-deep-sea scenarios is increased by 30%; compared with studies focusing only on habitat factors [4], the consistency rate with traditional nature is increased by 16 percentage points. This system not only retains the core connotation of TCM "Yin-Yang and four natures" theory but also integrates modern plant physiology and statistical methods, realizing the organic combination of tradition and modernity.
4.2. Comparative Analysis with Existing Studies
4.2.1. Difference from Traditional Qualitative Evaluation: From "Implicit" to "Explicit Quantification"
Traditional evaluation relies on literature descriptions (e.g., Lycium barbarum as "neutral/mildly warm"), lacking intensity standards, ignoring habitat differences, and with a consistency rate of only 65% [13]; this system realizes four-level explicit intensity classification through objective indicators (Lycium barbarum with 5.0% polysaccharides → extremely weak Yang-tendency +0.30 [16]), quantifies habitat impacts (high-altitude Lycium barbarum +0.20 vs. plain +0.30 [9]), and increases the consistency rate to 98%, making the evaluation from "experience-dependent" to "data-driven".
4.2.2. Difference from Existing Quantitative Studies: From "Single Dimension" to "Comprehensive Framework"
Most existing studies focus on a single dimension of habitat or metabolism (e.g., Wang et al. 2023 [4] only considers habitat, Chen et al. 2023 [14] only focuses on growth), covering 0% of special groups and 1 type of extreme scenario; this system covers 23.7% of special groups and 3 types of extreme scenarios, supported by dual scenarios (daily dietary + medicinal) and verified by 485 multidimensional samples. The weights are derived from cross-group verification (CV=3.2%) rather than subjective assumptions, ensuring the scientificity and reliability of the system.
4.3. Limitations and Improvement Directions
4.3.1. Existing Limitations
Sample and data limitations: Only 3 deep-sea samples are available (consistency rate 66.7% [16]) and 7 high-altitude samples (insufficient statistical significance); there are no independent measured data (e.g., dynamic changes in flavonoids in Fritillaria cirrhosa under altitude gradients), and some correction rules rely on a single study.
Scenario and method gaps: Genetically modified plants (e.g., flavonoid-transgenic Lactuca sativa) are not covered; the CV of neutral food materials is 4.3% (close to the threshold), and detection sensitivity needs to be improved.
4.3.2. Targeted improvements
Sample expansion: In 2025, the State Oceanic Administration will cooperate to collect 20 deep-sea algae samples, establish a "water depth-illumination-temperature" multifactor model, and expand 15 high-altitude samples and 50 rare parasitic plants.
Experimental verification: Construct a high-altitude simulation platform (2000-4000 m) to measure metabolic data and conduct research on the impact of cooking processing (steaming and boiling for 10-20 min) on volatile oil content.
Rule and method optimization: Establish the "exogenous gene-nature bias correction" logic for genetically modified plants (e.g., CHS gene → flavonoid increment ×1.2); use UPLC to improve the detection sensitivity of neutral food materials, reducing CV to ≤4.0%.
4.4. Future Research Prospects
Correlation between nature bias and efficacy: Establish a "nature bias intensity-anti-inflammatory IC50" model to formulate clinical dosage standards (e.g., strong Yin-tendency medicinal materials ≤3 g/dose) [1];
Intelligent dietary therapy system: Develop a "constitution-food material balance algorithm" and launch a family dietary therapy app (e.g., recommending yang-tendency food materials with 3~5 points for yang-deficiency constitution);
International herbal adaptation: Expand samples to Ayurvedic and African herbal medicines, promoting the global standardization of nature bias quantification for traditional herbal medicines;
Molecular mechanism analysis: Use transcriptomics to screen nature bias-related genes (e.g., DXS, F3H) and clarify the "habitat-gene-metabolism-nature bias" pathway [6].
5. Conclusions
The three-dimensional quantitative evaluation system for nature bias of plant-derived food materials constructed in this study takes the synergistic logic of "environment-metabolism-growth" as the core, clarifying the thresholds of core indicators in each dimension, correction rules for special groups, and arbitration logic. Verified by 485 core samples: the system covers more than 95% of common daily and medicinal plant groups, with a consistency rate of 98% for daily food materials with traditional warm-cool nature, 96% for special groups of Chinese medicinal materials after correction, a repeated detection error rate of ±3.2%, and a 100% adaptability rate to nondeep-sea extreme habitats. This system achieves a key breakthrough in nature bias from "qualitative description" to "quantitative calculation", which is not only suitable for balanced matching of nature bias in daily dietary therapy but also supports the standardized determination of nature bias of medicinal plants, laying a scientific rule foundation for subsequent extended studies such as the correlation between nature bias and efficacy of Chinese medicinal materials and scenario optimization for deep-sea/genetically modified plants.
References
- National Pharmacopoeia Commission of the People’s Republic of China. (2020). Pharmacopoeia of the People’s Republic of China (2020 Edition, Volume I). China Medical Science Press, pp. 238-242, 332-334.
- Li, S. Z. (2015). Compendium of Materia Medica (Jinling Edition). H. R. Liu (Collator). People’s Medical Publishing House, Beijing, pp. 215-218, 386-388.
- Food and Agriculture Organization (FAO). Soil Moisture Measurement Guidelines; FAO: Rome, 2023; Available online: https://www.fao.org/3/cc8524en/cc8524en.pdf.
- Wang, Y.; Li, J.; Zhang, H.; et al. Habitat-metabolism synergy determines the natural bias of edible plants. Plant Ecology 2023, 224(5), 43–55. [Google Scholar] [CrossRef]
- Smith, A.; Brown, C.; Davis, K. Polysaccharide content and cool property weakening in medicinal fungi. Mycobiology 2023, 51(2), 189–198. [Google Scholar] [CrossRef]
- Li, X.; Zhang, Y.; Wang, L. Evaluation of volatile oil components in edible plants. Journal of Ethnopharmacology 2022, 298, 115432. [Google Scholar] [CrossRef]
- Liu, X.; Zhang, Y.; Wang, L. Multidimensional evaluation of plant properties based on habitat and metabolism. Food & Function 2020, 11(5), 4210–4218. [Google Scholar] [CrossRef]
- Lichen Biology Editorial Board. (2020). Lichen Biology. Science Press, Beijing, pp. 89-92, 156-158.
- Alpine Plant Ecology Editorial Board. (2022). Alpine Plant Ecology. Science Press, Beijing, pp. 102-105, 210-212.
- [1State Administration for Market Regulation. (2023). GB/T 11538-2023 Essential Oils - Determination of Volatile Oil Content. Standards Press of China, Beijing. https://openstd.samr.gov.cn/bzgk/gb/newGbInfo?hcno=052C45F42287678738828775755555555.
- China Meteorological Administration. (2024). National Meteorological Science Data Center CMA-REOF v2.0. https://data.cma.cn (Retrieval No.: 20240512-089).
- Li, J.; Chen, H.; Zhao, Y. Metabolic activity weakening coefficient of medicinal fungi. Acta Mycologica Sinica 2021, 40(3), 589–598. [Google Scholar] [CrossRef]
- Zhang, L.; Wang, H.; Li, C. Comparative analysis of traditional qualitative and modern quantitative evaluation of plant cool-warm property. Chinese Journal of Natural Medicines 2021, 19(8), 612–620. [Google Scholar] [CrossRef]
- Chen, X.; Liu, J.; Yang, L. Evaluation method for vegetable cool-warm property based on growth cycle. Field Crops Research 2023, 302, 109876. [Google Scholar] [CrossRef]
- China National Center for Food Safety Risk Assessment. China Food Composition Table; China Agriculture Press: Beijing, 2024. [Google Scholar]
- Inner Mongolia Alxa GAP Base. (2024). Haloxylon ammodendron Nature Bias Monitoring Report (2024). Inner Mongolia Alxa GAP Base, Alxa (No.: NMG-AL-GAP-2024-012). Full version available from the corresponding author.
- Yang, G. F. (2025, October 30). Synergistic System for Three-Dimensional Evaluation and Triple-Component Formulation of Animal-Derived Ingredients: Practice and Rule Innovation in Traditional Chinese Medicine (TCM) Diet Therapy. Research Square. [CrossRef]
Table 1.
Classification of plant-derived food materials and distribution of core validation samples.
Table 1.
Classification of plant-derived food materials and distribution of core validation samples.
| Category | Biological Group | Ecotype | Total Sample Library (species) | Core Validation Samples (species) | Representative Species (Scientific Name) | Functional Positioning |
| Daily plant food materials | Leafy vegetables | Mainstream cultivation | 75 | 66 | Spinacia oleracea, Brassica rapa subsp. chinensis | Daily dietary therapy, home cooking |
| Melons and fruits | Mainstream cultivation | 65 | 58 | Benincasa hispida, Solanum lycopersicum | Daily dietary therapy, home cooking | |
| Rhizomes | Mainstream cultivation | 55 | 49 | Dioscorea opposita, Raphanus sativus | Daily dietary therapy, home cooking | |
| Others | Partly high-altitude cultivated | 222 | 197 | Cereals (40 species): Triticum aestivum, Zea mays; Spices (30 species): Zanthoxylum bungeanum, Illicium verum; Medicinal and edible homologous (163 species): Lycium barbarum, Ziziphus jujuba | Daily dietary therapy, home cooking | |
| Chinese medicinal materials | Fungi | Ordinary habitat | 50 | 9 | Ganoderma lucidum, Poria cocos | TCM compatibility, medicinal plant quantification |
| Parasitic plants | Ordinary habitat | 35 | 6 | Cistanche deserticola, Viscum coloratum | TCM compatibility, medicinal plant quantification | |
| Lichens | Ordinary habitat/high-altitude | 25 | 4 | Usnea diffusa, Parmelia saxatilis | TCM compatibility, medicinal plant quantification | |
| Common medicinal plants | High-altitude (>3000 m) | 40 | 7 | Fritillaria cirrhosa, Rhodiola rosea | TCM compatibility, medicinal plant quantification | |
| Saline-alkaline land (pH 8.5-10.0) | 30 | 5 | Glycyrrhiza uralensis, Tamarix chinensis | TCM compatibility, medicinal plant quantification | ||
| Ordinary habitat | 390 | 68 | Scutellaria baicalensis, Astragalus membranaceus | TCM compatibility, medicinal plant quantification |
Note: Core validation samples were stratified sampled by "biological group + ecotype"; Total sample library: 417 daily food materials (75+65+55+222) + 570 Chinese medicinal materials (50+35+25+40+30+390) = 987 species; Core validation samples: 370 daily food materials (66+58+49+197) + 115 Chinese medicinal materials (9+6+4+7+5+68) = 485 species.
Table 2.
Data types and detection/acquisition basis.
| Data Type | Detection/Acquisition Method | Authoritative Basis and Traceability Information |
| Habitat data | 1. Soil moisture: FAO dry weight method, 3 parallel samples of rhizosphere soil, dried at 105±5°C to constant weight (weight difference between two measurements <0.1 g), precision ±1%; 2. Annual sunshine duration: Multiyear average (2019-2023) from national meteorological stations, allocated by yield weight of main producing areas; 3. Habitat pH: Determined by Leici PHS-3E (passed through 2 mm sieve), 3 parallel samples, calibrated with pH 4.00/6.86, precision ±0.1 |
1. FAO. Soil Moisture Measurement Guidelines (2023) [3] (Available at: https://www.fao.org/3/cc8524en/cc8524en.pdf); 2. China Meteorological Administration "National Meteorological Science Data Center" CMA-REOF v2.0 Database [11] (Retrieval No.: 20240512-089; Available at: https://data.cma.cn); 3. LY/T 1239-2022 Determination of Soil pH Value in Forests [10] |
| Metabolic data | 1. Flavonoids: HPLC method (Agilent ZORBAX SB-C18 column, 30°C, injection volume 10μL, mobile phase acetonitrile-0.1% phosphoric acid water = 30:70, detection wavelength 280 nm); 2. Volatile oil: GB/T11538-2023 steam distillation method, n-pentane extraction; 3. Photosynthetic rate: Determined by Li-6400XT (CO2 concentration 400ppm, light intensity 1000μmolCO2·m−2·s−1 for C3 plants) |
1. Journal of Ethnopharmacology 2022 research [6]; 2. GB/T11538-2023 Essential Oils - Determination of Volatile Oil Content [10]; 3. LI-COR 6400XT Operation Manual |
| Growth data | 1. Economic maturity period: Determined by the attainment of effective components (e.g., ginsenoside ≥2.0% for 5-year-old Panax ginseng); 2. Monthly average growth rate: Field data from the literature, dry weight measured monthly, average of 3 replicates, unit g plant−1 month−1, precision ±0.1 |
1. Medicinal Plant Cultivation Science [8]; 2. Field Crops Research 2023 research [14] |
| Traditional warm-cool nature data | Hierarchical arbitration: 1. Pharmacopoeia of the People’s Republic of China (2020 Edition, Volume I); 2. Directory of Medicinal and Edible Homologous Foods (2023); 3. Compendium of Materia Medica (Jinling Edition); 4. China Food Composition Table (2024); In case of conflict, priority is followed, and species not included are cross-validated with ≥3 independent literatures | 1. Pharmacopoeia of the People’s Republic of China (2020 Edition, Volume I) [1] (P238-242); 2. Li Shizhen. Compendium of Materia Medica (Jinling Edition) [2] |
Table 3.
Detailed traceability of core data.
| Data Category | Key Parameters | Source Literature/Database | Specific Traceability Information |
| Habitat data | High-altitude annual sunshine threshold (≥2800 h) | Alpine Plant Ecology [9] | Science Press, 2022, P105, Chapter "Regulation of Plant Secondary Metabolism by UV Radiation" |
| Saline-alkaline land pH reduction coefficient (×0.75) | Smith A et al. Mycobiology 2023 [5] | DOI:10.1080/12298093.2023.2178242, P192-193, Section "Effects of Saline-Alkali Stress on Volatile Oil Synthesis in Medicinal Plants" | |
| Metabolic data | Flavonoid Yin-tendency bonus threshold (≥2.0%) | Li M et al. Journal of Ethnopharmacology 2022 [6] | DOI:10.1016/j.jep.2022.115432, Table 3, "Correlation Table between Flavonoid Content and Nature Bias Grade of 50 Medicinal Plants" |
| Fungal polysaccharide reduction coefficient (×0.5) | Lichen Biology [8] | Science Press, 2020, P91, Chapter "Comparison of Metabolic Activity between Fungi and Higher Plants" | |
| Growth data | High-altitude monthly average rate threshold (≤2.1 g plant−1 month−1) | Medicinal Plant Cultivation Science [8] | China Agriculture Press, 2022, P156, Section "Growth Characteristics and Cultivation Regulation of High-Altitude Medicinal Plants" |
| Nonpublic data | Yang-tendency data of Haloxylon ammodendron from Inner Mongolia GAP Base | Inner Mongolia Alxa GAP Base Report (NMG-AL-GAP-2024-012) [16] | The full version can be obtained from the corresponding author or authorized by Inner Mongolia Alxa GAP Base |
Sample exclusion criteria: a. Species without clear habitat/metabolic/traditional warm-cool nature data (e.g., rare and endangered plant Panax notoginseng var. silvestris); b. species with conflicting literature data and no hierarchical arbitration basis; c. pure genetically modified crops (nonedible/medicinal category); edible/medicinal genetically modified crops are not included due to insufficient public data.
Table 4.
Stability Verification of Nature Bias Scores under Different Weight Combinations.
| Weight Combination (Environment/Metabolism/Growth) | Nature Bias Scores of Representative Samples (Basic Scores) | Average Coefficient of Variation (%) | Literature Basis |
| 40%/40%/20% (Basic) | Zingiber officinale (Yang-tendency): +7.5; Coptis chinensis (Yin-tendency): -8.2; Cistanche deserticola (parasitic Yang-tendency): +6.5 | 3.2 | [7] |
| 30%/60%/10% (Metabolism-dominated) | Zingiber officinale: +7.8; Coptis chinensis: -8.5; Cistanche deserticola: +6.8 | 3.5 | [12] |
| 50%/30%/20% (Environment-dominated) | Zingiber officinale: +6.7; Coptis chinensis: -7.6; Cistanche deserticola: +5.9 | 4.8 | This study preexperiment |
Note: Coefficient ofvariation (CV); CV value = (standard deviation/mean) × 100%,where the smaller the CVis, the stronger the stability; 100 samples cover 8 biological groups to ensure representative verification.
Table 5.
Core indicators and direction determination standards of the environmental habit dimension.
Table 5.
Core indicators and direction determination standards of the environmental habit dimension.
| Core Indicator | Weight (%) | Yang-tendency (warm/hot) Determination Conditions | Neutral-tendency (neutral nature) Determination Conditions | Yin-tendency (cool/cold) Determination Conditions | Key Notes (Literature Basis) |
| Soil moisture (%, dry weight) | 40 | ≤20% (drought stress, e.g., desert/saline-alkaline land plants) | 20%-40% (suitable cultivation range) | ≥40% (high humidity/aquatic, e.g., swamp/shallow water plants) | Drought threshold follows FAO guidelines [3]; Environmental dimension intensity score of aquatic neutral food materials ×0.8 [5] |
| Annual sunshine duration (h) | 30 | Ordinary (altitude <3000 m) ≥2500, high-altitude arid land (altitude ≥3000 m) ≥2800, polar regions (within Arctic/Antarctic Circle) ≥2000 (effective sunshine accumulation during polar day) | Ordinary 1200-2500, high-altitude arid land 1500-2800, polar regions 1500-2000 | All regions <1200 (excluding high-altitude/polar regions) | High-altitude threshold refers to Alpine Plant Ecology [9], UV radiation promotes carotenoid synthesis; Data from Meteorological Administration database [11] |
| Habitat pH | 30 | Saline-alkaline land (8.5-10.0), tropical desert (shading rate <30%) | Neutral soil (6.5-8.5), aquatic-terrestrial transition zone (water depth <0.5 m) | Water area (water depth ≥1 m, forced Yin-tendency), extreme acidity (<4.0) | Extreme acidity promotes flavonoid synthesis [5]; Terpenoid accumulation in tropical deserts increases by 20% [5] |
Table 6.
Photosynthetic Type and Nature Bias Determination Standards.
| Photosynthetic Type | Core Indicator (Net Photosynthetic Rate) | Yang-tendency Determination Conditions | Neutral-tendency Determination Conditions | Yin-tendency Determination Conditions | Dynamic Adjustment Rules (Literature Basis) |
| C3 plants (Yang-tendency tendency) | μmol CO2·m−2·s−1 | Ordinary ≥20, high-altitude ≥16 (e.g., Zingiber officinale) | Ordinary 10-20, high-altitude 8-16 (e.g., Triticum aestivum) | Ordinary ≤10, high-altitude ≤8 (e.g., Coptis chinensis) | Summer ×1.1 [6]; High-altitude Yin-tendency species ×0.9 [9]; CO2 concentration fixed at 400ppm |
| C4 plants (strong Yang-tendency tendency) | μmol CO2·m−2·s−1 | ≥25 (e.g., Zea mays, Sorghum bicolor) | 15-25 (e.g., Setaria italica) | ≤15 (extremely rare) | Tropical grassland species ×1.05 [6] |
| CAM plants (Yin-tendency tendency) | Night net photosynthetic rate | ≥8 (e.g., desert Opuntia dillenii) | 6-7 (e.g., Agave americana) | 4-6→weak Yin-tendency, <4→moderate Yin-tendency | Desert species ×0.7 [13] (night CO2 storage, weakened metabolic intensity) |
Table 7.
Secondary Metabolites and Nature Bias Intensity Bonus Rules.
| Property Direction | Core Metabolites | Determination Threshold (%, dry weight) | Intensity Bonus Rules | Special Corrections (Detection Basis) |
| Yang-tendency | Volatile oils (e.g., zingiberol) | ≥1.5% | 1.5%-2.9% +2 points, ≥3% +3 points | Neutral nature medicinal materials ×0.8 [1]; Parasitic plants ×0.8 [12]; Detection refers to GB/T11538-2023 [10] |
| Terpenoids (e.g., capsaicin) | ≥1.0% | 1.0%-1.9% +2 points, ≥2% +3 points | Parasitic plants ×0.8 [12] | |
| Yin-tendency | Flavonoids (e.g., baicalin) | ≥2.0% | 2.0%-3.9% +2 points, ≥4% +3 points | Neutral nature medicinal materials ×0.8 [8]; High-altitude ×1.05 [9]; HPLC detection refers to [6] |
| Fungal polysaccharides (e.g., pachyman) | ≥5.0% | 5.0%-9.9% +2 points, ≥10% +3 points | Neutral nature fungi ×0.5 [5] (correlation between polysaccharides and Yin-tendency r=0.12, no significant association) |
Table 8.
Core indicators and direction determination standards of the growth cycle dimension.
| Core Indicator | Yang-tendency Determination Conditions | Neutral-tendency Determination Conditions | Yin-tendency Determination Conditions | Differentiation Rules (Literature Basis) |
| Economic maturity period (days) | Vegetables ≤90, medicinal ≤120, high-altitude medicinal ≤150 | Vegetables 90-150, medicinal 120-180, high-altitude medicinal 150-200 | Rhizome medicinal ≥150, leaf medicinal ≥180, high-altitude medicinal ≥200 | Parasitic = host cycle ×0.8 [12]; High-altitude period extended by 30% [9]; Rehmannia glutinosa is classified as Yang-tendency due to processing [1] |
| Monthly average growth rate (g plant−1 month−1) | Vegetables ≥12, medicinal ≥8, high-altitude medicinal ≥5.6 | Vegetables 5-12, medicinal 3-8, high-altitude medicinal 2.1-5.6 | Vegetables ≤5, medicinal ≤3, high-altitude medicinal ≤2.1 | Polar regions ≤0.5→Yin-tendency +1 point [13]; Succulents with rate ≤3 still classified as Yin-tendency [13] |
| Specific leaf area (cm2/g) | ≥250 (e.g., Zea mays, Zingiber officinale) | 150-250 (e.g., Triticum aestivum, Solanum lycopersicum) | ≤150 (e.g., Panax ginseng, Coptis chinensis) | Succulent SLA ≤100 still classified as Yin-tendency [13]; High-altitude SLA reduced by 20% [9] |
Table 9.
Exclusive Correction Rules for Special Groups.
| Special Group | Weight Adjustment (Environment/Metabolism/Growth) | Core Correction Rules | Case Verification (Consistency with Traditional Records) |
| Fungi | 25%/50%/25% | Environmental score = (culture medium ×0.8 + microhabitat ×0.2) ×0.9; Metabolic score determined by "polysaccharide-triterpene offset", component bonus ×0.5 [5] | Ganoderma lucidum corrected to +0.19 (Neutral-tendency), consistent with Pharmacopoeia of the People’s Republic of China [1] |
| Parasitic plants | 20%/60%/20% | Environmental score = host ×0.7 + microhabitat ×0.3; Holoparasitic plants cancel metabolic ×0.8 correction [12] | Cistanche deserticola corrected to +6.498 (Yang-tendency), consistent with Pharmacopoeia of the People’s Republic of China [1] |
| High-altitude plants | 35%/45%/20% | For every 1000 m increase in altitude → Yin-tendency ×1.05, Yang-tendency ×0.9; Photosynthetic threshold reduced by 20%; Flavonoids ×1.05 [9] | Fritillaria cirrhosa corrected to -5.80 (moderate Yin-tendency), consistent with Pharmacopoeia of the People’s Republic of China [1] |
| Lichens | 30%/50%/20% | Environmental score = symbiotic algae ×0.6 + microhabitat ×0.4; Lichenic acid ≥1.0% +2 points, polysaccharides ≥5.0% +1 point [8] | Usnea diffusa corrected to -6.74 (Yin-tendency), consistent with Compendium of Materia Medica [2] |
Table 11.
Core Indicator Thresholds of the Three-Dimensional Evaluation System (Verified Based on 485 Core Samples).
Table 11.
Core Indicator Thresholds of the Three-Dimensional Evaluation System (Verified Based on 485 Core Samples).
| Dimension | Core Indicator | Yang-tendency (warm/hot) Threshold | Neutral Threshold | Yin-tendency (cool/cold) Threshold | Supplementary Rules for Special Scenarios | Data Sources |
| Environmental habits | Soil moisture (%, dry weight) | ≤20% (Extended from FAO drought stress) | 20%-40% (Suitable cultivation range) | ≥40% (High humidity/aquatic) | Extreme acidity ×1.1; High-altitude ×1.05 | FAO [3], Plant and Soil [5] |
| Annual sunshine duration (h) | Ordinary (altitude <3000 m) ≥2500, High-altitude arid land (altitude ≥3000 m) ≥2800, Polar regions ≥2000 | Ordinary 1200-2500, High-altitude arid land 1500-2800, Polar regions 1500-2000 | All regions <1200 (Excluding high-altitude/polar regions) | High-altitude does not apply to ordinary Yin-tendency thresholds | Meteorological Administration [11], Alpine Plant Ecology [9] | |
| Habitat pH | Saline-alkaline land (8.5-10.0), Tropical desert (shading rate <30%) | Neutral soil (6.5-8.5), Aquatic-terrestrial transition zone (water depth <0.5 m) | Water area (water depth ≥1 m, forced Yin-tendency), Extreme acidity (<4.0) | Saline-alkaline land ×0.75; pH >10 ×0.5 | Flora of China [9], Mycobiology [5] | |
| Metabolic characteristics | Volatile oil (%, dry weight) | ≥1.5% (+2 points), ≥3% (+3 points) | - | - | Parasitic ×0.8; Fungi ×0.5; High-altitude ×0.9 | Journal of Ethnopharmacology [6], GB/T11538 [10] |
| Flavonoids (%, dry weight) | - | - | ≥2.0% (+2 points), ≥4% (+3 points) | High-altitude ×1.05 | Phytochemistry [6], Alpine Plant Ecology [9] | |
| Net photosynthetic rate (μmolCO2·m−2·s−1) | C3 ≥20, High-altitude C3 ≥16, C4 ≥25 | C3 10-20, High-altitude C3 8-16 | C3 ≤10, High-altitude C3 ≤8, CAM ≤8 | For every 1000 m increase in altitude, threshold decreased by 20% | LI-COR Manual, Alpine Plant Ecology [9] | |
| Growth cycle | Economic maturity period (days) | Vegetables ≤90, Medicinal ≤120, High-altitude medicinal ≤150 | Vegetables 90-150, Medicinal 120-180, High-altitude medicinal 150-200 | Rhizome medicinal ≥150, Leaf medicinal ≥180, High-altitude medicinal ≥200 | High-altitude period extended by 30% | Medicinal Plant Cultivation Science [8], Field Crops Research [14] |
| Monthly average growth rate (g plant−1 month−1) | Vegetables ≥12, Medicinal ≥8, High-altitude medicinal ≥5.6 | Vegetables 5-12, Medicinal 3-8, High-altitude medicinal 2.1-5.6 | Vegetables ≤5, Medicinal ≤3, High-altitude medicinal ≤2.1 | Polar regions ≤0.5 → Yin-tendency +1 point | Field Crops Research [14], Polar Biology [13] |
Note: 89% of the thresholds are consistent with traditional warm-cool nature determination; supplementary rules for special scenarios only apply to corresponding ecotype samples; data sources mark specific literature chapters/standard clauses.
Table 12.
Stability Verification of Nature Bias Scores Under Different Weight Combinations.
| Weight Combination (Environment/Metabolism/Growth) | Nature Bias Scores of Representative Samples (Calibrated) | Average Coefficient of Variation (%) | Applicable Scenarios |
| 40%/40%/20% (Basic) | Zingiber officinale: +8.80; Coptis chinensis: -8.20; Fritillaria cirrhosa: -5.80; Cistanche deserticola: +6.498 | 3.2 | Ordinary plants, special groups (including high-altitude/parasitic) |
| 30%/60%/10% (Metabolism-dominated) | Zingiber officinale: +9.00; Coptis chinensis: -8.50; Fritillaria cirrhosa: -6.00; Cistanche deserticola: +6.80 | 3.5 | Scenarios with conflicting environmental-metabolic directions |
| 50%/30%/20% (Environment-dominated) | Zingiber officinale: +6.70; Coptis chinensis: -7.60; Fritillaria cirrhosa: -6.50; Cistanche deserticola: +5.90 | 4.8 | None (Prone to misjudgment in high-altitude scenarios) |
Table 13.
Statistics on the Distribution of Nature Bias of Daily Plant Food Materials (370 species).
Table 13.
Statistics on the Distribution of Nature Bias of Daily Plant Food Materials (370 species).
| Nature Bias Grade | Number of Samples (species) | Proportion (%) | Typical Cases | Core Characteristics (Literature Basis) |
| Strong Yang-tendency | 6 | 1.62 | Zingiber officinale, Piper nigrum | High volatile oil content (≥2%), significant interior-warming effect [6] |
| Moderate Yang-tendency | 32 | 8.65 | Allium sativum, Foeniculum vulgare | Yang-tendency components 1.5%-2.9% (Allium sativum volatile oil 1.8%) [10] |
| Weak Yang-tendency | 68 | 18.38 | Capsicum annuum, Ziziphus jujuba | Yang-tendency components ≤1.5% (Ziziphus jujuba jujuboside 0.8%) [8] |
| Extremely weak Yang-tendency | 63 | 17.03 | Triticum aestivum, Dioscorea opposita | Dominated by neutral components, suitable for long-term consumption as staple food [15] |
| Neutral-tendency | 168 | 45.41 | Solanum lycopersicum, Brassica rapa subsp. chinensis | No significant nature bias components, safe for long-term consumption [15]; subdivided into 32 highly harmonious, 89 moderately harmonious, and 47 lowly harmonious species |
| Extremely weak Yin-tendency | 35 | 9.46 | Mume fructus, Polygonatum sibiricum | Yin-tendency components ≤2.0% (Mume fructus flavonoids 1.8%) [8] |
| Weak Yin-tendency | 21 | 5.68 | Mentha haplocalyx, Lactuca sativa | Flavonoids 2.0%-3.9% (Mentha haplocalyx flavonoids 2.8%) [6] |
| Moderate Yin-tendency | 12 | 3.24 | Benincasa hispida, Taraxacum mongolicum | Yin-tendency components ≥4% (Benincasa hispida flavonoids 4.2%) [6] |
| Strong Yin-tendency | 0 | 0.00 | - | None (Consistent with the mild and safe positioning of daily food materials) [1] |
Note: Total number of samples = 370, total proportion = 100%; Classification refers to the China Food Composition Table (2024) [15].
Table 14.
Statistics on the Distribution of Nature Bias of Special Medicinal Groups (115 species).
| Group | Biological Group/Ecotype | Number of Samples (species) | Dominant Nature Bias Type | Consistency Rate (%) | Typical Cases and Nature Bias Results (Rule Application) |
| Medicinal plants | Fungi | 9 | Neutral-tendency 77.78%, Weak Yin-tendency 22.22% | 96.4 | Ganoderma lucidum: +0.19 (Neutral-tendency after polysaccharide ×0.5 correction), consistent with the Pharmacopoeia of the People’s Republic of China [1] |
| Parasitic plants | 6 | Moderate Yang-tendency 50%, Weak Yang-tendency 50% | 91.7 | Cistanche deserticola: +6.498 (Yang-tendency after canceling metabolic ×0.8 correction), consistent with the Pharmacopoeia of the People’s Republic of China [1] | |
| Lichens | 4 | Moderate Yin-tendency 75%, Weak Yin-tendency 25% | 100 | Usnea diffusa: -6.74 (Yin-tendency after symbiotic algae ×0.6 correction), consistent with the Compendium of Materia Medica [2] | |
| Common medicinal plants - High-altitude type | 7 | Moderate Yin-tendency 85.71%, Weak Yin-tendency 14.29% | 100 | Fritillaria cirrhosa: -5.80 (mildly cold nature after altitude ×1.05 correction), consistent with the Pharmacopoeia of the People’s Republic of China [1] | |
| Common medicinal plants - Saline-alkaline type | 5 | Weak Yang-tendency 60%, Neutral-tendency 40% | 98 | Glycyrrhiza uralensis: +4.66 (neutral to slightly Yang-tendency after saline-alkaline land ×0.75 correction), consistent with traditional records [5] | |
| Common medicinal plants - Ordinary habitat type | 68 | Weak Yang-tendency 39.71%, Weak Yin-tendency 39.71%, Neutral-tendency 20.58% | 98 | Coptis chinensis: -8.20 (Yin-tendency dominated by metabolism with flavonoids ≥6%), consistent with the Pharmacopoeia of the People’s Republic of China [1] |
Note:The consistency rate refers to the Pharmacopoeia of the People’s Republic of China [1]; "Partial consistency" is defined as "correct direction and intensity error ≤15%";high-altitude samples are planned to be expanded to ≥15 species in 2025.
Table 16.
Statistics on Repeated Detection Errors of Core Samples.
| Sample Type | Sample Name | Group 1 Nature Bias Score | Group 2 Nature Bias Score | Group 3 Nature Bias Score | Mean Value | CV Value (%) | Data Sources | Notes |
| Daily food materials | Zingiber officinale | +8.8 | +8.7 | +8.9 | +8.80 | 1.1 | [6,10,15] | Extremely small error, meeting standards |
| Daily food materials | Solanum tuberosum | +0.22 | +0.23 | +0.24 | +0.23 | 4.3 | [14,15] | Low nature bias components in neutral food materials, limited detection sensitivity |
| Special groups | Ganoderma lucidum | +0.18 | +0.19 | +0.20 | +0.19 | 3.5 | [5,8] | Stable correction rules for fungi |
| Special groups | Cistanche deserticola | +6.485 | +6.512 | +6.498 | +6.498 | 0.2 | [12,16] | Reliable metabolic rules for parasitic plants |
Key conclusions: The overall CV=3.2% (excluding neutral food materials), meeting standards; the error of special groups is lower (CV ≤3.5%), verifying the stability of exclusive rules.
Table 17.
Adaptability verification results of extreme scenarios.
| Extreme Scenario | Sample Name | Application of Correction Rules | System Calculation Result | Traditional Warm-Cool Nature | Consistency Status | Data Sources | Sample Size Description |
| High-altitude (3200-3500 m) | Fritillaria cirrhosa | Yin-tendency score ×1.05; C3 photosynthetic threshold decreased by 20% | Moderate Yin-tendency -5.80 | Mildly cold nature | Fully consistent | [9,16] | 7 high-altitude species, planned to expand to ≥15 species in 2025 |
| Saline-alkaline land (pH 8.5-10.0) | Glycyrrhiza uralensis | Yang-tendency score ×0.75; Glycyrrhizic acid not corrected | Weak Yang-tendency +4.66 | Neutral to slightly Yang-tendency | Fully consistent | [5,16] | 5 saline-alkaline species, planned to expand to ≥10 species in 2025 |
| Extreme acidity (pH 3.5-4.0) | Carex lasiocarpa | Yin-tendency score ×1.1; Flavonoids ×1.05 | Moderate Yin-tendency -6.20 | Cold nature | Fully consistent | [5,6] | 8 extreme acidic species, planned to expand to ≥10 species in 2025 |
Key conclusions: Extreme scenarios can explain the differences in nature bias of medicinal materials from genuine producing areas (e.g., the difference in Yin-tendency scores between Panax notoginseng from Yunnan and Sichuan is 0.8), and the rules are promotable (e.g., the saline-alkaline land rules apply to Lycium barbarum from Ningxia and Glycyrrhiza uralensis from Xinjiang).
Disclaimer/Publisher’s Note: The statements, opinions and data contained in all publications are solely those of the individual author(s) and contributor(s) and not of MDPI and/or the editor(s). MDPI and/or the editor(s) disclaim responsibility for any injury to people or property resulting from any ideas, methods, instructions or products referred to in the content. |
© 2025 by the authors. Licensee MDPI, Basel, Switzerland. This article is an open access article distributed under the terms and conditions of the Creative Commons Attribution (CC BY) license (http://creativecommons.org/licenses/by/4.0/).
Copyright: This open access article is published under a Creative Commons CC BY 4.0 license, which permit the free download, distribution, and reuse, provided that the author and preprint are cited in any reuse.


