Submitted:
14 December 2025
Posted:
18 December 2025
You are already at the latest version
Abstract
Endothelial cells are continuously exposed to fluctuations in circulating blood composi-tion and must rapidly adapt to changes in nutrient and growth factor availability. Here, we investigated how serum deprivation—a model of trophic stress—affects stress adapta-tion pathways in human umbilical vein endothelial cells (HUVECSs), focusing on the in-tegrated stress response (ISR), a key mechanism in cellular adaptation. After 24 hours of serum deprivation, HUVECSs exhibited increased cell death, adoption of an elongated stress-associated morphology, and upregulation of pro-inflammatory genes (ICAM1, PLAU, CCL2). Western blot analysis revealed marked phosphorylation of eIF2α, and quantitative PCR confirmed the induction of ATF4 target genes involved in stress adapta-tion and epigenetic regulation (HDAC1, HDAC8), indicating robust ISR activation. In Matrigel angiogenesis assays, serum-deprived cells showed enhanced angiogenic branching, suggesting a compensatory response. Together, these findings identify growth factor deprivation as a potent trigger of the ISR in endothelial cells and suggest that ISR activation may represent an important component of endothelial adaptation to systemic metabolic challenges.
Keywords:
integrated stress response
; eIF2a
; angiogenesis
; serum deprivation
; endothelial cells
1. Introduction
Periods of reduced nutrient and energy availability, such as fasting or caloric restriction, impose substantial stress on both organisms and individual cells. In humans, fasting is accompanied by profound changes in circulating metabolites and growth factors, which are first sensed by vascular endothelial cells [1]. Endothelial cells line the inner surface of blood vessels and are continuously exposed to fluctuations in blood-derived nutrients, hormones, and cytokines. Yet, despite their central position at the interface between the circulation and peripheral tissues, the adaptive stress responses of human endothelial cells to conditions of limited serum-derived factors remain poorly understood.
One of the evolutionarily conserved mechanisms that enables cells to cope with diverse environmental stresses is the integrated stress response (ISR). ISR is centered on the phosphorylation of the α-subunit of eukaryotic initiation factor 2 (eIF2α), which transiently attenuates global protein synthesis while selectively enhancing the translation of specific mRNAs, most notably activating transcription factor 4 (ATF4) [2]. ATF4 then orchestrates a transcriptional program involved in amino acid metabolism, redox homeostasis, and cell fate decisions. Although activation of the ISR has been described in response to amino acid deprivation, ER stress, and oxidative insults [2], its engagement by serum deprivation in human endothelial cells remains insufficiently characterized.
Serum starvation is widely used as an experimental approach to synchronize cells or to mimic conditions of nutrient and growth factor limitation in vitro.
In endothelial cell serum deprivation is frequently applied as a seemingly neutral “baseline” condition preceding stimulation with cytokines, growth factors, or mechanical stress. However, serum withdrawal itself represents a major alteration in the extracellular milieu, including the removal of growth factors, cytokines, lipids, and carrier proteins, and is thus expected to elicit specific stress responses. How this condition is translated into ISR activation in endothelial cells, and which components of the ATF4-dependent transcriptional program are engaged, is largely unknown.
In this study, we used HUVECSs to dissect ISR activation during serum starvation in the presence of glucose, amino acids, and albumin, a condition that mimics growth factor withdrawal rather than complete nutrient deprivation.
2. Materials and Methods
2.1. Cell Isolation and Culture
Umbilical vein endothelial cells (HUVECS) were kindly provided by O.A. Antonova from the Laboratory of Cell Adhesion of Chazov National Medical Research Center of Cardiology of the Ministry of Health of Russian Federation. HUVECSs were cultured in complete EGM-2 MV medium (Lonza, Basel, Swiss) until 70% confluence in a humidified chamber incubator at 37 C and 5% CO2. In all experiments, HUVECSs were used at passage 3 to 5. In each experiment, we used at least three biological repeats (one donor per repeat).
2.2. Tube Formation Assay on MatrigelTM In Vitro
The in vitro endothelial cell tube formation assay was performed and quantified as described by us previously [21]. Briefly,1) 35*103 cells were seeded per well onto the 48 well plate (Corning, NY, USA) covered with 200 µl of MatrigelTM (Corning, NY, USA) and cultured for 24 h in the EGM-2 MV media (Lonza, Basel, Swiss). Images were taken using the Image Exfluorer AI (LCI, Republic of Korea). The tube formation assay images were analyzed using WimTube: Tube Formation Assay Image Analysis Solution. Release 4.0. (Wimasis, 2016). Available from: https://www.wimasis.com/en/products/13/WimTube.
2.3. Studying the Impact of Serum Starvation on Cellular Morphology
Cells were seeded as a mono culture at the density of 30 × 103 cells or 60 × 103 cells per well of 24-well plate (Corning, USA) in EGM-2 MV media (Lonza, Basel, Swiss) and cultured for 24 h. After that media was changed for the EGM-2 MV media (Lonza, Basel, Swiss) or 0,5% BSA fraction V (Sigma-Aldrich, USA) + EBM media (Lonza, Basel, Swiss) and cells were continued to culture for additional 48 h. Images were taken using the Image Exfluorer AI (LCI, Republic of Korea) during cultivation at time points 2, 4, 24, 48 h. Cell numbers were quantified manually using the Cell Counter plugin in Fiji/ImageJ (version 2.9.0/1.53, NIH, USA).
2.4. Real-Time Quantitative PCR
Cells were seeded as a mono culture at the density of 500 × 103 cells per 100sm2 Petri dish and cultured for 48 h in the EGM-2 MV media (Lonza, Basel, Swiss) until confluent monolayer. After that media was changed for the EGM-2 MV media (Lonza, Basel, Swiss) or 0,5% BSA fraction V + EBM media (Lonza, Basel, Swiss) and cells were continued to culture for additional 24 h. Total RNA was extracted, reverse-transcribed, and amplified by RT-PCR using commercial kits according to the manufacturer's instructions (Evrogen, Russia), the primers used are listed in Table 1.
2.4. Western Blot
HUVECSs were cultured until 60-70% of monolayer. After that media was changed for the EGM-2 MV media (Lonza, Basel, Swiss) or 0,5% BSA fraction V + EBM media (Lonza, Basel, Swiss). Cells were lysed in RIPA buffer with protease inhibitors (Protease Inhibitor Cocktail, HY-K0010, MedChemExpress, Junction, NJ, USA) and phosphatase inhibitors (Phosphatase Inhibitor Cocktail II, HY-K0022, MedChemExpress, Junction, NJ, USA). Samples were resolved by 15% SDS-PAGE and electrotransferred to a polyvinylidene difluoride membrane (Millipore, Burlington, MA, USA). After blocking with 5% non-fat milk in TBST for 1 h, the membrane was incubated overnight at 4 °C with primary antibodies: Anti-Phospho-EIF2S1(Ser51) (#K011481M, SolarBio, Beijing, China) and Anti-eIF2alpha/EIF2S1 (#112127-T34, SinoBilogical, Beijing, China)
3. Results
3.1. Endothelial Cells Starvation Enhances Angiogenesis
Human endothelial cells (HUVECS) form the inner layer of blood vessels and are crucial for vascular homeostasis, controlling blood pressure and facilitating nutrient exchange [3]. To evaluate the angiogenic function of HUVECS, we performed a tube formation assay. The results demonstrated that, during starvation, more tubes are formed, however, their perimeter and area are smaller compared to control samples (Figure 1).
To validate the results of the 2D angiogenesis assay, we analyzed the expression of several factors associated with angiogenesis. We found that starvation reduces the expression of FLT1, ANGPT1, ANGPT2 and SDC1 (Figure 2A). These factors were demonstrated to contribute to vascular maturation [4,5,6]. Furthermore, Kearney et al. showed that FLT1 knockout enhances vascularization in cell cultures [5]. Conversely, vascular maturation is associated with reduced levels of VEGFR2 [7]. In our experiment, we observed VEGFR2 upregulation under starvation conditions (Figure 2B). Another marker of impaired angiogenesis is the suppression of Notch signaling [8], as evidenced by the downregulation of JAG1, HES1, HES2, HEY1 and HEY2 proteins in starved HUVECS (Fig. 2C). Therefore, starvation enhances uncanonical angiogenesis in HUVECS, characterized by the suppression of the Notch pathway and the increased formation of immature vessels.
3.2. The Starvation-Associated Stress Phenotype of HUVECS Is Governed by the Integrated Stress Response Signaling
The ISR pathway is capable of blocking global translation in a cell and enhancing the synthesis of selected proteins [2]. We found that starvation activates the ISR pathway. This is evidenced by an increase in the phosphorylation level of the alpha subunit of eukaryotic translation initiation factor 2 (Figure 3B), the upregulation of the main ISR transcription factors ATF3 and ATF4 (Fig. 3C), and the increased expression of ATF4-regulated genes, including HDAC1, HDAC8, GADD34, HERPUD1, and NRF2 (Fig. 3D). Thus, starvation triggers the ISR cascade in HUVECS and determines the expression profile of these cells.
3.3. Starvation Affects HUVECS Viability
The ISR pathway essentially controls the cell's transcriptional and translational apparatus during stress and determines its fate [2]. Depending on the type and duration of stress exposure, the ISR signaling can direct the cell towards survival and differentiation or towards cell death [2]. Using microscopy of HUVECS cultures, we demonstrated that 24-hour high cell density (Figure 4) and 48-hour (supplementary material 1) starvation leads to a significant decrease in HUVECS survival.
To confirm the detrimental impact of starvation on HUVECS, we analyzed the expression of several factors in key cellular signaling pathways. We found that starvation downregulates the Hippo signaling pathway anti-apoptotic molecules YAP1 and TEAD1 in HUVECS (Figure 5A) [9]. Simultaneously, we observed CCN3 upregulation (Fig. 5B), a pro-apoptotic factor [10]. Additionally, starvation causes the upregulation of pro-inflammatory factors, including CCL2, ICAM1, and PLAU (Fig. 5C) [11,12]. We also observed the downregulation of proteins associated with matrix homeostasis (ITGA5, ITGB3) and with endothelial to mesenchymal transition (TAGLN, SNAI1) – Fig. 5 D. Thus, starvation activates pro-apoptotic and pro-inflammatory signaling pathways in HUVECS.
4. Discussion
Serum deprivation is frequently applied as a “baseline” condition for cells synchronization or to reduce exogenous growth factor signaling. However, serum is a chemically complex and variable supplement that supplies not only mitogens but also carrier proteins, lipids, hormones, and micronutrients; therefore, its withdrawal is itself a strong perturbation rather than a neutral control [13,14]. In line with this view, multiple studies demonstrate that serum starvation rapidly reprograms EC redox state, metabolism, secretory output, and responsiveness to inflammatory cues, making the interpretation of “starved” conditions inherently mechanistic rather than merely technical [15,16,17,18,19].
Serum deprivation mimics the conditions of nutrient and growth factor deprivation observed in various pathological contexts, including atherosclerosis and ischemic diseases, and in endothelial cells it can reproduce several core features of endothelial dysfunction: increased oxidative stress, morphological aberrations, impaired survival signaling, and a heightened susceptibility to pro-inflammatory cues [15,16]. Although serum deprivation does not replicate the complex hemodynamic forces of disturbed flow at arterial bifurcations, it effectively models an inflammatory and pro-adhesive shift in the endothelial phenotype. Russell and Hamilton showed that serum-starved HUVECSs exhibit markedly increased mitochondrial superoxide production and become substantially more susceptible to pro-inflammatory insults (TNF-α), with morphological aberrations and enhanced neutrophil adhesion under low-serum conditions [15]. This framework is consistent with our observations that serum deprivation is accompanied by a pronounced stress-associated elongation phenotype and a pro-inflammatory transcriptional shift (ICAM1/PLAU/CCL2) – Fig. 5C. These markers collectively represent a canonical “activated endothelium” state that promotes leukocyte recruitment and amplifies vascular inflammation - a key event in plaque formation [20,21].
Mechanistically, serum deprivation disrupts key homeostatic pathways. For instance, serum deprivation has been shown to rapidly induce apoptosis in vascular endothelial cells, highlighting the sensitivity of the endothelium to growth factor withdrawal [22]. In our model, we similarly detect massive cell death by 48 h. (supplementary material 1). Notably, we additionally observe a cell-density-dependent loss of cells already by 24 h under high seeding (60k), plausibly explained by increased competition for limiting nutrients and/or autocrine/paracrine survival factors under starvation (Figure 4). In parallel, literature indicates that nutrient deprivation can also promote senescence in HUVECSs (e.g., SA-β-gal positivity), depending on exposure conditions and duration [23].
A particularly useful conceptual scaffold for our time-course is the biphasic starvation response described by Latham et al. [24]. In their model (serum-deprived MCDB-131 supplemented with 0.2% BSA), the early stress-survival phase (≈0–16 h) was characterized by a pro-survival, pro-angiogenic sensitization: VEGFR2 protein increased and FLT1 (VEGFR1) decreased, accompanied by increased phosphorylation of stress/adaptation-associated kinases (Akt, p38, and MAPKAPK2), whereas a later phase (24–48 h) is marked by increased FLT1 deposition, loss of VEGFR2, and entry into apoptosis [24]. Consistent with this, we detect increased VEGFR2 and decreased FLT1 mRNA expression in serum-deprived HUVECS and improved tube-formation parameters of starved HUVECSS in Matrigel Angiogenesis Assay (Fig. 1 and fig. 2). Our analysis revealed that networks exhibited more branching points, tubes, and loops, but smaller loop perimeter/area, indicating a shift toward a finer, more highly partitioned meshwork rather than a simple gain/loss of angiogenic capacity (Fig. 1B). This “patterning shift” is conceptually compatible with idea that in early adaptive window, endothelial cells may remain competent to form networks, before compensation collapses and cell death dominates.
These observations support the conclusion that serum deprivation at early phase shift EC into an adaptive stress program. One of such universal adaptive stress program is the integrated stress response—a conserved pathway centered on phosphorylation of eIF2α by stress- and nutrient-sensing kinases (PERK/EIF2AK3, GCN2/EIF2AK4, PKR/EIF2AK2, HRI/EIF2AK1), leading to selective translation of ATF4 and downstream transcriptional programs that regulate amino acid metabolism, redox control, and proteostasis [25,26,27]. In our model, serum deprivation robustly increases eIF2α phosphorylation (24 h) and induces ATF4 target genes (e.g., stress-adaptive and proteostasis-associated transcripts), supporting bona fide ISR activation (Fig. 3). The gene-expression pattern we observed is consistent with canonical ISR outputs. GADD34 is particularly informative because it is a canonical ISR negative-feedback component that promotes eIF2α dephosphorylation, indicating that the ISR is not only triggered but also actively regulated at 24 h. The induction of HERPUD1 (an ERAD-associated gene) and NRF2/ATF3 (redox/stress transcriptional regulators) is compatible with a model in which prolonged serum deprivation progressively generates proteostasis and oxidative stress, converging on the eIF2α–ATF4 axis. Moreover, in endothelial cells, oxidized phospholipids (relevant to atherogenic environments) were shown to induce ATF4 and VEGF via an NRF2-dependent mechanism [28]. Furthermore, amino acid restriction can trigger angiogenesis via the GCN2–eIF2α–ATF4 axis, driving expression of VEGF and cystathionine-γ-lyase [29]. Thus, ISR activation is not necessarily incompatible with preserved (or transiently improved) angiogenic behavior and may contribute to the compensatory window observed at 24 h.
We observed an upregulation of HDAC1 and HDAC8 transcripts—both recognized as primary targets of ATF4 [30,31]—during serum deprivation, suggesting that the early adaptive response involves not only translational reprogramming but also epigenetic remodeling. In contrast, SIRT1 was not robustly induced under these conditions, despite its well-established role as a nutrient-sensing, NAD⁺-dependent deacetylase implicated in the promotion of autophagy [32].
Under nutrient limitation, endothelial metabolic plasticity can be mobilized to sustain cellular function, and—in some contexts—support angiogenesis in unfavorable environments [17,29]. Lorenz et al. provide an instructive metabolic precedent: serum starvation reduces steady-state levels of glycolytic and TCA intermediates but accelerates intracellular metabolite turnover (faster 13C incorporation) and increased amino acid pools (that could lead to ATF4 activation) that consistent with an adaptive increase in metabolic activity to cope with energy deficiency [17].
Finally, Notch signaling was significantly remodeled in our dataset. Despite reports that serum starvation and VEGF can up-regulate Notch pathway regulators (e.g., HES1, NOTCH1/4) in brain microvascular endothelial cells [19], 24 h serum deprivation in our conditions resulted in suppression of canonical Notch output: JAG1, HES1/2 and HEY1/2 transcription factors were consistently downregulated (Fig. 2C). Together, these data indicate that the early pro-angiogenic phenotype is compatible with VEGFR2-linked compensation and ISR-associated stress remodeling, while Notch-dependent transcriptional programs are dampened rather than activated under serum deprivation in our model [19].
This was accompanied by strong downregulation of cell–matrix adhesion and mechanotransduction regulators — syndecan 1 (SDC1), ITGA5/ITGB3, TAGLN, and the YAP1–TEAD module—together with decreased SNAI1, collectively suggesting blunted integrin–cytoskeleton and mechano-transcriptional signaling, i.e., a shift away from a migratory program under trophic deprivation, which is also consistent with Latham et al., where endothelial migration was impaired under serum deprivation [24].
Taken together, our findings support a two-stage model of endothelial response to serum deprivation. The first stage (≤24 h) is characterized by a compensatory, partially pro-angiogenic adaptation that includes VEGFR2 upregulation, ISR activation (eIF2α phosphorylation and ATF4 target induction), metabolic remodeling, and an inflammatory activation signature (ICAM1/PLAU/CCL2). The second stage (24–48 h) represents failure of compensation with pronounced cell loss, consistent with the late starvation phase described in the biphasic framework.
5. Conclusions
Serum deprivation represents a reductionist in vitro model of endothelial dysfunction driven by the withdrawal of trophic and growth factor support. It elicits a dynamic response comprising both adaptive and degenerative processes. In line with previously proposed biphasic models, our data support the existence of an early compensatory phase (≤24 h), characterized by upregulation of VEGFR2, engagement of the integrated stress response (evidenced by eIF2α phosphorylation and induction of ATF4 target genes), and the emergence of a pro-adhesive, inflammatory phenotype (ICAM1, PLAU, CCL2), alongside transiently enhanced angiogenic signaling. Upon prolonged deprivation (48 h), adaptive capacity was exceeded, leading to marked cell loss. Collectively, our findings position ISR activation within the early adaptive phase of serum withdrawal and highlight its potential role in coordinating inflammatory and angiogenic behavior in endothelial cells under trophic stress.
Author Contributions
Irina Beloglazova: Visualization, Experimental Work, Writing - Original Draft; Alexander Kalinin: Experimental Work, Writing - Original Draft; Ekaterina Zubkova: Conceptualization, Writing, Review & Editing; Yelena Parfyonova: Supervision, Review & Editing; Mikhail Menshikov: Writing - Review & Editing, Funding acquisition.
Funding
This work is supported by Russian Science Foundation, RSF project #23-15-00539.
Conflicts of Interest
The authors declare no conflicts of interest.
Abbreviations
The following abbreviations are used in this manuscript:
| ATF3 | Activating Transcription Factor 3 |
| ATF4 | Activating Transcription Factor 4 |
| ATG5 | Autophagy Related 5 |
| ATG7 | Autophagy Related 7 |
| Akt | Protein Kinase B (PKB) |
| BSA | Bovine Serum Albumin |
| CCL2 | C-C Motif Chemokine Ligand 2 (MCP-1) |
| EBM | Endothelial Basal Medium |
| EC | Endothelial Cells |
| EGM-2 MV | Endothelial Growth Medium-2 Microvascular |
| eIF2α | Eukaryotic Initiation Factor 2 Alpha |
| EIF2AK1 | Eukaryotic Translation Initiation Factor 2 Alpha Kinase 1 (HRI) |
| EIF2AK2 | Eukaryotic Translation Initiation Factor 2 Alpha Kinase 2 (PKR) |
| EIF2AK3 | Eukaryotic Translation Initiation Factor 2 Alpha Kinase 3 (PERK) |
| EIF2AK4 | Eukaryotic Translation Initiation Factor 2 Alpha Kinase 4 (GCN2) |
| ER | Endoplasmic Reticulum |
| ERAD | ER-Associated Degradation |
| FBS | Fetal Bovine Serum |
| GADD34 | Growth Arrest and DNA Damage-inducible Protein 34 |
| GCN2 | General Control Nonderepressible 2 (EIF2AK4) |
| HDAC1 | Histone Deacetylase 1 |
| HDAC8 | Histone Deacetylase 8 |
| HERPUD1 | Homocysteine Inducible ER Protein With Ubiquitin Like Domain 1 |
| HRI | Heme-Regulated Inhibitor (EIF2AK1) |
| HUVECSs | Human Umbilical Vein Endothelial Cells |
| ICAM1 | Intercellular Adhesion Molecule 1 |
| ISR | Integrated Stress Response |
| KDR | Kinase Insert Domain Receptor (VEGFR2) |
| MAPKAPK2 | MAPK-Activated Protein Kinase 2 |
| NAD⁺ | Nicotinamide Adenine Dinucleotide (oxidized form) |
| NRF2 | Nuclear Factor Erythroid 2–Related Factor 2 |
| p38 | p38 Mitogen-Activated Protein Kinase |
| p62/SQSTM1 | Sequestosome-1 |
| PCR | Polymerase Chain Reaction |
| PERK | Protein Kinase RNA-like ER Kinase (EIF2AK3) |
| PKR | Protein Kinase R (EIF2AK2) |
| RT-PCR | Reverse Transcription Polymerase Chain Reaction |
| SA-β-gal | Senescence-Associated Beta-Galactosidase |
| sFlt-1 | Soluble Fms-Like Tyrosine Kinase-1 (sVEGFR1) |
| SIRT1 | Sirtuin 1 |
| TCA | Tricarboxylic Acid Cycle (Krebs cycle) |
| TLA | Three Letter Acronym |
| TNF-α | Tumor Necrosis Factor Alpha |
| VEGF | Vascular Endothelial Growth Factor |
| VEGFR1 | Vascular Endothelial Growth Factor Receptor 1 (Flt-1) |
| VEGFR2 | Vascular Endothelial Growth Factor Receptor 2 (KDR) |
References
- Pietrocola, F.; Demont, Y.; Castoldi, F.; Enot, D.; Durand, S.; Semeraro, M.; Baracco, E.E.; Pol, J.; Bravo-San Pedro, J.M.; Bordenave, C.; et al. Metabolic Effects of Fasting on Human and Mouse Blood in Vivo. Autophagy 2017, 13, 567–578. [Google Scholar] [CrossRef] [PubMed]
- Kalinin, A.; Zubkova, E.; Menshikov, M. Integrated Stress Response (ISR) Pathway: Unraveling Its Role in Cellular Senescence. Int. J. Mol. Sci. 2023, 24, 17423. [Google Scholar] [CrossRef]
- Hennigs, J.K.; Matuszcak, C.; Trepel, M.; Körbelin, J. Vascular Endothelial Cells: Heterogeneity and Targeting Approaches. Cells 2021, 10. [Google Scholar] [CrossRef]
- Orecchia, P.; Conte, R.; Balza, E.; Petretto, A.; Mauri, P.; Mingari, M.C.; Carnemolla, B. A Novel Human Anti-Syndecan-1 Antibody Inhibits Vascular Maturation and Tumour Growth in Melanoma. Eur. J. Cancer 2013, 49, 2022–2033. [Google Scholar] [CrossRef]
- Kearney, J.B.; Ambler, C.A.; Monaco, K.-A.; Johnson, N.; Rapoport, R.G.; Bautch, V.L. Vascular Endothelial Growth Factor Receptor Flt-1 Negatively Regulates Developmental Blood Vessel Formation by Modulating Endothelial Cell Division. Blood 2002, 99, 2397–2407. [Google Scholar] [CrossRef]
- Saharinen, P.; Alitalo, K. The Yin, the Yang, and the Angiopoietin-1. J. Clin. Invest. 2011, 121, 2157–2159. [Google Scholar] [CrossRef]
- Ehling, M.; Adams, S.; Benedito, R.; Adams, R.H. Notch Controls Retinal Blood Vessel Maturation and Quiescence. Development 2013, 140, 3051–3061. [Google Scholar] [CrossRef]
- Akil, A.; Gutiérrez-García, A.K.; Guenter, R.; Rose, J.B.; Beck, A.W.; Chen, H.; Ren, B. Notch Signaling in Vascular Endothelial Cells, Angiogenesis, and Tumor Progression: An Update and Prospective. Front. Cell Dev. Biol. 2021, 9. [Google Scholar] [CrossRef]
- Zhou, W.; Lim, A.; Edderkaoui, M.; Osipov, A.; Wu, H.; Wang, Q.; Pandol, S. Role Of YAP Signaling in Regulation of Programmed Cell Death and Drug Resistance in Cancer. Int. J. Biol. Sci. 2024, 20, 15–28. [Google Scholar] [CrossRef]
- Guo, Z.; Zhang, H.; Huang, T.; Liu, C. CCN3/NOV Inhibition Attenuates Oxidative Stress-Induced Apoptosis of Mouse Neural Stem/Progenitor Cells by Blocking the Activation of P38 MAPK: An in Vitro Study. Brain Res. 2024, 1827, 148756. [Google Scholar] [CrossRef]
- Fang, L.; Che, Y.; Zhang, C.; Huang, J.; Lei, Y.; Lu, Z.; Sun, N.; He, J. PLAU Directs Conversion of Fibroblasts to Inflammatory Cancer-Associated Fibroblasts, Promoting Esophageal Squamous Cell Carcinoma Progression via UPAR/Akt/NF-ΚB/IL8 Pathway. Cell Death Discov. 2021, 7, 32. [Google Scholar] [CrossRef] [PubMed]
- Won Jun, H.; Kyung Lee, H.; Ho Na, I.; Jeong Lee, S.; Kim, K.; Park, G.; Sook Kim, H.; Ju Son, D.; Kim, Y.; Tae Hong, J.; et al. The Role of CCL2, CCL7, ICAM-1, and VCAM-1 in Interaction of Endothelial Cells and Natural Killer Cells. Int. Immunopharmacol. 2022, 113, 109332. [Google Scholar] [CrossRef]
- van der Valk, J. Fetal Bovine Serum (FBS): Past – Present – Future. ALTEX 2018, 99–118. [Google Scholar] [CrossRef] [PubMed]
- Pirkmajer, S.; Chibalin, A. V. Serum Starvation: Caveat Emptor. Am. J. Physiol. Physiol. 2011, 301, C272–C279. [Google Scholar] [CrossRef]
- Russell, F.D.; Hamilton, K.D. Nutrient Deprivation Increases Vulnerability of Endothelial Cells to Proinflammatory Insults. Free Radic. Biol. Med. 2014, 67, 408–415. [Google Scholar] [CrossRef]
- Scioli, M.G.; Bielli, A.; Agostinelli, S.; Tarquini, C.; Arcuri, G.; Ferlosio, A.; Costanza, G.; Doldo, E.; Orlandi, A. Antioxidant Treatment Prevents Serum Deprivation- and TNF-α-Induced Endothelial Dysfunction through the Inhibition of NADPH Oxidase 4 and the Restoration of β-Oxidation. J. Vasc. Res. 2014, 51, 327–337. [Google Scholar] [CrossRef]
- Lorenz, M.; Fritsche-Guenther, R.; Bartsch, C.; Vietzke, A.; Eisenberger, A.; Stangl, K.; Stangl, V.; Kirwan, J.A. Serum Starvation Accelerates Intracellular Metabolism in Endothelial Cells. Int. J. Mol. Sci. 2023, 24, 1189. [Google Scholar] [CrossRef]
- Lorenz, M.; Witt, E.; Völker, U.; Stangl, K.; Stangl, V.; Hammer, E. Serum Starvation Induces Sexual Dimorphisms in Secreted Proteins of Human Umbilical Vein Endothelial Cells (HUVECs) from Twin Pairs. Proteomics 2022, 22. [Google Scholar] [CrossRef] [PubMed]
- Li, L.; Liu, X.; Zhao, M.; Guo, P.; Zhang, H. Effects of Serum Starvation and Vascular Endothelial Growth Factor Stimulation on the Expression of Notch Signalling Pathway Components. Sci. Prog. 2021, 104. [Google Scholar] [CrossRef]
- Mestas, J.; Ley, K. Monocyte-Endothelial Cell Interactions in the Development of Atherosclerosis. Trends Cardiovasc. Med. 2008, 18, 228–232. [Google Scholar] [CrossRef]
- Nelken, N.A.; Coughlin, S.R.; Gordon, D.; Wilcox, J.N. Monocyte Chemoattractant Protein-1 in Human Atheromatous Plaques. J. Clin. Invest. 1991, 88, 1121–1127. [Google Scholar] [CrossRef]
- Hogg, N.; Browning, J.; Howard, T.; Winterford, C.; Fitzpatrick, D.; Gobé, G. Apoptosis in Vascular Endothelial Cells Caused by Serum Deprivation, Oxidative Stress and Transforming Growth Factor-β. Endothelium 1999, 7, 35–49. [Google Scholar] [CrossRef]
- Jimenez Trinidad, F.R.; Arrieta Ruiz, M.; Solanes Batlló, N.; Vea Badenes, À.; Bobi Gibert, J.; Valera Cañellas, A.; Roqué Moreno, M.; Freixa Rofastes, X.; Sabaté Tenas, M.; Dantas, A.P.; et al. Linking In Vitro Models of Endothelial Dysfunction with Cell Senescence. Life 2021, 11, 1323. [Google Scholar] [CrossRef]
- Latham, A.M.; Odell, A.F.; Mughal, N.A.; Issitt, T.; Ulyatt, C.; Walker, J.H.; Homer-Vanniasinkam, S.; Ponnambalam, S. A Biphasic Endothelial Stress-Survival Mechanism Regulates the Cellular Response to Vascular Endothelial Growth Factor A. Exp. Cell Res. 2012, 318, 2297–2311. [Google Scholar] [CrossRef]
- Costa-Mattioli, M.; Walter, P. The Integrated Stress Response: From Mechanism to Disease. Science (80-. ) 2020, 368. [Google Scholar] [CrossRef]
- Pakos-Zebrucka, K.; Koryga, I.; Mnich, K.; Ljujic, M.; Samali, A.; Gorman, A.M. The Integrated Stress Response. EMBO Rep. 2016, 17, 1374–1395. [Google Scholar] [CrossRef] [PubMed]
- Wek, R.C. Role of EIF2α Kinases in Translational Control and Adaptation to Cellular Stress. Cold Spring Harb. Perspect. Biol. 2018, 10, a032870. [Google Scholar] [CrossRef] [PubMed]
- Afonyushkin, T.; Oskolkova, O. V.; Philippova, M.; Resink, T.J.; Erne, P.; Binder, B.R.; Bochkov, V.N. Oxidized Phospholipids Regulate Expression of ATF4 and VEGF in Endothelial Cells via NRF2-Dependent Mechanism: Novel Point of Convergence Between Electrophilic and Unfolded Protein Stress Pathways. Arterioscler. Thromb. Vasc. Biol. 2010, 30, 1007–1013. [Google Scholar] [CrossRef]
- Longchamp, A.; Mirabella, T.; Arduini, A.; MacArthur, M.R.; Das, A.; Treviño-Villarreal, J.H.; Hine, C.; Ben-Sahra, I.; Knudsen, N.H.; Brace, L.E.; et al. Amino Acid Restriction Triggers Angiogenesis via GCN2/ATF4 Regulation of VEGF and H2S Production. Cell 2018, 173, 117–129.e14. [Google Scholar] [CrossRef]
- Deng, X.; He, Y.; Miao, X.; Yu, B. ATF4-Mediated Histone Deacetylase HDAC1 Promotes the Progression of Acute Pancreatitis. Cell Death Dis. 2021, 12, 5. [Google Scholar] [CrossRef] [PubMed]
- Han, J.; Back, S.H.; Hur, J.; Lin, Y.-H.; Gildersleeve, R.; Shan, J.; Yuan, C.L.; Krokowski, D.; Wang, S.; Hatzoglou, M.; et al. ER-Stress-Induced Transcriptional Regulation Increases Protein Synthesis Leading to Cell Death. Nat. Cell Biol. 2013, 15, 481–490. [Google Scholar] [CrossRef] [PubMed]
- Lee, I.H.; Cao, L.; Mostoslavsky, R.; Lombard, D.B.; Liu, J.; Bruns, N.E.; Tsokos, M.; Alt, F.W.; Finkel, T. A Role for the NAD-Dependent Deacetylase Sirt1 in the Regulation of Autophagy. Proc. Natl. Acad. Sci. 2008, 105, 3374–3379. [Google Scholar] [CrossRef] [PubMed]
Figure 1.
2D angiogenesis tube formation assay microphotographs and tube assay metrics. (n=3).
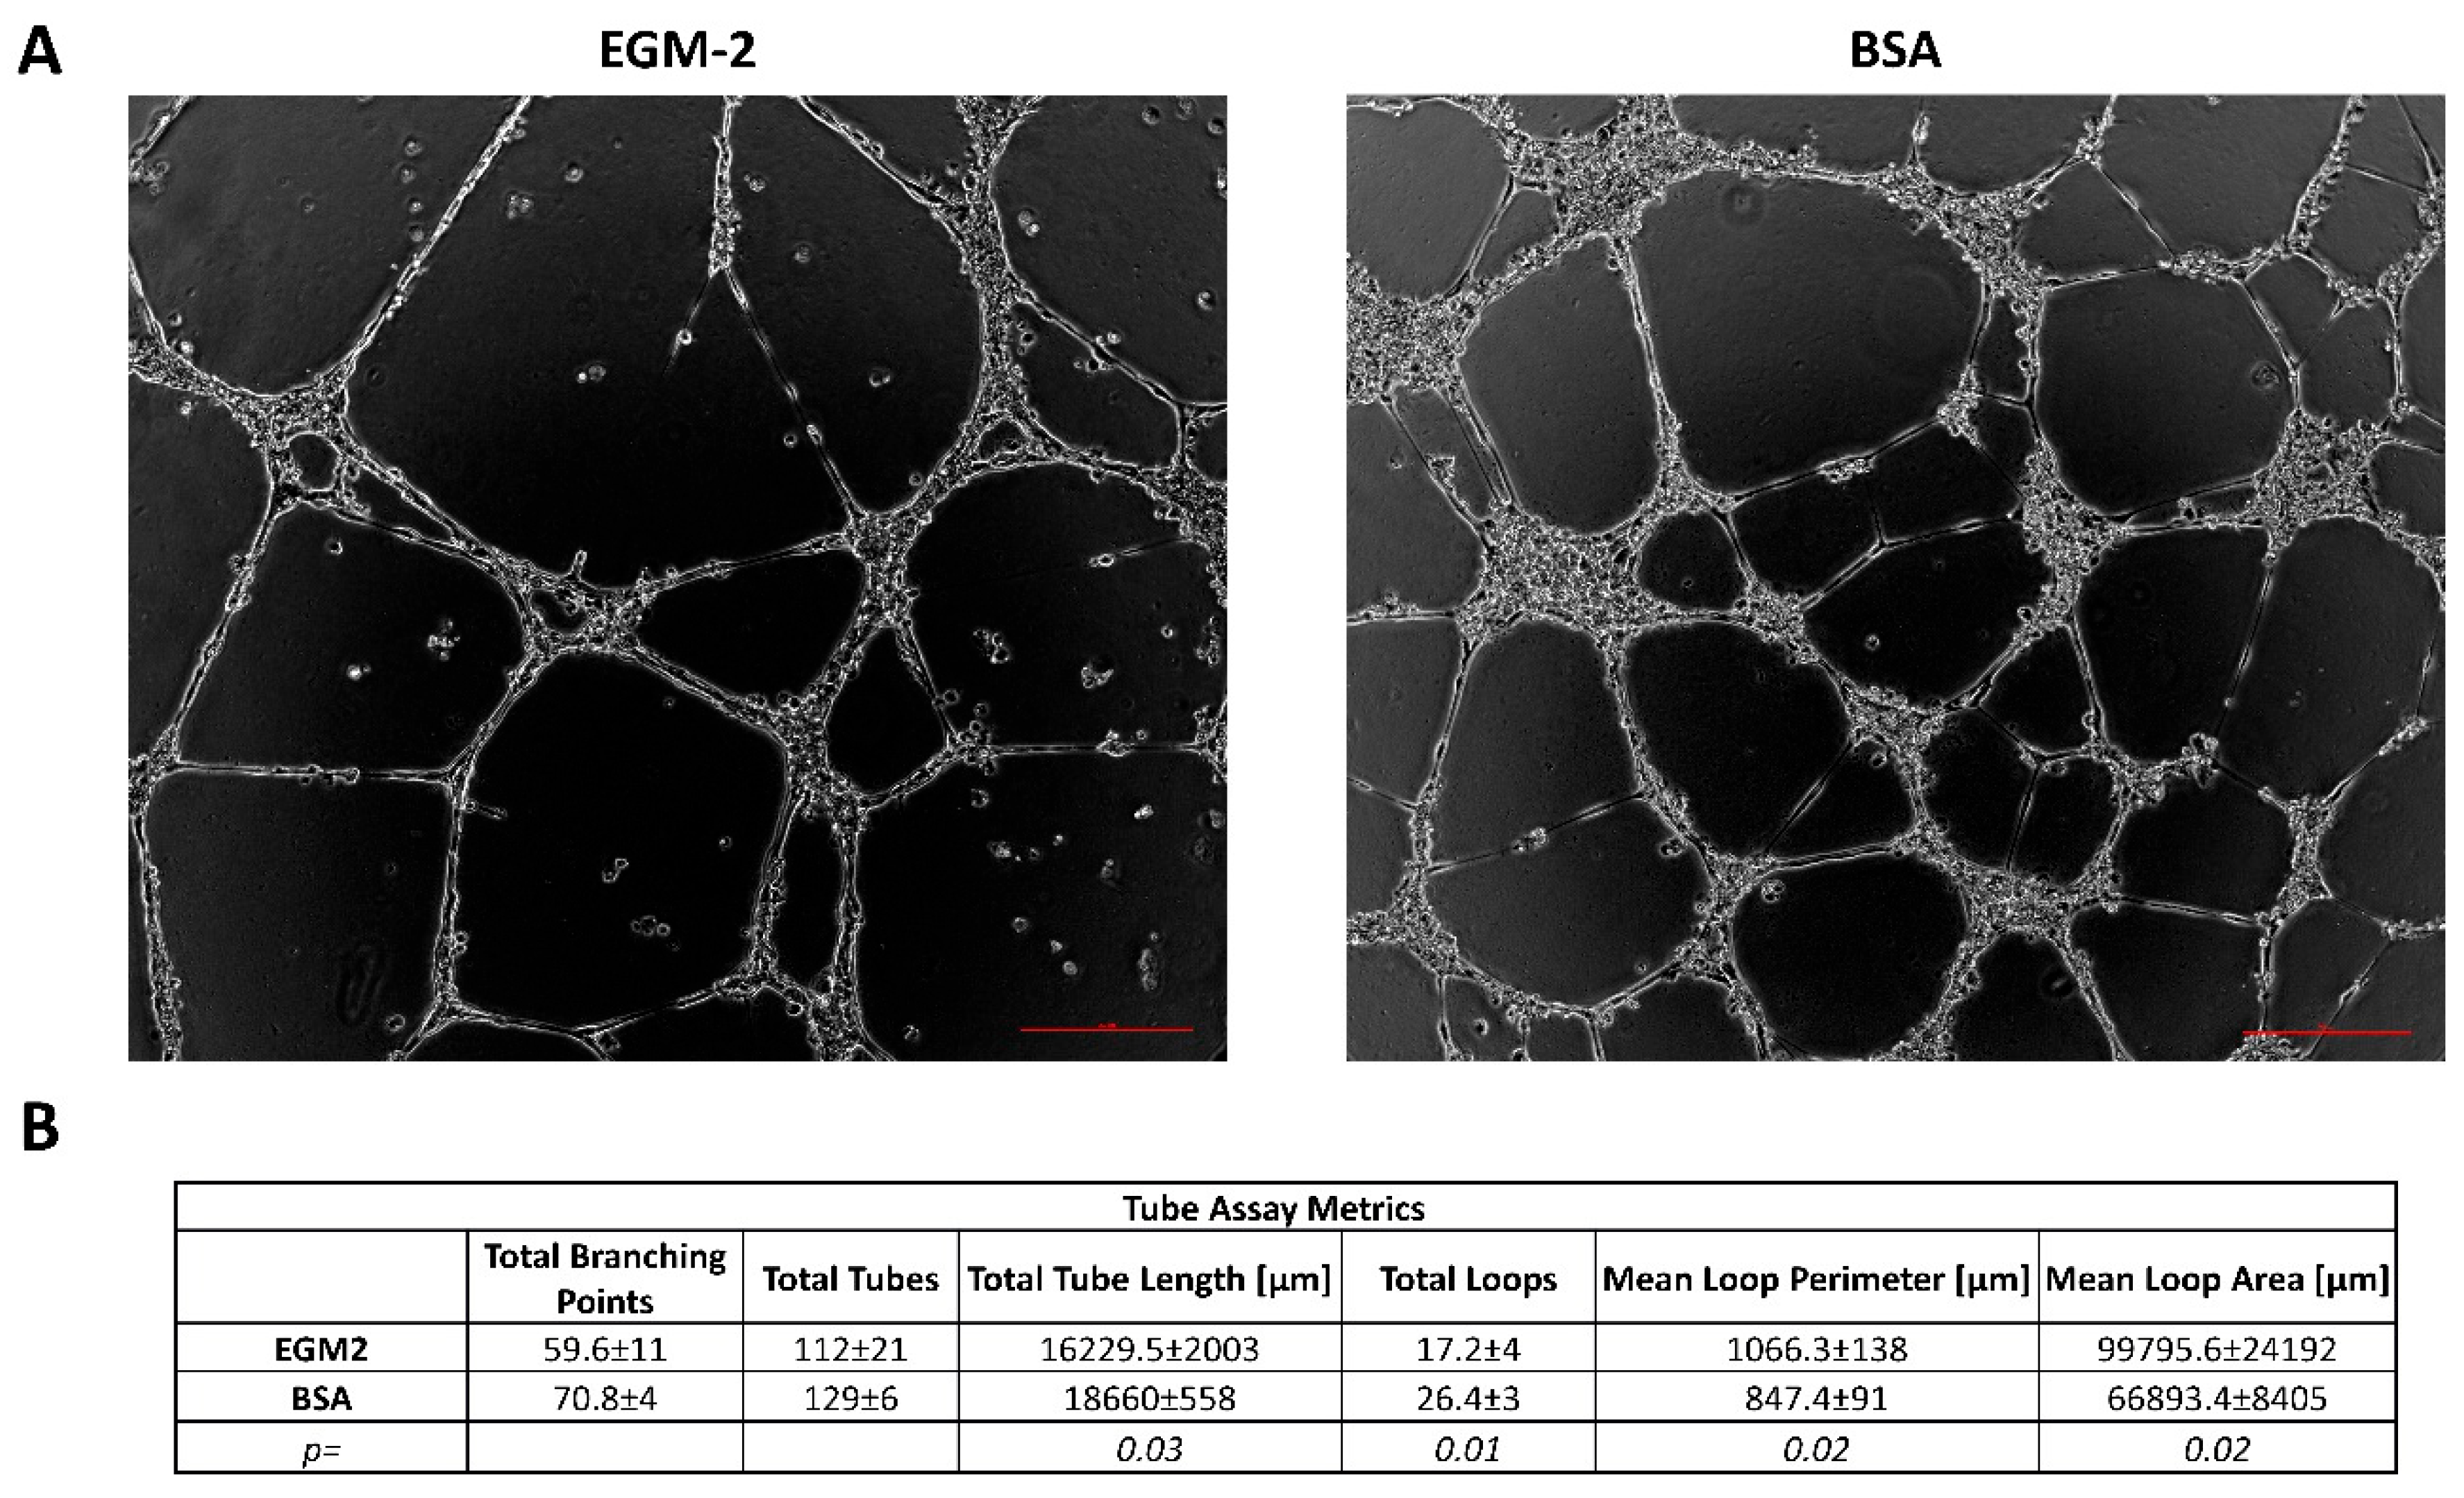
Figure 2.
RT-qPCR analysis of angiogenic (A, B) and the Notch pathway factors alterations. (n = 3; * p ≤ 0.05; ** p ≤ 0.01; *** p ≤ 0.001; **** p ≤ 0.0001).
Figure 2.
RT-qPCR analysis of angiogenic (A, B) and the Notch pathway factors alterations. (n = 3; * p ≤ 0.05; ** p ≤ 0.01; *** p ≤ 0.001; **** p ≤ 0.0001).
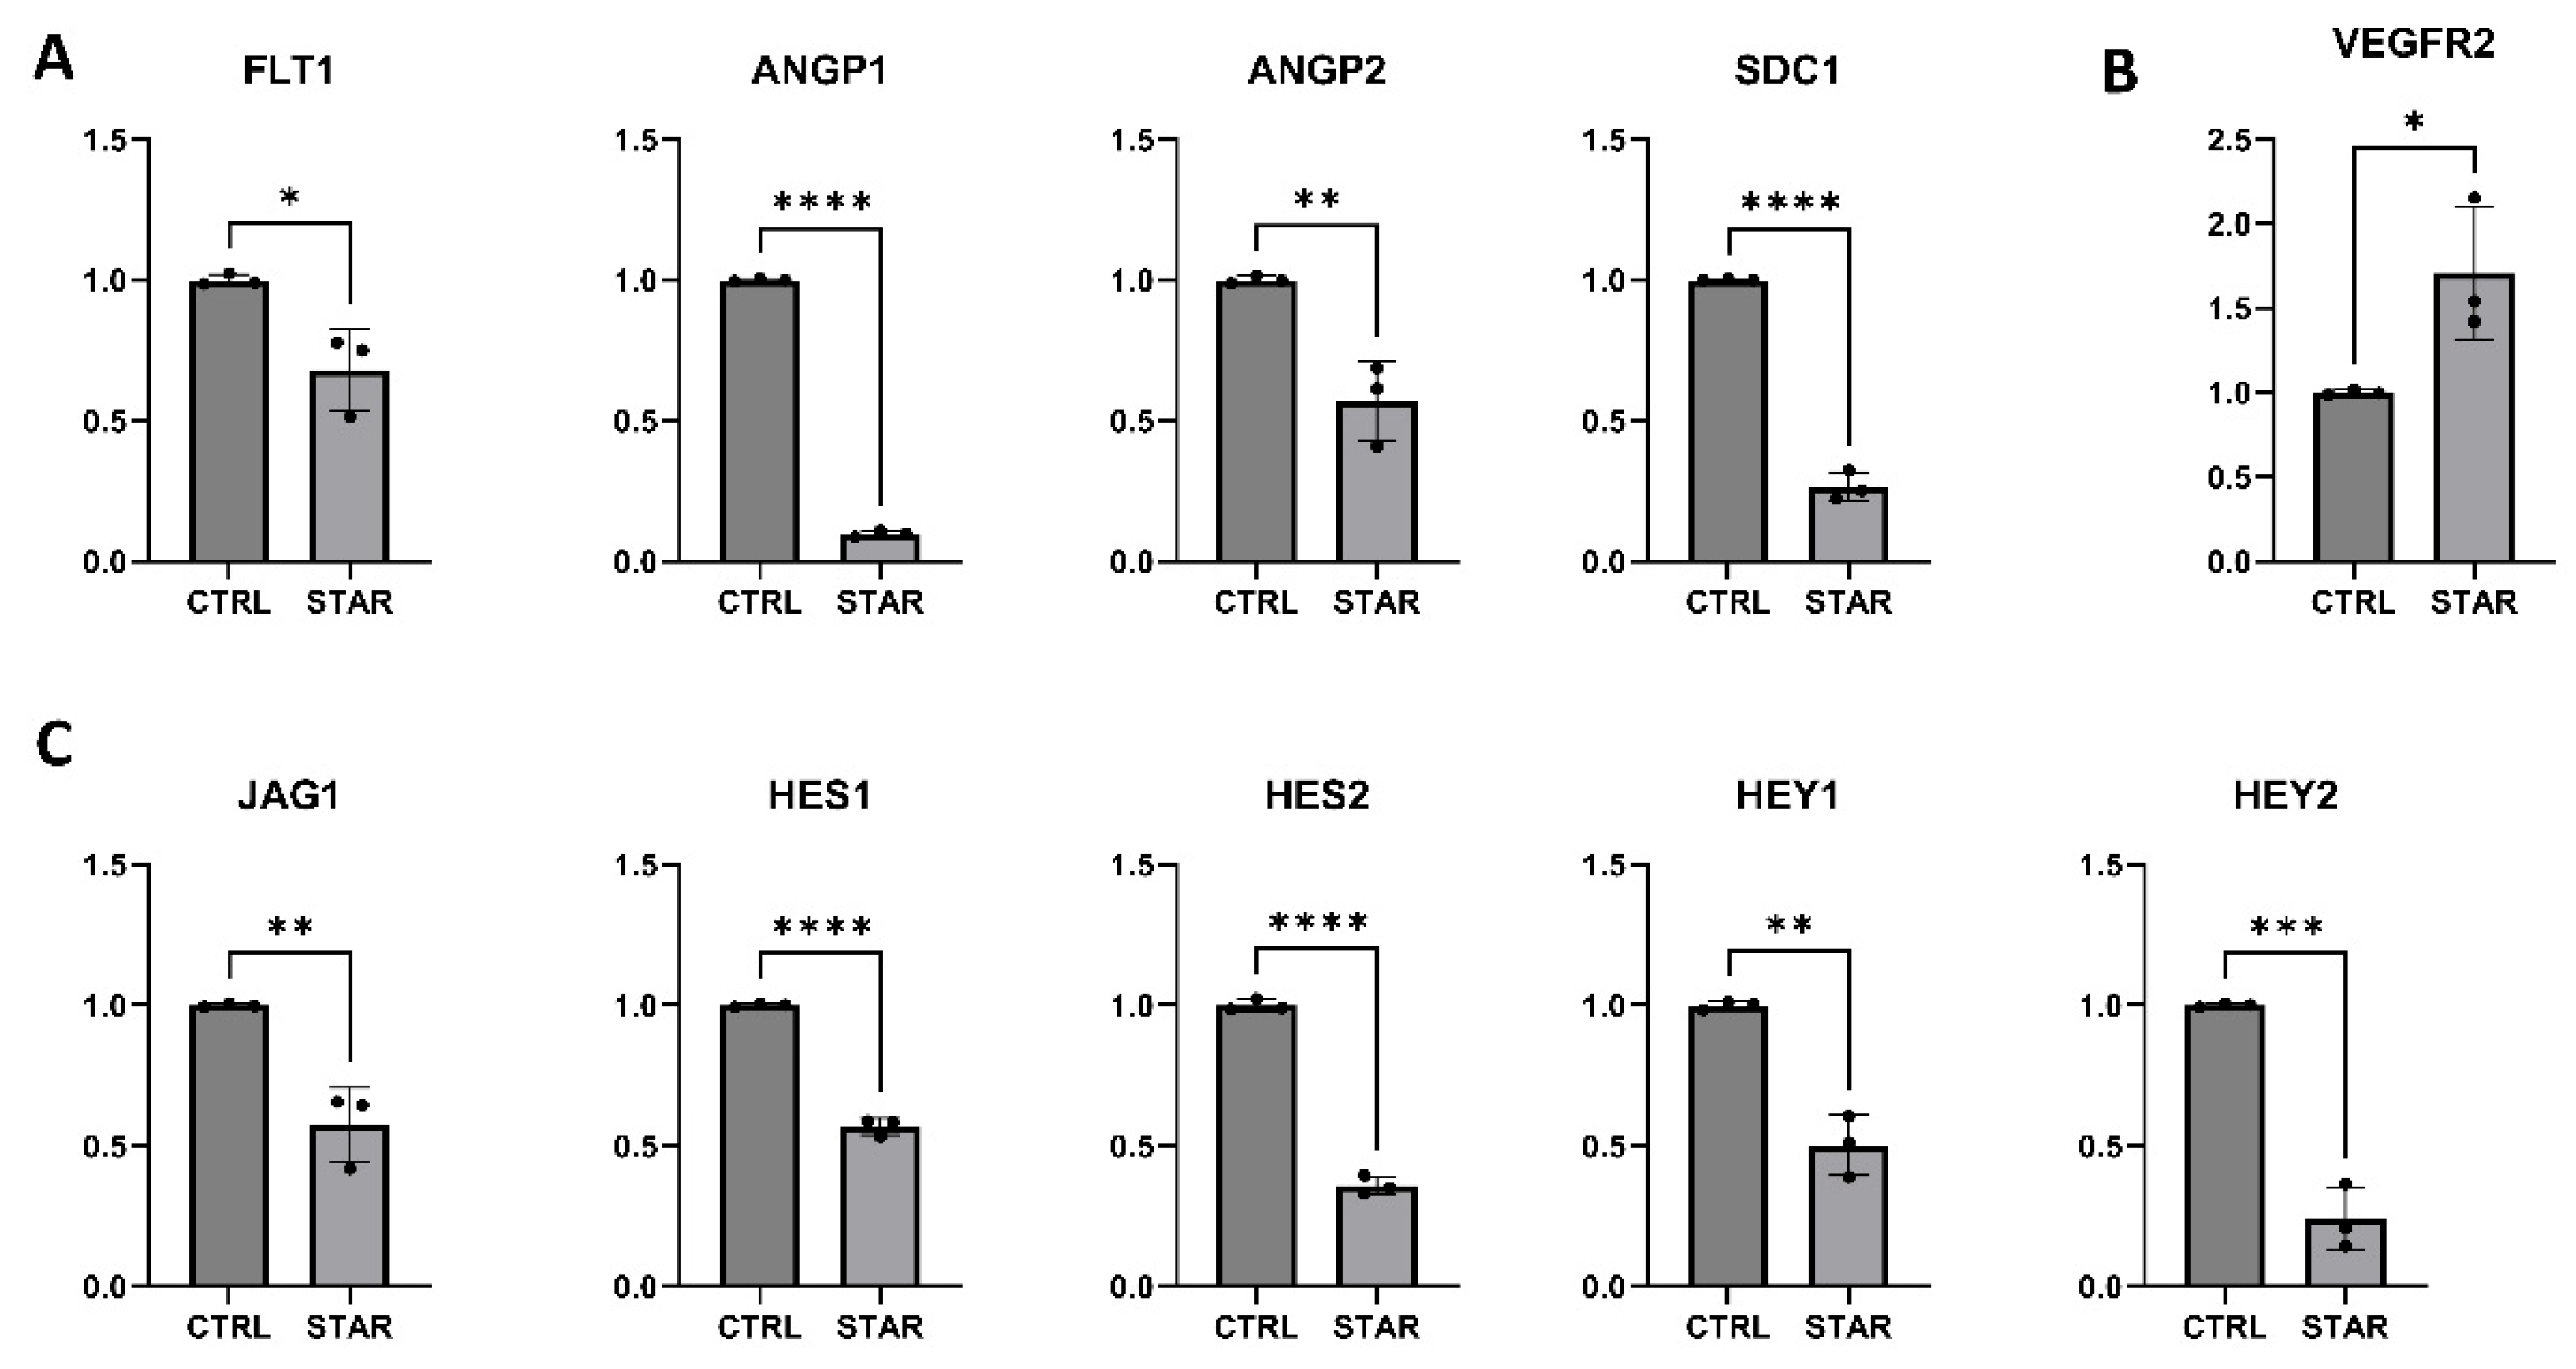
Figure 3.
(A,B) Representative photographs of Western blot of phospho-eIF2a and its relative expression. (C,D) RT-qPCR analysis of the Integrated Stress Response pathway factors alterations. (n = 3; * p ≤ 0.05; ** p ≤ 0.01). C – control, S – starvation.
Figure 3.
(A,B) Representative photographs of Western blot of phospho-eIF2a and its relative expression. (C,D) RT-qPCR analysis of the Integrated Stress Response pathway factors alterations. (n = 3; * p ≤ 0.05; ** p ≤ 0.01). C – control, S – starvation.
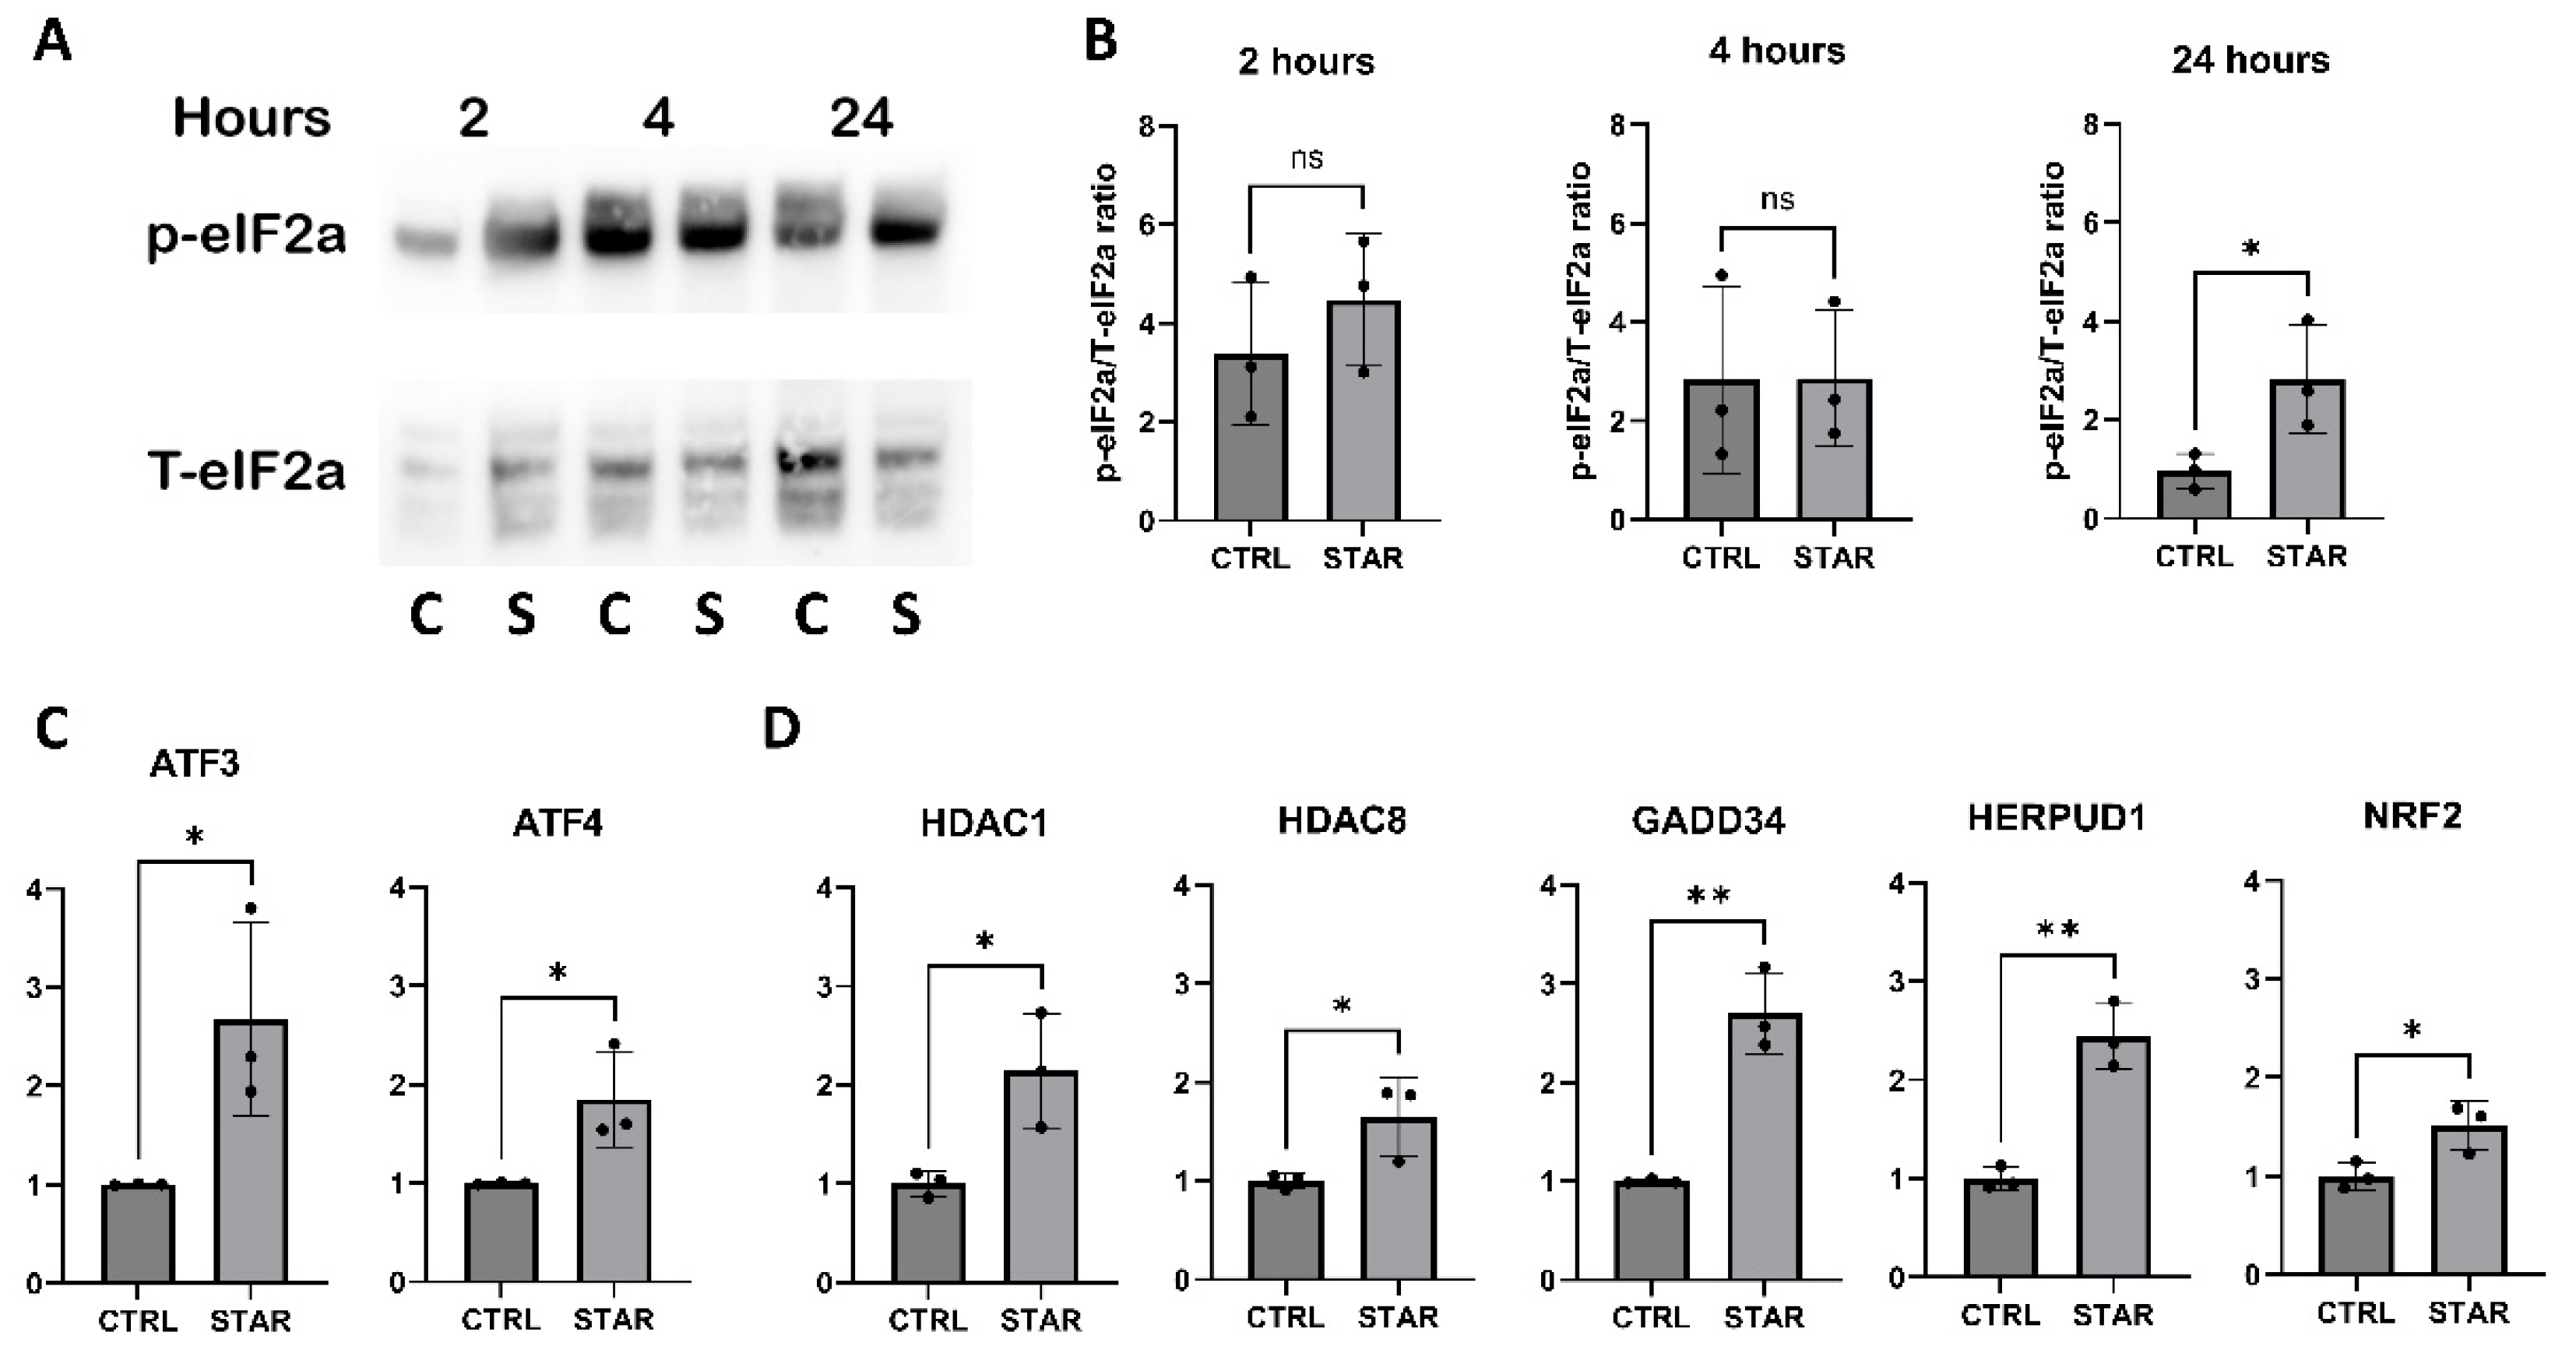
Figure 4.
Representative photographs of HUVECs cultures in endothelial growth medium (EGM2) and starvation (BSA).
Figure 4.
Representative photographs of HUVECs cultures in endothelial growth medium (EGM2) and starvation (BSA).
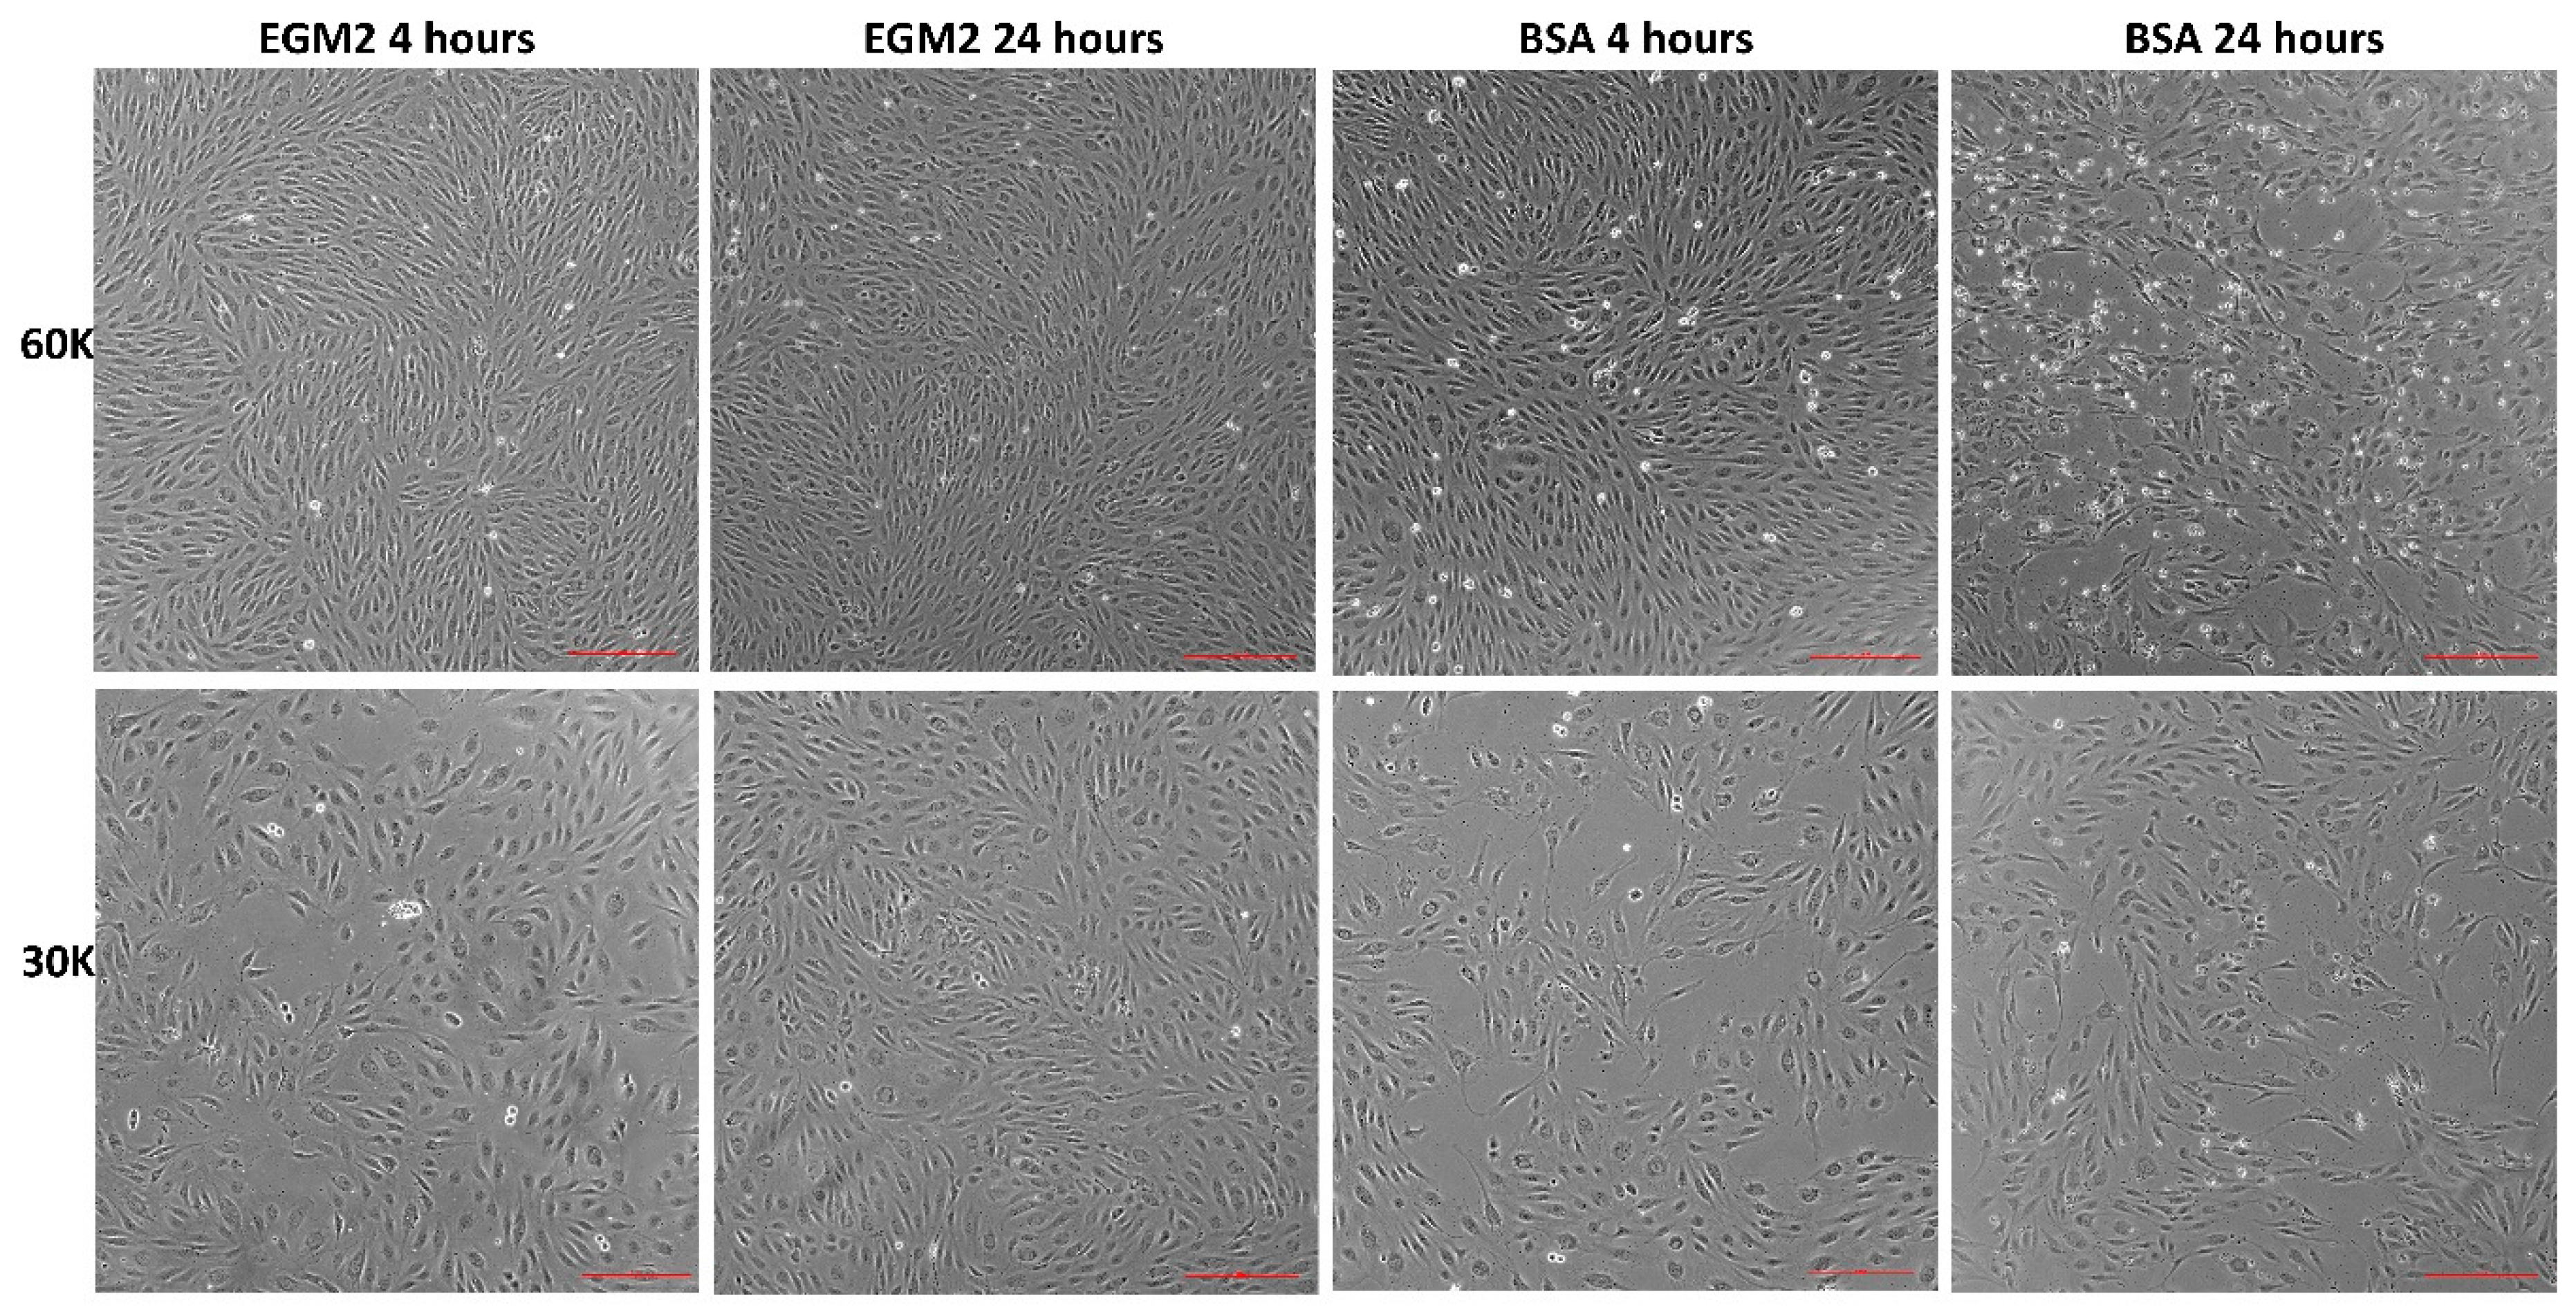
Figure 5.
RT-qPCR analysis of the Hippo pathway (A,B) factors, proinflammatory (C), EndMT and matrix-associated proteins alterations. (n = 3; * p ≤ 0.05; ** p ≤ 0.01; *** p ≤ 0.001; **** p ≤ 0.0001).
Figure 5.
RT-qPCR analysis of the Hippo pathway (A,B) factors, proinflammatory (C), EndMT and matrix-associated proteins alterations. (n = 3; * p ≤ 0.05; ** p ≤ 0.01; *** p ≤ 0.001; **** p ≤ 0.0001).
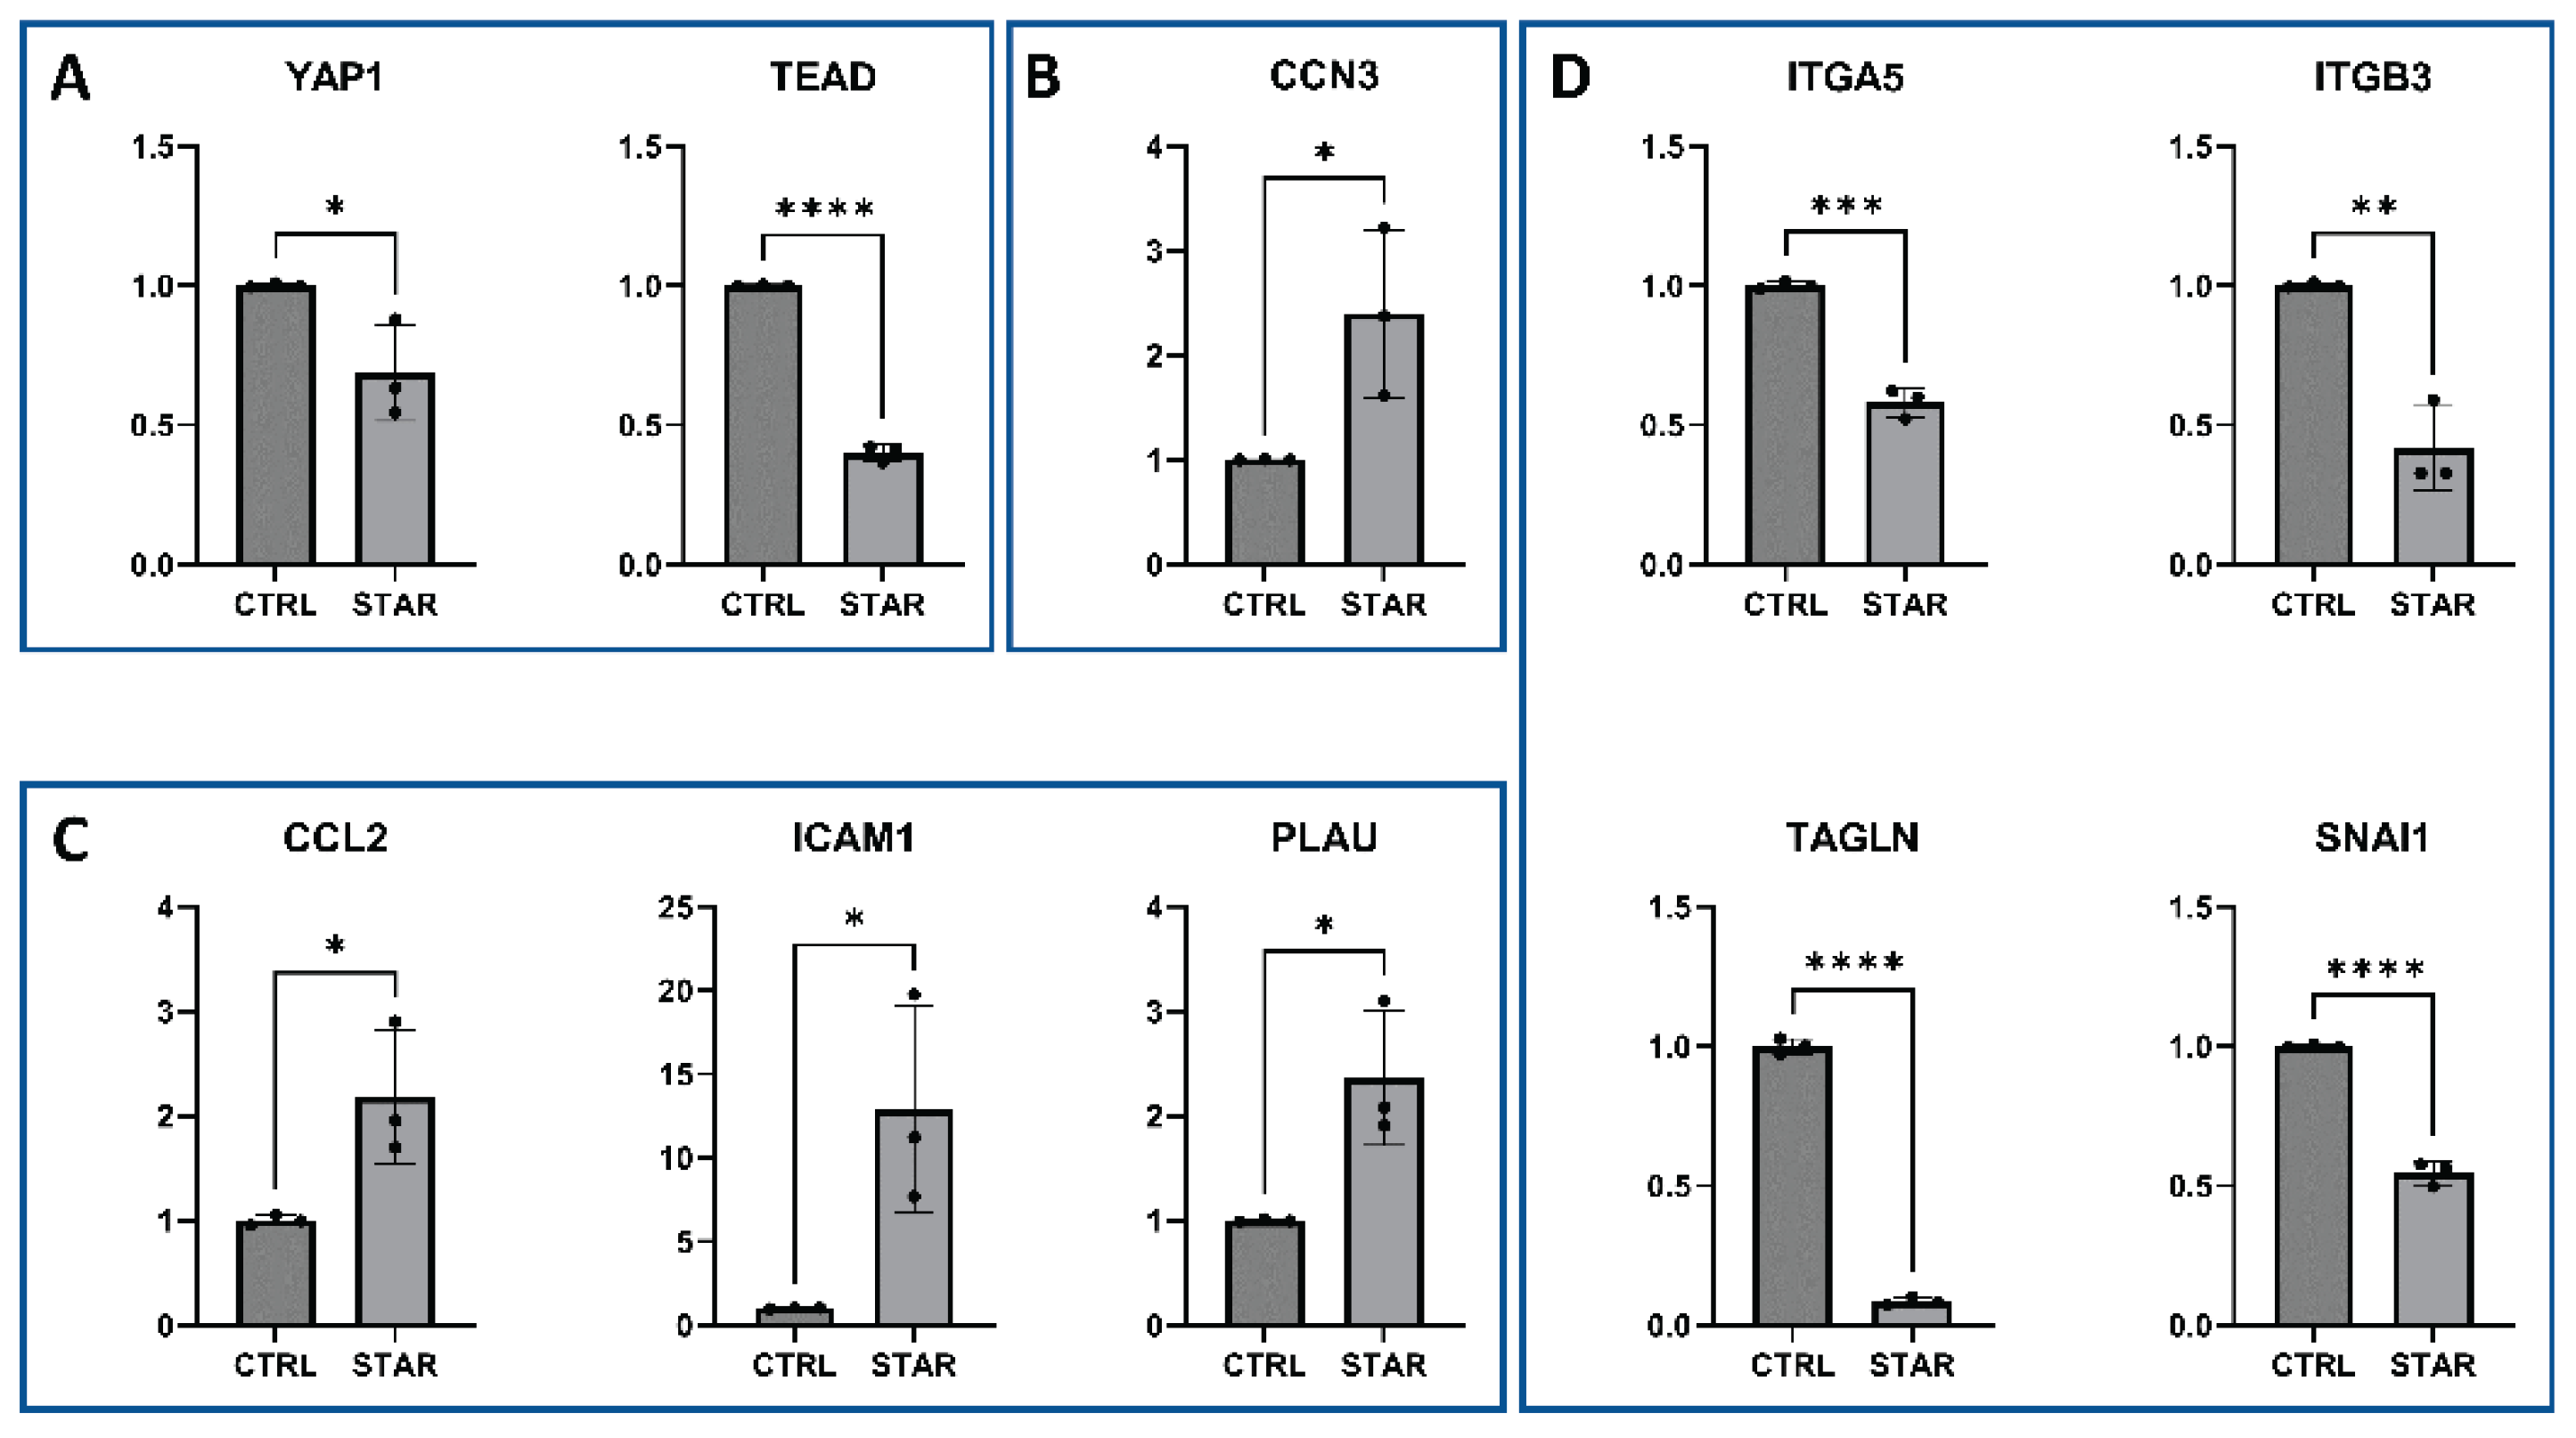

Table 1.
List of PCR primers used.
| Forward primer | Reverse primer | |
| ATF3 | GTG CCG AAA CAA GAA GAA GG | TCT GAG CCT TCA GTT CAG CA |
| ATF4 | GGT TCT CCA GCG ACA AGG | TCT CCA ACA TCC AAT CTG TCC |
| NRF2 | AAA CCA GTG GAT CTG CCA AC | GAC CGG GAA TAT CAG GAA CA |
| HK1 | GGA CTG GAC CGT CTG AAT GT | ACA GTT CCT TCA CCG TCT GG |
| SQSTM1 | CTG CCC AGA CTA CGA CTT GTG T | TCA ACT TCA ATG CCC AGA GG |
| GADD34 | TCC GAC TGC AAA GGC GGC TCA | CAG CCA GGA AAT GGA CAG TGA C |
| HPRT | CAT TAT GCT GAG GAT TTG GAA AGG | CTT GAG CAC ACA GAG GGC TAC A |
| HERPUD1 | CCA ATG TCT CAG GGA CTT GCT TC | CGA TTA GAA CCA GCA GGC TCC T |
| TEAD1 | CCT GGC TAT CTA TCC ACC ATG TG | TTC TGG TCC TCG TCT TGC CTG T |
| Sirt1 | AAA TGC TGG CCT AAT AGA GTG G | TGG TGG CAA AAA CAG ATA CTG A |
| CCL2 | AGT CTC TGC CGC CCT TCT | GTG ACT GGG GCA TTG ATT G |
Disclaimer/Publisher’s Note: The statements, opinions and data contained in all publications are solely those of the individual author(s) and contributor(s) and not of MDPI and/or the editor(s). MDPI and/or the editor(s) disclaim responsibility for any injury to people or property resulting from any ideas, methods, instructions or products referred to in the content. |
© 2025 by the authors. Licensee MDPI, Basel, Switzerland. This article is an open access article distributed under the terms and conditions of the Creative Commons Attribution (CC BY) license (http://creativecommons.org/licenses/by/4.0/).
Copyright: This open access article is published under a Creative Commons CC BY 4.0 license, which permit the free download, distribution, and reuse, provided that the author and preprint are cited in any reuse.


