
Submitted:
10 April 2025
Posted:
11 April 2025
You are already at the latest version
Abstract
This study investigates the interplay between cellular senescence and inflammation in human umbilical vein endothelial cells (HUVECs). We employed RNA sequencing to analyze gene expression changes in HUVECs subjected to replicative- or radiation-stress-induced senescence, and compared these profiles with those of cells under acute or chronic TNFα-mediated inflammation. Our findings reveal that both senescence types exhibit significant upregulation of genes associated with epithelial- (or endothelial) mesenchymal transition (EMT) and inflammatory pathways, indicating a shared molecular response. Notably, chronic inflammation led to a pronounced EMT signature as well, while acute inflammation primarily activated classical inflammatory responses. Experimental validation confirmed reduced proliferation and increased secretion of pro-inflammatory cytokines (IL-6 and IL-8) in senescent and chronically inflamed cells and substantiated the upregulation of EMT marker genes. Additionally, we observed impaired wound healing capacity in senescent and chronically inflamed cells, highlighting the functional consequences of these cellular states. Our study underscores the critical role of inflammation in exacerbating senescence-related changes, contributing to the understanding of age-related cardiovascular pathologies. These insights may inform future therapeutic strategies aimed at mitigating the effects of aging and inflammation on endothelial function and cardiovascular health.
Keywords:
senescence
; inflammation
; transcriptomics
; gene set enrichment analysis
; molecular signatures
; proliferation
; mesenchymal transition
; wound healing
1. Introduction
The prevalence of cardiovascular disease in the world is currently increasing steadily with age and is the leading cause of death worldwide [1]. Aging is closely associated with the phenomenon of cellular senescence, a state in which cells dramatically alter their metabolic, morphological and proliferative properties [2]. The term and concept of cellular senescence was coined in the last century by Leonard Hayflick and Paul Moorhead in their pioneering work [3] where they demonstrated, contrary to the prevailing belief at that time, that primary cells would stop dividing after a finite number of population doublings. These initial observations led to the theory of aging according to which senescent cells accumulate with age in vivo or during prolonged culture in vitro, primarily due to telomere shortening. In addition, cellular senescence can be prematurely induced in a replication-independent manner, mainly in response to various cellular and/or DNA-damaging agents including reactive oxygen species [4], anticancer drugs [5], inflammatory cytokines [6], mitochondrial dysfunction [7], high glucose concentrations [8], UV light [9] or ionizing radiation [10]. The main characteristic of senescent cells regardless of the inducing factor is the irreversible loss of proliferative potential, which in contrast to quiescent cells persists even in the presence of growth factors. This state is mainly maintained by the upregulation of cell cycle inhibitors [11]. In addition to cell cycle arrest, senescent cells acquire a pro-inflammatory “senescence-associated secretory phenotype” (SASP) which implies that cells are in a state of chronic low-grade inflammation. Core SASP factors include key players of NF-κB signaling pathways such as interleukin 6 or 8 (IL-6 or IL-8, respectively), tumor necrosis factor α (TNFα), intercellular adhesion molecule 1 (ICAM-1), plasminogen activator inhibitor 1 (PAI-1) or matrix-degrading proteases, through which they influence neighboring cells in a paracrine manner (reviewed in [12,13]). Due to the ongoing high rate of metabolism [2], senescent cells undergo severe morphological changes such as cell size expansion, flattening, protrusion development, chromosomal aberrations or multinucleation [14]. Since senescent cells are known to accumulate with higher age and have also been identified in lesions of age-related diseases, including atherosclerosis [15], their involvement in the development and progression of these pathologies has been extensively discussed.
Endothelial cells, by lining the lumen of blood vessels, are exposed to various blood-borne factors literally from the front row, making them susceptible to acquiring a senescent phenotype. Indeed, endothelial cells appear to be the first cell type to be affected by senescence in vivo. [16]. Normally, endothelial cells are long-lived and quiescent, and are only primed to proliferate during special occasions such as wound healing or pregnancy [17]. However, at sites of vascular bifurcation, carotid sinus or aortic arch, endothelial cells are induced to proliferate by fluctuating hemodynamic forces. Endothelial cells at these sites of accelerated turnover are particularly prone to (replicative) senescence, predisposing these sites to the development of atherosclerosis [15,18]. However, quiescent endothelial cells are also prone to develop a senescent phenotype because they are exposed for very long periods of time to various noxious substances circulating in the blood, where they also encounter systemic inflammatory conditions of either an acute or chronic nature [19]. The senescent endothelial layer is characterized by substantial structural and functional changes including limited angiogenic potential [20], leaky barrier function [21], impaired vascular tone due to reduced eNOS function and subsequent prothrombotic character [22], all of which are known to promote the progression of cardiovascular diseases.
We aimed at an unbiased integrative assessment of changes in endothelial cell programs during replicative or stress-induced senescence. Therefore, we performed a comprehensive RNA sequencing analysis of HUVECs induced to senesce by extensive cultivation or ionizing radiation and compared them with early passage HUVECs. In addition, since acute and chronic inflammation are thought to be involved in the onset and progression of senescence, we compared the transcriptomes of HUVECs treated with TNFα for short or long periods with their unstimulated counterparts and with senescent cells.
2. Materials and Methods
2.1. Isolation and Cell Culture of HUVECs
Primary human umbilical vein endothelial cells (HUVECs) were obtained in agreement with the ethical permissions GS4-EK4/562-2018 (Ethic Commission of Lower Austria) and EK 1259/20218 (Medical University of Vienna) from naval strings using a well described collagenase digestion method [23]. HUVECs were grown on pre-gelatinized cell culture dishes in a M199-based medium supplemented with 20% FBS (Sigma-Aldrich, Saint Louis, MO, USA), 0.4% endothelial cell growth supplement with heparin (ECGS/H, PromoCell, Heidelberg, Germany), 2 mM L-glutamine, 0.1% penicillin, 0.1% streptomycin and 0.25 μg/mL fungizone (all from Lonza, Visp, Switzerland) and cultured at 37°C with 5% CO2 and 95% humidity. To overcome batch effects resulting from individual characteristics of each donor, HUVECs of at least five single donors were pooled.
Replicative senescence of HUVECs was achieved by passaging them 35 times in a 1:3 ratio. Stress-induced premature senescent HUVECs were created by exposure to ionizing irradiation. Briefly, young, proliferating HUVECs were harvested and subjected in suspension to 10 Gy by using the cesium137-based irradiator IBL-437 C (kindly provided by the Department of Blood Group Serology and Transfusion Medicine, Medical University of Vienna). After irradiation, HUVECs were re-seeded on a six-times larger growth area than harvested to provide sufficient space for spreading caused by their expanded cell size. Irradiated HUVECs were kept in culture for ten more days before performing downstream analysis. Chronic inflammatory stimulation was conducted by exposing early passage HUVECs to 10 ng/ml TNFα (PeproTech, London, UK) for six continuous days (medium change every second day) followed by a three-day recovery period summing up to a 9d-inflammatory condition. Acute inflammation was mimicked by stimulating the cells with TNFα for 5h only.
2.2. RNA Isolation and qPCR
For isolating RNA, proliferating HUVECs were seeded into gelatin-coated 6-well plates while senescent cells (both replicative and stress-induced) into 75cm² cell culture flasks as triplicates. RNA was isolated using the commercial Peqgold total RNA kit (VWR International, Vienna, Austria) according to the instructions. Determination of RNA concentration and purity (260/280 ratio >1.8) was performed with the NanoDrop instrument (Thermo Fisher Scientific, Waltham, MA, USA). Aliquots of RNA samples were sent to the Core Facility of The Medical University of Vienna (senescent HUVECs) and the Research Center for Molecular Medicine of the Austrian Academy of Science (CeMM) (TNFα-treated HUVECs) for RNA sequencing.
To determine the fold change of selected genes, 450 ng of total RNA was reverse transcribed to cDNA using oligo (dT) 18 primer (Bioline, London, UK), dNTP (Thermo Fisher Scientific), RNAse Inhibitor and M-MuLV Reverse Transcriptase (both Lucigen, Middleton, WI, USA). Real-time PCR was conducted for N-cadherin (5’- CCT CCA GAG TTT ACT GCC ATG AC-3´ and 5’- GTA GGA TCT CCG CCA CTG ATT C-3´), vimentin (5’-AGG CAA AGC AGG AGT CCA CTG A-3´ and 5’- ATC TGG CGT TCC AGG GAC TCA T-3´) and fibronectin (5’-ACA ACA CCG AGG TGA CTG AGA C-3´and 5’-GGA CAC AAC GAT GCT TCC TGA G-3’) on a CFX Connect Real-Time System PCR machine using SsoAdvanced Universal SYBR Green Supermix (both Bio-Rad Laboratories, Vienna, Austria). Changes in gene expression were calculated by the Pfaffl method [24] by normalizing to GUSB (5’-AAA CGA TTG CAG GGT TTC AC-3’ and 5’-TAT TCC CCA GCA CTC TCG TC-3’), a housekeeping gene not affected by senescence-associated gene alterations [25].
For statistical analysis, one-way ANOVA with Bonferroni correction was performed using GraphPad Prism 10 (Version 10.4.1 for Windows, GraphPad Software, Boston, MA, USA). Graphs are shown as mean with SEM where *** P ≤ 0.001 and **** P ≤ 0.0001.
2.3. Library Preparation and Sequencing
2.3.1. For Senescent HUVECs
Sequencing libraries were prepared from total RNA at the Core Facility Genomics, Medical University of Vienna, using the QuantSeq FWD protocol (Lexogen). The optimal number of PCR amplification cycles was determined by quantitative PCR, according to the manufacturer’s instructions. Library quality control was performed using the Agilent Bioanalyzer 2100 with the High Sensitivity DNA Kit to confirm the expected insert size. Library concentrations were measured using the Qubit dsDNA HS Assay Kit (Invitrogen). Pooled libraries were sequenced on an Illumina NextSeq500 system in 1×75 bp single-end mode. FASTQ files were generated with bcl2fastq (v2.19.1.403, Illumina). Adapter trimming and quality filtering, including poly(A) tail removal and exclusion of reads containing ambiguous bases (N), were conducted using cutadapt (v1.15) [26]. Each sample initially yielded approximately 8 million reads; to ensure uniform sequencing depth across samples, all datasets were downsampled to 5 million reads. Reads were aligned to the human reference genome GRCh38 with Gencode v29 annotations using the STAR aligner (v2.6.1a) [27] in 2-pass mode. Gene-level raw read counts were obtained directly from STAR.
2.3.2. For TNFα-Treated HUVECs
The amount of total RNA was quantified using the Qubit 2.0 Fluorometric Quantitation assay (Thermo Fisher Scientific, Waltham, MA, USA) and the RNA integrity number (RIN) was determined using the 2100 Bioanalyzer High-Resolution Automated Electrophoresis instrument (Agilent, Santa Clara, CA, USA). RNA-seq libraries were prepared with the NEBNext® Poly(A) mRNA Magnetic Isolation Module E7490 and the NEBNext® Ultra™ II Directional RNA sample preparation kit E7760 (New England Biolabs, Inc., Ipswich, MA, USA). NGS library concentrations were quantified with the Qubit 2.0 assay and the size distribution was assessed using the 2100 Bioanalyzer instrument. Before sequencing, sample-specific NGS libraries were diluted and pooled in equimolar amounts. Expression profiling libraries were sequenced on a NovaSeq 6000 instrument (Illumina, San Diego, CA, USA) following a 100-base-pair, paired-end recipe. An average of 37x106 raw sequencing reads were obtained. Reads were trimmed for quality and adapter sequences using Trim Galore (v0.6.10) [28] with a Phred score cutoff of 30 and a minimum read length of 30 bp. Reads (~36x106 per sample) were aligned to the human genome GRCh38 release 95 primary assembly using STAR (v2.7.11b) [27], with genome indices and transcript annotations based on Ensembl release 95 in a two-pass mapping, reporting only reads that mapped exactly once to the reference genome (-outFilterMultimapNmax 1), with gene counts performed during alignment using the option –quantMode GeneCounts
2.4. Bioinformatic Analysis
Differential expression analysis was conducted in RStudio Server (v.2024.12.1.563) [29] with R version 4.4.3 (2025-02-28) [30], using the edgeR package (v.4.4.2) [31] with a quasi-likelihood F-test (glmQLFTest) for differential expression modeling. Prior to analysis, gene annotations were retrieved from Ensembl release 113 using the biomaRt R package (v2.62.1) [32]. Ensembl IDs from the raw gene count matrix were mapped to Entrez Gene IDs. Genes lacking a valid Entrez Gene ID were removed, and in cases where multiple Ensembl gene IDs mapped to the same Entrez Gene ID, the gene with the highest total expression (sum across all samples) was retained. Only genes annotated as protein coding were included in downstream analyses. Genes with zero counts across all samples were also excluded. Furthermore, genes with low expression were filtered using the filterByExpr function, which considers the experimental design and library sizes to retain only genes with sufficient counts across replicates. This improves power and reduces false positives by excluding uninformative genes. Normalization of library sizes was performed using the Trimmed Mean of M-values (TMM) method via calcNormFactors, which adjusts for composition biases across libraries and ensures that expression levels are comparable between samples. To control for false discoveries, p-values were adjusted using the Benjamini & Hochberg method to obtain the adjusted p-values. Genes were considered to be differentially expressed when they showed an adjusted p-value < 0.05 and an absolute log2 fold change (FC) > 1. Moreover, the data was further analyzed with NetworkAnalyst platform [33], using the STRING-database [34] and Cytoscape [35] was used for network visualization. Gene expression changes and their overlaps between the various treatments or conditions were visualized with their relative proportions using the DeepVenn web-platform [36]. The unique as well as the intersection genes of the different areas were analyzed for enriched molecular signatures using the Enrichr platform [37,38]. For data visualization, the ggplot2 package (v.3.5.1) [39] was also used.
2.5. Gene Set Enrichment Analysis
Gene Set Enrichment Analysis (GSEA) [40] overcomes a key limitation of traditional differentialfC expression analysis, which tends to highlight genes with large individual changes while potentially overlooking small but coordinated shifts within biologically related groups. Instead of analyzing genes in isolation, GSEA evaluates predefined gene sets by aggregating per-gene statistics, making it possible to detect subtle, yet biologically relevant, patterns of regulation. In this analysis, genes were ranked based on: −log10(P-value) × log2 FC., which incorporates both the direction (up- or down-regulation) and the statistical significance of expression changes. GSEA was performed using the fgsea algorithm [41] implemented in the clusterProfiler package (v4.14.6) [42] The Molecular Signatures Database Hallmark genesets [43] were extracted using msigdbr (v.10.0.1) [44].
2.6. Protein Isolation and Western Blot
HUVECs were treated and prepared as specified above and the protein content was extracted from 25 cm² (young and TNFα-treated) and 75cm² (senescent) cell culture flasks. Briefly, cells were harvested by trypsinization, and the pellet was dissolved in ice-cold RIPA buffer (Sigma-Aldrich) containing protease inhibitor cocktail (Bimake, Houston, TX, USA). Equal amounts of proteins were loaded on 10% polyacrylamide gels for SDS-PAGE. Proteins were blotted on PVDF membranes (Carl Roth, Karlsruhe, Germany) using the wet blotting method. For detection of lamin B1 as marker for senescence, the membranes were first blocked in 5% skimmed milk in PBS-T and incubated overnight with anti-lamin B1 rabbit primary monoclonal antibody (1:500; ab133741, Abcam, Cambridge, UK) and anti-β-actin (as reference) rabbit primary polyclonal antibody (1:1000; A2066, Sigma-Aldrich) followed by incubation with secondary donkey anti-rabbit HRP-conjugated antibody (1:5000; NA934, Amersham, UK) for additional 2h. Membranes were developed with HRP Western Bright Sirius substrate (Advansta, San Jose, CA, USA) and visualized using a CCD-based chemiluminescence imager (Alpha Innotech, San Leonardo, CA, USA). Protein bands were analyzed using ImageJ (version 1.53c, [45]) and statistical significance was determined with unpaired one-tailed t test in GraphPad Prism. **** <0,0001
2.7. IL-6 and IL-8 ELISA
Cells were seeded into gelatin-coated 96-well plates and handled as indicated earlier. HUVECs mimicking chronic inflammation were treated intermittently every second day with 10 ng/ml TNFα for 6 days followed by 3 days of recovery in full medium, whereas acute inflammation HUVECs were exposed to TNFα for 5h. The supernatant was centrifuged for 5 min at 3000× g directly after collecting to remove cellular debris and stored frozen at -20°C until used for the assay. For this, the Ready-SET-Go! IL-8 and IL-6 ELISA kits (88-8086 and 88-7066, both Thermo Fisher Scientific) were prepared according to manufacturer’s instructions. In brief, low-binding 96-well plates were coated with capture antibodies overnight, blocked with ELISA/ELISPOT diluent, subsequently incubated overnight with IL-8 and IL-6 standards as well as the HUVEC supernatant samples. This was followed by incubation with detection antibodies, streptavidin-HRP linked secondary antibodies, TMB substrate and the reaction was ultimately stopped by adding 2N H2SO4 (Merck, Darmstadt, Germany). Absorbance was measured on the BioTek ELx808 plate reader (Agilent, Santa Clara, CA, USA) at 450 nm and 630 nm. The measured values were normalized to the number of cells that have been determined by nuclear Hoechst 33258 staining. Statistical significance was computed by one-way ANOVA with Bonferroni correction using GraphPad Prism. Data is shown as means with SEM where ns >0,05; ** ≤0,01 and **** ≤0,0001.
2.8. Wound Healing (Scratch) Assay
To assess the wound healing potential of endothelial cells under different conditions, HUVECs were seeded into 24-well plates pre-coated with 1% gelatin and prepared according to the 5h or 9d TNFα protocol, respectively or kept in full medium in the case of control and senescent cells. All conditions were prepared in triplicates and in parallel. The wound was created by scratching the cellular monolayer with a 1000 µl pipette tip and placed immediately into an Incucyte machine (Sartorius, Göttingen, Germany) for time-lapse image acquisition. Per well 16 images were taken every 30 min for a total observation time of 30h. The images were analyzed with the build-in software “Confluence-AI” and the migration rate was calculated as the time needed to reach ≥95% confluence or the final confluence if 95% were not reached. One-way ANOVA with Bonferroni correction (GraphPad Prism) was used to analyze statistical significance. ns>0,05; **** <0,0001
2.9. Immunofluorescent Staining for Ki67 as Proliferation Marker
HUVECs were seeded into gelatinized 96-well plates and treated as mentioned above. Cells were fixed with 4% PFA (Sigma-Aldrich), permeabilized with 0,2%Triton-X 100 (Serva, Heidelberg, Germany) and blocked with 3% goat serum (Abcam) prior to adding rabbit monoclonal Ki67 antibodies (RM-9106-S1, Thermo Fisher Scientific) in a 1:500 dilution. After the overnight incubation with primary antibodies, secondary goat anti-rabbit polyclonal IgG Alexa 647 antibodies (1:500, A-21245, Thermo Fisher Scientific) were incubated for 2h and during the final washing step nuclear staining with 1 µg/ml Hoechst 33258 (CAY-16756-50, Cayman Chemical, Ann Arbor, MI, USA) was added. Fluorescent images were taken on inverted Olympus IX71 or IX83 cellVivo live cell microscopes (both Olympus, Shinjuku, Japan) with a 10× air objective using 385 nm excitation with a 447/60 blue emission filter (for DAPI/Hoechst) and 660 nm with a 692/40 far-red emission filter for Ki67. Quantification of cell nuclei and Ki67 positive cells was carried out using ImageJ and respective macros. Statistical analysis was performed by GraphPad Prism using one-way ANOVA with Bonferroni correction. Data is shown as mean with SEM, * P ≤ 0.05; ** P ≤ 0.01 and **** P ≤ 0.0001.
2.10. Nanoparticle Analysis of Extracellular Vesicles and Secretome Analysis by MS/MS
Proliferating and replicative senescent HUVECs were seeded into 24-well plates and kept growing in full medium for five days before harvesting. For this, the supernatant was collected into microcentrifuge tubes and centrifuged first for 5 min at 300× g and subsequently twice at 3000× g for another 5 min while always changing to a fresh tube to get rid of cellular debris. Next, the supernatant was filtered through a 0,2 µm PES membrane syringe filter and finally enriched using the Vivaspin 500 centrifugal concentrator with a molecular weight cut-off of 5 kDa (Sartorius) before storing at -80°C. Particle size and concentration was measured in 1:20 diluted samples (with full growth medium as reference control) on the tunable resistance pulse sensing (TRPS) EXOID system (Izon Science, Lyon, France). Briefly, by applying different pressure forces (1300 Pa, 1500 Pa and 1900 Pa) and a constant voltage of 604 mV the resistive pulse of the specimen on a 150 nm nanopore was measured. The crude extracellular vesicle content was calculated by matching the sample measurements with measurements of calibration beads (TKP200) within the Izon Data Suite software 1.0 (both Izon Science). For the analysis of secretomes from young and old HUVECs (comprising both extracellular vesicles and secreted protein), confluent plates were stimulated for 45 min with PMA (10 ng/ml PMA) to promote secretion and membrane fusion (three biological replica for each condition). Supernatants were cleared from cell debris by differential centrifugation (500× g, 5 min and 3000× g, 5 min) and subjected to TCA-precipitation. Protein-pellets were solubilized in urea, digested and analyzed using a Q-Exactive HF (Thermo Fisher Scientific) operated in DDA mode and analyzed with Proteome Discoverer. Comparative statistical analysis was done on the basis of normalized spectral counts in Perseus by means of one-way-ANOVA with post-hoc Tukey´s HSD test to correct for multiple testing. A q-value <0.05 was considered significant. Proteins identified exclusively in young or old secretomes were summarized in Venn diagrams. Enrichr (https://maayanlab.could/Enrichr) was utilized for qualitative Reactome-pathway enrichment analysis.
3. Results
3.1. Effects of Replicative and Stress-Induced Senescence on RNA Expression
First, we wanted to obtain an unbiased overview of gene expression changes in endothelial cells during replicative senescence and compare them with the effects of premature senescence induced by gamma irradiation. Endothelial cells reflecting an aged phenotype were obtained by exhaustive replication over 35 cell passages. Stress-induced senescence was achieved by irradiating young proliferating HUVECs with 10 Gy. RNA was extracted from triplicate treatments using young proliferating endothelial cells as controls and sequenced at the university core facility. Differential gene expression analysis and subsequent bioinformatics were performed as described in the Methods section. Changes in signaling pathways and molecular signatures were determined by gene set enrichment analysis (GSEA), which has the advantage of not requiring a threshold of up- or down-regulation to detect changes in whole gene sets [40]. This analysis revealed strong similarities between stress-induced and age-related senescence (Figure 1). Epithelial (or in this case endothelial)-mesenchymal transition (EMT) and a large panel of inflammatory pathways were upregulated, while cell cycle progression and DNA repair were downregulated.
3.2. Effects of Acute and Chronic Endothelial Inflammation on RNA Expression
Given the strong inflammatory phenotype of endothelial cells after both stress-induced and replicative senescence, we wanted to compare these specific RNA expression profiles with those of endothelial cells after short- or long-term inflammatory activation. HUVECs were treated with TNFα for 5 hours to mimic acute inflammation or with TNFα for 6 days followed by 3 days in normal medium to mimic long-term inflammation after a total of 9 days. Comparison of gene expression with that of untreated young endothelial cells revealed in both cases the expected upregulation of TNFα- or interferon-related pathways and downregulation of E2F- or MYC-related proliferation pathways (Figure 2). However, EMT was more pronounced after long-term inflammation. We then directly compared the effects of 9d TNFα treatment with those of 5h TNFα treatment to detect the specific differences between chronic and acute inflammation. Among the hallmark gene collection of the Molecular Signature database, only EMT genes remained as upregulated, while TNFα and interferon-related inflammatory pathways were seen as significantly downregulated after long-term TNFα treatment, indicating that the inflammatory response is significantly reduced, leaving endothelial-mesenchymal transition as one of the major consequences of chronic inflammation.
3.3. Overlaps and Differences Between Senescence, Acute and Chronic Inflammation
To elucidate the similarities and differences between senescence, short- and long-term TNFα treatment of endothelial cells, we computed proportional Venn diagrams and queried the various overlaps using the Enrichr platform. This revealed that all three conditions overlapped (Figure 3). However, inflammatory pathways were only seen in the overlap between senescence and short-term TNFα treatment, whereas chronic inflammatory activation and senescence showed similarities in EMT, TGFβ signaling, and cell junctions.
Further analysis and visualization of differences and similarities between senescence, short- and long-term TNFα treatment was performed using the NetworkAnalyst [33] platform, comparison with the STRING-database interactome and visualization using Cytoscape [35], which confirmed the Venn graph and pathway analysis (Supplementary Figure S1).
3.4. Experimental Validation of the Antiproliferative and Pro-Inflammatory Effects
The results of our unbiased transcriptomic analyses prompted us to experimentally investigate some of the predicted effects of senescence and short- and long-term endothelial inflammation. To analyze proliferative potential, we stained for the cell cycle marker Ki67, which is not expressed in cells in the resting G0 phase of the cell cycle. Both types of TNFα treatment (5h and 9d) resulted in a similar reduction of Ki67 expression expressed as a percentage of total cells (Figure 4A). An even greater reduction of the proliferation marker was observed in irradiation-induced senescence and in replicative senescence. Representative microscopic images of the staining are shown in Supplementary Figure S2. As markers of inflammation, we quantified the cytokines IL-6 and IL-8 in the supernatants of the cells by ELISA. A very significant increase (when normalized to cell number) was observed in old senescent HUVECs (Figure 4B,C), confirming a pro-inflammatory effect of senescence. IL-8 secretion was increased after TNFα treatment for 5h, but this increase was no longer visible at 9d after TNFα treatment, consistent with the observation from RNA sequencing results that long-term inflammation leads to a downregulation of the inflammatory response. For IL-6, only a trend towards elevation was observed after both types of TNFα treatment, which was not statistically significant. A possible explanation is that the 5h treatment was too short to detect a measurable upregulation at the protein level and that a putative increased gene expression and secretion does not last long enough to be measured after 9d (especially considering that the treatment medium was replaced with fresh medium after 6d followed by 3d without TNFα). Thus, cytokines released during the first 6 days were removed and the remaining 3 days may not have been sufficient to induce significant IL-6 or IL-8 secretion in the case of a rather transient inflammatory response. Furthermore, the sensitivity of the ELISA measurement may have been too low to detect a mild upregulation, as the secreted cytokines are diluted in the supernatants.
3.5. Markers of Mesenchymal Transition Are Upregulated by TNFα Treatment or Senescence
Analysis of gene expression changes by RNA sequencing suggested a significant stimulation of epithelial or endothelial-mesenchymal transition. Well-accepted markers of this biological process, in which epithelial or endothelial cells dedifferentiate into a mesenchymal state, are the genes N-cadherin, vimentin, and fibronectin [46]. Therefore, we measured the expression of these genes by sensitive quantitative PCR after reverse transcription. The highest upregulation of all three markers was observed in cells with irradiation-induced senescence (Figure 5). All of them were also significantly upregulated in old endothelial cells undergoing replicative senescence. N-cadherin and fibronectin showed similarly increased expression in 9d TNFα-treated cells, whereas no significant change was observed for vimentin under these conditions. None of the EMT marker genes showed an increase after 5h TNFα treatment, in agreement with the bioinformatics results that EMT is predominantly seen after long-term inflammation as well as senescence.
3.6. The Senescence Marker Lamin Is Upregulated by Long-Term TNFα Treatment
A well-established marker of cellular senescence is the protein lamin B1 [47], which belongs to intermediate filament proteins that stabilize the inner side of the nuclear membrane and which play a role in chromatin stability and telomer function. To investigate the effects of our treatment conditions on this marker, we performed Western blot analysis of extracts from endothelial cells treated with TNFα for 5h or 9d and compared them with extracts from cells undergoing replicative or stress-induced senescence. As expected, the protein was almost completely lost in both types of senescence (Figure 6). Interestingly, it was upregulated after 5 h of TNFα treatment, whereas it was significantly downregulated after 9 d of TNFα treatment. This is consistent with the notion that short-term inflammation does not act as a driver of cellular senescence, while chronic inflammation already has a senescence-promoting effect.
3.7. Wound Healing Capacity of Senescent or TNFα-Treated Endothelial Cells
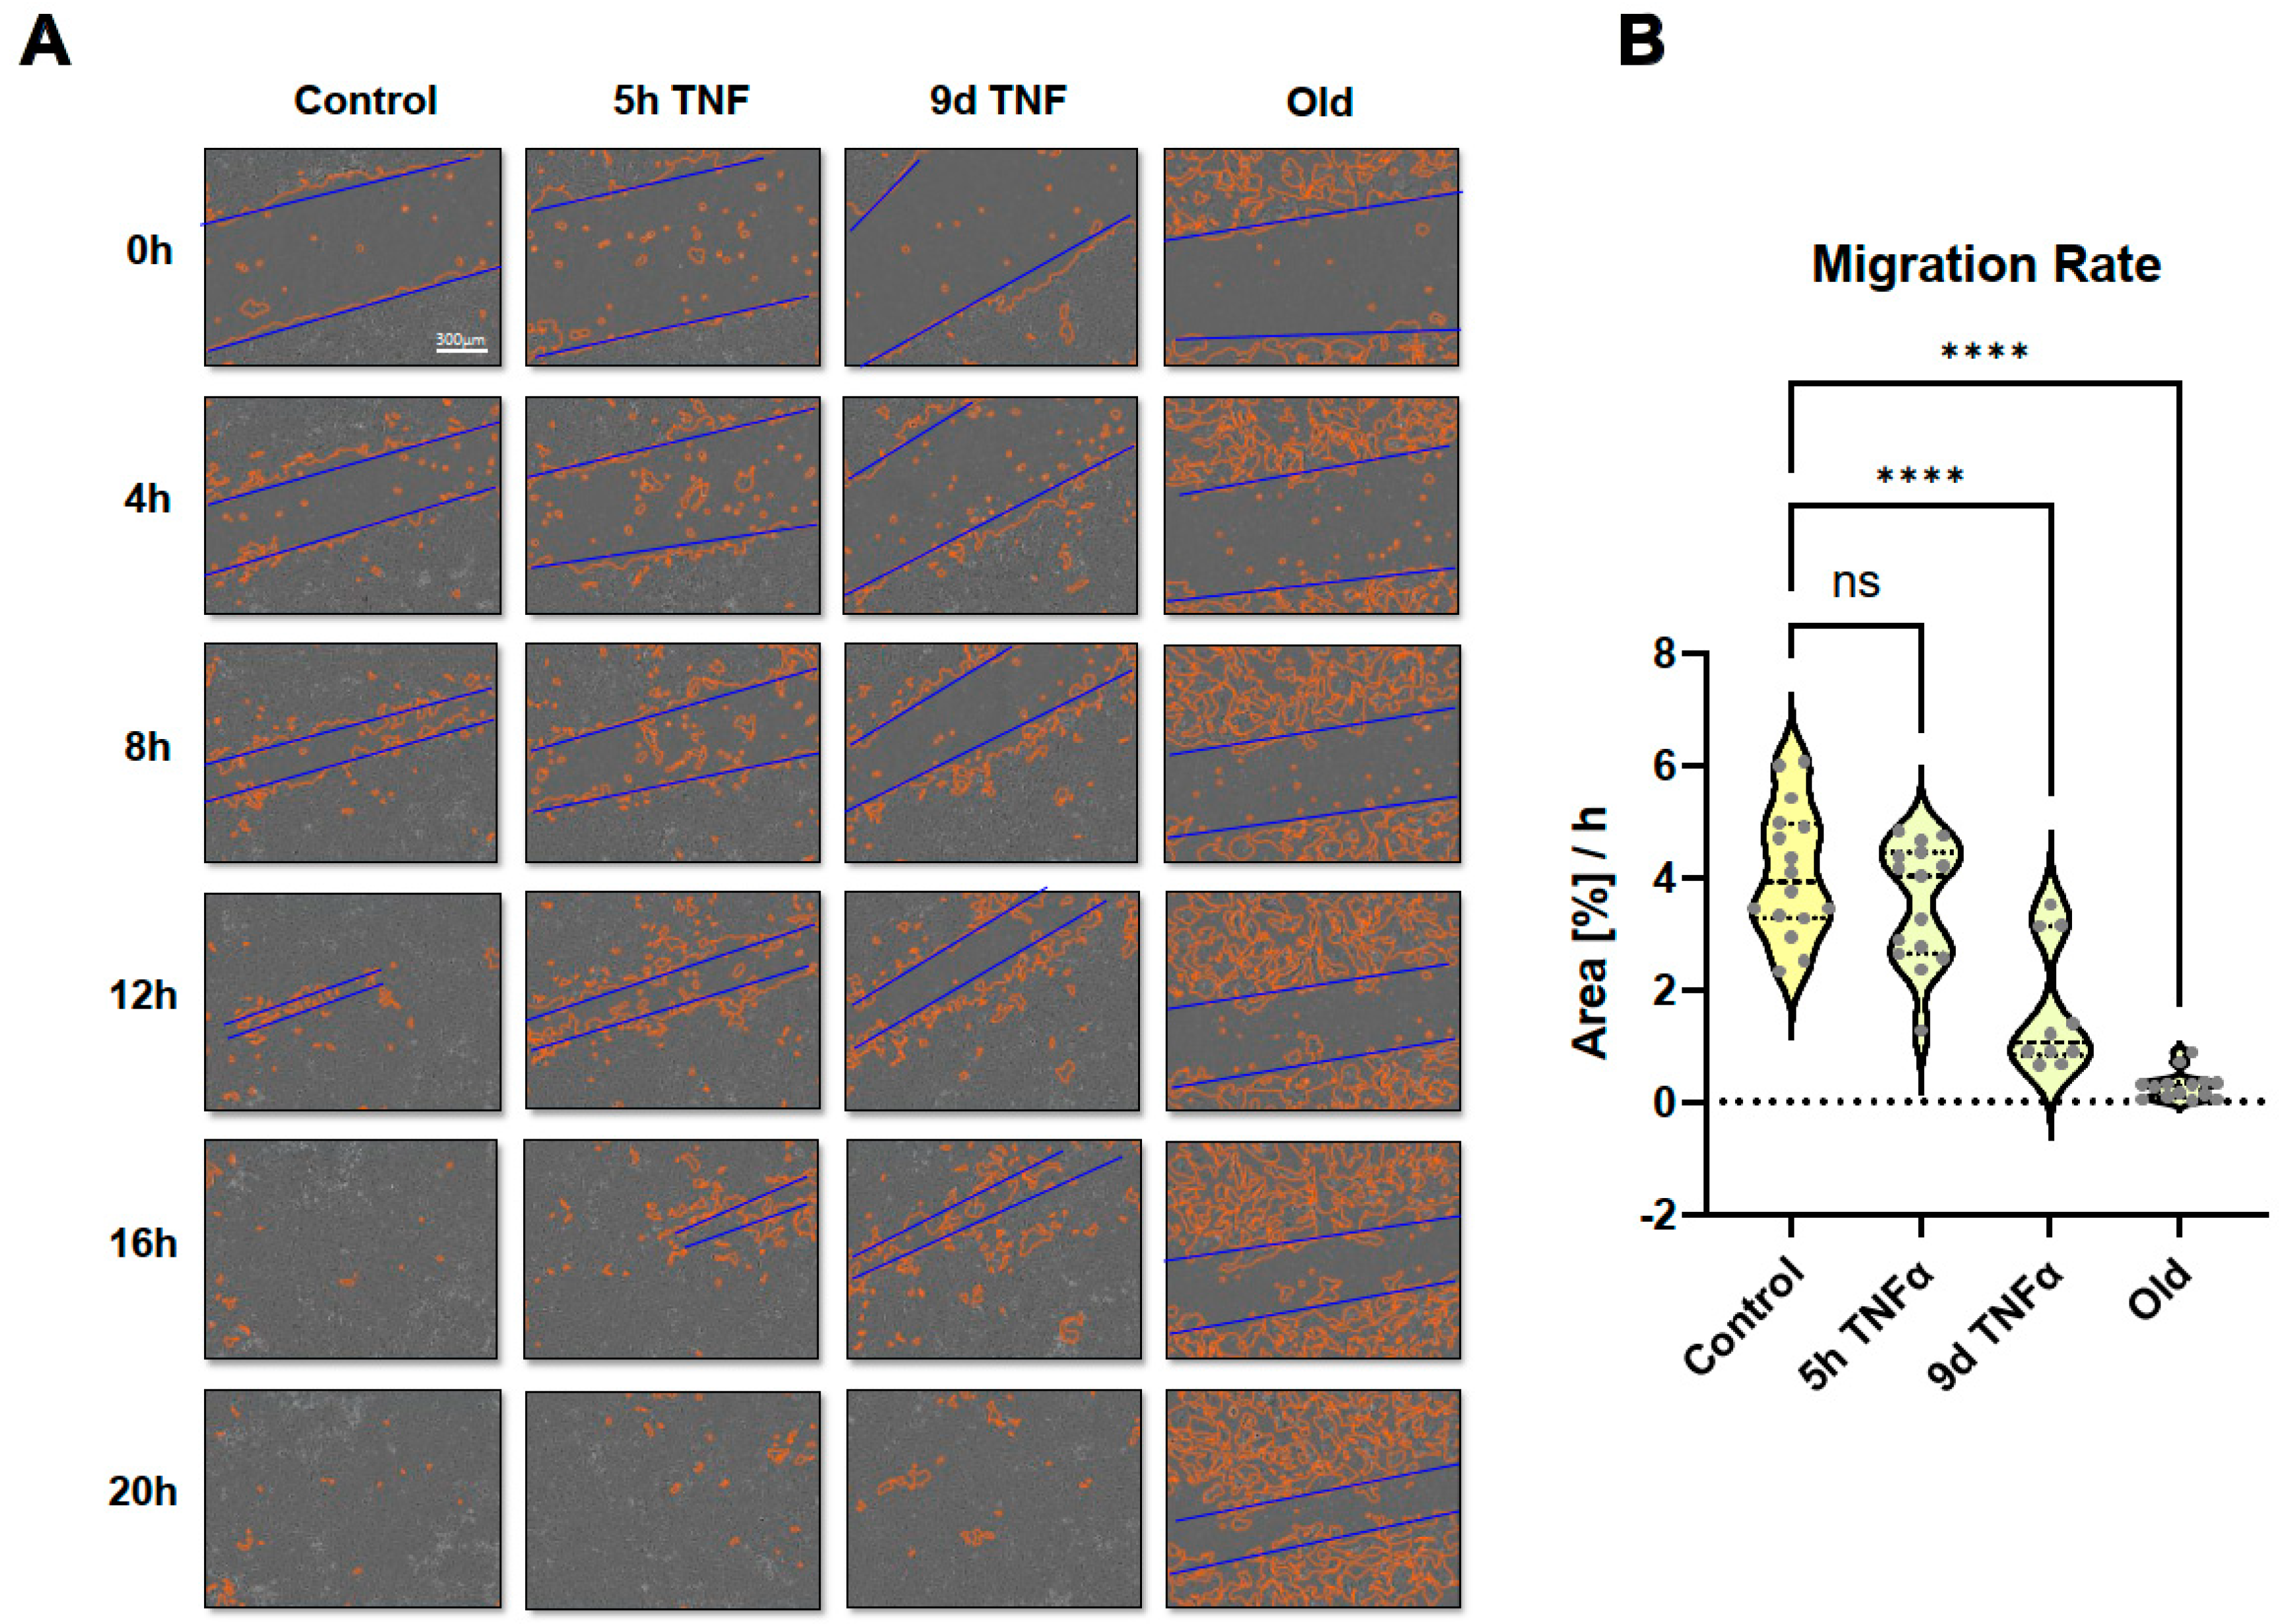
Since some cell migration related pathways or molecular signatures were seen in the transcriptomic analysis, we performed scratch assays and long-term microscopic evaluation. Monolayers of endothelial cells treated with TNFα for 5h or 9d or in replicative senescence were wounded by scratching with a pipette tip followed by microscopic imaging for 30h. Wound closure was quantitatively assessed using the Incucyte instrument software. Short-term TNFα treatment resulted in a significant reduction in migration rate, which was even more pronounced after long-term TNFα treatment (Figure 7 and Supplementary Movies S1–S4). Cells in replicative senescence could hardly close the wound during the observation period and moved more randomly in all directions, whereas cells with the other treatments showed a more directed movement towards the gap.
Since senescence is associated with a secretory phenotype, we performed an exploratory proteomic analysis of secretomes obtained from old (replicatively senescent) and young HUVECs. In this analysis, we identified a total of 427 proteins following stringent filtering for 3 valid values for each condition, of which 197 were present only in the secretomes of young HUVECs and 35 only in the secretomes of senescent cells. 195 proteins were found in both conditions (Supplementary Figure S3A). Quantitative comparison of the commonly identified proteins based on spectral counts revealed 69 proteins significantly higher in the secretome of old and 9 proteins significantly higher in the secretome of young HUVECs (p<0.05, with a log2-fold change cut-off > |0.5|), as shown in Supplementary Figure S3B. Notably, proteins that were higher or only found in old HUVECs had functions in hemostasis (101 proteins, adj. p-value 4.2e-14, odds ratio 10.31, combined score 381). Conversely, proteins higher or only found in young HUVEC had functions enriched in axon guidance (198 proteins, adj. p-value 9.9e-20, odds ratio 9.43, combined score 476.4).
In general, secretomes contain both secreted proteins (from secretory granules) and proteins within extracellular vesicles that are released into the supernatant. Since RNA sequencing also suggested potential effects on the formation of extracellular vesicles, we also performed a scouting experiment to determine potential differences in the formation of these vesicles using a nanoparticle analyzer. We compared only old (replicatively senescent) HUVECs with young endothelial cells. The average size of the vesicles was slightly below 100 nm regardless of the cell state. However, the number of vesicles released per cell was significantly higher in senescent cells. Together with the known diameter distribution, a significantly higher volume of the sum of these vesicles was calculated for cells in replicative senescence (Supplementary Figure S4).
4. Discussion
As living organisms age, they are exposed to a variety of environmental and internal stressors. In this study, we aimed to conduct an integrative study to assess similarities and differences between two major types of cellular senescence and acute and chronic inflammation, which are important triggers or cofactors of cellular aging. To this end, we first compared the transcriptome of proliferation-competent young HUVECs with that of senescent endothelial cells induced into this state by either exhaustive replication or ionizing radiation stress. Both senescent states showed upregulation of genes involved in mesenchymal transition, but also inflammatory molecular signatures related to interferon and TNFα-induced NF-κB signaling (Figure 1). There were few differences between the two types of senescence, with angiogenesis, myogenesis and coagulation upregulated in stress-induced senescence and hypoxia, and glycolysis specifically upregulated in replicative senescence. The predominance of inflammation-associated molecular signatures in both types of senescence suggested a comparison with pathways altered by acute or chronic inflammation. Therefore, we first analyzed the effects of short-term and long-term TNFα treatment compared to untreated controls (Figure 2). As in senescent cells, we observed very similar changes in molecular signatures, with the expected inflammatory pathways being enriched and MYC-related cell proliferation pathways being reduced. However, the magnitude of the molecular changes appeared to be greater in the acute inflammatory state. When we compared the long-term TNFα treatment with the acute inflammatory state, we found that mesenchymal transition was more predominant in chronic inflammation, whereas the classical inflammatory signatures and pathways induced by UV were already downregulated after long-term TNFα treatment. This suggests that acute defense mechanisms against stressors are reduced upon prolonged stimulation and replaced by phenotypic changes and alterations in cellular differentiation states. Separate analysis of the effects of senescence and inflammation revealed that they induce similar responses with overlapping signatures. We analyzed this aspect by visualizing the transcriptomic changes and their overlap with Venn graph tools - and querying the different intersections as well as unique gene sets with pathway enrichment methods (Figure 3). This revealed that the similarity between short-term TNFα treatment and senescence mainly included the classical TNFα and interferon-related inflammatory signatures, while the overlap between senescence and long-term TNFα treatment was related to mesenchymal transition, TGFβ signaling and myogenesis. This may suggest that inflammation drives senescence pathways under both acute and chronic conditions, albeit at different mechanistic levels that may act cooperatively. However, these findings must be interpreted with caution, as the transcriptomic profile of HUVECs changes after explanted from the intact umbilical cord and cultured in vitro due to the altered microenvironment with lack of blood flow and lack of crosstalk with other cells [48]. Nevertheless, our results are consistent with a meta-analysis of gene expression changes associated with aging that identified inflammatory pathways as an important common denominator [49]. Furthermore, we were able to verify our bioinformatic analyses with experimental results that supported the predicted changes in cell proliferation, expression of inflammatory cytokines (Figure 4) or genes involved in mesenchymal transition (Figure 5). Similarly, we could show that the marker lamin B1, which is lost in senescence, is reduced after long-term TNFα treatment (Figure 6), in agreement with some other reports [50]. Interestingly, however, lamin B1 was significantly elevated after short-term TNFα treatment, suggesting that chronic inflammation is required to trigger its reduction. Finally, our studies showed that inflammatory activation of endothelial cells has similar functional consequences in the context of wound healing - as a combination of proliferation and migration of cells (Figure 7). In particular, long-term TNFα treatment and cellular senescence had an inhibitory effect on wound healing potential. Since both chronic inflammation and cellular senescence increase with age, this explains the age-related decrease in regenerative potential.
Supplementary Materials
The following supporting information can be downloaded at: Preprints.org, Supplementary material containing Supplementary Figures S1–S4 and Supplementary movie 1-4.
Author Contributions
Conceptualization, J.A.S, J.Ba.; methodology, B.B., J. Ba., M.C.-M., U.R., J.A.S.; software, J.Ba., M.C.-M., J.A.S.; validation, B.B., J. Ba., J.A.S.; formal analysis, J. Ba., J.A.S.; investigation, B.B., J.Ba., A.F.P.S., U.R..; resources, J.A.S.; data curation, J. Ba., M.C.-M., J.A.S..; writing—original draft preparation, B.B., J.A.S.; writing—review and editing, J.A.S.; visualization, B.B., J.A.S.; supervision, J.A.S.; project administration, J.A.S.; funding acquisition, J.A.S. All authors have read and agreed to the published version of the manuscript.
Funding
This research was funded by the Austrian Science Fund (FWF), grant numbers P-31743 and I-5215.
Institutional Review Board Statement
The study was conducted in accordance with the Declaration of Helsinki and approved by the Institutional Review Board. HUVECs were isolated from human umbilical veins based on the granted permissions GS4-EK-4/562-2018 (issued by the Ethic Commission of Lower Austria, Austria) and EK 1259/20218 (issued by the Medical University of Vienna).
Informed Consent Statement
Informed consent was obtained from all subjects involved in the study (mothers of babies, whose umbilical cords were used for isolation of endothelial cells).
Data Availability Statement
The data presented in this study are available upon request from the corresponding author. The RNA sequencing datasets will be deposited to the GEO database.
Acknowledgments
This manuscript was written in memoriam of Pavel Uhrin, whose contributions and knowledge have greatly impacted this work. Although he is no longer with us, his dedication to science continues to inspire and guide our research. In addition, we acknowledge the valuable contribution of Johannes Breuss, who together with Pavel Uhrin guided and supervised the initial phase of this project. Furthermore, we would like to thank Judit Mihaly-Bison and Mario Hilpert for their excellent technical support as well as Manuel Mayr and Xiaoke Yin for the MS/MS analysis.
Conflicts of Interest
The authors declare no conflicts of interest. The funders had no role in the design of the study; in the collection, analyses, or interpretation of data; in the writing of the manuscript; or in the decision to publish the results.
Abbreviations
The following abbreviations are used in this manuscript:
| HUVEC | Human umbilical vein endothelial cells |
| EMT | Epithelial (or endothelial) mesenchymal transition |
References
- Vaduganathan, M.; Mensah, G.A.; Turco, J.V.; Fuster, V.; Roth, G.A. The global burden of cardiovascular diseases and risk: A compass for future health. J. Am. Coll. Cardiol. 2022, 80, 2361–2371. [Google Scholar] [CrossRef] [PubMed]
- Pawlikowski, J.S.; Adams, P.D.; Nelson, D.M. Senescence at a glance. J. Cell Sci. 2013, 126, 4061–4067. [Google Scholar] [CrossRef]
- Hayflick, L.; Moorhead, P.S. The serial cultivation of human diploid cell strains. Exp. Cell Res. 1961, 25, 585–621. [Google Scholar] [CrossRef] [PubMed]
- Marazita, M.C.; Dugour, A.; Marquioni-Ramella, M.D.; Figueroa, J.M.; Suburo, A.M. Oxidative stress-induced premature senescence dysregulates VEGF and CFH expression in retinal pigment epithelial cells: Implications for Age-related Macular Degeneration. Redox Biol. 2016, 7, 78–87. [Google Scholar] [CrossRef] [PubMed]
- Maejima, Y.; Adachi, S.; Ito, H.; Hirao, K.; Isobe, M. Induction of premature senescence in cardiomyocytes by doxorubicin as a novel mechanism of myocardial damage. Aging Cell 2008, 7, 125–136. [Google Scholar] [CrossRef]
- Khan, S.Y.; Awad, E.M.; Oszwald, A.; Mayr, M.; Yin, X.; Waltenberger, B.; Stuppner, H.; Lipovac, M.; Uhrin, P.; Breuss, J.M. Premature senescence of endothelial cells upon chronic exposure to TNFα can be prevented by N-acetyl cysteine and plumericin. Sci. Rep. 2017, 7, 39501. [Google Scholar] [CrossRef] [PubMed]
- Wiley, C.D.; Velarde, M.C.; Lecot, P.; Liu, S.; Sarnoski, E.A.; Freund, A.; Shirakawa, K.; Lim, H.W.; Davis, S.S.; Ramanathan, A.; Gerencser, A.A.; Verdin, E.; Campisi, J. Mitochondrial Dysfunction Induces Senescence with a Distinct Secretory Phenotype. Cell Metab. 2016, 23, 303–314. [Google Scholar] [CrossRef]
- Bertelli, P.M.; Pedrini, E.; Hughes, D.; McDonnell, S.; Pathak, V.; Peixoto, E.; Guduric-Fuchs, J.; Stitt, A.W.; Medina, R.J. Long term high glucose exposure induces premature senescence in retinal endothelial cells. Front. Physiol. 2022, 13, 929118. [Google Scholar] [CrossRef]
- Debacq-Chainiaux, F.; Borlon, C.; Pascal, T.; Royer, V.; Eliaers, F.; Ninane, N.; Carrard, G.; Friguet, B.; de Longueville, F.; Boffe, S.; Remacle, J.; Toussaint, O. Repeated exposure of human skin fibroblasts to UVB at subcytotoxic level triggers premature senescence through the TGF-beta1 signaling pathway. J. Cell Sci. 2005, 118, 743–758. [Google Scholar] [CrossRef]
- Kim, K.S.; Kim, J.E.; Choi, K.J.; Bae, S.; Kim, D.H. Characterization of DNA damage-induced cellular senescence by ionizing radiation in endothelial cells. Int. J. Radiat. Biol. 2014, 90, 71–80. [Google Scholar] [CrossRef]
- Larsson, L.-G. Oncogene- and tumor suppressor gene-mediated suppression of cellular senescence. Semin. Cancer Biol. 2011, 21, 367–376. [Google Scholar] [CrossRef] [PubMed]
- Coppé, J.-P.; Desprez, P.-Y.; Krtolica, A.; Campisi, J. The senescence-associated secretory phenotype: The dark side of tumor suppression. Annu. Rev. Pathol. 2010, 5, 99–118. [Google Scholar] [CrossRef] [PubMed]
- Salminen, A.; Kauppinen, A.; Kaarniranta, K. Emerging role of NF-κB signaling in the induction of senescence-associated secretory phenotype (SASP). Cell. Signal. 2012, 24, 835–845. [Google Scholar] [CrossRef] [PubMed]
- Belakova, B.; Wedige, N.K.; Awad, E.M.; Hess, S.; Oszwald, A.; Fellner, M.; Khan, S.Y.; Resch, U.; Lipovac, M.; Šmejkal, K.; Uhrin, P.; Breuss, J.M. Lipophilic Statins Eliminate Senescent Endothelial Cells by inducing Anoikis-Related Cell Death. Cells 2023, 12, 2836. [Google Scholar] [CrossRef] [PubMed]
- Erusalimsky, J.D.; Kurz, D.J. Cellular senescence in vivo: Its relevance in ageing and cardiovascular disease. Exp. Gerontol. 2005, 40, 634–642. [Google Scholar] [CrossRef]
- Grosse, L.; Wagner, N.; Emelyanov, A.; Molina, C.; Lacas-Gervais, S.; Wagner, K.-D.; Bulavin, D.V. Defined p16High Senescent Cell Types Are Indispensable for Mouse Healthspan. Cell Metab. 2020, 32, 87–99.e6. [Google Scholar] [CrossRef]
- Falkenberg, K.D.; Rohlenova, K.; Luo, Y.; Carmeliet, P. The metabolic engine of endothelial cells. Nat. Metab. 2019, 1, 937–946. [Google Scholar] [CrossRef] [PubMed]
- Warboys, C.M.; de Luca, A.; Amini, N.; Luong, L.; Duckles, H.; Hsiao, S.; White, A.; Biswas, S.; Khamis, R.; Chong, C.K.; Cheung, W.-M.; Sherwin, S.J.; Bennett, M.R.; Gil, J.; Mason, J.C.; Haskard, D.O.; Evans, P.C. Disturbed flow promotes endothelial senescence via a p53-dependent pathway. Arterioscler. Thromb. Vasc. Biol. 2014, 34, 985–995. [Google Scholar] [CrossRef]
- Bloom, S.I.; Islam, M.T.; Lesniewski, L.A.; Donato, A.J. Mechanisms and consequences of endothelial cell senescence. Nat. Rev. Cardiol. 2023, 20, 38–51. [Google Scholar] [CrossRef]
- Ungvari, Z.; Podlutsky, A.; Sosnowska, D.; Tucsek, Z.; Toth, P.; Deak, F.; Gautam, T.; Csiszar, A.; Sonntag, W.E. Ionizing radiation promotes the acquisition of a senescence-associated secretory phenotype and impairs angiogenic capacity in cerebromicrovascular endothelial cells: Role of increased DNA damage and decreased DNA repair capacity in microvascular radiosensitivity. J. Gerontol. A Biol. Sci. Med. Sci. 2013, 68, 1443–1457. [Google Scholar] [CrossRef]
- Krouwer, V.J.D.; Hekking, L.H.P.; Langelaar-Makkinje, M.; Regan-Klapisz, E.; Post, J.A. Endothelial cell senescence is associated with disrupted cell-cell junctions and increased monolayer permeability. Vasc. Cell 2012, 4, 12. [Google Scholar] [CrossRef] [PubMed]
- Silva, G.C.; Abbas, M.; Khemais-Benkhiat, S.; Burban, M.; Ribeiro, T.P.; Toti, F.; Idris-Khodja, N.; Côrtes, S.F.; Schini-Kerth, V.B. Replicative senescence promotes prothrombotic responses in endothelial cells: Role of NADPH oxidase- and cyclooxygenase-derived oxidative stress. Exp. Gerontol. 2017, 93, 7–15. [Google Scholar] [CrossRef] [PubMed]
- Crampton, S.P.; Davis, J.; Hughes, C.C.W. Isolation of human umbilical vein endothelial cells (HUVEC). J. Vis. Exp. 2007, 183. [Google Scholar] [CrossRef]
- Pfaffl, M.W. A new mathematical model for relative quantification in real-time RT-PCR. Nucleic Acids Res. 2001, 29, e45. [Google Scholar] [CrossRef] [PubMed]
- González-Bermúdez, L.; Anglada, T.; Genescà, A.; Martín, M.; Terradas, M. Identification of reference genes for RT-qPCR data normalisation in aging studies. Sci. Rep. 2019, 9, 13970. [Google Scholar] [CrossRef] [PubMed]
- Martin, M. Cutadapt removes adapter sequences from high-throughput sequencing reads. EMBnet j. 2011, 17, 10. [Google Scholar] [CrossRef]
- Dobin, A.; Davis, C.A.; Schlesinger, F.; Drenkow, J.; Zaleski, C.; Jha, S.; Batut, P.; Chaisson, M.; Gingeras, T.R. STAR: Ultrafast universal RNA-seq aligner. Bioinformatics 2013, 29, 15–21. [Google Scholar] [CrossRef] [PubMed]
- FelixKrueger TrimGalore/Docs/Trim_Galore_User_Guide.md at master · FelixKrueger/TrimGalore. Available online: https://github.com/FelixKrueger/TrimGalore/blob/master/Docs/Trim_Galore_User_Guide.md (accessed on 7 April 2025).
- Posit Software, P.B.C. RStudio: Integrated Development Environment for R. Available online: http://www.posit.co/ (accessed on 7 April 2025).
- R Foundation for Statistical Computing; R Core Team R: A Language and Environment for Statistical Computing.
- Chen, Y.; Chen, L.; Lun, A.T.L.; Baldoni, P.L.; Smyth, G.K. edgeR v4: Powerful differential analysis of sequencing data with expanded functionality and improved support for small counts and larger datasets. Nucleic Acids Res. 2025, 53. [Google Scholar] [CrossRef]
- Durinck, S.; Spellman, P.T.; Birney, E.; Huber, W. Mapping identifiers for the integration of genomic datasets with the R/Bioconductor package biomaRt. Nat. Protoc. 2009, 4, 1184–1191. [Google Scholar] [CrossRef]
- Zhou, G.; Soufan, O.; Ewald, J.; Hancock, R.E.W.; Basu, N.; Xia, J. NetworkAnalyst 3.0: A visual analytics platform for comprehensive gene expression profiling and meta-analysis. Nucleic Acids Res. 2019, 47, W234–W241. [Google Scholar] [CrossRef]
- Szklarczyk, D.; Kirsch, R.; Koutrouli, M.; Nastou, K.; Mehryary, F.; Hachilif, R.; Gable, A.L.; Fang, T.; Doncheva, N.T.; Pyysalo, S.; Bork, P.; Jensen, L.J.; von Mering, C. The STRING database in 2023: Protein-protein association networks and functional enrichment analyses for any sequenced genome of interest. Nucleic Acids Res. 2023, 51, D638–D646. [Google Scholar] [CrossRef] [PubMed]
- Shannon, P.; Markiel, A.; Ozier, O.; Baliga, N.S.; Wang, J.T.; Ramage, D.; Amin, N.; Schwikowski, B.; Ideker, T. Cytoscape: A software environment for integrated models of biomolecular interaction networks. Genome Res. 2003, 13, 2498–2504. [Google Scholar] [CrossRef] [PubMed]
- Hulsen, T. DeepVenn -- a web application for the creation of area-proportional Venn diagrams using the deep learning framework Tensorflow.js. arXiv 2022. [Google Scholar] [CrossRef]
- Chen, E.Y.; Tan, C.M.; Kou, Y.; Duan, Q.; Wang, Z.; Meirelles, G.V.; Clark, N.R.; Ma’ayan, A. Enrichr: Interactive and collaborative HTML5 gene list enrichment analysis tool. BMC Bioinformatics 2013, 14, 128. [Google Scholar] [CrossRef] [PubMed]
- Xie, Z.; Bailey, A.; Kuleshov, M.V.; Clarke, D.J.B.; Evangelista, J.E.; Jenkins, S.L.; Lachmann, A.; Wojciechowicz, M.L.; Kropiwnicki, E.; Jagodnik, K.M.; Jeon, M.; Ma’ayan, A. Gene Set Knowledge Discovery with Enrichr. Curr. Protoc. 2021, 1, e90. [Google Scholar] [CrossRef]
- Wickham, H. ggplot2: Elegant Graphics for Data Analysis (Use R!), 1st ed.; Corr. 3rd printing 2010; Springer: New York, 2009; p. 213. ISBN 9780387981413. [Google Scholar]
- Subramanian, A.; Tamayo, P.; Mootha, V.K.; Mukherjee, S.; Ebert, B.L.; Gillette, M.A.; Paulovich, A.; Pomeroy, S.L.; Golub, T.R.; Lander, E.S.; Mesirov, J.P. Gene set enrichment analysis: A knowledge-based approach for interpreting genome-wide expression profiles. Proc Natl Acad Sci USA 2005, 102, 15545–15550. [Google Scholar] [CrossRef] [PubMed]
- Korotkevich, G.; Sukhov, V.; Budin, N.; Shpak, B.; Artyomov, M.N.; Sergushichev, A. Fast gene set enrichment analysis. BioRxiv 2016. [Google Scholar] [CrossRef]
- Xu, S.; Hu, E.; Cai, Y.; Xie, Z.; Luo, X.; Zhan, L.; Tang, W.; Wang, Q.; Liu, B.; Wang, R.; Xie, W.; Wu, T.; Xie, L.; Yu, G. Using clusterProfiler to characterize multiomics data. Nat. Protoc. 2024, 19, 3292–3320. [Google Scholar] [CrossRef] [PubMed]
- Liberzon, A.; Birger, C.; Thorvaldsdóttir, H.; Ghandi, M.; Mesirov, J.P.; Tamayo, P. The Molecular Signatures Database (MSigDB) hallmark gene set collection. Cell Syst. 2015, 1, 417–425. [Google Scholar] [CrossRef] [PubMed]
- Dolgalev, I. msigdbr: MSigDB Gene Sets for Multiple Organisms in a Tidy Data Format. Available online: https://CRAN.R-project.org/package=msigdbr (accessed on 7 April 2025).
- Schindelin, J.; Arganda-Carreras, I.; Frise, E.; Kaynig, V.; Longair, M.; Pietzsch, T.; Preibisch, S.; Rueden, C.; Saalfeld, S.; Schmid, B.; Tinevez, J.-Y.; White, D.J.; Hartenstein, V.; Eliceiri, K.; Tomancak, P.; Cardona, A. Fiji: An open-source platform for biological-image analysis. Nat. Methods 2012, 9, 676–682. [Google Scholar] [CrossRef] [PubMed]
- Piera-Velazquez, S.; Jimenez, S.A. Endothelial to mesenchymal transition: Role in physiology and in the pathogenesis of human diseases. Physiol. Rev. 2019, 99, 1281–1324. [Google Scholar] [CrossRef] [PubMed]
- Wang, A.S.; Ong, P.F.; Chojnowski, A.; Clavel, C.; Dreesen, O. Loss of lamin B1 is a biomarker to quantify cellular senescence in photoaged skin. Sci. Rep. 2017, 7, 15678. [Google Scholar] [CrossRef] [PubMed]
- Afshar, Y.; Ma, F.; Quach, A.; Jeong, A.; Sunshine, H.L.; Freitas, V.; Jami-Alahmadi, Y.; Helaers, R.; Li, X.; Pellegrini, M.; Wohlschlegel, J.A.; Romanoski, C.E.; Vikkula, M.; Iruela-Arispe, M.L. Transcriptional drifts associated with environmental changes in endothelial cells. eLife 2023, 12. [Google Scholar] [CrossRef] [PubMed]
- de Magalhães, J.P.; Curado, J.; Church, G.M. Meta-analysis of age-related gene expression profiles identifies common signatures of aging. Bioinformatics 2009, 25, 875–881. [Google Scholar] [CrossRef] [PubMed]
- Tran, J.R.; Chen, H.; Zheng, X.; Zheng, Y. Lamin in inflammation and aging. Curr. Opin. Cell Biol. 2016, 40, 124–130. [Google Scholar] [CrossRef]
Figure 1.
Gene set enrichment analysis (GSEA) after stress-induced or replicative senescence of endothelial cells. Left: Young HUVECs irradiated with 10 Gy (at a stress-induced senescent state) were compared to non-irradiated control cells. Right: HUVECs at replicative senescence (after 35 passages) compared to young endothelial control cells. Significant Hallmark Gene sets of the Molecular Signature database are shown with the normalized enrichment score (NES) with the adjusted p-value shown in gradients of red as indicated in the legend. Arrows indicate differences between the responses. Three replicates were analyzed for each experimental condition.
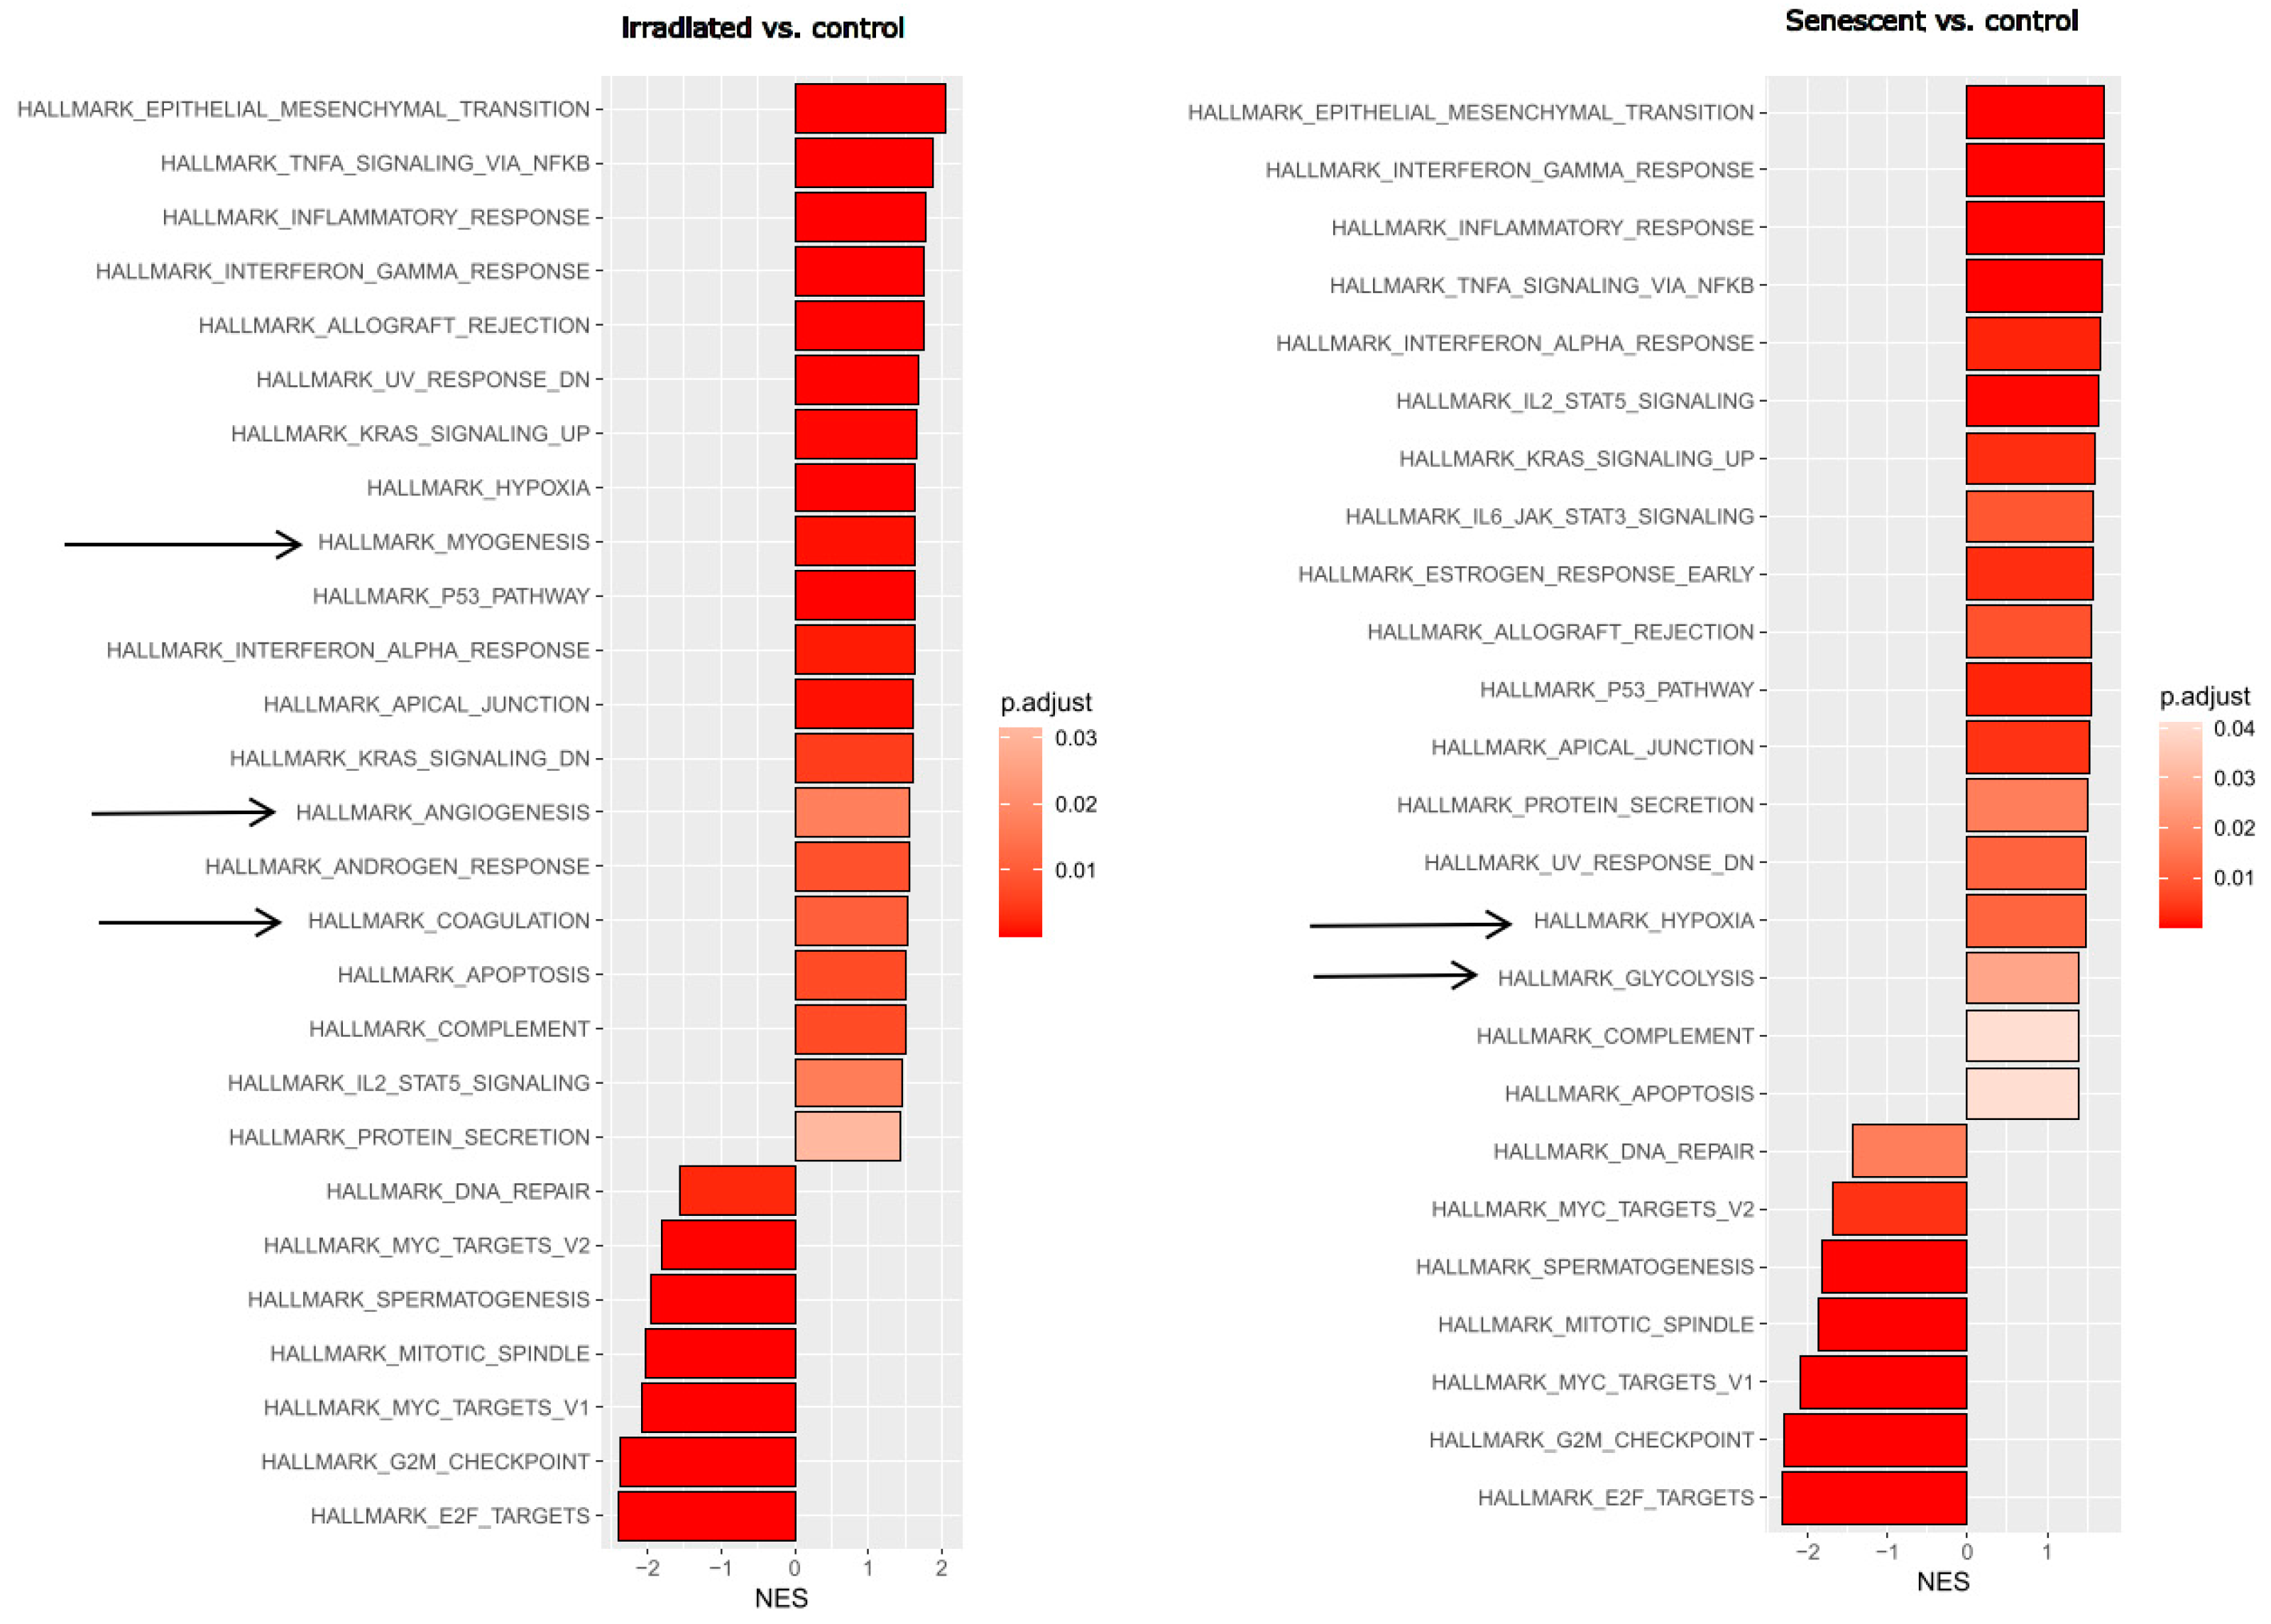
Figure 2.
Gene set enrichment analysis (GSEA) after short- or long-term TNFα treatment of endothelial cells. Left: Hallmark gene set changes of HUVECs treated for 5h with TNFα as compared to untreated controls. Upper right: Hallmark gene set changes of HUVECs after long-term TNFα treatment versus untreated controls. Normalized enrichment scores (NES) are shown with the adjusted p-value in gradients of red as indicated in the legend. Black lines indicate differences in the molecular signatures altered by 5h and 9d TNFα treatment. Lower right: Direct comparison of 9d versus 5h TNFα treatment for a more sensitive assessment of their differences. Three replicates were analyzed for each experimental condition. Black vertical lines indicate differences in enriched signatures,.
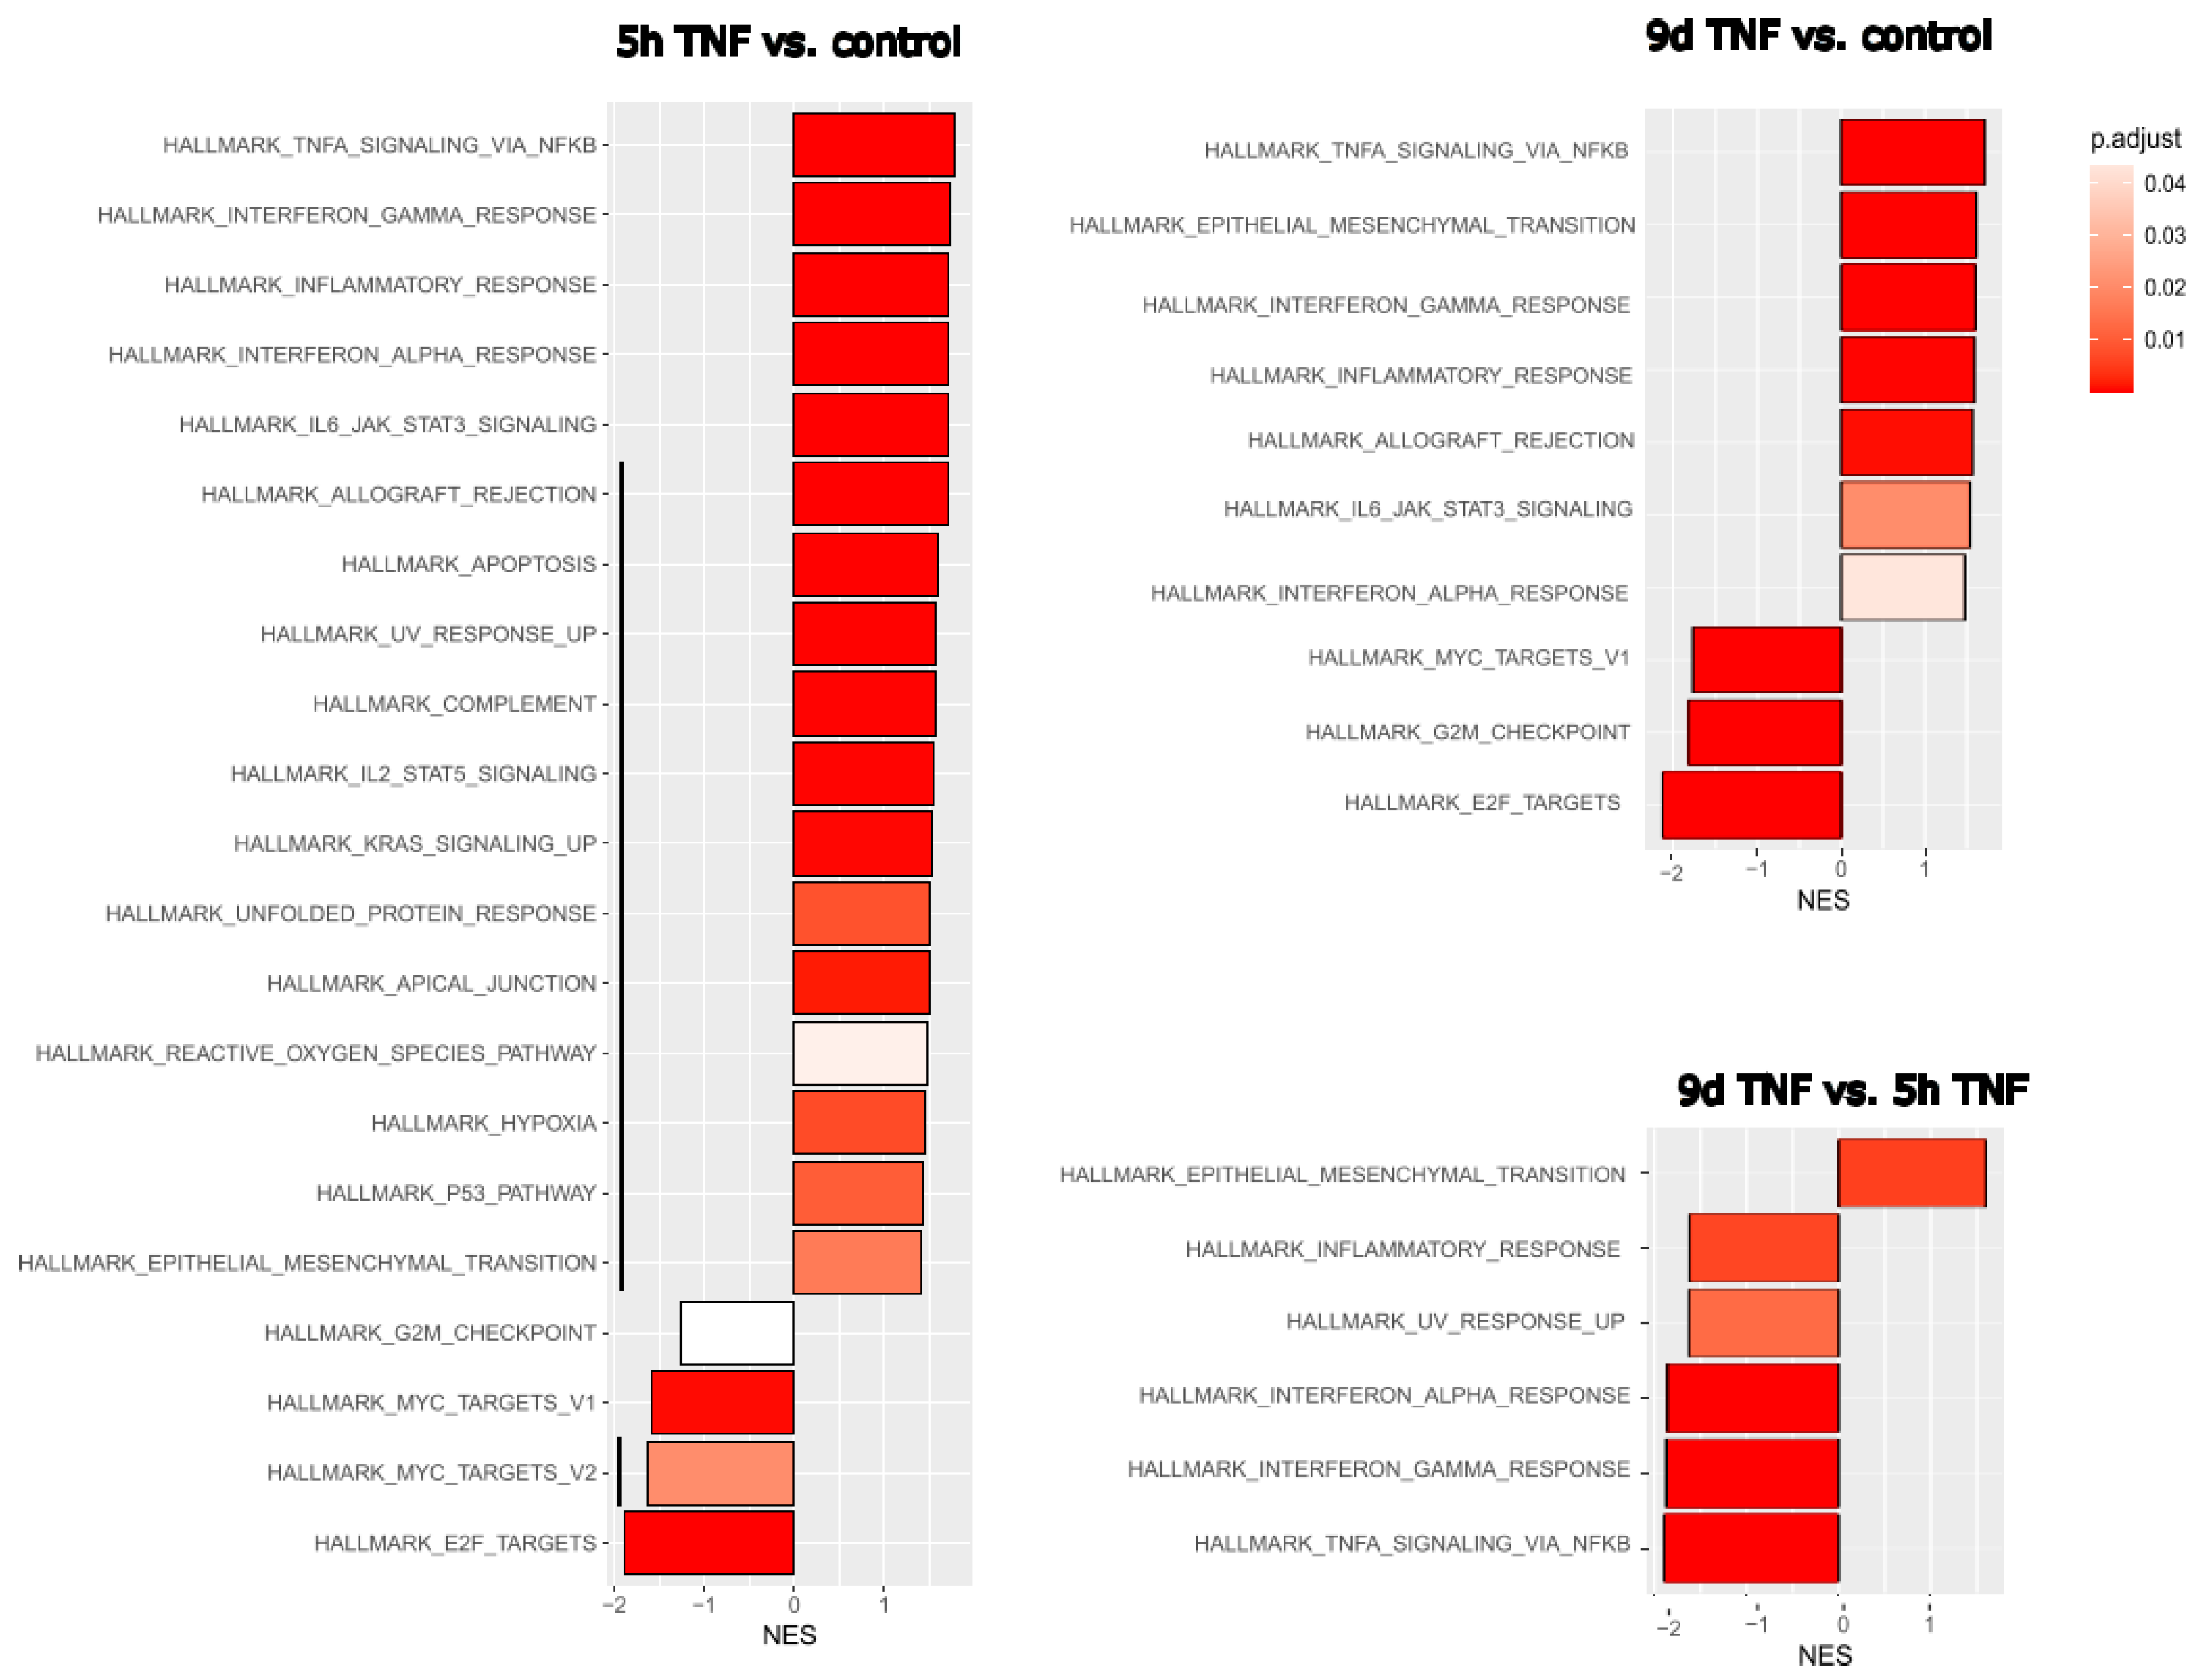
Figure 3.
Proportional Venn graph showing gene expression changes, their overlaps and enriched pathways for senescence, short- and long-term TNFα treatment of endothelial cells. (A) Proportional Venn graph for significantly altered genes (FDR<0.05; log-fold change above 0.5 or below -0.5) using DeepVenn [36]. (B) Pathways enriched for the overlap between senescence and 9d TNFα treatment, or those for the overlap between senescence and 5h TNFα treatment were determined using the Enrichr web-platform [38].
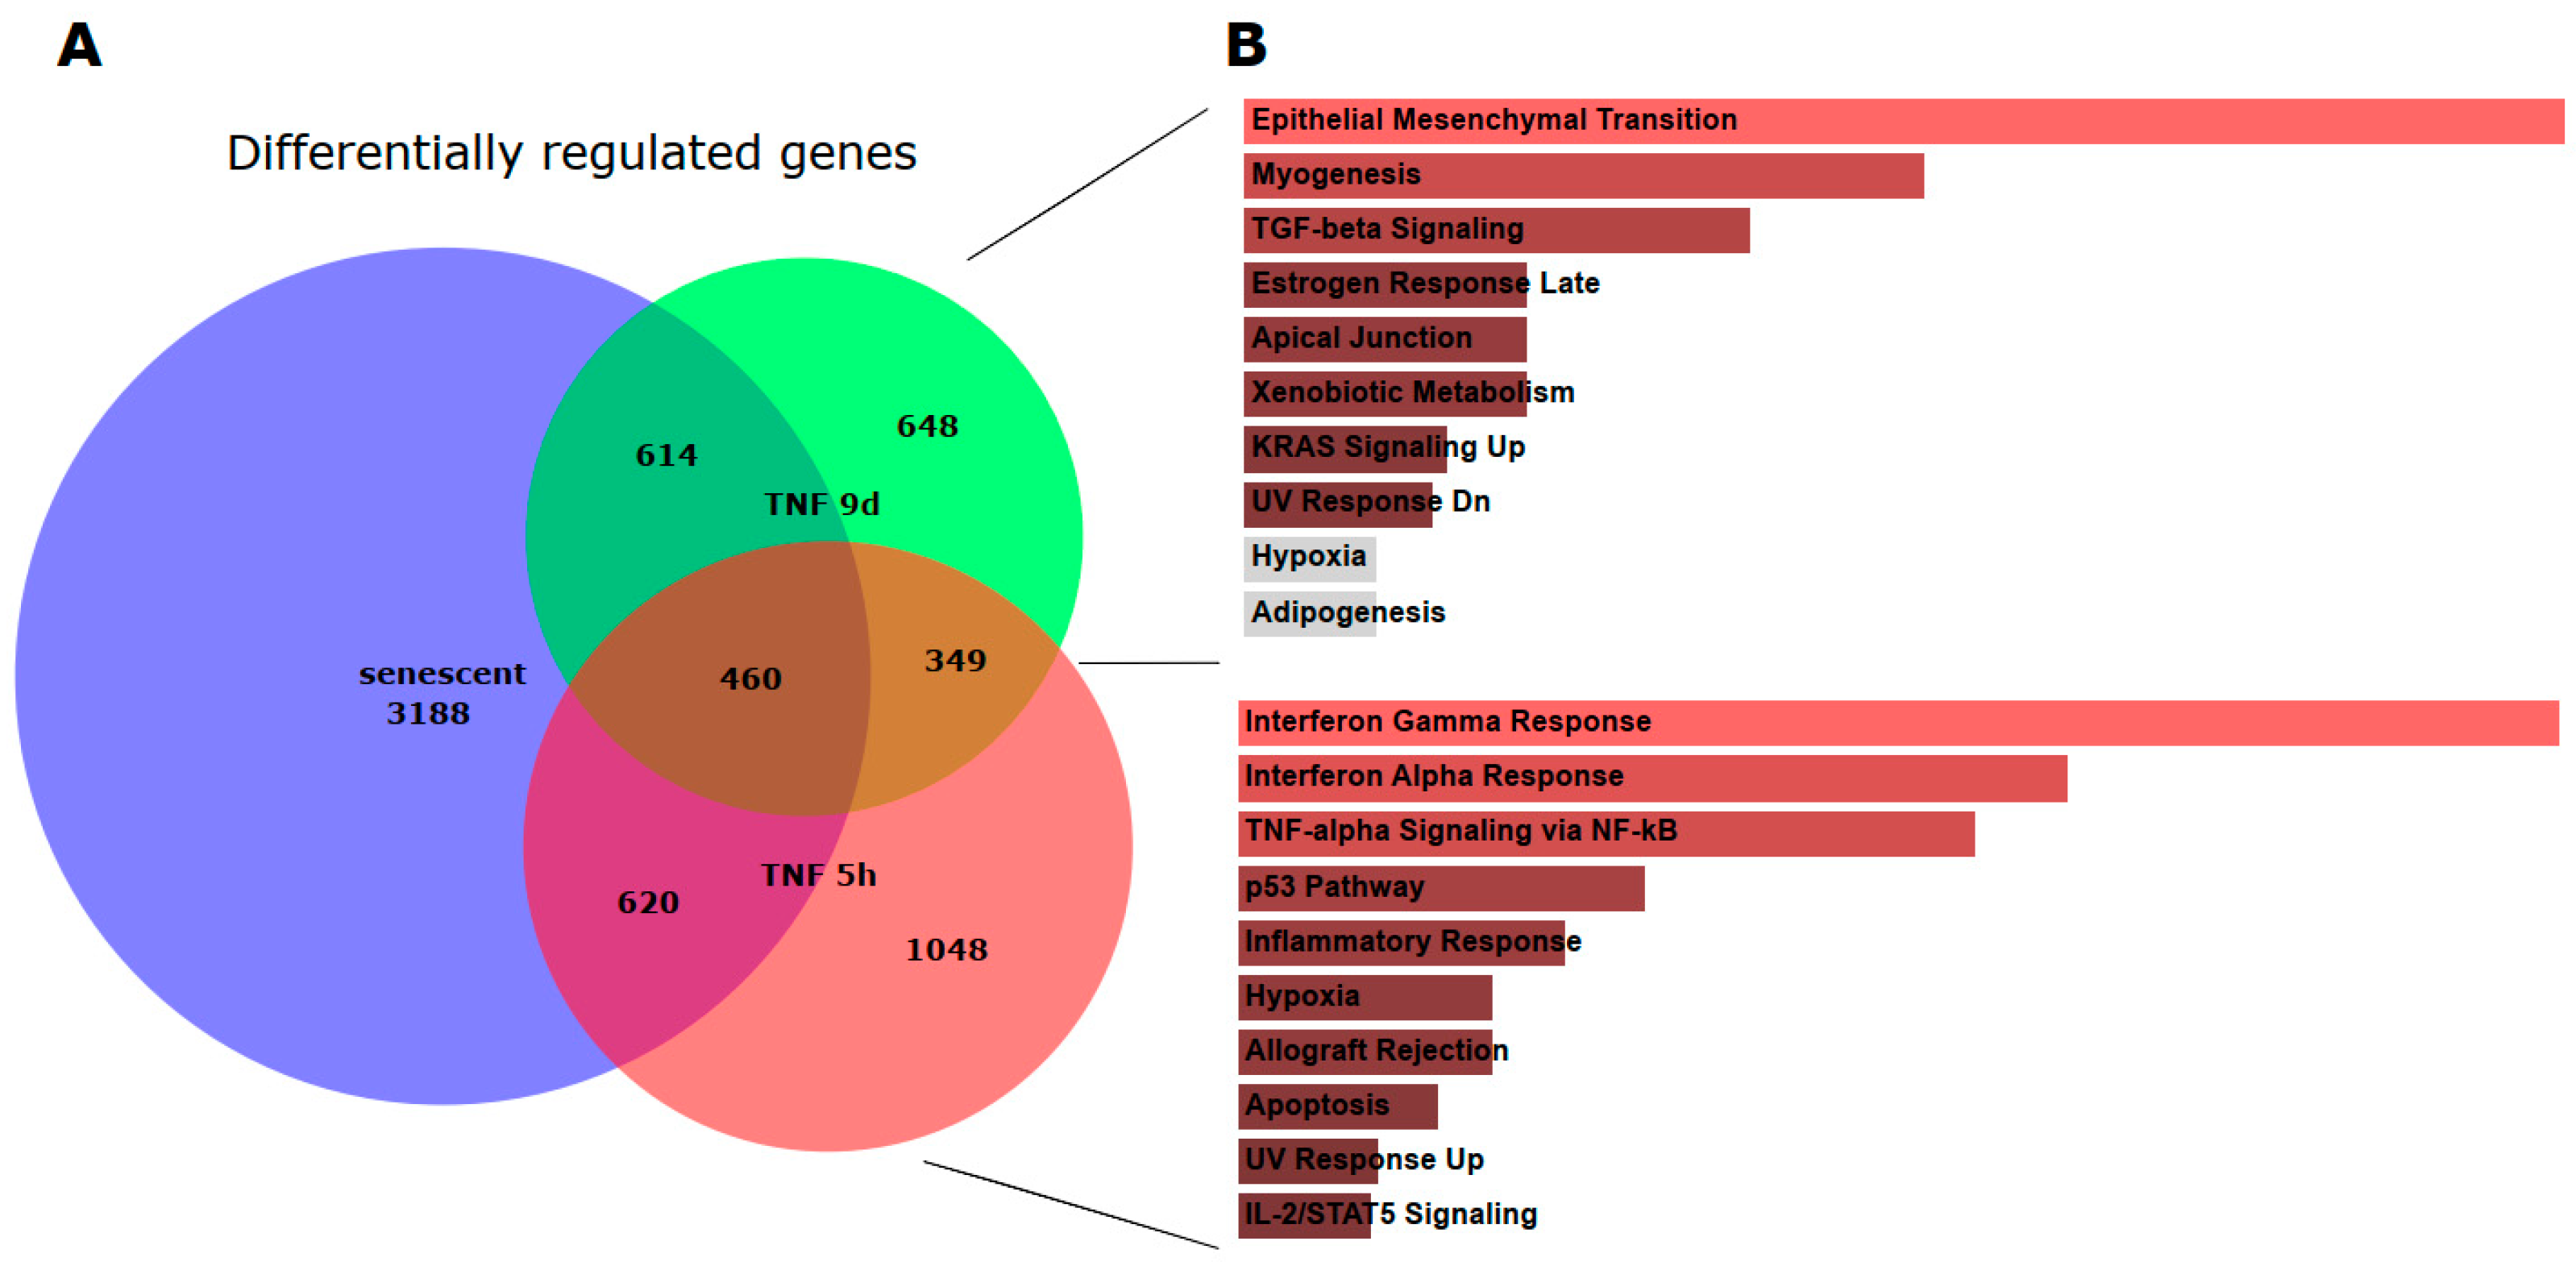
Figure 4.
(A) Quantification of the proliferation marker Ki67 in young endothelial cells treated with TNFα for 5h or 9d, as compared to cells in replicative senescence (Old) or stress-induced senescence (irradiated). (B) Quantification of IL-6 secretion or (C) IL-8 secretion in cells under the conditions as described in (A).
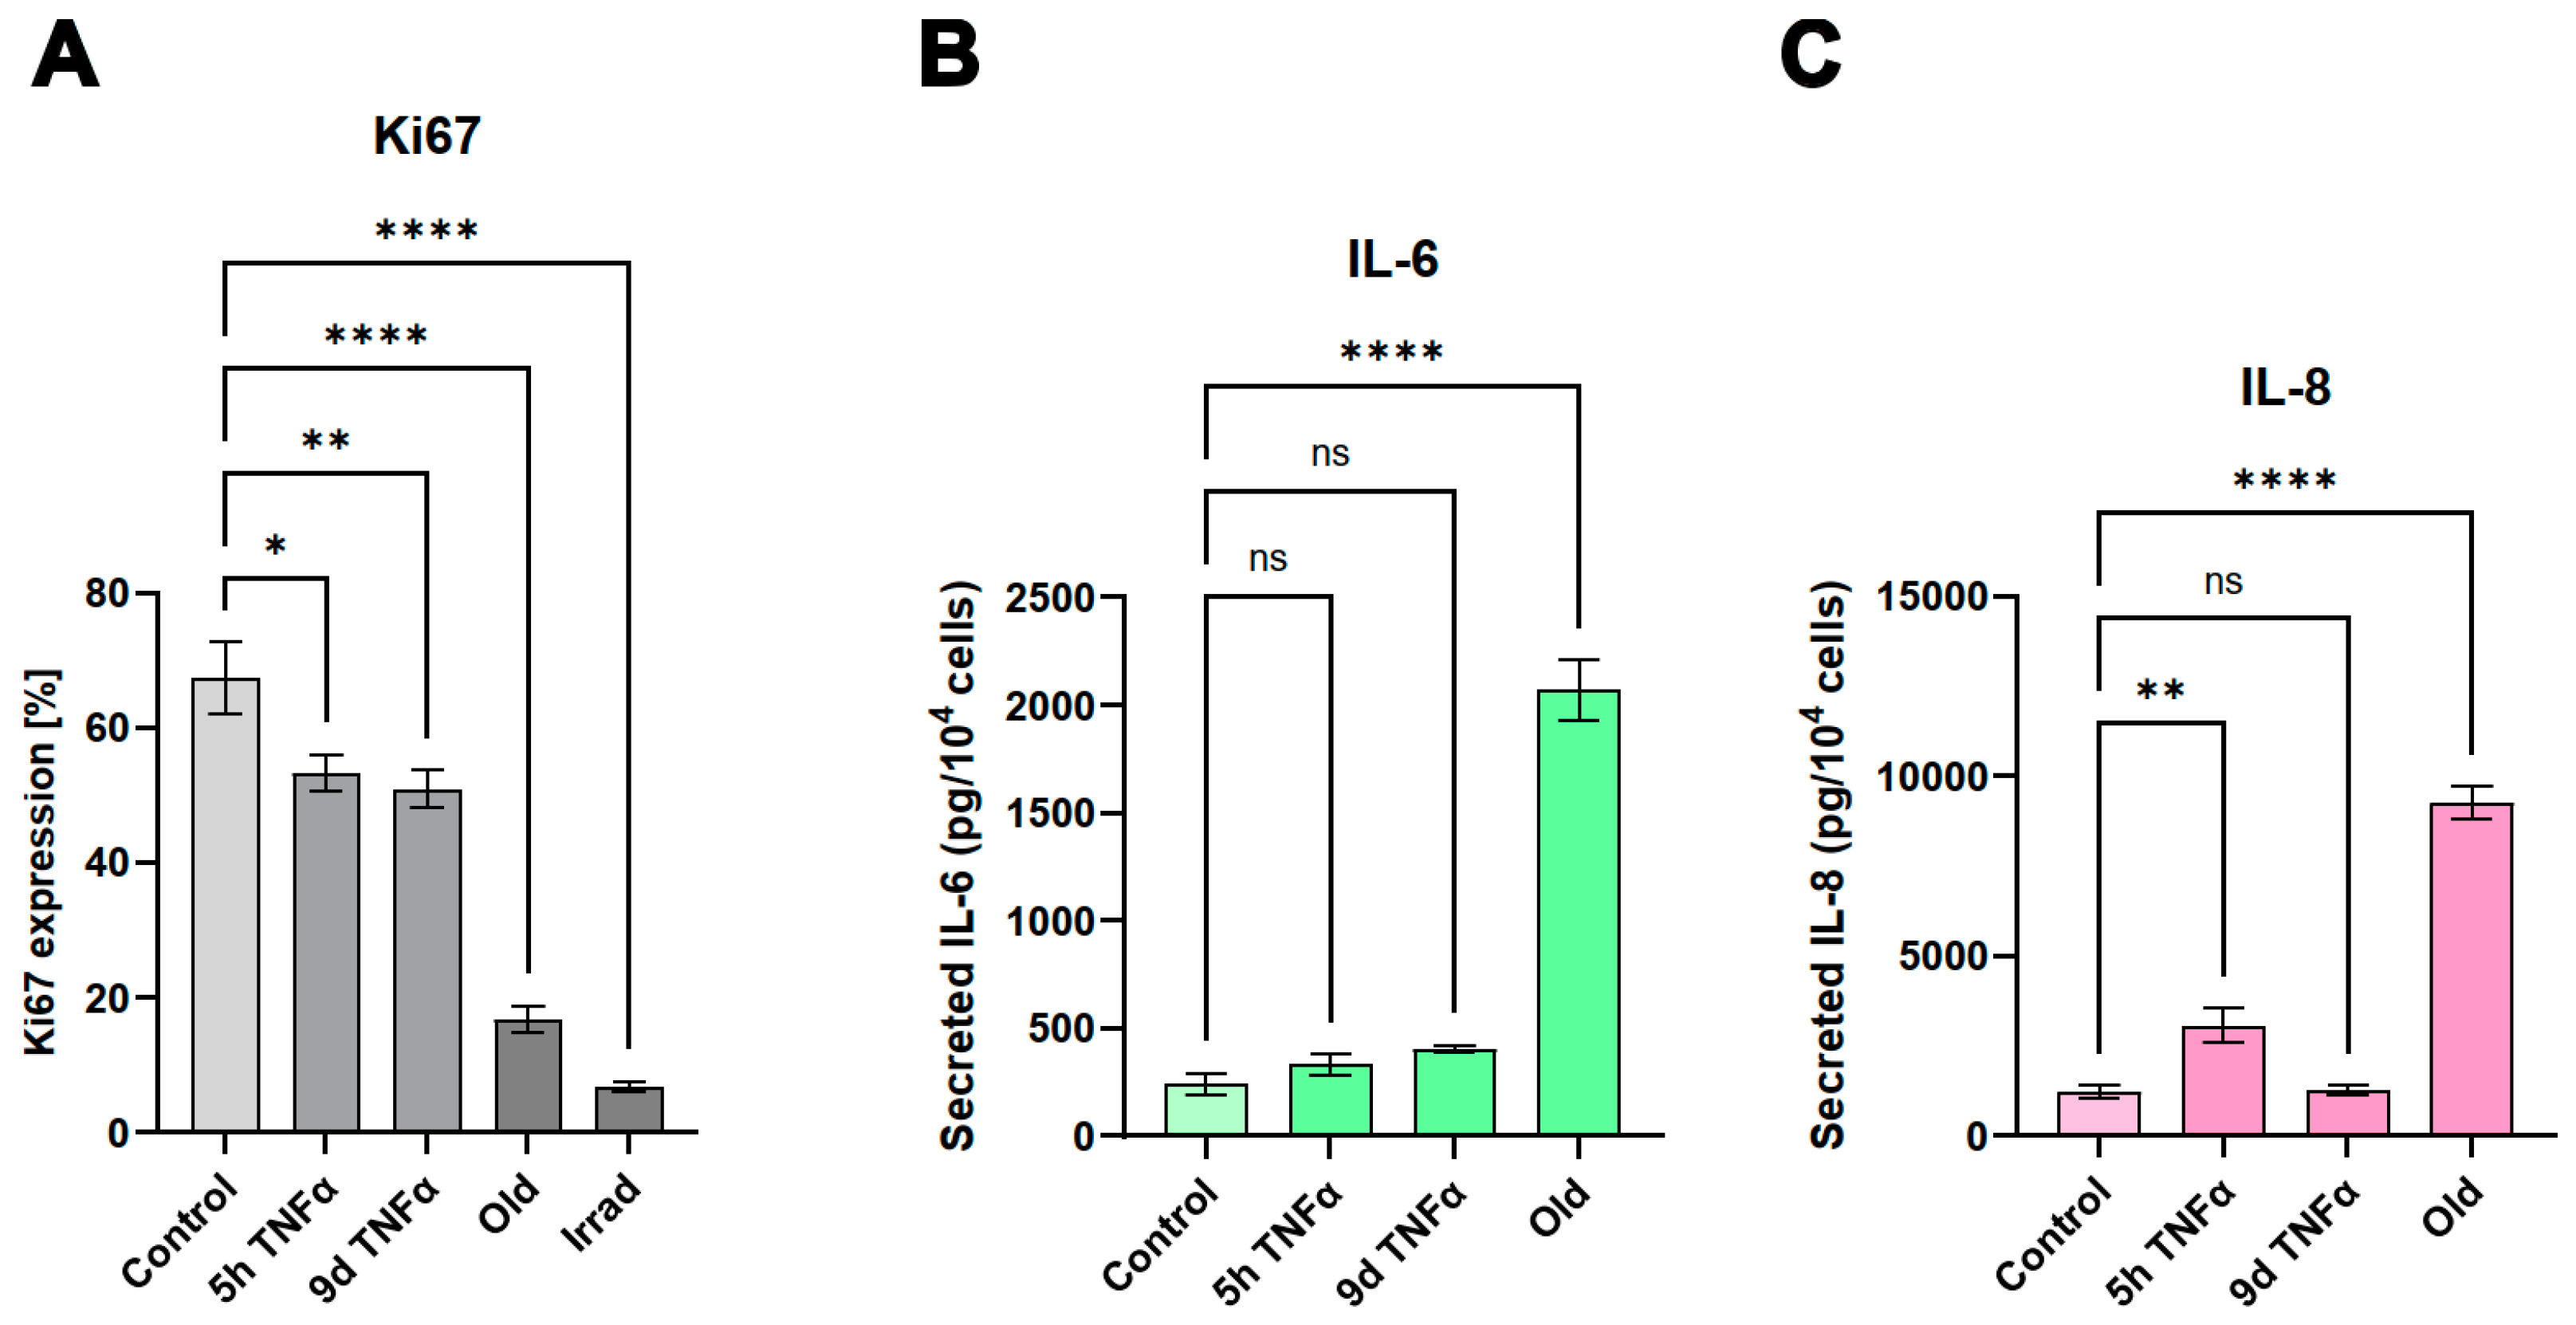
Figure 5.
qPCR-based quantification of the expression of the EMT-marker genes N-cadherin (A), Vimentin (B) and Fibronectin (C) in young HUVECs treated with TNFα for 5h or 9d, HUVECs in replicative senescence (Old) or young HUVECs rendered senescent by gamma-irradiation (Irrad).
Figure 5.
qPCR-based quantification of the expression of the EMT-marker genes N-cadherin (A), Vimentin (B) and Fibronectin (C) in young HUVECs treated with TNFα for 5h or 9d, HUVECs in replicative senescence (Old) or young HUVECs rendered senescent by gamma-irradiation (Irrad).
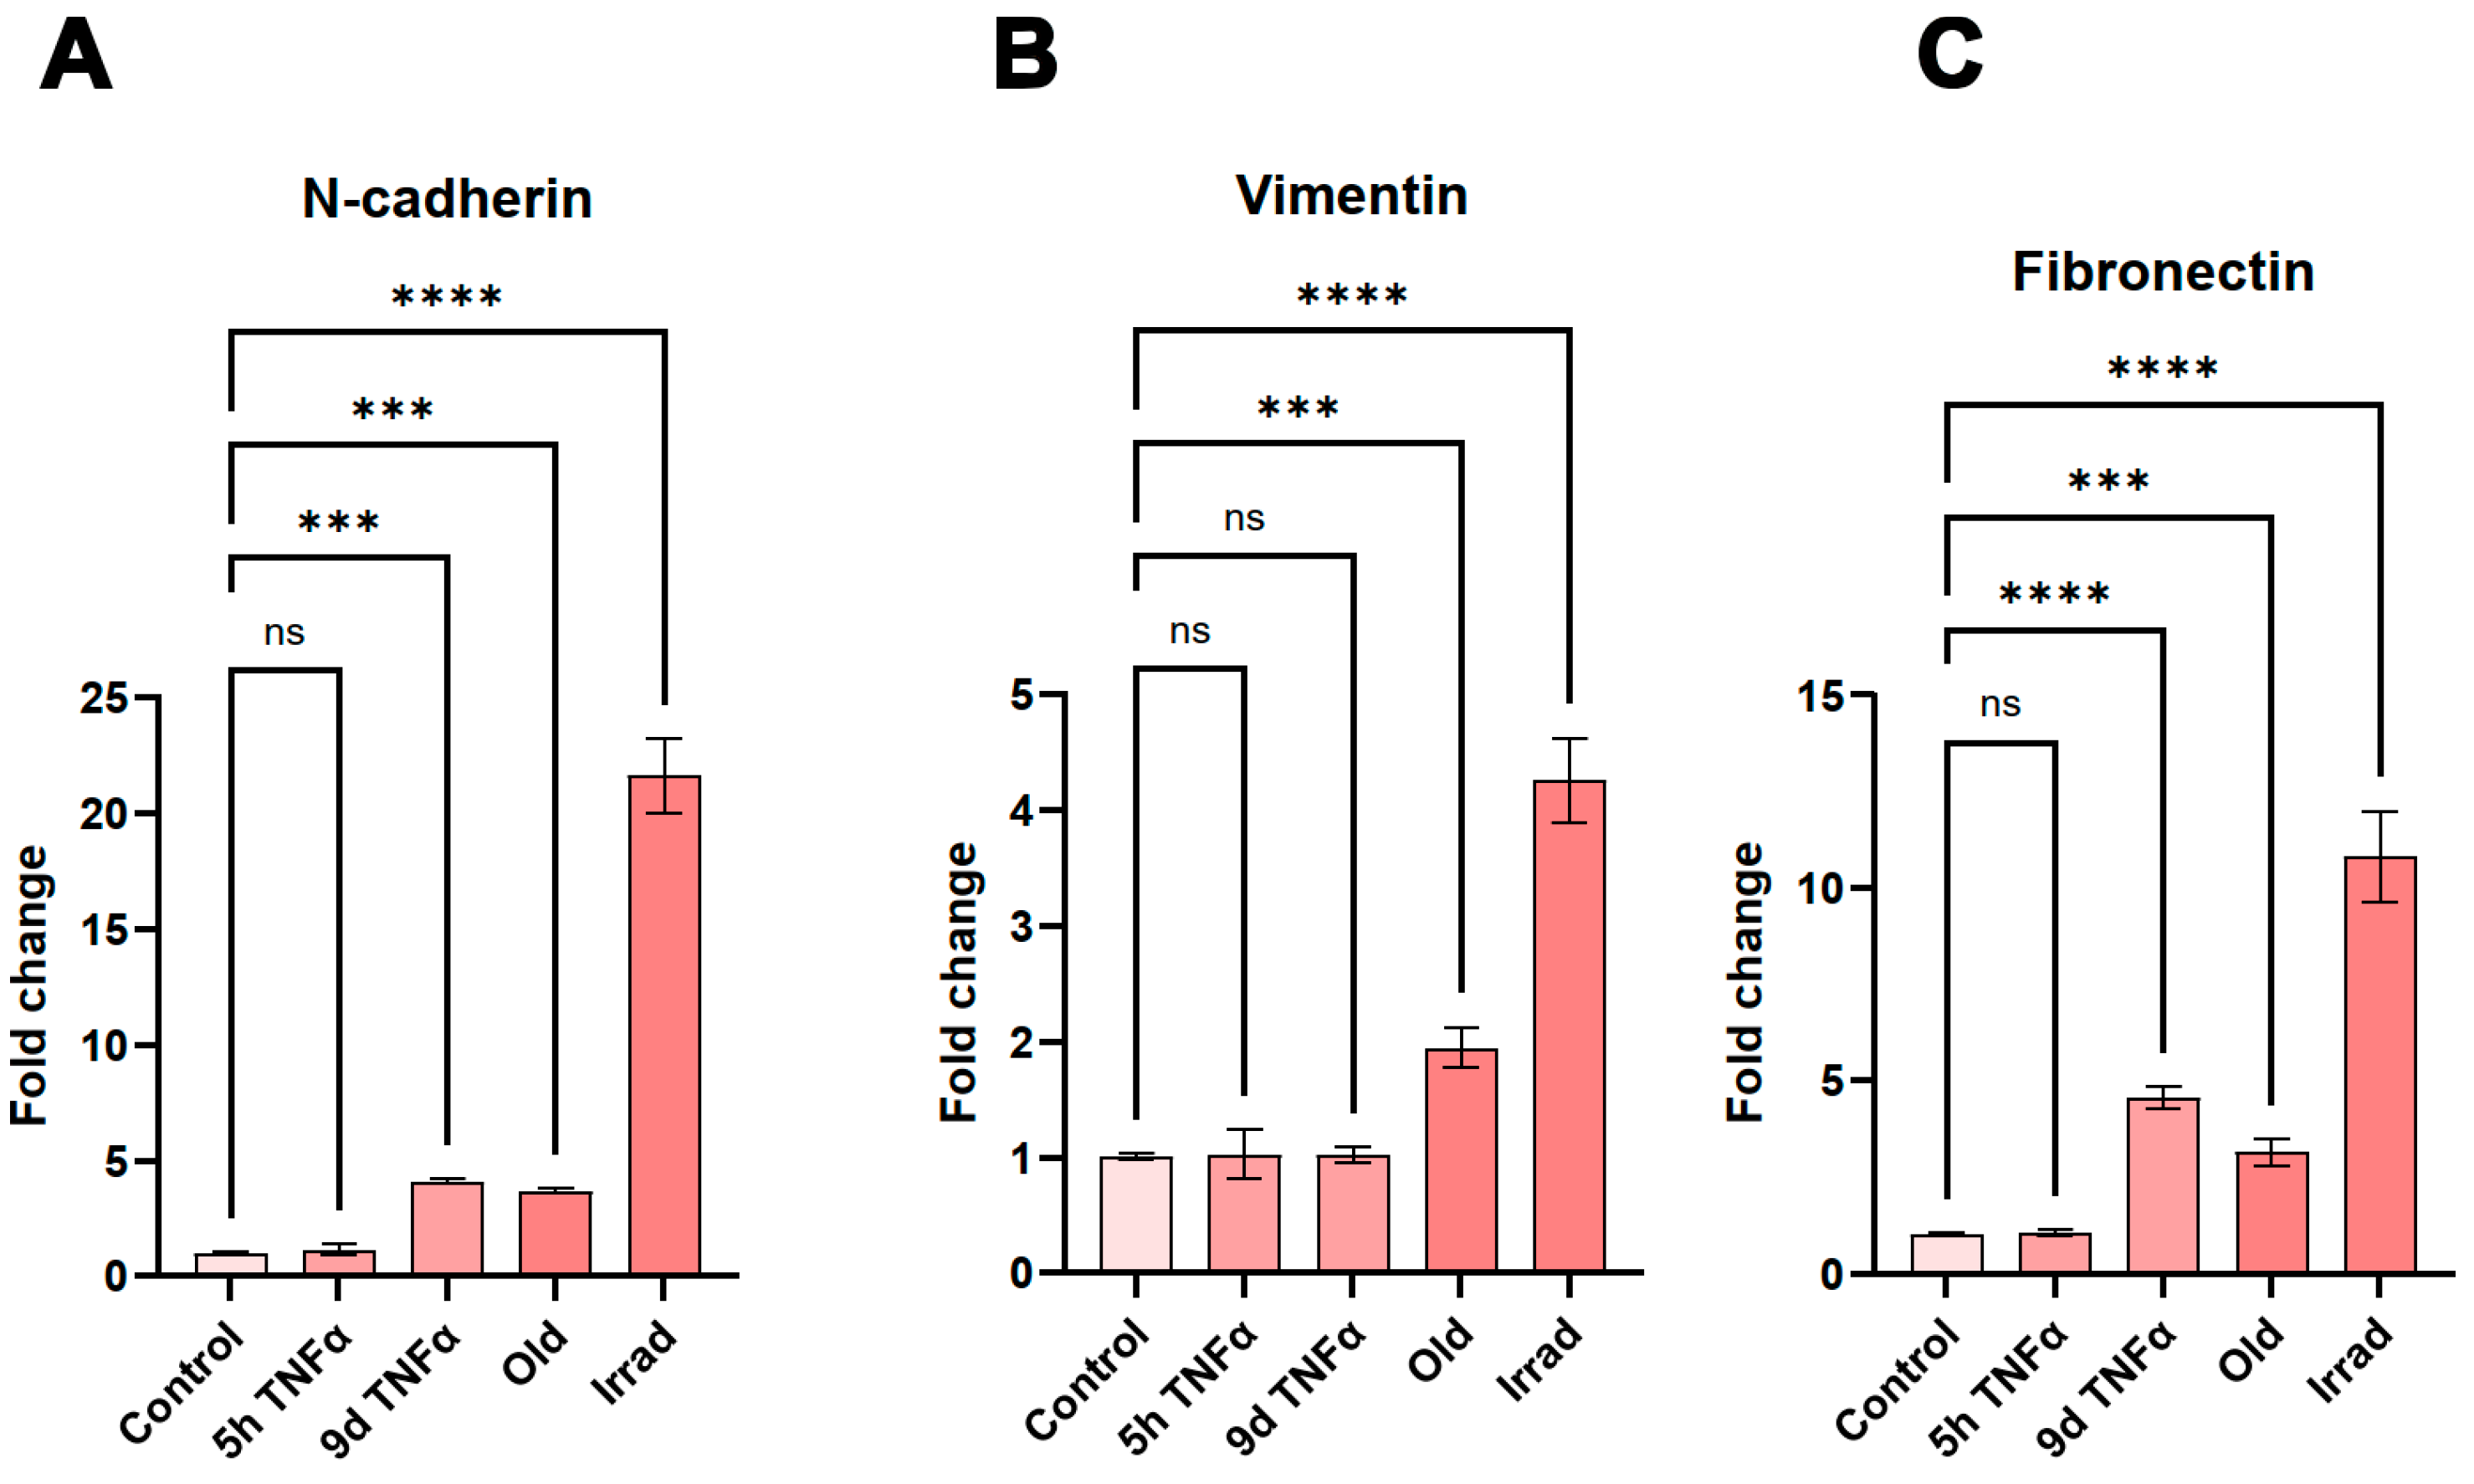
Figure 6.
Western Blot analysis of the senescence marker lamin B1. HUVECs were treated with TNFα or rendered senescent as indicated (Old: replicative senescence, Irrad; irradiation-induced senescence), followed by SDS-PAGE and immuno-blotting with antibodies against lamin B, or actin as loading control. The lamin B1 band was normalized to the actin band for quantification, as shown on the right side.
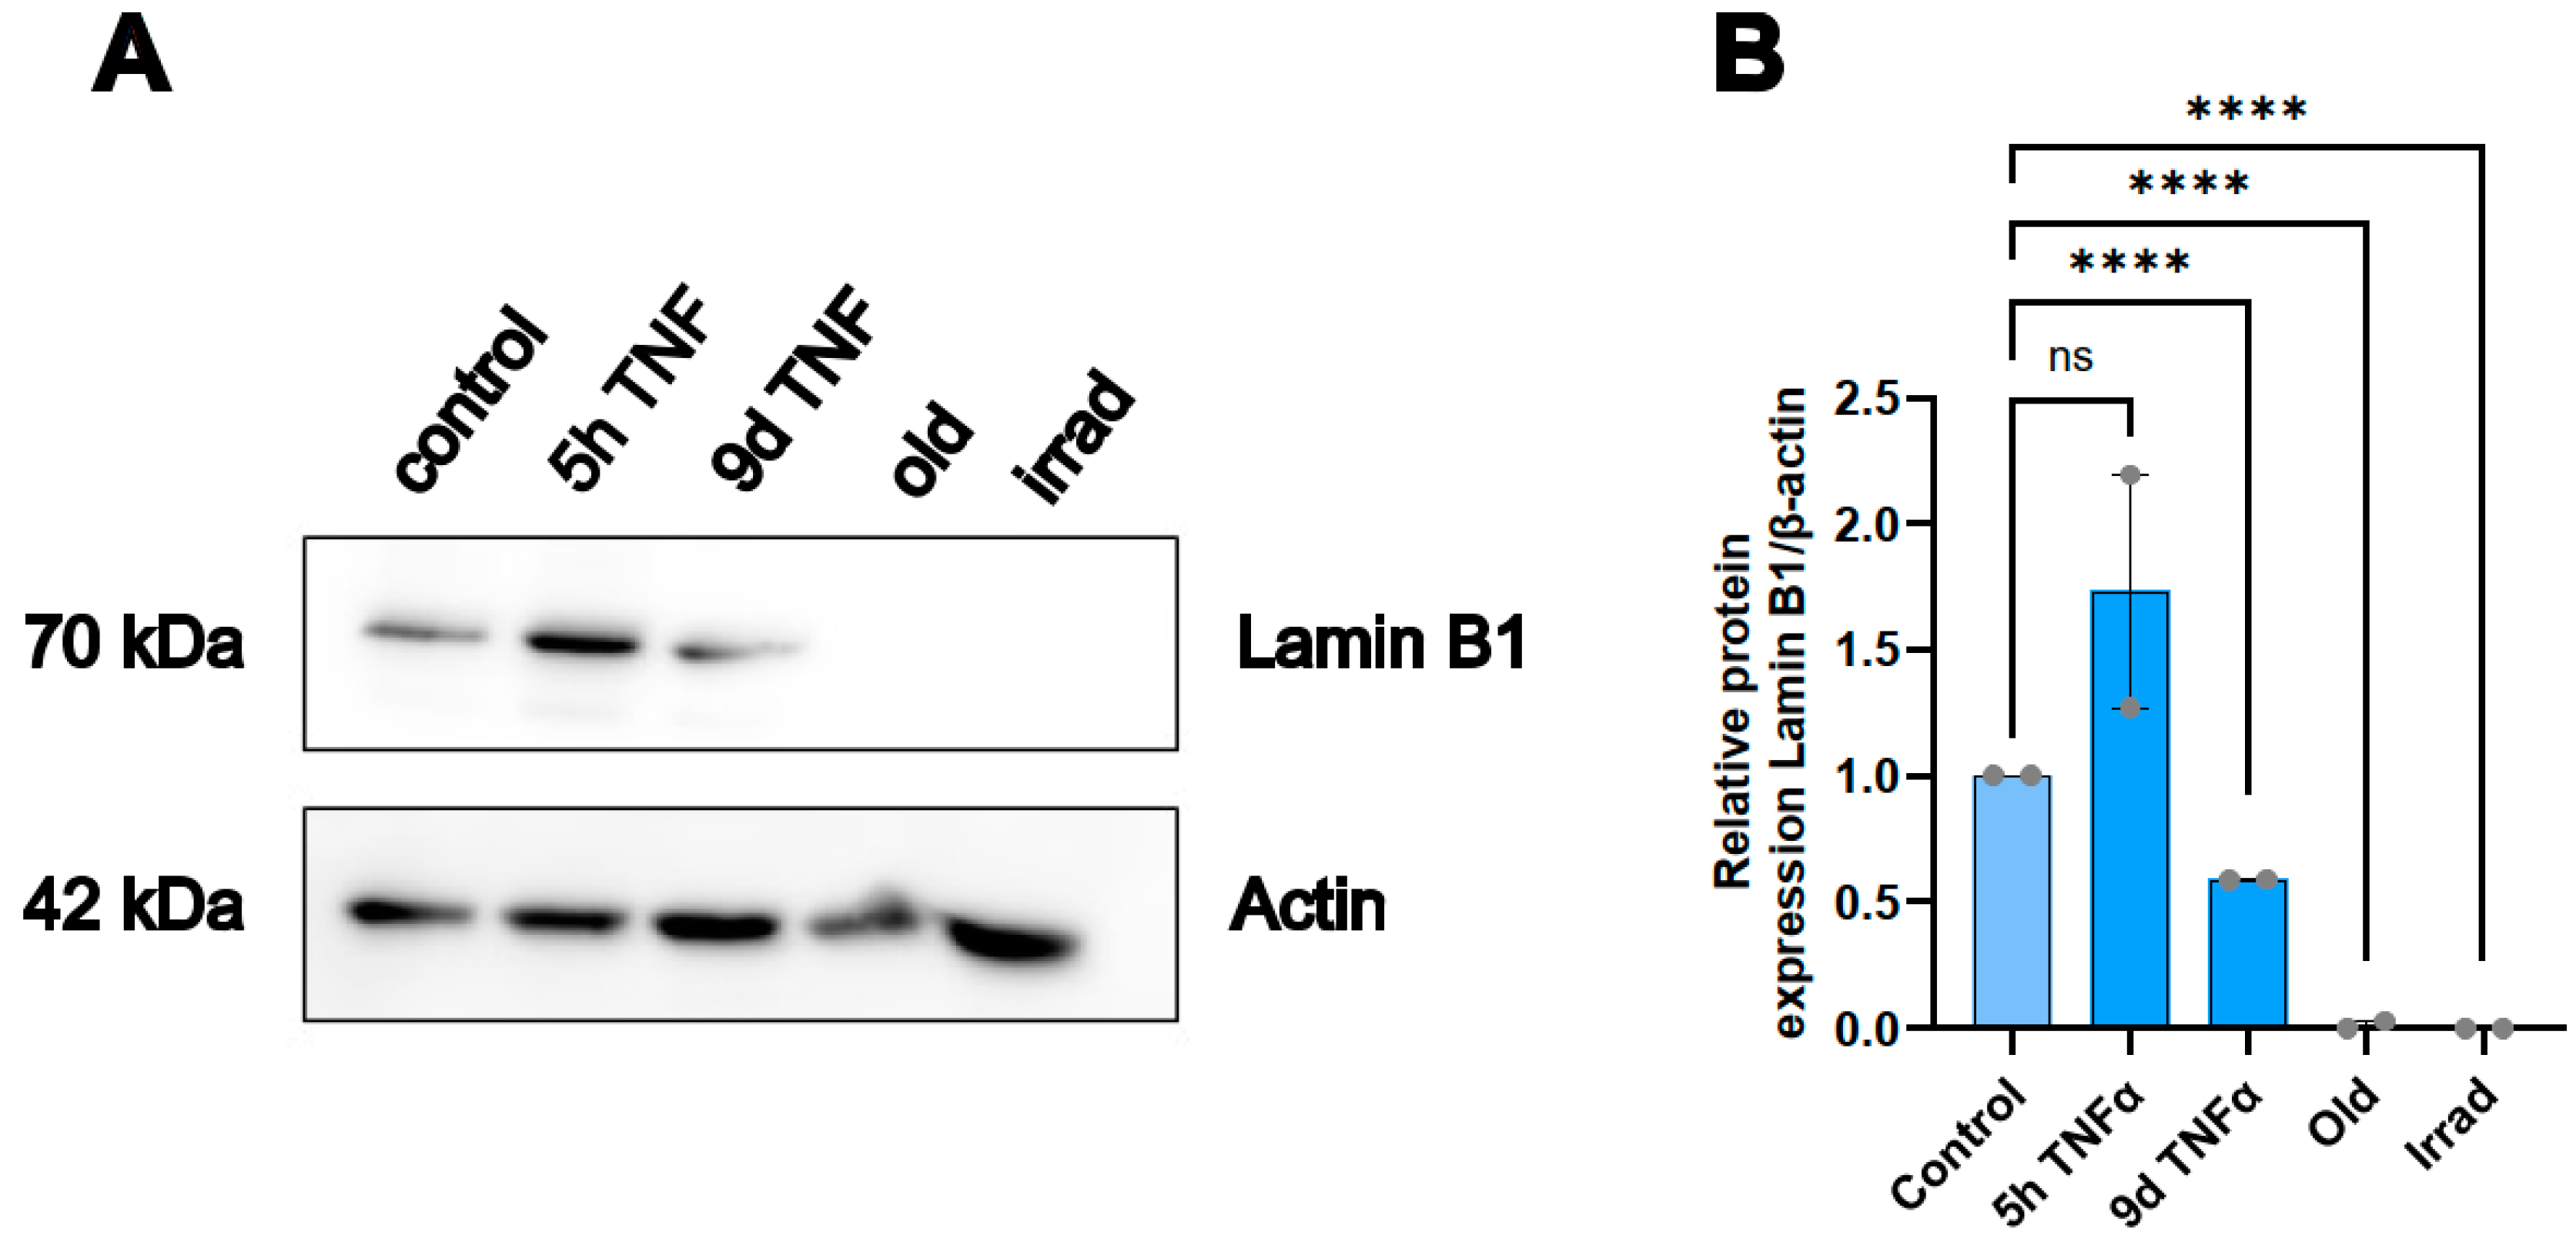
Figure 7.
Wound healing (scratch) assay using long-term observation with an Incucyte system. HUVECs were left untreated (control) or were treated with TNFα for 5h or 9d and were compared to cells in replicative senescence (Old). (A) Representative microscopy images showing automatically recorded cell front borders in red and approximate dimensions of the gaps in blue. (B) Quantification of the recorded migration rates as assessed by area closure in %/h.
Disclaimer/Publisher’s Note: The statements, opinions and data contained in all publications are solely those of the individual author(s) and contributor(s) and not of MDPI and/or the editor(s). MDPI and/or the editor(s) disclaim responsibility for any injury to people or property resulting from any ideas, methods, instructions or products referred to in the content. |
© 2025 by the authors. Licensee MDPI, Basel, Switzerland. This article is an open access article distributed under the terms and conditions of the Creative Commons Attribution (CC BY) license (http://creativecommons.org/licenses/by/4.0/).
Copyright: This open access article is published under a Creative Commons CC BY 4.0 license, which permit the free download, distribution, and reuse, provided that the author and preprint are cited in any reuse.


