1. Introduction
As the world faces the adverse impacts of climate change and elevated pollution, the need for effective action plans to mitigate these pressures has become urgent. Consequently, societal demand for reliable forest-related information has grown substantially. This demand prompted the establishment of the Collaborative Forest Resources Questionnaire (CFRQ), a global joint forest reporting mechanism, at the turn of the millennium [
1,
2]. According to the Global Forest Resources Assessment 2025 (FRA 2025) of the Food and Agriculture Organization of the United Nations (FAO), forests cover 4.14 billion hectares, approximately one-third of the planet’s land area, equivalent to about 0.5 hectares per person. There is a global, collaborative effort to support significant international commitments, including the 2030 Agenda for Sustainable Development, the Paris Agreement on Climate Change, the Kunming–Montreal Global Biodiversity Framework, and the United Nations Strategic Plan for Forests 2017–2030 [
3]. Moreover, the European Forest Strategy aims to unlock forests’ potential for the future. European Union (EU) frameworks, such as the European Green Deal and the EU Biodiversity Strategy for 2030 (European Commission 2020), recognize the central and multifunctional role of forests and their contribution to achieving the EU’s greenhouse gas emission reduction target of at least 55% by 2030, as well as climate neutrality by 2050, as established under the European Climate Law. In this context, numerous studies worldwide focus on forest stands, examining their ecological [
4,
5,
6,
7], silvicultural [
8,
9,
10], and socio-economic characteristics [
11,
12,
13,
14,
15,
16].
Romania’s forests, known for their rich biodiversity and ecological significance, face unprecedented challenges due to climate change. In their study, Stamin, F.D., and Cosmulescu, S., 2025 [
17], proved that species such as beech (
Fagus sylvatica), spruce (
Picea abies), oak (
Quercus spp.), and fir (
Abies alba) are particularly vulnerable to these changes, while Chivulescu, S. et al., 2025, concluded that sessile oak (
Quercus petraea) and hornbeam (
Carpinus betulus) face greater challenges due to changing aridity patterns [
18].
Rapid urbanization is impacting Romanian forests located near major urban centers [
19,
20]. At the local scale, several studies have focused on periurban forests in Romania, but few of them have analyzed the structural diversity of these ecosystems, their species composition, succession, and resilience [
21,
22,
23]. In other studies, information on biodiversity and forest structure was used to model the recreational functions of forests [
24,
25]. A recent article presents information on the structure, diversity, and health status of one of the main periurban forests in Bucharest [
26]. It emphasizes its importance in providing specific ecosystem services to the urban agglomeration.
Urban forests, as representations of nature within city landscapes, provide both economic and social benefits while simultaneously maintaining ecological health through climate regulation, improved air quality, and habitat provision for biodiversity. Recent reports and studies highlight urban trees as vital tools for mitigating heat, underscoring their importance in building resilient, livable cities [
27,
28]. At the same time, the presence of old trees in urban areas depends strongly on tree management, as their persistence requires long-term protection and care, which is constrained by the availability of financial resources.
In Romania, significant spatial transformations in land use, including changes in forest cover, exert high pressure on natural ecosystems [
29,
30]. A substantial discrepancy exists between civil society’s expectations for forest policies and the outcomes delivered by current forest management practices. This discrepancy is also reflected in the noteworthy evolution of Green Forest, whose first recorded forest management plan dates back to 1860. Initially owned by the town of Timișoara, it was later designated as a state forest, and today it once again falls under municipal ownership. Written historical documents indicate that, during Turkish domination, up to 1711, a hunting forest already existed in this area. In one of the oldest available cartographic sources, Griselini’s map from 1776, old-growth woods are depicted in the Green Forest area, extending beyond the present-day boundary of Dumbrăviţa village. Moreover, an early 19th-century map depicts a large hunting forest in the Green Forest region and indicates that the current site of the Forestry School Group was once a hunting lodge [
31].
Nowadays, in the context of a rapidly growing metropolitan area, it is pivotal to implement the policies outlined in the 2023 Action Plan for Timișoara, a Green City. The incorporation of Green Forest into Timișoara’s green infrastructure as a forest park reflects a strategic shift in urban planning—one that prioritizes sustainability, climate change adaptation, and the enhancement of urban quality of life, as emphasized in the 2023 General Urban Plan (PUG). Although the forest already existed and its ecological role remained unchanged, the transfer of 5,198,412 square meters of woodland into the Municipality of Timișoara’s public domain increases the officially recorded green space per capita. It enables improved management, protection, and integration of this area into the city’s ecological planning and landscape architecture strategies.
This research investigates the tree diversity of Green Forest and its contribution to the landscape architecture of Timișoara, with the forest stand serving as the study area.
The specific aims of the research are: (i) to explore the diversity of tree species in the Green Forest, highlighting their role in enhancing urban landscapes; and (ii) to promote the forest’s ecological and recreational functions through proposed interventions, including the development of an ecological education zone, a passive/transit recreation area, and an active recreation zone within the Green Forest.
The positive relationship between species richness and area is a fundamental principle of ecology, suggesting that larger habitats tend to support more species. Although this principle underpins the ecological significance of incorporating a large area such as Green Forest into the urban landscape, our ability to fully capture this effect is constrained by the scope of the present study. Because biodiversity was evaluated solely through tree species composition, excluding shrubs, herbaceous plants, fungi, and faunal communities, the observed increase in species richness likely represents only a fraction of the diversity expected under the species–area relationship. Consequently, the true magnitude of biodiversity enhancement associated with the expanded urban green area is presumably higher than our results indicate. A more comprehensive assessment that integrates multiple taxonomic groups and functional traits would be necessary to fully quantify the ecological value and conservation potential of Green Forest.
Our findings contribute to knowledge on how the interspecific diversity and intraspecific variability of the tree individuals forming the Green Forest enrich Timișoara’s biodiversity, while also highlighting their role in embellishing the urban landscape. Our proposal to maximize the ecological and recreational functions of the Green Forest will enhance the value of the ecosystem services it provides to Timișoara. If implemented, these developments will encourage public engagement with nature, promote mental and physical well-being within the community, and serve as a response tool for the 2023 Action Plan for Timișoara – a Green City. Our results provide insights and transferable knowledge for improving urban landscapes and biodiversity management, and they may prove useful in similar contexts worldwide.
2. Results
2.1. Tree Species Identified in Different Plots of Green Forest
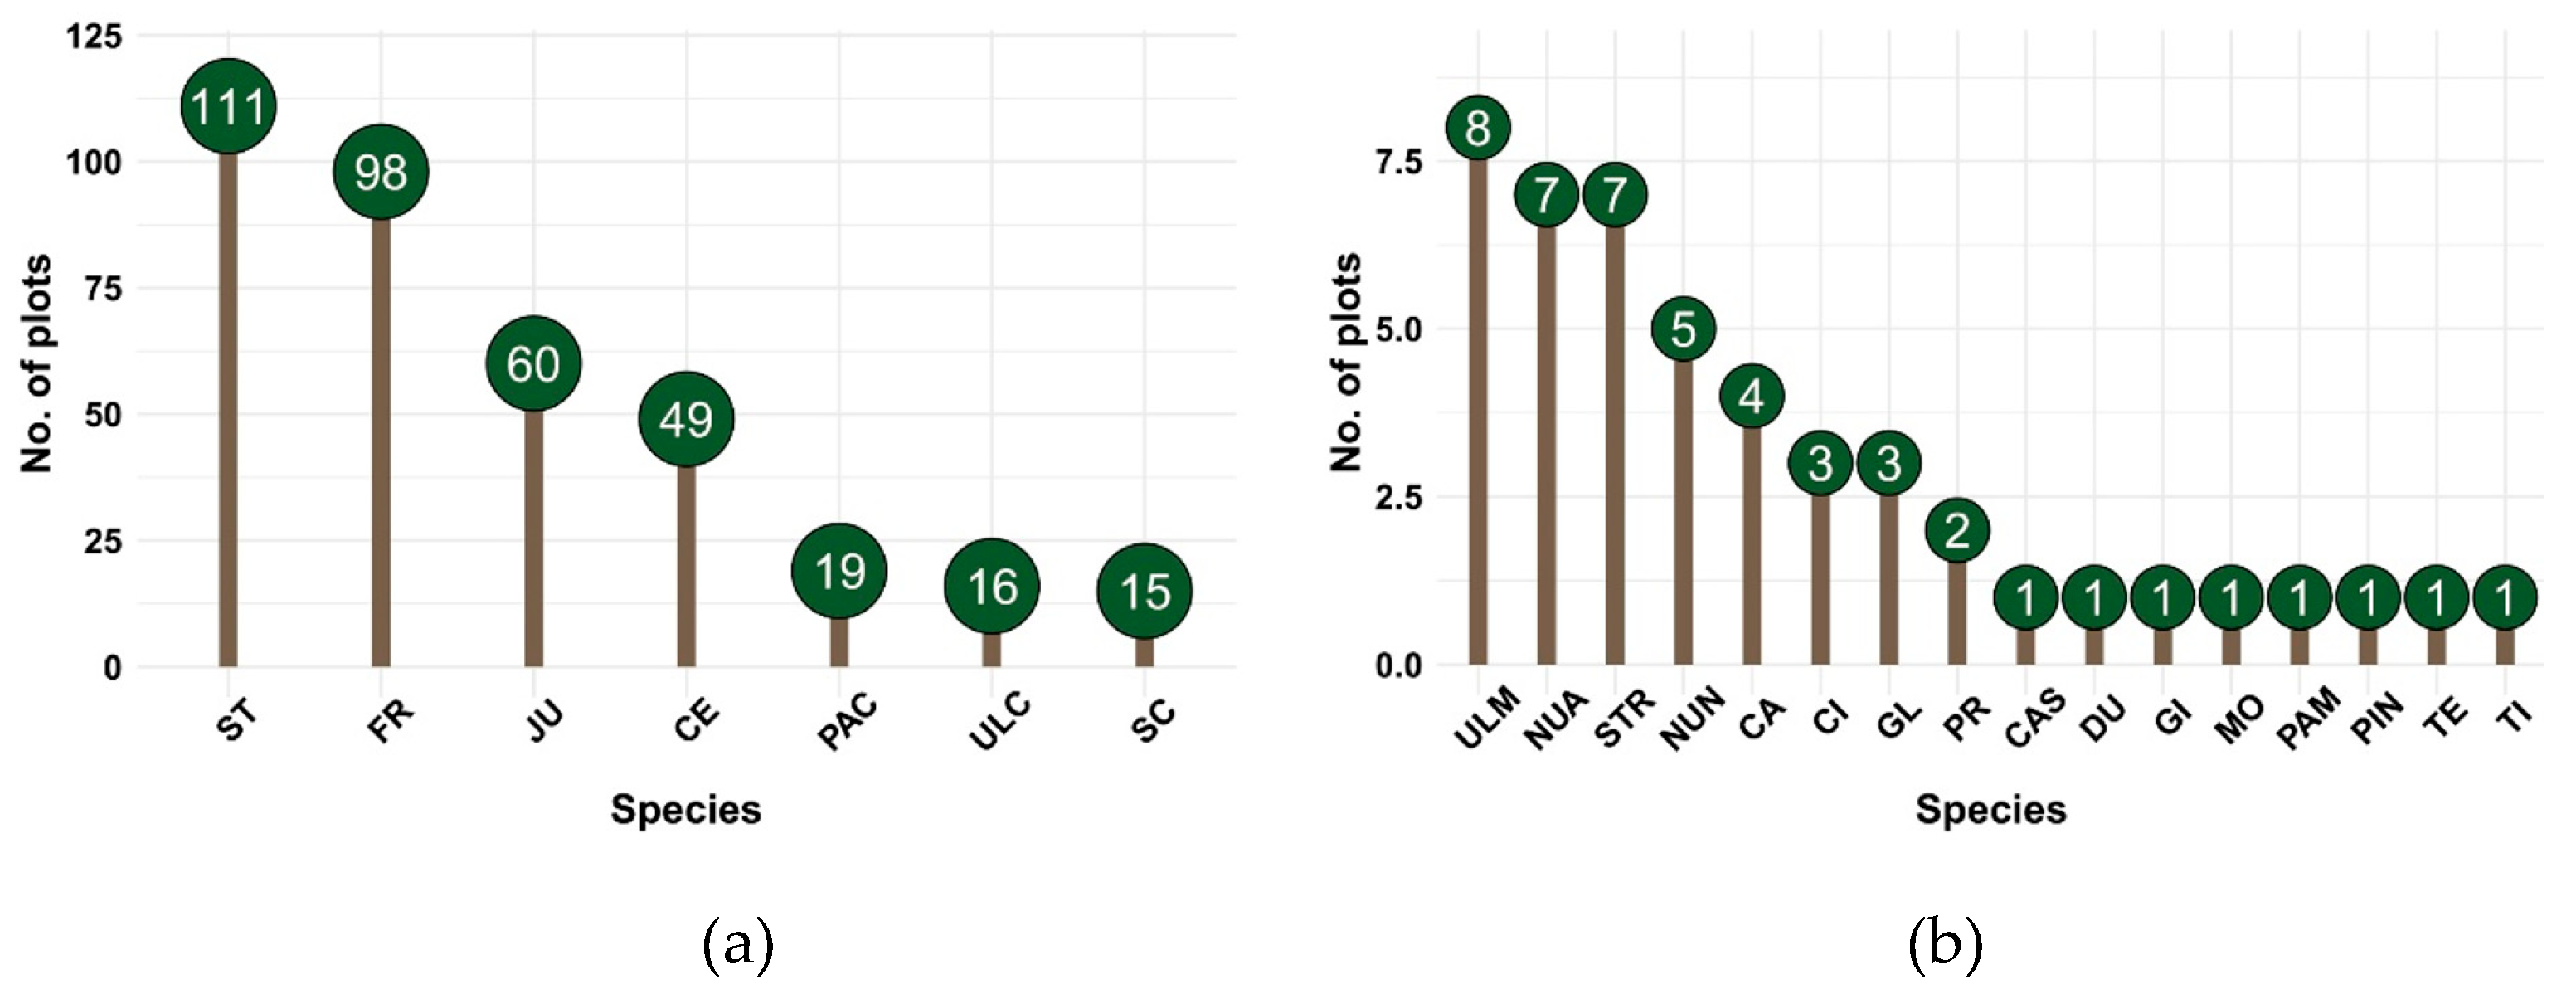
The Green Forest is primarily composed of 24 tree species popuations, grouped into 16 genera, as follows: Quercus - pedunculate oak (Quercus robur L.) - ST; red oak (Quercus rubra) - STR; Turkey oak (Quercus cerris) - CE; Hungarian oak (Quercus frainetto) - GI, Fraxinus - common ash (Fraxinus excelsior) - FR, Acer - field maple (Acer campestre) - JU; Norway maple (Acer platanoides) - PAC; sycamore maple (Acer pseudoplatanus) - PAM, Ulmus - European field elm (Ulmus campestris) - ULC; wych elm (Ulmus glabra) - ULM, Robinia - black locust (Robinia pseudoacacia) - SC, Juglans - white walnut (Juglans cinerea) - NUA, - black walnut (Juglans nigra) - NUN; Prunus - wild cherry (Prunus avium) – CI, Carpinus - hornbeam (Carpinus betulus) - CA, Gleditsia - honey locust (Gleditsia triacanthos) - GL, Pyrus - European wild pear (Pyrus pyraster) - PR, Tilia - silver linden (Tilia argentea) - TE, Castanea - sweet chestnut (Castanea sativa) - CAS, Picea - Norway spruce (Picea abies) – MO, Taxus - English yew (Taxus baccata) - TI, Pinus - black pine (Pinus nigra) - PIN; Scots pine (Pinus sylvestris) - PI, Pseudotsuga - Douglas fir (Pseudotsuga menziesii) – DU.
Tree species populations occurring in the highest number of plots are associated with the following genera: Quercus, with ST recorded in 111 plots, CE in 49 plots, STR in 7 plots, and GI in one plot; Fraxinus with FR present in 98 plots; Acer with JU in 60 plots, PAC in 19 plots, and PAM in one plot, Ulmus, with ULC in 16 plots and ULM in 8 plots, and Robinia with SC in 15 plots. Conversely, trees from the genera Taxus, Tilia, Picea, Castanea, and Pseudotsuga were identified in only one plot, as shown in
Figure 1.
These species together create a unique ecosystem within the urban environment, enhancing it with a dynamic diversity of shapes and colors throughout the year.
2.2. Descriptive Statistics of Each Tree Species Identified—Green Forest Tree Diversity
Even in plots where trees are of the same species and age, they do not exhibit uniform development. This variation is influenced by genetic heredity and a heterogeneous environment, including microsite conditions that offer slightly better or worse living conditions within the same habitat. As a result, tree height, diameter, volume, and basal area vary among individuals. Consequently, each plot develops its own dimensional structure, a specific distribution of trees by height and diameter classes, and correspondingly, by volume or basal area [
32]. This structural variability creates diversity within unity, contributing to the uniqueness of forest landscapes. A descriptive analysis was conducted on the variables mean age (A), mean trunk diameter at breast height (DBH), mean tree height (H), and mean consistency of stand densities (C) to assess central tendency, variability, and distributional shape. By assessing stand structure, this analysis offers insights into the physical characteristics of tree species populations within the Green Forest. The forest canopy is an important indicator used to measure stand density, with canopy cover typically associated with forest planning and inventories, while canopy closure is more commonly applied in ecologically oriented forest research [
33]. The consistency or density of a forest stand strongly influences light-and-shadow dynamics by determining the amount of light penetrating the canopy, the spatial pattern of shadows, and the contrast and texture of light on the lower strata of the forest [
34].
Higher density tends to reduce light transmission and increase shading, while lower density or gaps allow more light to penetrate and create more varied light-and-shadow contrasts. These characteristics are purposefully used in landscape architecture to create diverse visual perspectives and to either conceal or highlight specific compositional focal points.
2.2.1. Quercus Genus Tree Population Descriptive Statistics
Quercus genus tree population identified in Green Forest is represented by the following tree species: Pedunculate oak (Quercus robur L.) - ST; Red oak (Quercus rubra) - STR; Turkey oak (Quercus cerris) - CE; Hungarian oak (Quercus frainetto) – GI.
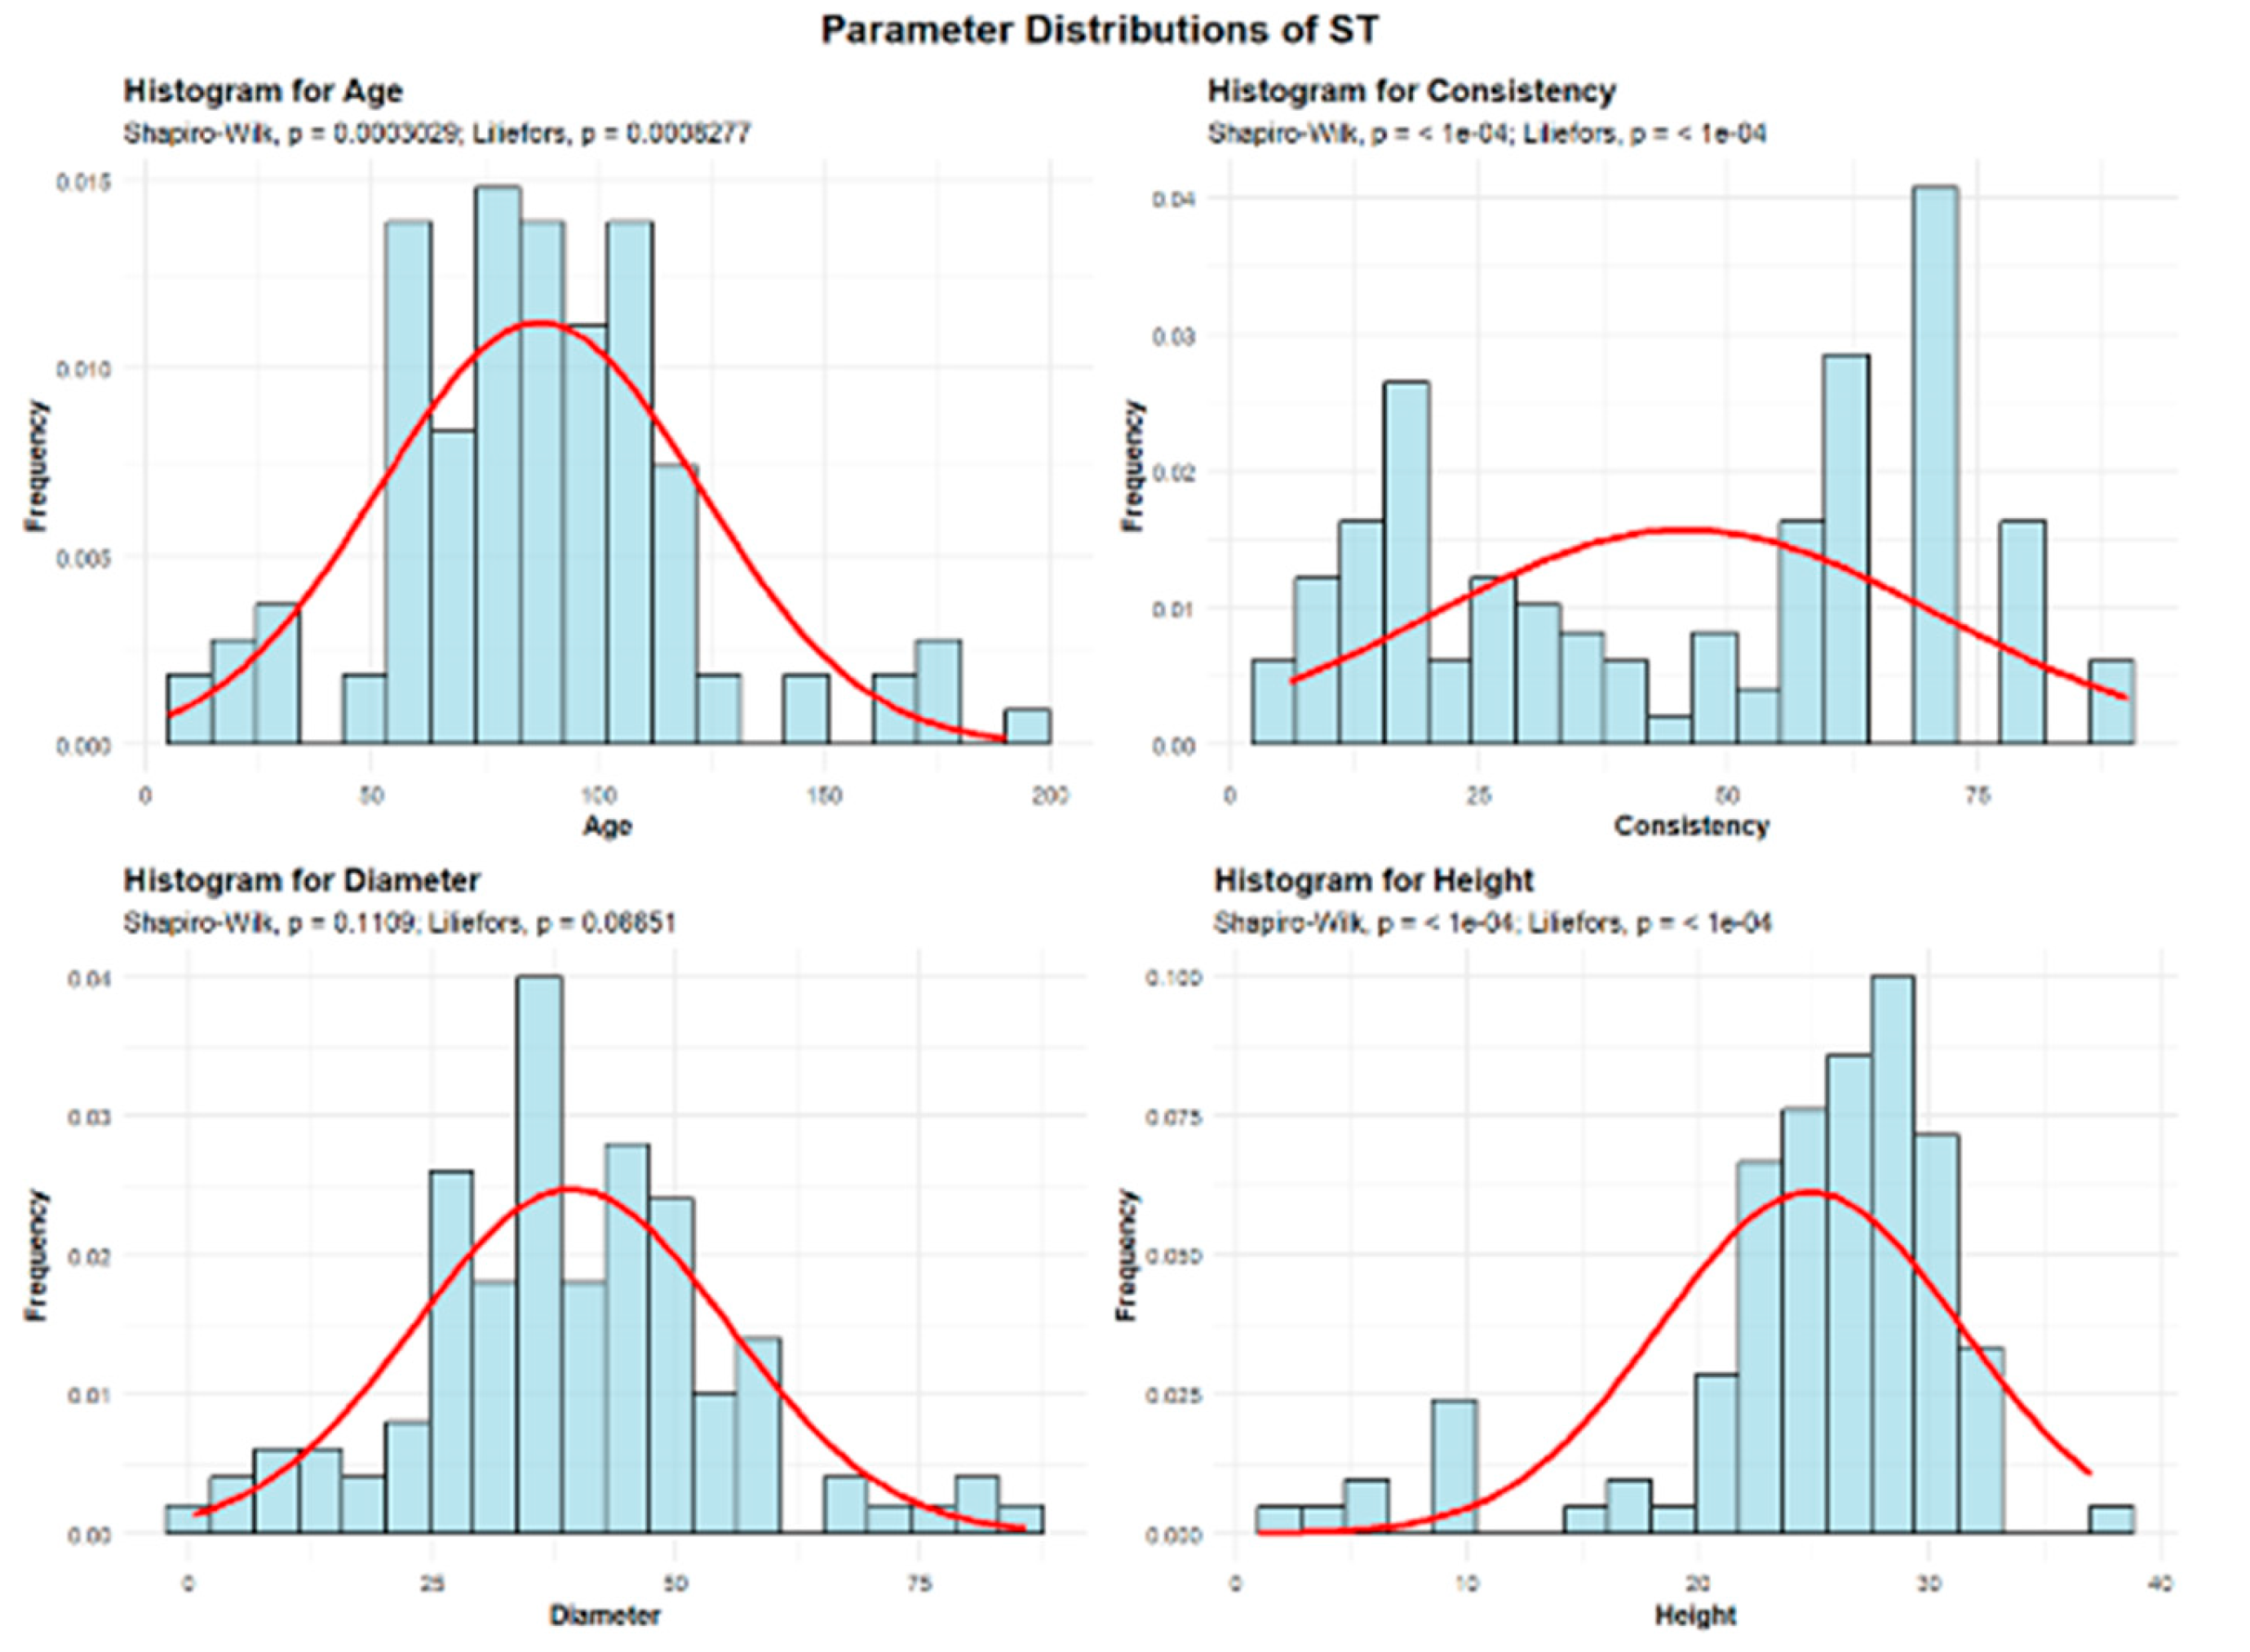
2.2.1.1. Pedunculate Oak (Quercus robur L.)—ST
Descriptive analyses were conducted for the variables age, consistency, diameter, and height to summarize their central tendency, variability, and distributional characteristics within the sample, as shown in
Figure 2.
The mean age of the ST is 87 years. The standard deviation of the age of the ST trees in the studied plots is 35.5 years. A total of 9 plots (8.11%) contain ST with an average age of up to 30 years. Another 17 plots (15.32%) have ST with an average age between 30 and 60 years. The largest group includes 40 plots (36.04%), where the average ST age is between 60 and 90 years. In addition, 35 plots (31.53%) have ST with an average age between 90 and 120 years. Beyond these dominant classes, we also observed 4 plots with average ST ages ranging from 120 to 150 years, 5 plots with average ST ages ranging from 150 to 180 years, and 1 plot with trees older than 180 years. Together, these oldest age classes represent less than 10% of the total.
The mean consistency (ST) of stand-density values is 45.69, with a standard deviation of 25.33. Among all plots, 45 plots (40.54%) show degraded ST consistency, 35 plots (31.53%) show discontinuous consistency, and 31 plots (27.93%) exhibit nearly full consistency.
ST exhibit an average trunk diameter of 39.27 cm with a standard deviation of 16.10 cm. This means that while the average diameter is 39.27 cm, tree mean diameters can vary significantly, ranging from as small as 0.5 cm in plots where there is seedling regeneration, to as large as 86 cm in plots with mature, old-growth trees.
In 34 plots (30.63% of the total), the average tree mean diameter of the ST is up to 30 cm. In 70 plots (63.06%), the average diameter falls between 30 and 60 cm. Only 7 plots (6.31%) recorded average ST diameters between 60 and 90 cm.
The average height of the ST is 24.83 m, with a standard deviation of 6.51 m. This suggests that ST trees are generally tall, though their heights show considerable variation—from the shortest individuals found in seedling-regeneration plots to the tallest, reaching 37 m in plots containing mature trees. In 100 plots (90.09% of the total), the average height is below 30 m, while only 11 plots (9.91%) recorded average ST heights above 30 m.
2.2.1.2. Red Oak (Quercus rubra)—STR
Descriptive analyses were conducted for the variables age, consistency, diameter, and height to summarize their central tendency, variability, and distributional characteristics within the sample as shown in
Figure 3.
The mean age of the STR is 43.57 years. The standard deviation of STR age across the studied plots is 20.75 years, indicating moderate age-structure variability. Of the sampled plots, 3 plots (42.86%) contain STR with an average age up to 30 years, while 4 plots (57.14%) have STR with an average age between 30 and 60 years.
The mean STR consistency of stand-density values is 10.42, with a standard deviation of 7.89. All 7 plots exhibit degraded STR consistency, indicating uniformly low values across the dataset.
The STR exhibits an average trunk diameter of 20 cm, with a standard deviation of 8.87 cm. Across all 7 plots, the average tree mean diameter of the STR falls within the range of 10 to 40 cm.
The average height of the STR is 17 m, with a standard deviation of 7 m. Across the studied plots, the minimum average height recorded is 8 m, while the maximum reaches 25 m.
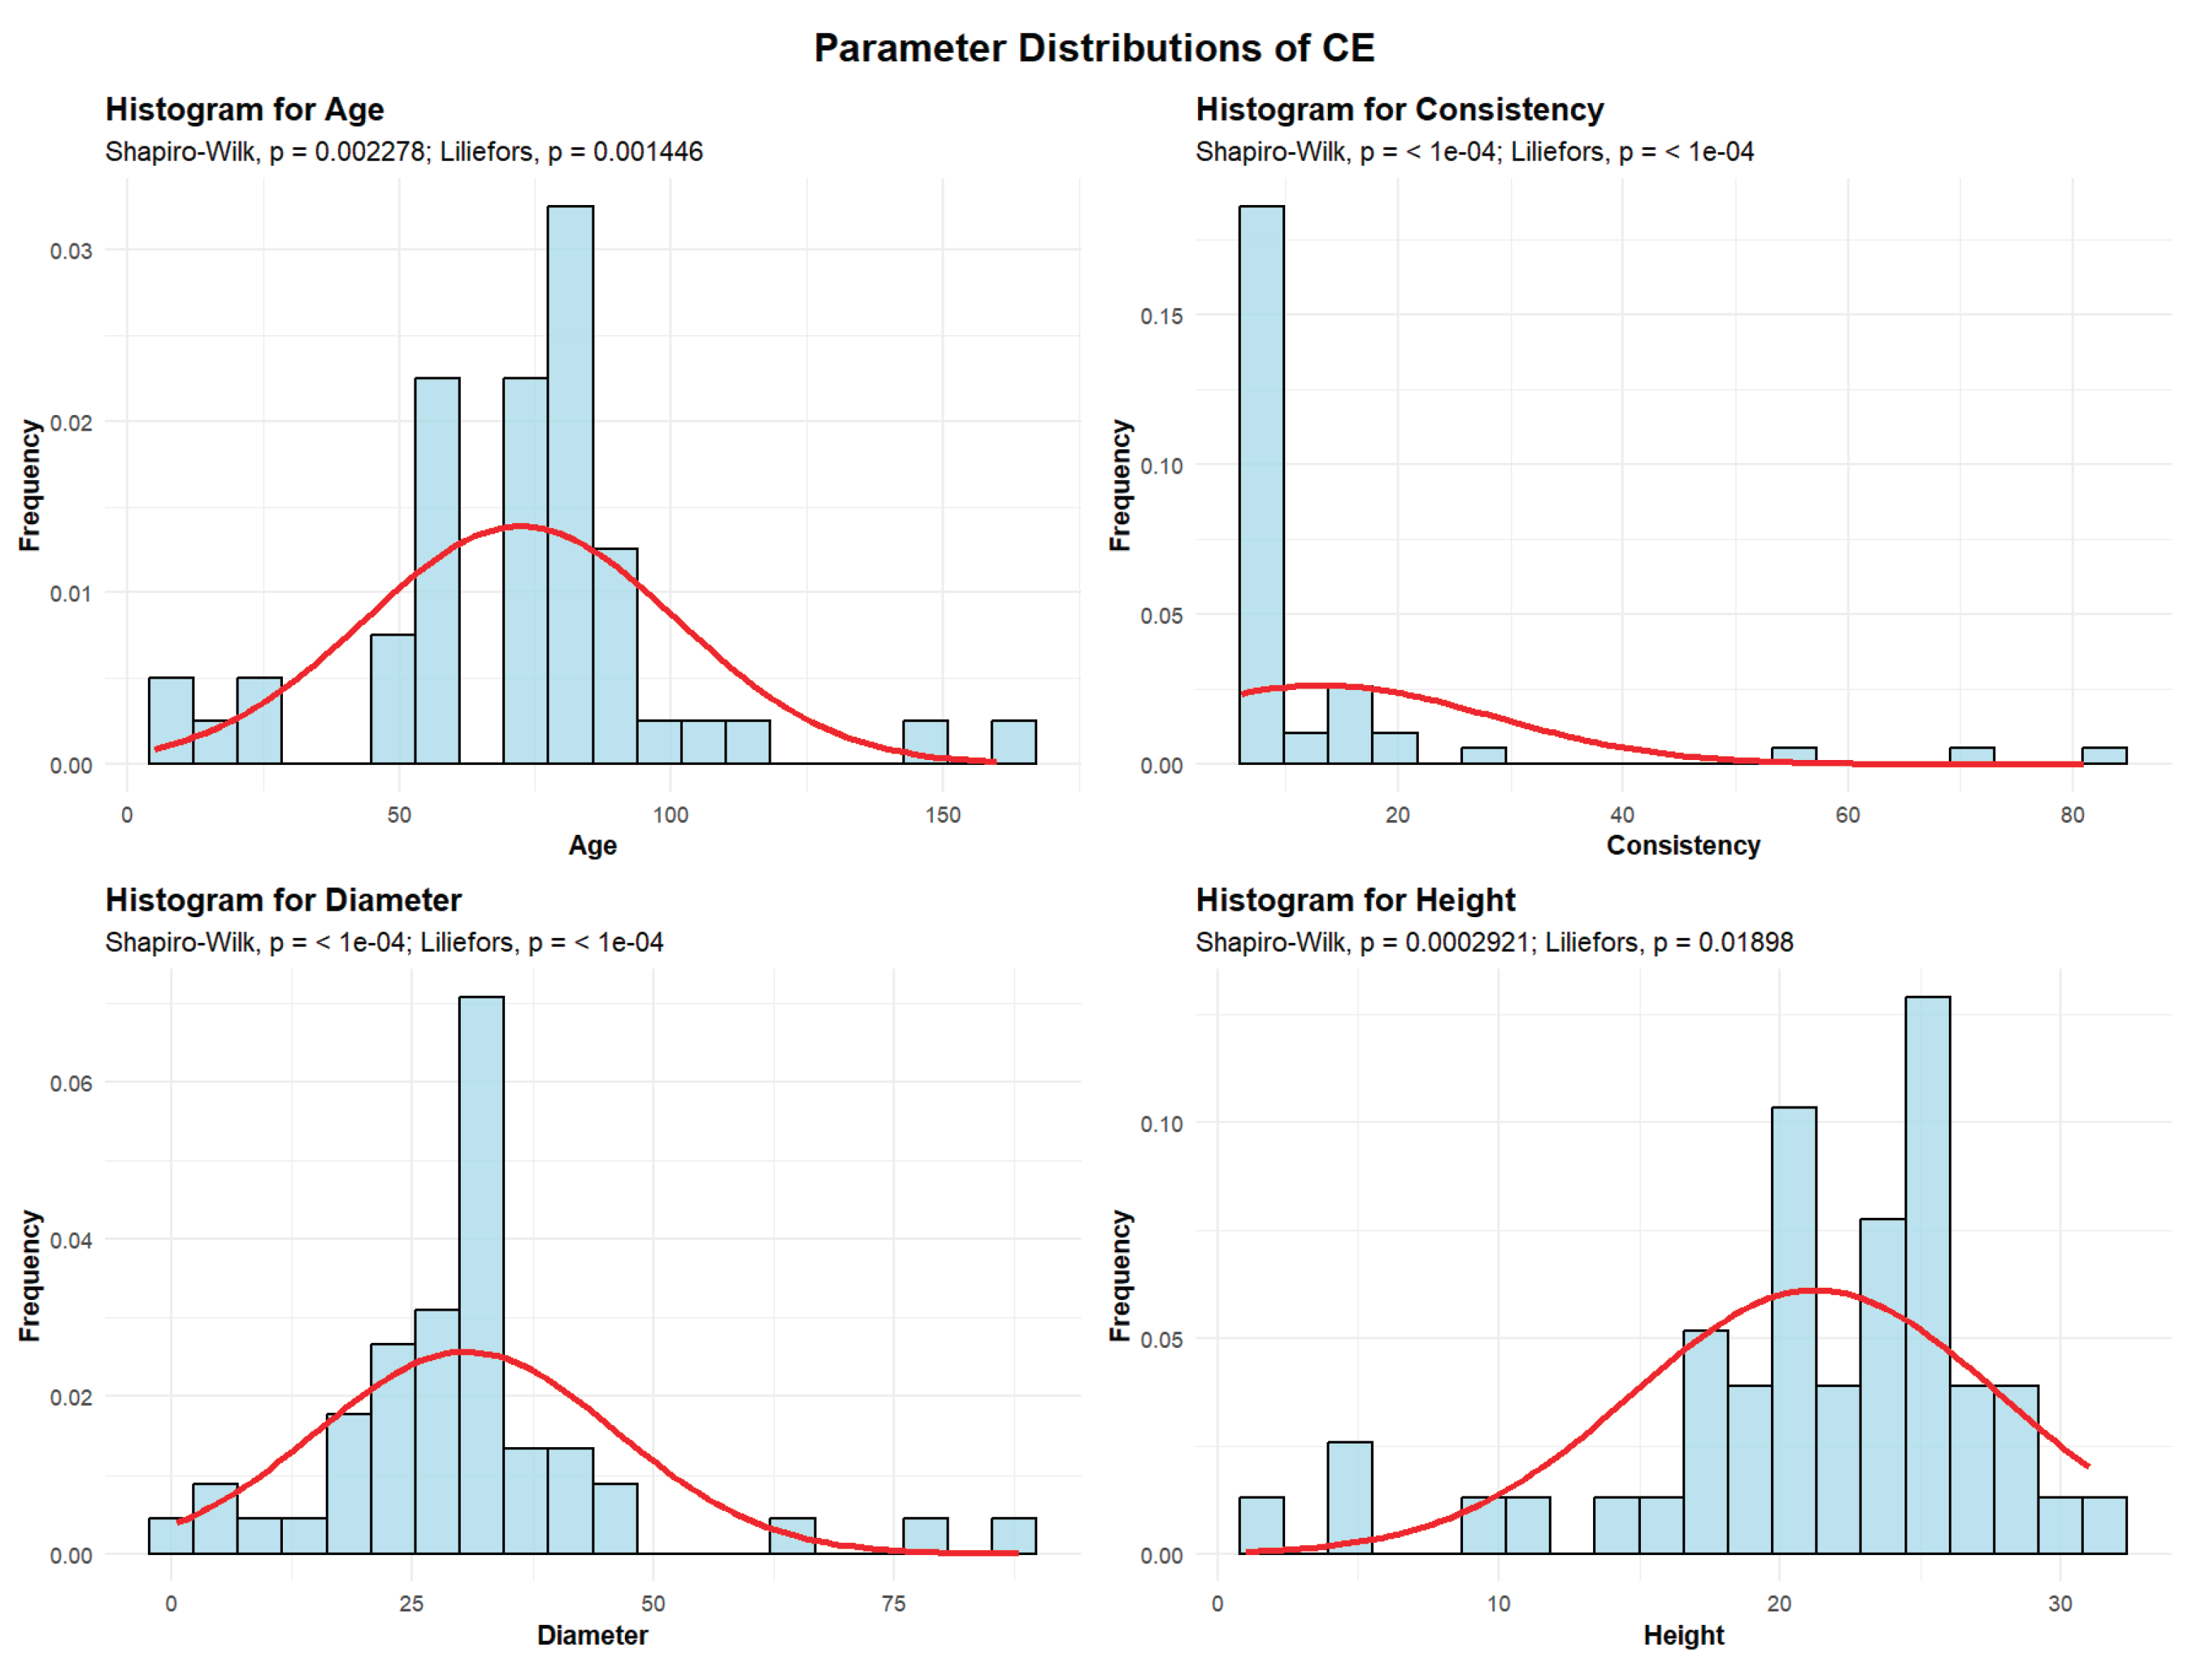
2.2.1.3. Turkey Oak (Quercus cerris)—CE
Descriptive analyses were conducted for the variables age, consistency, diameter, and height to summarize their central tendency, variability, and distributional characteristics within the sample as shown in
Figure 4.
The mean age of the CE is 72 years. The standard deviation of the age of the ST trees in the studied plots is 28.74 years.
A total of 5 plots (10.2%) contain CE with an average age of up to 30 years. Another 12 plots (24.49%) have CE with an average age between 30 and 60 years. The largest group comprises 27 plots (55.1%), with average CE age ranging from 60 to 90 years. Beyond these dominant classes, we identified 3 plots with average CE ages between 90 and 120 years, 1 plot with ages from 120 to 150 years, and 1 plot containing trees older than 150 years. Together, these oldest age categories represent 5% of the total.
The mean CE consistency of stand-density values is 13.20, with a standard deviation of 15.18. Most plots, 46 plots (93.88%), exhibit degraded CE consistency, while 1 plot (2.04%) shows discontinuous consistency, and 2 plots (4.08%) display nearly full consistency.
CE exhibit an average trunk diameter of 30.60 cm with a standard deviation of 15.52 cm. This means that while the average diameter is 30.60 cm, tree mean diameters can vary significantly, ranging from as small as 0.5 cm in plots where there is seedling regeneration, to as large as 88 cm in plots with mature, old-growth trees. In 26 plots (53.06% of the total), the average tree mean diameter of the CE is up to 30 cm. In 20 plots (40.82%), the average diameter ranges between 30 and 60 cm. Only 3 plots (6.12%) recorded average CE diameters between 60 and 90 cm.
The average height of the CE is 21.27 m, with a standard deviation of 6.51 m. This indicates that CE trees are generally tall, though their heights vary considerably, from the shortest individuals in seedling regeneration plots to the tallest, which reach 31 m in plots with mature trees. In 48 plots (97.96% of the total), the average height is below 30 m, while only 1 plot (2.04%) recorded average CE heights above 30 m.
2.2.1.4. Hungarian Oak (Quercus frainetto)—GI
A population of Quercus frainetto - GI was identified in only one plot within the Green Forest stand. Its characteristics are as follows: the mean age is 80 years, the mean diameter is 28 cm, the mean height is 20 m, and the mean consistency value is 7, indicating a degraded canopy.
2.2.2. Fraxinus Genus Tree Population Descriptive Statistics
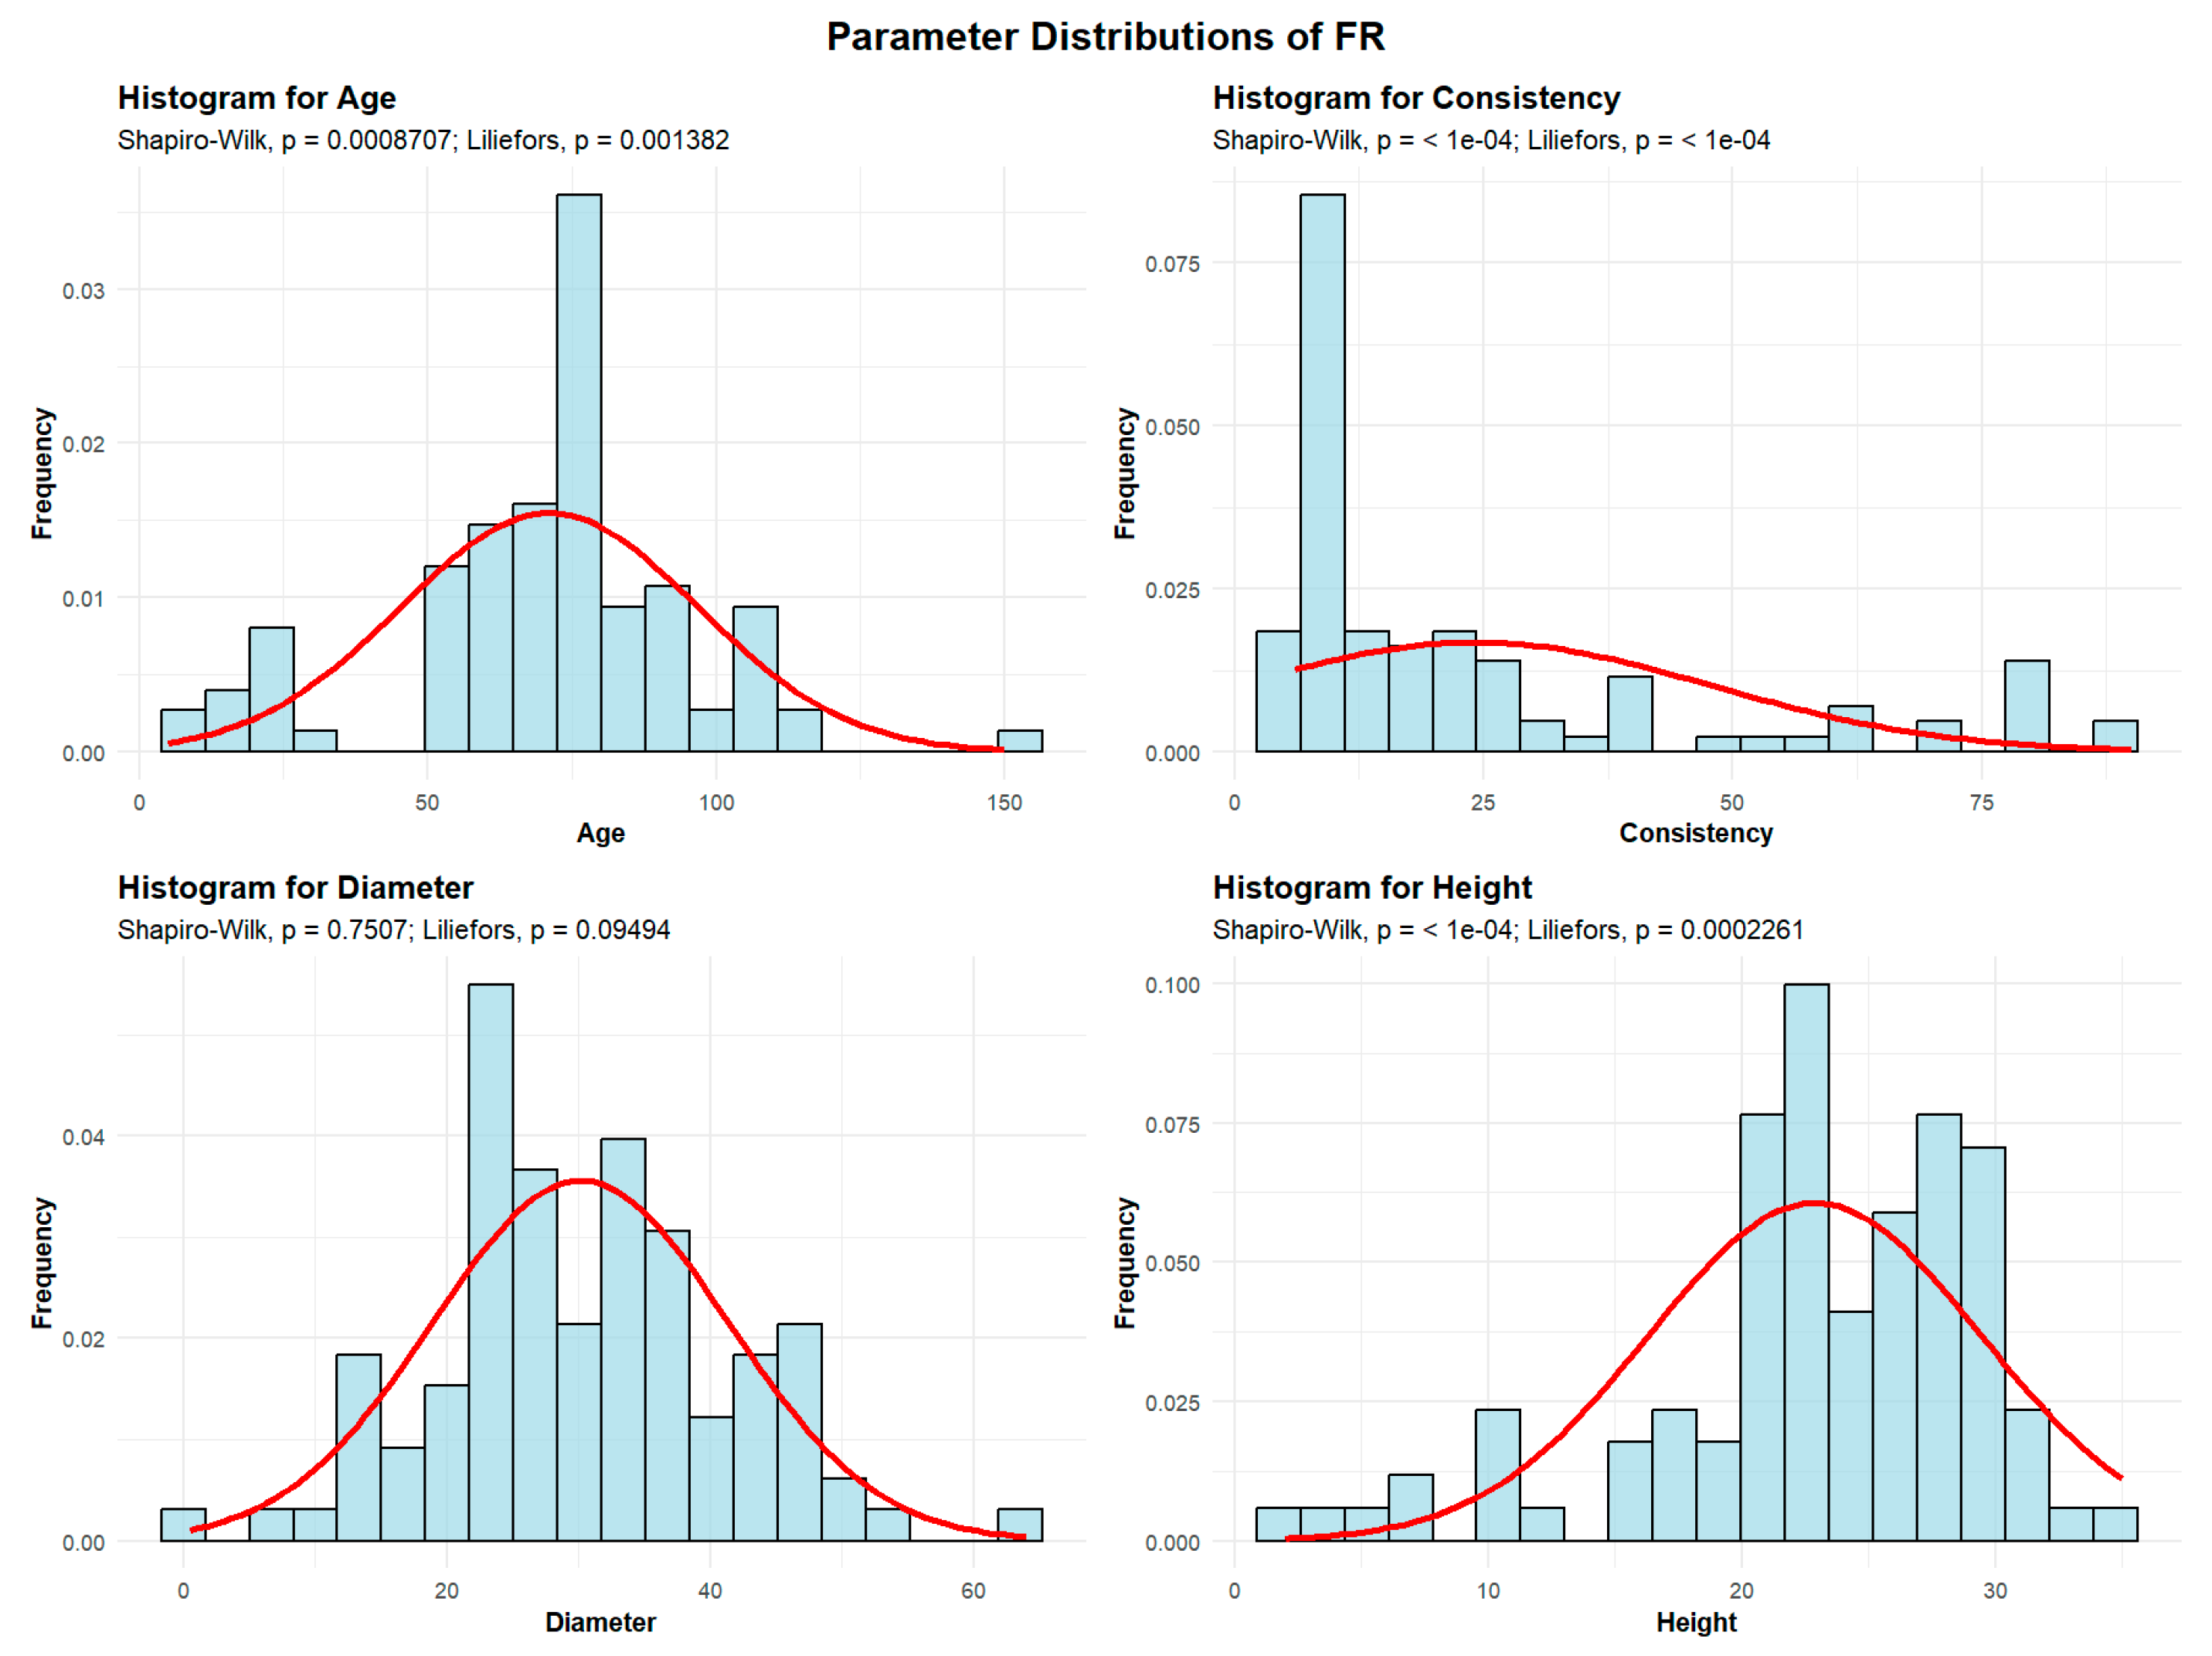
The Fraxinus genus is represented within the Green Forest stand by the common ash (
Fraxinus excelsior) - FR population. Descriptive analyses were conducted for the variables age, consistency, diameter, and height to summarize their central tendency, variability, and distributional characteristics within the sample, as shown in
Figure 5.
The mean age of the FR is 71 years. The standard deviation of the age of the FR trees in the studied plots is 25.77 years.
A total of 12 plots (12.24%) contain FR with an average age of up to 30 years. Another 20 plots (20.41%) have FR with an average age between 30 and 60 years. The largest group includes 53 plots (50.08%), where the average FR age is between 60 and 90 years. In addition, 12 plots (12.24%) have FR with an average age between 90 and 120 years, and 1 plot containing trees older than 120 years.
The mean FR consistency of stand-density values is 24.10, with a standard deviation of 23.70. Most plots—76 plots (77.55%)—exhibit degraded FR consistency, while 12 plots (12.24%) show discontinuous consistency, and only 10 plots (10.20%) display nearly full consistency.
FR exhibit an average trunk diameter of 30.13 cm with a standard deviation of 11.21 cm. This means that while the average diameter is 30.13 cm, tree mean diameters can vary significantly, ranging from as small as 0.5 cm in plots where there is seedling regeneration, to as large as 64 cm in plots with mature trees.
In 54 plots (55.1% of the total), the average tree mean diameter of the FR is up to 30 cm. In 43 plots (43.88%), the average diameter ranges from 30 to 60 cm. Only 1 plot recorded average FR diameters between 60 and 90 cm.
The average height of the FR is 22.88 m, with a standard deviation of 6.57 m. In most plots, 96 plots (97.96% of the total), the average height is below 30 m, while only 3 plots (2.04%) recorded average FR heights above 30 m.
2.2.3. Acer Genus Tree Population Descriptive Statistics
The Acer genus tree population identified in Green Forest is represented by the following tree species: Field maple (Acer campestre) – JU; 2 Norway maple (Acer platanoides) – PAC, and sycamore maple (Acer pseudoplatanus) - PAM.
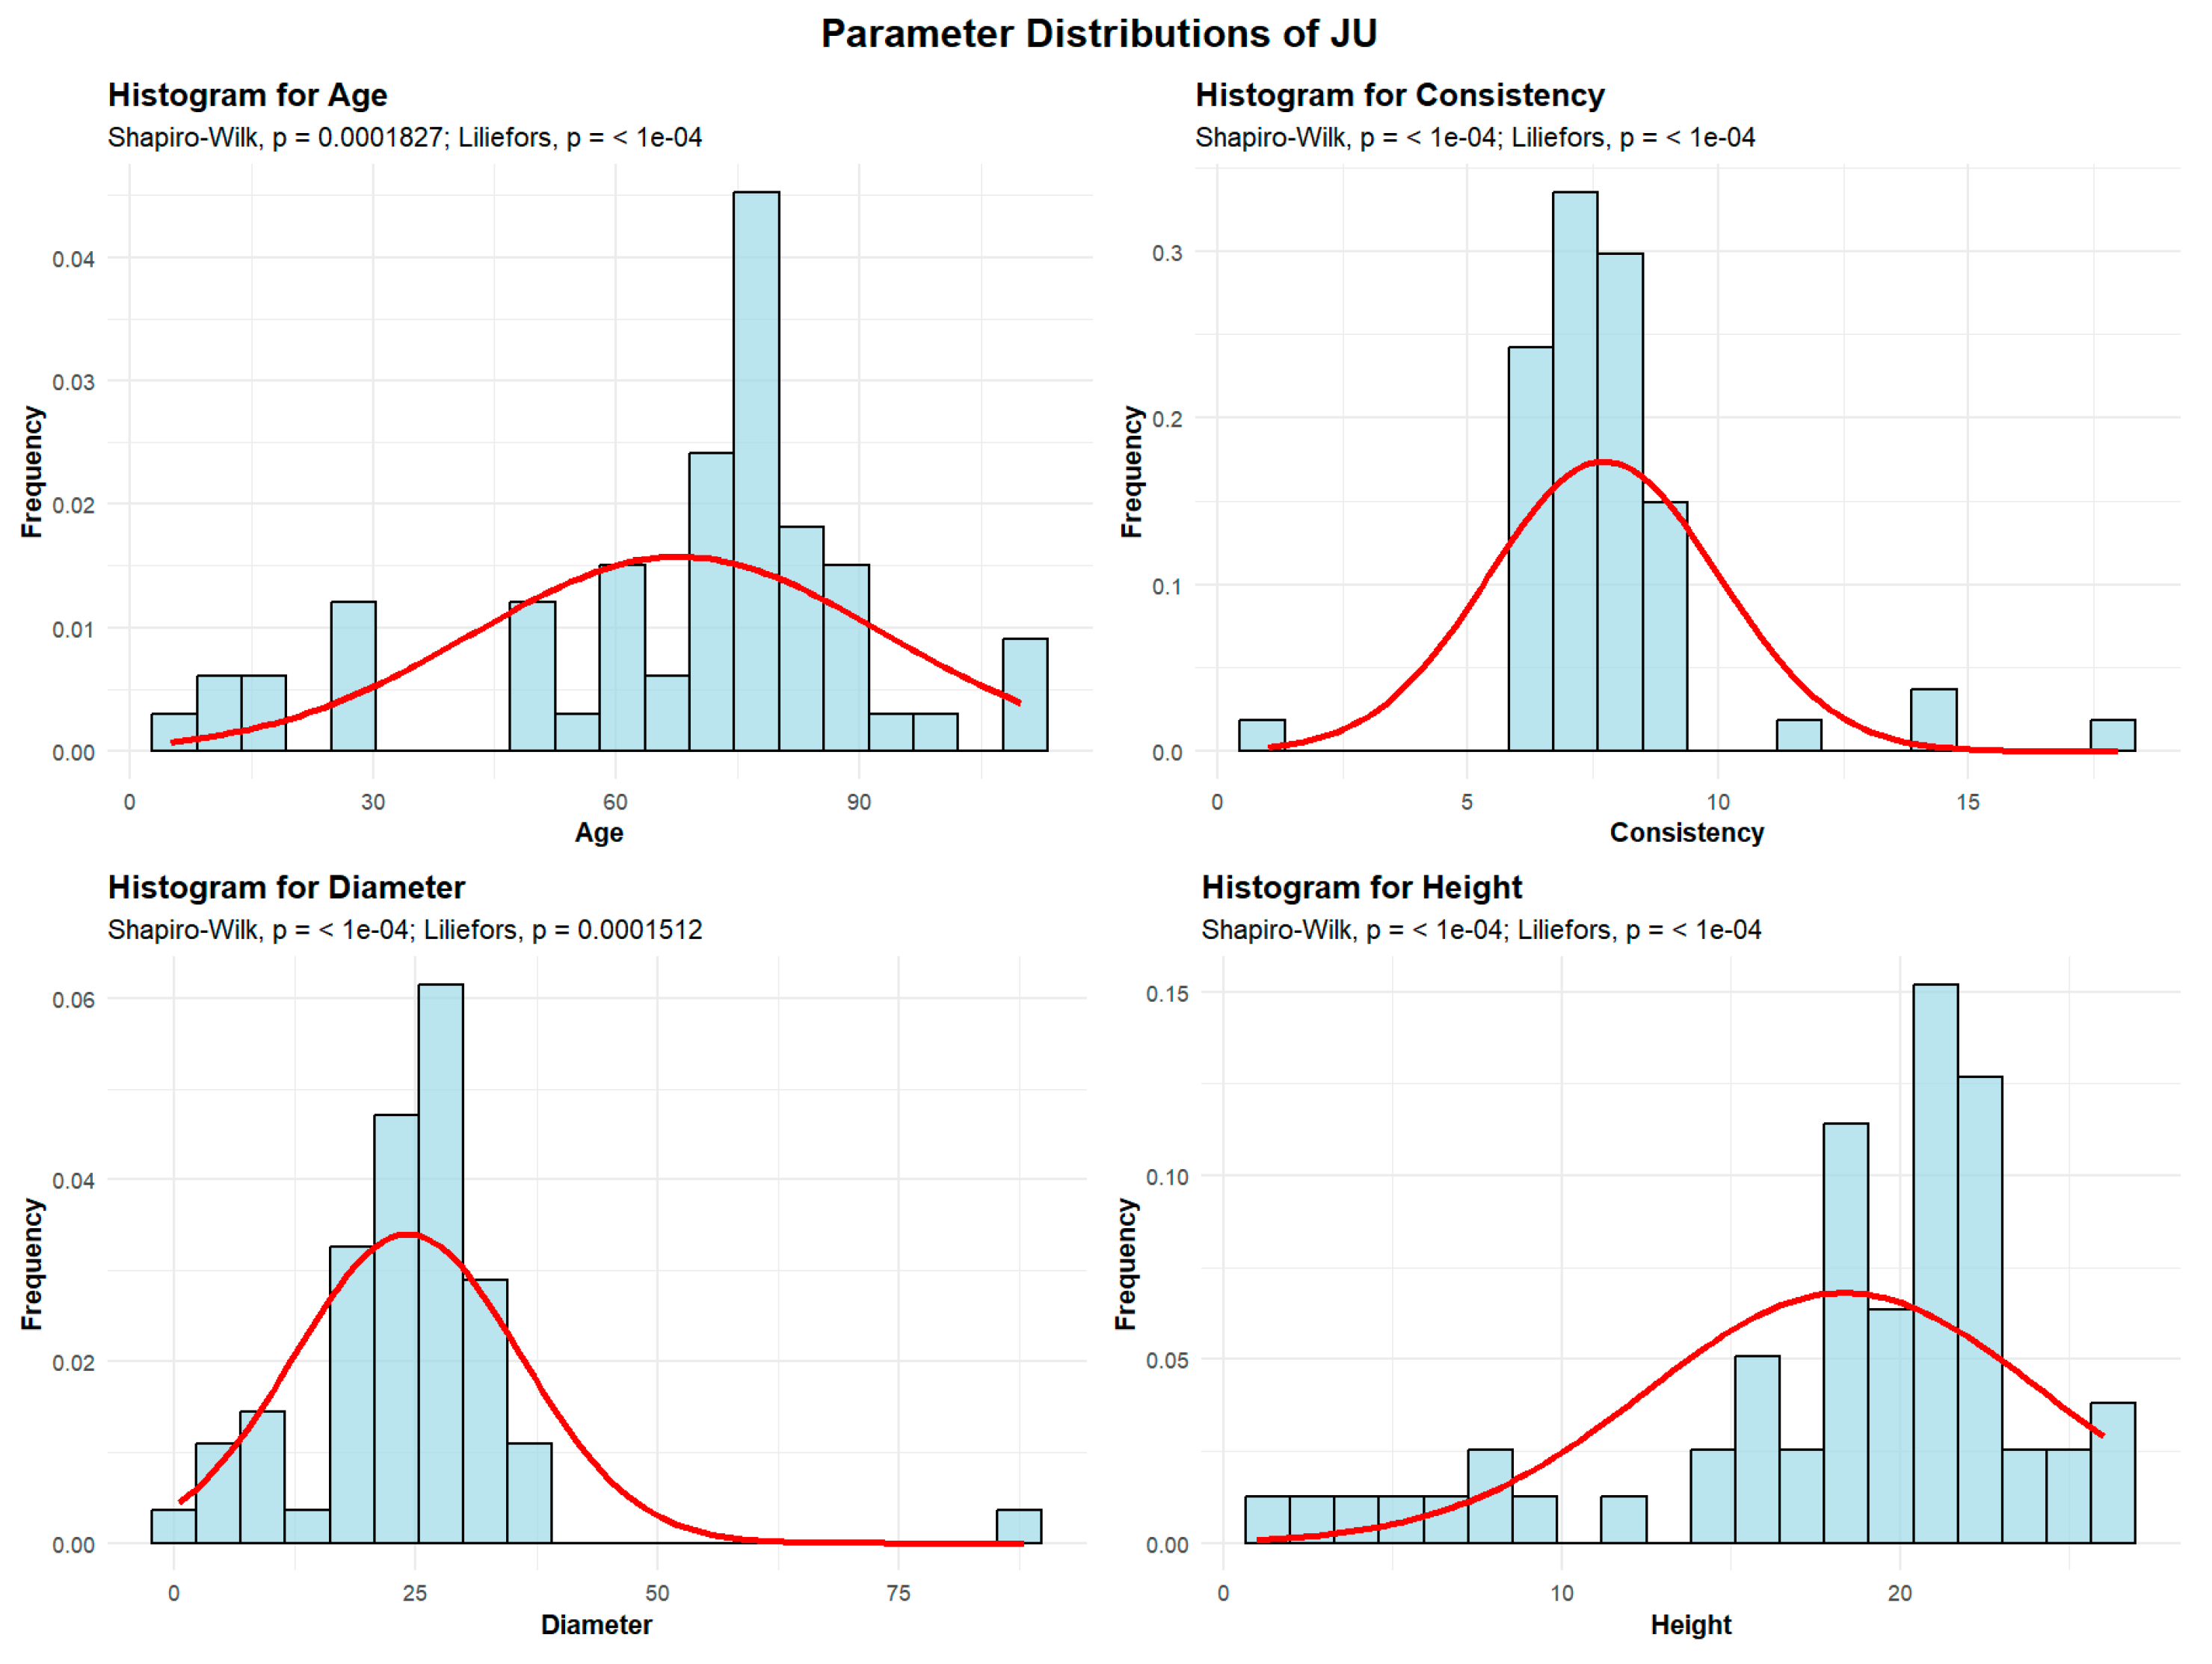
2.2.3.1. Field Maple (Acer campestre)—JU
Descriptive analyses were conducted for the variables age, consistency, diameter, and height to summarize their central tendency, variability, and distributional characteristics within the sample, as shown in
Figure 6.
The mean age of the JU is 68 years. The standard deviation of JU age across the studied plots is 25.33 years, indicating considerable variability. A total of 9 plots (15%) contain JU with an average age up to 30 years, while 10 plots (16.67%) have JU with an average age between 30 and 60 years. The largest group comprises 36 plots (60%), with an average JU age of 60 to 90 years. Beyond these dominant classes, 5 plots (8.33%) were observed with average JU ages ranging from 90 to 120 years.
The mean JU consistency of stand-density values is 7.71, with a standard deviation of 2.29, meaning that all 60 plots exhibit degraded JU consistency.
JU exhibits an average trunk diameter of 24.14 cm with a standard deviation of 11.73 cm. This means that while the average diameter is 24.14 cm, tree mean diameters can vary significantly, ranging from as small as 0.5 cm in plots where there is seedling regeneration, to as large as 88 cm in plots with mature, old-growth trees.
In 51 plots (85% of the total), the average tree mean diameter of the JU is up to 30 cm. In 8 plots (13.33%), the average diameter ranged from 30 to 60 cm, while only 1 plot recorded average JU diameters between 60 and 90 cm.
The average height of the JU is 18.35 m, with a standard deviation of 5.85 m. This indicates that JU trees are generally tall, although their heights vary considerably, from the shortest individuals in seedling-regeneration plots to the tallest, reaching 26 m in plots with mature trees. In all 60 plots, the average JU height is below 30 m.
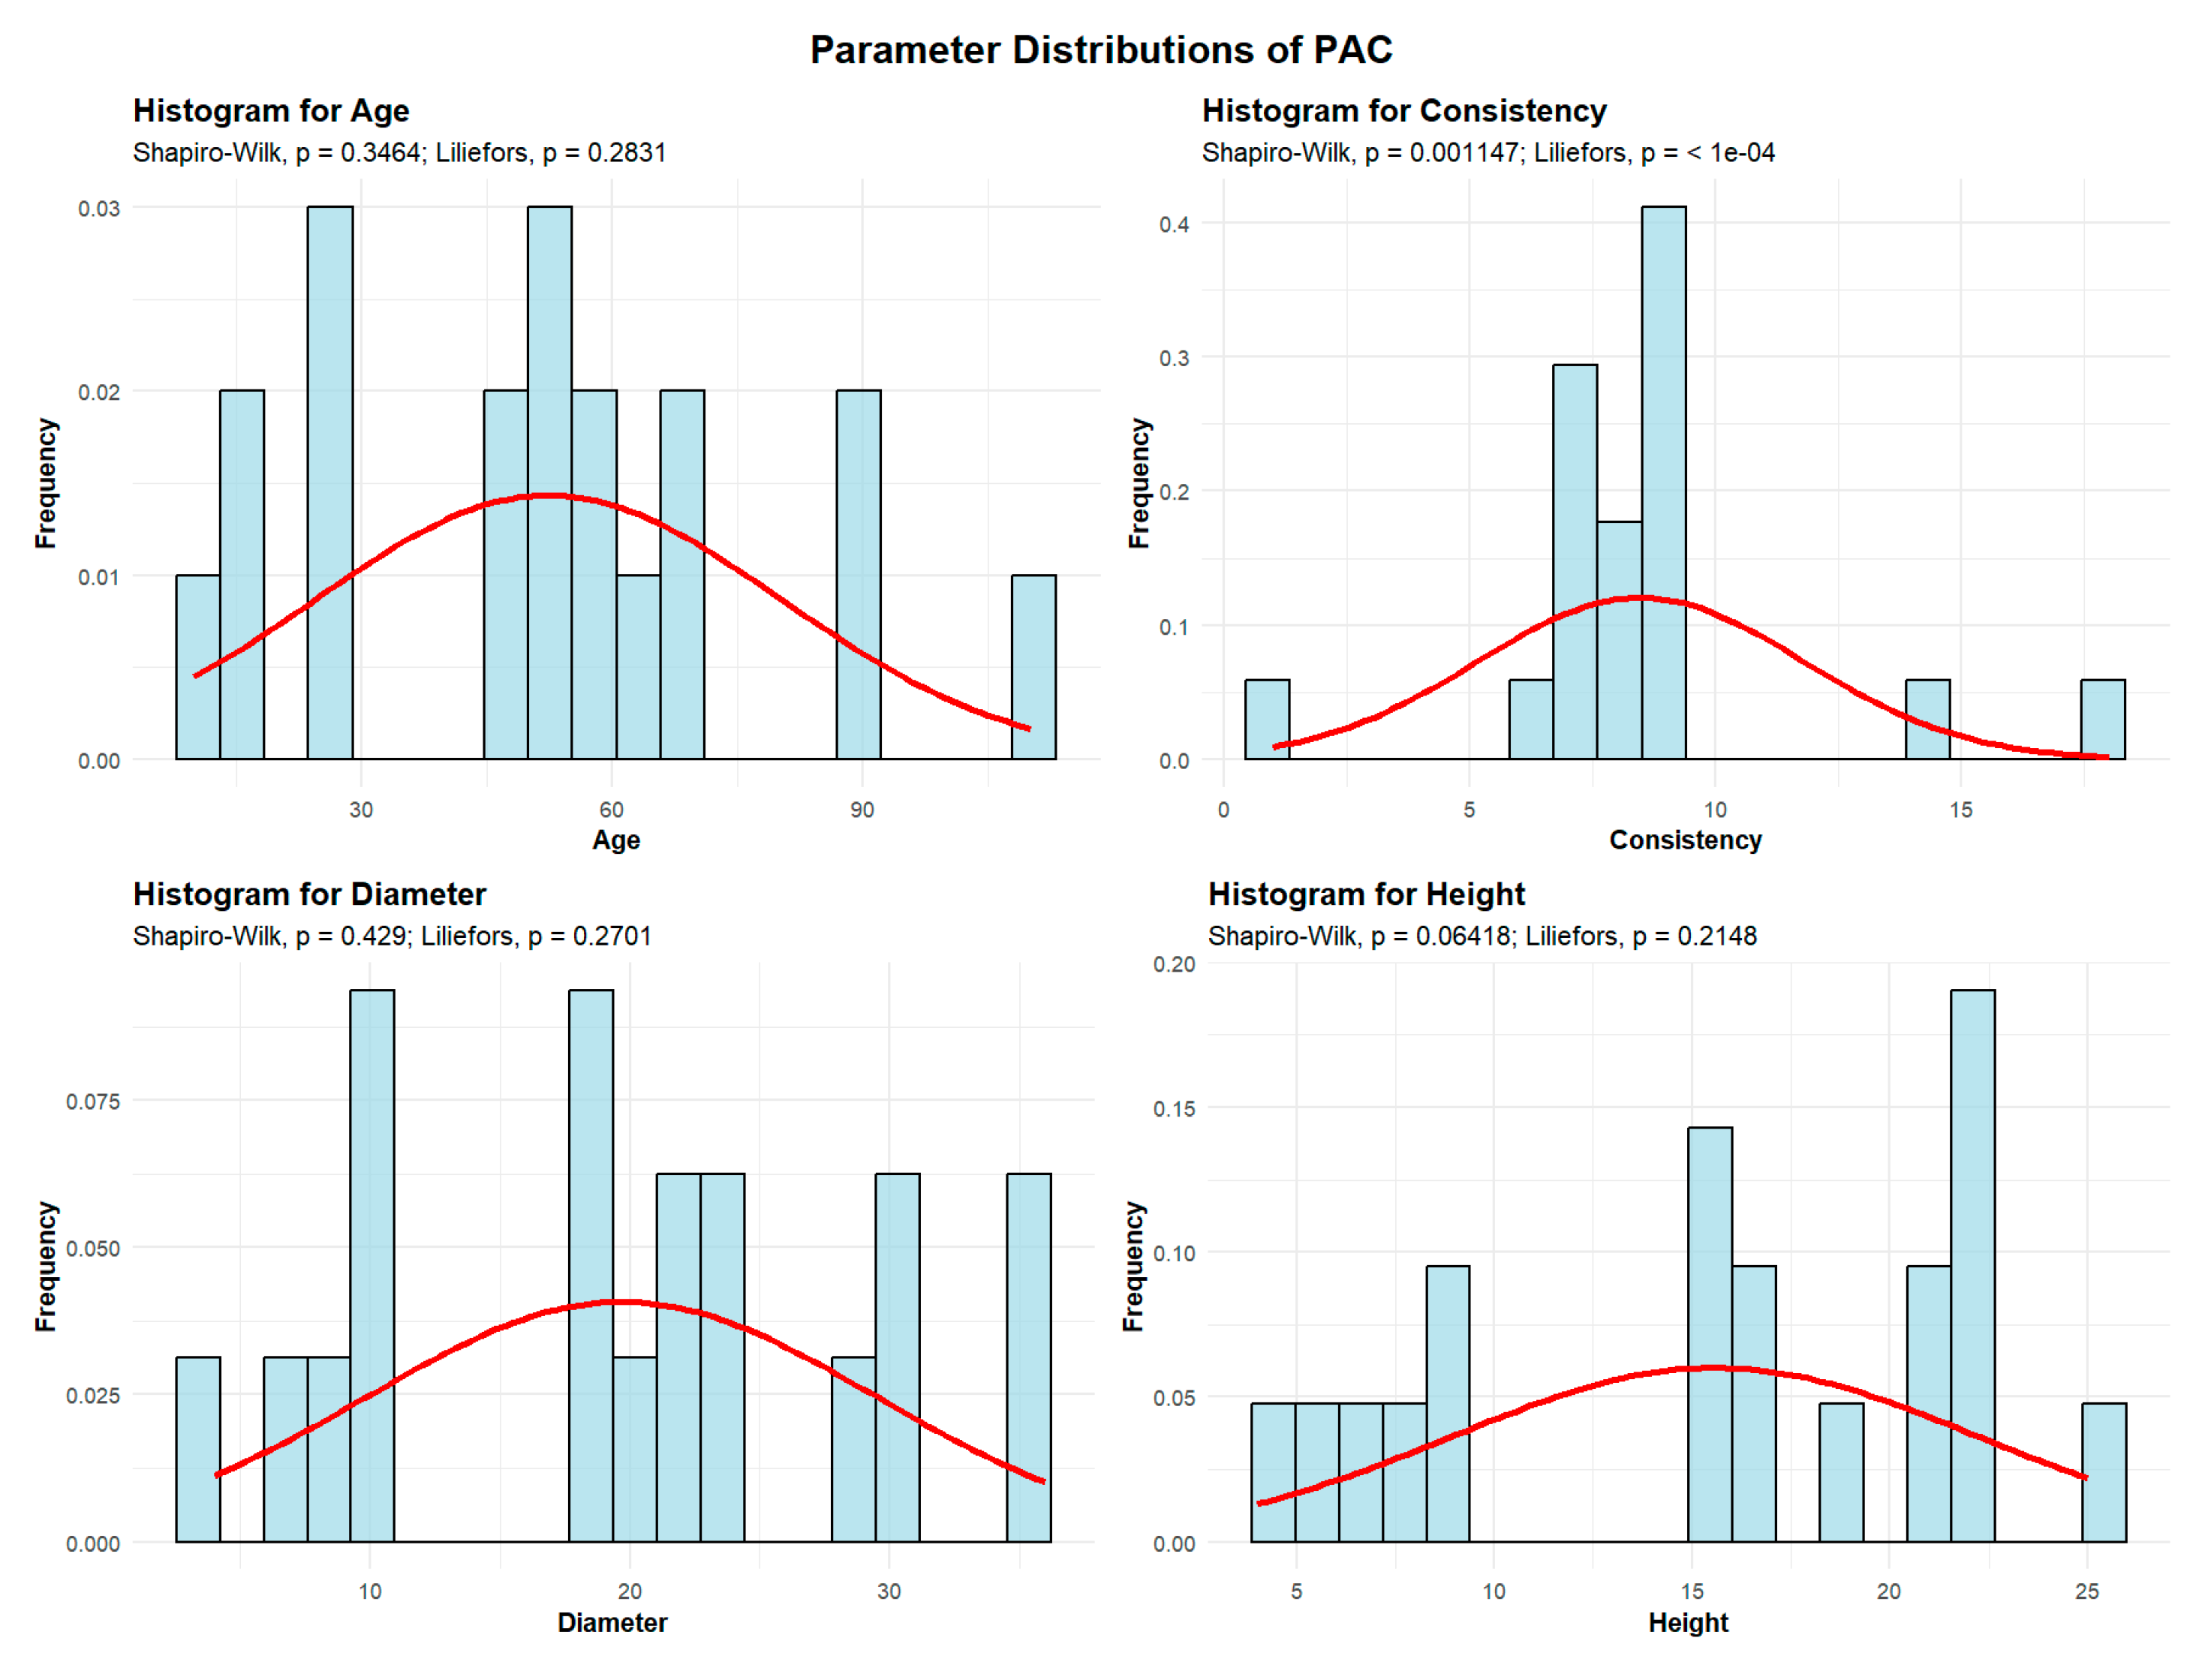
2.2.3.2. Norway Maple (Acer platanoides)—PAC
Descriptive analyses were conducted for the variables age, consistency, diameter, and height to summarize their central tendency, variability, and distributional characteristics within the sample, as shown in
Figure 7.
The mean age of the PAC is 52.36 years. The standard deviation of the age of the ST trees in the studied plots is 27.80 years.
A total of 6 plots (31.58%) contain PAC with an average age of up to 30 years. The largest group includes 8 plots (42.11%) with PAC averaging between 30 and 60 years. Additionally, 4 plots (21.05%) have PAC with an average age between 60 and 90 years, and 1 plot contains trees older than 90 years.
The mean PAC consistency of stand-density values is 8.47, with a standard deviation of 3.30, meaning that all 19 plots exhibit degraded PAC consistency.
PAC trees have an average trunk diameter of 19.68 cm, with a standard deviation of 9.78 cm, indicating substantial variation; diameters range from 4 cm to 36 cm in plots containing mature trees. In most plots, 17 plots (89.47% of the total), the average PAC diameter is up to 30 cm, while only 2 plots (10.53%) have average diameters between 30 and 60 cm.
The average height of the PAC is 15.57 m, with a standard deviation of 6.63 m. This indicates that PAC trees are generally tall, although their heights vary considerably. In all 19 plots, the average PAC height is below 30 m.
2.2.3.3. Sycamore Maple (Acer pseudoplatanus)—PAM
A population of Acer pseudoplatanus (PAM) was identified in only one plot within the Green Forest stand. Its characteristics are as follows: the mean age is 60 years, the mean diameter is 18 cm, the mean height is 17 m, and the mean consistency value is 9, indicating a degraded canopy.
2.2.4. Ulmus Genus Tree Population Descriptive Statistics
Ulmus genus tree populations identified in the Green Forest are represented by the European field elm (Ulmus campestris) – ULC and the Wych elm (Ulmus glabra) – ULM
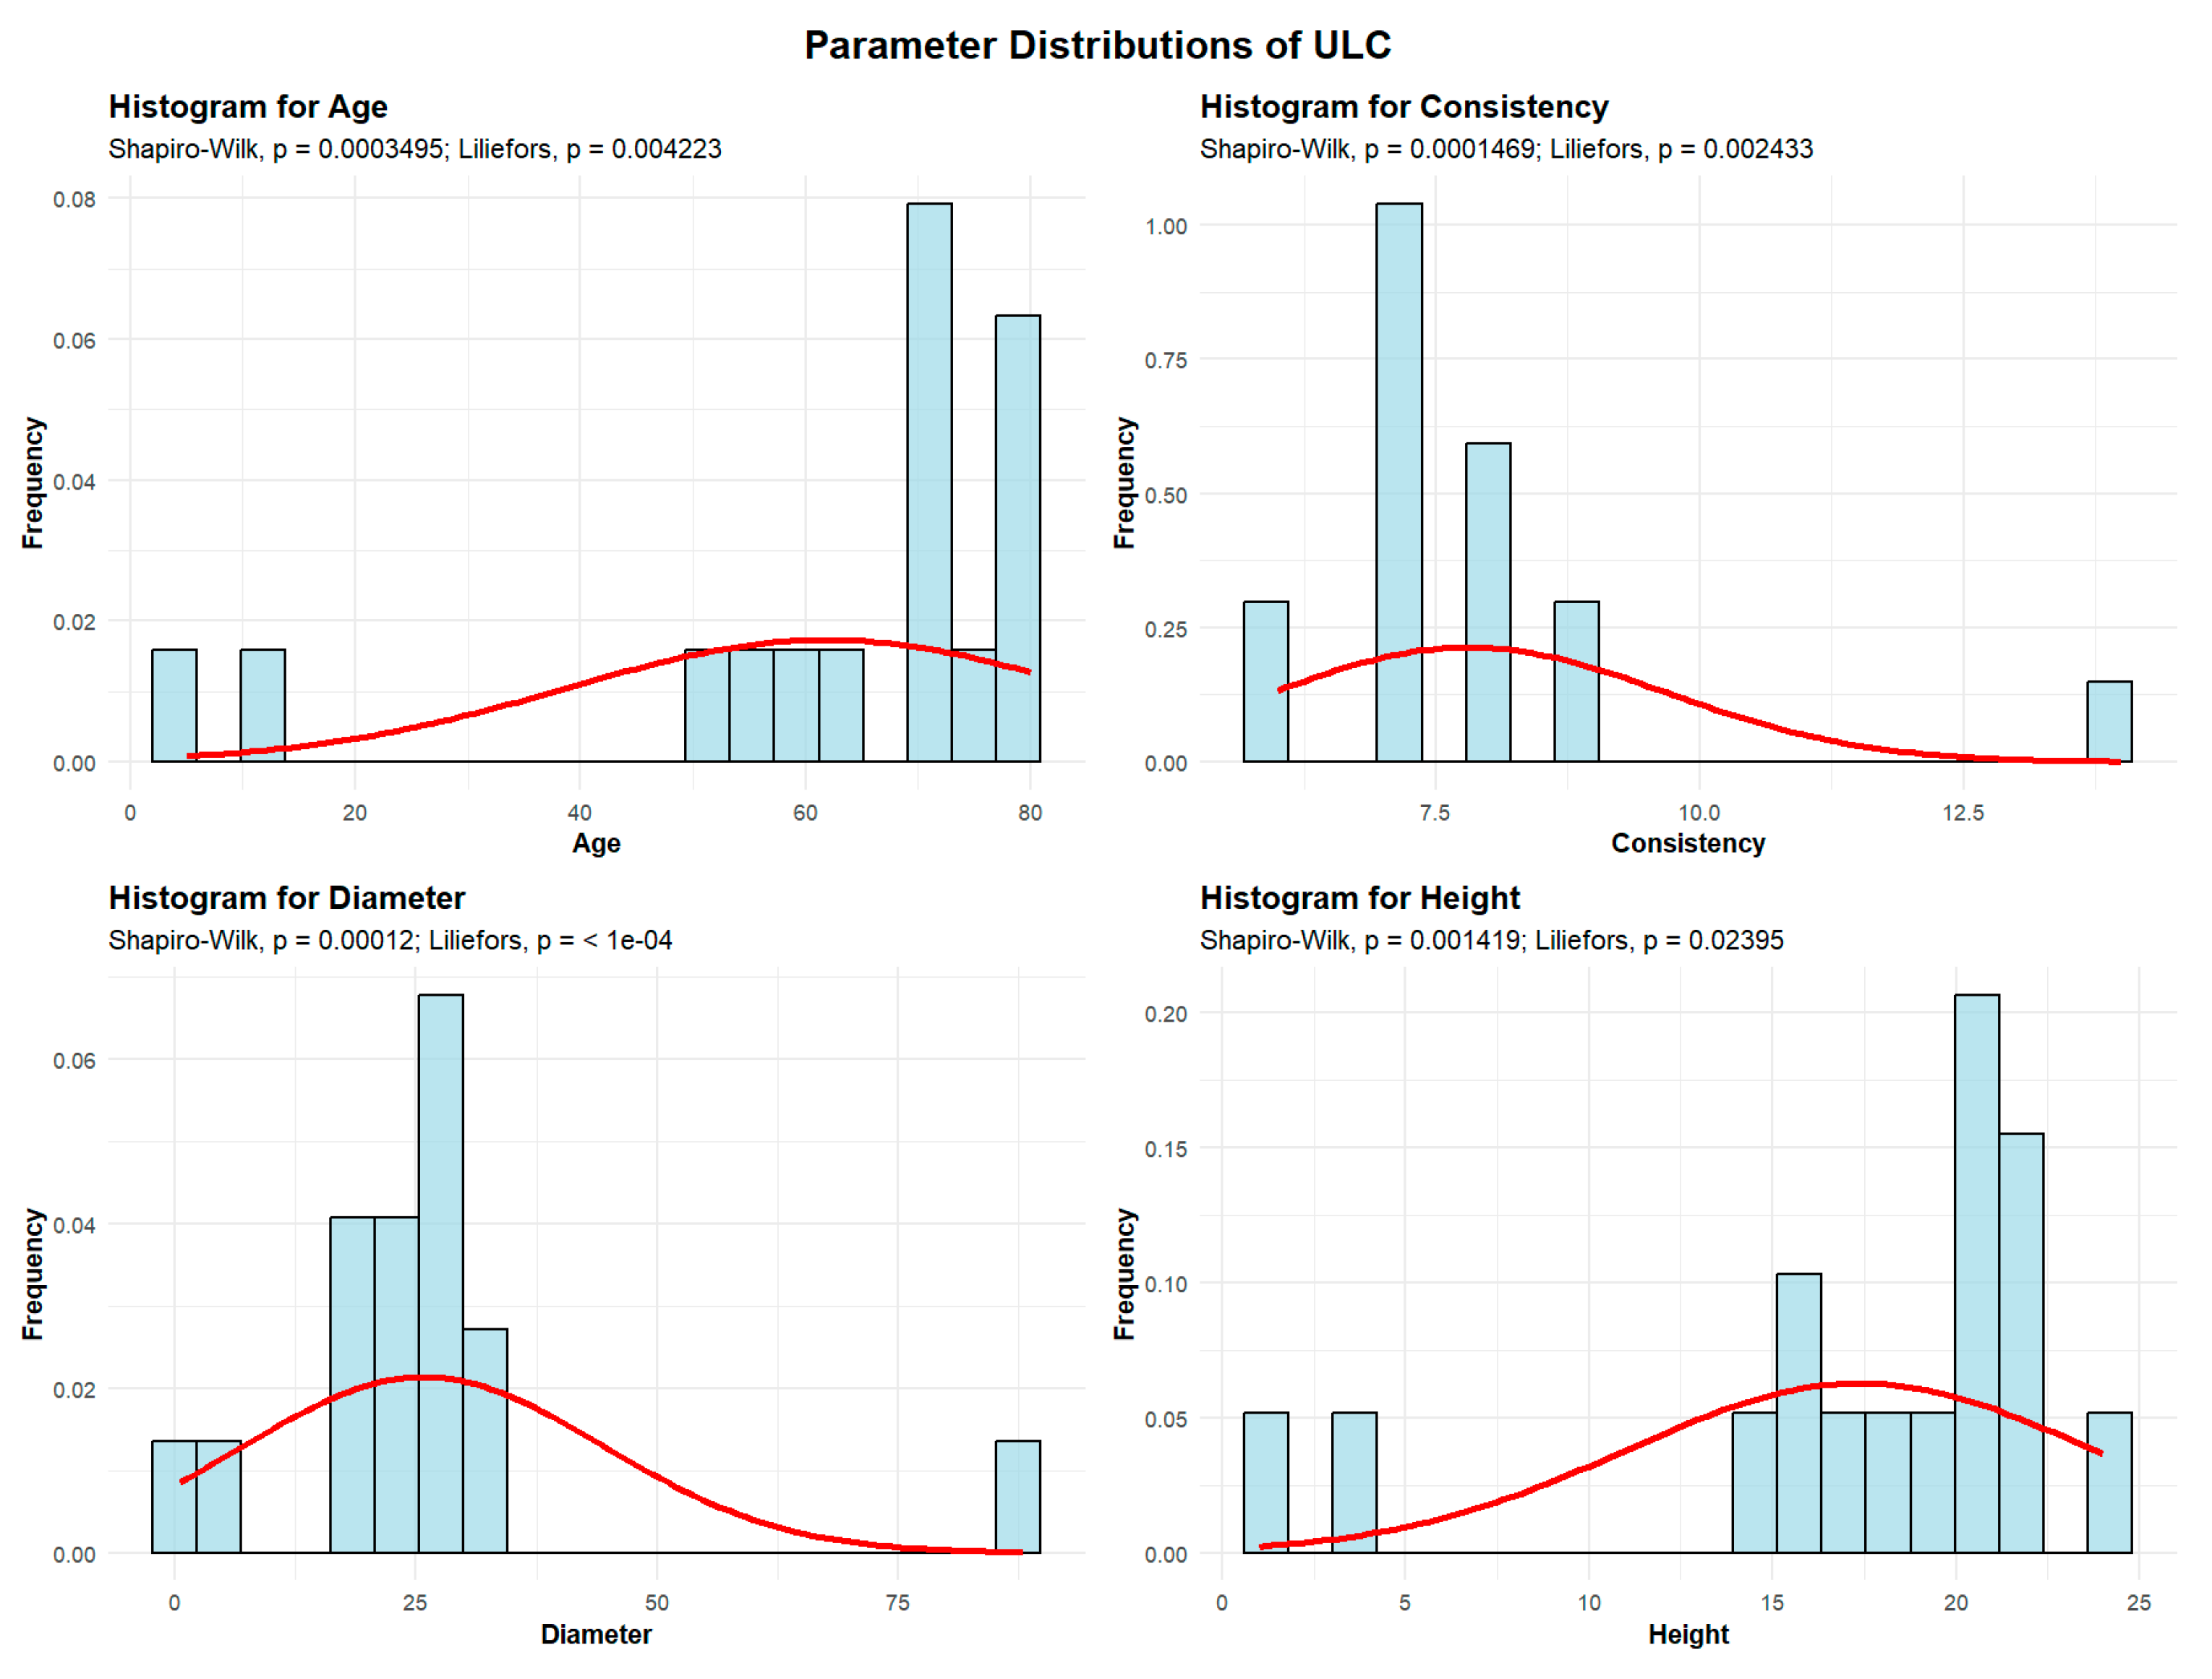
2.2.4.1. European Field Elm (Ulmus campestris)—ULC
Descriptive analyses were conducted for the variables age, consistency, diameter, and height to summarize their central tendency, variability, and distributional characteristics within the sample, as shown in
Figure 8.
The mean age of the ULC is 61.87 years. The standard deviation of the ULC tree ages in the studied plots is 35.5 years. A total of 2 plots (12.5%) contain ULC with an average age of up to 30 years. Another 3 plots (18.75%) have ULC with an average age between 30 and 60 years. The largest group includes 11 plots (68.75%), where the average ULC age is between 60 and 90 years.
The mean ULC consistency of stand-density values is 7.81, with a standard deviation of 1.86, meaning that all 16 plots exhibit degraded ULC consistency.
ULC exhibit an average trunk diameter of 25.78 cm, with a standard deviation of 18.68 cm. In most plots, 15 plots (93.75% of the total), the average ULC diameter is up to 30 cm, while only 1 plot has an average diameter between 60 and 90 cm.
The average height of the ULC is 17.37 m, with a standard deviation of 6.36 m, and the maximum recorded height is 24 m, meaning that in all 16 plots the average ULC height is below 30 m.
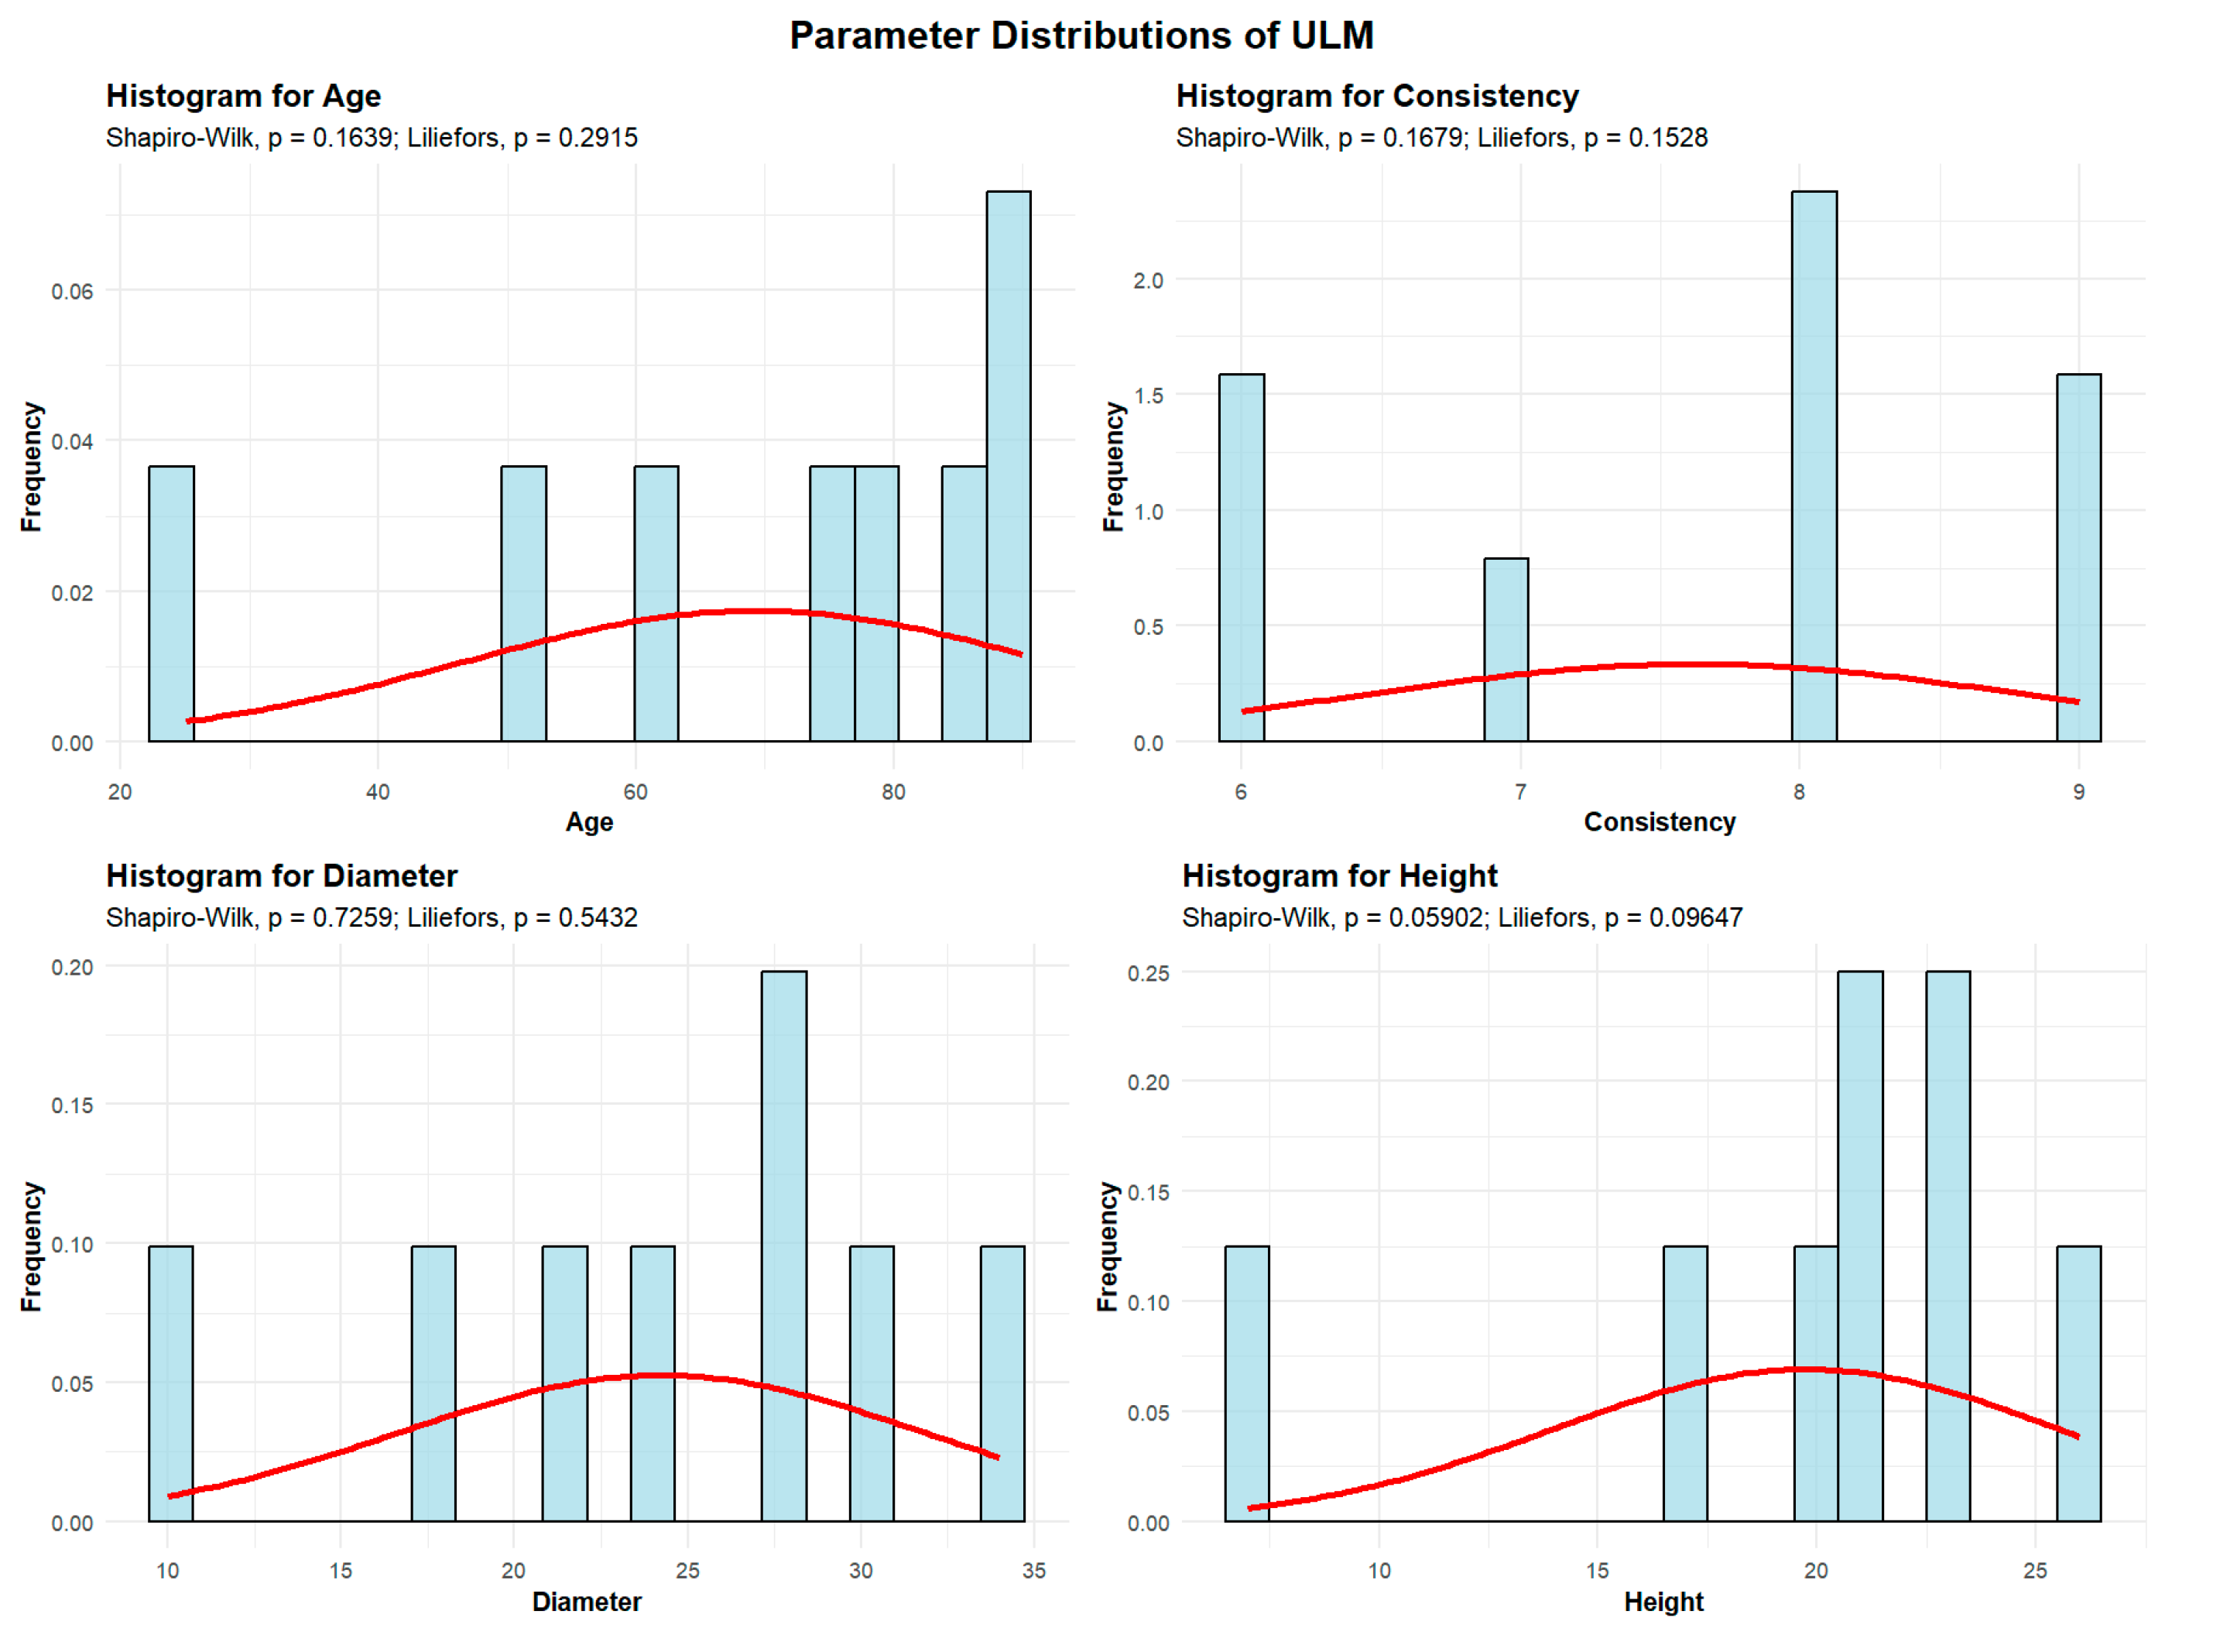
2.2.4.2. Wych Elm (Ulmus glabra)—ULM
Descriptive analyses were conducted for the variables age, consistency, diameter, and height to summarize their central tendency, variability, and distributional characteristics within the sample, as shown in
Figure 9.
The mean age of the ULM is 69.37 years. The standard deviation of ULM age across the studied plots is 22.9 years. A total of 2 plots (25%) contain ULM with an average age between 30 and 60 years. The other 6 plots (75%) have ULM with an average age between 60 and 90 years.
The mean ULM consistency of stand-density values is 7.62, with a standard deviation of 1.18, meaning that all 8 plots exhibit degraded ULM consistency.
ULM exhibits an average trunk diameter of 24.25 cm, with a standard deviation of 5.7 cm.
In 7 plots, the average ULM diameter is up to 30 cm, while only 1 plot shows an average diameter of 34 cm.
The average height of the ULM is 19.75 m, with a standard deviation of 6.36 m, and the maximum recorded height is 26 m, meaning that in all 8 plots the average ULM height is below 30 m.
2.2.5. Robinia Genus Tree Population Descriptive Statistics
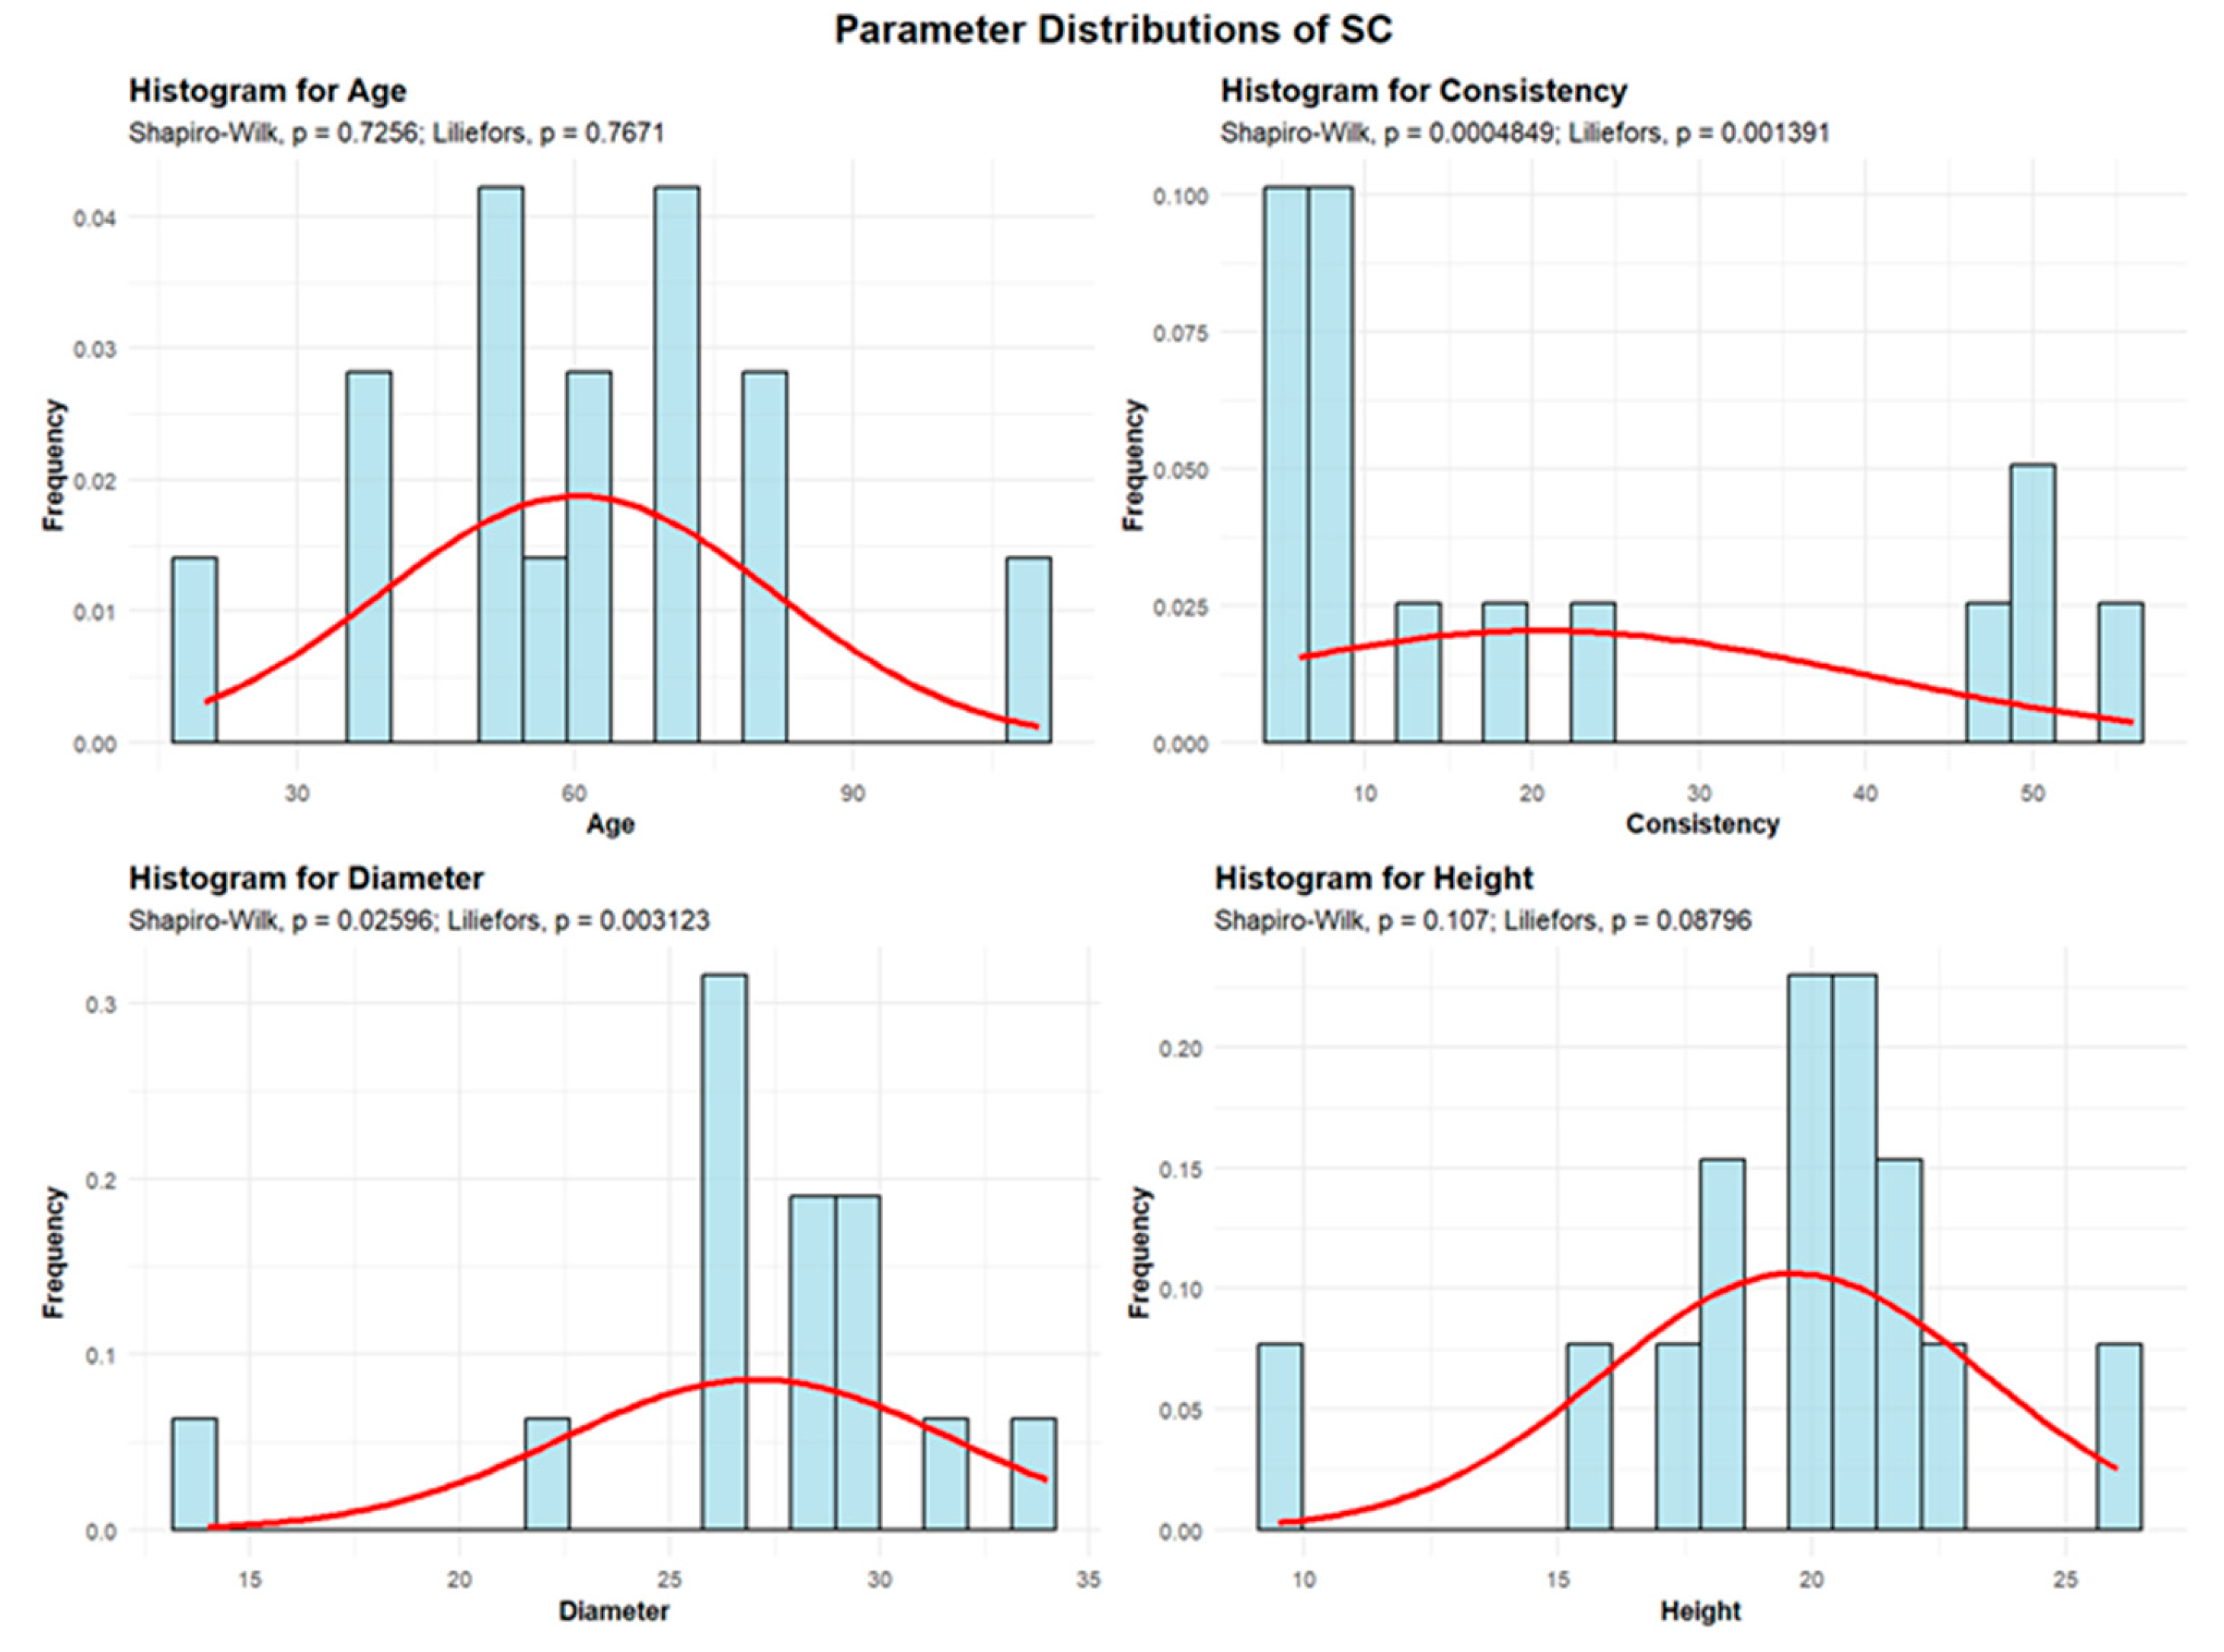
The Robinia genus is represented within the Green Forest stand by the black locust (Robinia pseudoacacia) – SC population.
Descriptive analyses were conducted for the variables age, consistency, diameter, and height to summarize their central tendency, variability, and distributional characteristics within the sample, as shown in
Figure 10.
The mean age of the SC is 60.33 years. The standard deviation of the SC trees’ ages is 21.25 years.
One plot (6.67%) contains SC with an average age of 20 years. The largest group includes 8 plots (53.33%) with SC averaging between 30 and 60 years. Another 5 plots (33.33%) have SC with an average age between 60 and 90 years, and one plot (6.67%) contains SC trees with an average age of 110 years.
The mean consistency (SC) of stand-density values is 20.53, with a standard deviation of 19.46. Among all plots, 11 plots (73.33%) show degraded SC consistency, while 4 plots (26.67%) exhibit nearly full consistency.
SC exhibit an average trunk diameter of 27.06 cm, with a standard deviation of 4.65 cm. The minimum recorded average trunk diameter is 14 cm, while the maximum reaches 34 cm. In most plots, 13 plots (86.67%), the average SC trunk diameter is up to 30 cm, whereas only 2 plots (13.33%) show average trunk diameters between 30 and 60 cm.
The average height of the SC is 19.63 m, with a standard deviation of 3.75 m. The minimum recorded average height is 9.5 m, while the maximum is 26 m, indicating that, across all 15 plots, the average SC height is below 30 m.
2.2.6. Juglans Genus Tree Population Descriptive Statistics
Juglans genus tree populations identified in the Green Forest are represented by the White walnut (Juglans cinerea) - NUA and the Black walnut (Juglans nigra) – NUN.
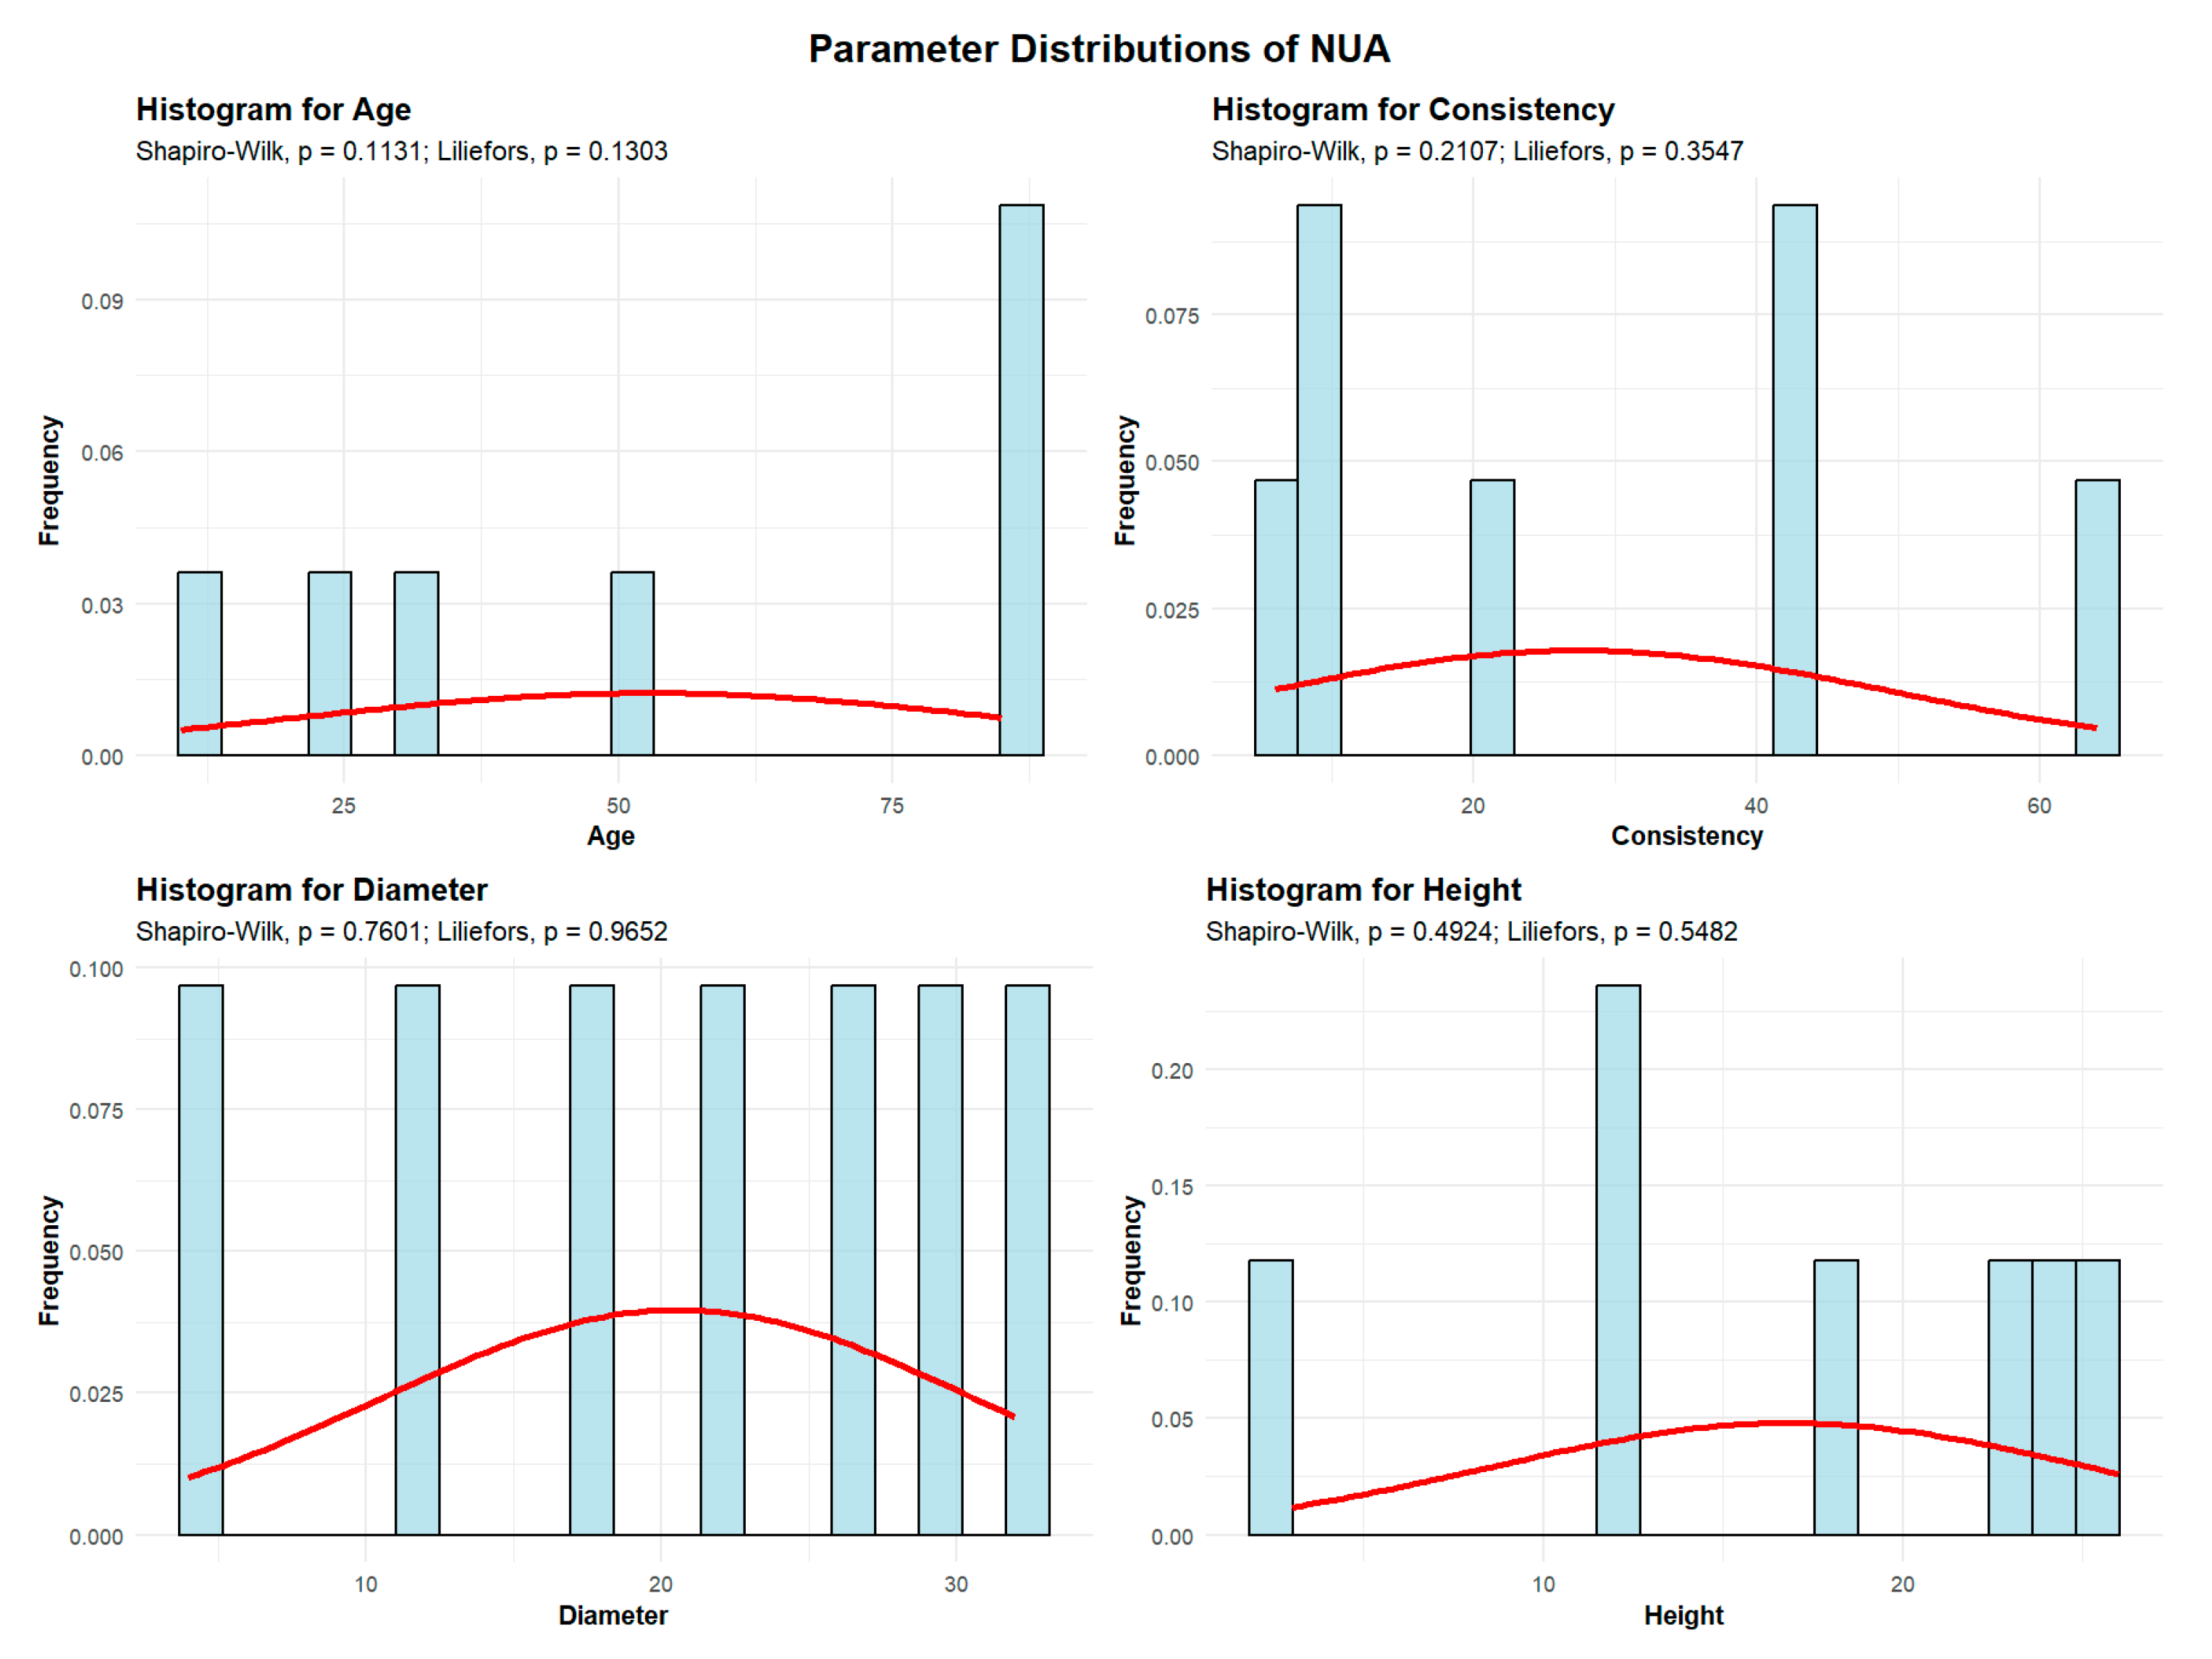
2.2.6.1. White Walnut (Juglans cinerea)—NUA
Descriptive analyses were conducted for the variables age, consistency, diameter, and height to summarize their central tendency, variability, and distributional characteristics within the sample, as shown in
Figure 11.
The mean age of the NUA is 52.85 years. The standard deviation of NUA age across the studied plots is 32.25 years. A total of 3 plots (42.86%) contain NUA with an average age of up to 30 years. One plot (14.29%) contains NUA with an average age of 50 years, while 3 plots (42.86%) have NUA with an average age of 85 years.
The mean NUA consistency of stand-density values is 27.42, with a standard deviation of 22.28. Among all plots, 4 plots (57.14%) show degraded NUA consistency, while 3 plots (42.86%) show discontinuous consistency.
NUA exhibits an average trunk diameter of 20.57 cm with a standard deviation of 10.04 cm. This means that tree mean diameters vary significantly, ranging from as small as 4 cm to as large as 32 cm.
The average height of the NUA is 16.85 m, with a standard deviation of 8.29 m, and in all 7 plots, the average height remains below 30 m.
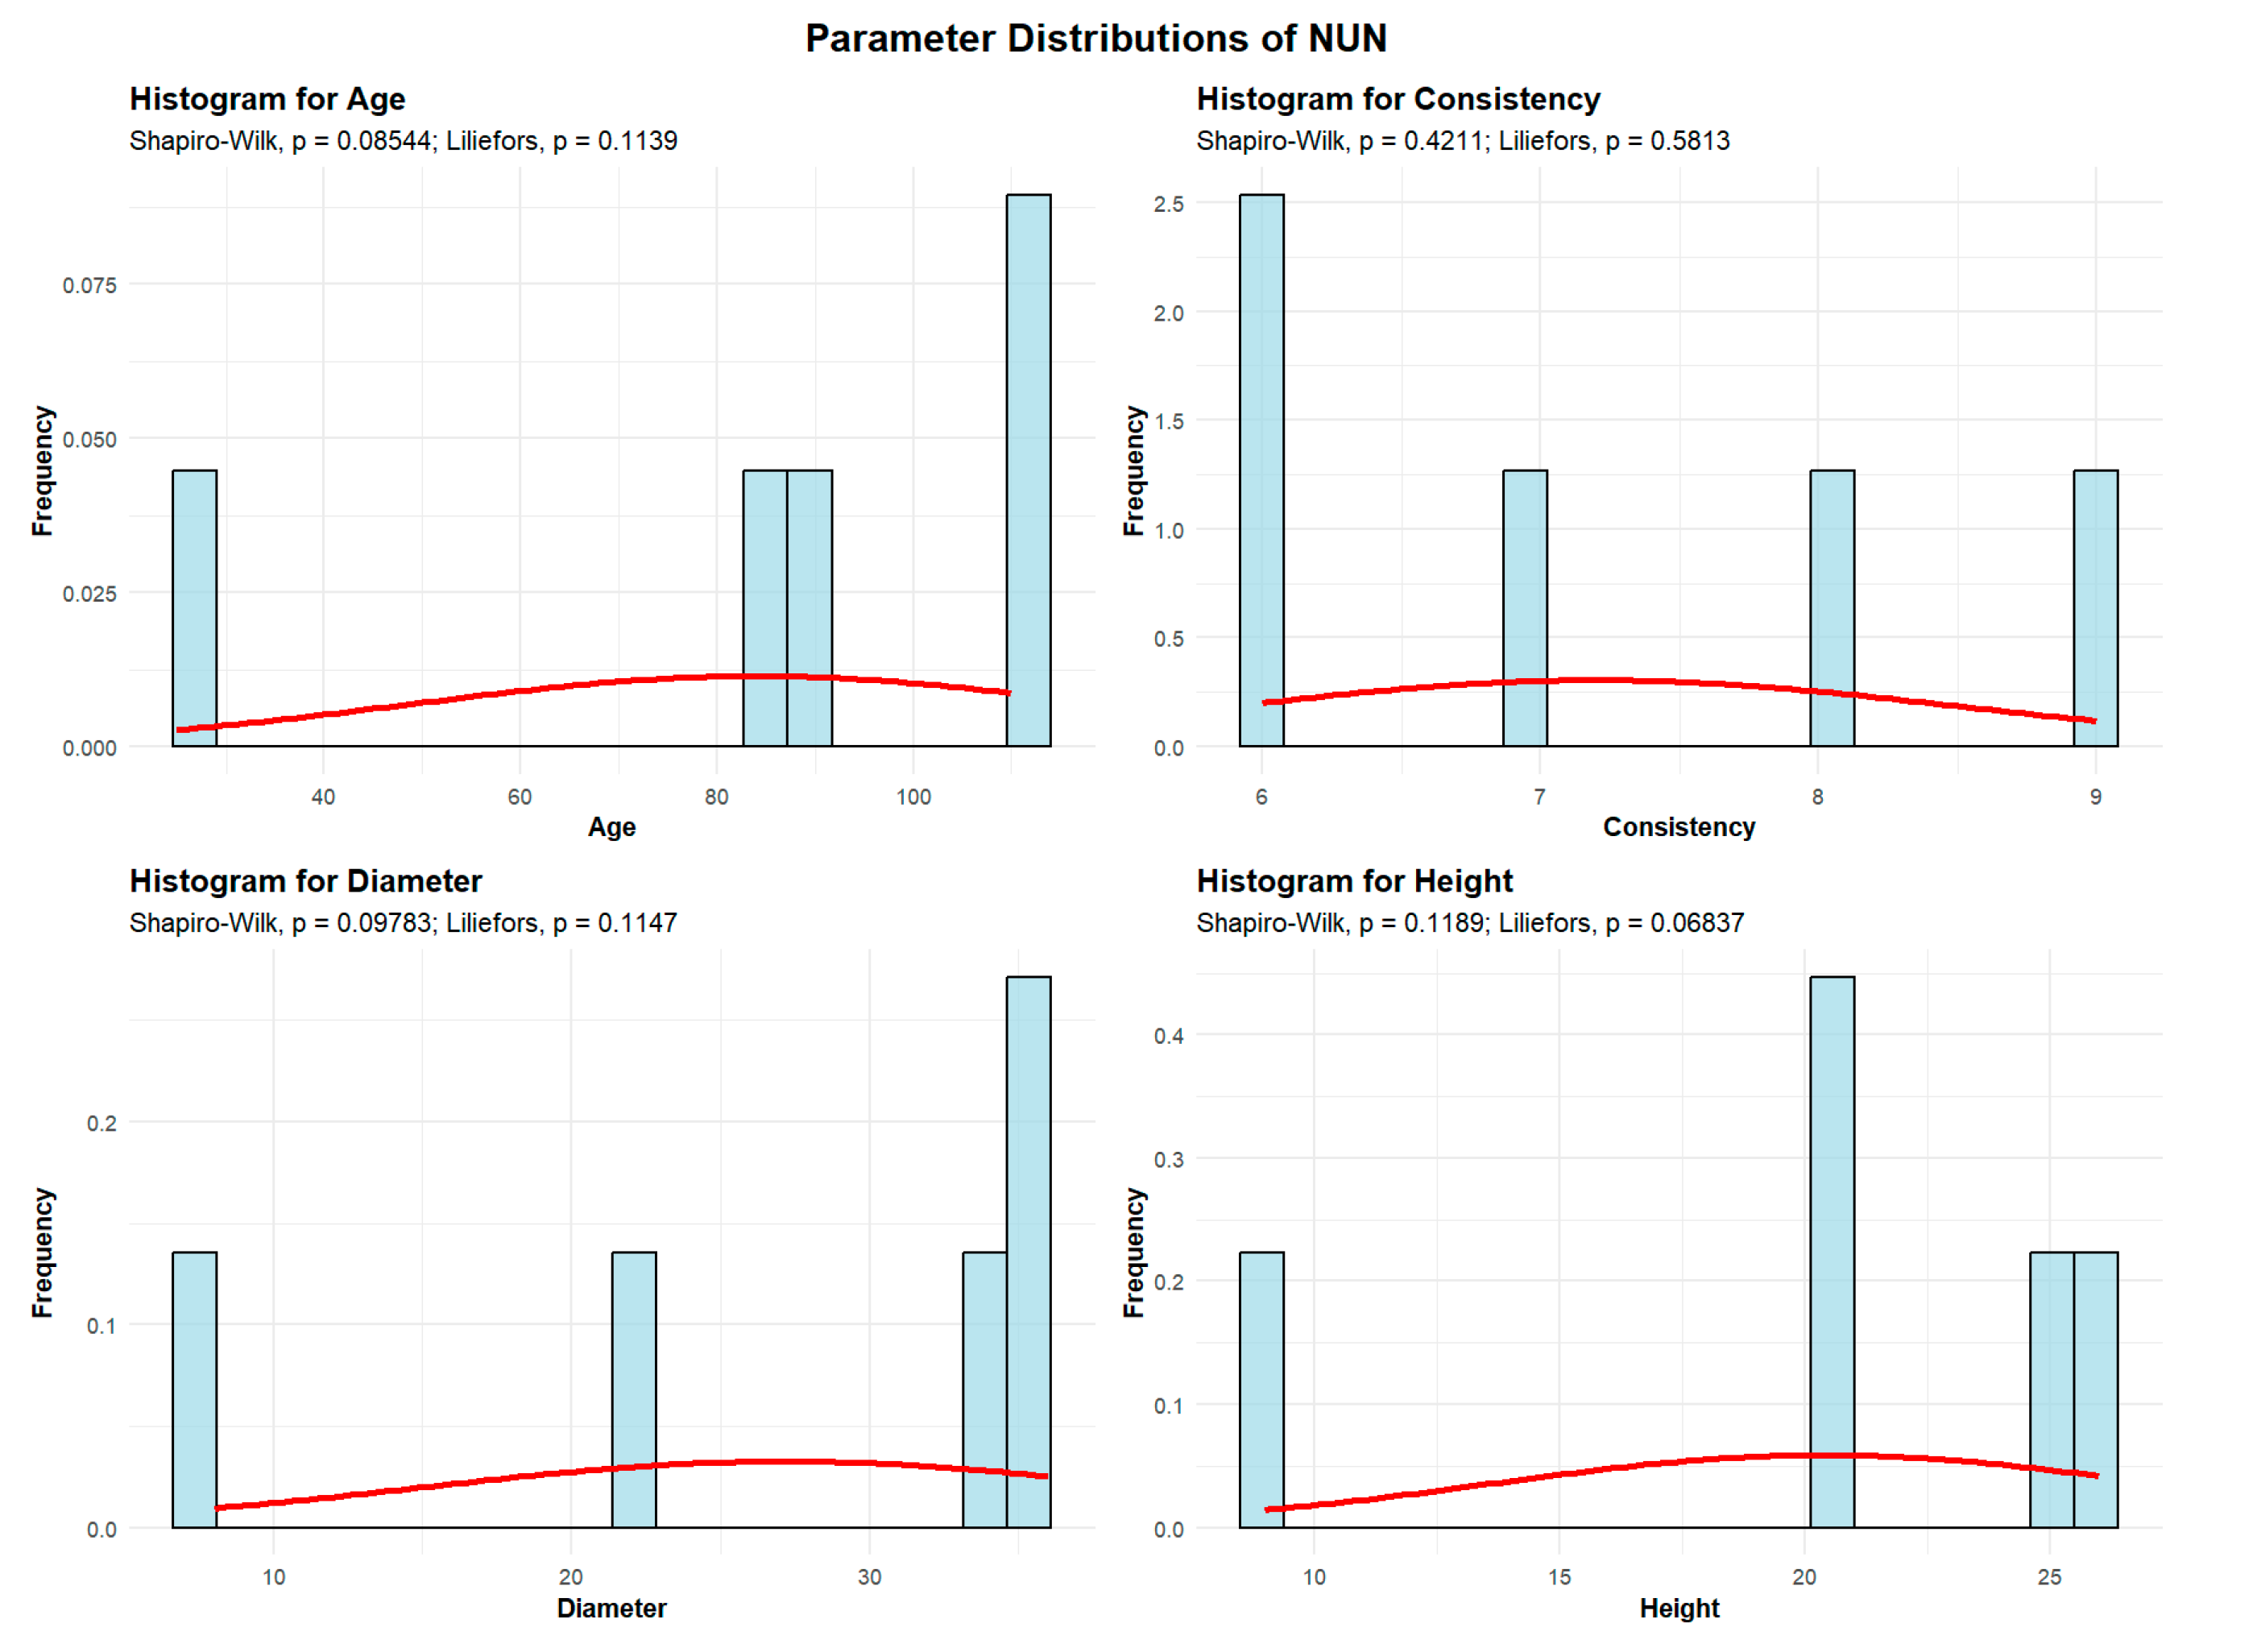
2.2.6.2. Black Walnut (Juglans nigra)—NUN
Descriptive analyses were conducted for the variables age, consistency, diameter, and height to summarize their central tendency, variability, and distributional characteristics within the sample, as shown in
Figure 12.
The mean age of the NUN is 84 years. The standard deviation of NUN age across the studied plots is 34.89 years. One plot contains NUN with an average age of 25 years, while 4 plots (80%) contain NUN with an average age greater than 80 years.
The mean NUN consistency of stand-density values is 7.2, with a standard deviation of 1.30, meaning that all 5 plots show degraded NUN consistency.
NUN exhibit an average trunk diameter of 27.2 cm with a standard deviation of 12.21 cm. This means that tree mean diameters vary significantly, ranging from as small as 8 cm to as large as 36 cm.
The average height of the NUN is 20.04 m, with a standard deviation of 6.76 m, and in all 5 plots, the average height remains below 30 m.
2.2.7. Prunus Genus Tree Population Descriptive Statistics
The descriptive statistics for the Prunus population refer to Wild cherry (Prunus avium) – CI, which was identified in only 3 plots within the Green Forest stand.
The mean age of the CI is 73.33 years, with a standard deviation of 20.81 years. One plot contains CI with an average age of 50 years, while the other two plots contain CI with an average age greater than 80 years.
The mean CI consistency of stand-density values is 9.33, with a standard deviation of 4.16, meaning that all 3 plots show degraded CI consistency.
CI exhibit an average trunk diameter of 22 cm, with a standard deviation of 9.45 cm. The minimum average trunk diameter is 18 cm, while the maximum reaches 36 cm.
The average height of the CI is 19.33 m, with a standard deviation of 2.08 m. The minimum average height recorded is 17 m, and the maximum is 21 m.
2.2.8. Carpinus Genus Tree Population Descriptive Statistics
The descriptive statistics for the Carpinus population refer to Hornbeam (Carpinus betulus) – CA, which was identified in only 4 plots within the Green Forest stand.
The mean age of the CA is 51.25 years, with a standard deviation of 32.24 years. In two plots, CA have an average age of up to 30 years, while in the other two plots, the average CA age ranges from 60 to 90 years.
The mean CA consistency of stand-density values is 6.75, with a standard deviation of 1.5, meaning that all 4 plots show degraded CA consistency.
CA exhibit an average trunk diameter of 23.5 cm, with a standard deviation of 10.63 cm. The minimum average trunk diameter is 12 cm, while the maximum reaches 36 cm. The average height of the CA is 16.25 m, with a standard deviation of 6.13 m. The minimum average height recorded is 10 m, and the maximum is 22 m.
2.2.9. Gleditsia Genus Tree Population Descriptive Statistics
The descriptive statistics for the Gleditsia population refer to honey locust (Gleditsia triacanthos) - GL, which was identified in only 3 plots within the Green Forest stand. The mean age of the GL is 58.33 years, with a standard deviation of 2.88 years. The mean GL consistency of stand-density values is 7, with no variation across plots, meaning that all 3 plots show degraded GL consistency.
GL exhibit an average trunk diameter of 20.66 cm, with a standard deviation of 3.05 cm. The minimum average trunk diameter is 18 cm, while the maximum reaches 24 cm. The average height of the GL is 16.33 m, with a standard deviation of 1.52 m. The minimum average height recorded is 15 m, and the maximum is 18 m.
2.2.10. Pyrus Genus Tree Population Descriptive Statistics
The descriptive statistics for the Pyrus population refer to European wild pear (Pyrus pyraster) – PR, which was identified in only 2 plots within the Green Forest stand. The mean age of the PR is 77.5 years.
The mean PR consistency of stand-density values is 8, with no variation across plots, indicating degraded PR consistency in the 2 plots.
PR exhibit an average trunk diameter of 26 cm; the minimum average trunk diameter is 22 cm, while the maximum reaches 30 cm.
The average height of the PR is 22.5 m, with a minimum of 19 m and a maximum of 26 m.
2.2.11. Tilia Genus Tree Population Descriptive Statistics
The descriptive statistics for the Tilia population refer to silver linden (Tilia argentea) – TE, which was identified in only one plot within the Green Forest stand. Its characteristics are as follows: the mean age is 90 years, the mean trunk diameter is 36 cm, the mean height is 25 m, and the mean consistency value is 6, indicating a degraded canopy.
2.2.12. Castanea Genus Tree Population Descriptive Statistics
The descriptive statistics for the Castanea population refer to sweet chestnut (Castanea sativa) – CAS, which was identified in only one plot within the Green Forest stand. Its characteristics are as follows: the mean age is 90 years, the mean trunk diameter is 36 cm, the mean height is 21 m, and the mean consistency value is 6, indicating a degraded canopy.
2.2.13. Picea Genus Tree Population Descriptive Statistics
The descriptive statistics for the Picea population refer to Norway spruce (Picea abies) – MO, which was identified in only one plot within the Green Forest stand. Its characteristics are as follows: the mean age is 90 years, the mean trunk diameter is 34 cm, the mean height is 24 m, and the mean consistency value is 6, indicating a degraded canopy.
2.2.14. Taxus Genus Tree Population Descriptive Statistics
The descriptive statistics for the Taxus population refer to English yew (Taxus baccata) – TI, which was identified in only one plot within the Green Forest stand. Its characteristics are as follows: the mean age is 90 years, the mean trunk diameter is 34 cm, the mean height is 24 m, and the mean consistency value is 6, indicating a degraded canopy.
2.2.15. Pinus Genus Tree Population Descriptive Statistics
Pinus genus tree populations identified in the Green Forest are represented by the Black pine (Pinus nigra) – PIN and the Scots pine (Pinus sylvestris) – PI.
2.2.15.1. Black Pine (Pinus nigra)
PIN was identified in only one plot within the Green Forest stand. Its characteristics are as follows: the mean age is 80 years, the mean trunk diameter is 32 cm, the mean height is 21 m, and the mean consistency value is 6, indicating a degraded canopy.
2.2.15.2. Scots Pine (Pinus sylvestris)
PI was identified in only one plot within the Green Forest stand. Its characteristics are as follows: the mean age is 90 years, the mean trunk diameter is 34 cm, the mean height is 24 m, and the mean consistency value is 6, indicating a degraded canopy.
2.2.16. Pseudotsuga Genus Tree Population Descriptive Statistics
The descriptive statistics for the Pseudotsuga population refer to Douglas fir (Pseudotsuga menziesii) – DU, which was identified in only one plot within the Green Forest stand. Its characteristics are as follows: the mean age is 90 years, the mean trunk diameter is 34 cm, the mean height is 24 m, and the mean consistency value is 6, indicating a degraded canopy.
2.3. Principal Component Analysis and Cluster Analysis
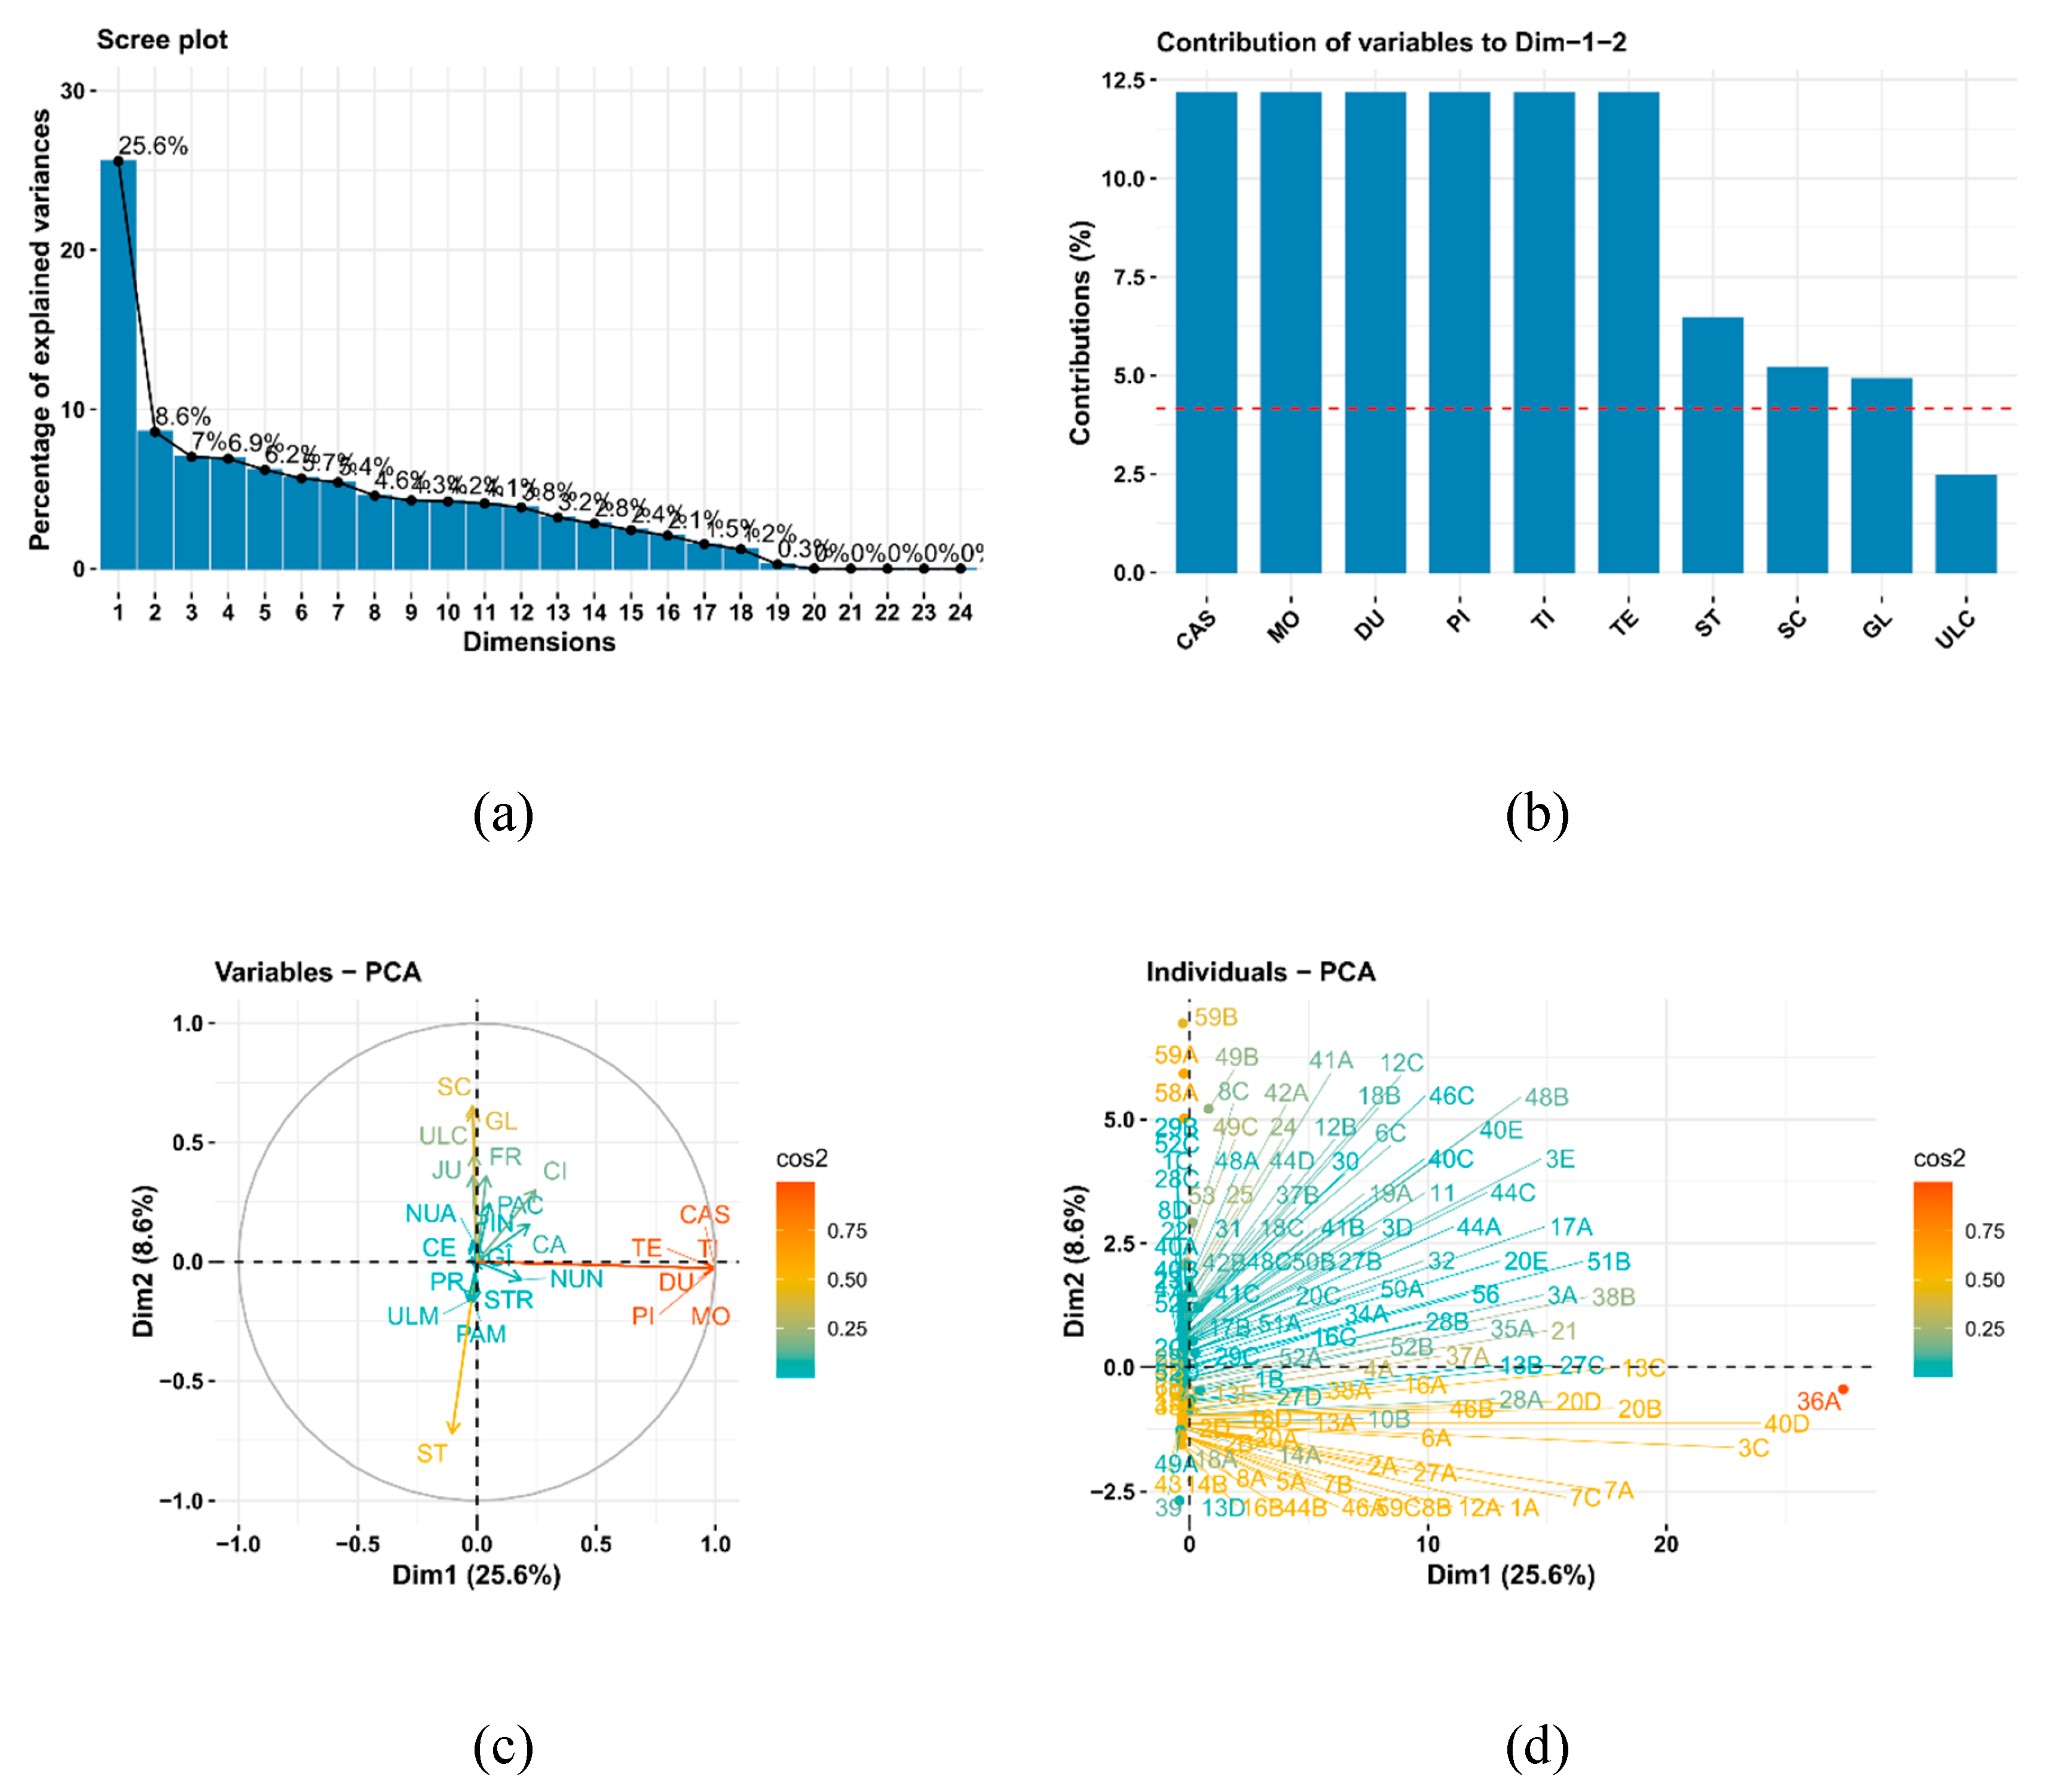
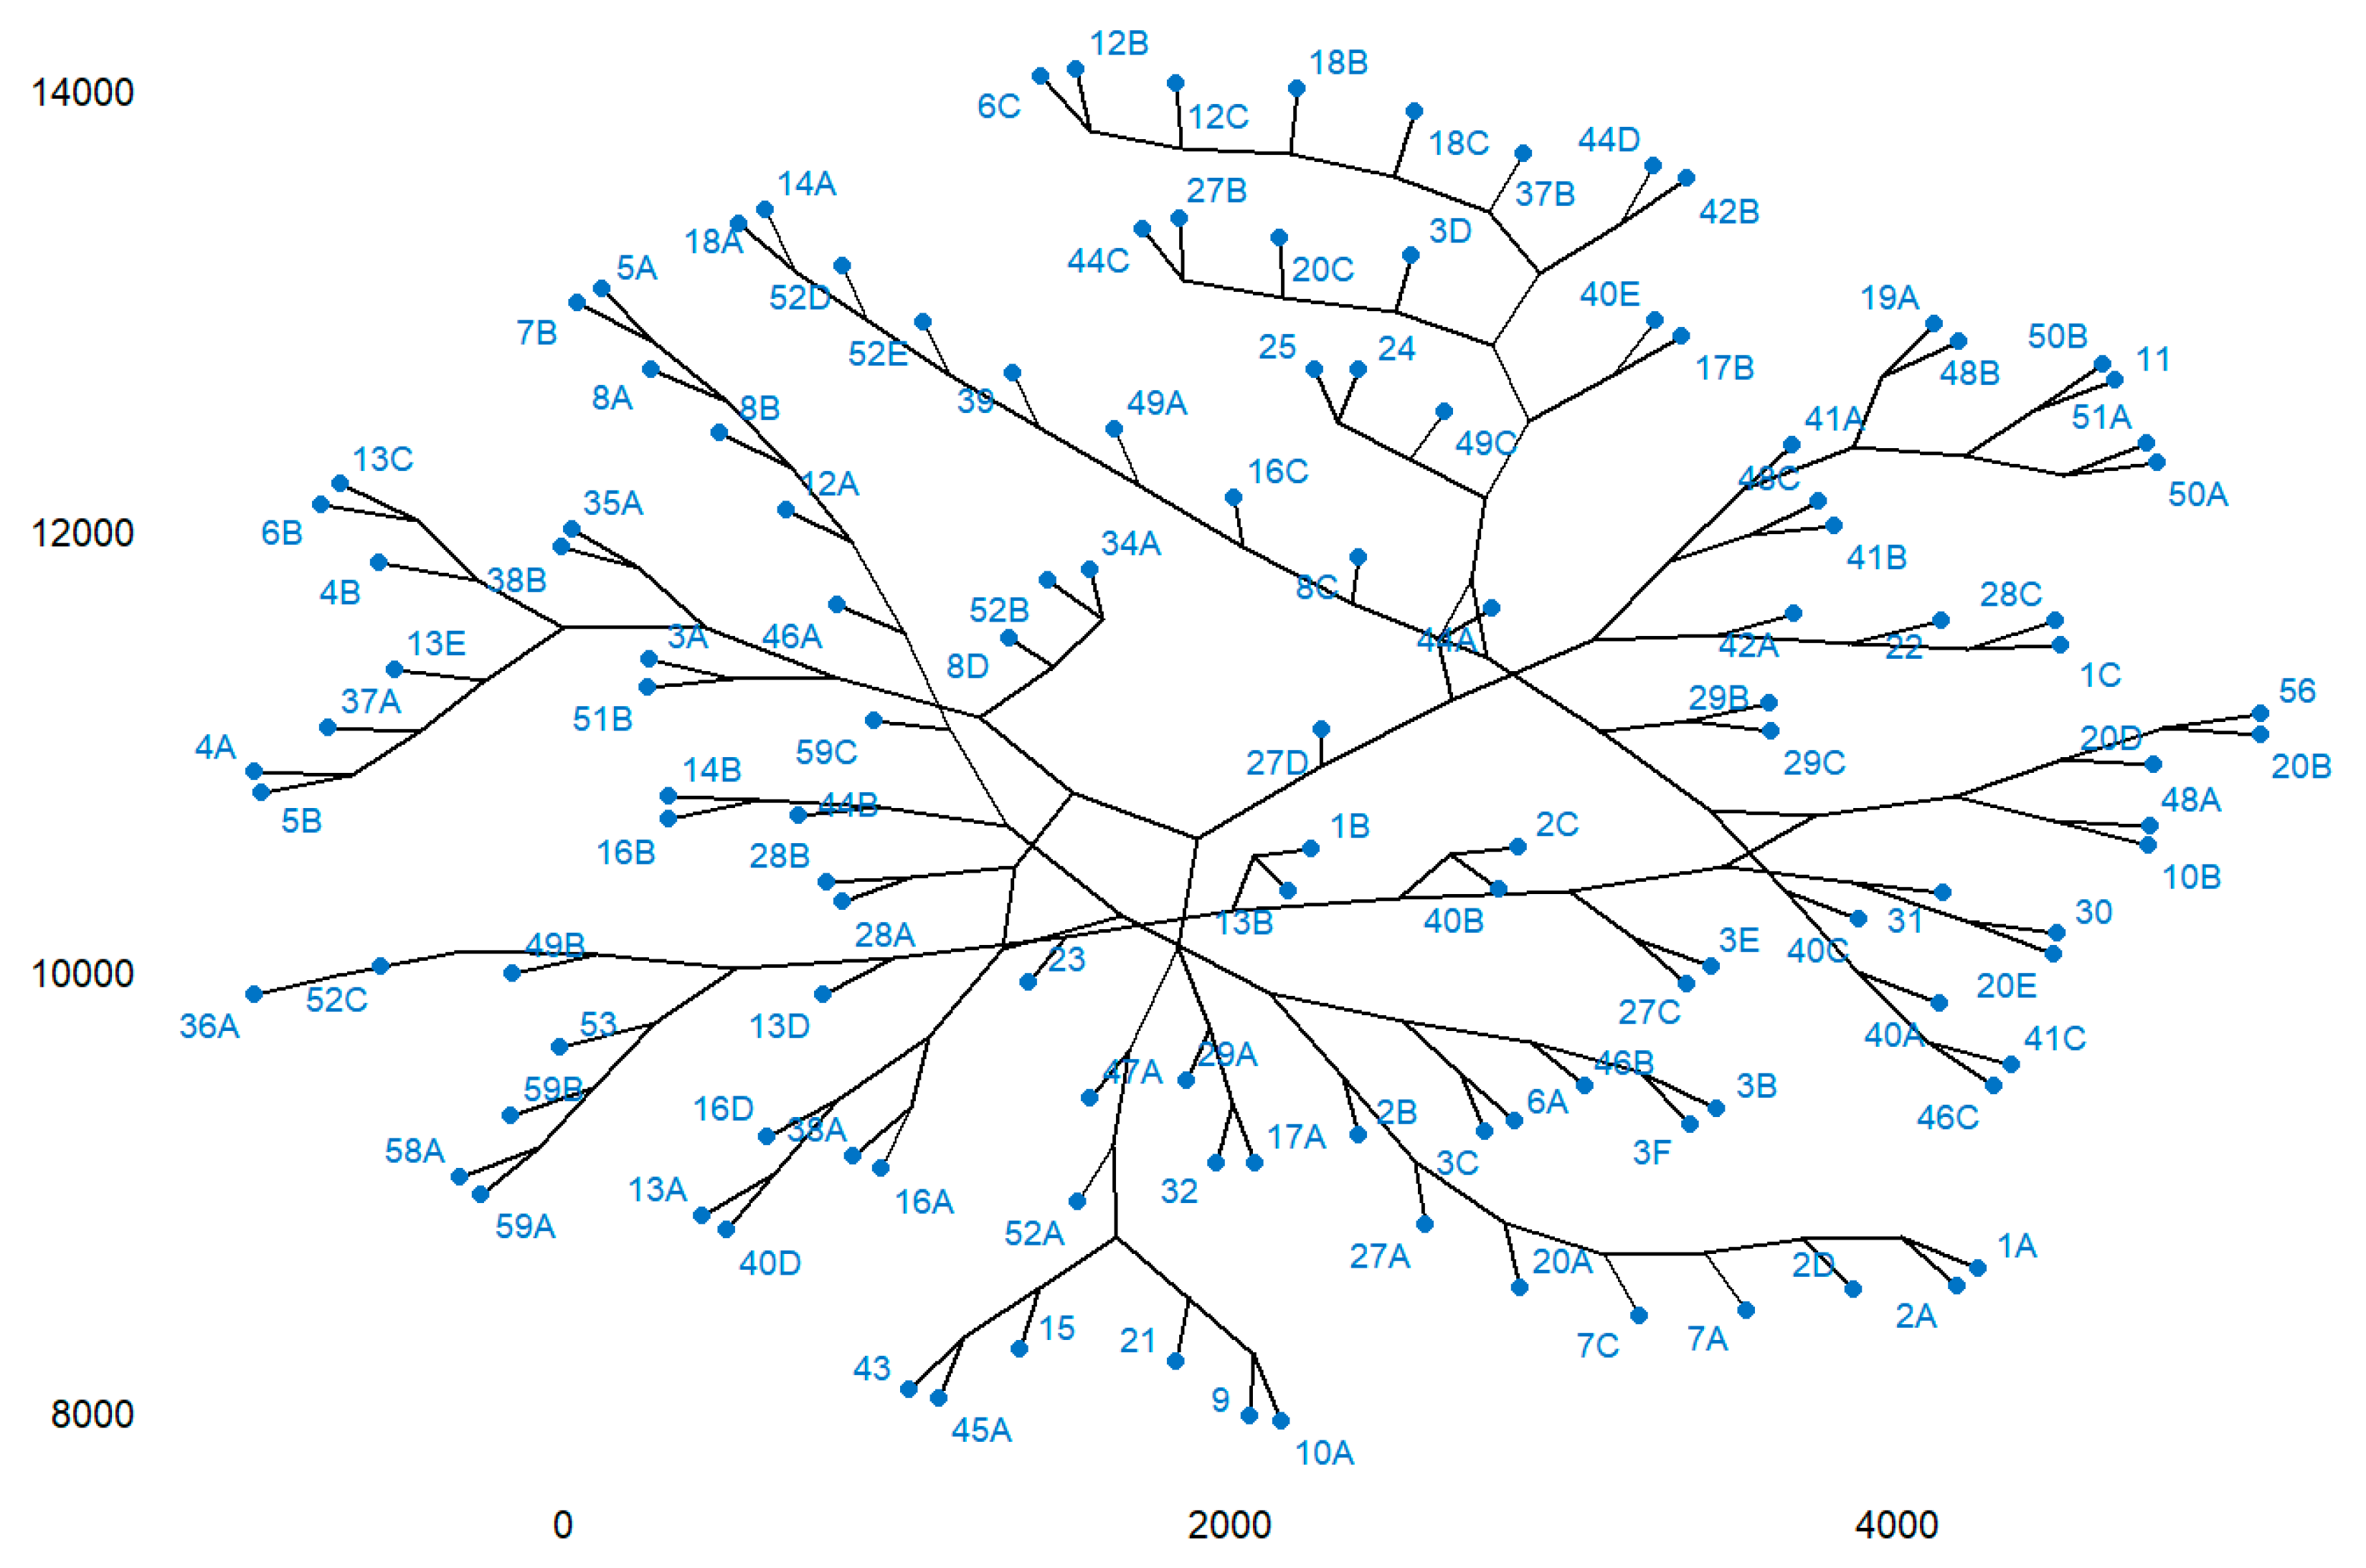
The inertia of the first principal components indicates strong relationships among variables and suggests the number of components to examine. The first two principal components of analysis account for 30.4% of the total dataset inertia; this means that 30.4% of the individual’s total cloud variability is explained by the plane spanned by the first two principal components (
Figure 13(a)). The first plane represents data variability well.
The first principal component is significant, accounting for 21.9% of the data variability (
Figure 13(a)). This observation suggests that this axis carries great information. The most significant contributions to this component come from the following variables: CAS, TE, MO, DU, PI, and TI, which are highly correlated with this dimension. These variables could therefore summarize dimension 1 (
Figure 13(b) and 13(c)). Dimension 1 opposes individuals such as 6C, 12B, 12C, 18B, 42B, 44D, and 16C (to the right of the graph, characterized by a strongly positive coordinate on the axis) to individuals characterized by a strongly negative coordinate on the axis (to the left of the graph). The group in which the individual 16C stands (characterized by a positive coordinate on the axis) shares high values for the variables ULM, AR, and CE (the variables are sorted from the strongest). The group, comprising individuals 6C, 12B, 12C, 18B, 42B, and 44D (characterized by a positive coordinate on the axis), exhibits high values for the variable FR and low values for the variable ST (
Figure 13(d)).
The second principal component accounts for 8.5% of the data variability (
Figure 13(a)). The most important contribution of this component comes from the variables
AR, ULC, SC, ST, GL, CI, and JU, which are all highly correlated with this dimension (
Figure 13(b) and 13(c)). These variables could therefore be used to summarize dimension 2.
Cluster analysis is presented in
Figure 14. This highlights the clustering of plots according to the studied variables in 7 clusters as follows:
Cluster 1 includes the following plots: 1A, 1B, 1C, 2A, 2B, 2C, 2D, 3A, 3B, 3C, 3D, 3E, 3F, 4A, 4B, 5A, 5B, 6A, 6B, 6C, 7A, 7B, 7C, 8A, 8B, 8C, 8D, 9, 10A, 10B, 11, 12A, 12B, 12C, 13A, 13B, 13C, 13E, 14A, 14B, 15, 16A, 16B, 16C, 16D, 17A, 17B, 18A, 18B, 18C, 19A, 20A, 20B, 20C, 20D, 20E, 21, 22, 24, 25, 27A, 27B, 27C, 27D, 28A, 28B, 28C, 29A, 29B, 29C, 30, 31, 32, 34A, 35A, 37A, 37B, 38A, 38B, 39, 40A, 40B, 40C, 40D, 40E, 41A, 41B, 41C, 42A, 42B, 43, 44A, 44B, 44C, 44D, 45A, 46A, 46B, 46C, 47A, 48A, 48B, 48C, 49A, 49C, 50A, 50B, 51A, 51B, 52A, 52B, 52D, 52E, 56, 59C.
Cluster 2 includes plot 13D.
Cluster 3 includes plot 23.
Cluster 4 includes plot 36A
Cluster 5 includes plot 49B
Cluster 6 includes plot 52C
Cluster 7 includes the following plots: 53, 58A, 59A, 59B.
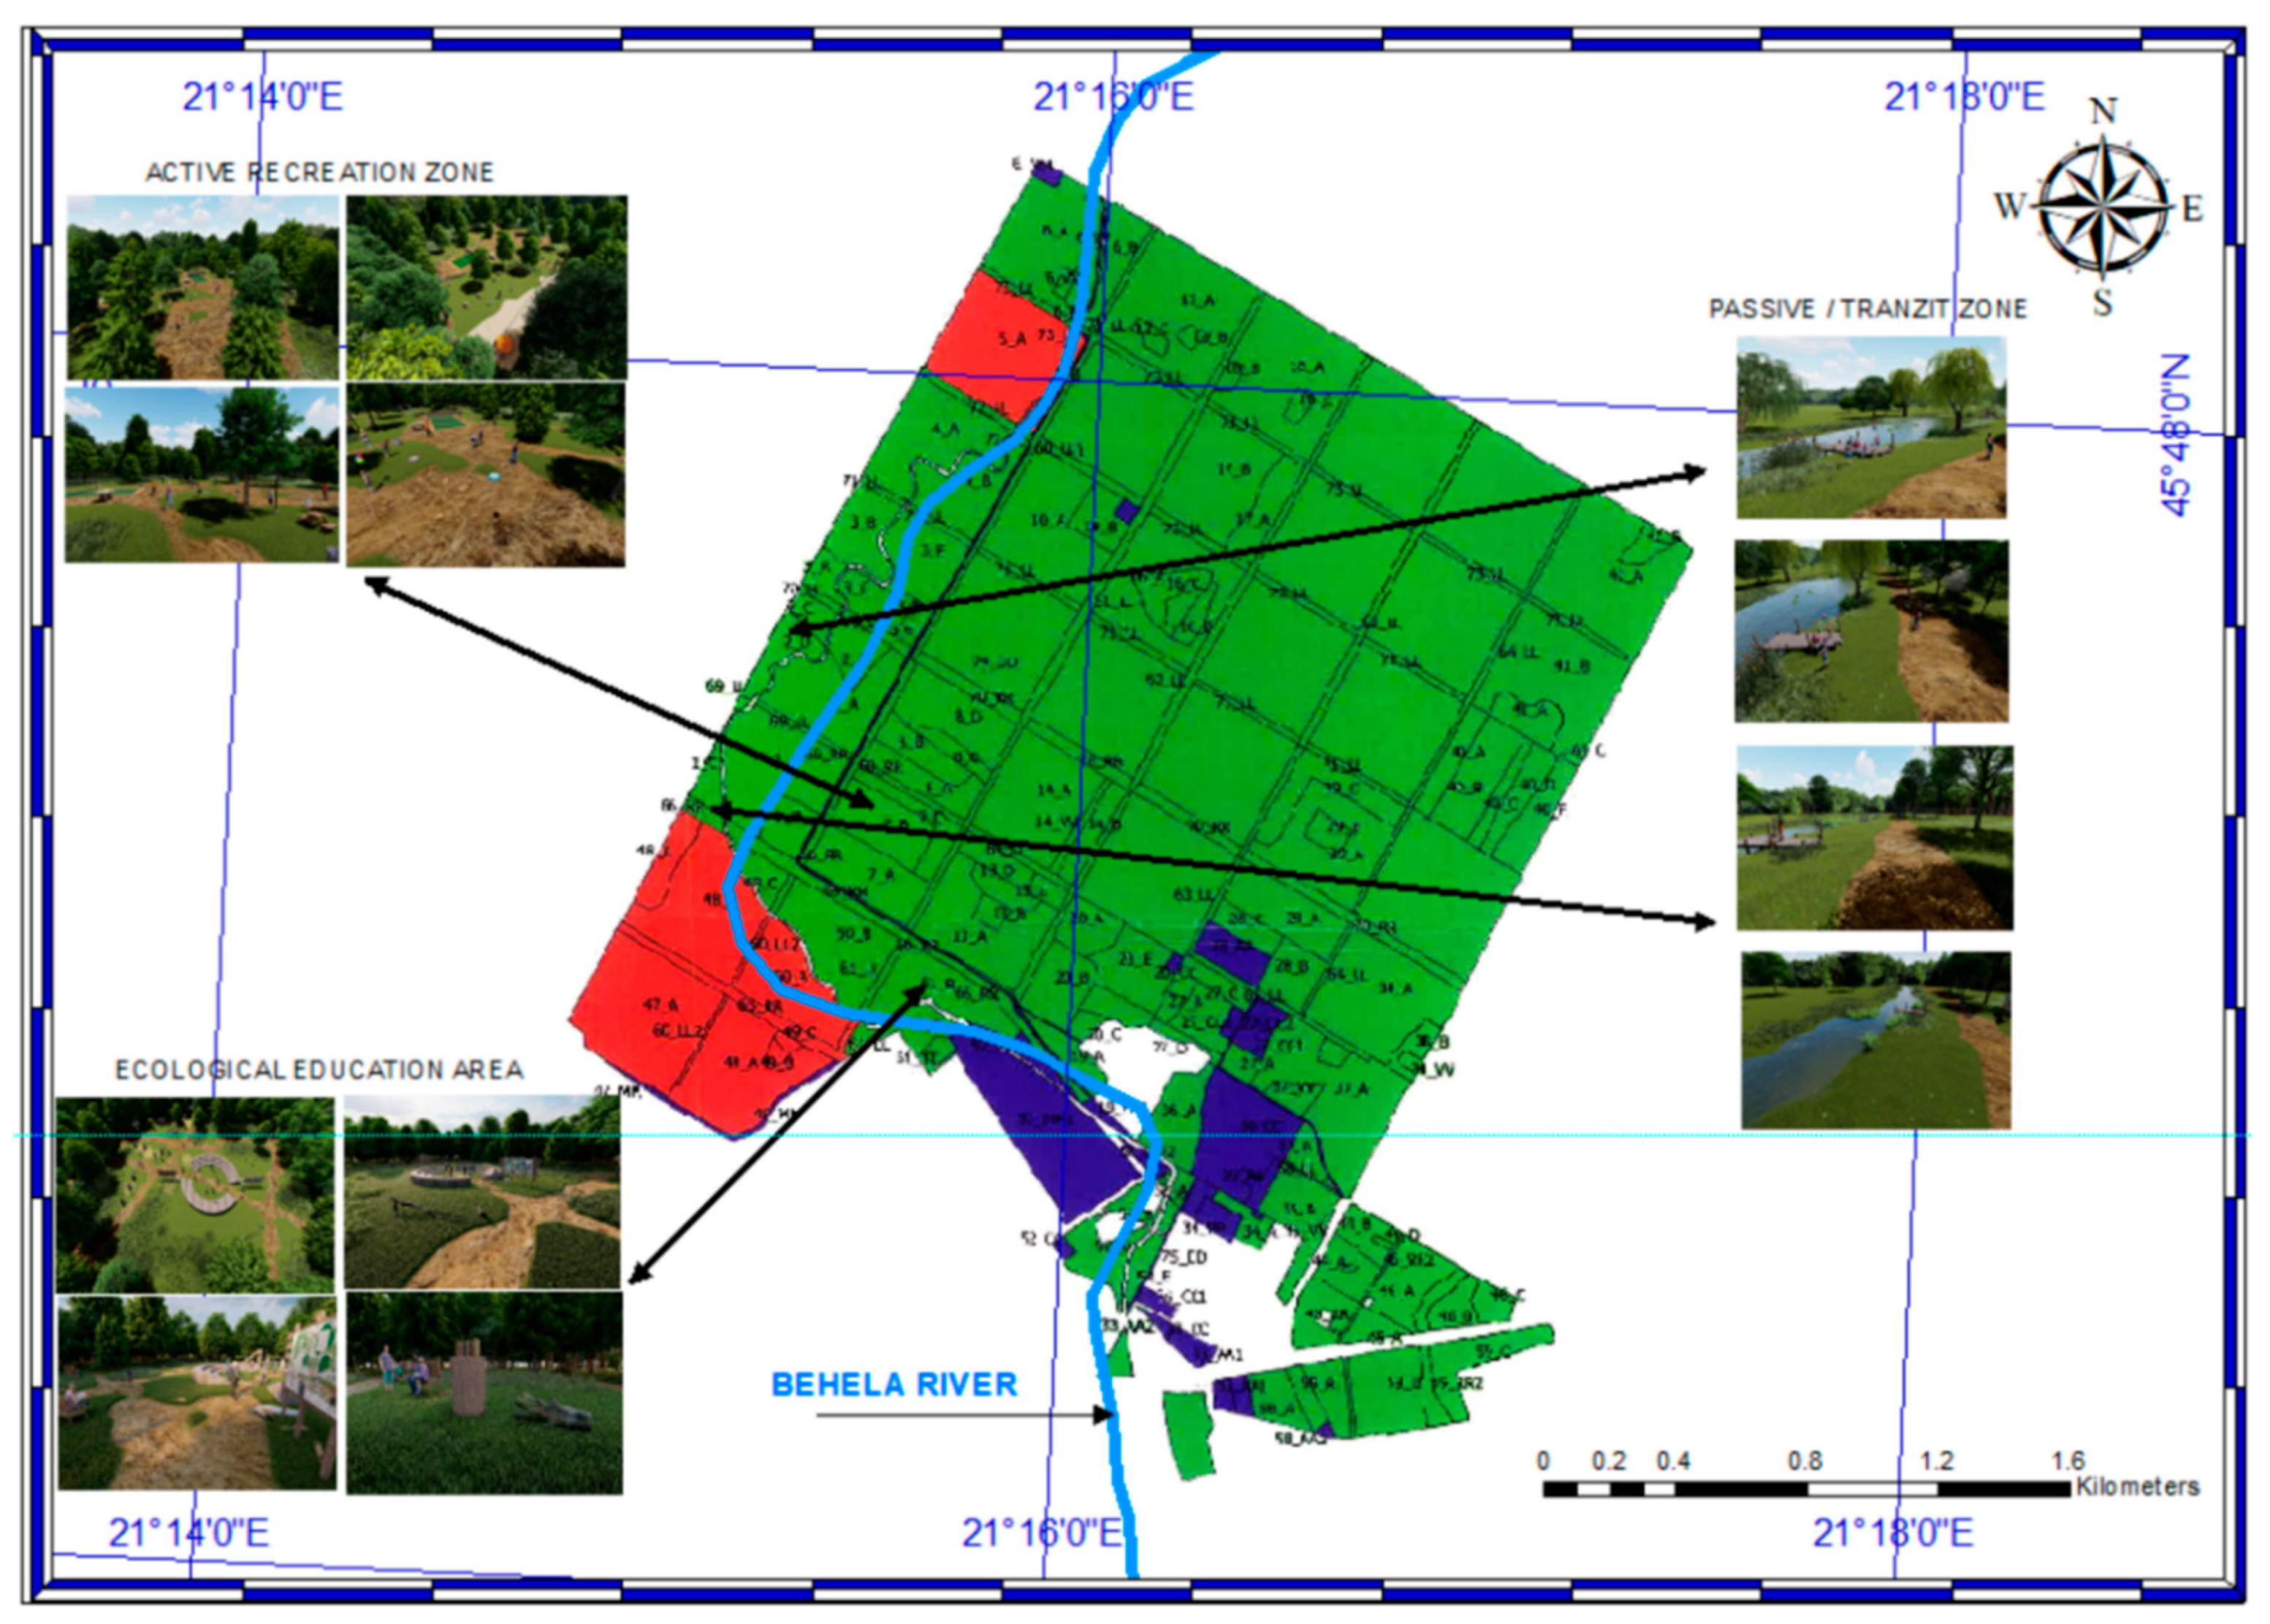
2.4. Landscape Architecture Design Proposals
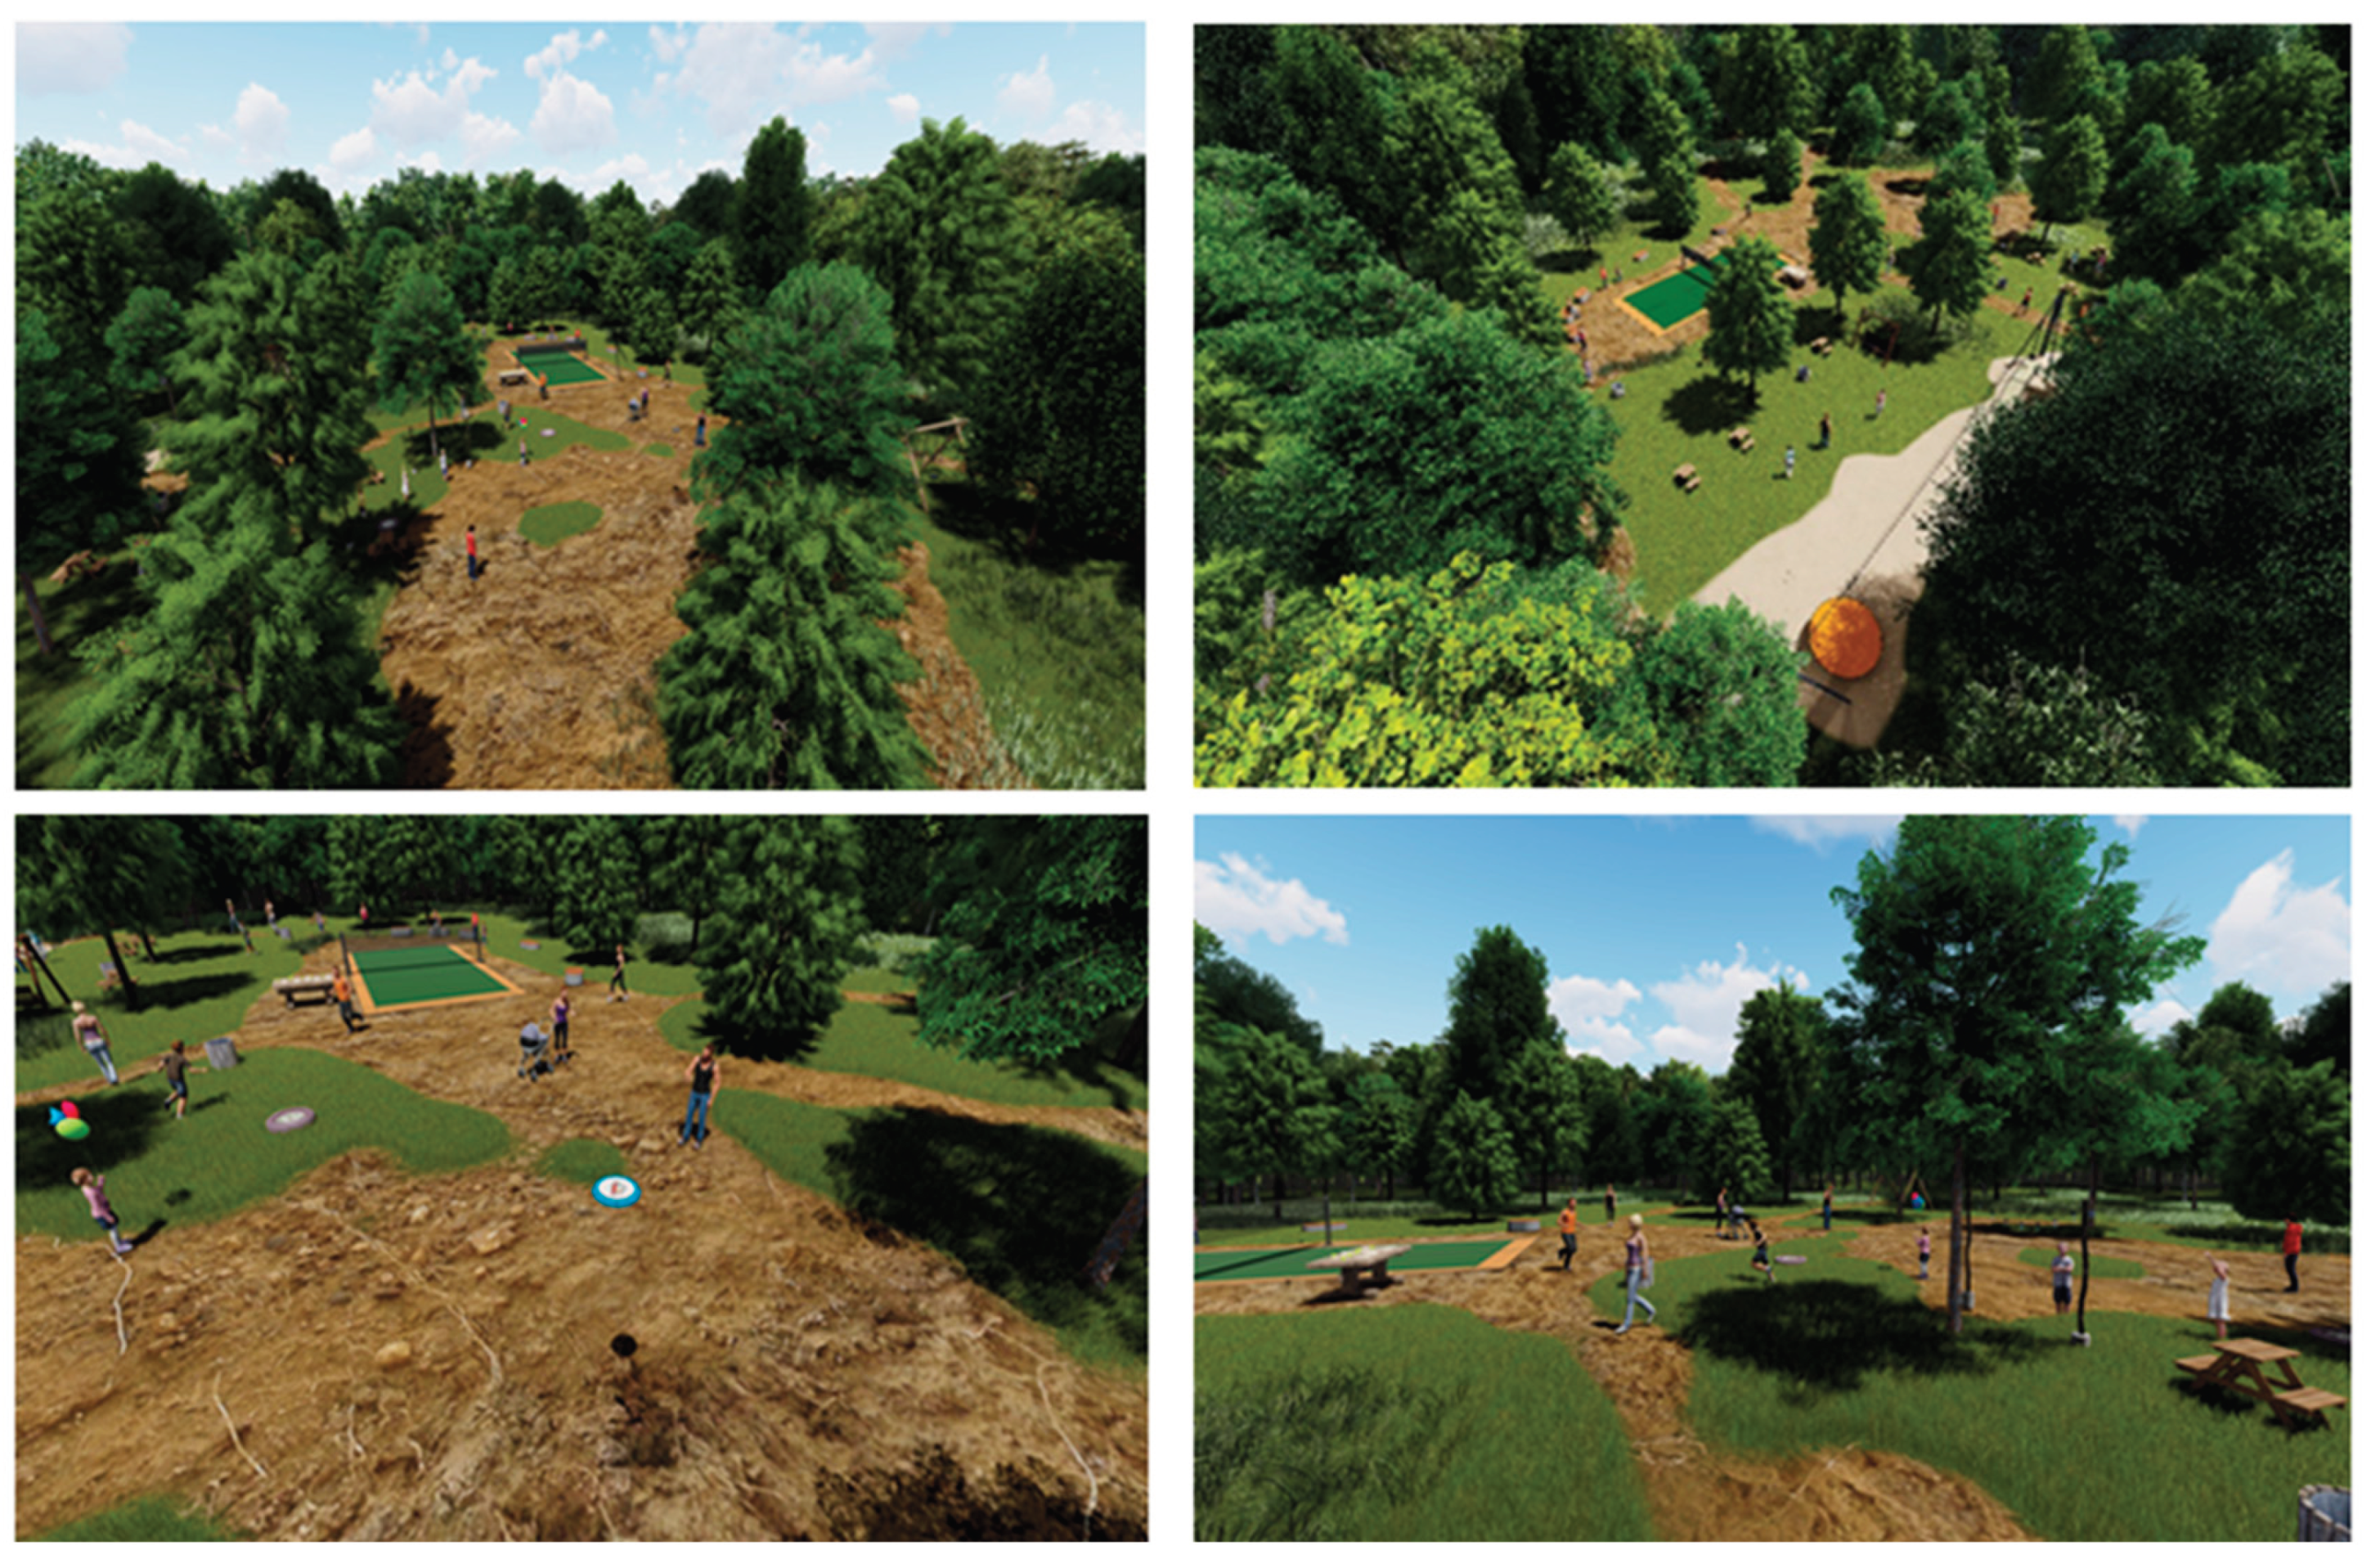
To provide psychological and physical benefits to all types of residents and facilitate a diverse range of human–nature interactions, three functionally distinct zones were delineated within Green Forest, as illustrated in
Figure 15.
Each zone is designed to support a specific mode of engagement with the forest landscape, thereby accommodating multiple user needs and experiential preferences. The Ecological education area prioritizes scientific inquiry and knowledge dissemination, the Passive/Transit zone provides opportunities for contemplative experience, and the Active recreation zone supports more intensive forms of environmental engagement and physical activity. All zones were designed following natural vegetation lines, and we proposed using natural materials such as durable wood for urban furniture elements, the open library, signage, and playground equipment, and porous materials like tree bark and sand for pedestrian and bicycle paths, allowing water to infiltrate into the soil. Additionally, ecological toilets and recycling bins were integrated into the design to promote proper waste management and encourage environmental stewardship throughout the forest. These elements are designed to complement the active and passive recreation zones and the ecological education areas, creating a harmonious balance among leisure, learning, and conservation.
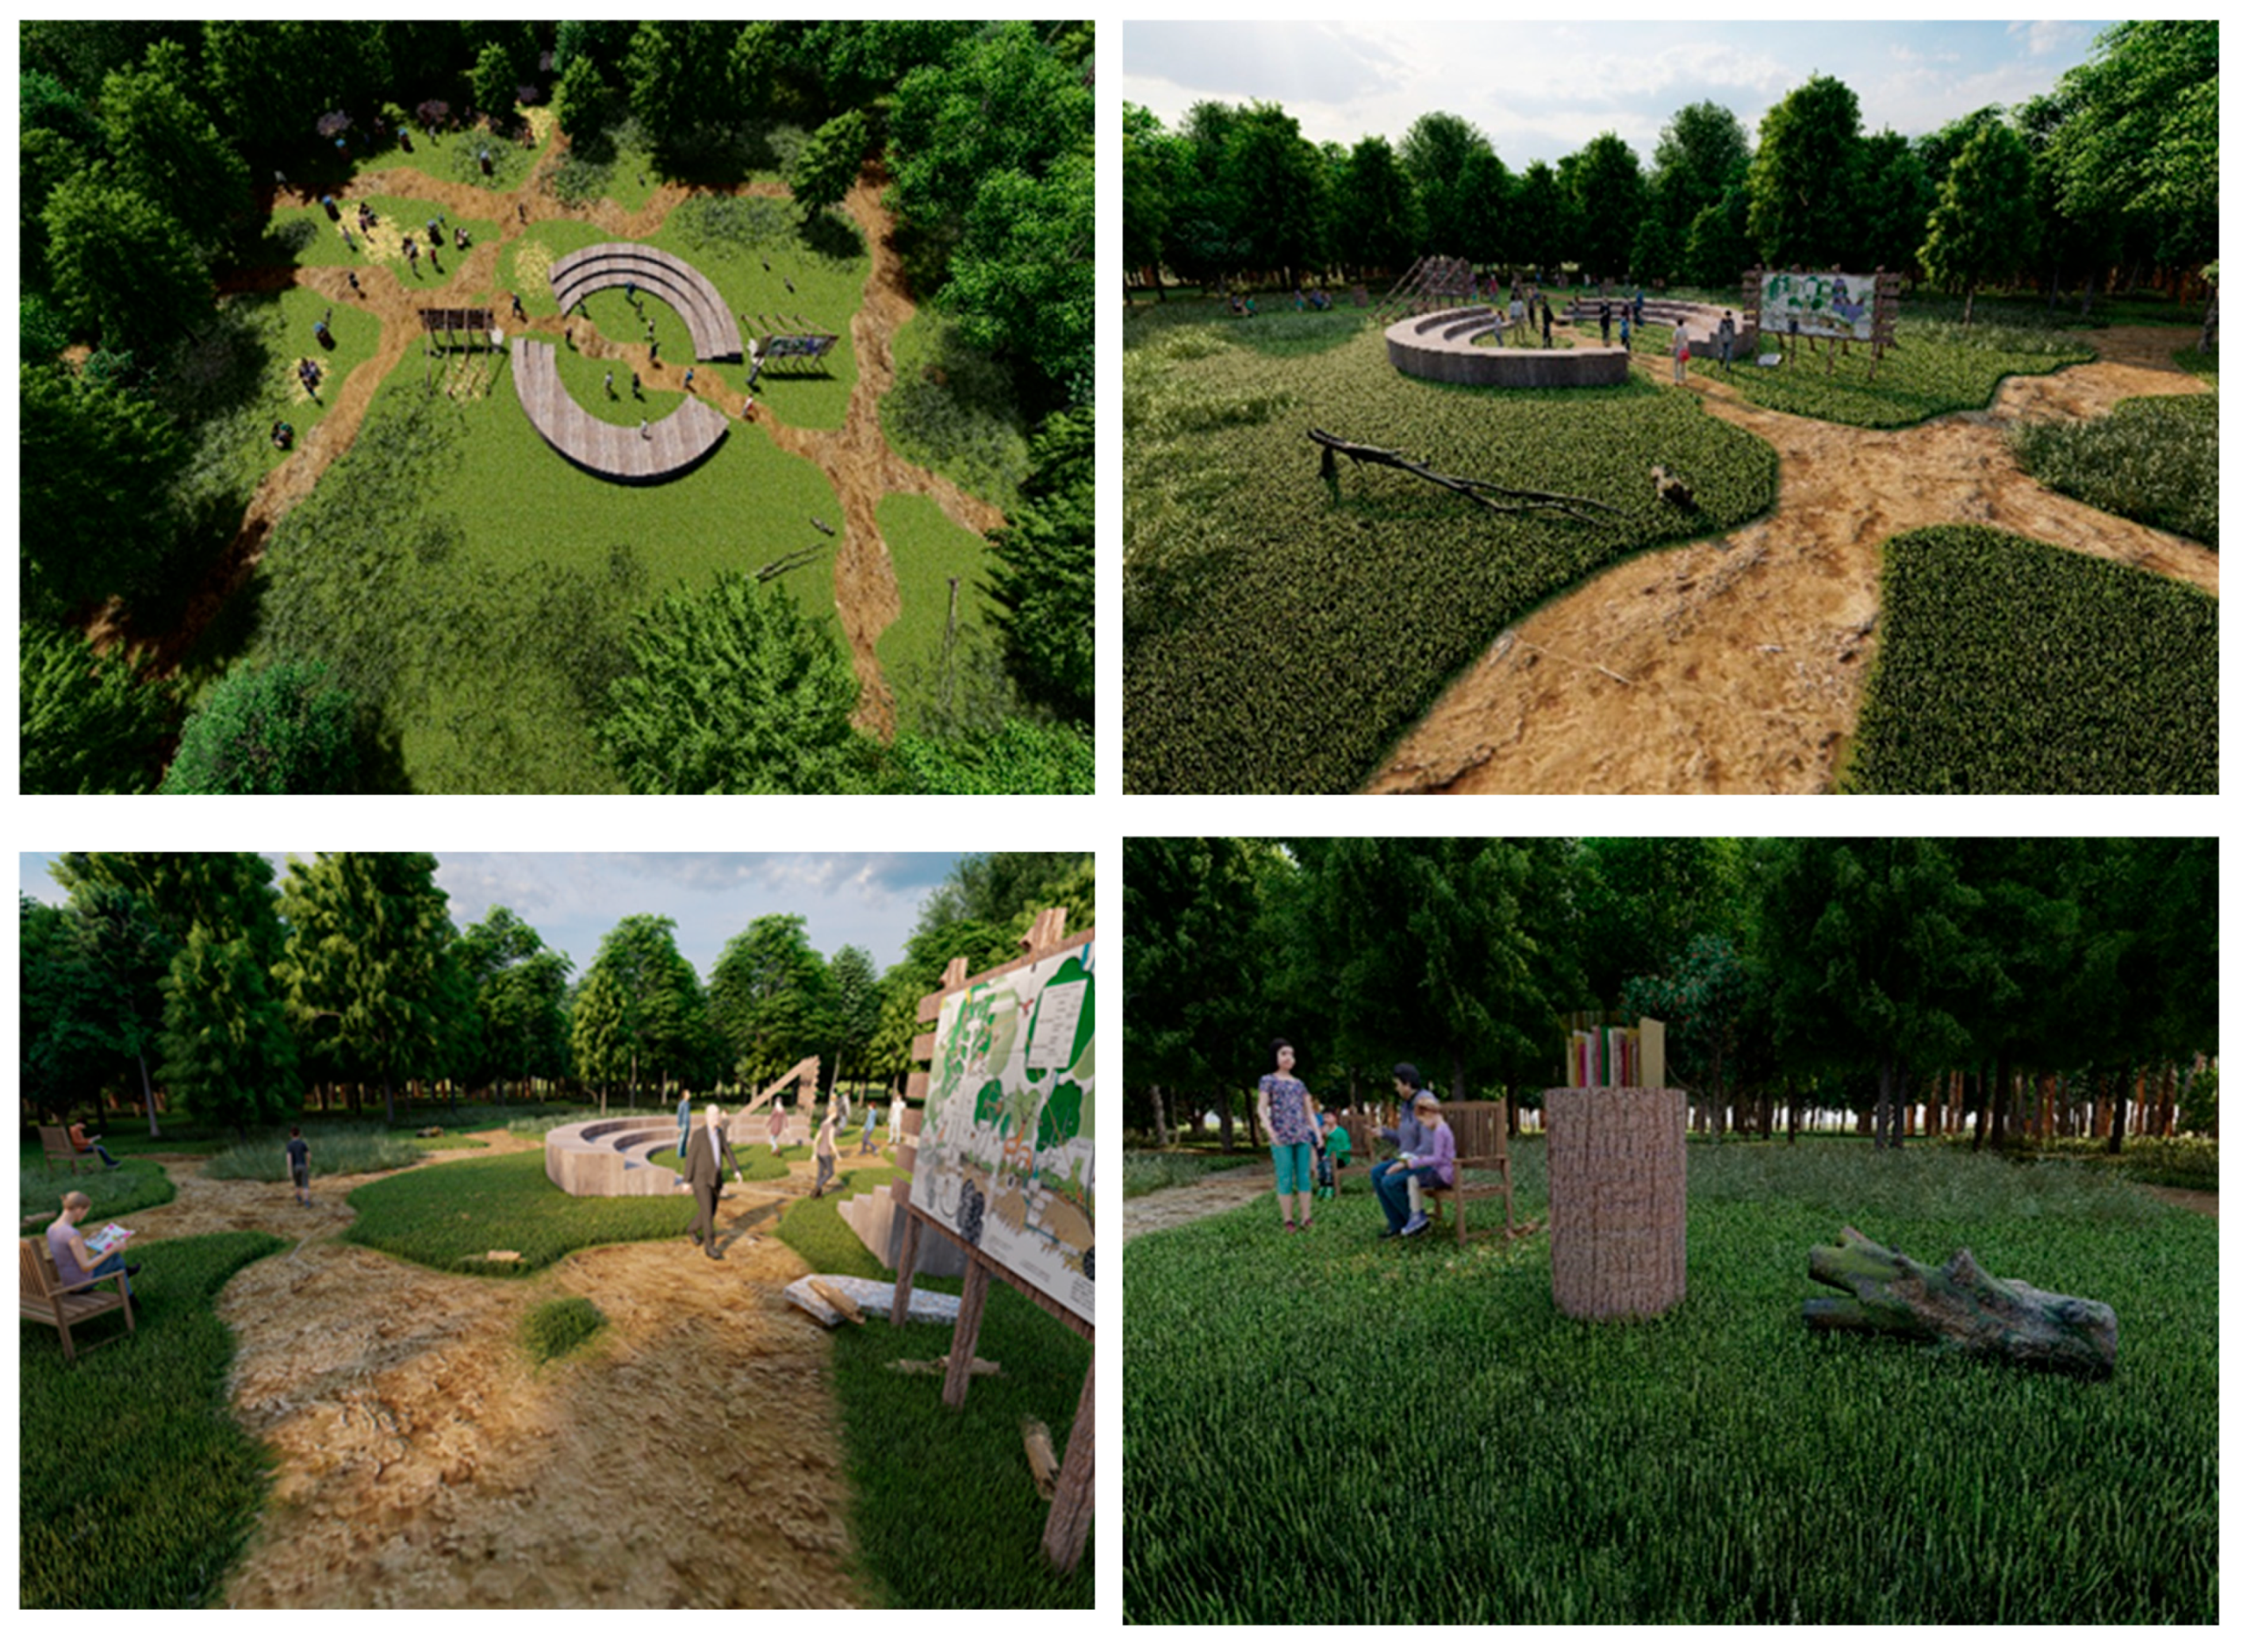
2.4.1. The Ecological Education Area
As the forest ecosystem, comprising a diverse range of flora and fauna, serves as an ecological catalyst for profound, awe-inspiring, and meaningful nature experiences, we design an Ecological education area within the Green Forest as a valuable opportunity to connect the community with nature and to cultivate learning in the open air, as illustrated in
Figure 16. We conceived this space as an outdoor University of Life Science designed for learners of all ages, from preschool children to experienced researchers, who seek to study the forest ecosystem directly within the forest itself. The focal point of the composition is an open-air amphitheater, a proper space for educational presentations, performances, cultural activities, and workshops. Adjacent to the amphitheater, we proposed a reading area, equipped with benches and tables suitable for outdoor study and reflection. This space will include a thematic selection of books on the natural sciences with varying levels of complexity, addressing all age groups, as well as forest-inspired stories rooted in the local cultural landscape, thereby stimulating curiosity and engagement among visitors of all ages. The intention is that, through organized reading sessions, the space will promote critical thinking, creativity, and dialogue within the community. To better understand Green Forest’s biodiversity, we have proposed two informative panels that highlight the unique characteristics of its flora and fauna. These panels will present information on the taxonomic classification, origin, distribution, and morphology of selected species, as well as their ecological importance within the urban landscape. They will include illustrations and graphic elements depicting trees, shrubs, herbs, insects, birds, and mammals that inhabit Green Forest, highlighting each species’ role in maintaining a healthy, balanced ecosystem. By developing this educational recreation area, we aim to create a functional space that inspires respect for nature, stimulates scientific curiosity, and fosters a desire to learn. In doing so, the area will become a community gathering place where every visitor can connect with the forest, gain new knowledge, and enjoy the present moment.
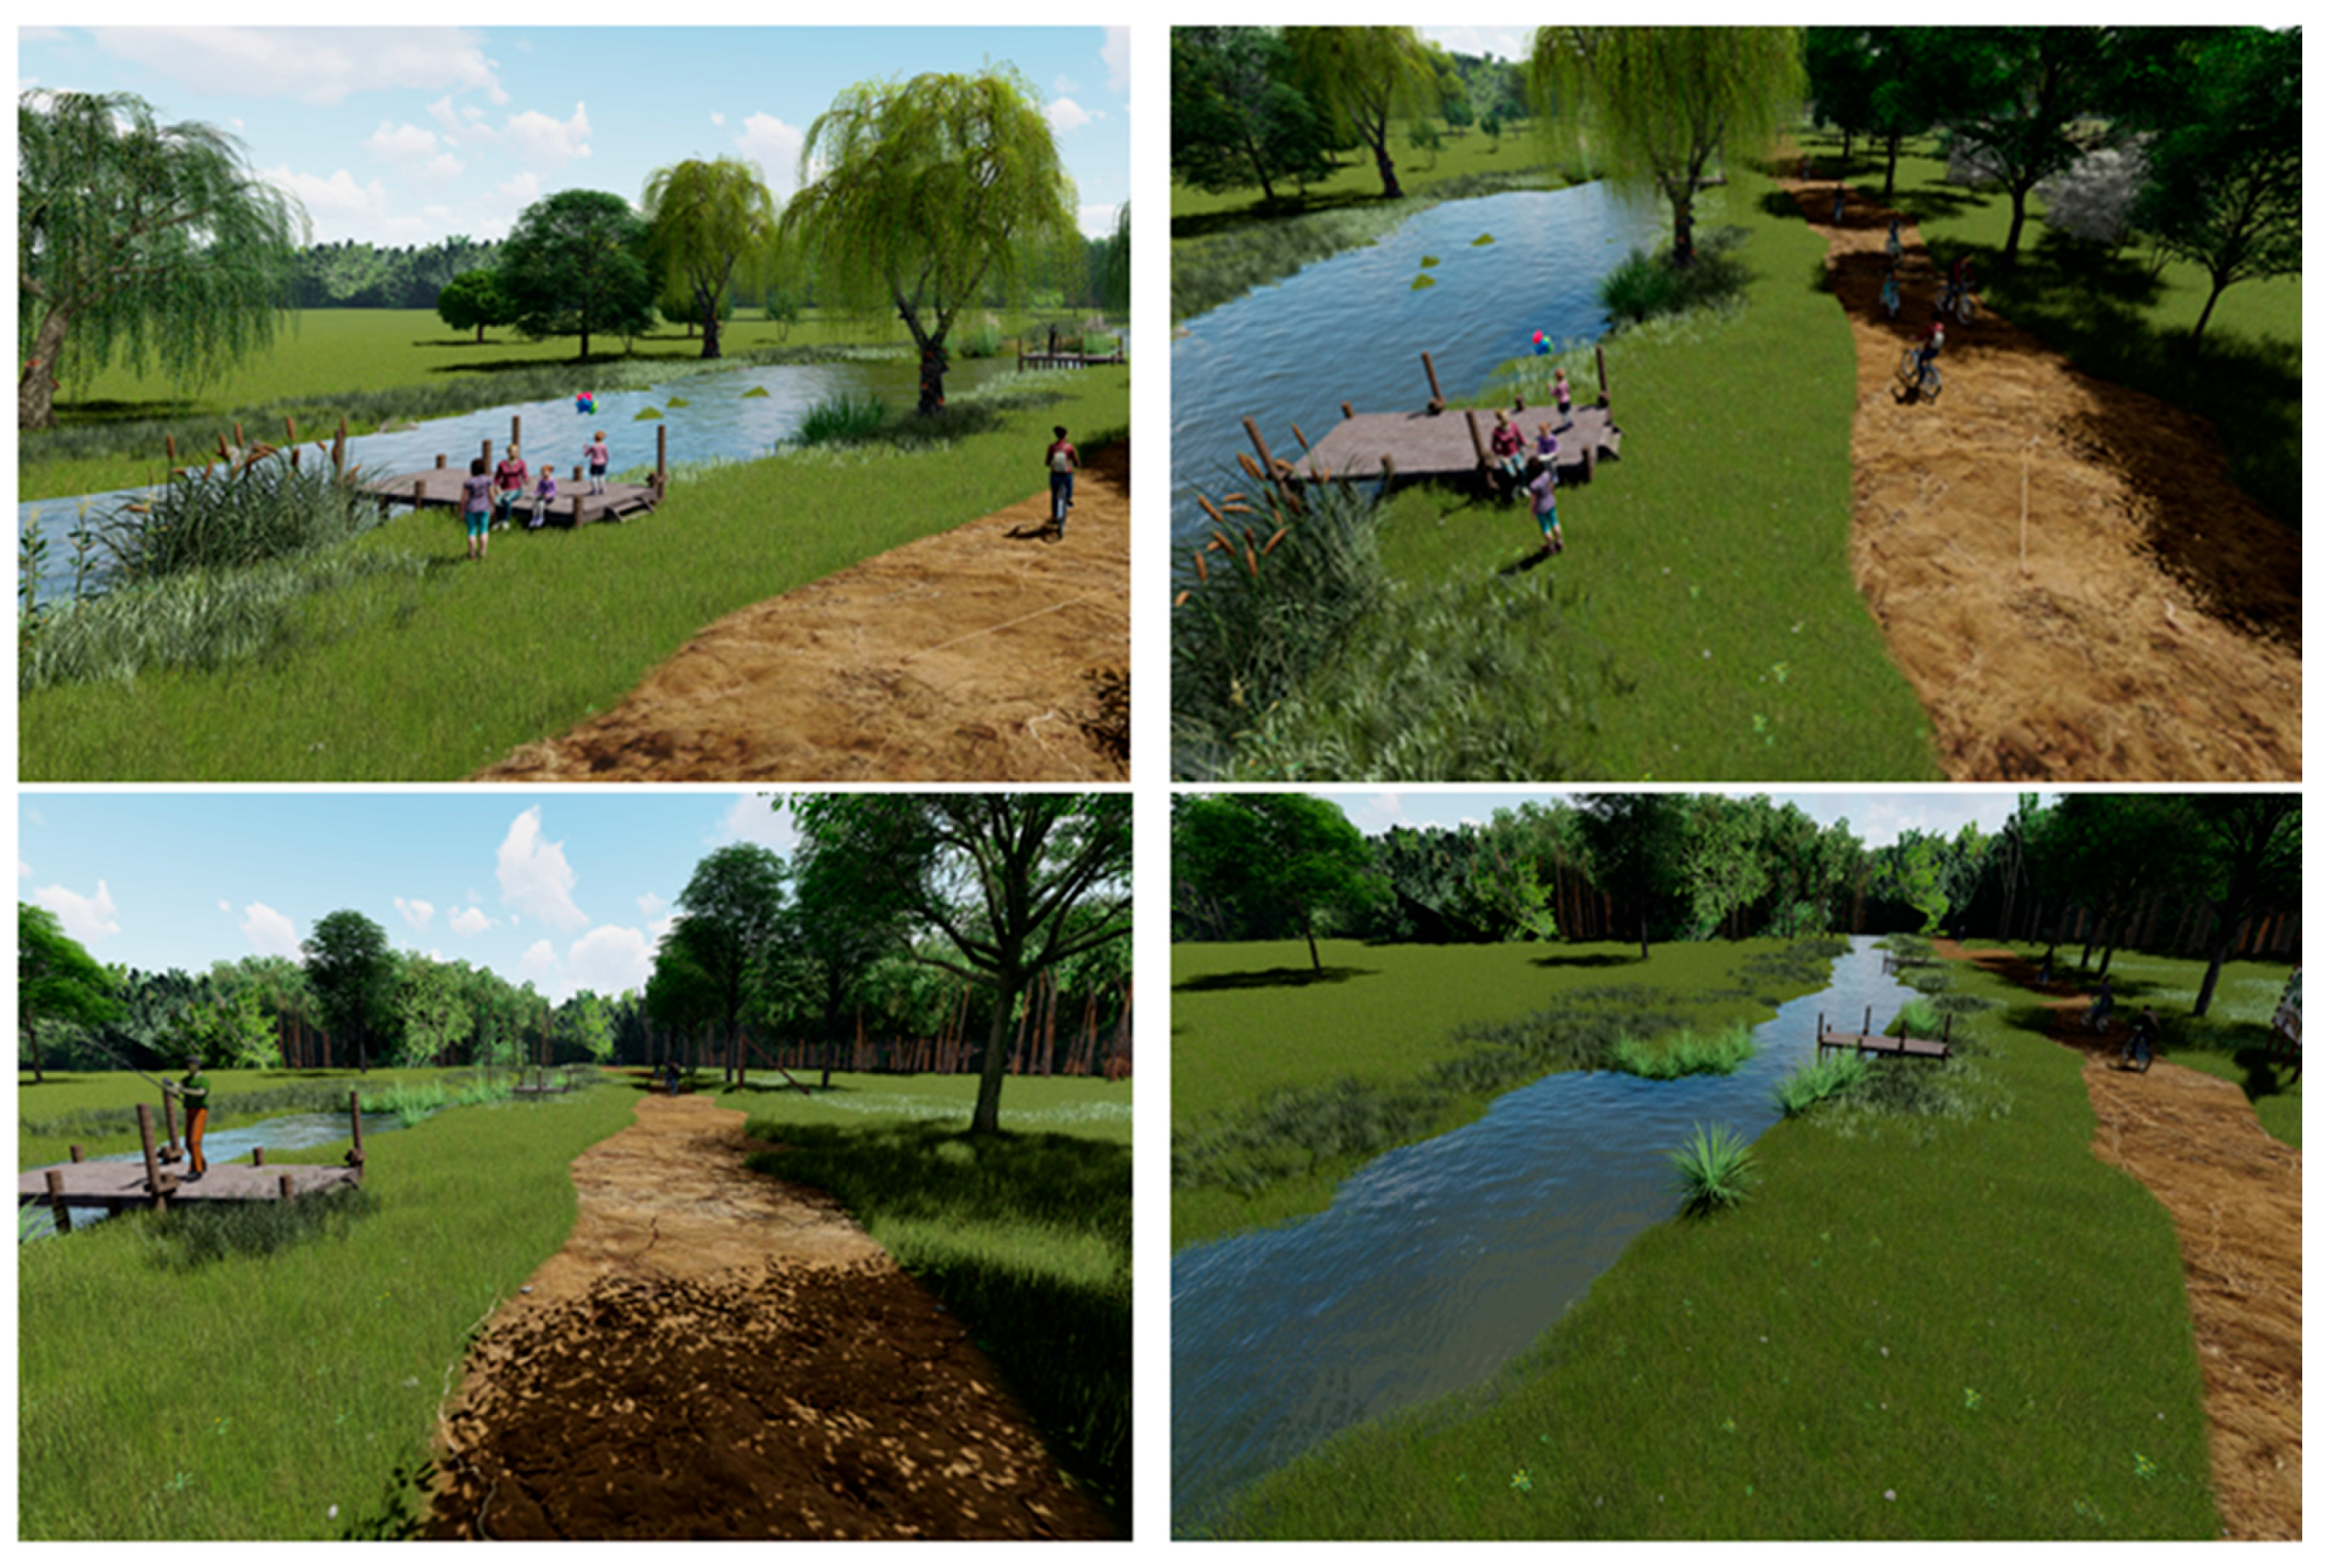
2.4.2. The Passive/Transit Zone
The passive/transit zone represents a forest route along a sector of the Green Forest – Behela River – Bega River green corridor, which forms a particularly valuable and unique green-blue area within Timișoara [
35]. Located in the forest’s interior, it offers extensive vegetation, diverse natural landscapes, and clean, high-quality air. It is designed as a multifunctional space that accommodates long-distance activities such as walking, running, and cycling, as well as passive forms of recreation, including landscape appreciation, wildlife observation, birdwatching, picnicking, and interaction with the river environment. Consequently, we proposed seating areas in the form of wooden decks, enabling visitors to explore the Behela River’s aquatic ecosystem and benefit from its ecological and sensory qualities, for instance by meditating near the water or observing its acoustic and visual characteristics, as shown in
Figure 17. Information boards and trail signage were also included in our proposal to inform visitors about local biodiversity and ecological processes. Certain signs indicating orientation and location are mounted on wooden logs, while others, featuring botanical illustrations of native plant species, invite visitors to "Find me," encouraging an exploratory and interactive engagement with the Green Forest.
2.4.3. The Active Recreation Zone
We conceived a family-friendly space within the Green Forest for various recreational activities, as shown in
Figure 18. One of the main attractions is a zipline constructed from durable materials and designed in accordance with safety standards, offering a unique and dynamic experience with clearly marked, easily accessible takeoff and landing areas. In addition, we proposed several activity zones, including a badminton court, an area for frisbee play, and climbing structures, balance beams, swings, and seesaws to support a diversity of physical and social interactions. To complement the recreational experience, the design includes urban furniture such as benches, recycling bins, wooden decks, and picnic tables, as well as ecological toilets to ensure visitor comfort and promote responsible waste management. By creating a pleasant, accessible, and well-equipped environment, the project encourages a healthy and active lifestyle while supporting environmental protection and fostering respect for the forest.
3. Discussion
Green and blue infrastructures constitute a vital component of contemporary metropolitan ecological networks, contributing significantly to environmental quality, urban resilience, and the provision of essential ecosystem services. Green Forest holds a crucial role in advancing the Sustainable Development Goals within the Timișoara Metropolitan Area. As an integrated social-ecological system, its structure, functions, and resilience are shaped by the region’s social, economic, and institutional dynamics. Our findings confirm the significant biodiversity of Green Forest, identifying 24 tree species across 16 genera, a richness sustained by the widespread presence and structural dominance of native taxa such as
Quercus robur (pedunculate oak) and
Fraxinus excelsior (common ash). The analysis demonstrated that the mean age of
Quercus robur (87 years) and the large average diameter (DBH 39.27 cm) observed in the majority of plots (
Section 2.2.1.1) classify these individuals as essential components of the urban canopy. Such mature, large-diameter trees are disproportionately valuable in terms of carbon sequestration and cooling effect compared to younger, smaller individuals, aligning with findings by Fauziah et al. (2024) regarding the critical role of structurally diverse stands in enhancing carbon stocks [
37].
Yao et al. (2023) demonstrated that evolutionary history and past ecological processes shape differences in species composition, thereby influencing the formation and maintenance of beta diversity within forest communities [
36]. In this context, the Green Forest, comprising both coppice stands and composite coppice stands, reflects a historically shaped forestry structure. Over time, many of these stands have been artificially regenerated by introducing additional tree species, including both autochthonous and allochthonous taxa. Such interventions have contributed to the forest’s present heterogeneity, with implications for forest ecosystems structure at species composition level, ecological functioning, and potential resilience.
However, a critical finding from the dendrometric analysis is the predominantly low stand consistency (C), which was recorded as ‘degraded’ in the majority of plots for key species such as
Quercus cerris (93.88%),
Acer campestre (100%), and
Fraxinus excelsior (77.55%) (
Section 2.2). This low density suggests a highly heterogeneous, open-canopy environment, which, while favoring light transmission and understory development, also indicates potential vulnerability to external pressures or management deficits.
The multivariate analysis further elucidated this composition variability. The Principal Component Analysis (PCA) isolated the contribution of rare and mature species (CAS, TE, MO, DU, PI, TI) along the first dimension (explaining 21.9% of the variability), and segregated these unique structural features into six minor, isolated clusters (2-7). Conversely, the majority of the forest falls within Cluster 1, characterized by the common, low-density species defining the second dimension (ULC, SC, ST, JU). This pattern confirms that the forest structure is not uniform but is composed of a large, homogeneous matrix of low-density forest interspersed with highly localized micro-sites of ecological rarity and high structural complexity, likely remnants of older, more intensely managed stands or specific planting efforts.
As an uneven-aged stand containing trees across all developmental stages, from seedlings to mature and senescent individuals, it represents a largely underrecognized yet substantial reservoir of biodiversity and ecological complexity, indicating ongoing regeneration processes and a relatively stable forest dynamic.
The presence of genera such as Quercus, Fraxinus, Acer, and Ulmus across most plots suggests that species in these genera are well adapted to current site conditions. Vertically, their tree crowns form multiple layers. This structural heterogeneity enhances habitat diversity, supports species persistence, and enriches the city’s landscape architecture, positioning Green Forest as a key asset in shaping Timișoara’s long-term ecological sustainability.
Green Forest acts as a refugium for species with specific ecological requirements and serves as an important source of biodiversity for the surrounding green infrastructure within Timișoara’s urban matrix. Therefore, we propose creating a transit zone along the Behela River, which flows through Green Forest and serves as a green corridor, strengthening the connection between the forest and the belt of green spaces along the Bega Canal. Enhancing connectivity between the forest and the urban landscape is essential to facilitate species distribution and support their successful establishment across the city’s green infrastructure.
In response to pressing global challenges such as biodiversity loss and the climate crisis, we propose implementing Nature-Based Solutions (NBS) that address ecological concerns while meeting human needs. By advancing three main approaches to designing sections of the Green Forest stand, namely the Ecological Education Area, the Passive/Transit Zone, and the Active Recreation Zone, we aim to enhance citizens’ quality of life by offering diverse opportunities for meaningful and enriching experiences within the forest ecosystem.
As shown by Fauziah et al. (2024), forests with high species diversity within vegetation communities plays a critical role in enhancing carbon stocks, underscoring the ecological value of structurally diverse stands such as those found in the Green Forest [
37]. However, this ecological potential is threatened by climatic pressures. Chivulescu et al. (2025) indicate that extended heat waves exacerbate drought stress, elevate tree mortality rates, and drive shifts in community composition, highlighting the vulnerability of forest systems under intensifying climate change [
18].
The finding that the dominant and structurally most valuable species,
Quercus robur, is highly represented in mature age classes (mean age 87 years) must be directly addressed in management planning. As this species is demonstrably prone to growth decline under future warming scenarios, the low stand consistency observed for most species (
Section 2.2) becomes a compounded risk factor. Lower density can increase ground-level heat and drought exposure, particularly for sensitive mature individuals, making targeted silvicultural interventions crucial for maintaining the health of these vital carbon assets. Understanding the structure of the Green Forest stand is therefore essential for determining appropriate intensities of tending and management cuttings, as well as for identifying priority trees for removal to support stand health and adaptive capacity.
Particular attention should be directed toward
Quercus robur, a species shown to be highly sensitive to the timing of summer drought and prone to growth decline under future warming scenarios [
38,
39,
40].
Deepening our understanding of mechanisms of species coexistence in Green Forest communities will provide critical scientific evidence to enhance ecosystem stability while balancing its ecological, aesthetic, and social functions.
A primary limitation of this study lies in the scope of the dendrometric analysis, which was restricted to tree populations and did not integrate shrubs comunities. Furthermore, neither herbaceous vegetation nor faunal communities were considered, which limits the ecological comprehensiveness of the findings. Consequently, the observed structural variability, particularly the low stand consistency, could not be fully correlated with understory development or overall microhabitat heterogeneity. Furthermore, while PCA and cluster analysis identified structural patterns, the proportion of explained variance by the first two dimensions (30.4%) suggests that other unmeasured environmental or historical factors contribute significantly to the total variability of the Green Forest stand.
To obtain and manage more accurate data for the Green Forest stand, we propose a novel approach utilizing airborne Light Detection and Ranging (LiDAR) multispectral and hyperspectral data for automated forest stand delineation, a method shown by Xiong et al. (2024) to enhance practical performance and forest management efficiency by outperforming manual delineation by 7.31% and multi-scale segmentation by 2.13% [
41]. According to Şmuleac, A. et al. (2015) data processing with LiDAR, satellite images facilitates the creation of 3D models, the detection of the soil surface, data filtering, and vegetation classification [
42]. This will maximize the incorporation of stand structure information, including tree height, canopy closure, and tree species details, and will lead to more efficient stand delineation in the Green Forest management inventory. Moreover, Dragomir L.O. et al. (2025) demonstrated that the hybrid methodology incorporating UAV photogrammetry, terrestrial SLAM LiDAR, and GNSS-based ICP validation produces cadastral plans that are both highly accurate and efficiently generated [
43]. In this context, the approach may be effectively applied to Green Forest mapping and monitoring, enabling precise boundary delineation, high-resolution spatial characterization, and reliable detection of temporal changes, thereby supporting sustainable forest management.
To apply responsible forest stewardship, it is essential to preserve valuable species and habitats, address social dimensions, and integrate modern forestry practices, including active conservation measures, retention trees for biodiversity, and dead wood management.
Safeguarding rare and threatened species such as
Neottia nidus-avis,
Cephalanthera damasonium,
Cephalanthera longifolia,
Epipactis helleborine,
Platanthera bifolia,
Epipactis microphylla, and
Ruscus aculeatus, identified by Chiricheș T. (2013) within the Green Forest, is central to maintaining the ecological integrity and functional resilience of this ecosystem [
44].
Adopting the measure of maintaining biodiversity trees alongside retaining dead wood would exert a highly favourable influence on overall biodiversity.
Biodiversity trees create ecological continuity between regeneration cycles, enhance the structural heterogeneity of the forest, and increase the volume of dead wood within the ecosystem. Biodiversity trees should be organized in representative groups with high ecological value and maintained until the end of their biological longevity. These areas should then be progressively replaced by similar patches during regeneration cuttings. To maximize ecological effectiveness, such groups should be well distributed throughout Green Forest. Suitable candidates include trees exhibiting decay, cavities, or wood in advanced stages of decomposition, as these structures provide essential habitats for a wide range of flora and fauna species.
Dead wood itself functions as a key stability factor in forest ecosystems, exerting major significance for several fundamental ecological components, including the return of organic material into biogeochemical cycles, the support of decomposer communities, and the provision of habitat for insects, fungi, plants, birds, amphibians, and mammals. All these aspects may be presented and discussed within the Ecological Education Area that we propose to establish, thereby providing a coherent framework for their protection, management, and long-term integration into the forest’s conservation strategy. Ultimately, integrating detailed dendrometric assessments with the proposed landscape architecture framework provides a robust, evidence-based strategy for the Green Forest. The successful implementation of the Ecological Education Area, the Passive/Transit Zone, and the Active Recreation Zone, underpinned by responsible forestry practices, will establish Green Forest as both a fragment of nature and a living, managed ecosystem that actively enhances Timișoara’s resilience, biodiversity, and urban quality of life for future generations.
4. Materials and Methods
4.1. Site Description and Data Collection
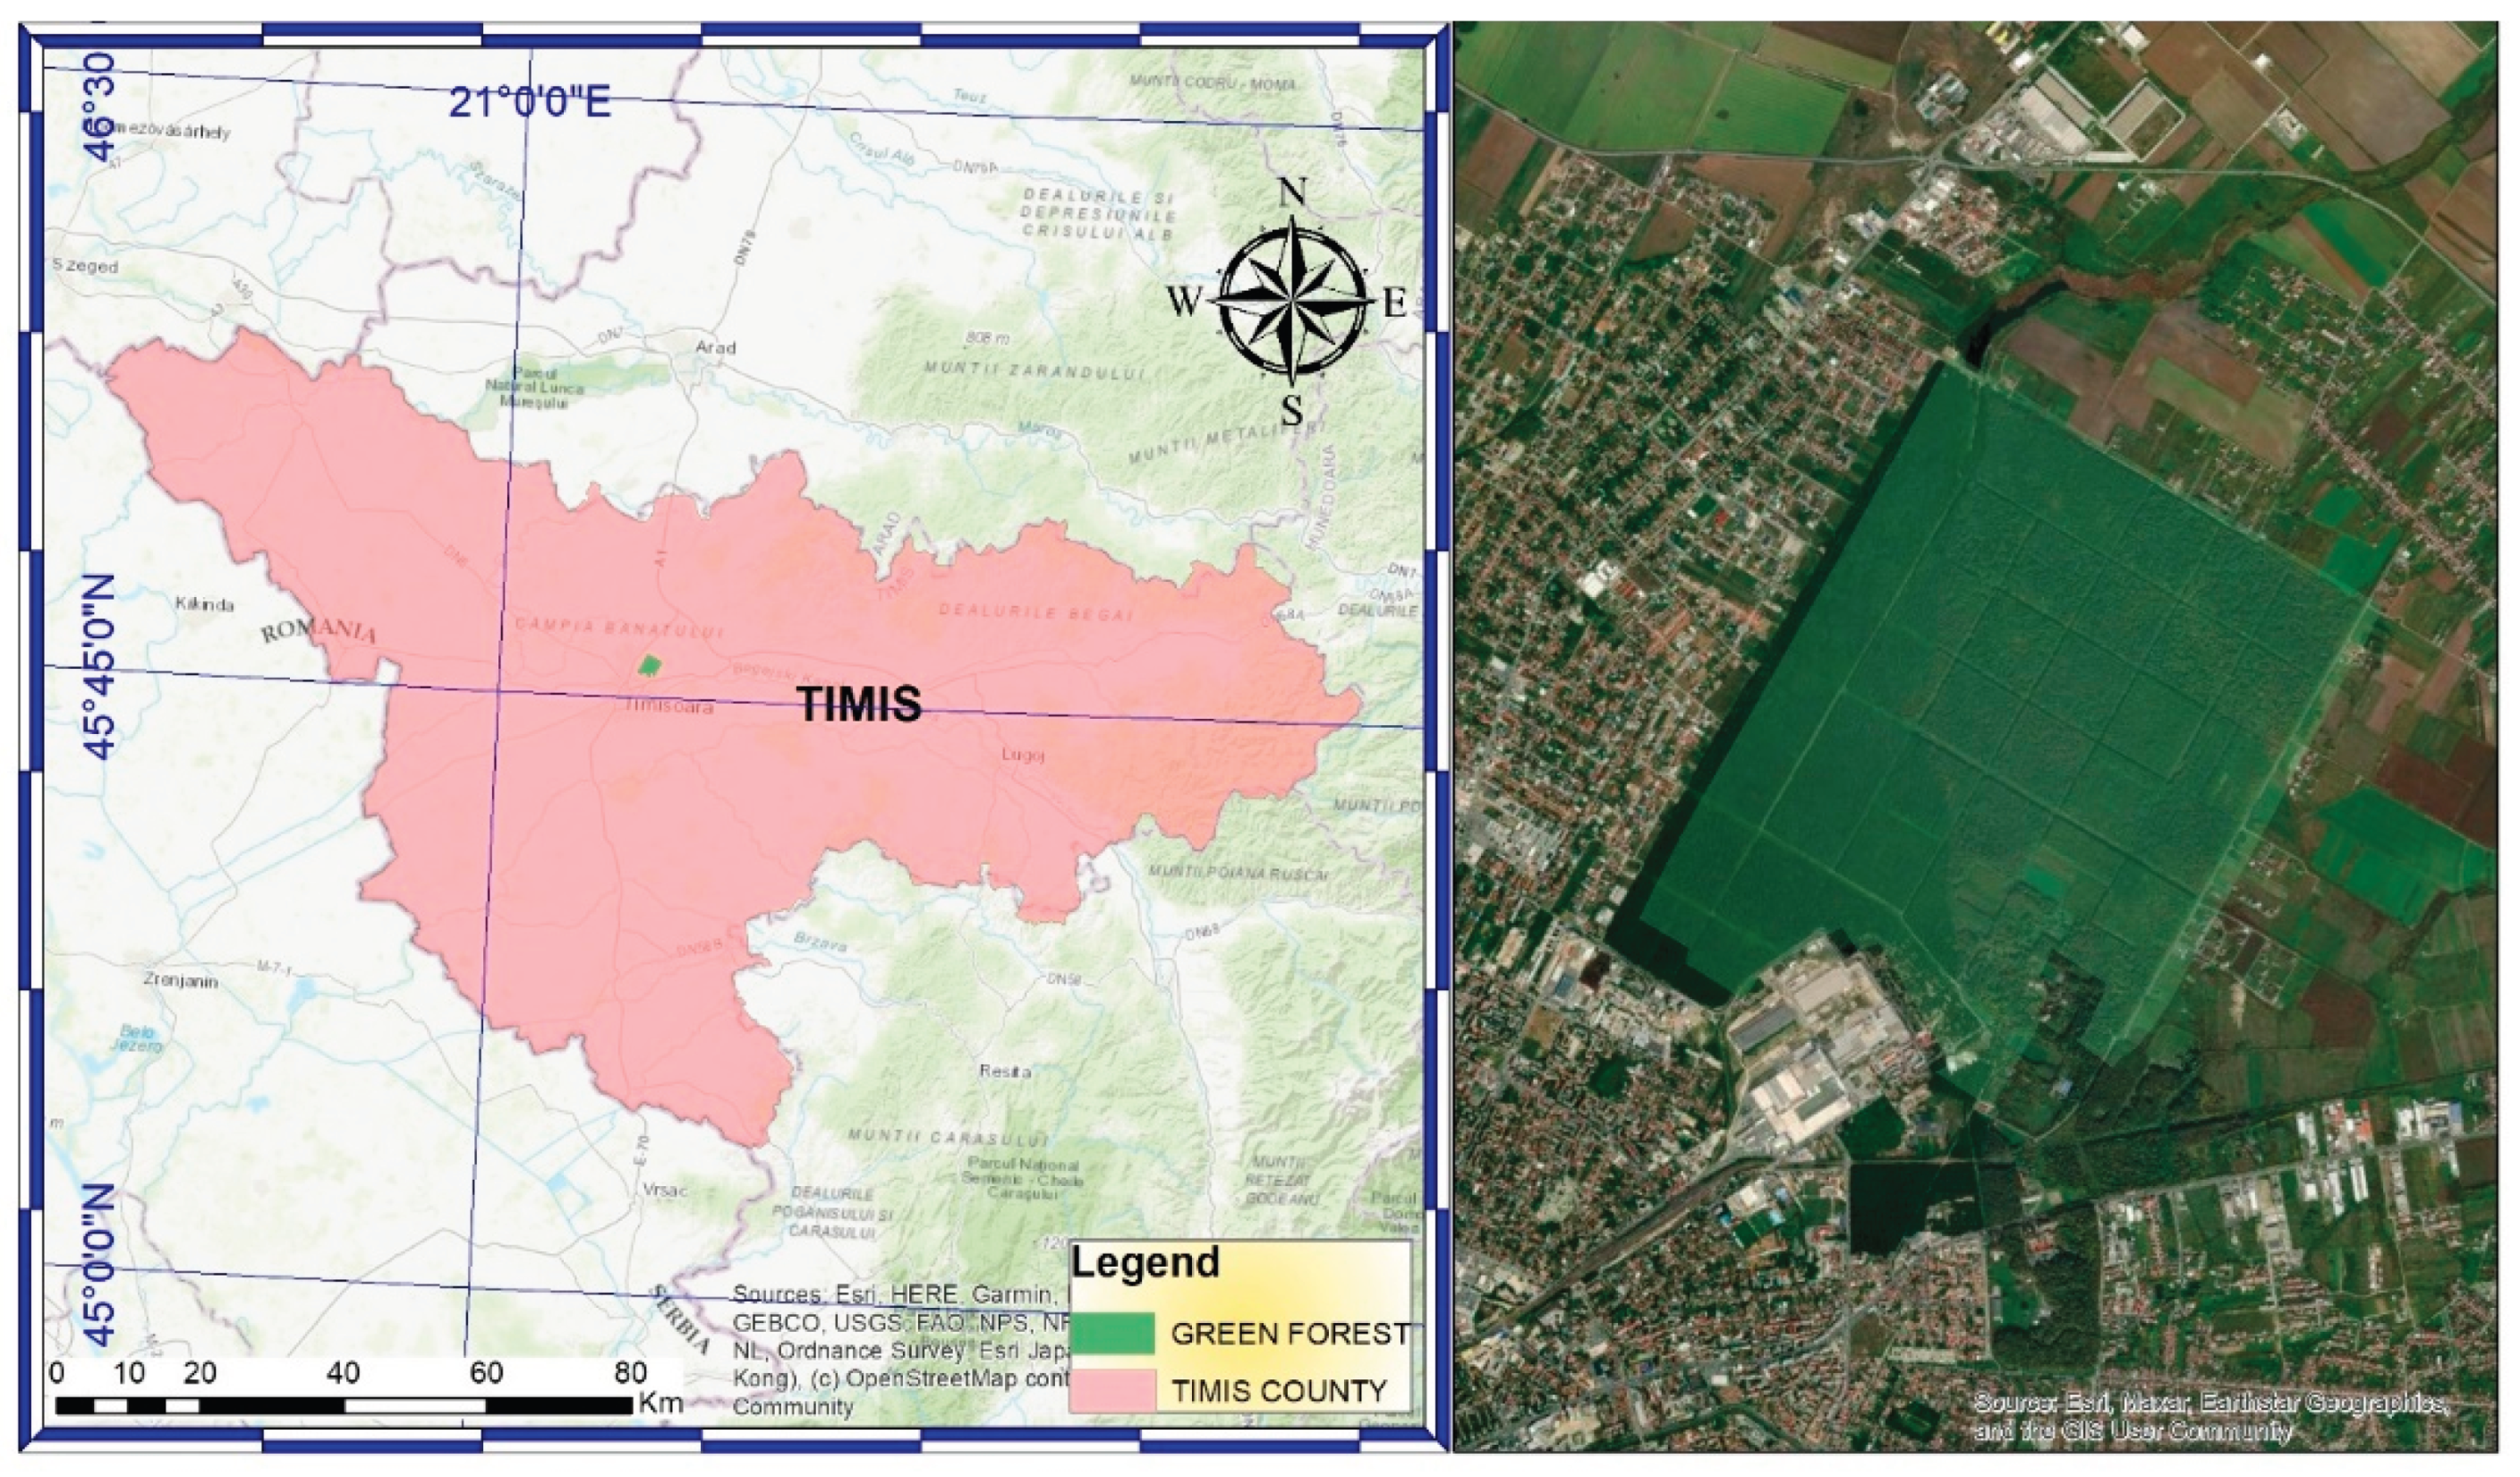
Timișoara, located in the Western Romanian Plains within Timiș County (45.75372° N; 21.22571° E) (
Figure 19), is an interconnected regional center currently experiencing continuous expansion and metropolitan transformation. Over the past two decades, the city’s urban boundaries have steadily extended, with neighboring localities — such as Dumbrăvița, Giroc, Moșnița Nouă, and Ghiroda — becoming integral components of its metropolitan ecosystem. This territorial growth has been fueled by economic development, foreign investment, infrastructure expansion, and population migration toward periurban areas. Urbanization threatens local biodiversity by degrading and fragmenting natural habitats and replacing them with grey infrastructure such as buildings and roads, which in turn contribute to higher levels of traffic-related air, soil, and water pollution [
45,
46]. Moreover, although the climate is warm and temperate—with an annual mean temperature of 13.2 °C and an annual average precipitation of 649 L/m² unevenly distributed [
47,
48]—the results of a recent study by Micu et al. (2024), quantifying the changing signals in the combined heat hazard (CHH) associated with concurrent hot days (HD – maximum temperature above 30 °C) and hot nights (HN – minimum temperature above 20 °C), reveal consistent geographical patterns in CHH change signals across both present and future climates in Timișoara. The city is projected to experience substantial increases in both the frequency and duration of CHH events, with values nearly doubling by 2050 and rising even further by 2100 [
49].
In response, the Timișoara municipality is committed to preserving and expanding green and blue infrastructures, including Green Forest, within the urban landscape. This approach aligns with Croci et al. (2008), who suggest that woodlands are an effective means of promoting biodiversity conservation in towns [
50].
Green Forest (45.75372° N; 21.22571° E) (
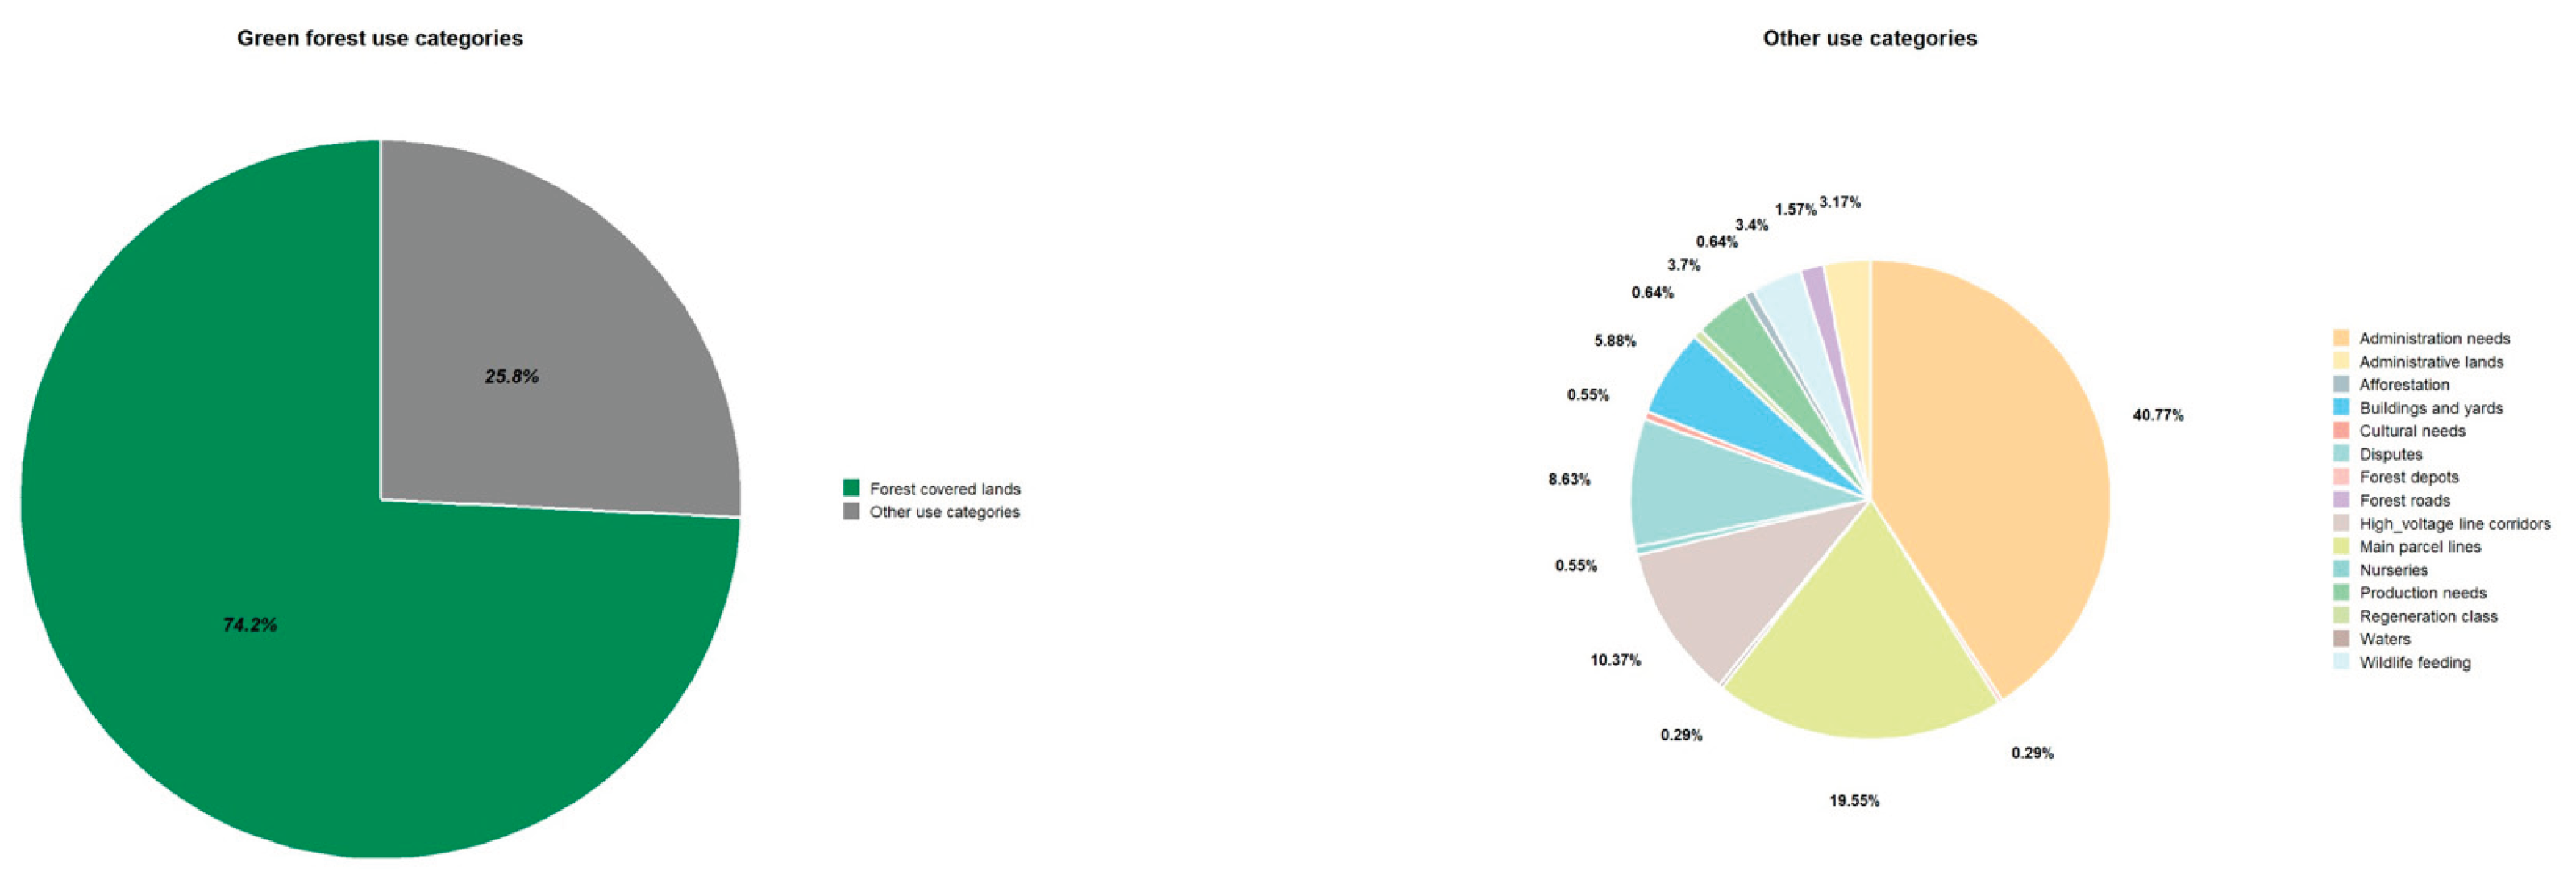
Figure 20) covers approximately 700 hectares in the northeastern part of Timișoara. Of this, 519.84 hectares were transferred to the Municipality of Timișoara by Government Decision No. 790/24.09.2020, reassigning the land from the public domain of the State and the administration of the National Forest Administration – ROMSILVA. Additionally, 60.74 hectares of land with other uses, including parcel boundaries, areas designated for game management, and non-productive land, were included in the transfer. Furthermore, over 100 hectares were returned to the Municipality of Timișoara through several successive actions in accordance with relevant legislation. As a result of these transfers, the green space per capita in Timișoara increased to approximately 38 sq m. Due to the Local Green Spaces Register currently being in progress, this information is subject to updates.
The Green Forest land-use categories and management units, as defined in the 2018 management plan for Production Unit VIII (Forest District Timișoara, Forestry Directorate Timiș), are shown in
Figure 21.
Even though the Green Forest is strongly influenced by intense human activity, it maintains a well-represented biodiversity, including plants, birds, amphibians, mammals, and entomofauna, a finding consistent with the conclusions of Abrego and Medianero (2025) in their study on the diversity and composition of insect communities in four urban forest fragments near Panama City [
51].
Despite being surrounded by buildings and roads, existing studies on the insect diversity of the Green Forest document a remarkable richness, including 635 species of butterflies [
52], 35 species of dragonflies, two of which are of community interest [
53], eight species from the family Cerambycidae [
54], and a grading of the species
Stereonychus fraxini was mentioned in 1958–1959 [
55]. These findings suggest that the Green Forest ecosystem supports a wide variety of insect species, forming complex food webs that function as decomposers, pollinators, and natural enemies of other species, thereby maintaining high energy fluxes and providing important ecosystem functions. At the same time, the diversity of tree and shrub species of the Green Forest ecosystem is complemented by a rich layer of herbaceous plants, including
Anemone ranunculoides, Corydalis cava, Campanula sp., Dactylis polygala, Erythronium dens-canis, Ficaria verna, Fritillaria meleagris, Galium album, Geranium robertianum, Geum urbanum, Oryzopsis xiresceus, Primula vulgaris, Prunella vulgaris, and
Pulmonaria officinalis, which sustain biodiversity and enhance the forest’s aesthetic value throughout the year.
Moreover, the Behela River flows through the Green Forest for 2.6 km. It constitutes a valuable green-blue corridor that connects the forest with the Bega Canal, along which it provides habitats for local fauna, constitutes a natural ecosystem with unique biodiversity, and contributes to maintaining ecological balance within Timișoara’s urban landscape [
35,
56].
4.2. Geographical Information System (G.I.S.) and Global Navigation Satellite System (GNSS) Technologies
The maps were created using Geographic Information Systems (GIS) technology, which is the most effective method for representing geospatial data [
57]. The software used was ArcGIS version 8. Spatial data were represented in the WGS 84 projection system (
Figure 1) and in the national Stereo 70 projection system (
Figure 2).
4.3. Methodology for Data Collection for Forest Management Planning
For the statistical analysis, data were sourced from the most recent management plan (2018) for Production Unit VIII Green Forest, administered by the Forest District Timișoara under the Forestry Directorate Timiș.
According to Technical Norms no. 6/2022 for Forest Management Planning, the entire surface of the forest management unit (sub-parcel) is inspected. At characteristic points (at least 1 per 4 hectares), a sampling plot is installed, and 8-10 trees are measured and described. The species of each tree is noted, and the diameters and the height of the trees with the diameter close to the average diameter were measured. Measurement of two diameters at breast height (1.3 m) (DBH1, DBH2) at 1800 intervals, using Haglöf Sweden AB aluminum tree caliper with a precision of 1 mm, was conducted. The average diameter at breast height (DBHm) was calculated. The heights of the trees with diameters close to the average were measured with Vertex equipment. The measured trees are marked with paint (the ones with measured heights are marked differently), and the sample plot location is recorded using a GPS. The three crown cover of the stand, its density, the proportion of participation of different tree species, and other stand characteristics are estimated at the stand level.
4.4. Statistical Analysis
All statistical analyses (including graphics) were performed using R Statistical Software (v4.4.1; R Core Team 2024) [
58]. Basic descriptive statistics for age, consistency, height, and diameter were used to characterize tree species diversity within the studied plots of the Green Forest in the Timișoara urban woodland. To explore the underlying structure within the consistency of trees species of the Green Forest of Timișoara urban woodland, principal component analysis (PCA) was conducted. This technique reduces data dimensionality by identifying a smaller set of uncorrelated principal components that capture the majority of the variance in the original data. Subsequently, cluster analysis was performed on the derived principal components to group plots of the Green Forest of Timișoara urban woodland with similar characteristics.
4.5. Landscape Architecture Design Proposals
Although the primary functions of the Green Forest are ecological (a diverse ecosystem), cultural (including the Forestry School Group, the Village Museum and the anti-communist Resistance Monument in Banat), and recreational (cycling and walking paths), it currently lacks the requisite infrastructure and ecological management practices to qualify for urban forest park designation [
59,
60]. In this context, high-quality 3D visualizations were developed in ArchiCAD and Lumion to illustrate proposed designs for an ecological education zone, a passive recreation area, and an active recreation area within the Green Forest.
5. Conclusions
This study provided a comprehensive assessment of the tree diversity and structural complexity of the Green Forest, framing its ecological value within the context of Timișoara’s urban landscape architecture and strategic planning. The findings confirm the critical role of this forest park as a significant component of the city’s green infrastructure, enriching both biodiversity and quality of life.
Our analysis identified 24 tree species across 16 genera, demonstrating the high biodiversity of Green Forest, sustained by the structural dominance of mature native species, particularly Quercus robur (pedunculate oak) and Fraxinus excelsior (common ash). The mean age of Quercus robur (87 years) and the high average DBH (39.27 cm) underline the forest’s substantial capacity for long-term carbon sequestration and urban climate mitigation.
The multivariate analysis (PCA and Cluster Analysis) was instrumental in uncovering the stand’s underlying structural heterogeneity. While the forest is characterized by a prevailing matrix of low-density plots (often exhibiting "degraded consistency"), the analysis successfully isolated specific, highly localized micro-sites that host rare species and unique structural complexity. This evidence underscores the need to implement differentiated, adaptive forest management strategies that prioritize protecting these rare clusters and retaining valuable old-growth individuals.
Crucially, the research translates these ecological findings into practical application by proposing a functional three-zone landscape architecture framework: the Ecological Education Area, the Passive/Transit Zone, and the Active Recreation Zone.
The core contributions of this research are twofold:
Scientific Contribution: Providing the first detailed dendrometric and multivariate analysis of the Green Forest structure, establishing a foundational ecological baseline for future urban ecology research in the Timișoara Metropolitan Area.
Practical Contribution: Delivering realistic, evidence-based landscape design proposals (using ArchiCAD and Lumion) that maximize the forest’s ecological and recreational functions, directly supporting the objectives of the 2023 Action Plan for Timișoara – a Green City.
We conclude that the proposed interventions, if implemented, will significantly enhance Green Forest’s ecosystem services, foster deeper community engagement with nature, and position this blue-green infrastructure as a model for sustainable urban forest integration in Central and Eastern Europe.
Author Contributions
Conceptualization: A.-M. T.-C. and D.V.L.; Methodology: A.-M. T.-C., D.V.L., C. B., E.O., I.S., D. O. T., A.H.; Software: A.-M. T.-C., D.V.L., C. B., C.G.F., D. C., D. O. T., R. C. L., C.-I. G., C.A.P., M.V.H., L.D.; Validation: A.-M. T.-C., D.V.L., E.O.; C.G.F., D. C., R. C. L., C.-I. G., C.A.P., M.V.H., L.D.; Formal analysis: A.-M. T.-C., D.V.L.; C. B., E.O., I.S., S.P, C.-I. G., C.A.P., M.V.H., L.D.; Investigation: A.-M. T.-C., D.V.L., M.V.H., L.D.; Resources: A.-M. T.-C., D.V.L., D. C., A.H.; Data curation: A.-M. T.-C., D.V.L. I.S., S.P, D. O. T., C.-I. G.; Writing—original draft preparation: A.-M. T.-C., D.V.L., C. B., C.G.F., R. C. L., M.V.H., S.P; Writing—review and editing, A.-M. T.-C. and D.V.L.; Visualization: A.-M. T.-C., D.V.L., C. B., E.O.; I.S., S.P, C.G.F., D. C., D. O. T., R. C. L., A.H., M.V.H.; Supervision: A.-M. T.-C. and D.V.L.; Project administration: A.-M. T.-C., D.V.L., A.H, and C.A.P.; funding acquisition, A.-M. T.-C., D.V.L., A.H. and C.A.P.; All authors have read and agreed to the published version of the manuscript.
Funding
The payment for the article was made from the research funds of the University of Life Sciences “King Mihai I” from Timișoara.
Data Availability Statement
The original contributions presented in the study are included in the article, further inquiries can be directed to the corresponding author.
Acknowledgments
The authors are grateful to the University of Life Sciences “King Mihai I” from Timisoara for support with the publication fee.
Conflicts of Interest
The authors declare no conflicts of interest.
References
- Linser, S.; Lier, M.; Bastrup-Birk, A. Key Information for Forest Policy Decision-Making-Does Current Reporting on Forests and Forestry Reflect Forest Discourses? 2023.
-
FAO (2023). Co-Chairs Summary. Global Workshop on Reporting on Progress Towards Global Forest Goals and Targets of the UN Strategic Plan on Forests 2030. Rome (Italy) 22-24 March 2023. FAO, Rome, Italy, Pp. 11.
.
- Global Deforestation Slows, but Forests Remain under Pressure, FAO Report Shows. Available online: https://www.fao.org/newsroom/detail/global-deforestation-slows--but-forests-remain-under-pressure--fao-report-shows/en (accessed on 3 December 2025).
- Sawitri, R.; Heriyanto, N.M.; Dharmawan, I.W.S.; Kwatrina, R.T.; Gunawan, H.; Garsetiasih, R.; Takandjandji, M.; Rianti, A.; Sihombing, V.S.; Mindawati, N. Ecological Dynamics of Forest Stands with Castanopsis Argentea (Blume) A. DC. in a Mountain Ecosystem: Vegetation Structure, Diversity, and Carbon Stock Under Tourism Pressure. Land 2025, 14, 1187. [Google Scholar] [CrossRef]
- Dharmawan, I.W.S.; Heriyanto, N.M.; Garsetiasih, R.; Kwatrina, R.T.; Sawitri, R.; Denny; Setyawati, T.; Pratiwi; Narendra, B.H.; Siregar, C.A. The Dynamics of Vegetation Structure, Composition and Carbon Stock in Peatland Ecosystem of Old Secondary Forest in Riau and South Sumatra Provinces. Land 2024, 13, 663. [Google Scholar] [CrossRef]
- Giles, A.L.; Schietti, J.; Rosenfield, M.F.; Mesquita, R.C.; Vieira, D.L.M.; Vieira, I.C.; Poorter, L.; Brancalion, P.H.; Peña-Claros, M.; Siqueira, J. Simple Ecological Indicators Benchmark Regeneration Success of Amazonian Forests. Commun. Earth Environ. 2024, 5, 780. [Google Scholar] [CrossRef]
- Arese Lucini, F.; Morone, F.; Tomassone, M.S.; Makse, H.A. Diversity Increases the Stability of Ecosystems. PloS One 2020, 15, e0228692. [Google Scholar] [CrossRef]
- Liu, F.; Tan, C.; Yang, Z.; Li, J.; Xiao, H.; Tong, Y. Regeneration and Growth of Tree Seedlings and Saplings in Created Gaps of Different Sizes in a Subtropical Secondary Forest in Southern China. For. Ecol. Manag. 2022, 511, 120143. [Google Scholar] [CrossRef]
- Wang, Y.; Chen, S.; He, W.; Ren, J.; Wen, X.; Wang, Y.; Li, X.; Chen, G.; Feng, M.; Fan, C. Shrub Diversity and Niche Characteristics in the Initial Stage of Reconstruction of Low-Efficiency Cupressus Funebris Stands. Forests 2021, 12, 1492. [Google Scholar] [CrossRef]
- Pretzsch, H.; Poschenrieder, W.; Uhl, E.; Brazaitis, G.; Makrickiene, E.; Calama, R. Silvicultural Prescriptions for Mixed-Species Forest Stands. A European Review and Perspective. Eur. J. For. Res. 2021, 140, 1267–1294. [Google Scholar] [CrossRef]
- Angelstam, P.; Manton, M. Effects of Forestry Intensification and Conservation on Green Infrastructures: A Spatio-Temporal Evaluation in Sweden. Land 2021, 10, 531. [Google Scholar] [CrossRef]
- Imbrenda, V.; Coluzzi, R.; Mariani, F.; Nosova, B.; Cudlinova, E.; Salvia, R.; Quaranta, G.; Salvati, L.; Lanfredi, M. Working in (Slow) Progress: Socio-Environmental and Economic Dynamics in the Forestry Sector and the Contribution to Sustainable Development in Europe. Sustainability 2023, 15, 10271. [Google Scholar] [CrossRef]
- Wang, D.; Xu, P.-Y.; An, B.-W.; Guo, Q.-P. Urban Green Infrastructure: Bridging Biodiversity Conservation and Sustainable Urban Development through Adaptive Management Approach. Front. Ecol. Evol. 2024, 12, 1440477. [Google Scholar] [CrossRef]
- Stevenson, P.C.; Bidartondo, M.I.; Blackhall-Miles, R.; Cavagnaro, T.R.; Cooper, A.; Geslin, B.; Koch, H.; Lee, M.A.; Moat, J.; O’Hanlon, R.; et al. The State of the World’s Urban Ecosystems: What Can We Learn from Trees, Fungi, and Bees? PLANTS PEOPLE PLANET 2020, 2, 482–498. [Google Scholar] [CrossRef]
- Wu, Q.; Zaw, Z.; Yang, J.; Yang, R.; Li, Z.; Hauer, R.J.; Li, H.; Fan, Z.; Lu, H.; Sterck, F. Urbanization Associated with Greater Tree Growth Declines in Urban than in Rural Forests. Urban For. Urban Green. 2025, 104, 128599. [Google Scholar] [CrossRef]
- Nyssen, B.; Ouden, J.D.; Bindewald, A.; Brancalion, P.; Kremer, K.; Lapin, K.; Raats, L.; Schatzdorfer, E.; Stanturf, J.; Verheyen, K.; et al. Established Invasive Tree Species Offer Opportunities for Forest Resilience to Climate Change. Curr. For. Rep. 2024, 10, 456–486. [Google Scholar] [CrossRef]
- Stamin, F.D.; Cosmulescu, S. Comparative Assessment of Biodiversity and Ecological Indicators in Three Forest Ecosystems of Southern Romania. Diversity 2025, 17, 277. [Google Scholar] [CrossRef]
- Chivulescu, S.; Pitar, D.; Dobre, A.C.; Mărmureanu, L.; Leca, Ștefan; Badea, O. Quantifying Climate Change Impacts on Romanian Forests: Indicators of Resilience and Vulnerability. Forests 2025, 16, 941. [Google Scholar] [CrossRef]
- Tóthmérész, B.; Máthé, I.; Balázs, E.; Magura, T. Responses of Carabid Beetles to Urbanization in Transylvania (Romania). Landsc. Urban Plan. 2011, 101, 330–337. [Google Scholar] [CrossRef]
- Geacu, S.; Dumitraşcu, M.; Grigorescu, I. On the Biogeographical Significance of Protected Forest Areas in Southern Romania. Sustainability 2018, 10, 2282. [Google Scholar] [CrossRef]
- Grigorescu, I.; Geacu, S. The Dynamics and Conservation of Forest Ecosystems in Bucharest Metropolitan Area. Urban For. Urban Green. 2017, 27, 90–99. [Google Scholar] [CrossRef]
- Badiu, D.L.; Iojă, C.I.; Pătroescu, M.; Breuste, J.; Artmann, M.; Niță, M.R.; Grădinaru, S.R.; Hossu, C.A.; Onose, D.A. Is Urban Green Space per Capita a Valuable Target to Achieve Cities’ Sustainability Goals? Romania as a Case Study. Ecol. Indic. 2016, 70, 53–66. [Google Scholar] [CrossRef]
- Niță, M.-R.; Năstase, I.-I.; Badiu, D.-L.; Onose, D.-A.; Gavrilidis, A.-A. Evaluating Urban Forests Connectivity in Relation to Urban Functions in Romanian Cities. Carpathian J. Earth Environ. Sci. 2018, 13, 291–299. [Google Scholar] [CrossRef]
- Tudoran, G.-M.; Cicșa, A.; Cicșa, M.; Dobre, A.-C. Management of Recreational Forests in the Romanian Carpathians. Forests 2022, 13, 1369. [Google Scholar] [CrossRef]
- Giergiczny, M.; Czajkowski, M.; Żylicz, T.; Angelstam, P. Choice Experiment Assessment of Public Preferences for Forest Structural Attributes. Ecol. Econ. 2015, 119, 8–23. [Google Scholar] [CrossRef]
- Leca, Ștefan; Popa, I.; Chivulescu, Șerban; Popa, A.; Pitar, D.; Dobre, A.-C.; Pascu, I.-S.; Apostol, B.; Badea, O. Structure and Diversity in a Periurban Forest of Bucharest, Romania. Ann. For. Res. 2023, 66, 139–153. [Google Scholar] [CrossRef]
- Hernández-Morcillo, M.; Torralba, M.; Baiges, T.; Bernasconi, A.; Bottaro, G.; Brogaard, S.; Bussola, F.; Díaz-Varela, E.; Geneletti, D.; Grossmann, C.M.; et al. Scanning the Solutions for the Sustainable Supply of Forest Ecosystem Services in Europe. Sustain. Sci. 2022, 17, 2013–2029. [Google Scholar] [CrossRef]
- Alonzo, M.; Ibsen, P.C.; Locke, D.H. Urban Trees and Cooling: A Review of the Recent Literature (2018 to 2024). Arboric. Urban For. 2025, 51. [Google Scholar] [CrossRef]
- Geacu, S.; Grigorescu, I. Historical Changes in Urban and Peri-Urban Forests: Evidence from the Galați Area, Romania. Land 2022, 11, 2043. [Google Scholar] [CrossRef]
- Dumitrașcu, M.; Grigorescu, I.; Cuculici, R.; Dumitrașcu, C.; Năstase, M.; Geacu, S. Assessing Long-Term Changes in Forest Cover in the South West Development Region. Romania. Proceedings of the Forum geografic 2014, Vol. 13, 76–85. [Google Scholar] [CrossRef]
- Oprea, A.; Vișoiu, D. Green Space Development Project of Dumbrăvița Lake and Green Forest Timișoara; 2010. [Google Scholar]
- Koller, A.; Kunz, M.; Perles-Garcia, M.D.; von Oheimb, G. 3D Structural Complexity of Forest Stands Is Determined by the Magnitude of Inner and Outer Crown Structural Attributes of Individual Trees. Agric. For. Meteorol. 2025, 363, 110424. [Google Scholar] [CrossRef]
- Paletto, A.; Tosi, V. Forest Canopy Cover and Canopy Closure: Comparison of Assessment Techniques. Eur. J. For. Res. 2009, 128, 265–272. [Google Scholar] [CrossRef]
- Forrester, D.I.; Ammer, C.; Annighöfer, P.J.; Barbeito, I.; Bielak, K.; Bravo-Oviedo, A.; Coll, L.; Del Río, M.; Drössler, L.; Heym, M.; et al. Effects of Crown Architecture and Stand Structure on Light Absorption in Mixed and Monospecific Fagus Sylvatica and Pinus Sylvestris Forests along a Productivity and Climate Gradient through Europe. J. Ecol. 2018, 106, 746–760. [Google Scholar] [CrossRef]
- Andra, P.; Elena, T.C.; Berar, C. A Study of Behela River as a Blue Green Corridor in Timișoara. J. Hortic. For. Biotechnol. 2023, 27, 100–109. [Google Scholar]
- Yao, L.; Jiang, B.; Jiao, J.; Wu, C. Environmental Filtering and Dispersal Limitations Driving the Beta Diversity Patterns at Different Scales of Secondary Evergreen Broadleaved Forests in the Suburbs of Hangzhou. Plants 2023, 12, 3057. [Google Scholar] [CrossRef]
- Fauziah, F.; Fajrushobah, M.F.; Ramadhani, D.; Yulistyarini, T.; Fiqa, A. Structure and Carbon Stock of Vegetation in the Arboretum Area of the Purwodadi Botanic Garden 2024.
- Bose, A.K.; Redmond, M.D.; Levesque, M. Forest Management Options in Modulating Trees’ Survival, Growth, and Reproduction Strategies under Environmental Stress. For. Ecol. Manag. 2024, 555, 121708. [Google Scholar] [CrossRef]
- Novick, K.; Jo, I.; D’Orangeville, L.; Benson, M.; Au, T.F.; Barnes, M.; Denham, S.; Fei, S.; Heilman, K.; Hwang, T. The Drought Response of Eastern US Oaks in the Context of Their Declining Abundance. BioScience 2022, 72, 333–346. [Google Scholar] [CrossRef]
- Sánchez-Salguero, R.; Colangelo, M.; Matías, L.; Ripullone, F.; Camarero, J.J. Shifts in Growth Responses to Climate and Exceeded Drought-Vulnerability Thresholds Characterize Dieback in Two Mediterranean Deciduous Oaks. Forests 2020, 11, 714. [Google Scholar] [CrossRef]
- Xiong, H.; Pang, Y.; Jia, W.; Bai, Y. Forest Stand Delineation Using Airborne LiDAR and Hyperspectral Data. Silva Fenn. 2024, 58. [Google Scholar] [CrossRef]
- Şmuleac, A.; Popescu, C.; Şmuleac, L.; Peptan, C.A. Processing Lidar Information to increase precision in field numerical models. Research Journal of Agricultural Science 2015, 47(no. 2). [Google Scholar]
- Dragomir, L.O.; Popescu, C.A.; Herbei, M.V.; Popescu, G.; Herbei, R.C.; Salagean, T.; Bruma, S.; Sabou, C.; Sestras, P. Enhancing Conventional Land Surveying for Cadastral Documentation in Romania with UAV Photogrammetry and SLAM. Remote Sens. 2025, 17, 2113. [Google Scholar] [CrossRef]
- Chiriches, T. Aspects Regarding the Management of Forest from Timiş County That Are Hosting Threatened, Endangered or Endemic Species, and Are Not Included in Protected Areas. J. Hortic. For. Biotechnol. 2013, 17, 307–320. [Google Scholar]
- Szabó, B.; Korányi, D.; Gallé, R.; Lövei, G.L.; Bakonyi, G.; Batáry, P. Urbanization Decreases Species Richness, and Increases Abundance in Dry Climates Whereas Decreases in Wet Climates: A Global Meta-Analysis. Sci. Total Environ. 2023, 859, 160145. [Google Scholar] [CrossRef]
- Bogdanffy, L.; Lorinț, C.R.; Nicola, A. Development of a Low-Cost Traffic and Air Quality Monitoring Internet of Things (IoT) System for Sustainable Urban and Environmental Management. Sustainability 2025, 17, 5003. [Google Scholar] [CrossRef]
- Meteo Romania | Site-ul Administratiei Nationale de Meteorologie 2025.
- Timișoara Climate: Weather Timișoara & Temperature by Month, Https://En.Climate-Data.Org/Europe/Romania/Timis/Timisoara-997/#google_vignette. Available online: https://en.climate-data.org/europe/romania/timis/timisoara-997/#google_vignette?utm_content=cmp-true (accessed on 11 April 2024).
- Micu, D.M.; Cheval, S.; Dumitrescu, A.; Smău, R.; Amihăesei, V. Extreme Heat Hazard in the Urban Areas of Romania in a Changing Climate; Copernicus Meetings, 2024.
- Croci, S.; Butet, A.; Georges, A.; Aguejdad, R.; Clergeau, P. Small Urban Woodlands as Biodiversity Conservation Hot-Spot: A Multi-Taxon Approach. Landsc. Ecol. 2008, 23, 1171–1186. [Google Scholar] [CrossRef]
- Abrego, J.; Medianero, E. The Diversity and Composition of Insect Communities in Urban Forest Fragments near Panama City. Biology 2025, 14, 721. [Google Scholar] [CrossRef] [PubMed]
-
König, F., 1975, Catalog of the Lepidoptera Collection of the Banat Museum, Timișoara, 284 Pp
.
- Manci, O. Preliminary Study on the Distribution of Dragonflies (Insecta: Odonata) in the Green Forest (Timisoara) and the Immediate Vicinity. Bul. Inf. Entomol (in Romanian).. 2005, 16, 83–88. [Google Scholar]
-
Balaci, A., 2000, Catalog of the Family Ceramycidae (Coleoptera) from the Collection of the Banat Museum, Timișoara, Annals of Banat, Natural Sciences, 153-185 (in Romanian).
.
-
Teicu, A. 1959, Attack of Cionus Fraxini De Geer in the Green Forest - Timisoara, Revista Pădurilor, Nr. 11 (in Romanian).
.
- Székely, G.; Țenche-Constantinescu, A.M. The Potential Ecologic and Visual Value of the Bega Canal in Timișoara. J. Hortic. For. Biotechnol. 2019, 23, 29–33. [Google Scholar]
- Lorinț, C.; Traistă, E.; Florea, A.; Marchiș, D.; Radu, S.M.; Nicola, A.; Rezmerița, E. Spatiotemporal Distribution and Evolution of Air Pollutants Based on Comparative Analysis of Long-Term Monitoring Data and Snow Samples in Petroșani Mountain Depression, Romania. Sustainability 2025, 17, 3141. [Google Scholar] [CrossRef]
- Team, R.C. R: A Language and Environment for Statistical Computing. R Foundation for Statistical Computing, Vienna, Austria. Httpwww R-Proj. Org 2016.
- Bârliba, L.L.; Eleş, G.; Bârliba, C.; Bârliba, F.C. SUSTAINABLE DEVELOPMENT AND MANAGEMENT OF GREEN SPACES FOR THE TIMISOARA MUNICIPALITY. Sci. Bull. Politeh. Univ. Timisoara Trans. Hydrotech. Stiintific Al Univ. Politeh. Din Timisoara Ser. Hidroteh. 2023, 68.
- Crețan, R.; Chasciar, D.; Dragan, A. Forests and Their Related Ecosystem Services: Visitors’ Perceptions in the Urban and Peri-Urban Spaces of Timișoara, Romania. Forests 2024, 15, 2177. [Google Scholar] [CrossRef]
Figure 1.
Spatial distribution of tree populations among Green Forest stand plots: (a) occurring in 111–15 plots; (b) occurring in 8–1 plots.
Figure 1.
Spatial distribution of tree populations among Green Forest stand plots: (a) occurring in 111–15 plots; (b) occurring in 8–1 plots.
Figure 2.
Pedunculate oak (Quercus robur L.) - ST histograms of age, consistency, diameter, and height.
Figure 2.
Pedunculate oak (Quercus robur L.) - ST histograms of age, consistency, diameter, and height.
Figure 3.
Red oak (Quercus rubra) - STR histograms of age, consistency, diameter, and height.
Figure 3.
Red oak (Quercus rubra) - STR histograms of age, consistency, diameter, and height.
Figure 4.
Turkey oak (Quercus cerris) - CE histograms of age, consistency, diameter, and height.
Figure 4.
Turkey oak (Quercus cerris) - CE histograms of age, consistency, diameter, and height.
Figure 5.
Common ash (Fraxinus excelsior) - FR histograms of age, consistency, diameter, and height.
Figure 5.
Common ash (Fraxinus excelsior) - FR histograms of age, consistency, diameter, and height.
Figure 6.
Field maple (Acer campestre) - JU histograms of age, consistency, diameter, and height.
Figure 6.
Field maple (Acer campestre) - JU histograms of age, consistency, diameter, and height.
Figure 7.
Norway maple (Acer platanoides) - PAC histograms of age, consistency, diameter, and height.
Figure 7.
Norway maple (Acer platanoides) - PAC histograms of age, consistency, diameter, and height.
Figure 8.
European field elm (Ulmus campestris) - ULC histograms of age, consistency, diameter, and height.
Figure 8.
European field elm (Ulmus campestris) - ULC histograms of age, consistency, diameter, and height.
Figure 9.
Wych elm (Ulmus glabra) - ULM histograms of age, consistency, diameter, and height.
Figure 9.
Wych elm (Ulmus glabra) - ULM histograms of age, consistency, diameter, and height.
Figure 10.
Black locust (Robinia pseudoacacia) – SC histograms of age, consistency, diameter, and height.
Figure 10.
Black locust (Robinia pseudoacacia) – SC histograms of age, consistency, diameter, and height.
Figure 11.
White walnut (Juglans cinerea) - NUA histograms of age, consistency, diameter, and height.
Figure 11.
White walnut (Juglans cinerea) - NUA histograms of age, consistency, diameter, and height.
Figure 12.
Black walnut (Juglans nigra) – NUN histograms of age, consistency, diameter, and height.
Figure 12.
Black walnut (Juglans nigra) – NUN histograms of age, consistency, diameter, and height.
Figure 13.
(a) Scree plot of PCA; (b) Contribution of variables to the first and second dimensions of PCA; (c) Projection of variables on the plane spanned by the first and second principal components of PCA; (d) Projection of individuals on the plane spanned by the first and second principal components of PCA.
Figure 14.
Dendrogram of the plots with respect to tree consistency according to their age, height, and diameter.
Figure 14.
Dendrogram of the plots with respect to tree consistency according to their age, height, and diameter.
Figure 15.
A three-zone landscape architecture framework is proposed for the Green Forest.
Figure 15.
A three-zone landscape architecture framework is proposed for the Green Forest.
Figure 16.
Ecological education area.
Figure 16.
Ecological education area.
Figure 17.
The Passive / transit zone.
Figure 17.
The Passive / transit zone.
Figure 18.
The Active recreation zone.
Figure 18.
The Active recreation zone.
Figure 19.
Timișoara metropolitan area.
Figure 19.
Timișoara metropolitan area.
Figure 20.
The Green Forest as part of Timișoara’s green infrastructure.
Figure 20.
The Green Forest as part of Timișoara’s green infrastructure.
Figure 21.
Green Forest fund area by use category.
Figure 21.
Green Forest fund area by use category.
|
Disclaimer/Publisher’s Note: The statements, opinions and data contained in all publications are solely those of the individual author(s) and contributor(s) and not of MDPI and/or the editor(s). MDPI and/or the editor(s) disclaim responsibility for any injury to people or property resulting from any ideas, methods, instructions or products referred to in the content. |
© 2025 by the authors. Licensee MDPI, Basel, Switzerland. This article is an open access article distributed under the terms and conditions of the Creative Commons Attribution (CC BY) license (https://creativecommons.org/licenses/by/4.0/).