Submitted:
16 December 2025
Posted:
16 December 2025
You are already at the latest version
Abstract
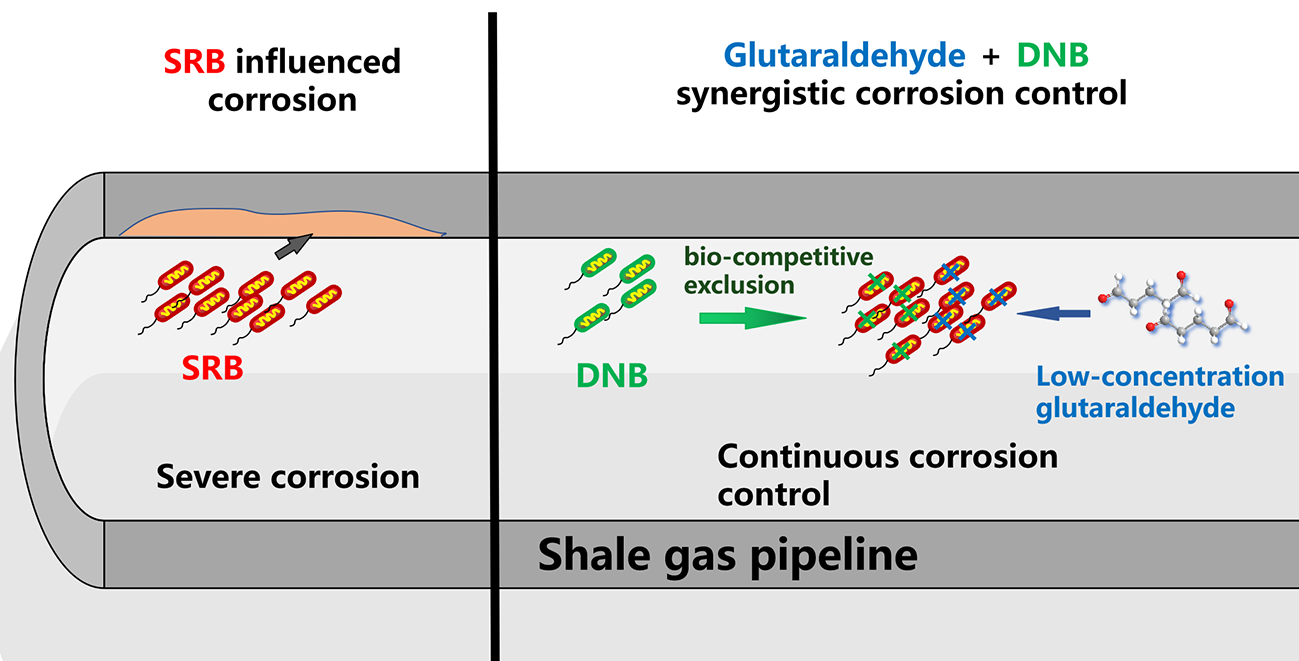
Sulfate-reducing bacteria (SRB)-induced corrosion presents a considerable challenge to the integrity of shale gas pipelines. Conventional reliance on chemical biocides is limited by the potential for microbial resistance and environmental impact. As an alternative, the bio-competitive exclusion approach, utilizing microbes such as denitrifying bacteria (DNB), offers a promising strategy. This study investigates an integrated control method, combining the biocide glutaraldehyde with DNB to synergistically inhibit SRB activity and corrosion. The efficacy and mechanisms were systematically evaluated through electrochemical measurements, weight-loss analysis, surface characterization, and microbial community profiling. Following synergistic treatment with glutaraldehyde and DNB, the average corrosion rate was reduced by 44.2% and the maximum corrosion depth decreased by 84.3% compared to the SRB-inoculated system. Microbial community analysis revealed a substantial decline in SRB abundance from 62.7% on day 1 to 11.9% by day 14 under the synergistic treatment. The combined approach proves economically and environmentally viable, offering the advantages of reduced chemical dosage and the avoidance of additional corrosion typically associated with DNB. These results provide a novel strategy for developing microbial-influenced corrosion control measures in shale gas infrastructure.
Keywords:
shale gas
; microbial-influenced corrosion control
; denitrifying bacteria
; bio-competitive exclusion
1. Introduction
During the extraction of shale gas resources utilizing hydraulic fracturing technology, flowback and produced water reservoirs introduce diverse microbial communities into pipeline systems [1]. SRB exhibit substantial destructive potential and pronounced corrosiveness towards metallic materials. SRB accelerate the metal degradation process and have been identified as primary contributors to microbiologically influenced corrosion by metabolizing sulfides and organic acids [2]. SRB generate compounds such as hydrogen sulfide (H2S) and metal sulfides, which induce and accelerate material corrosion under anaerobic conditions [3]. Conventional corrosion mitigation strategies predominantly rely on the application of chemical biocides. Commonly employed biocides for SRB control encompass aldehydes, quaternary ammonium compounds, nitrogen heterocycles, and formulated combinations thereof, exemplified by imidazoline and metronidazole [4]. Glutaraldehyde exerts biocidal effect through protein alkylation, inducing denaturation and subsequently impairing nucleic acid and enzymatic activities. It is widely employed due to its broad-spectrum efficacy, thermal stability, and rapid action characteristics [5]. However, inhomogeneous biocide distribution frequently results in localized sub-inhibitory concentrations, potentially permitting SRB survival and proliferation. Furthermore, prolonged biocide application may select for resistant microbial populations, ultimately necessitating elevated treatment dosages, causing potential adverse impacts on environmental ecosystems and human health [4].
Corrosion control through the bio-competitive exclusion (BCX) approach has garnered increasing attention in recent years [6]. This methodology employs microbial competition mechanisms to suppress SRB activity. DNB, characterized by their capacity to reduce nitrate to nitrite or directly to N2 or NH4+ through nitrate reductase activity, constitute fundamental components of this strategy [7]. DNB and SRB exhibit anaerobic metabolism with comparable physiological traits and environmental adaptations [8]. Competitive interactions are established between these microorganisms when spatial and nutritional resources are limited. Multiple inhibitory pathways are employed by DNB against SRB, including modulation of redox potential and interactions within anaerobic sulfur cycling [9], while competitive exclusion for nutrients is recognized as the predominant mechanism [10]. BCX implementation involves either direct introduction of DNB-containing microbial suspensions or supplementation with specific nutrients such as nitrate and nitrite. The effectiveness of DNB-mediated SRB suppression has been substantiated by experimental evidence. In investigations by Xu et al., inoculation with 5% DNB was demonstrated to reduce SRB populations by three orders of magnitude, revealing synergistic effects between nitrate and DNB in controlling SRB proliferation [11]. Field applications at the WuNan Oilfield confirmed that appropriate nitrate supplementation successfully activated DNB, modified microbial community composition, and diminished SRB dominance [12]. Fan et al proved that biosurfactants produced by DNB have been shown to strengthen competitive advantage against SRB through efficient elimination of corrosive sulfides and enhancement of nitrate-mediated inhibition pathways [13].
Despite these promising findings, existing research has predominantly focused on the inhibitory effects of DNB against SRB, while overlooking potential limitations. The nitrate reduction process and metabolic activities of DNB have been demonstrated to potentially contribute to microbiologically influenced corrosion [14]. Investigations by Dake et al. revealed that although nitrate injection effectively controlled SRB populations, the proliferation of DNB concurrently induced substantial metallic corrosion damage [14]. Neither biological competition nor chemical treatment alone can sufficiently address corrosion challenges. This limitation underscores the necessity for integrated approaches that simultaneously mitigate SRB proliferation and DNB-induced corrosion. The present research comprehensively examines the synergistic effects of glutaraldehyde and nitrate in controlling SRB activity while alleviating potential corrosion associated with DNB metabolism. Through integrated electrochemical measurements, microbial community analysis, and surface characterization techniques, the study aims to develop a balanced strategy that leverages both the rapid biocidal action of glutaraldehyde and the sustained ecological competition provided by nitrate-stimulated DNB. Following synergistic treatment with glutaraldehyde and DNB, the average corrosion rate was reduced by 44.2% and the maximum corrosion depth decreased by 84.3% compared to the SRB-inoculated system. Microbial community analysis revealed a substantial decline in SRB abundance from 62.7% on day 1 to 11.9% by day 14 under the synergistic treatment. These results demonstrate the significant efficacy of the combined glutaraldehyde and DNB strategy in suppressing sulfate-reducing activity and mitigating corrosion. The proposed approach addresses the inherent limitations of both individual methods while capitalizing on their complementary advantages. This findings provide new insights for developing integrated chemical and biological strategies to control microbiologically influenced corrosion in shale gas infrastructure, offering innovative solutions for corrosion management during shale gas production.
2. Materials and Methods
2.1. Isolation of SRB from Shale Gas Production Liquid
The composition of the SRB enrichment medium is presented in Table 1. Dissolved oxygen was removed by purging with nitrogen gas for 40 minutes. Sterilization was performed by autoclaving at 121°C for 30 minutes. The produced water samples were aseptically inoculated into SRB enrichment medium at 3% (v/v) inoculation volume using sterile syringes. Anaerobic cultivation was conducted at 35°C for 48 hours in a constant-temperature incubator, after which SRB growth status was examined. Culture bottles exhibiting distinct black precipitation were selected for subsequent purification. SRB was isolated through the Hungate roll tube technique. The purified SRB culture was maintained at 4°C as a stock for future experiments.
2.2. Enrichment and Identification of DNB Communities
The composition of the DNB culture medium is detailed in Table 2. All specified compounds were dissolved in 1 L of sterile distilled water. Dissolved oxygen was removed through nitrogen purging for 40 minutes. Sterilization was performed by autoclaving at 121°C for 30 minutes.
DNB Identification Medium (Giltay Medium): Solution A was prepared by dissolving 1.0 g KNO3, 1.0 g asparagine, and 5 mL of 1% bromothymol blue ethanol solution in 500 mL of distilled water. Solution B contained 8.5 g sodium citrate, 1.0 g MgSO4, 0.05 g FeCl3, 1.0 g KH2PO4, and 0.2 g CaCl2 dissolved in 500 mL of distilled water. The two solutions were combined after preparation, and the pH was adjusted to 7.0~7.2. The final mixture was stored protected from light with adequate ventilation for subsequent use.
For microbial enrichment, 10 mL of produced water sample (identical to that used for SRB enrichment) was aseptically injected into a serum vial containing 100 mL of enrichment medium using a sterile syringe. The vial was incubated at 35°C for 72 hours after thorough mixing. Following primary enrichment, 10 mL of cultured medium was transferred under aseptic conditions to a fresh vial containing 100 mL of enrichment medium for secondary enrichment. DNB community enriched for 3 times subculturing procedure.
To verify the presence of DNB, the acclimated culture was inoculated into Giltay medium. Development of a green color indicated successful DNB enrichment, while a blue color denoted the absence of viable bacteria. Nitrate concentration was quantified using the phenoldisulfonic acid spectrophotometric method to confirm the denitrification capability of the acclimated bacterial consortium.
2.3. Determination of Minimum Inhibitory Concentration (MIC)
1 mL of glutaraldehyde solutions at varying concentrations was individually added to 100 mL portions of the liquid medium. Each mixture was subsequently inoculated with 1 mL of B-1 bacterial suspension and homogenized, followed by incubation at 35°C for 48 hours. Development of intense black coloration accompanied by a pungent hydrogen sulfide odor indicated bacterial growth and proliferation at the corresponding glutaraldehyde concentration. Absence of visual changes in the medium demonstrated complete inhibition of B-1 strain growth at that concentration. The MIC value was determined according to the following criterion: when substantial bacterial growth was observed in positive control groups while blank control groups remained sterile, the lowest concentration preventing bacterial growth in experimental groups was defined as the minimum inhibitory concentration of glutaraldehyde.
2.4. Electrochemical Corrosion Testing
A conventional three-electrode system was assembled in a 250 mL three-neck flask. The configuration consisted of L245 carbon steel as working electrode, a saturated calomel electrode as reference electrode, and a graphite rod as counter electrode. Following flask sterilization and addition of prepared water samples, dissolved oxygen was removed through nitrogen purging for 2 hours. The working electrode was then introduced under controlled atmosphere, the system was hermetically sealed, and allowed to stabilize for 3 hours at 35°C prior to electrochemical measurements. Seven experimental conditions were established: blank control (contrast group), SRB inoculation (SRB group), DNB inoculation (DNB group), mixed bacterial culture (DNB+SRB group), mixed bacterial culture with nitrate supplementation (KNO3 group), mixed bacterial culture with glutaraldehyde addition (glutaral group), and mixed bacterial culture, glutaraldehyde and nitrate (glutaral+KNO3 group).
Open circuit potential (OCP), electrochemical impedance spectroscopy (EIS), and linear polarization resistance (LPR) were measured for all experimental groups. Equivalent circuit modeling was conducted using Zsimpwin software. All electrochemical data were processed and analyzed through the integrated software of the electrochemical workstation.
2.5. Static Weight Loss Testing
L245 steel coupons with dimensions of 40×13×2 mm were utilized for corrosion weight loss measurements. The specimen surfaces were sequentially ground with metallographic sandpaper, followed by ultrasonic cleaning in acetone and deionized water. Subsequent dehydration was performed using absolute ethanol, with final drying under a cool air stream. Seven experimental conditions were established: blank control (contrast group), SRB inoculation (SRB group), DNB inoculation (DNB group), mixed bacterial culture (DNB+SRB group), mixed bacterial culture with nitrate supplementation (KNO3 group), mixed bacterial culture with glutaraldehyde addition (glutaral group), and mixed bacterial culture, glutaraldehyde and nitrate (glutaral+KNO3 group) .
All solutions were deoxygenated by nitrogen purging for 40 minutes. Under continuous nitrogen protection, the corrosion vessels were sealed with epoxy resin and maintained at 35°C for 14 days. The L245 coupons were extracted and processed according to GB/T 16545-2015 standards for removal of surface corrosion products and biofilms. Clean water served as the control reference. The corrosion rate for each system was determined by averaging results from triplicate coupons. Corrosion rates were calculated based on mass loss measurements using the following equation:
V – Average corrosion rate, mm/year
Δm – the reduced weight, g
S – exposed surface area of steel coupon, m2
t – immersion duration, hours
ρ – density of steel, g/cm3
2.6. Microbial Community Composition Analysis
Four experimental groups were established: mixed bacterial culture with glutaral group (samples 1, 5, 9, 13, 17), KNO3 group (samples 2, 6, 10, 14, 18), glutaral+KNO3 group (samples 3, 7, 11, 15, 19), and SRB+KNO3 group (samples 4, 8, 12, 16, 20). On days 1, 3, 7, 10, and 14 of the experiment, mixed bacterial cultures were centrifuged at 10,000 rpm for 3 minutes at 4°C. Following supernatant removal, the bacterial pellets were stored at -80°Cprior to genomic analysis conducted by Luoning Biotech.
Genomic DNA was purified using the Zymo Research BIOMICS DNA Microprep Kit with integrity verified through 0.8% agarose gel electrophoresis. Nucleic acid concentration was quantified employing the PicoGreen fluorescence method on a Tecan F200 system. Full-length 16S rDNA amplification was performed using indexed primers 8F (5'-AGAGTTTGATCATGGCTCAG-3') and 1492R (5'-CGGTTACCTTGTTACGACTT-3'). Purified DNA was fragmented using Covaris instrumentation for sequencing library construction. Quantified libraries were sequenced on the Nanopore GridION platform.
Bioinformatic processing involved initial quality control of raw sequencing data using NanoFilt (v2.7.1), followed by chimera removal with Uchime algorithm against the gold reference database. Quality-filtered sequences were clustered into operational taxonomic units (OTU) using Kraken2. Taxonomic classification was performed with RDP classifier (v2.11) against the SILVA 16S rRNA database (v132) at 70% confidence threshold across phylum to species levels. Microbial community composition was visualized through bar plots generated in R language, enabling comparative analysis of temporal structural dynamics across experimental conditions.
3. Results and Discussion
3.1. Isolation of SRB
A SRB strain B1 was isolated from produced water obtained from the Weiyuan shale gas field. Colonies exhibited circular morphology with diameters ranging from 1.1 to 1.3 mm. Scanning electron microscopy (SEM) analysis of the purified strain B1. Figure 1a revealed short rod-shaped cellular structures measuring approximately 1.5 μm in length and 0.5 μm in width. Sequence homology analysis conducted through BLAST alignment demonstrated 96.7% similarity between strain B-1 and Desulfovibrio alaskensis B-1497 in the reference database (b).
Based on 16S rDNA sequence analysis, strain B-1 was identified as a member of the genus Desulfovibrio. The effects of temperature and pH on bacterial growth were subsequently investigated, with OD600 (the optical density at 600 nm) as the indicator for evaluating bacterial growth. As shown in Figure 2a, strain B-1 proliferated within a temperature range of 25~40°C, with optimal growth observed at 35°C. Growth inhibition occurred when temperatures exceeded 40°C. Figure 2b illustrates bacterial growth under varying initial pH conditions. Minimal growth was detected at pH 4.0, indicating significant suppression of SRB proliferation under acidic conditions. Gradual enhancement of B-1 growth was observed as pH increased from 4.0 to 7.0. However, growth inhibition recurred when initial pH values exceeded 7.0. Metabolic activity of strain B-1 was determined to be significantly higher in alkaline conditions (pH 7.0~9.0) compared to acidic environments (pH 4.0~7.0), demonstrating greater sensitivity to acidic stress. Optimal growth occurred under neutral to weakly alkaline conditions, with pH 7.0 identified as the optimum for strain B-1 proliferation.
3.2. Enrichment of DNB
As presented in Figure S1, the inoculated medium (right) exhibited green pigmentation compared to the blue blank control, confirming the denitrification capability of the acclimated microbial consortium [16]. Physiological characterization of the enriched DNB community was subsequently performed. As illustrated in Figure 3a, microbial growth was sustained across a temperature range of 20~45°C, with optimal metabolic activity recorded at 35°C. Significant growth inhibition was observed when temperatures deviated below 25°C or exceeded 40°C. The pH tolerance profile presented in Figure 3b demonstrated minimal microbial activity at pH 4.0 and 9.0, whereas substantial population increases occurred at pH 6.0 and 7.0, indicating favorable growth conditions. The comparable optimal temperature and pH ranges shared between DNB and SRB communities establish fundamental conditions for effective microbial competition. This physiological compatibility enables DNB to competitively exclude SRB under appropriate environmental conditions, supporting the practical implementation of bio-competitive exclusion strategies for controlling SRB-induced corrosion.
3.3. Influence of Nitrate Concentration and DNB on SRB Activity
The effects of nitrate concentration on strain B-1 were investigated by monitoring sulfate ion concentration, pH variation, and bacterial population dynamics in aqueous systems. As shown in Figure 4, sulfate concentration decreased over time while pH values increased, which can be attributed to bicarbonate generation through SRB-mediated oxidation of organic carbon sources during sulfate metabolism. As sulfate ions serve as terminal electron acceptors in SRB respiratory metabolism, their concentration directly governs the extent of microbial sulfate reduction. Figure 4a demonstrates that potassium nitrate supplementation resulted in lower pH values compared to the control group, indicating retarded SRB growth and consequent suppression of sulfate consumption. According to Figure 4b, sulfate depletion rates were significantly reduced in nitrate systems relative to the control, confirming the inhibitory effect of nitrate on SRB proliferation. This inhibition exhibited concentration dependency, with optimal suppression achieved at nitrate concentrations exceeding 200 mg/L. Supporting evidence from optical density measurements (Figure 4c) revealed decreased OD600 values and reduced SRB populations in nitrate-treated systems, particularly at nitrate concentrations above 200 mg/L. However, gradual diminution of inhibitory effects was observed from the fourth day of nitrate exposure. Considering both economic efficiency and environmental impact, the 200 mg/L nitrate system was identified as providing the most favorable balance between inhibition efficiency and practical implementation.
Subsequent investigation examined the influence of DNB inoculation dosage on SRB activity through co-cultivation of sulfate-reducing strain B1 with enriched DNB communities. As demonstrated in Figure 5a and Figure 5b, all DNB-added systems exhibited lower pH values compared to the SRB control, following the hierarchical order: pH (control) > pH (SRB+1% DNB) > pH (SRB+2% DNB) > pH (SRB+3% DNB). Progressive sulfate consumption occurred over the incubation period, though sulfate depletion rates were substantially attenuated with increasing DNB inoculation volumes, indicating dose-dependent suppression of SRB metabolic activity. Nitrate concentration profiles presented in Figure 5c revealed minor nitrate reduction in the SRB-only control after 8 days, whereas rapid nitrate depletion occurred in DNB-supplemented systems due to microbial assimilation during metabolic processes. Corresponding SRB population dynamics shown in Figure 5d demonstrated significant growth inhibition proportional to DNB inoculation dosage. The moderate SRB population recovery observed during later experimental stages may be attributed to declining nitrate availability limiting further DNB proliferation.
3.4. Minimum Inhibitory Concentration of Glutaraldehyde
Glutaraldehyde represents one of the most widely employed biocides in oilfield operations, recognized for its broad-spectrum efficacy, thermal stability, and rapid bactericidal action [5]. Glutaraldehyde was selected as the biocide for SRB suppression, with tested concentrations of 10, 20, 30, 40, and 50 mg/L. As shown in Figure S2, distinct black precipitation and characteristic hydrogen sulfide odor were detected in culture bottles after 48-hour incubation, indicating substantial SRB proliferation. SRB growth was observed at glutaraldehyde concentrations of 10 and 20 mg/L, whereas no visible growth occurred at 30, 40, or 50 mg/L. The MIC was consequently determined to be 30 mg/L. However, upon extended observation to day 8, resumed SRB growth accompanied by solution darkening was noted in all concentration groups. This result demonstrates the time-dependent limitation of this biocide for long-term SRB control.
3.5. Electrochemical Corrosion Analysis
3.5.1. Open Circuit Potential and Linear Polarization Resistance
The open circuit potential (OCP) directly reflects metallic corrosion propensity. More negative OCP values indicate greater susceptibility to corrosion in the specific electrolyte environment [17]. Temporal evolution of OCP across experimental groups is presented in Figure 6a. The control group maintained relatively stable OCP values within a 0.15 V fluctuation range throughout the 24~336 h monitoring period. In SRB, DNB, and SRB+DNB group, initial OCP shifts toward positive potentials were observed during the first 48 h, potentially attributable to temporary protective effects from initial biofilm formation on electrode surfaces [18]. Subsequent negative potential shifts occurred after 48 h in SRB and DNB group, indicating enhanced corrosion tendencies. Although minor potential recoveries were detected during bacterial decline phases, overall OCP trajectories demonstrated progressive negative shifts. Both SRB and DNB group promoted increasing corrosion tendencies, with the mixed culture system exhibiting similar patterns albeit with less pronounced negative shifts than the SRB group. KNO3 group displayed initial positive potential shifts followed by negative drifts, ultimately achieving intermediate OCP values between DNB and SRB systems. This pattern suggests that while nitrate stimulation of DNB activity moderately enhances corrosion propensity compared to DNB alone, it simultaneously facilitates synergistic SRB suppression. Notably, glutaral group and glutaral+KNO3 group exhibited sustained positive potential shifts throughout the experimental period, with the glutaral+KNO3 group positive potential shift more significant. The enhanced corrosion mitigation observed in the combined treatment demonstrates superior protective effects compared to individual applications.
Linear polarization resistance (LPR) is a non-destructive electrochemical technique enabling continuous monitoring of corrosion processes, characterized by a linear relationship between applied potential and resulting current within the polarization region. The polarization resistance (Rp) serves as a quantitative indicator of corrosion behavior, exhibiting an inverse proportionality to both corrosion current density (i0) and corrosion rate, permitting temporal monitoring of corrosion progression [19]. Figure 6b illustrates the temporal evolution of Rp values across seven experimental configurations. The control group demonstrated an initial Rp decrease followed by gradual recovery, attributable to early-stage corrosion initiation in sterile solution and subsequent formation of protective corrosion product layers. Both SRB and DNB groups exhibited triphasic Rp patterns: initial increase, subsequent decline, and final recovery. The primary increase (0~24 h) presumably resulted from protective biofilm formation, while subsequent reduction reflected localized corrosion under microbial metabolic activity [20]. The final recovery phase corresponded to densification of corrosion product films. SRB group induced more severe corrosion than DNB group, as evidenced by lower minimum Rp values. SRB+DNB and KNO3 group displayed similar triphasic trends, though mechanistic differences were observed. The KNO3 group exhibited earlier and more pronounced Rp increase (24 h vs 48 h in mixed culture), suggesting accelerated DNB activation and consequent competitive suppression of SRB. The glutaral group showed continuous Rp decline, indicating limited long-term efficacy at MIC concentration. In contrast, the glutaral+KNO3 group demonstrated the most favorable performance, with initial Rp increase (0~24 h) followed by moderate decrease (24~168 h) and subsequent recovery (168~336 h). LPR result reflects dynamic interactions between nitrate-stimulated biofilm formation and glutaraldehyde-mediated microbial inhibition. Throughout the experimental period, the combined treatment consistently maintained higher Rp values than all other microbial-inoculated systems, demonstrating synergistic corrosion control through integrated chemical and biological mechanisms.
3.5.2. Electrochemical Impedance Spectroscopy Analysis
Nyquist plot characteristics are intrinsically associated with the properties of corrosion product films formed on electrode surfaces [21]. The diameter of capacitive arcs reflects the charge transfer resistance at the electrode-electrolyte interface, with larger diameters corresponding to greater inhibition of electrochemical reactions and reduced corrosion rates [22]. As shown in Figure 7, the control group exhibited minimal capacitive arc diameter on day 2, followed by progressive enlargement attributed to accumulating corrosion products increasing charge transfer resistance. Maximum arc dimensions were recorded on day 10, subsequent to which diameter reduction indicated renewed corrosion activity. The SRB group demonstrated triphasic capacitive arc evolution: initial increase (days 0~3) suggested protective biofilm formation, followed by diameter minimization on day 5 indicating severe corrosion, and subsequent fluctuations reflecting alternating biofilm detachment and reformation processes [21]. The DNB group exhibited progressively enlarging capacitive arc radii during the initial three-day period, a pattern consistent with observations in the SRB group. This similarity indicates successful colonization and biofilm formation by both microbial types on the electrode surface. The arc radii decreased, reaching minima on days 5 and 14 that corresponded to maximum corrosion severity. This phenomenon may be attributed to cyclic processes involving detachment and re-accumulation of corrosion products and biofilms. The KNO3 group exhibited significantly larger capacitive arc radii compared to the SRB-inoculated group, demonstrating reduced corrosion severity in the mixed microbial consortium, confirmed that DNB enrichment effectively mitigates SRB-induced metallic corrosion. However, the observed corrosion extent in KNO3 group exceeded that of the SRB+DNB group, suggesting that nitrate stimulation of DNB metabolic activity may inadvertently enhance corrosion progression. The glutaral group achieved maximum capacitive arc dimensions on day 1, indicating optimal initial biocidal efficacy. Subsequent gradual reduction in arc radii reflected progressive corrosion acceleration due to diminishing inhibitory effects. In contrast, the resistance arc radius of glutaral+KNO3 group increased in day14, exhibited the maximum capacitive arc diameter, indicating sustained corrosion protection enabled by the combined application of DNB and glutaraldehyde over extended exposure.
The maximum phase angle peak in Bode plots and the corresponding log|Z| values in low-frequency regions serve as reliable indicators for evaluating the status of biofilms or corrosion products on metal surfaces. A shift of the maximum phase angle toward lower frequencies signifies suppression of uniform corrosion on working electrodes, suggesting the possible formation of protective corrosion products or biofilms [23]. As illustrated in Figure 8, Bode plot variations across experimental groups demonstrate remarkable consistency with capacitive arc radius evolution in Nyquist plots. In all microbial-inoculated groups, the maximum phase angle frequency predominantly shifted toward lower frequencies, accompanied by progressive reduction of log|Z| peak values in corresponding frequency ranges. These observations confirm the continuous development of corrosion product films on working electrode surfaces across all seven experimental conditions. Previous investigations have established that biofilm detachment from metal surfaces induces characteristic shifts of maximum phase angle frequency toward higher spectral regions [24]. Such frequency migration was periodically observed during later experimental stages in microbial-inoculated systems. Specifically, the DNB system exhibited initial low-frequency shifting of maximum phase angle during the first five days, followed by pronounced high-frequency migration after day 5. This transition corresponds precisely with the minimum capacitive arc diameter observed in Nyquist plots on day 5, confirming accelerated corrosion progression. The group of glutaral、KNO3、and glutaral + KNO3 demonstrated cyclic frequency migration patterns, where initial high-frequency shifts were subsequently reversed by low-frequency migration. This oscillatory behavior reflects the detachment of accumulated corrosion products and microbial biofilms from the working electrode surface, followed by subsequent regeneration of fresh corrosion products and biofilms through continued microbial growth and metabolic activity [23].
To further investigate the electrochemical impedance characteristics of working electrodes across different systems, appropriate equivalent circuits were selected and EIS data were fitted using Zsimpwin software. The sterile control group was fitted with an R(QR)(QR) equivalent circuit, while microbial-inoculated systems were modeled using an R(Q(R(QR))) equivalent circuit [25]. The fitted values for Rs, Rf, and Rct are depicted in Figure 9. Variations in Rf values correlate closely with the structural evolution of surface films on electrode substrates. Increased Rf values generally indicate the formation of corrosion product layers or biofilms on working electrode surfaces. Conversely, temporary reductions in Rf values may result from structural loosening or partial detachment of surface films due to excessive corrosion products or microbial activity [26]. The Rct parameter, directly related to the thickness of adsorbed surface layers, serves as a quantitative indicator of corrosion severity on working electrodes [27]. Compared to the sterile control, most experimental systems exhibited initial slight decrease followed by progressive increase in Rs values, with the exception of glutaraldehyde-treated systems. This pattern may be attributed to partial deposition of microbial metabolites and accumulation of extracellular polymeric substances produced during microbial growth [28]. Microbial-inoculated systems demonstrated significantly higher Rf values than the sterile control, confirming the presence of biofilms and corrosion products on electrode surfaces. Continuous increase in Rf values throughout the experimental period indicated progressive thickening of corrosion product layers. Both glutaral group and glutaral+KNO3 systems exhibited lower Rct values than SRB and DNB groups, demonstrating that combined chemical and biological treatments effectively suppress biofilm formation through microbial inhibition.
3.6. Weight Loss Measurements and Coupon Surface Characterization
Corrosion rates of working electrodes in seven different systems were calculated using Equation 1. As presented in Figure 10a, the SRB group exhibited the maximum average corrosion rate of 0.02881 mm/a, significantly higher than the 0.01688 mm/a recorded in the DNB group. The SRB+DNB group, KNO3 group, glutaral group, glutaral + KNO3 group demonstrated corrosion rate of 0.02016 mm/a, 0.02077 mm/a, 0.01687 mm/a and 0.01608 mm/a, confirming superior corrosion mitigation through synergistic application. Maximum localized corrosion depths were quantified through three-dimensional optical microscopy. Figure S3 demonstrates surface topography images across experimental groups, with corresponding maximum pit depths summarized in Figure 10b. Following 14-day immersion, maximum pit depths measured 0.5146 μm (control), 9.7258 μm (SRB), 3.9954 μm (DNB), 4.9258 μm (SRB+DNB), 7.2455 μm (KNO3), 1.8726 μm (glutaral), and 1.5285 μm (glutaral + KNO3). The control group displayed characteristic uniform corrosion with minimal penetration depth, and SRB group produced the most severe localized corrosion, while DNB group substantially reduced pitting severity. However, KNO3 group increased corrosion penetration, consistent with previous electrochemical observations. The glutaral + KNO3 dramatically suppressed maximum pit depth, with the combined treatment demonstrating optimal performance against localized corrosion.
3.7. Microbial Community Analysis
As shown in Figure 11, high-throughput sequencing revealed Bacillus, Desulfovibrio, Clostridium, and Pseudomonas emerged as predominant taxa at genus level. Desulfovibrio represents typical SRB genera [29], while both Clostridium and Bacillus possess denitrification capabilities [30]. Glutaral group maintained highest Clostridium abundance (43.6%-79.3%), with Desulfovibrio at 25.7%-38.1%. SRB abundance decreased during days 1-10 but recovered by day 14, potentially indicating diminished biocidal efficacy. KNO3 group demonstrated Clostridium abundance of 39.3%-85.8% and Desulfovibrio at 18.7%-40.5%, showing progressive SRB suppression and DNB enrichment through competitive exclusion. The glutaral + KNO3 group achieved most effective SRB suppression with Desulfovibrio abundance limited to 20.1%-60.3%, confirming synergistic inhibition throughout the experimental period. The SRB+DNB group exhibited initial Desulfovibrio dominance (62.7%) followed by progressive decline to 11.9% by day 14, while Clostridium generally increased, demonstrating substantial SRB suppression through DNB competition.
4. Conclusions
SRB-induced corrosion presents a considerable challenge to the integrity of shale gas pipelines. Conventional reliance on chemical biocides is limited by the potential for microbial resistance and environmental impact. As an alternative, the bio-competitive exclusion approach, utilizing microbes such as DNB, offers a promising strategy. This study investigates an integrated control method, combining the biocide glutaraldehyde with DNB to synergistically inhibit SRB activity and corrosion. The efficacy and mechanisms were systematically evaluated through electrochemical measurements, weight loss analysis, surface characterization, and microbial community profiling. This synergistic strategy not only minimizes chemical usage but also circumvents the potential corrosivity associated with DNB alone. The systematic investigation of the bio-competitive exclusion and chemical treatment process provides novel insights for developing integrated chemical and biological strategies to control microbiologically influenced corrosion in shale gas infrastructure. These findings provide a novel and sustainable framework for controlling microbiologically influenced corrosion in energy infrastructure.
Supplementary Materials
The following supporting information can be downloaded at the website of this paper posted on Preprints.org, Figure S1: The cultivation of DNB causes the Giltay liquid medium to turn green (right), while the left bottle is a sterile Giltay liquid medium; Figure S2: Antibacterial effects of different concentrations of glutaraldehyde; Figure S3: Three-dimensional microscopic images of steel sheets under different conditions. A: control group; B: SRB group; C: DNB group; D: SRB+DNB group; E: KNO3 group; F: glutaral group; G: glutaral + KNO3 group. In KNO3 group, glutaral group and glutaral+KNO3 group, SRB and DNB mixed bacteria were added.
Author Contributions
Conceptualization, Yu Guo. and Chongrong Wen.; methodology, Yu Guo. and Chongrong Wen; validation, Yu Guo.; formal analysis, Guihong Lan.; investigation, Guihong Lan. and Ming Duan.; data curation, Yu Guo.; writing—original draft preparation, Yu Guo; writing—review and editing, Guihong Lan; visualization, Guihong Lan; supervision, Guihong Lan; project administration, Ming Duan; funding acquisition, Ming Duan. All authors have read and agreed to the published version of the manuscript.
Funding
This work was funded by PetroChina Southwest Oil and Gas Field Company (No: 2024D106-02-02).
Data Availability Statement
The original contributions presented in this study are included in the article. Further inquiries like genomic data can be directed to the corresponding authors.
Conflicts of Interest
The authors declare no conflicts of interest.
Abbreviations
The following abbreviations are used in this manuscript:
| SRB | sulfate-reducing bacteria |
| DNB | denitrifying bacteria |
| H2S | hydrogen sulfide |
| BCX | bio-competitive exclusion |
| MIC | determination of minimum inhibitory concentration |
| OCP | open circuit potential |
| EIS | electrochemical impedance spectroscopy |
| LPR | linear polarization resistance |
| OTU | operational taxonomic units |
| SEM | scanning electron microscopy |
| OD600 | the optical density at 600 nm |
References
- Jiang, X.; Zhang, Q.; Qu, D.; Xu, K.; Song, X. Corrosion behavior of L360 N and L415 N mild steel in a shale gas gathering environment – Laboratory and on-site studies. Journal of Natural Gas Science and Engineering 2020, 82, 103492. [Google Scholar] [CrossRef]
- Venzlaff, H.; Enning, D.; Srinivasan, J.; Mayrhofer, K. J. J.; Hassel, A. W.; Widdel, F.; Stratmann, M. Accelerated cathodic reaction in microbial corrosion of iron due to direct electron uptake by sulfate-reducing bacteria. Corrosion Science 2013, 66, 88–96. [Google Scholar] [CrossRef]
- Lee, W.; Lewandowski, Z.; Nielsen, P. H.; Hamilton, W. A. Role of sulfate-reducing bacteria in corrosion of mild steel: A review. Biofouling 1995, 8, 165–194. [Google Scholar] [CrossRef]
- Liu, H. X.; Jin, Z. Y.; Liu, H. F.; Meng, G. Z.; Liu, H. W. Microbiological corrosion acceleration of N80 steel in shale gas field produced water containing Citrobacter amalonaticus at 60? bioelectrochemistry 2022, 148, 108253. [Google Scholar] [CrossRef]
- Wen, J.; Zhao, K.; Gu, T.; Raad, I. I. A green biocide enhancer for the treatment of sulfate-reducing bacteria (SRB) biofilms on carbon steel surfaces using glutaraldehyde. International Biodeterioration & Biodegradation 2009, 63, 1102–1106. [Google Scholar] [CrossRef]
- Fu, Q.; Xu, J.; Wei, B.; Qin, Q.; Bai, Y.; Yu, C.; Sun, C. Biologically competitive effect of Desulfovibrio desulfurican and Pseudomonas stutzeri on corrosion of X80 pipeline steel in the Shenyang soil solution. Bioelectrochemistry 2022, 145, 108051. [Google Scholar] [CrossRef]
- Li, W.; Li, J.; Wu, Y.; Chen, M.; Fu, Y.; Li, W.; Liu, S.; Wang, J.; Chen, Y. Efficient nitrogen removal by alternating axial distribution of nitrification and denitrification on conductive aeration membrane in membrane aerated biofilm reactor(MABR). Separation and Purification Technology 2026, 382, 136037. [Google Scholar] [CrossRef]
- Yamamoto-Ikemoto, R.; Matsui, S.; Komori, T.; Bosque-Hamilton, E. J. Symbiosis and competition among sulfate reduction, filamentous sulfur, denitrification, and poly-p accumulation bacteria in the anaerobic-oxic activated sludge of a municipal plant. Water Science and Technology 1996, 34, 119–128. [Google Scholar] [CrossRef]
- Yamamoto-Ikemoto, R.; Matsui, S.; Komori, T. Ecological interactions among denitrification, poly-P accumulation, sulfate reduction, and filamentous sulfur bacteria in activated sludge. Water Science and Technology 1994, 30, 201–210. [Google Scholar] [CrossRef]
- Fu, Q.; Xu, J.; Wei, B.; Qin, Q.; Bai, Y.; Yu, C.; Sun, C. Mechanistic diversity between nitrate and nitrite on biocorrosion of X80 pipeline steel caused by Desulfovibrio desulfurican and Pseudomonas stutzeri. Corrosion Science 2022, 207, 110573. [Google Scholar] [CrossRef]
- Xu, L.B.; Lei, F. Q.; Chen, H. D.; Qin, F. L. Effect of Denitrification on SRB in Oilfield Produced Water. Yunnan Chemical Technology 2020, 47, 39–41. [Google Scholar]
- Zhao, M. L.; Sui, G. Z.; Xu, X. K.; Sun, W. G.; Sun, X. Y.; Kang, Y. Biological Inhibition of Sulfate-reducing Bacteria in Produced Water from Wunan Oilfield. Drilling and Production Technology 2021, 44, 106–110. [Google Scholar]
- Fan, F.; Zhang, B.; Liu, J.; Cai, Q.; Lin, W.; Chen, B. Towards sulfide removal and sulfate reducing bacteria inhibition: Function of biosurfactants produced by indigenous isolated nitrate reducing bacteria. Chemosphere 2020, 238, 124655. [Google Scholar] [CrossRef]
- Xu, D.; Li, Y.; Song, F.; Gu, T. Laboratory investigation of microbiologically influenced corrosion of C1018 carbon steel by nitrate reducing bacterium Bacillus licheniformis. Corrosion Science 2013, 77, 385–390. [Google Scholar] [CrossRef]
- Wu, H.; Huang, C.; Wen, N.; Mao, T.; Tao, S.; Wang, M. Analysis of the corrosion failure causes of shale gas surface pipelines. Materials and Corrosion 2021, 72, 1908–1918. [Google Scholar] [CrossRef]
- Blasco, R.; Castillo, F.; MartinezLuque, M. The assimilatory nitrate reductase from the phototrophic bacterium, Rhodobacter capsulatus E1F1, is a flavoprotein. FEBS letters 1997, 414, 45–49. [Google Scholar] [CrossRef]
- Wysocka, J.; Cieslik, M.; Krakowiak, S.; Ryl, J. Carboxylic acids as efficient corrosion inhibitors of aluminium alloys in alkaline media. Electrochimica Acta 2018, 289, 175–192. [Google Scholar] [CrossRef]
- Mansfeld, F. The use of electrochemical techniques for the investigation and monitoring of microbiologically influenced corrosion and its inhibition – a review. Materials and Corrosion 2003, 54, 489–502. [Google Scholar] [CrossRef]
- Moradi, M.; Song, Z.; Yang, L.; Jiang, J.; He, J. Effect of marine Pseudoalteromonas sp. on the microstructure and corrosion behaviour of 2205 duplex stainless steel. Corrosion Science 2014, 84, 103–112. [Google Scholar] [CrossRef]
- Beech, I. B.; Campbell, S. A. Accelerated low water corrosion of carbon steel in the presence of a biofilm harbouring sulphate-reducing and sulphur-oxidising bacteria recovered from a marine sediment. Electrochimica Acta 2008, 54, 14–21. [Google Scholar] [CrossRef]
- Xu, D.; Xia, J.; Zhou, E.; Zhang, D.; Li, H.; Yang, C.; Li, Q.; Lin, H.; Li, X.; Yang, K. Accelerated corrosion of 2205 duplex stainless steel caused by marine aerobic Pseudomonas aeruginosa biofilm. Bioelectrochemistry 2017, 113, 1–8. [Google Scholar] [CrossRef] [PubMed]
- Liu, H.; Gu, T.; Asif, M.; Zhang, G.; Liu, H. The corrosion behavior and mechanism of carbon steel induced by extracellular polymeric substances of iron-oxidizing bacteria. Corrosion Science 2017, 114, 102–111. [Google Scholar] [CrossRef]
- Moradi, M.; Duan, J.; Ashassi-Sorkhabi, H.; Luan, X. De-alloying of 316 stainless steel in the presence of a mixture of metal-oxidizing bacteria. Corrosion Science 2011, 53, 4282–4290. [Google Scholar] [CrossRef]
- Aljohani, T. A.; Hayden, B. E. A simultaneous screening of the corrosion resistance of Ni–W thin film alloys. Electrochimica Acta 2013, 111, 930–936. [Google Scholar] [CrossRef]
- Qian, H.; Zhang, J.; Cui, T.; Fan, L.; Chen, X.; Liu, W.; Chang, W.; Du, C.; Zhang, D. Influence of NaCl concentration on microbiologically influenced corrosion of carbon steel by halophilic archaeon Natronorubrum tibetense. Bioelectrochemistry 2021, 140, 107746. [Google Scholar] [CrossRef]
- Lin, C.; Ruan, H. Multi-phase-field modeling of localized corrosion involving galvanic pitting and mechano-electrochemical coupling. Corrosion Science 2020, 177, 108900. [Google Scholar] [CrossRef]
- Wang, H.; Hu, C.; Hu, X.; Yang, M.; Qu, J. Effects of disinfectant and biofilm on the corrosion of cast iron pipes in a reclaimed water distribution system. Water Research 2012, 46, 1070–1078. [Google Scholar] [CrossRef]
- Sheng, X.; Ting, Y.-P.; Pehkonen, S. O. The influence of sulphate-reducing bacteria biofilm on the corrosion of stainless steel AISI 316. Corrosion Science 2007, 49, 2159–2176. [Google Scholar] [CrossRef]
- Liu, H.; Cheng, Y. F. Corrosion of X52 pipeline steel in a simulated soil solution with coexistence of Desulfovibrio desulfuricans and Pseudomonas aeruginosa bacteria. Corrosion Science 2020, 173, 108753. [Google Scholar] [CrossRef]
- Chu, L.; Wang, J. Denitrification of groundwater using PHBV blends in packed bed reactors and the microbial diversity. Chemosphere 2016, 155, 463–470. [Google Scholar] [CrossRef]
Figure 1.
Electron microscope image (a) and phylogenetic tree (b) of strain B1.
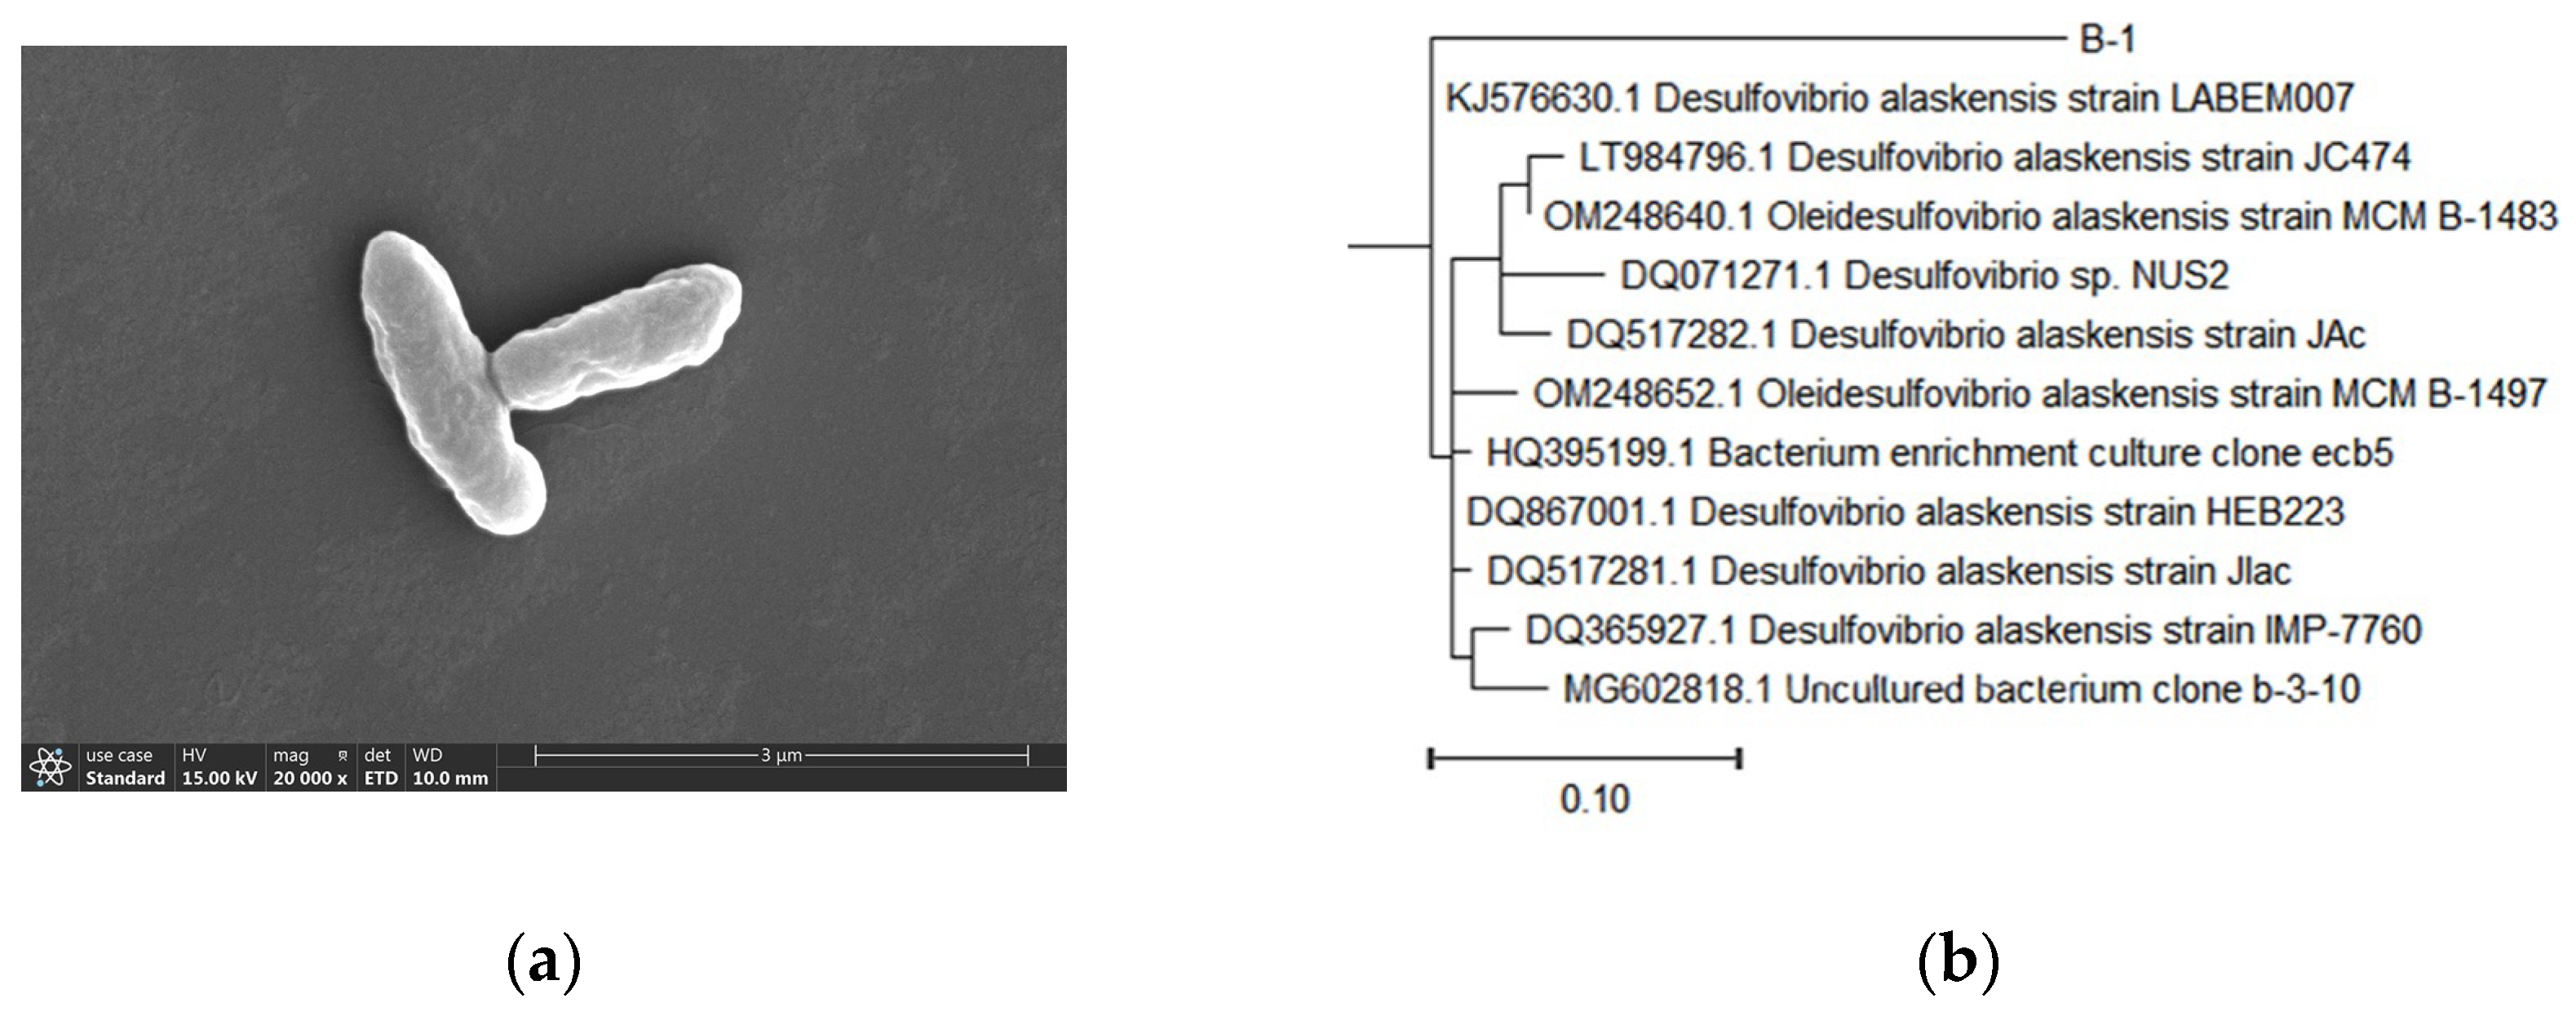
Figure 2.
The effects of temperature (a) and pH (b) on the growth of strain B1.
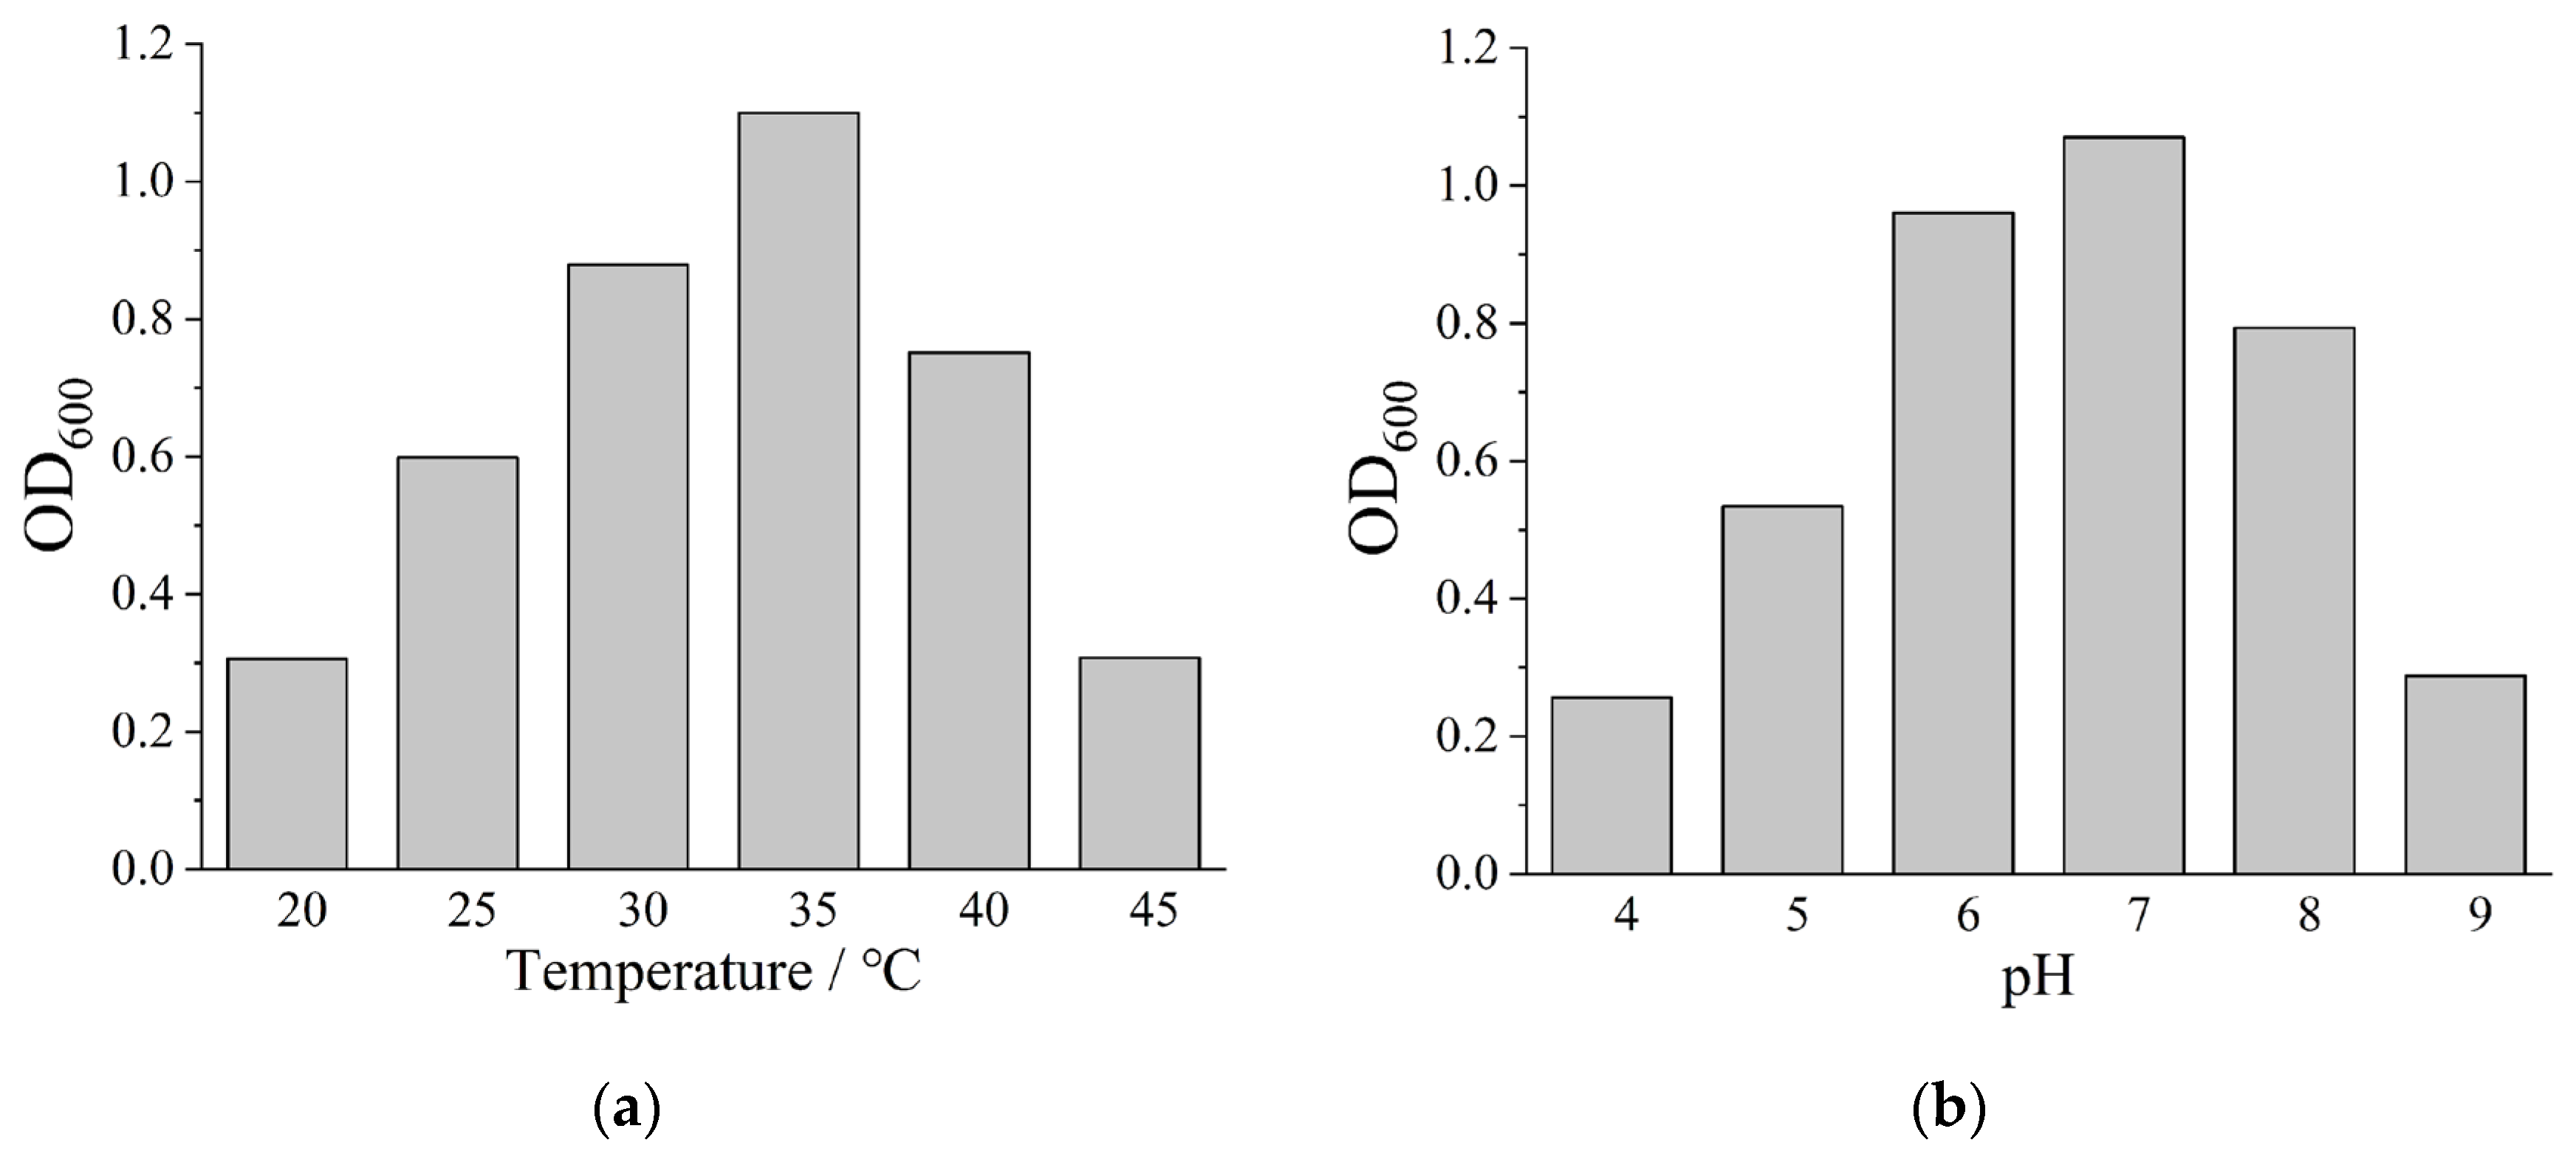
Figure 3.
The effects of temperature (a) and pH (b) on the growth of the DNB community.
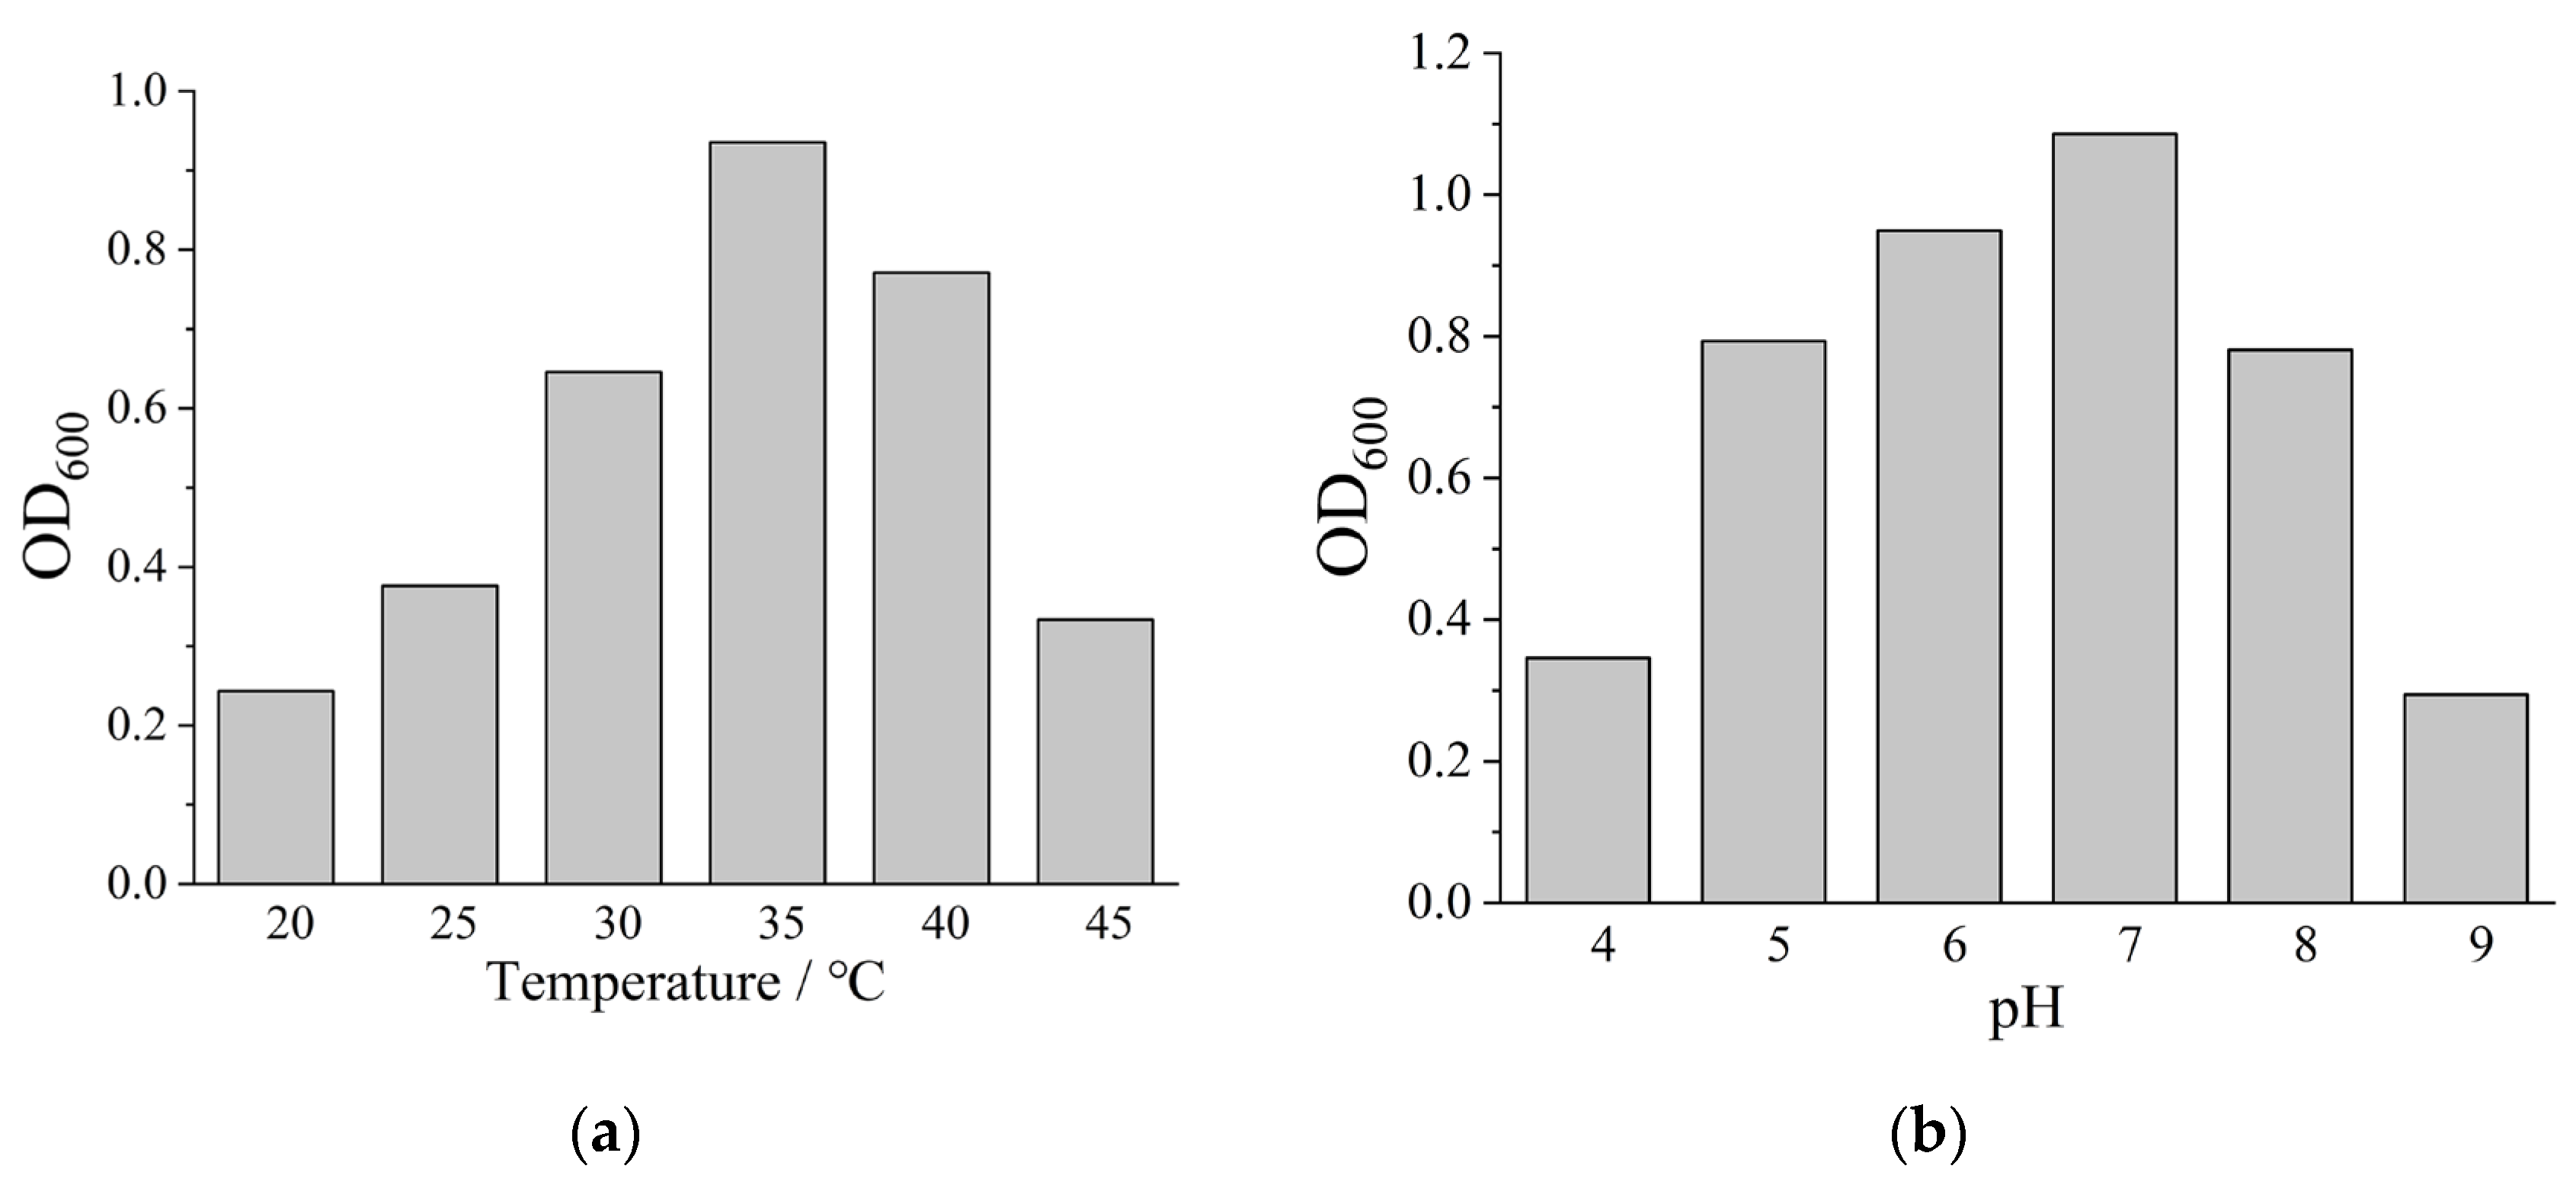
Figure 4.
Effects of different nitrate concentrations on pH (a), SO42- concentration (b), and OD600 (c) in the
system.
Figure 4.
Effects of different nitrate concentrations on pH (a), SO42- concentration (b), and OD600 (c) in the
system.
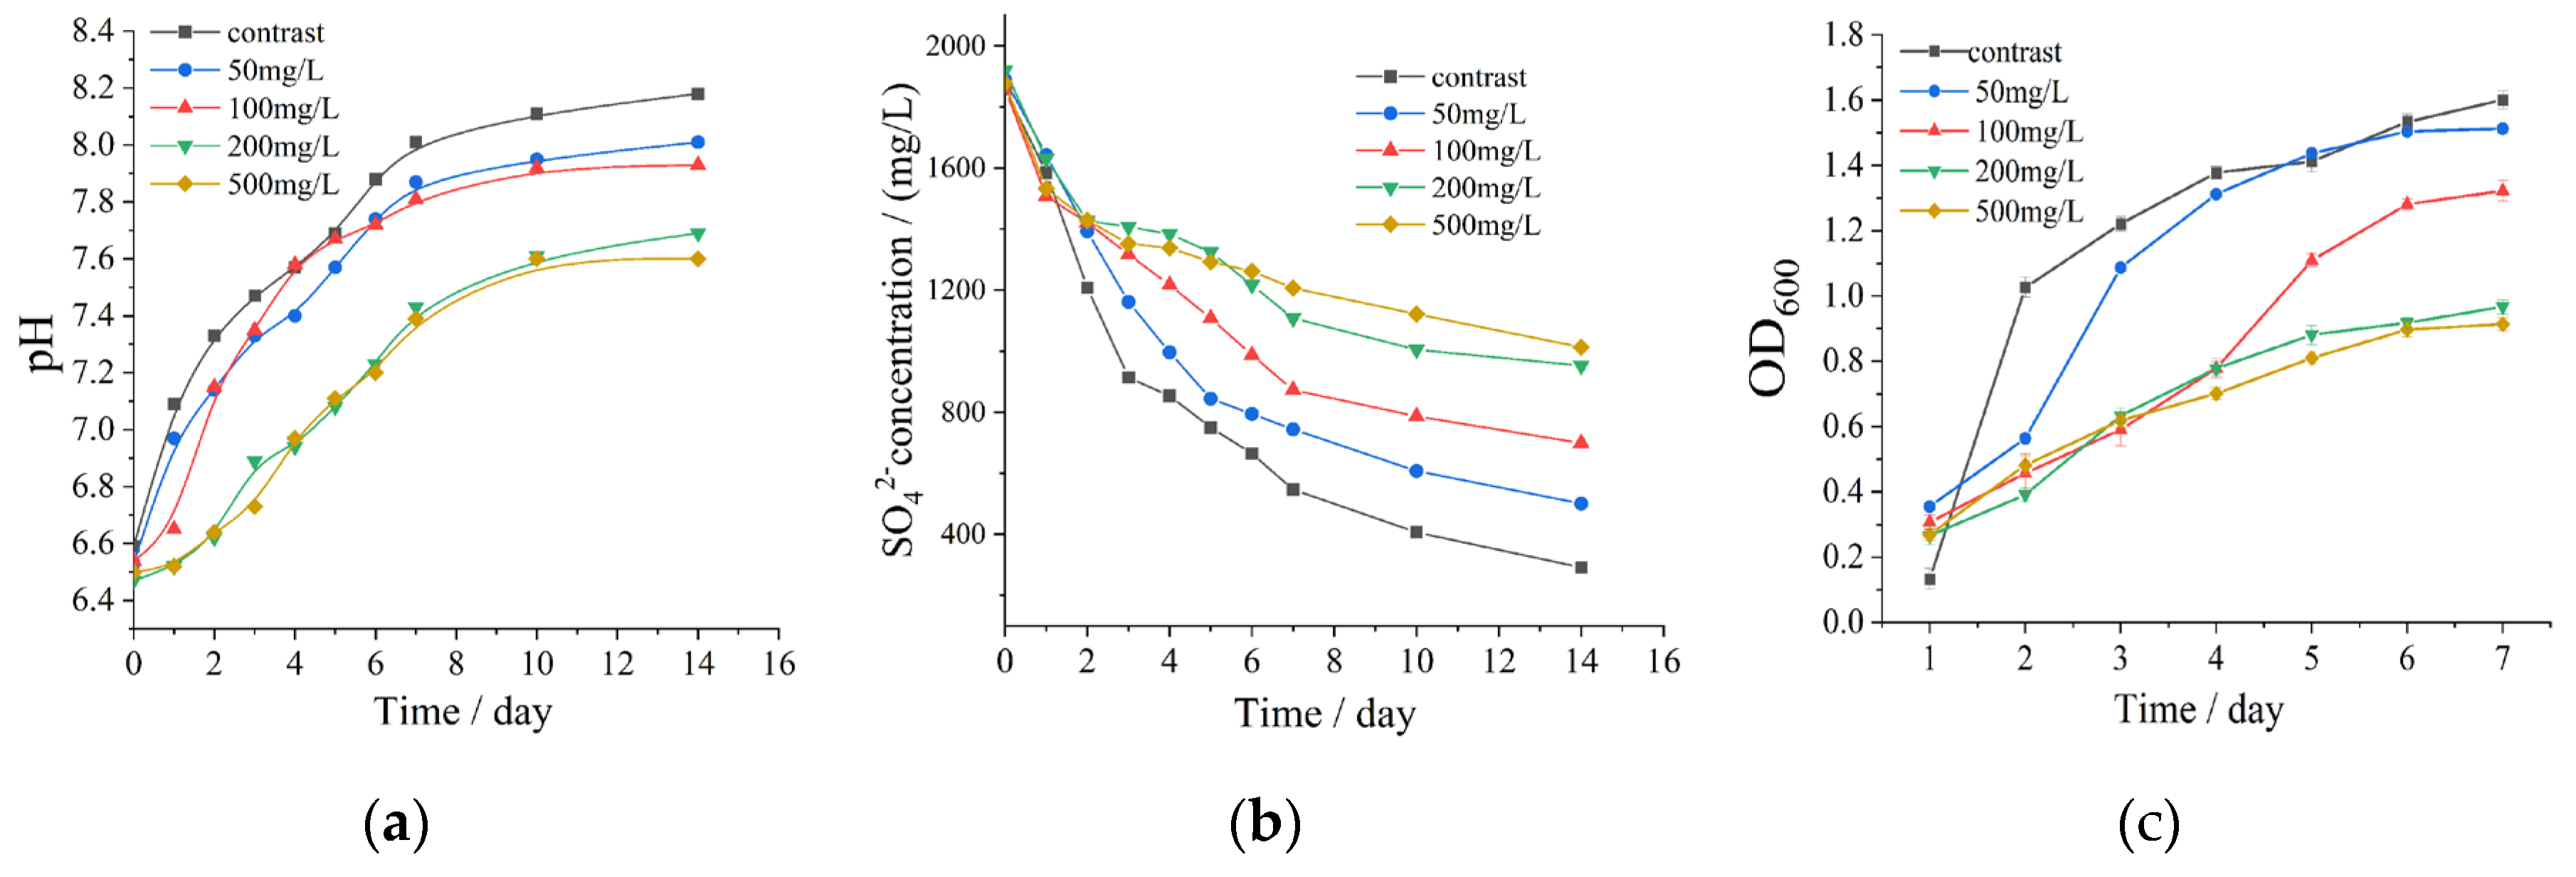
Figure 5.
The influence of DNB bacterial quantity on pH (a), SO42- concentration (b), NO3- concentration (c), and
SRB quantity (d) in the system.
Figure 5.
The influence of DNB bacterial quantity on pH (a), SO42- concentration (b), NO3- concentration (c), and
SRB quantity (d) in the system.
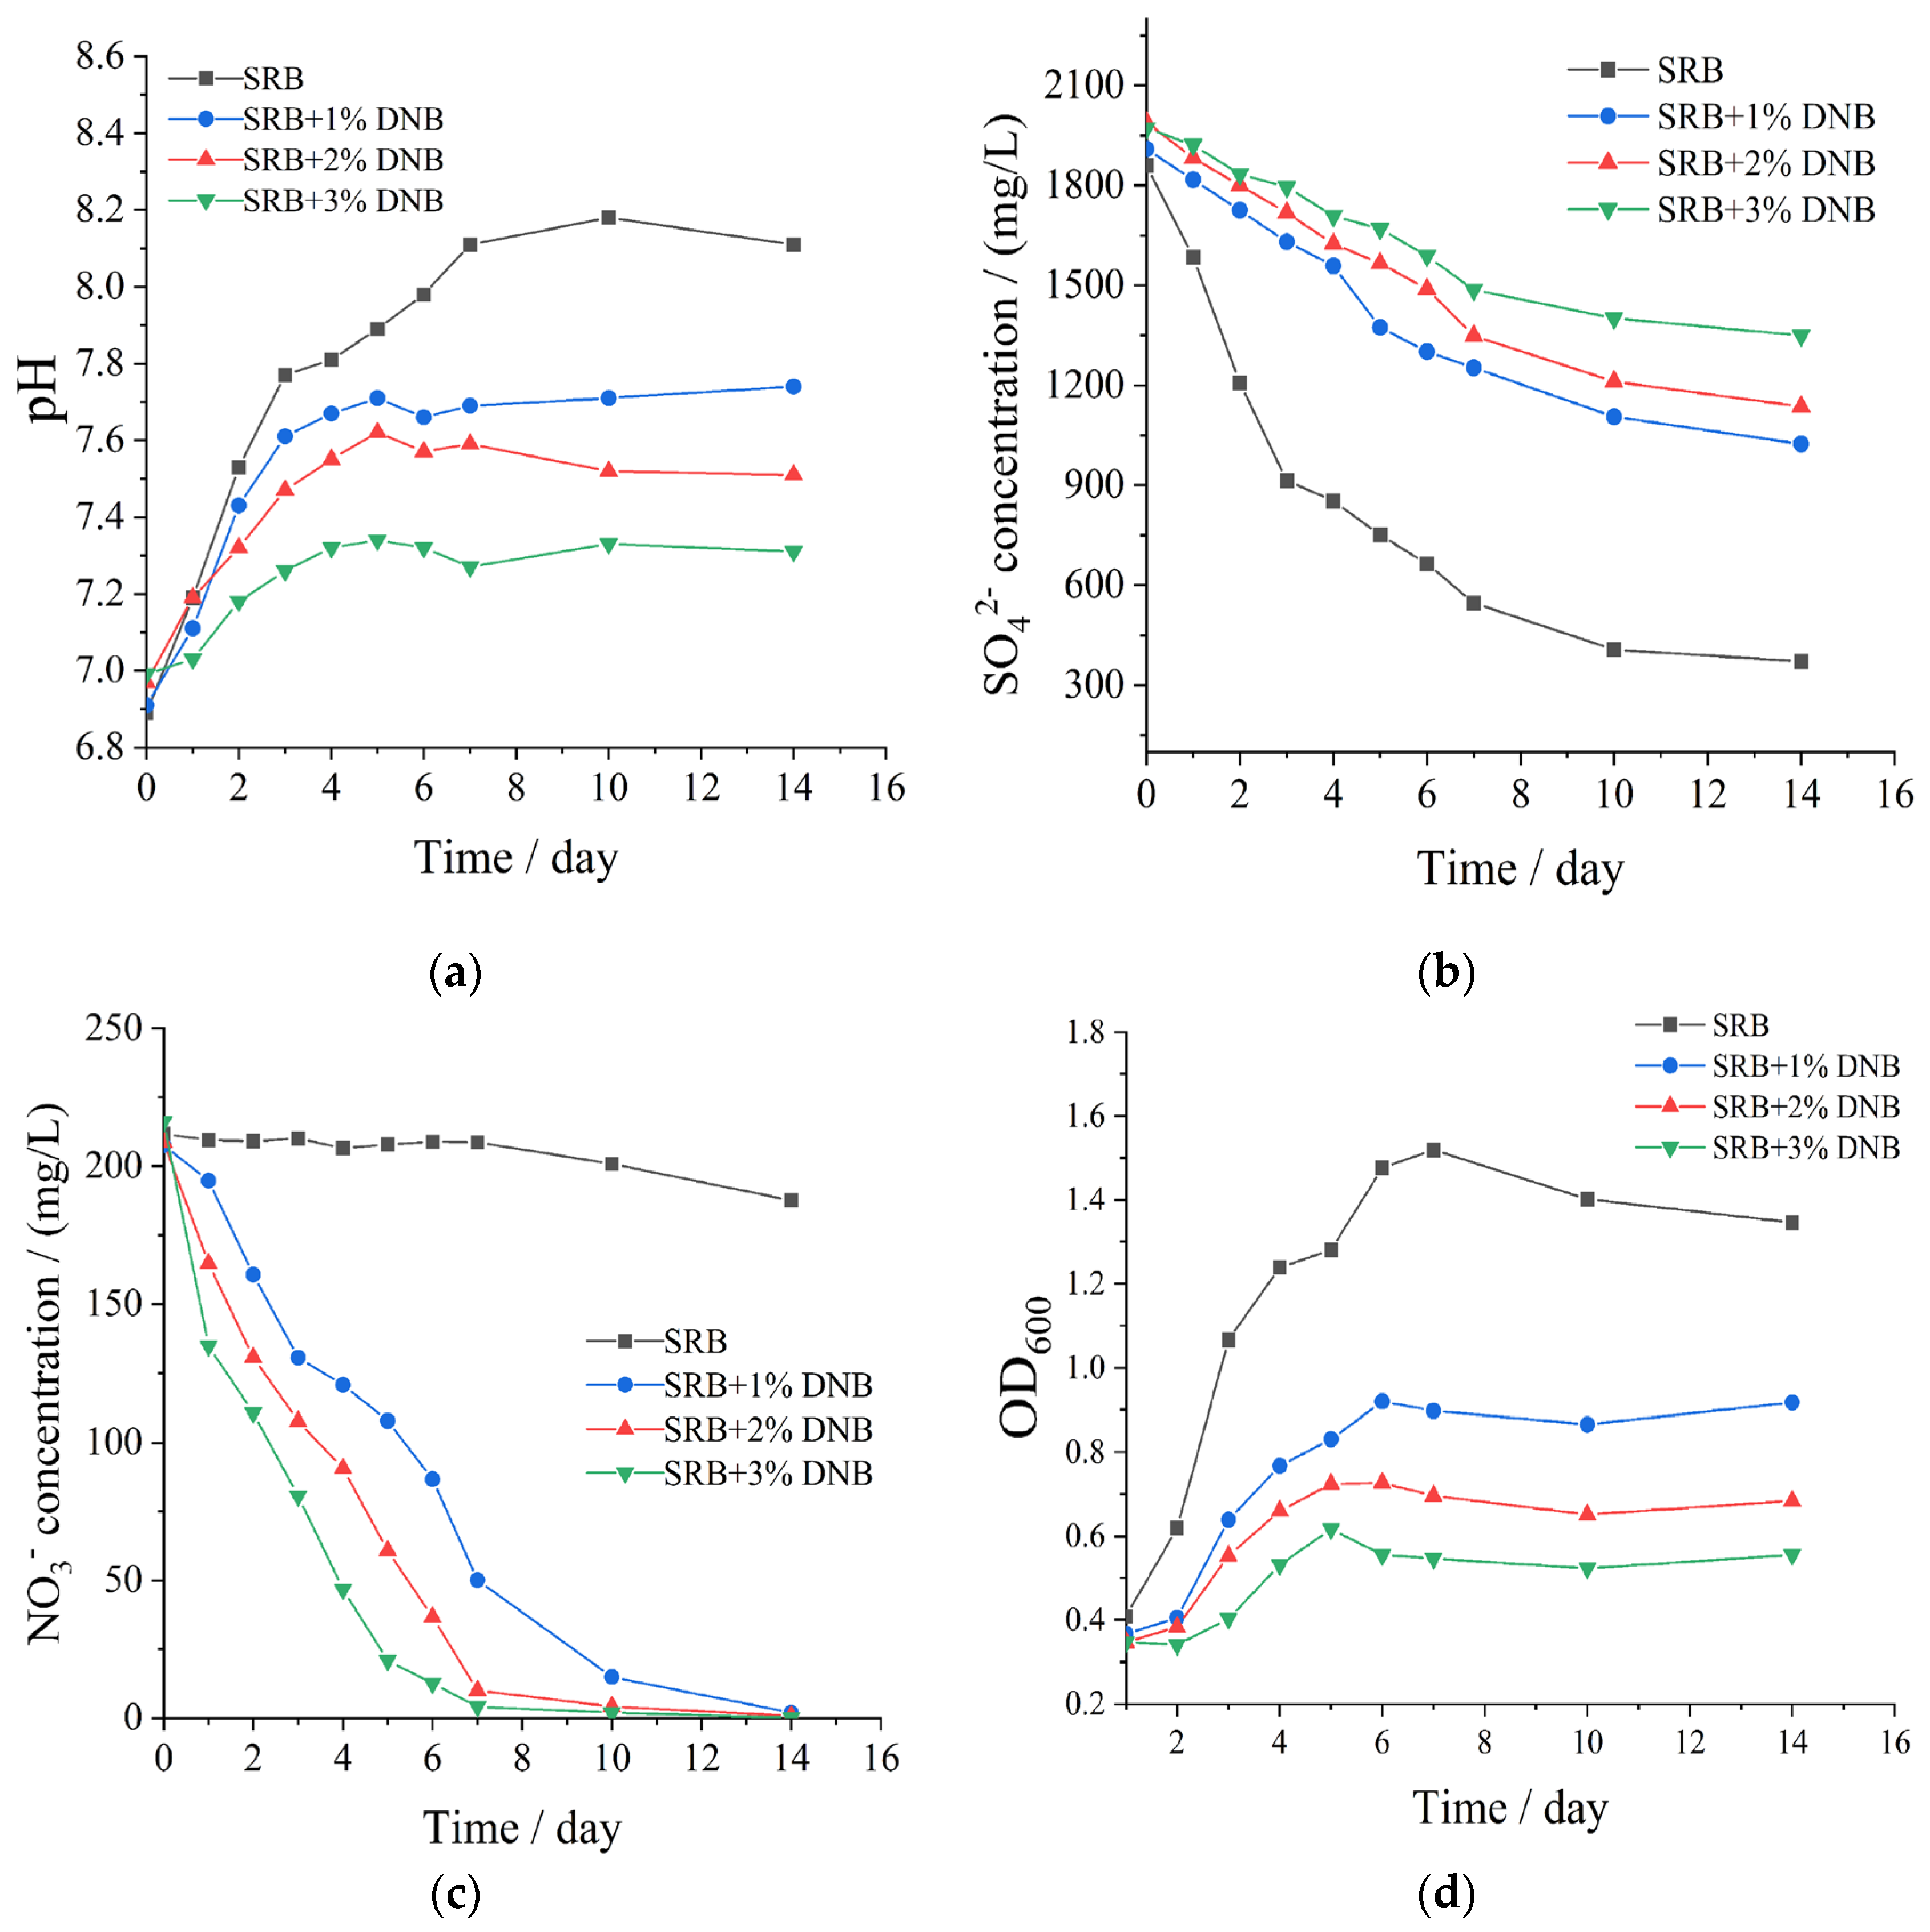
Figure 6.
The variation patterns of the working electrode Eocp (A) and Rp (B) of different systems over time. The
KNO3 group, the glutaral group, and the glutaral + KNO3 group, SRB and DNB mixed bacteria were added.
Figure 6.
The variation patterns of the working electrode Eocp (A) and Rp (B) of different systems over time. The
KNO3 group, the glutaral group, and the glutaral + KNO3 group, SRB and DNB mixed bacteria were added.
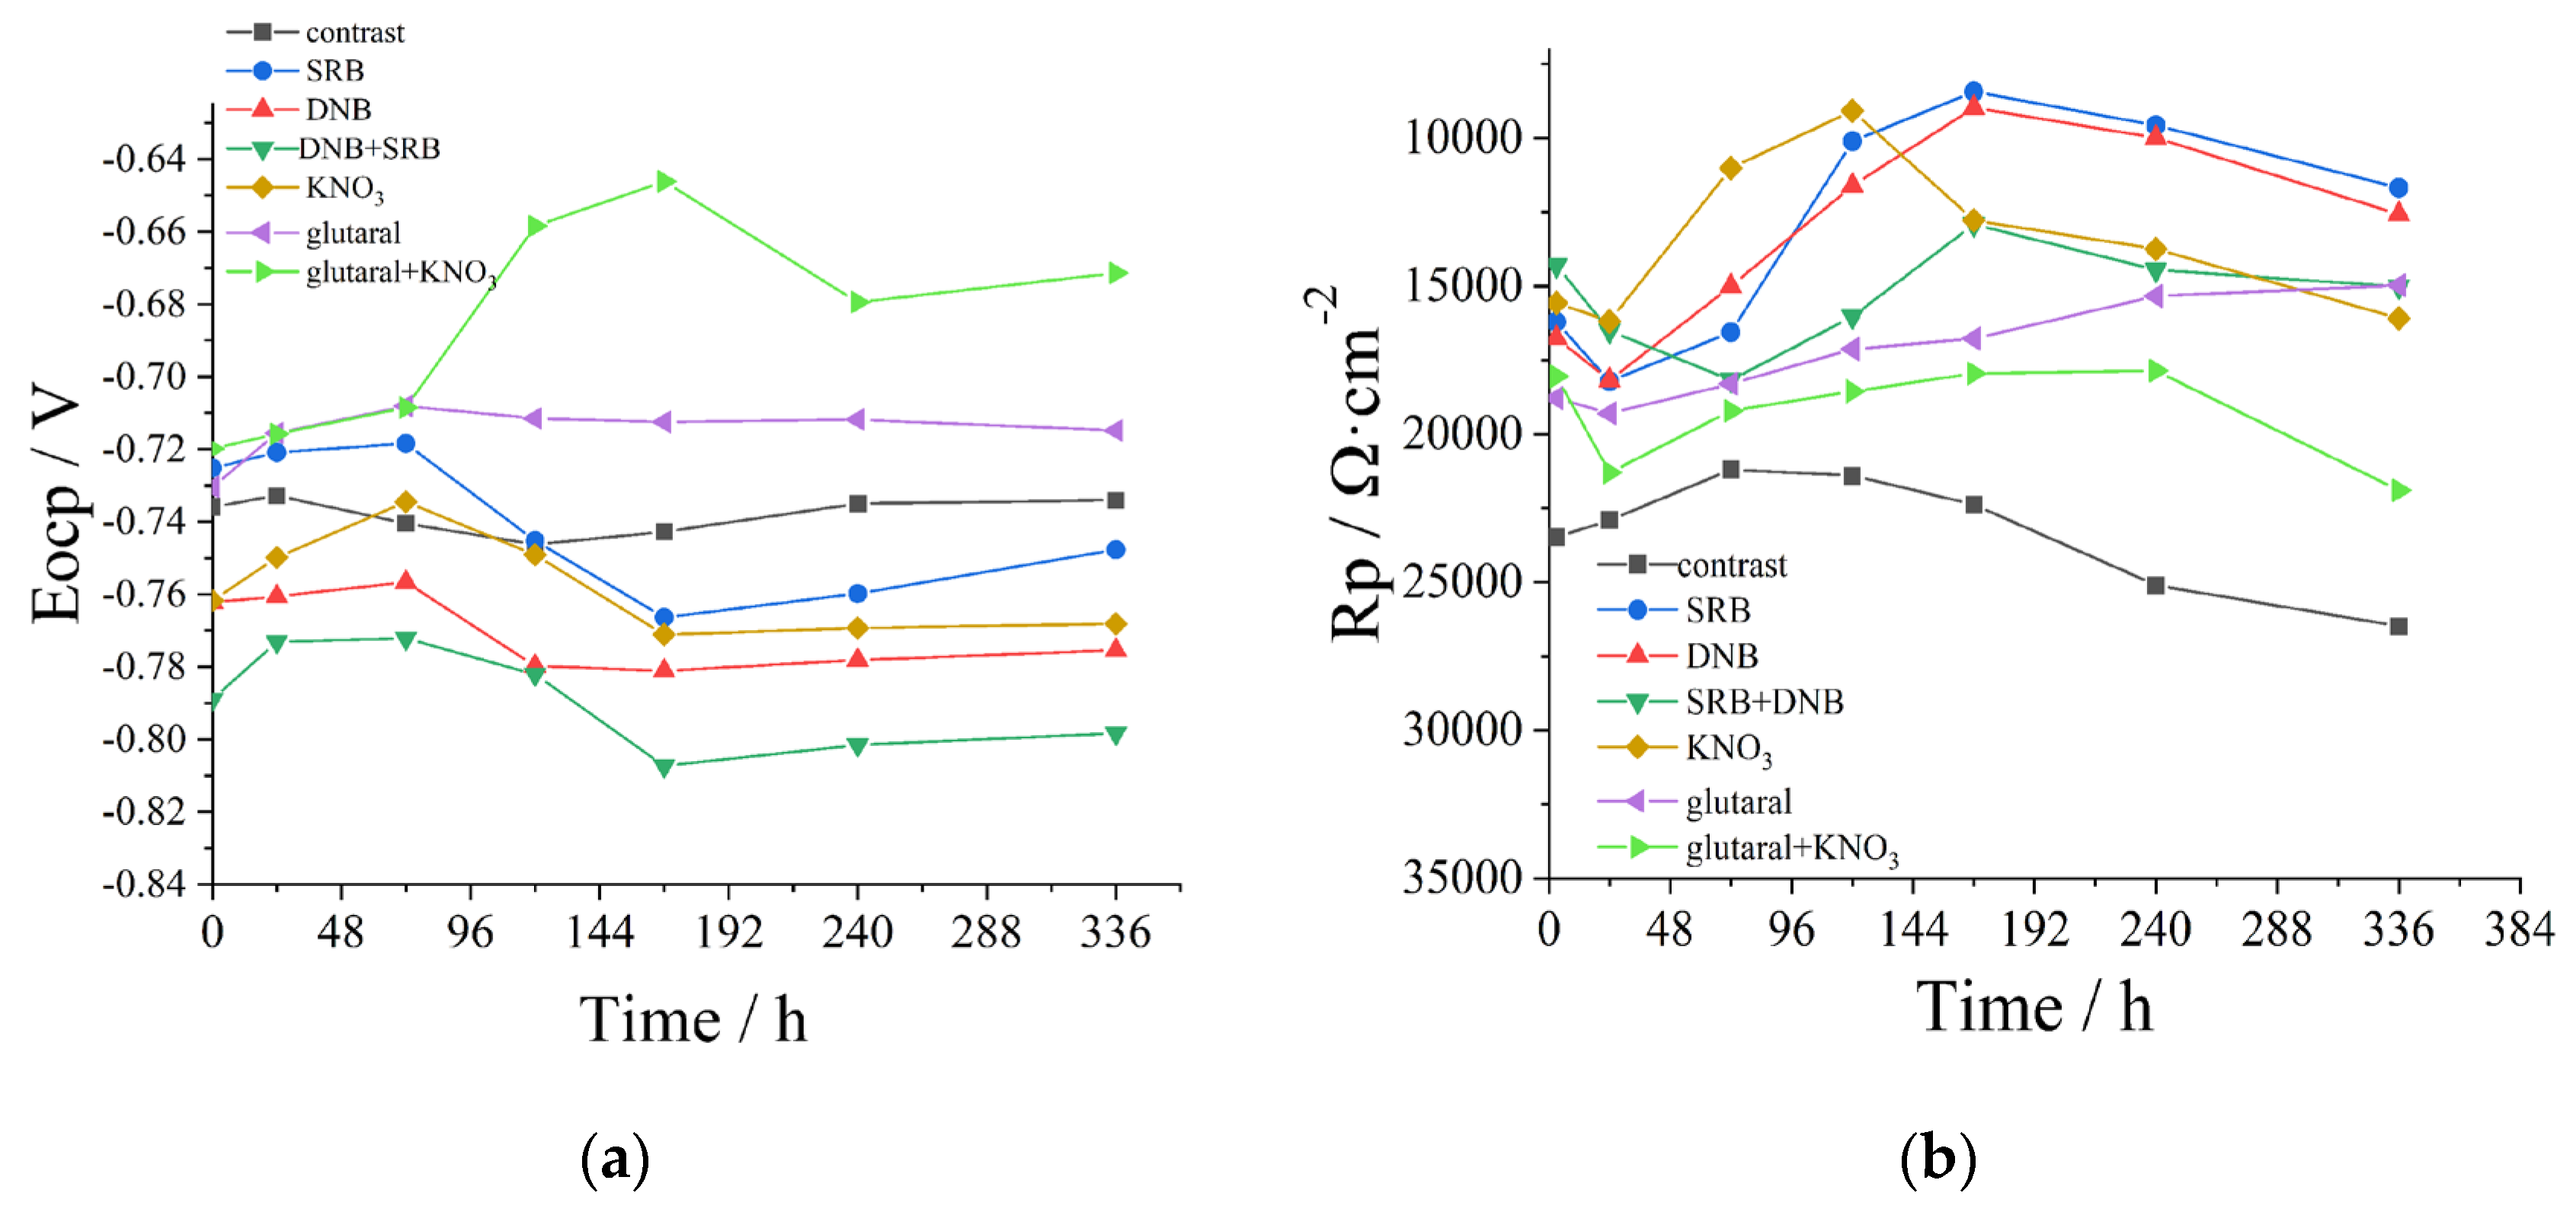
Figure 7.
Nyquis plots of different systems, A: control group; B: SRB group; C: DNB group; D: SRB+DNB group;
E: KNO3 group; F: glutaral group; G: glutaral + KNO3 group. In KNO3 group, glutaral group and glutaral + KNO3
group, SRB and DNB mixed bacteria were added.
Figure 7.
Nyquis plots of different systems, A: control group; B: SRB group; C: DNB group; D: SRB+DNB group;
E: KNO3 group; F: glutaral group; G: glutaral + KNO3 group. In KNO3 group, glutaral group and glutaral + KNO3
group, SRB and DNB mixed bacteria were added.
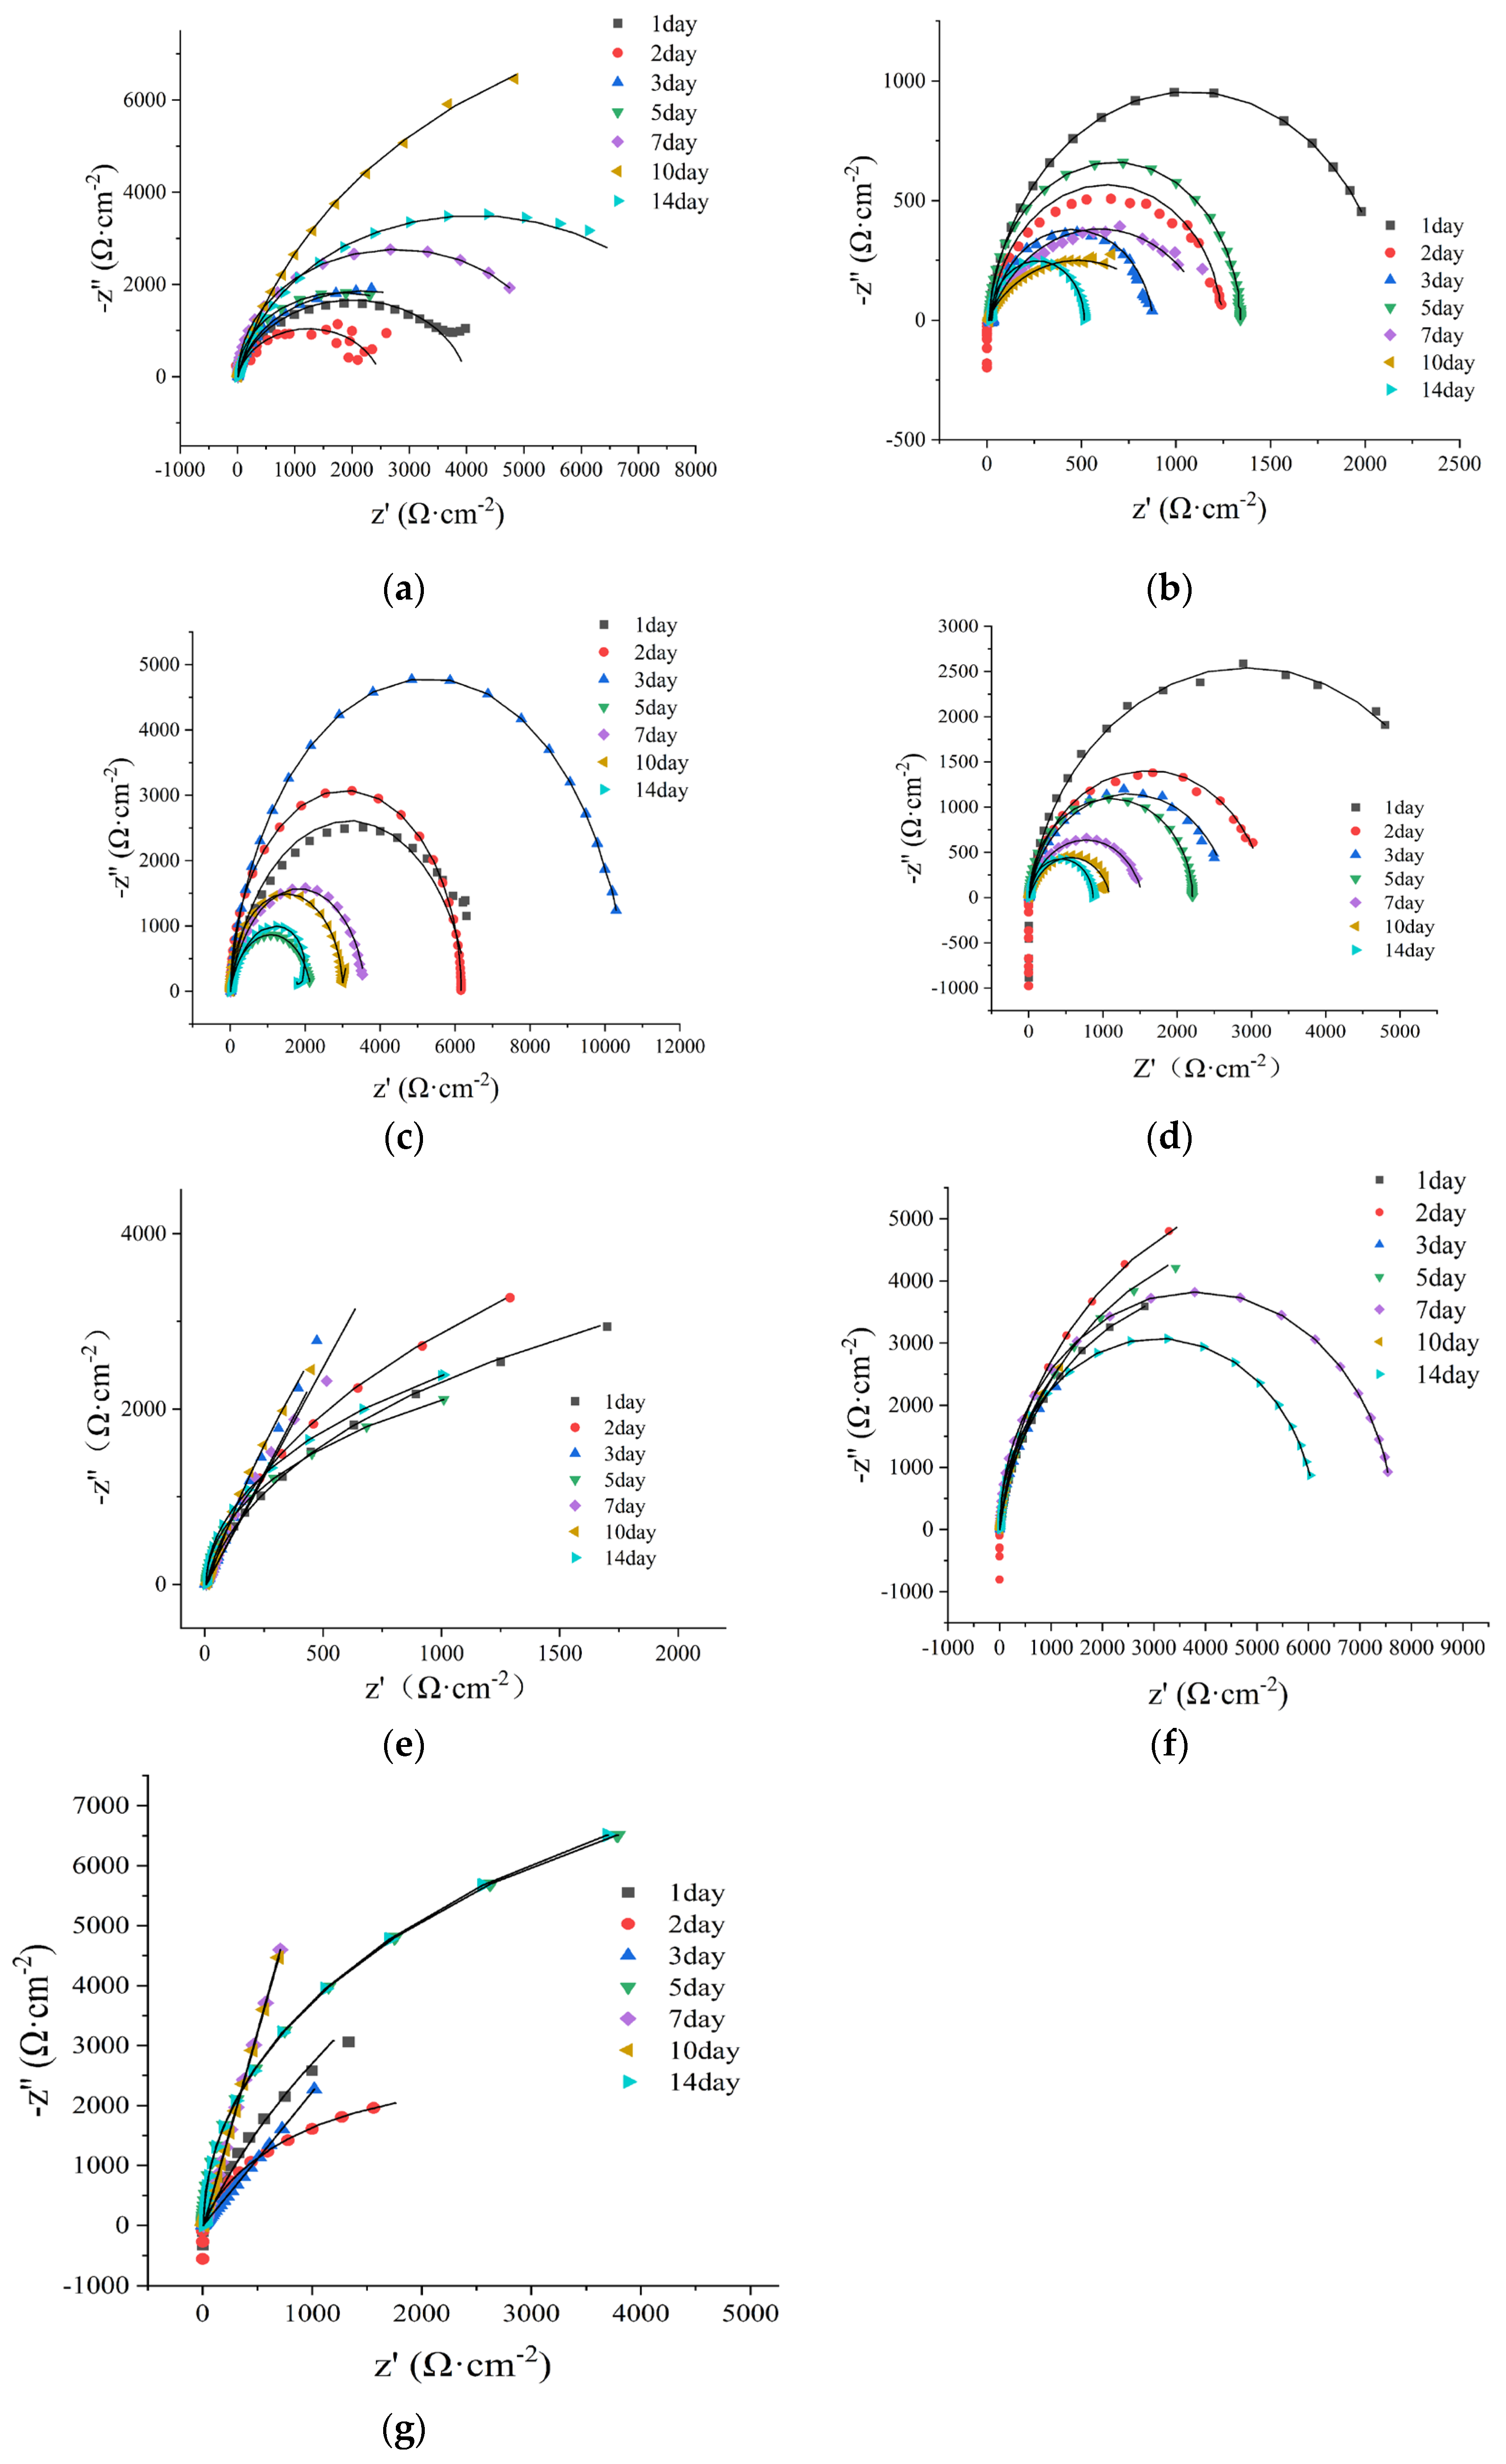
Figure 8.
Bode plots of different systems, A: control group; B: SRB group; C: DNB group; D: SRB+DNB group;
E: KNO3 group; F: glutaral group; G: glutaral + KNO3 group. In KNO3 group, glutaral group and glutaral + KNO3
group, SRB and DNB mixed bacteria were added.
Figure 8.
Bode plots of different systems, A: control group; B: SRB group; C: DNB group; D: SRB+DNB group;
E: KNO3 group; F: glutaral group; G: glutaral + KNO3 group. In KNO3 group, glutaral group and glutaral + KNO3
group, SRB and DNB mixed bacteria were added.
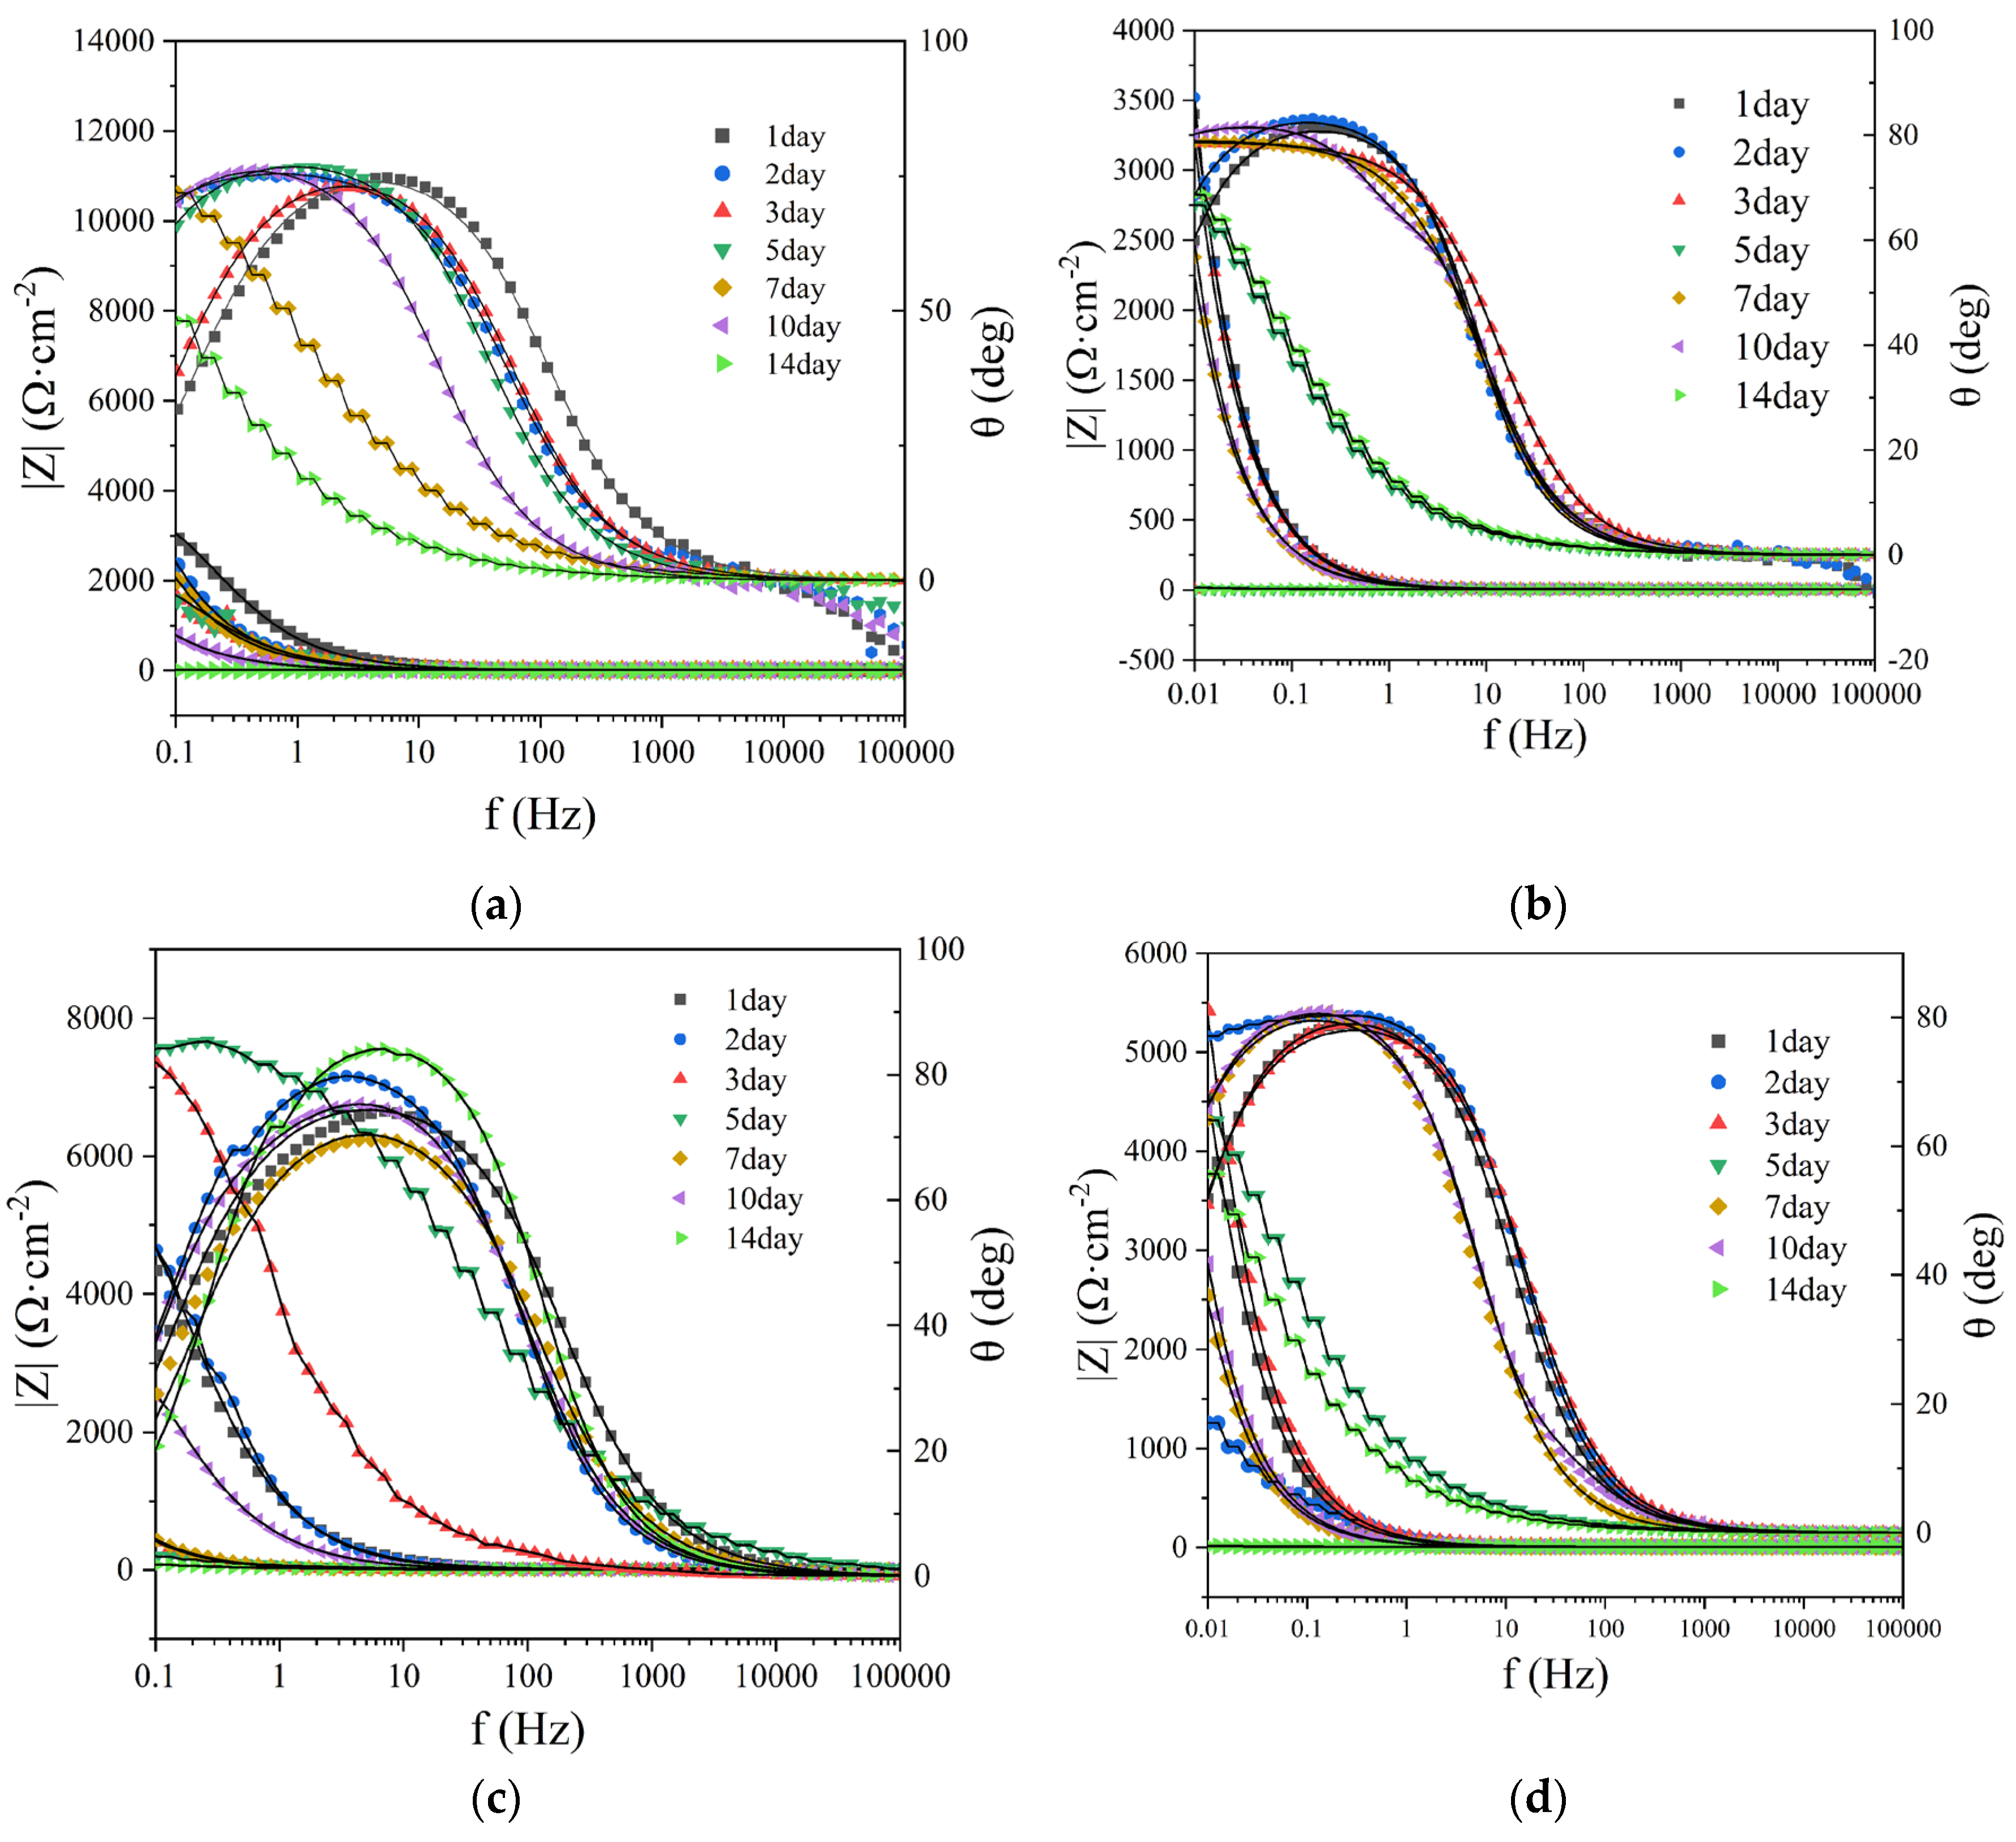
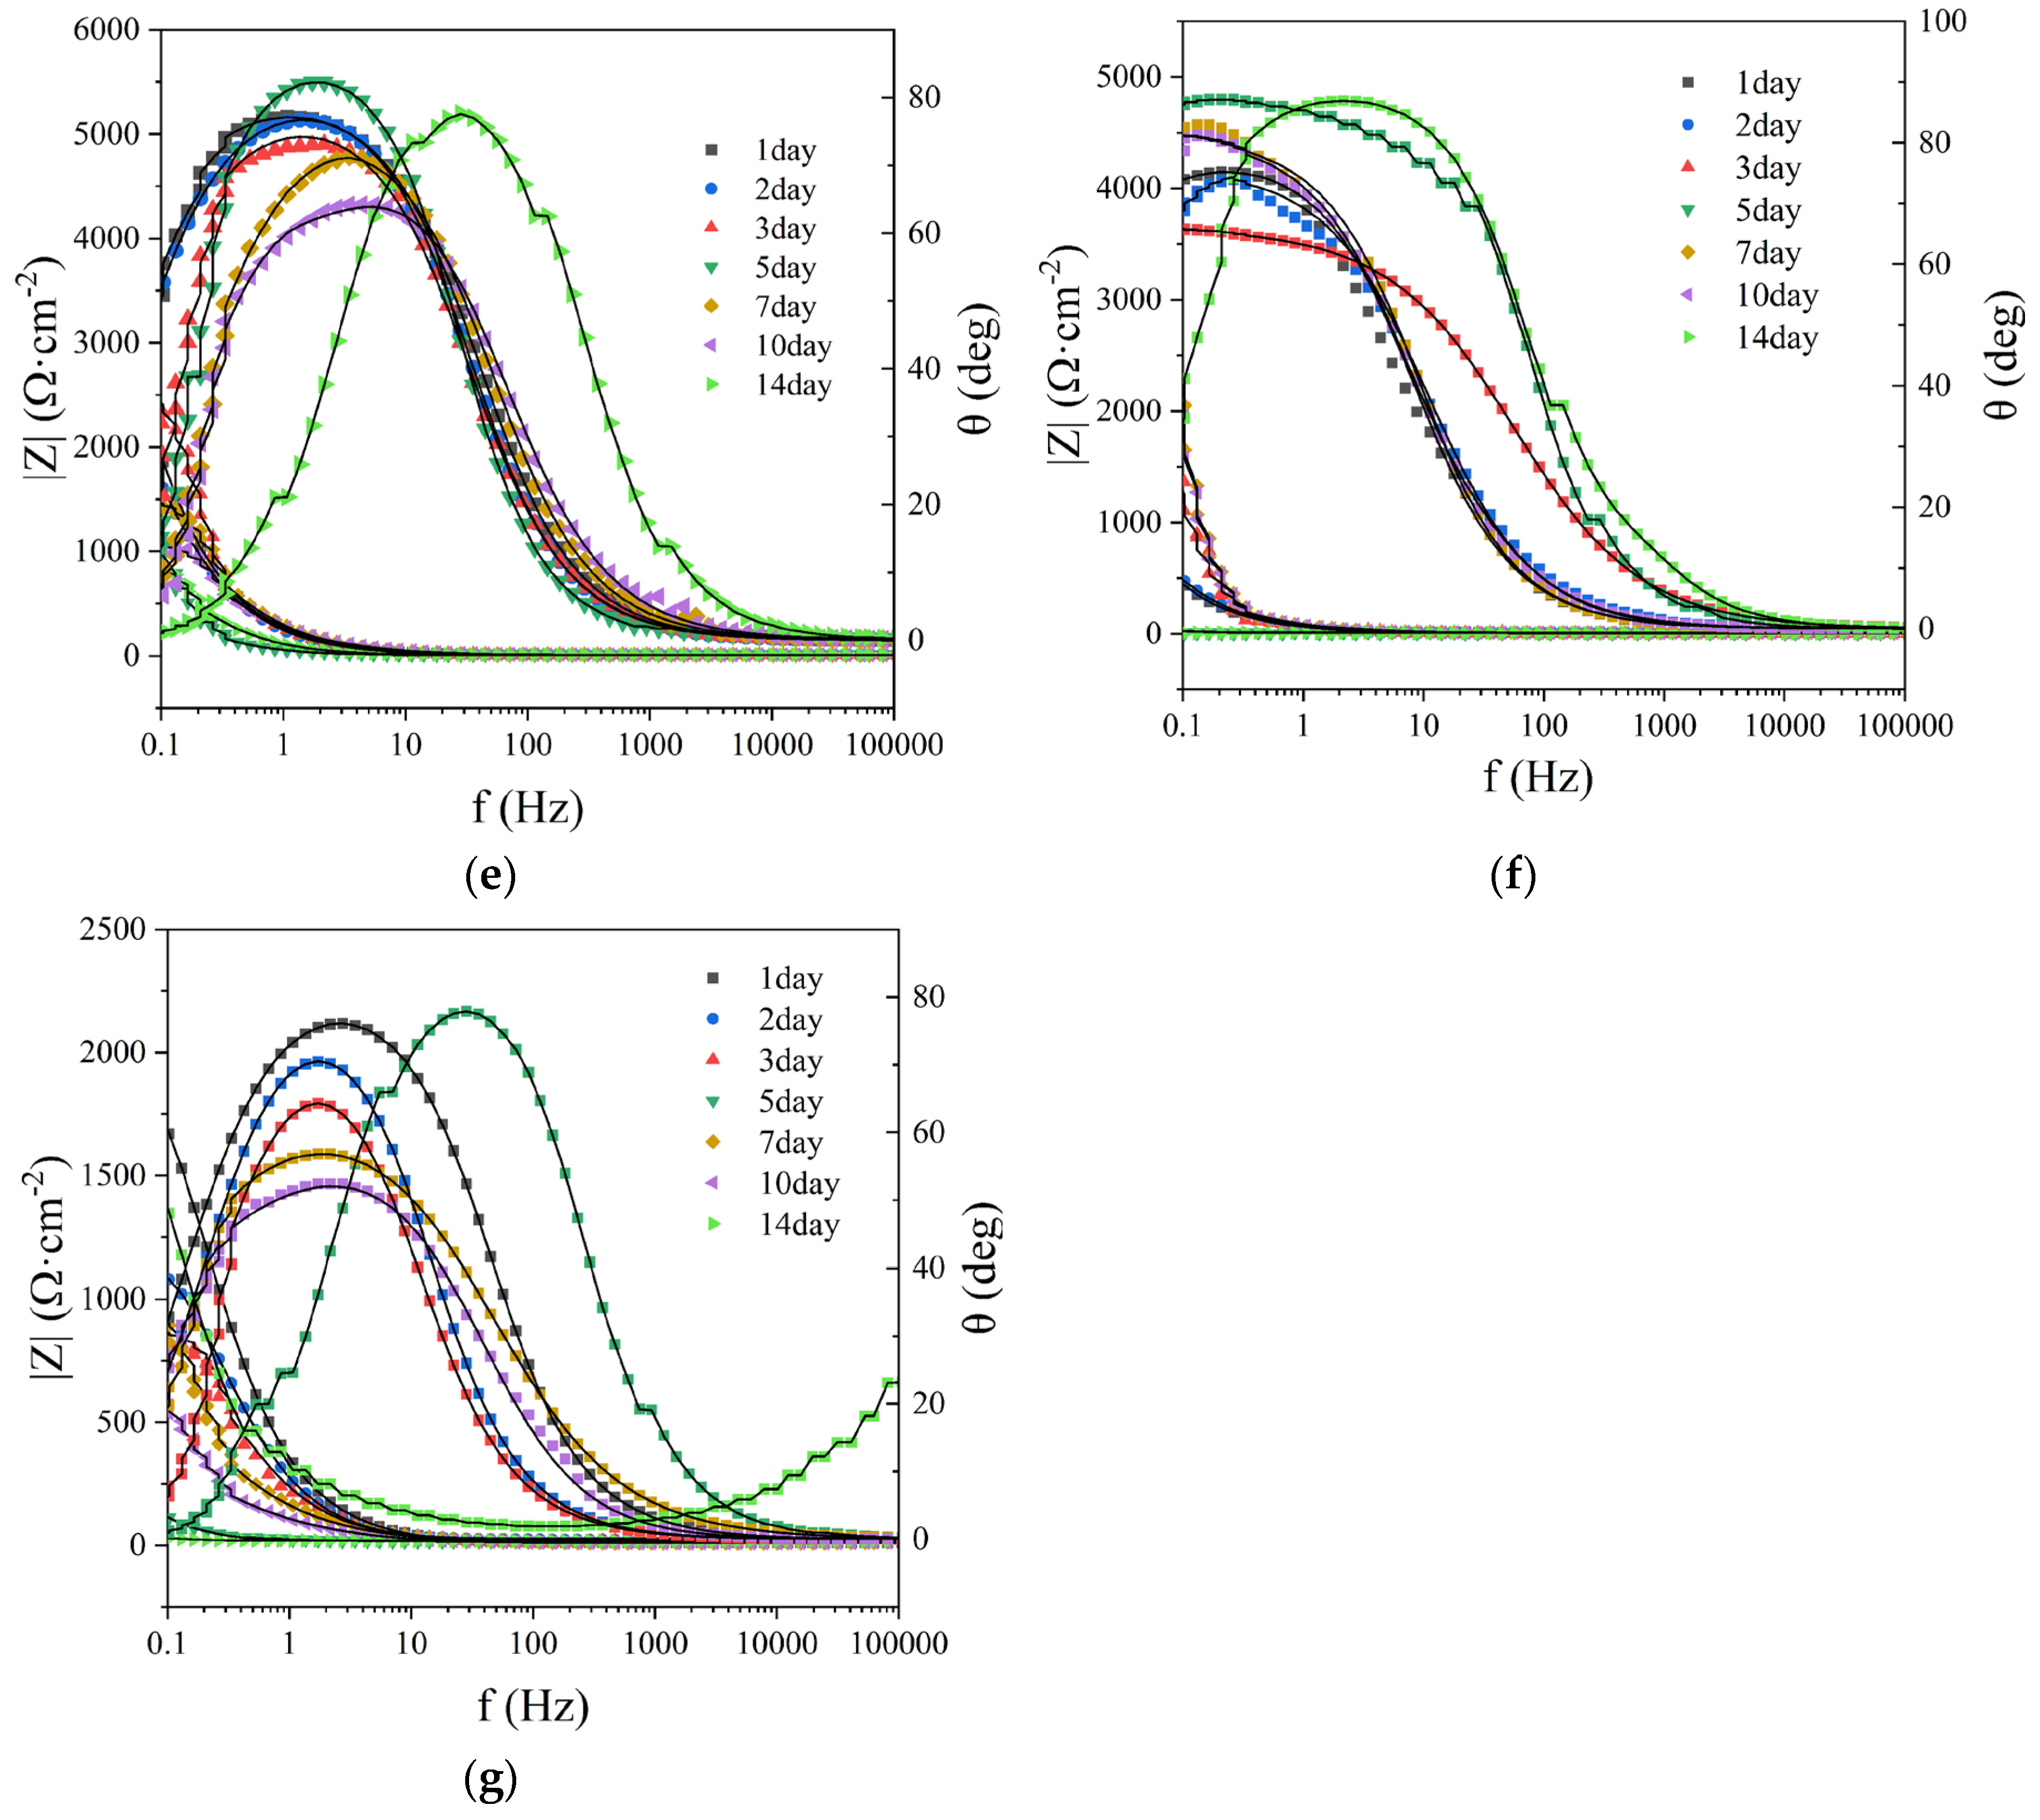
Figure 9.
EIS fitting results of working electrodes in different systems (A: Rs fitting result; B: Rf fitting result; C:
Rct fitting result), in which the KNO3 group, glutaral group, and glutaral + KNO3 group all added bacteria of
SRB and DNB.
Figure 9.
EIS fitting results of working electrodes in different systems (A: Rs fitting result; B: Rf fitting result; C:
Rct fitting result), in which the KNO3 group, glutaral group, and glutaral + KNO3 group all added bacteria of
SRB and DNB.
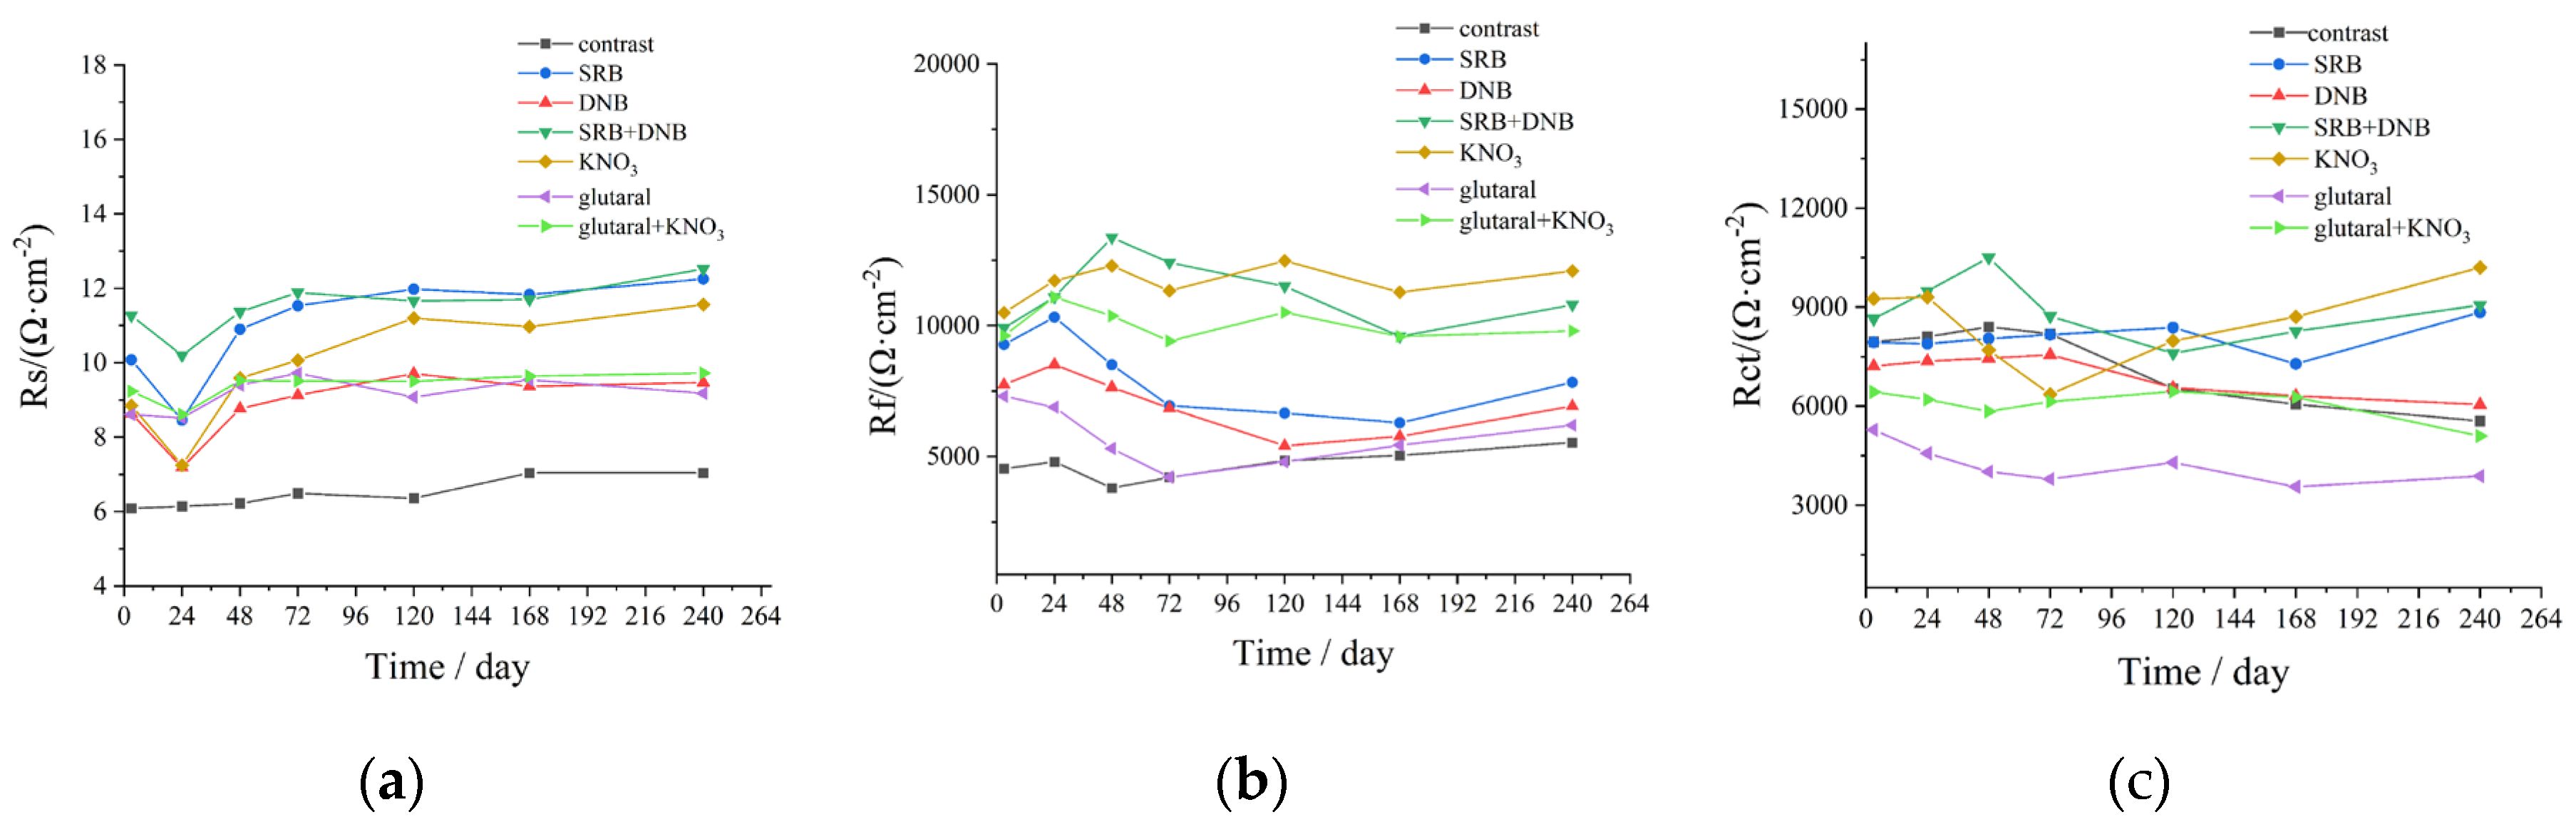
Figure 10.
Average corrosion rate (a) and maximum pitting depth (b) of the test specimens under different
systems. the mixed bacteria SRB and DNB were added in the KNO3 group, the glutaral group, and the glutaral
+ KNO3 group.
Figure 10.
Average corrosion rate (a) and maximum pitting depth (b) of the test specimens under different
systems. the mixed bacteria SRB and DNB were added in the KNO3 group, the glutaral group, and the glutaral
+ KNO3 group.
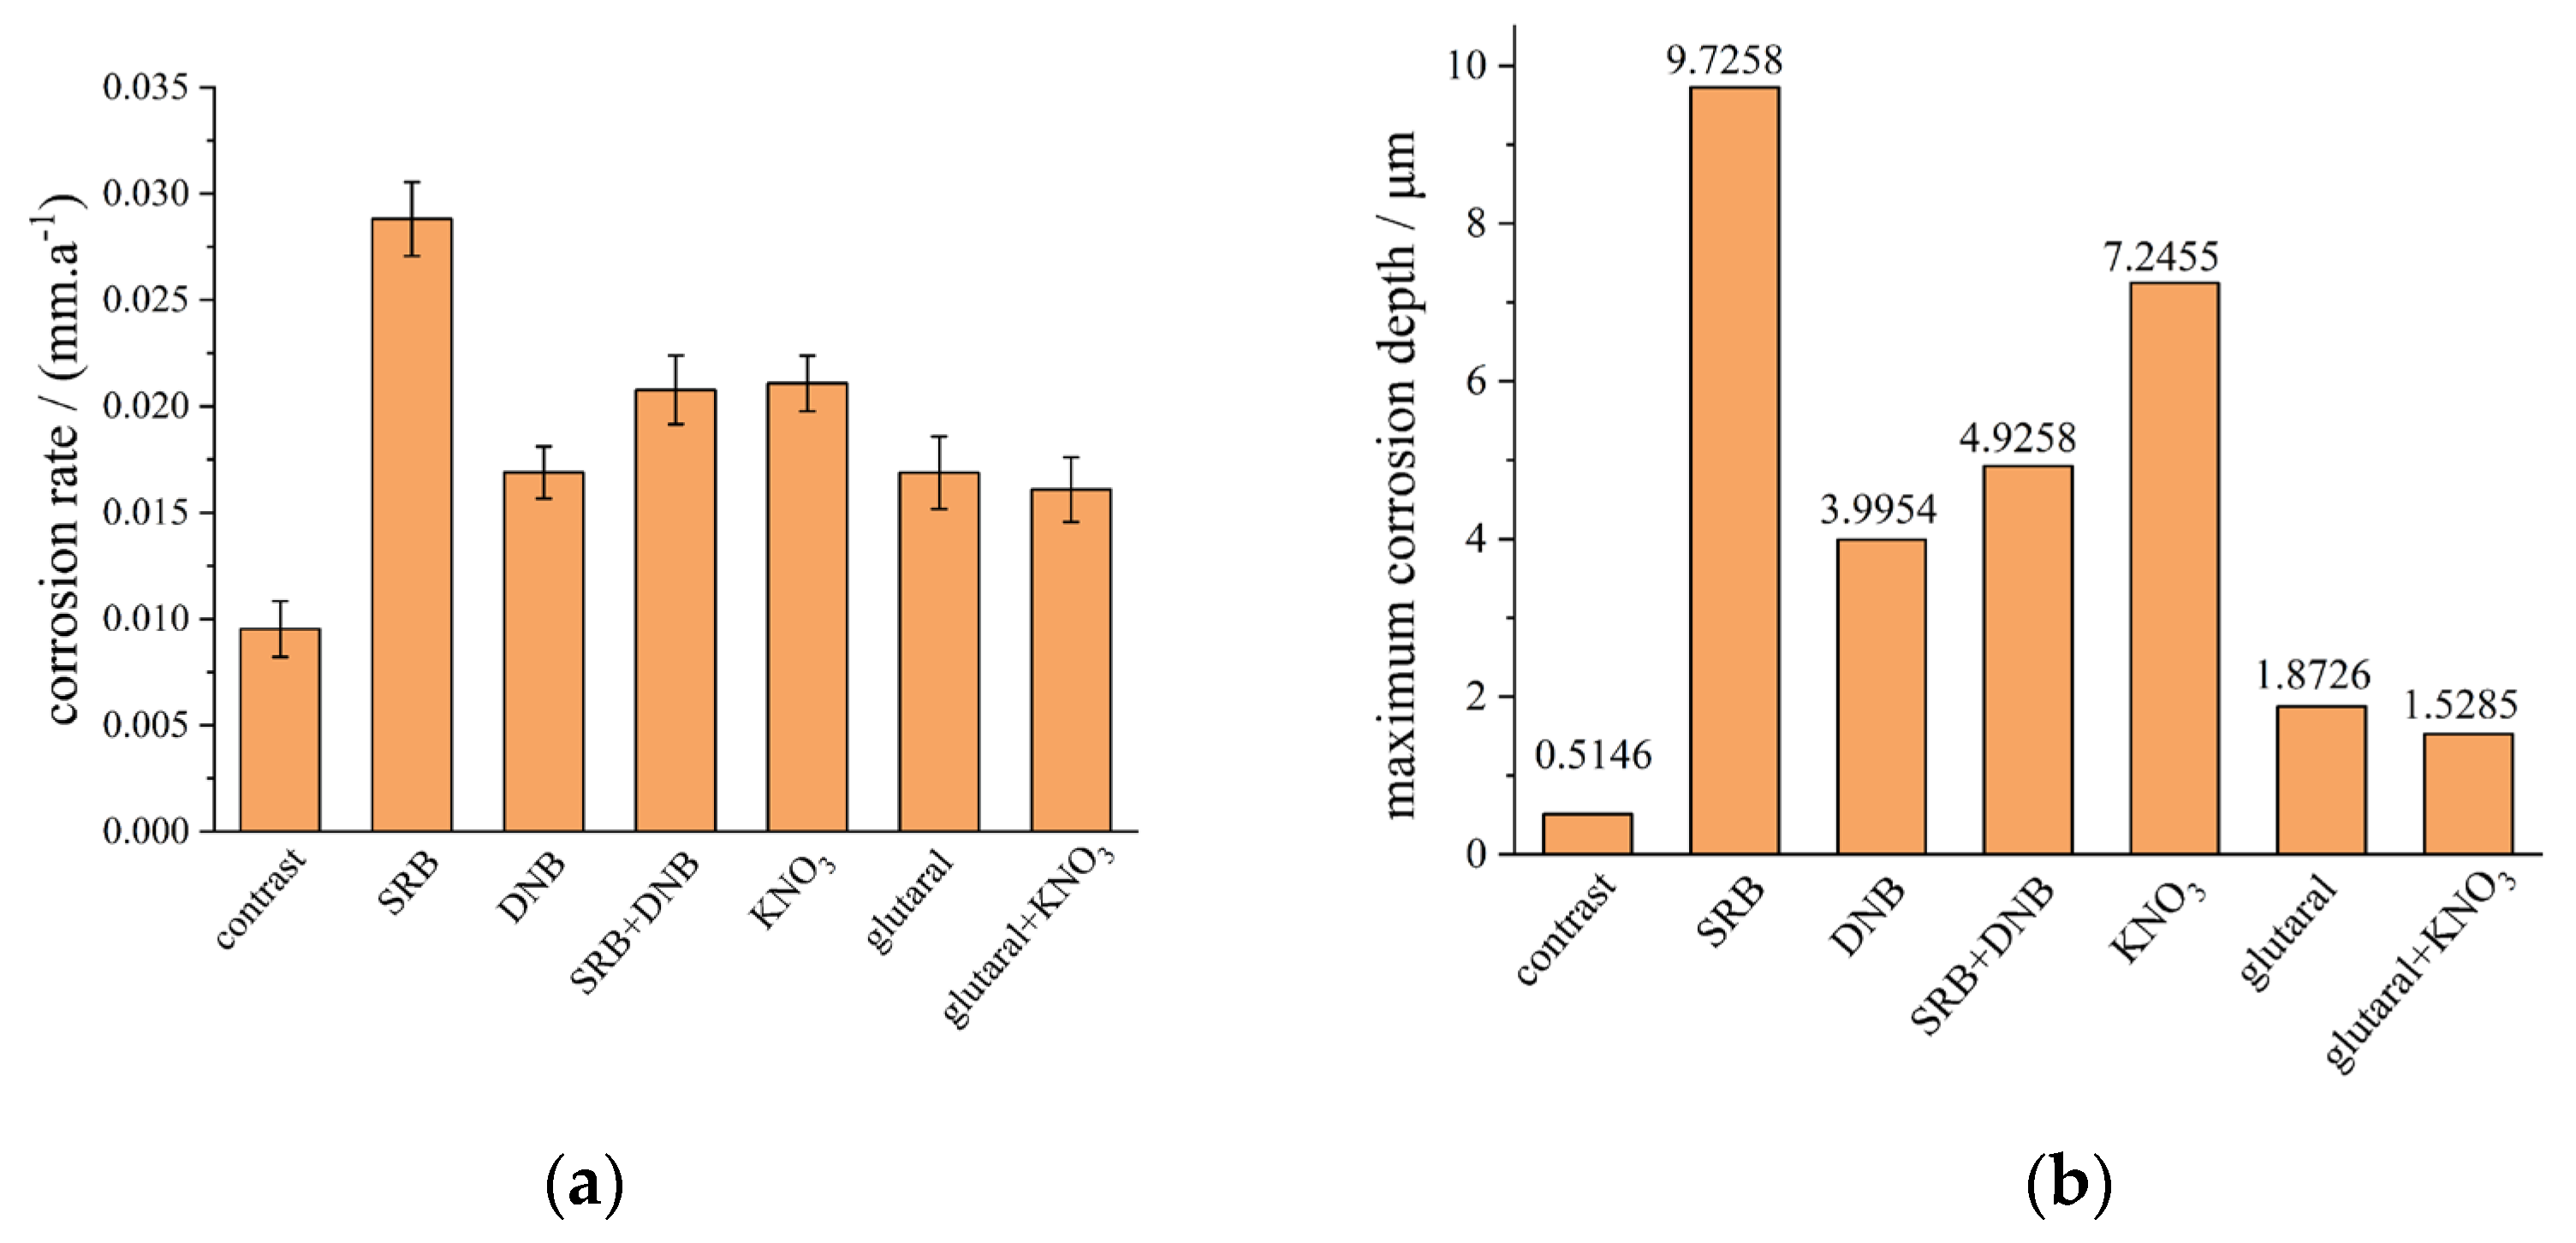
Figure 11.
Relative abundance plots of microbial samples at the genus level.
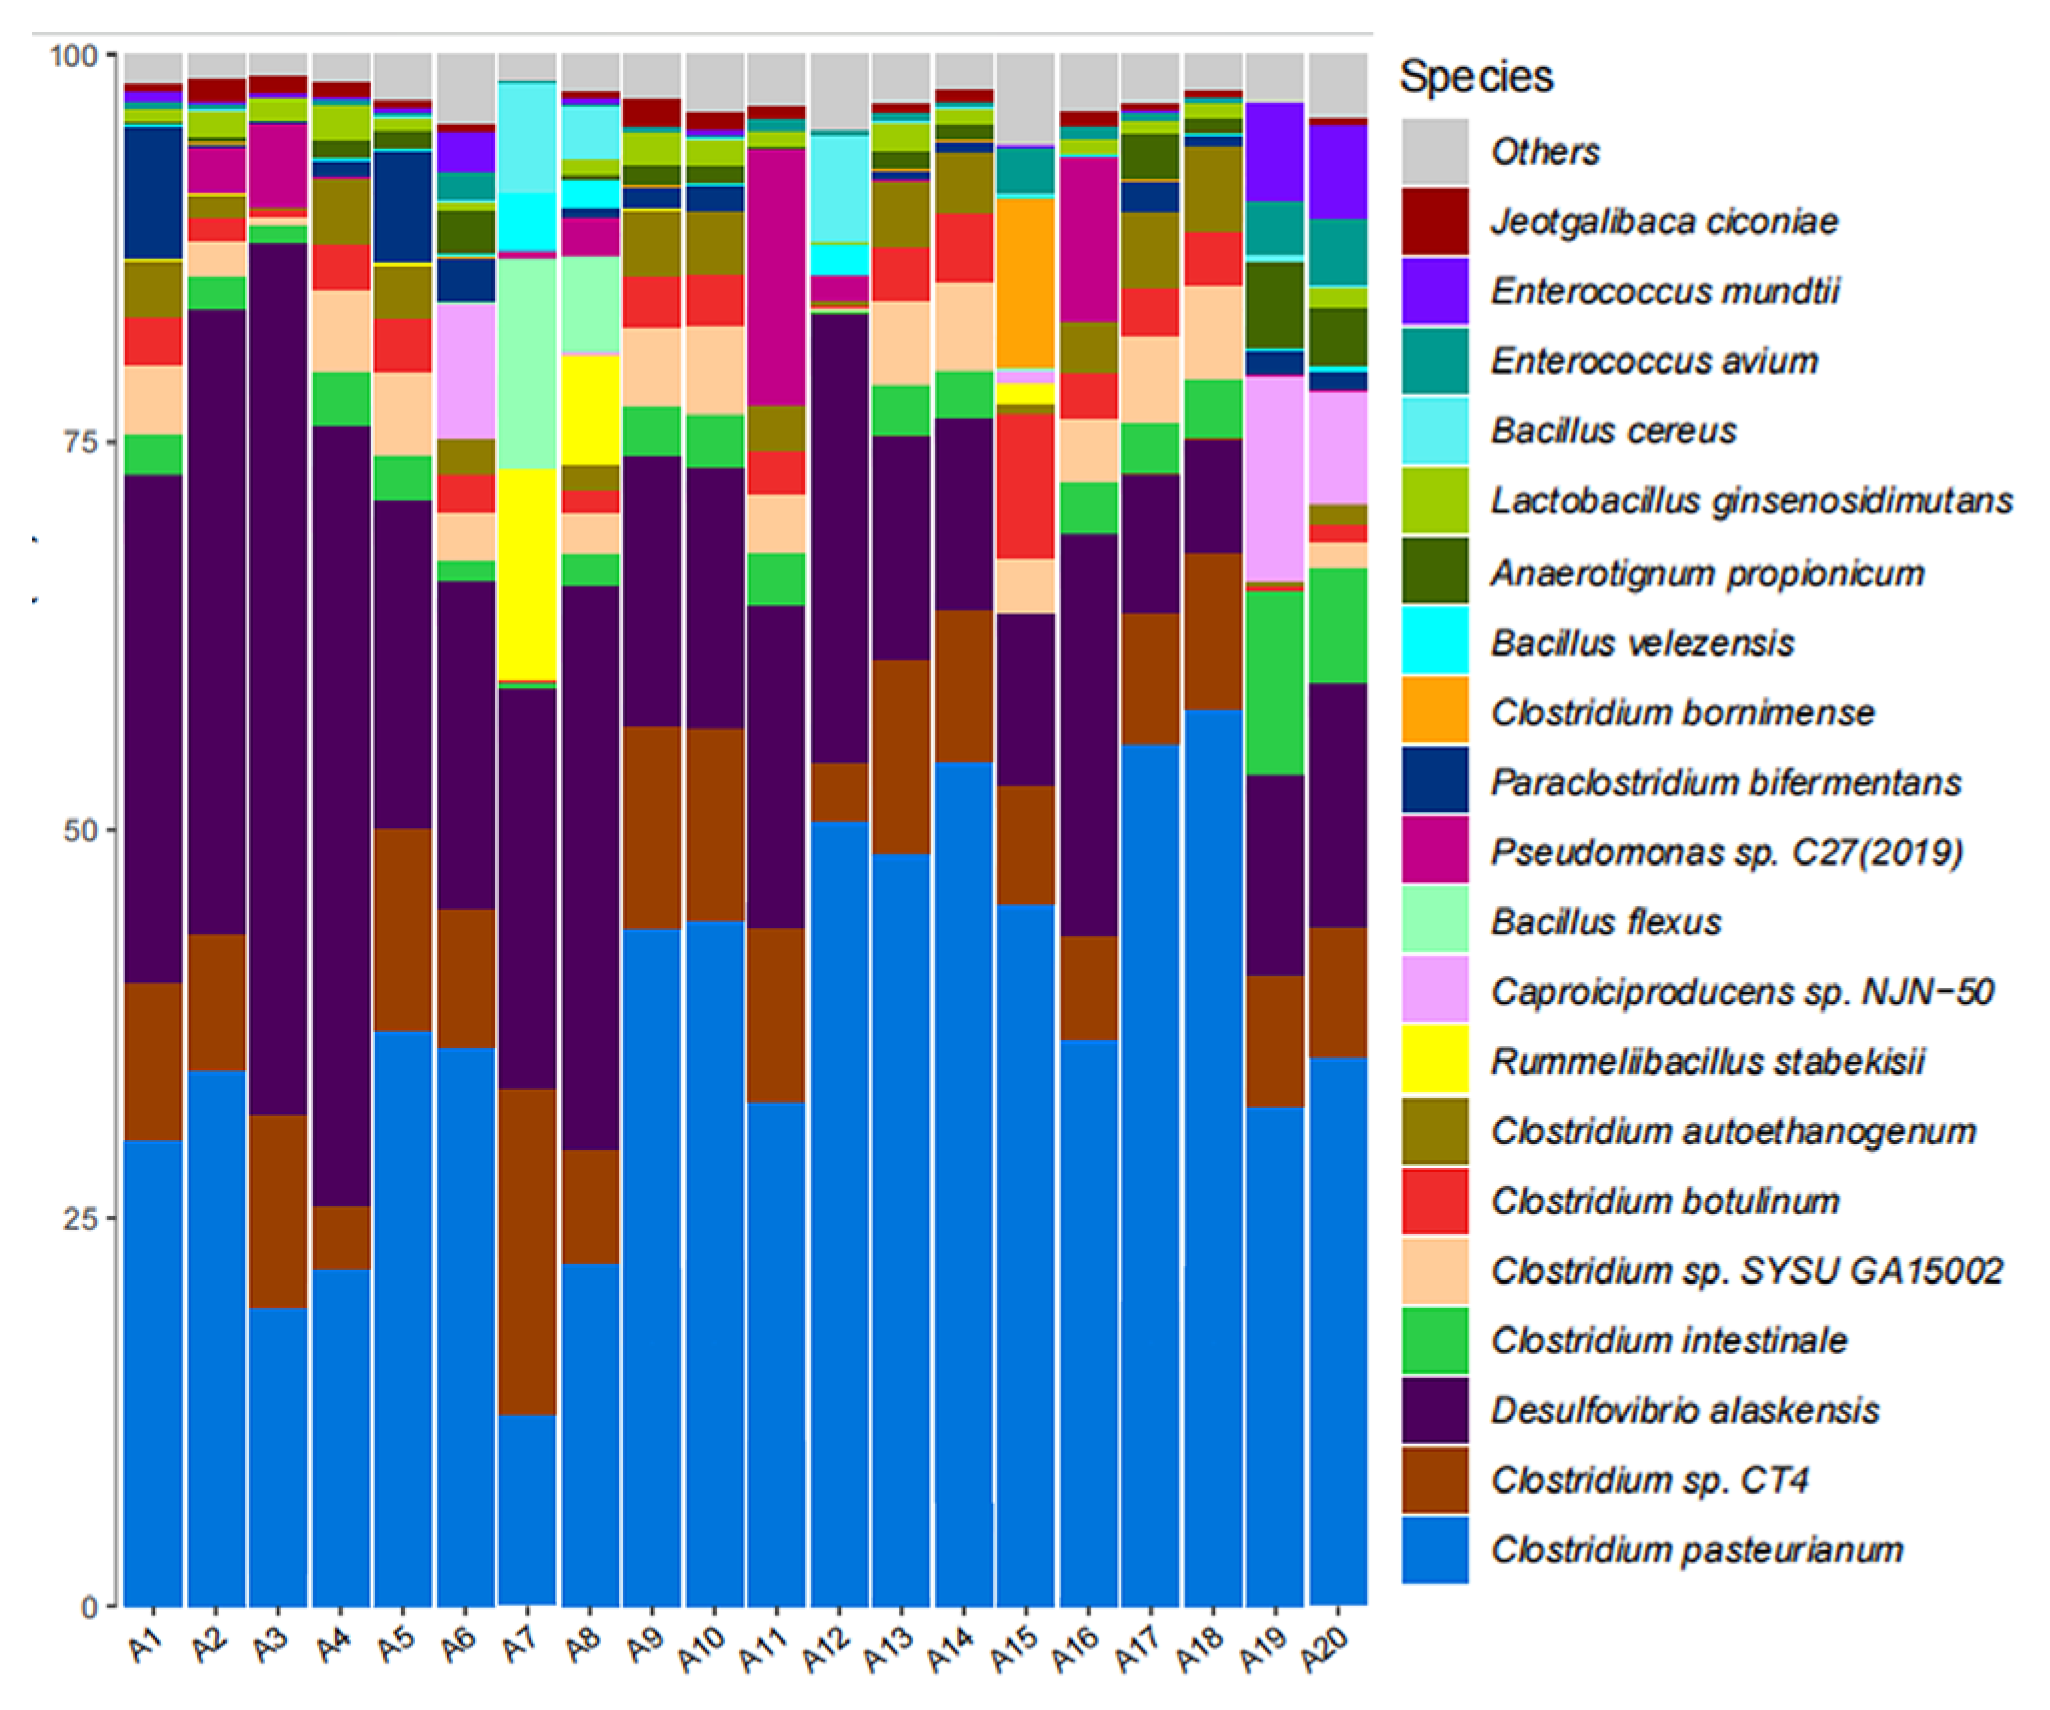

Table 1.
Composition of SRB culture medium.
| Reagent | Dosage(g/L) |
|---|---|
| CaCl2 | 0.1 |
| KH2PO4 | 0.5 |
| Na2SO4 | 1.0 |
| MgSO4·7H2O | 2.0 |
| FeSO4 | 0.2 |
| NH4Cl | 1.0 |
| yeast extract | 1.0 |
| sodium lactate | 3.48 |
Table 2.
Composition of DNB culture medium.
| reagent | dosage(g/L) |
|---|---|
| K2HPO4 | 0.5 |
| KNO3 | 2 |
| CaCl2 | 0.05 |
| MgSO4·7H2O | 1.5 |
| seignette salt | 20 |
Disclaimer/Publisher’s Note: The statements, opinions and data contained in all publications are solely those of the individual author(s) and contributor(s) and not of MDPI and/or the editor(s). MDPI and/or the editor(s) disclaim responsibility for any injury to people or property resulting from any ideas, methods, instructions or products referred to in the content. |
© 2025 by the authors. Licensee MDPI, Basel, Switzerland. This article is an open access article distributed under the terms and conditions of the Creative Commons Attribution (CC BY) license (http://creativecommons.org/licenses/by/4.0/).
Copyright: This open access article is published under a Creative Commons CC BY 4.0 license, which permit the free download, distribution, and reuse, provided that the author and preprint are cited in any reuse.


