
Submitted:
28 April 2024
Posted:
29 April 2024
You are already at the latest version
Abstract
The formation of hydrogen sulfide (H2S) in petroleum reservoirs by anaerobic microbial activity is called biogenic souring of reservoirs and is a risk in the oil and gas industry as the compound is extremely toxic, flammable and corrosive. In this paper, we present a workflow and the tools to assess biogenic souring from a pragmatic engineering perspective. The retention of H2S in the reservoir due to the reactions with iron-bearing rock minerals (e.g. siderite) is shown in a theoretical approach here and supported with literature data. Cases are given for two fields under secondary (waterflooding) and tertiary flooding with microbial enhanced oil recovery (MEOR). The use of the Monte Carlo method as a numerical modelling tool to incorporate uncertainties in the measured physical/chemical/ biochemical data is demonstrated as well. A list of studies conducted with different chemicals alone or in combination with various biocides to mitigate biogenic souring provides an overview of potential inhibitors as well as possible applications. Furthermore, the results of static and dynamic inhibition tests using molybdate are presented in more detail due to its promising mitigation ability. Finally, a three-step workflow for the risk assessment of biogenic souring and its possible mitigation is presented and discussed.
Keywords:
Biogenic souring
; waterflooding
; microbial enhanced oil recovery
; souring mitigation
; numerical modelling
; mineral scavenging
; risk management
1. Introduction
The release of hydrogen sulfide (H2S) due to anthropogenic activities may be a result of industrial processes, especially wastewater or waste treatment, but also gas and oil production and oil refining. One source for H2S generation in hydrocarbon reservoirs is the interaction of hydrocarbons with sulfur-containing minerals like anhydrite (CaSO4) to form carbonates in addition to H2S. These reactions take place at high temperatures (>140°C) in a process called thermogenic H2S generation. [1]. Another known type of H2S generation in oil reservoirs is due to anaerobic microbial activity (through sulfate reducing microorganisms, SRMs) and is referred to as biogenic reservoir souring.
Independent from its source, production of H2S is always an unwelcome issue in the oil and gas industry as the compound is extremely toxic, flammable, and corrosive. Damage to reservoir and associated surface facilities caused by biogenic souring remains one of the largest techno-economic risks in all water/chemical injection oil recovery operations, estimated to cause over $100 billion in annual economic damage [2,3,4]. A number of studies from a wide range of disciplines have been published to investigate various aspects of its generation, transport in porous media, rock and fluid interaction, mitigation, and production-corrosion characteristics. Bastin et al. were among the first to provide evidence that H2S can be generated by SRMs in oilfields [5]. Another pioneer, ZoBell, investigated the effect of microbial souring in relationship with water injection to increase oil production [6]. Several books and publications describe the microbial aspects of souring [7,8,9,10,11] and well-established expertise is existing on the issue, including methods of comprehensive analyses of key parameters. The efforts on the modelling and mitigation in the reservoir as well as in production systems are also subject of various publications [3,12,13,14,15,16]. Based on the theoretical, laboratory, and field results, for example, the use of nitrate to mitigate the reservoir souring has been proposed [8,17,18,19,20]. Although nitrate has been used in many field applications [21,22,23], discussions are ongoing on its effectiveness and various alternative mitigation chemicals and methods are proposed [24,25,26,27,28].
The prediction of biogenic souring as well as evaluating its impact on production performance is of crucial importance for the oil exploration and production industry. Despite recent studies that have made important contributions to the understanding of biogenic souring of reservoirs, pragmatic reservoir engineering perspectives providing guidance on how to deal with this difficult and costly challenge in field applications are still scarce. Accordingly, this paper focuses on the following five main objectives:
- Provide a survey of recent studies on the understanding of biogenic reservoir souring, the controlling parameters and its mitigation.
- Emphasize on the importance of mineral scavenging for the retention of H2S in the reservoir based on a theoretical approach as well as laboratory measurements.
- Underline laboratory and numerical modelling efforts, approaches and success rates, exemplified via two application cases on a waterflooding and a microbial enhanced oil recovery (MEOR) technology project.
- Use of the Monte Carlo method as a pragmatic reservoir modelling approach with the associated uncertainties .
- Present and discuss a workflow that can be used in similar studies to assess the risks of biogenic souring and potential mitigation measures.
2. Biogenic Souring; Mechanisms And Impacts on Reservoir-Oil Production
The dissimilatory sulfate reduction, i.e., the conversion of sulfate to H2S by SRMs is the major source for H2S in biogenic souring, and arguably one of the most relevant challenges for the petroleum industry. Dissimilatory sulfate reduction is exclusive to anaerobic conditions as typically encountered in oil reservoirs due to highly reducing environments. However, it should be noted that dissimilatory sulfate reduction is just one aspect of the biogeochemical sulfur cycle and that sulfur-containing compounds can be abiotically and biotically transformed in several ways. For instance, sulfur intermediates can serve as both electron and acceptor and donor simultaneously producing both sulfate and sulfide (so-called sulfur disproportionation, see Figure 1). In addition, sulfur-containing compounds can also be oxidized or assimilated into microbial cells for biosynthesis of amino acids and proteins [29] (Figure 1). But as no H2S is excreted into the extracellular environment in those cases, it is just referred to a number of excellent papers and reviews where the sulfur cycle is discussed in more detail [29,30,31].
Like all other biological cells, SRMs require chemical compounds to grow on, so-called substrates. These include molecules acting as electron donor and acceptor to gain energy from biochemical redox reactions (dissimilatory metabolism). In addition, a carbon source which can be incorporated into the cell mass to allow cell growth is required (assimilatory metabolism). In the case of organic compounds, volatile fatty acids (VFA), the electron donor and carbon source can be the same molecule. In other cases, using inorganic substrates such as hydrogen (H2) may only be utilized for harvesting energy via electron transfer to an electron acceptor. In that case, the carbon required for cell growth can be taken from organic molecules (heterotrophy) or inorganic carbon sources such as CO2 (autotrophy). SRMs can use sulfate (SO42-) as well as less oxidized sulfur forms like thiosulfate (S2O32-) or sulfite (SO32-) as electron acceptors (Figure 1). For oil fields, free sulfate concentrations in injection waters with waterflooding vary from not present at all up to 30 mM (milliMol) when seawater is injected [32]. Another significant example of the injection of organic material into a reservoir is the application of specific techniques for enhanced oil recovery, namely the injection of nutrients in MEOR or the injection of (bio)polymers and (bio)surfactants. Hydrolysis of polymeric substances into monosaccharides and amino acids and subsequent in-situ fermentation results in similar metabolites as described above.
SRMs are common in many environments and can be active as long as the temperature is within the biological relevant range. Even if a reservoir has no documented history of either elevated sulfate levels or souring, souring can occur once sulfate is introduced i.e., with waterflooding. Acetate (CH3COO-) is a common substrate for SRMs as VFA and often present in formation waters and is a potential metabolite produced during MEOR or in-situ hydrocarbon degradation. H2S generation in the presence of SO42- and acetate can be described as follows:
The H2S generated due to this microbial interplay should be assessed for the design of secondary and tertiary oil recovery applications such as MEOR or biopolymer flooding. In this context, it is not only important to consider the microbial cycling of sulfur compounds, but also abiotic reactions: This may include chemical sulfur and sulfide oxidation due to oxidants such as nitrite, but also burial as metal sulfides such as FeS (Figure 1).
In the reservoir, biogenic souring occurs only if specific initial and/or boundary conditions are met. Hence, the formation and transport of H2S in the reservoir is controlled by the microbiological, geochemical/physicochemical, petrophysical, and thermodynamical parameters. The H2S generated is transported in the different phases, namely oil, water, and gas, throughout the reservoir and may be retained in fluid phases and/or may react to solid metal sulfides in the reservoir. Once reaching a production well, the flow conditions and resulting thermodynamics in the wellbore cause the H2S arriving topside to partition mostly into the gas phase, with a potential significant impact on the safety of the facilities.
3. Controlling Parameters of the Biogenic Souring In Oil Reservoirs
The assessment of biogenic reservoir souring needs a thorough analysis and evaluation of the parameters causing and controlling biogenic souring. To assess the magnitude of H2S and its mitigation, the following parameters should be defined and evaluated:
Interventional studies involving animals or humans, and other studies that require ethical approval, must list the authority that provided approval and the corresponding ethical approval code.
3.1. Microbiology: SRM in the Reservoir and/or Injected Water
A large group of known SRMs belong to the bacterial classes and domains of Deltaproteobacteria and Firmicutes, respectively. Sulfate-reducing bacteria (SRB) were the first microorganisms identified in oil fields [5] and several lower temperature oil reservoirs contain SRB. Some sulfate reducers are phylogenetically affiliated with the archaea and are designated as sulfate-reducing archaea, or SRA. In this paper, the term SRB is preferred as they are considered to be the main cause of H2S generation in the reservoir. Two well-known genera of SRB include the non-sporulating Desulfovibrio and the spore forming Desulfotomaculum. Other genera of SRB, including Desulfomonas, Desulfobacter, Desulfobacterium, Desulfobulbus, Desulfococcus, Desulfonema, Desulfosarcina, Desulfomicrobium and Thermodesulfobacterium have also been identified and classified as H2S generating microbes. Besides, some anaerobic extremophilic archaea as well as mesophilic bacteria such as Bacillus, Pseudomonas, Proteus Clostridium and Thermoproteus are reducing elemental sulfur to sulfide [7]. In general, SRB are a mixed group of morphologically and nutritionally diverse, strictly anaerobic bacteria which utilize sulfate as terminal electron acceptor, reducing it to H2S. SRB are present in almost all types of habitats and although being obligate anaerobes, they can also be found dormant in a wide variety of oxygenated environments and are now well recognized for their involvement in microbial induced corrosion (MIC) [7]. Larsen et al. provide a list of the SRB detected in various fields in the North Sea [33], whereas Gieg et al. [34] and Immanuel et al. [26] provide a list of various SRMs reported in various produced waters with the corresponding salinity and temperature conditions. Nowadays various methods are used for the identification and enumeration of bacteria. These include 16S rDNA sequencing for identification and fluorescence microscopy, quantitative Fluorescent In Situ Hybridization (qFISH), or quantitative Polymerase Chain Reaction (qPCR) and reverse transcription qPCR (RT-qPCR) for enumeration of total (i.e. dead and alive) as well as biologically active cells [7].
The kinetics of the H2S generation via microbial sulfate reduction has been investigated by many authors. Tang et al. provide insights on sulfate reduction biokinetics and the governing parameters using various dynamic setups such as bioreactors and sand packs [29]. These studies suggest that the volumetric sulfate reduction rate in the presence and use of various energy and carbon sources by SRB varies depending on operating conditions such as pH, sulfate concentration and finally, temperature. In a reservoir, the biokinetics of microbial sulfate reduction mainly depend on the discrepancy between the prevailing reservoir temperature and the optimum growth temperature of the corresponding SRB, but in terms of reservoir engineering, the reaction times are generally quite fast, i.e., being in the range of several days.
The growth rate of SRB in the presence of substrates can be predicted by the well-known half empirical Monod equation [35]. With variations of the basic equation, Monod kinetics were assessed to account for different products, microbial species or substrate inhibition [36,37,38]. The basic form of Monod equation with the growth rate rg is given as follows:
In which S is substrate concentration, rmax is the maximum growth rate and KS is the half rate constant representing at which the rate is rmax/2.
3.2. Pressure and Temperature
As discussed above, temperature is playing a crucial role on the activity of SRB. Most SRB are thought to be active from low up to moderate reservoir temperatures (10-70°C), whilst thermophilic SRB (Thermodesulfobacterium) are reported to be active up to 85°C [29,34]. According to a limited number of studies, the pressure ranges in oil reservoirs does not seem to have an inhibiting effect on the activity of SRB and H2S production [39]. Figure 2 depicts the results of a study on water samples from several North Sea fields showing the activity regions of SRB as function of pressure and temperature. As can be concluded, the activity of SRB is limited by temperature rather than pressure with tolerable pressure limits reaching 500 bar which is higher than the prevailing pressure in most of oil reservoirs. SRB can also be present in injected seawater and are capable of growing in the reservoir in the so-called thermal viability shell (TVS), i.e., the lower temperature zone which results from the injection of colder water below the reservoir temperature ([39]; see next chapters).
3.3. Chemical-Physicochemical Conditions
3.3.1. Source of Carbon, Energy, and Nutrients
Within the microbial catabolism (i.e., harvesting energy) of SRB, various chemical compounds may serve as electron donor as described in Eq. (1) and chapter 2. These include hydrogen and various organic carbon compounds, for example VFAs and their salts, such as formate, acetate, propionate, butyrate, and lactate. Amino acids, furfural, and sulfur compounds, (polar) aromatic hydrocarbons, and saturated hydrocarbons are among the other compounds which may be utilized by SRB [29]. However, VFAs are among the organic carbon compounds easiest to metabolize and typically present in any formation water to a certain degree. In the case of produced water re-injection, VFAs are usually also present in the injection medium. In the case of injection of biosurfactants and biopolymers for oil recovery or in the application of MEOR, VFAs are generated during various biotic and abiotic degradation processes. According to Vale et al. [40], the mixture of biosurfactant and oil increased or decreased SRB-activity depending on the surfactant concentration (high/low, respectively). Given that such organic carbon compounds are also incorporated into the cells as biomass, the dissolved organic carbon (DOC) content in the water is another useful parameter to assess the concentration of potentially bioavailable carbon [41].
3.3.2. Salinity
High total dissolved solids (TDS) brines will exert a high osmotic pressure on bacterial cells. Laboratory data and unpublished field data indicate that the levels of H2S that can be generated in high salinity brines (TDS of higher than 150 g/L) are lower compared to equivalent lower salinity brines. On the other hand, presence and activity of SRB has been observed in higher salinity reservoirs of up to 180 g/L [27]. With seawater as injection medium, a lower salinity environment is established which provides favorable conditions for growth of SRB.
3.3.3. Partitioning
In common terminology and when discussing H2S, often only the gas phase is considered. However, H2S may also partition to quite some degree into the liquid phases, especially under elevated pressure. In water, it may then further dissociate into aqueous sulfide ions (HS- and S2-), depending on the prevailing pH. In oil reservoir engineering, it is much more valuable to assess the partitioning of all sulfidic species in gas, oil, and water. In the reservoir, where oil and water co-exist, H2S is a mobile chemical compound, transitioning between the oil and the water phase: If the oil phase is in saturated phase i.e. if the pressure is lower than the saturation pressure (bubble point), then a gas phase is formed in the reservoir in addition to liquid phases. A comparable situation occurs during the downhole flow to the wellhead into the separators; due to the pressure drop H2S degasses along with other light components from the liquid phases. The fraction in the gas phase is defined by the H2S partial pressure and is a function of a number of thermodynamic parameters. Prediction of three-phase equilibrium, or partitioning between the phases present, is important for both subsurface reservoir conditions and wellhead/separator conditions.
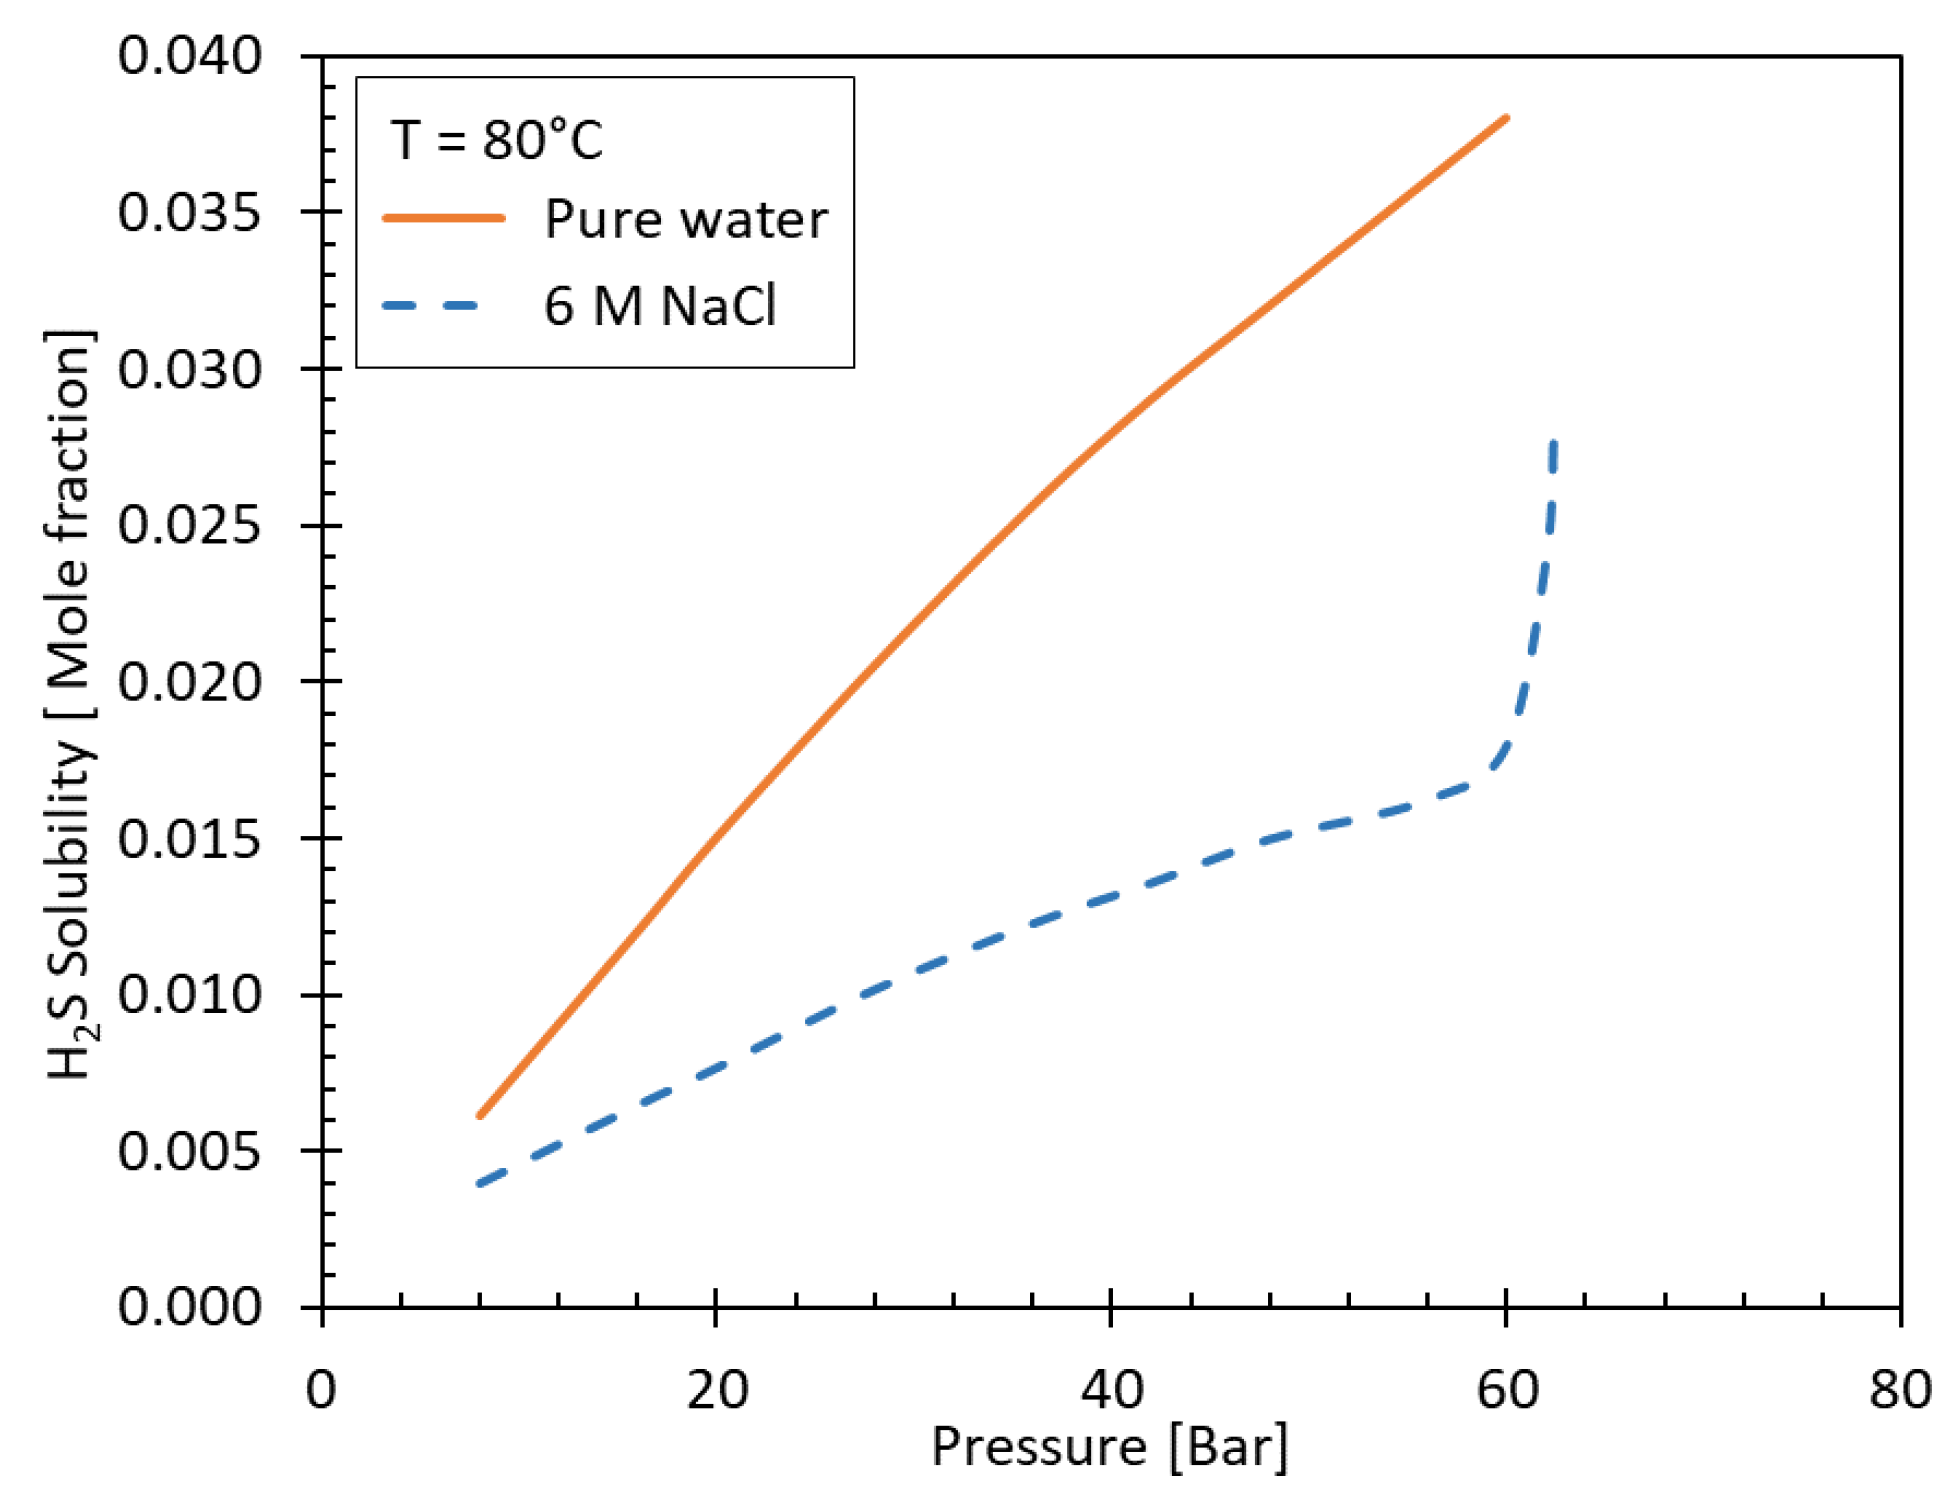
The solubility of H2S in liquids under the normally prevailing temperature and pressure conditions in reservoirs is increasing with increasing pressure and decreasing with increasing temperature. This can be predicted by using the partial pressure concept via Henry’s Law. At low pressure, Henry’s constant depends on temperature and, to a lesser degree, on pressure. At high pressures, it is necessary to consider the pressure dependency of Henry’s constant as proposed by [42]. For water, salinity needs to be considered as well. The solubility of H2S in water decreases as the salinity of water increases [43]. Figure 3 shows the solubility of H2S in pure water and in brine with 6 molar (M) NaCl salinity as function of pressure at 80°C. The pH value also plays a role which is discussed in the following chapter.
The diversity of organic compounds in various crude oils may markedly affect the solubility of H2S in oil and its distribution between crude oil and water. Heavy, more aromatic oils provide a higher H2S solubility than lighter, paraffinic oils [44].
Figure 4 shows the oil-water partitioning coefficient (Kow) of H2S in hexadecane and in a medium-heavy oil (29°API) calculated with PVTSim [45] as function of pressure. Calculations are performed for 1% and 10% NaCl brines. As expected, the H2S preferentially partitions in crude oil, which is heavier and more complex than n-hexadecane. On the other hand, it can also be deduced from the figure that for the high salinity brine case, the Kow is higher for the same oil type, as the solubility of H2S in the brine decreases.
Figure 3.
Solubility of H2S in pure and saline water (6 M NaCl). Data from [46].
Figure 3.
Solubility of H2S in pure and saline water (6 M NaCl). Data from [46].
3.3.4. pH
Most SRB have an optimum growth at around pH 7 but are also active in the pH range of 5-8 commonly encountered in oil reservoirs [18]. Hence, pH as parameter in souring relates to the partitioning of H2S in existing phases rather than the inhibition of SRB activity at very low and high pH values. As the pH of water increases above 5, the concentration of the undissociated H2S decreases in a predictable manner by dissociating to the bisulfide ion (HS-). This bisulfide ion and the further dissociated sulfide ion (S2-), which exists under alkaline conditions, are unable to partition from the water to either the liquid hydrocarbon or the gas phases. Therefore, upon contact with alkaline water, any H2S in the hydrocarbon phase will not only partition into the water, but also dissociate until the partitioning and dissociation reactions reach equilibrium. This equilibrium state may or may not support the existence of significant H2S in the gas phase. Figure 5 shows the Kow for two different pH values (pH=8 and pH=6) as function of pressure where the effect of pH on the partitioning of H2S into oil and water phases can be clearly observed.
3.3.5. Rock Mineralogy/Formation Water Composition
Due to precipitation reactions, H2S retention in the subsurface is assumed to be significant if the reservoir fluids contain dissolved ferrous iron Fe(II) or if the rock includes iron-rich minerals. This is referred to as mineral scavenging and for exemplary purposes, we focus here on the siderite (FeCO3) only. If present in the reservoir rock’s flow paths, siderite may react with H2S to form pyrrhotite (FeS) or other (partially amorphous) sulfidic minerals:
A theoretical approach based on the precipitation reaction given above can give an idea on the retention potential of H2S: Consider 1 m3 of oil reservoir with a porosity of 25% that is filled with formation water containing 0.5 mM SO42-. According to Eq. (1), the total consumption of the present sulfate would yield a stoichiometric concentration of 0.5 mM H2S (or 0.125 mol per 1 m³ reservoir volume based on the aqueous phase in the porous media). If the formation consists of 1% wt. siderite, this corresponds to more than 20 kg (172.6 mol) siderite in 1 m3 reservoir, given a rock density of 2,650 kg/m3. With a conservative assumption that only 1% (1.72 mol) of this siderite amount is in contact with the water phase and hence available to react with H2S according to Eq. (3), there is a significant excess of reactive siderite compared to the available H2S by a factor of approx. 15-fold. This example using conservative input data, however, shows the relevance of mineral scavenging in oil reservoirs if the formation mineralogy contains iron-bearing minerals in contact with H2S.
In addition to the above given retention mechanism of the reservoir rock, the divalent cation content of the formation water may well cause the sulfate to precipitate as Ca2+, Ba2+, or Sr2+ sulfates (e.g., CaSO4, BaSO4, and SrSO4) – depending on oversaturation and temperature; this precipitation reactions usually have faster kinetics than the microbial consumption of the sulfate:
Beyond the effect on sulfate, sulfides may be precipitated also by reaction with dissolved ferrous iron (II) in the formation water in a manner very much like the siderite retention mechanism outlined above:
Low concentrations of ferrous iron cations are often found in reservoir waters, especially if iron-bearing minerals are present within the reservoir.
The mitigation capability of iron-bearing minerals has been investigated and discussed in the literature based on experimental evidence. In a recent study, Graham et al. presented the results of an experimental study consisting of batch and dynamic experiments (sand packs and core floods) and they concluded that the magnitude of the two proposed mechanisms for H2S reservoir scavenging (dissolution/precipitation) depends on the stability of the Fe-bearing minerals and provided a scavenging capacity of 0.5 to 13 mg H2S/g rock over a range of initial pH values and temperatures [47]. Kögler et al. reported the H2S retention capacity of crushed formation material containing siderite (10% wt.) to be approximately 0.14 mg/g [27]. The data available in the literature are listed in Table 1. Although the experimental setups and procedures are subject to uncertainty, the values emphasize the validity of the above theoretical approach and demonstrate the importance of mineral scavenging in mitigating biogenic souring.
Temperature has the largest effect on the mineral scavenging. Higher temperatures yield larger capacities, which can be attributed to the accelerated kinetics. The composition of the reservoir rocks can be estimated from petrographic evaluations of recovered core materials but the degree to which they contribute to the H2S scavenging in a reservoir is difficult to predict. The mineralogy is generally not homogeneously distributed and petrophysical parameters like permeability also play a role. In addition to iron carbonates, other minerals can contribute to the H2S retention, both positively and negatively. Especially, the presence of clays is mentioned to adsorb H2S, thus increasing the mineral scavenging capacity. High porosity and permeability may translate to a lower specific surface area of the rock and hence a lower contact between scavenging minerals and H2S-bearing phases. Wettability can affect the access of H2S present in both phases to the minerals as well. In addition, hydrodynamic heterogeneity is also a factor that can affect mineral scavenging of H2S in the reservoir; reservoirs with high heterogeneity allow flow paths with higher permeability and the generated H2S can flow in the corresponding phases to the production wells without contacting the carbonates.
3.4. Petrophysical Conditions
3.4.1. Permeability
It is known that SRB can differ in shape and size with an average length of one µm, like most other bacteria. Experimental studies reveal a linear relationship between straining rate of spherical bacteria and the ratio of bacterial diameter to average pore size. Gruesbeck and Collins suggested that the ratio between bacteria diameter to the pore size must be in the range of 0.17 to 0.25 for straining-induced plugging to occur [50]. This corresponds to the claim made by Davis and Updegraff that the pore throat sizes of the rock should be at least twice the cell sizes to allow passage of microbes through the rock without substantial plugging [51]. Generally, rod-shaped bacteria tend to adopt a preferred orientation in direction of the flow along their major axis [52]. For free movement and transport of the SRB throughout the reservoir, the permeability or, more precisely, the average pore size of the reservoir studied should be large enough (kavr > 100 mD, pore diameter > 10 µm). If SRB are introduced into the reservoir via injection water and if the permeability is too low to transport the SRB deeper into the reservoir, H2S can only be generated in a limited volume of the reservoir. Potentially, biofilms may form in the near wellbore region which may accelerate the souring. On the other hand, lower permeability means a higher contact area, thus increasing H2S retention via mineral scavenging in the reservoir, if the rock mineralogy allows.
3.4.2. Heterogeneity
Reservoir heterogeneity can increase the effects of biogenic souring because of at least two aspects: Via higher permeability channels, the soured water and/or oil will reach the production wells faster, therefore allowing less time for retention and scavenging reactions which would remove H2S from the fluids; the resulting rapid breakthrough of H2S to producers is another drawback. The other negative aspect is the lower contact area between soured fluids and reservoir rock, which again implies a lower amplitude of retention and scavenging of sulfate and H2S in the reservoir. The heterogeneity can be quantified with the help of various methods like Dykstra–Parsons (DP) coefficient [53].
An overview of the controlling parameters of biogenic souring and their influences in terms of reservoir engineering is provided in Table 2.
4. Laboratory and Numerical Modelling Efforts-Types and Applications
Although biogenic souring has been observed in numerous oil fields where seawater is injected, predictive capabilities are still limited. In a general sense, if souring has occurred in a certain part of the field, the generated information can, if well documented, also be parametrized and utilized for other parts of the reservoir. However, field simulations of biogenic souring are not straight forward as spatial and timely uncertainties in the parameters play a role on the development of the conceptual models, and thus on the numerical implementations. In the related literature, three conceptual models are frequently discussed and applied.
4.1. Conceptual Reservoir Models of Biogenic Souring
4.1.1. Mixing Type Souring Pattern
In this concept, it is assumed that microorganisms thrive in the mixing zone of nutrient-rich formation water and sulfate-rich injection brine [54]. Given this model, produced H2S should peak with the injection water breakthrough, before it eventually flattens out, due to the mixing front moving beyond the ideal temperature window and due to the loss of ideal mixing ratios (i.e. depletion of available sulfate due to consumption and dilution of injection brine).
4.1.2. Biofilm Formation
A biofilm built-up in the proximity of the water injectors is assumed to take place. Hence, the model attributes the generation of H2S during seawater injection to the sessile (e.g., attached cells) SRB in the biofilm and all reactions responsible for reservoir souring take place in the vicinity of the injection well. Here, the temperature reduction due to continuous injection enables optimized conditions for microbial activity, sustained by crude oil itself as carbon source (biodegradation of oil components or water-soluble BTEX) [48]. With this model, the H2S production begins with injection water breakthrough as well, but slowly increases over time with a growing population of SRB in the biofilm. The nutrient concentration of the injection water is one of the major controlling factors.
4.1.3. Thermal Viability Shell (TVS)
This concept is based on the correlation of experimental data that relates the consumption of sulfate to the temperature and pressure in the presence of SRB [39]. In its original form the model assumes a constant concentration of sulfate in seawater and does not include the chemical constraints (limited nutrient availability) effects on the generation of H2S. Thus, with the profile of temperature and pressure in a reservoir, the generation rate of H2S is obtained with a simple stoichiometry as function of the reduced sulfate. In the original model, the retention and partitioning of H2S are ignored. The model attributes the delay in the produced H2S to the lag of the temperature front with respect to the injection front i.e., thermal vs hydraulic radius by calculating them via analytical methods.
4.2. Model Implementations
Maxwell and Spark described the possibility for hybrid models for field simulation, and in a recent paper on the Gullfaks (Norway) field, this could be shown for the H2S formation in an oil field flooded with seawater [55,56]. Indeed, the numerical reservoir models could and in most of the cases should contain all the relevant aspects of the three concepts, in addition to the general rules of transport in porous media including effect of controlling parameters presented in section 3. Figure 6 depicts the formation and transport of biogenic H2S in the reservoir schematically. Assuming that SRB are present in the reservoir in sessile or planktonic form, injection of sulfate would cause the formation of H2S due to the reaction given in Eq. (1). If the temperature in the reservoir is too high for the activity of the SRB (>80°C), the injection of cooler water may also transport SRB into the reservoir and the decreasing reservoir temperature in the reservoir can form favorable conditions for SRB. The SRB may adhere/adsorb onto the rock surface forming biofilm layers. The biofilm formation kinetics are known to occur within a relatively short time and the biofilm density is expected to decrease with increasing distance from the injector. As these biofilms potentially contain high numbers of SRB, these are the main sources of H2S generation, especially around the injectors as theorized by the biofilm concept.
The above given concepts for injection, transport and retention in porous media and production are numerically modelled by various researchers and engineers, at laboratory and/or field scale. A summary of these attempts is given in Table 3. Numerical simulators UTCHEM and TOUGH2 were adapted successfully for modelling the various aspects of H2S formation and transport at laboratory scale [57,58,59]. Field modelling efforts are given by various authors starting with [48]. More recent numerical simulators such as REVEAL by PETEX and the “Oil Plus 3D” can better represent H2S transport within the reservoir, but uncertainties about the controlling factors and limits for SRB activity have to be considered [60,61]. At the moment, “SourSim” can be combined with any commercial reservoir simulator. Several sophisticated souring models use geochemical algorithms to predict the biogenic souring and its mitigation using various chemicals [62,63,64]. State-of-the-art commercial reservoir simulators are (and should be) able to model all reservoir features of the biogenic souring [65,66,67]. From a pragmatic point of view, the main issue is to calibrate and validate the models. A validated reservoir model is mandatory as an initial step of a reliable souring modelling work. For the second step, the souring prediction, the model should be adapted to reflect reservoir souring processes, which in turn requires chemical and physical input from laboratory analyses of the field samples and measurements. As a rule of thumb, the higher the reliability and accuracy of the input data, the higher the validity of the reservoir souring model. Therefore, physical/chemical modeling and analysis at laboratory and field scales are essential to support the numerical studies. A compilation of the laboratory and experiments and measurements that can support numerical souring studies are given in Table 4.
5. Case Analyses
Two cases of using commercial reservoir simulators for assessing and predicting the biogenic souring based on measured data and observations are presented in the following sections.
5.1. Case 1: A Field in North Sea under Seawater Flood
In this example, seawater injection into a green North Sea oilfield is considered. Due to absence of historic data from the field for the given case, souring input parameters were taken from literature and adjusted using in-house expertise as well as field analogues in the area [56,68]. Due to topside limitation, sulfate removal from seawater was not considered; the sulfate concentration in injection water was measured to be about 2,780 mg/L, whereas sulfate present in the formation water was in the range of 4-10 mg/L. The formation water shows a salinity similar to seawater, but with a significant concentration of acetate (VFA). Hence, sufficient carbon sources are available for SRB. With regards to phosphorous and nitrogen, both were assumed to be present in concentrations not limiting the growth of SRB either. The reservoir temperature is just below 100°C and thus outside the microbially tolerable zone, but would be affected by water injection, leading to lower temperature around the injector wells. The spacing between injectors and producers is between 1,000 to 2,500 m, the average permeability is around 200 mD. An assumed 100% conversion of all VFA would lead to about 240 ppmw H2S, which was used as a first conservative estimate in the study. Laboratory evaluations utilizing relevant seawater samples from the area indicated that the generation of H2S is a realistic scenario, but the magnitude of the conversion could not be determined reliably.
To get a more realistic estimate for the resulting H2S concentrations in the reservoir, a simulation study with CMG STARS [89] was set up using the 3D reservoir model previously developed (Figure 7) [90]. Seawater is injected in the wells WI1, WI2, and WI3, and OP1, OP2, and OP3 are production wells. OP1 and OP3 are completed into the oil leg, while OP2 is completed into the water leg. The temperature variations due to water injection was accounted for by using the thermal option. No iron-bearing minerals were identified in subsurface samples, and therefore H2S retention was not considered to ensure conservative souring estimates. The model that includes chemical reaction for souring process was implemented to predict the reservoir, production, and injection performance over field lifetime. This approach not only allows to assess H2S production over life of field, but also serves as input to studies for topside mitigation needs and inorganic scale assessments. Especially on the former, high uncertainties of H2S production rates may lead to design changes for the H2S removal facilities.
The three production wells show distinct features in terms of H2S production. As OP1 and OP3 are supported by injection into the oil leg, the effective mixing zone between injection and formation water is limited for these wells. This leads to short peaks of H2S production in the simulation model, with abrupt increase and a declining trend thereafter, when the mixing zone moves out of the favorable temperature window. In case of OP2 well, however, with the corresponding injection well being completed into the water zone, large efficient mixing between the nutrient rich formation and sulfate/SRB rich injection water would lead to a steadily increasing H2S production over time.
For the given case, though, the history matching of production data in future may help to reduce the impact of the input uncertainty on the model. As can be seen in Figure 8, the breakthrough of injection water (and production of H2S) for OP1 is predicted to happen significantly earlier than for OP2 and OP3. This feature may allow for history matching with a subsequent tuning and re-running of the souring model to predict H2S production at OP2 and OP3 with reduced uncertainties.
As a result of the simulation study, a basic mitigation strategy to reduce the H2S production was defined to allow for H2S scavenging at OP1. It is important to highlight that the mitigation strategy is only a part of the total approach for the asset. Intense treatment of the injection water aims to reduce the overall occurrence of souring as well.
5.2. Case 2—An Onshore Field on a MEOR Application
A second example is given on the potential biogenic souring during a tertiary recovery application, namely MEOR. The study is described and discussed in previous papers in detail [27,90,91]. The biogenic souring was determined as one of the major risks at the beginning of the project and efforts to determine its magnitude and to develop potential mitigation started early. In the framework of the studies, the numerical modelling using the experimental data delivered was a major element accompanying this project. After the laboratory analysis of both injection and formation water, the microbial growth was studied under various feeding conditions and important aspects of the assessment could be specified as given in Table 5. To summarize: SRB are present in the reservoir and the thermodynamic, petrophysical as well as feeding conditions (conversion of injected nutrients to VFA during MEOR) are optimal for of biogenic souring. This was confirmed by batch as well as dynamic experiments, as shown in Figures 9a,b. In Figure 9a, the result of a batch experiment is shown where MEOR nutrient was added to formation water alone as well as formation water containing formation sand and oil. It was concluded that after the initial incubation time (3 days), corresponding to the consumption of MEOR nutrient and subsequent formation of organic acids as potential SRB substrate, H2S starts to form and is concurrent with a decrease in sulfate concentration. In the presence of sand and oil, the formation of H2S is delayed and remains at a lower range until the 8th day. Figure 9b shows the result of a sand pack experiment in which sand is used as filling material as shown in Figure 9c. Here, it can be noted that H2S is detected at the outflow only after 30 pore volume (PV) of injection, much later in comparison to the MEOR products acetate and ethanol which are shown in the figure as total VFA. Supplementary experiments showed that only approximately 3% of the VFA generated by MEOR application are needed to transform all the existing sulfate to H2S (data not shown). This indicates that the generated H2S in this case is limited by the amount of available sulfate. Furthermore, the H2S concentrations measured at the outflow (sand packs) and the headspace (batch experiment) are significantly lower than the theoretical values calculated based on the initial sulfate values. This implies that other mechanisms like retention of sulfate and H2S in the system play a role in the total amount of H2S measured. To be able to predict the extend of the souring in the field application, numerical modelling was applied. The commercial reservoir simulator CMG STARS [89] was used to simulate laboratory continuous up-flow sand pack experiments. Observed compositional changes along the length of the sand pack are matched for various injection scenarios. A similar approach was used previously to model MEOR in a field application in the project. The MEOR modeling concept is based on modeling the metabolism kinetics by replacing the Monod equation with the available Arrhenius equation in STARS. The kinetic parameters were calibrated by using the laboratory data, including dynamic experiments [92].
A model of the reservoir sector selected for the MEOR field pilot is used to investigate the potential souring without mitigation. The model is further improved to simulate the H2S dissipation in the reservoir by adding sulfate as another component to the system (formation and injection waters) and formed metabolites are applied in chemical reaction option (similar to Eq. (1)) to generate H2S with an assumed complete sulfate consumption. An injector with an injection rate of 150 m3/day and two producers with total production of 150 m3/day are the well components of the model. The general characteristics of the model are given in Table 6. The model consists of 16 horizontal layers with varying permeabilities (Table 6; 5 rock types with permeabilities between 1 – 6130 mD) reflecting the vertical heterogeneity of the reservoir. Figure 10 shows the production predictions from one of the producer wells, situated 150 m away from the injector. As can be seen, the water cut is above 96% resulting in a low oil production and therefore low H2S content due to the preferred partitioning into the oil phase. H2S breakthrough to the nearest production well (150 m to injection well) is calculated to be around one year after the injection start and reaches a maximum after 5 years. Note that in these runs, the retention of H2S is neglected. Although the amount of H2S dissolved in oil is larger than in water, the total H2S production from the main producer’s water is more relevant during the years 1-2.5 due to the water cut of around 96%. With a reduction of the water cut with time, as demonstrated in related MEOR simulations, the absolute amount of H2S being produced with the oil phase shows a steeper increase compared to the fraction from the water phase.
The siderite content of the reservoir rock reaches up to 10% wt. and the formation water contains ~1.2 mM ferrous iron. The corresponding retention reactions with generated H2S may be modelled using the chemical options of the simulator. As experimental input was missing in the case, the geochemical reactions of H2S are modelled by using Langmuir type adsorption curves for low and high cases. Figure 11 compares the H2S concentration in oil for the 4th layer of the model after 8 years of MEOR application for (a) no retention and for the cases in which retention is introduced as (b) very low with 0.001 mg iron sulfide per g of rock mg/g, (c) low with 0.01 mg/g and the most realistic high case with (d) 0.1 mg/g rock .
As can be concluded for this case, a H2S breakthrough to full extent (i.e., similar concentrations near the injector and producer) is only observed for the no-retention case while the low as well as the high retention cases show only little or no breakthrough at all (realistic scenario: d). Note that in the retention runs, the potential changes in the porosity and permeability due to mineral precipitation were not considered.
In this case the retention of H2S and/or sulfate in the reservoir is the main controlling parameter. At the same time, the retained amount is one of the most uncertain parameters. To highlight this point, a sensitivity analysis was performed, and the results were evaluated with Monte Carlo simulation by using the CMOST option of CMG [89]. Mineral scavenging, sulfate content of injection water and injection rates were selected as sensitive parameters and entered to a Monte Carlo uncertainty analysis as statistical distributions between the minimum and maximum values estimated from lab and field data. Figure 12 shows the statistical distribution of the H2S amount produced from the P-1 with low (P10), high (P90) and mean (P50) probability cases. As shown in the figure, the total H2S production rate in the most probable case (P50) is 0.349 kg/day, while the low (P10) and high (P90) probability cases are 0.158 kg/day and 0.541 kg/day, respectively. Since conclusive experimental data under reservoir conditions is not always available, mineral scavenging as well as the following parameters can be used for the prediction of H2S formation and production:
- -
- Sulfate content of the injection/formation water: The sulfate content of both injection and formation water can be determined from the water analyses of injection and production waters. However, if sulfate is introduced by the injection water and if the formation water does not contain sulfate in the first place, it might be challenging to estimate the timely and spatial distribution of sulfate in the reservoir.
- -
- Amount of substrate available for SRB in the reservoir is a critical parameter and independent of whether SRB are found in injection water and/or found in the reservoir. In case of a typical MEOR application, VFAs are generated as the product of in-situ fermentation reactions and these are available in excess for the complete reduction of sulfate. In this case, they cannot be used in an uncertainty analysis.
- -
- Partitioning coefficients: The partitioning of the H2S between the phases in the reservoir as well as in the wellbore can be determined well if the compositions and thermodynamic conditions are known. Yet, a careful examination of the existing literature implies that there is still a margin of uncertainties, especially for the oil/water partitioning coefficients.
6. Mitigation of Biogenic Souring
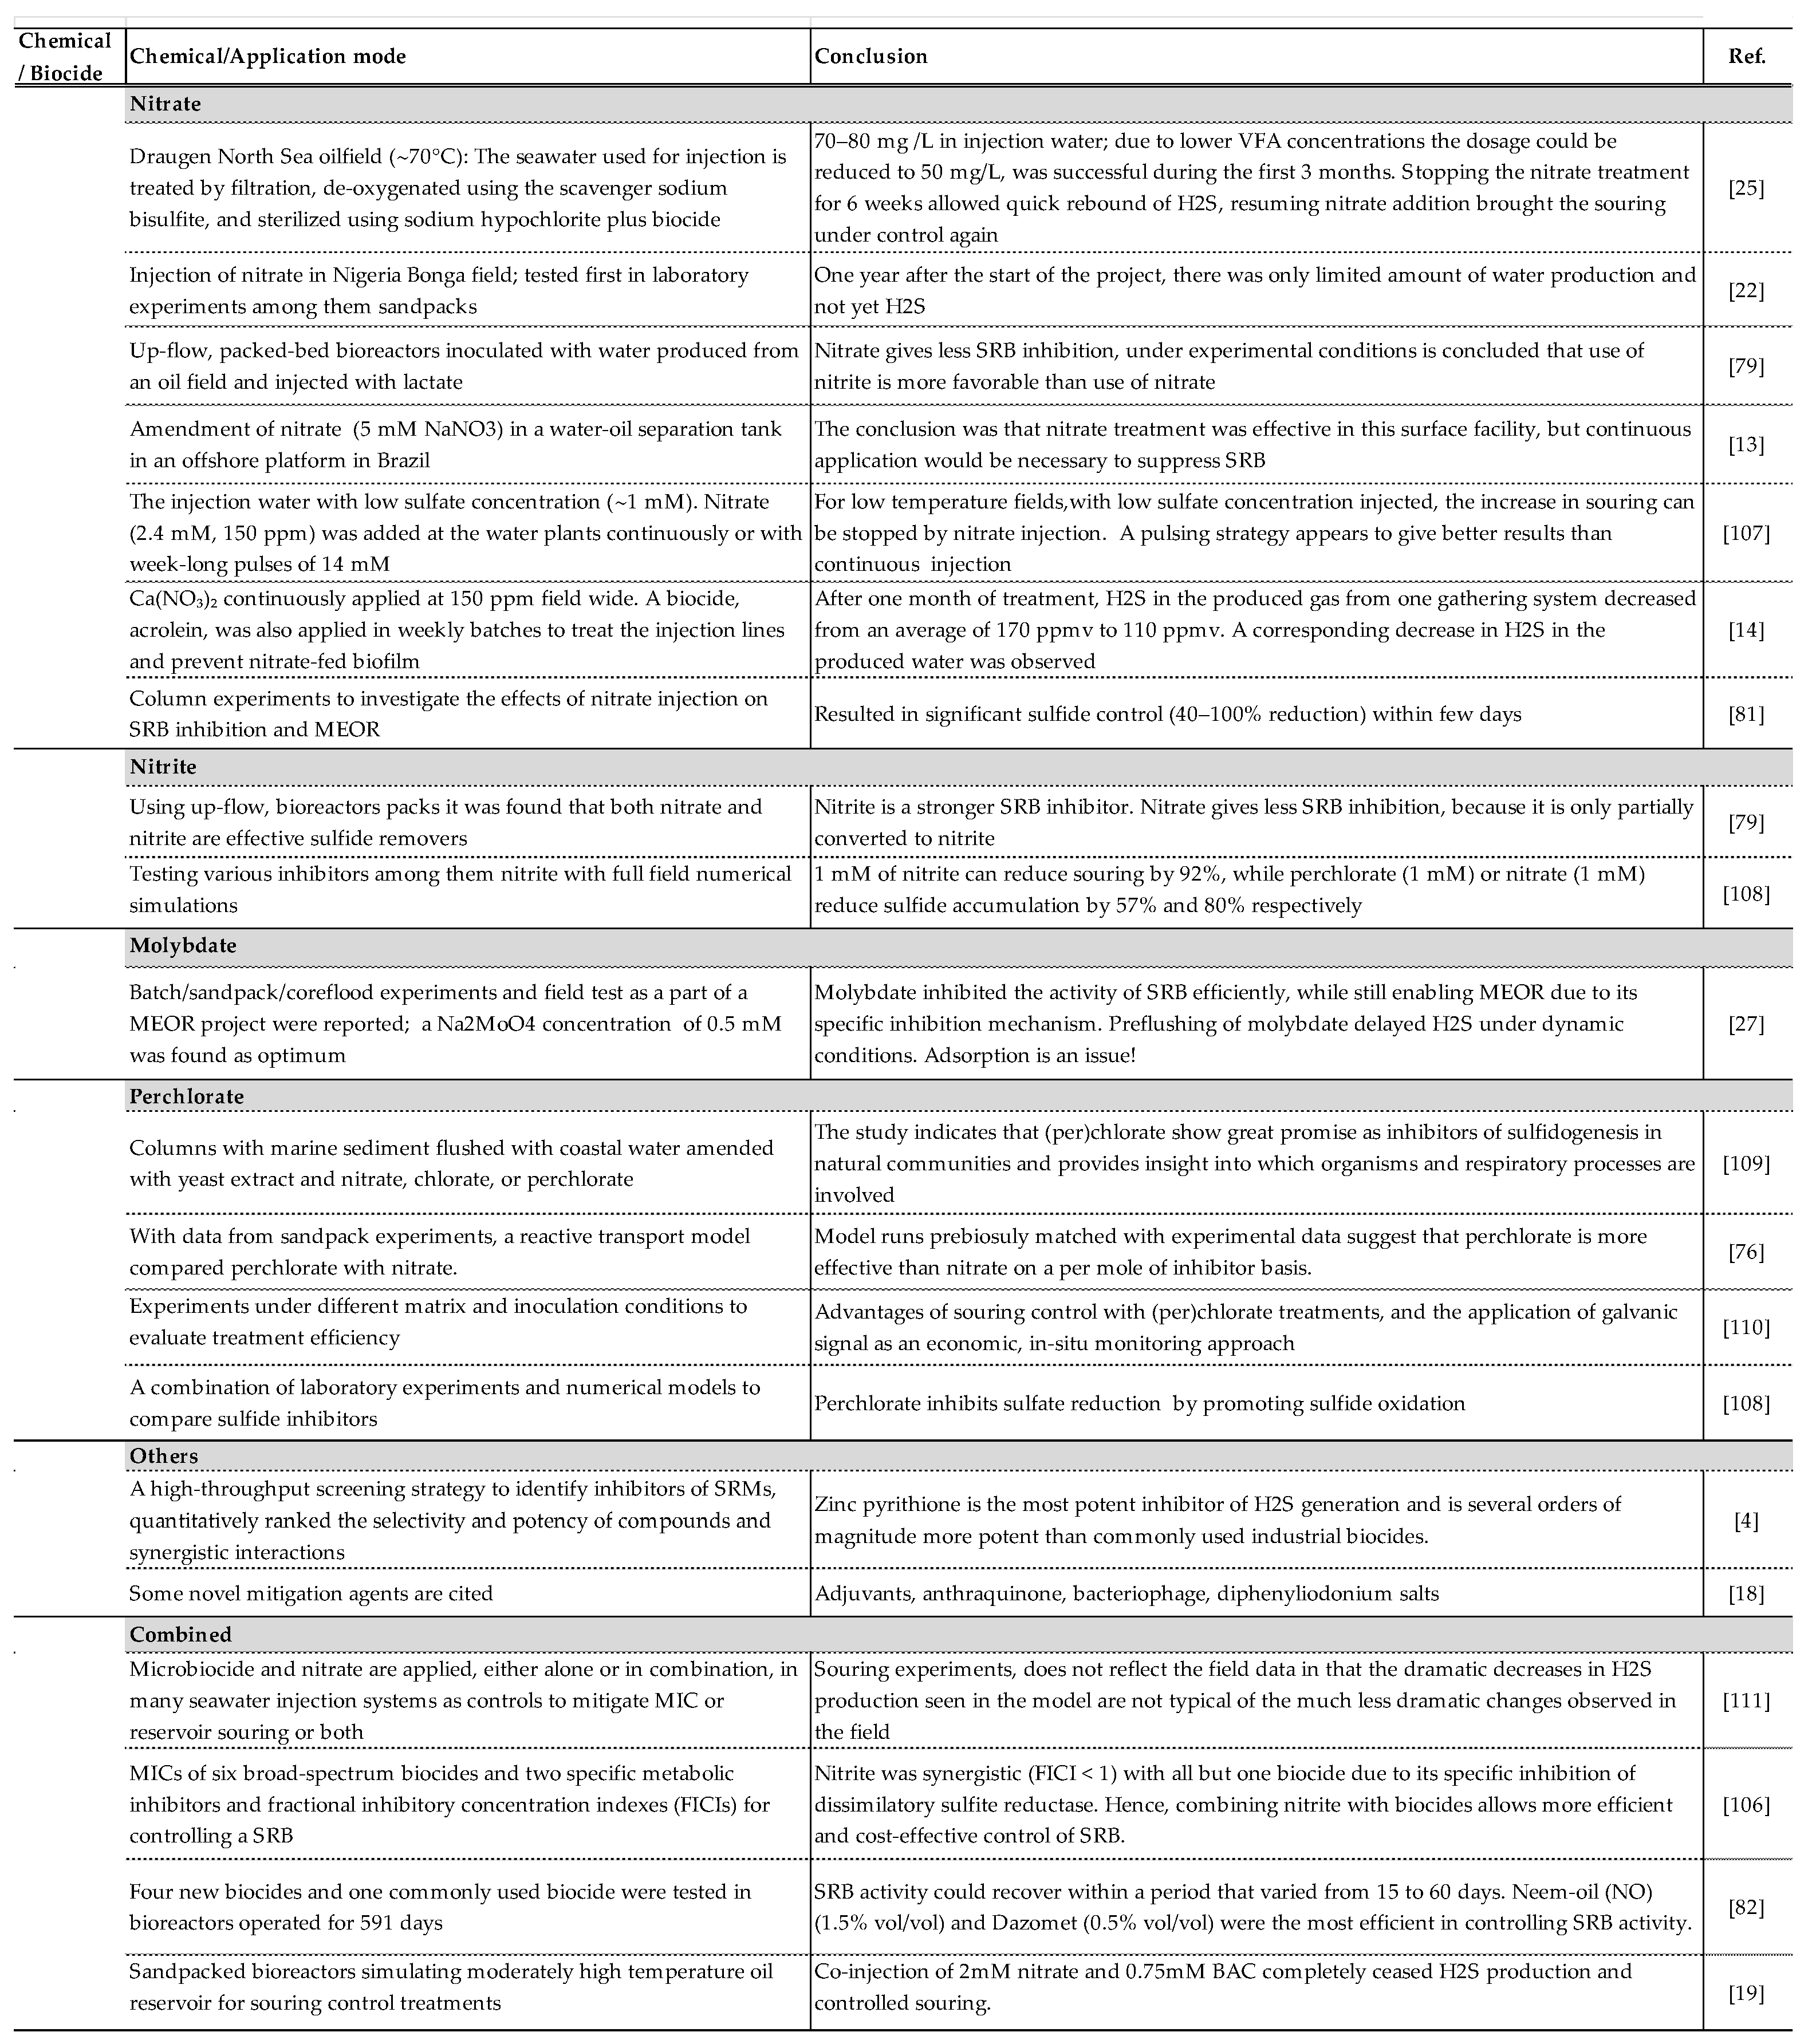
The mitigation of biogenic souring is subject to numerous scientific and engineering studies and field applications. Biogenic souring is commonly inhibited by adding biocides to surface water loops or injection fluids. However, these are often environmentally questionable and associated with excessive costs versus a limited efficiency [3,34]. Furthermore, their usage is heavily regulated. In addition, most biocides are non-specific and cannot be used to target SRB exclusively if the growth of other microbial species is desirable. This issue is relevant in MEOR as well as in oil to methane conversion projects. Once the risk of biogenic souring is defined, some proactive measures such as removal of the components responsible for biogenic souring (sulfate, VFAs) may be helpful in limiting the extent of souring, but possibly with little impact on long-term trends. Co-injection of a chemical that serves as a souring inhibitor should be part of the mitigation measures in most cases. A list of the recent studies on potential inhibitors for biogenic souring is provided in Table 7. The most relevant applications include the following:
6.1. Nitrate/Nitrite
The relevance of nitrate in preventing H2S formation in sewage systems in the framework of bio competitive exclusion has been known for almost a century and was demonstrated in the laboratory with oilfield brine microcosms and bioreactors decades ago [86]. However, using nitrate to treat souring in oil production operations began only in the 1990s [94,95]. Because of its low cost, easy availability, and high solubility in water phases, it had been claimed as a preferred solution over the use of biocides. A high number of studies report its field application e.g. [14,22,56]. The proposed mechanisms for reducing H2S formation through nitrate or nitrite modification include: (1) the preferential use of nitrate as an electron acceptor instead of sulfate by some species of SRB, thus suppressing microbial sulfate reduction (2) suppression of SRB activity as a result of competition between heterotrophic NRB and SRB for the same electron donors with SRB being out-competed, and (3) inhibition of SRB activity via intermediate compounds generated during nitrate reduction by heterotrophic NRB or NR-SOB (nitrate-reducing, sulfide-oxidizing bacteria), e.g. NO, N2O and especially nitrite, NO2-. Nitrite is claimed to be an effective souring inhibitor agent while also mediating the oxidation of sulfide [24,64]. In general, reported nitrate and nitrite concentrations applied in laboratory and field applications range from 10 mM up to 100 mM. However, some species of SRB possess high nitrite reductase activity which allows them to overcome this inhibition by reducing nitrite to ammonia. Veshareh and Nick investigated a novel approach of evaluating different reaction pathways to design reaction models that reflect governing microbial processes during the souring processes in a set of batch and flow experiments, suggesting dissimilatory nitrate reduction to ammonium as the main reaction pathway [20]. Further, they illustrate the inhibition by nitrite as the major mechanism of nitrate treatment process and introduce an inhibitory nitrate injection concentration: A Required Inhibitory Nitrate Concentration (RINC) of 15 mM is supposed to inhibit souring, regardless of the nitrite inhibition effect and the distance between injection and production wells. Furthermore, they demonstrate that the ratio of the nitrite-nitrate reduction rate can be used to estimate nitrate treatment effectiveness.
However, using nitrate or nitrite as inhibitor agents bears the potential for significant drawbacks which were studied in recent literature:
- -
- The fundamental inhibition mechanisms are well understood, but the complex biological, biochemical, and abiotic interactions in a reservoir cannot be predicted fully. In recent studies [56], the inhibitory effect previously claimed to be due to nitrate injection on Gullfaks field could be assigned to mixing and biofilm models instead and was potentially not related to the nitrate application.
- -
- Continuous and well-defined dosages of high nitrate concentrations are needed for direct inhibition (>10 mM). A sub-optimal or insufficient nitrate treatment strategy may result in higher H2S production from production wells despite a lower total amount of generated H2S inside the reservoir; but unconsumed nitrate in case of excessive nitrate injection could increase the need for post-production water treatment [96].
- -
- -
- More recently, nitrate injection was also shown to result in so called microbial induced calcite precipitation (MICP), potentially causing injectivity problems in the field [98].
- -
- There are concerns that nitrate or nitrite can exacerbate corrosion due to their oxidizing potentials [99].
6.2. Molybdate
Originally proposed by Peck [100], molybdate has been studied as SRB inhibitor in recent years for relevant technical applications such as in biogas generation [101] or within the oil and gas industry [4,27]. As an analogue to the sulfate ion, molybdate targets the first step of microbial dissimilatory sulfate reduction very specifically, the sulfurization of ATP to adenosine-5 -phosphosulfate (APS) under the release of pyrophosphate. The involved enzyme, ATP sulfurylase or sulfate adenylyl transferase is unable to discriminate between sulfate and molybdate. The resulting molybdate intermediate is not stable, leading to gradual depletion of intracellular ATP and eventually to cell lysis, after which the molybdate is still available for further reactions [100,102]. Despite this catalytic mode of action, its low toxicity and low environmental hazard class, molybdate has not been employed in the petroleum industry widely. In addition to higher costs compared to other inhibitors, retention of molybdate in the reservoir by adsorption or precipitation has been considered an obstacle for its broad implementation.
Kögler et al. mentioned that molybdate inhibited the activity of SRB very efficiently, while still enabling a planned in-situ MEOR due to its specific inhibition mechanism [27]. As shown in Figure 13, in batch experiments, 0.5 mM molybdate inhibited SRB growth more efficiently than 100 mM nitrate . They also showed that a preflushing of molybdate delayed microbial sulfate reduction under dynamic (sand pack) conditions (data not shown). However, significant molybdate adsorption onto reservoir rock occurred and the maximum Langmuir saturation was estimated to be 34 μMMolybdate per gram of rock. Residual oil allowed a further propagation of molybdate in sand pack reservoir models, but a pH < 6 limited the efficiency of molybdate due to its rapid adsorption. Under favorable souring conditions, they also observed the localized formation of macroscopic iron sulfide precipitations in sand packs with a corresponding four-fold permeability decrease after 40 days of continuous operation. The calculated mean sulfate reduction rate was 52 μMSO4/h with molybdate-preflushed sand packs showing a delay in sulfate reduction. This suggests an inhibitory effect, even if molybdate is partially adsorbed. In the corresponding pilot field of the same project, MEOR performed as a “huff and puff” application, sodium molybdate is reported to be injected alongside a nutrient solution with a concentration of 0.1 g/L and no H2S production was reported during the back production [67]. No other field applications were reported until now. More field trials are required to decide on the performance of molybdate as inhibitory agent.
6.3. Perchlorate
Engelbrektson et al. investigated the inhibition of microbial sulfate reduction by using perchlorate {103]. No effluent sulfide was observed when packed columns inoculated with marine sediment were flushed with coastal water amended with yeast extract and perchlorate (10 mM). Veshareh et al. suggest that on a field scale, perchlorate inhibits H2S accumulation by inhibiting sulfate reduction and promoting sulfide oxidation. Their field scale numerical simulations predict that injection of 1 mM of nitrite can reduce souring by 92%, while perchlorate (1 mM) or nitrate (1 mM) have the potential to reduce H2S accumulation by 57% and 80% respectively. To date, no field application using perchlorate is reported [104].
6.4. Other Inhibitors
The use of other chemical inhibitors, among them tungstate and mono-fluorophosphate, were investigated at laboratory scale in the literature. Klueglein et al. indicate that in batch experiments, mono-fluorophosphate only inhibited H2S formation at very high concentrations (1 g/L), where strong precipitation was observed with the high salinity brine specific to the case studied [105]. Carlson et al. (2017) developed a high-throughput screening strategy to identify potent and selective inhibitors of SRM, quantitatively ranked the selectivity and potency of hundreds of compounds and identified previously unrecognized SRM-selective inhibitors and synergistic interactions between inhibitors [4]. They identified zinc pyrithione as the most potent inhibitor of SRB indicating that it is several orders of magnitude more potent than commonly used industrial biocides. Greene et al. investigated the combined use of nitrate, nitrite and molybdate with biocides based on fractional inhibitory concentration index (FICI) {106]. They affirm the usefulness of such combinations and report a strong synergy between nitrite and the biocides glutaraldehyde, benzalkonium chloride, and bronopol. Although molybdate is a specific SRB inhibitor, they found that molybdate was less suitable than nitrite. Prajapat et al. studied various souring control treatments by evaluating them in sand packs [19]. Results revealed that continuous injection of 4 mM nitrate and 1.5 mM benzalkonium chloride (BAC) alone was not able to control souring. However, co-injection of 2 mM nitrate and 0.75 mM BAC completely ceased H2S production and controlled souring, highlighting the efficiency of a combination of biocides due to synergistic effects.

Table 7.
Summary of potential inhibitors for biogenic souring.
7. Workflow for the Assessment of Biogenic Souring
Risk assessment of waterflooding, chemical (biopolymer. biosurfactant) injection, or MEOR projects should consider biogenic souring as one of the relevant risks that may affect project scope, cost and schedule. From a project management point of view, the risk should be defined and quantified as soon as possible, and mitigation measures should be planned and taken as per plan. Obviously, this work should be done based on an assessment plan considering state-of-the-art of related technology and experiences.
Kalpakci et al. described a decision strategy which is one of the earliest examples of its kind [112]. Numerous studies apply assessment procedures, all of which have in common that they include experimental and numerical parts for the definition and mitigation of souring. In a list of strategies to reduce the risk of reservoir souring provided by Gieg et al. the removal of the sulfate (reverse osmosis, nanofiltration, dilution of sulfate containing injection water, etc.) or microbial substrates leading to H2S generation (VFAs and nutrients) with various methods are cited as proactive measures [34]. Besides, biocides and/or nitrate/nitrite/molybdate are proposed as mitigation agents, as well as chemical scavengers as remediation measures on the producing side.
According to our laboratory and field experiences, the assessment of biogenic souring and its mitigation can be done in three sequential but interdependent steps:
7.1. Step 1: Preliminary Assessment
The first step is the definition of the risk in terms of its impact on various stages of the oil production. In this step, the probability of the risk, its potential level in various stages of operations, its impacts on schedule, project economics and scope are defined based on preliminary data and methods. For example, applying the collected data to the stoichiometry given in Eq. (1), can provide a good initial estimate of the probability and extent of reservoir souring. HSE issues should be evaluated at this first step, and if these issues prove difficult to resolve, the future of the project can be reevaluated.
7.2. Step 2: Modelling and Quantification
In the second step, the quantification and spatial and temporal distribution of souring can be assessed using reservoir models supported by experimental and field data. As discussed in previous chapters, reservoir models calibrated with field data are used to describe the geology and hydrodynamics first. Modelling H2S generation, its partitioning and transport in the subsurface complete the souring reservoir model, which then helps to predict the H2S concentration in the production as function of time. To improve the reliability of the calculations, this part of the study should be supported by laboratory experiments and field measurements (Table 4) where applicable. The calibrated reservoir and experimentally validated H2S models coupled to each other are the prerequisites for realistic predictions. However, the remaining uncertainties caused by geological and petrophysical as well as other parameters controlling biogenic souring can impact the prediction quality. In this case, it is proposed to perform the predictions using statistical approaches. As discussed in previous chapters, retention of H2S, concentration and reactions of sulfate with components of formation water as well as partitioning of H2S into in situ phases may be appropriate parameters whose values should be considered in the context of probability distributions when supported by theoretical and experimental analyses. Modern reservoir simulators include such options like the Monte Carlo method to introduce the uncertainties and estimate the target parameters; at the end of this assessment, H2S production can be estimated as function of time and location within given probability ranges from low - high to mean (P10, P90 and P50) values. The identification of biogenic souring mitigation measures, if needed and doable with available tools and data, should also be included in this step. The impact of using various chemicals and biocides on the reservoir performance can also be assessed with the validated reservoir souring model based on experimental data. The spatial distribution of the chemicals to be injected can be predicted as function of time therefore giving a possibility to define and fine tune the injection strategies considering full field scale.
7.3. Step 3: Monitoring
Monitoring of the biogenic souring and the response of its mitigation should be part of the workflow. Field measurements of various parameters such as concentrations of H2S, sulfate and mitigation chemicals can be used to assess the success of mitigation measures and to re-evaluate the models used. The models can then be recalibrated based on the data, and re-used for updating the mitigation operations and their success. In other words, the measurements are used to reduce the uncertainties in each step of modelling thereby increasing the quality of the predictions and mitigation measures.
The workflow is shown in Table 8. The experimental work provides data for the numerical modeling, and each improvement of the experimental data leads to an improvement of the numerical predictions by reducing the uncertainties of the input parameters. The workflow thus results from the interaction of all steps as a kind of continuous improvement cycle.
8. Conclusions
Biogenic souring is a common risk in secondary (waterflooding) and tertiary oil production (EOR) operations. Both the reservoir and the production and injection history vary from case to case, so there are no one-size-fits-all solutions. However, many years of expertise and the experience of related industries can help increase the reliability of biogenic souring assessment and management. With this in mind, we evaluated recent and relevant studies on biogenic souring and combined the results with our practical expertise from a pragmatic reservoir engineering perspective to support evaluation and decision quality on the topic. The conclusions can be summarized as follows:
- -
- Technological developments in microbiology and petroleum industry simulation tools and techniques provide a sufficiently good analytical background. State-of-the-art numerical tools can support the prediction of H2S formation and its spatial and temporal distribution in the reservoir, as well as its production characteristics in terms of safety in surface facilities. However, as with all numerical simulation studies, the predictive capability depends heavily on the reliability and representativeness of the model created. The process of calibrating the model requires high-quality, reliable data from theoretical work, chemical-physical modelling and field measurements.
- -
- H2S retention in the reservoir can be significant if reservoir rock contains iron-bearing minerals like siderite; as shown for a MEOR case analysis even a minor siderite content can inhibit the H2S generation totally. The assessment of the mineral scavenging needs representative static (batch) and dynamic (sand packs, core floods) laboratory investigations. The composition of reservoir brine as well as H2S partitioning into water and oil phases can also play a significant role in the retention of H2S in the reservoir, thus decreasing topside-associated risks.
- -
- Considering the uncertainties in the associated inputs as well as in the geological unknowns, the use of the Monte Carlo method is suggested for the numerical evaluation, where the uncertainties of each associated parameter can be considered to define the H2S production in terms of a probability distribution. Due to high uncertainty, mineral scavenging is a natural candidate for this analysis, followed by sulfate content of injection and formation waters, partitioning and petrophysical parameters. State-of-the-art commercial reservoir simulators provide user friendly interactive codes for such analysis.
- -
- Nitrate and nitrite are the best-known and best-studied chemicals for biogenic souring inhibition, although their reported effectiveness in field applications is controversial. Molybdate and perchlorate are the emerging candidates for SRB inhibition, but further investigation is needed for safe and economical applications.
- -
- A workflow for assessing and managing biogenic souring in oil reservoirs during secondary and tertiary oil recovery is presented. The best strategy to control reservoir souring is to manage the issue proactively and as early as possible, ideally before any souring is detected; a quick analytical analysis based on relevant parameters can give a reliable preliminary insight on the probability and magnitude of the reservoir souring. If the risk is evident, the workflow should be followed to assess, predict, and mitigate the souring through case-specific surface and subsurface actions. The workflow provides a continuous cyclic process to improve the quality of the assessment and decision based on new laboratory and field data in each cycle.
Abbreviations, Symbols
| ATP | Adenosine triphosphate |
| avr | Average |
| BAC | Benzalkonium chloride |
| BTEX | Benzene, toluene, ethylbenzene, and xylene (light aromatics) |
| DOC | Dissolved organic carbon |
| DP | Dykstra–Parsons coefficient |
| FW | Formation water |
| HSE | Health, safety, and environment |
| k | Permeability, mD |
| Kow,og,wg | Partitioning coefficient (of H2S), oil-water, oil-gas, water-gas, fraction |
| KS | Monod equation; half rate constant representing at which the rate is rmax/2 , g/L |
| m | Milli |
| M | Molar |
| MEOR | Microbial enhanced oil recovery |
| MIC | Microbially induced corrosion |
| MICP | Microbial induced calcite precipitation |
| MPN | Most probable number |
| NRB | Nitrate reducing bacteria |
| P | Pressure, bar |
| P10 | Monte-Carlo simulation, low probability case |
| P50 | Monte-Carlo simulation, mean probability case |
| P90 | Monte-Carlo simulation, high probability case |
| ppmv | Part per million in gas (vapor) phase |
| ppmw | Part per million in water phase |
| PV | Pore volume, m3 |
| PWRI | Produced water re-injection |
| qFISH | Quantitative Fluorescent In Situ Hybridization |
| qPCR | Quantitative Polymerase Chain Reaction |
| rg | Monod equation; specific growth rate, hour-1 |
| RINC | Required inhibitory nitrate concentration; mM |
| rmax | Monod equation; maximum growth rate, hour-1 |
| RT-qPCR | Reverse transcription qPCR |
| S | Monod equation; (limiting) substrate concentration, g/L |
| SCI | Sulfur cycle intermediates |
| SRA | Sulfate reducing archaea |
| SRB | Sulfate reducing bacteria |
| SRM | Sulfate reducing microorganism |
| T | Temperature, °C |
| TDS | Total dissolved solids, g/L |
| TVS | Thermal viability shell |
| VFA | Volatile fatty acids |
| wt. | Weight |
Author Contributions
Conceptualization, Hakan Alkan and Felix Kögler; methodology, Hakan Alkan, Felix Kögler and Gyunay Namazova; validation, Hakan Alkan., Felix Kögler and Gyunay Namazova; formal analysis, Stephan Hatscher and Wolfgang Jelinek; investigation, Hakan Alkan, Felix Kögler, Gyunay Namazova, Stephan Hatscher and Wolfgang Jelinek; resources, Hakan Alkan, Mohd Amro, Wolfgang Jelinek; writing—original draft preparation, Hakan Alkan and Felix Kögler; writing—review and editing, Hakan Alkan, Stephan Hatscher and Mohd Amro; project administration, Hakan Alkan and Mohd Amro; funding acquisition, Hakan Alkan. All authors have read and agreed to the published version of the manuscript.
Funding
This research was carried out as part of the ‘MEOR Studies’ project funded by Wintershall Dea AG.
Acknowledgments
This paper was written based on the expertise and experience gained in the project “MEOR Studies” and other projects initiated and conducted by Wintershall Dea AG. We would like to thank all parties involved for their support and cooperation for the past years until now.
Conflicts of Interest
The authors declare no conflict of interest.
References
- Gaspar J., Carlos D. D., Pedro C., Alvarez J. J. Biogenic versus Thermogenic H2S Source Determination in Bakken Wells: Considerations for Biocide Application Environ. Sci. Technol. Lett. 2016, 3, 4, 127–132 March 28. [CrossRef]
- WHO Hydrogen Sulfide. WHO Regional Publications, European Series: 2000, Denmark, pp 1–7.
- Anchliya A. New Nitrate-Based Treatments—A novel approach to control hydrogen sulfide in reservoir and to increase oil recovery. All Days. Published online June 12, 2006. [CrossRef]
- Carlson HK, Stoeva MK, Justice NB, et al. Monofluorophosphate is a selective inhibitor of respiratory Sulfate-Reducing microorganisms. Environmental Science & Technology. 2015;49(6):3727-3736. [CrossRef]
- Bastin ES, Greer FE, Merritt CA, Moulton GF. The presence of sulphate reducing bacteria in oil field waters. Science. 1926;63(1618):21-24. [CrossRef]
- Bass, C. ZoBell’s contribution to petroleum microbiology, in: Proceedings of the 8th International Symposium on Microbial Ecology. Microbial Biosystems: New Frontiers. 1999, Halifax, Canada.
- Almeida P. F., Almeida R.C.C., Edgard B. Carvalho, Elias R. Souza, Alexandra S. Carvalho, Carlos H. T. P. Silva and Carlton A. Taft. Overview of sulfate-reducing bacteria and strategies to control biosulfide generation in oil waters. Modern Biotechnology in Medicinal Chemistry and Industry, 2006. ISBN: 81-308-0132-9.
- Hubert C. Microbial Ecology of Oil Reservoir Souring and its Control by Nitrate Injection. In: Springer eBooks. ; 2010:2753-2766. [CrossRef]
- Xue Y, Voordouw G, Gieg LM. Laboratory protocols for investigating microbial souring and potential treatments in crude oil reservoirs. In: Springer Protocols Handbooks/Springer Protocols. ; 2015:183-210. [CrossRef]
- Skovhus T. L., Whitby C. Oilfield Microbiology ISBN 9781138057753 Published 2019, April 30, CRC Press.
- Hagar HS, Foroozesh J, Kumar S, Zivar D, Banan N, Dzulkarnain I. Microbial H2S generation in hydrocarbon reservoirs: Analysis of mechanisms and recent remediation technologies. Journal of Natural Gas Science and Engineering. 2022;106:104729. [CrossRef]
- Burger ED, Jenneman GE, Bache Ø, Jensen TB, Soerensen SN. A mechanistic model to evaluate reservoir souring in the ekofisk field. All Days. Published online February 2, 2005. [CrossRef]
- Jurelevicius D, Von Der Weid I, Korenblum E, Valoni E, De Oliveira Penna M, Seldin L. Effect of nitrate injection on the bacterial community in a water-oil tank system analyzed by PCR-DGGE. Journal of Industrial Microbiology and Biotechnology/Journal of Industrial Microbiology & Biotechnology. 2008;35(4):251-255. [CrossRef]
- Arensdorf JJ, Miner K, Ertmoed R, Clay WK, Stadnicki P, Voordouw G. Mitigation of reservoir souring by nitrate in a Produced Water Re-Injection System in Alberta. All Days. Published online April 20, 2009. [CrossRef]
- Skjevrak I, Standnes DC, Thomsen US, et al. Field observations of reservoir souring development and implications for the Extended Growth Zone (EGZ) souring model. Journal of Petroleum Science & Engineering. 2021;204:108721. [CrossRef]
- Rahman HA, Sedaralit MF, Zainal S, De Rezende JR. Modelling reservoir souring mitigation strategy based on dynamic microorganisms interactions. Day 2 Tue, November 01, 2022. Published online October 31, 2022. [CrossRef]
- Hitzman DO, Sperl GT. A new microbial technology for enhanced oil recovery and sulfide prevention and reduction. All Days. Published online April 17, 1994. [CrossRef]
- Johnson RJ, Folwell BD, Wirekoh A, Frenzel M, Skovhus TL. Reservoir Souring – Latest developments for application and mitigation. Journal of Biotechnology. 2017;256:57-67. [CrossRef]
- Prajapat G, Rellegadla S, Jain S, Agrawal A. Reservoir souring control using benzalkonium chloride and nitrate in bioreactors simulating oil fields of western India. International Biodeterioration & Biodegradation. 2018;132:30-39. [CrossRef]
- Veshareh MJ, Nick HM. A sulfur and nitrogen cycle informed model to simulate nitrate treatment of reservoir souring. Scientific Reports. 2019;9(1). [CrossRef]
- Myhr S, Lillebø BL, Sunde E, Beeder J, Torsvik T. Inhibition of microbial H2S production in an oil reservoir model column by nitrate injection. Appl Microbiol Biotechnol. 2002. Mar;58(3):400-8. [CrossRef]
- Kuijvenhoven C, Noirot JC, Hubbard P, Oduola L. One year experience with the injection of nitrate to control souring in Bonga Deepwater Development Offshore Nigeria. All Days. Published online February 28, 2007. [CrossRef]
- Veshareh MJ, Nick HM. Learnings from Reservoir Souring Treatment by Nitrate Injection in the Halfdan Oil Field. Proceedings. Published online June 11, 2018. [CrossRef]
- Voordouw G, Hubert CRJ, Nemati M, Jenneman GE. Is souring and corrosion by Sulfate-Reducing bacteria in oil fields reduced more efficiently by nitrate or by nitrite? Corrosion. Published online January 1, 2004. https://onepetro.org/NACECORR/proceedings/CORR04/All-CORR04/NACE-04762/115094.
- Vik EA, Janbu AO, Garshol FK, et al. Nitrate-Based Souring Mitigation of Produced Water—Side Effects and Challenges from the Draugen Produced-Water ReInjection Pilot. All Days. Published online February 28, 2007. [CrossRef]
- Immanuel OM, Abu GO, Stanley HO. Mitigation of biogenic sulphide production by sulphate reducing bacteria in petroleum reservoir souring. All Days. Published online August 4, 2015. [CrossRef]
- Kögler F, Hartmann FSF, Schulze-Makuch D, Herold A, Alkan H, Dopffel N. Inhibition of microbial souring with molybdate and its application under reservoir conditions. International Biodeterioration & Biodegradation. 2021;157:105158. [CrossRef]
- Qu, M., Liang, T., Hou, J., Wu, W., Wen, Y., and Lixiao X.Ultralow Concentration of Amphiphilic Molybdenum Disulfide Nanosheets for Enhanced Oil Recovery-Research and Field Application. 2021.Paper presented at the SPE Annual Technical Conference and Exhibition, Dubai, UAE, September. [CrossRef]
- Tang K, Baskaran V, Nemati M. Bacteria of the sulphur cycle: An overview of microbiology, biokinetics and their role in petroleum and mining industries. Biochemical Engineering Journal. 2009;44(1):73-94. [CrossRef]
- Basafa M, Hawboldt K. Reservoir souring: sulfur chemistry in offshore oil and gas reservoir fluids. Journal of Petroleum Exploration and Production Technology. 2018;9(2):1105-1118. [CrossRef]
- Jørgensen BB, Findlay A, Pellerin A. The biogeochemical sulfur cycle of marine sediments. Frontiers in Microbiology. 2019;10. [CrossRef]
- Agrawal A., Effect of Temperature on Souring in the Low and High Temperature Oil Fields, 16th Reservoir Microbiology Forum, Nov 30., London.
- Larsen, J., Skovhus, T.L., Saunders, A. M., Højris, B., and Mikkel A. Molecular Identification Of Mic Bacteria From Scale And Produced Water: Similarities And Differences. Paper presented at the CORROSION 2008, New Orleans, Louisiana, March.
- Gieg LM, Jack T, Foght JM. Biological souring and mitigation in oil reservoirs. Applied Microbiology and Biotechnology. 2011;92(2):263-282. [CrossRef]
- Monod, J. The growth of bacterial cultures. Annual Review of Microbiology. 1949. 3: 371-394. [CrossRef]
- Button DK. Kinetics of nutrient-limited transport and microbial growth. Microbiological Reviews. 1985;49(3):270-297. [CrossRef]
- Han K, Levenspiel O. Extended monod kinetics for substrate, product, and cell inhibition. Biotechnology and Bioengineering. 1988;32(4):430-447. [CrossRef]
- Merchuk JC, Asenjo JA. The Monod equation and mass transfer. Biotechnology and Bioengineering. 1995;45(1):91-94. [CrossRef]
- Eden B., Laycock, P.J., Fielder M. OTH 92385, Oilfield reservoir Souring, 1993, HSE BOOKS.
- Vale TOD, De Magalhães RS, De Almeida PF, Matos JBTL, Chinalia FA. The impact of alkyl polyglycoside surfactant on oil yields and its potential effect on the biogenic souring during enhanced oil recovery (EOR). Fuel. 2020;280:118512. [CrossRef]
- Burger ED, Jenneman GE, Gao XC. The impact of dissolved Organic-Carbon type on the extent of reservoir souring. All Days. Published online April 8, 2013. [CrossRef]
- Prausnitz JM, Lichtenthaler RN, De Azevedo EG. Molecular Thermodynamics of Fluid-Phase Equilibria.; 1969. http://ci.nii.ac.jp/ncid/BA00240358.
- Duan Z, Sun R, Liu R, Zhu C. Accurate thermodynamic model for the calculation of H2S solubility in pure water and brines. Energy & Fuels. 2007;21(4):2056-2065. [CrossRef]
- Feng, G.-X and Mather, A.E. Solubility of H2S in n-dodecane. Fluid Phase Equilibria, , 1993, 87: 341-346.
- Calsep. https://www.calsep.com/pvtsim-nova 2021.
- Zirrahi M, Azin R, Hassanzadeh H, Moshfeghian M. Mutual solubility of CH4, CO2, H2S, and their mixtures in brine under subsurface disposal conditions. Fluid Phase Equilibria. 2012;324:80-93. [CrossRef]
- Graham A, Singleton M, Salleh IK, Khairuddin K, Ibrahim J, Sorbie KS. Experimental investigation of hydrogen sulfide scavenging capacities and mechanisms in iron-bearing minerals. Proceedings. Published online September 18, 2018. [CrossRef]
- Sunde E, Thorstenson T, Torsvik T, Vaag JE, Espedal MS. Field-Related Mathematical Model to predict and reduce reservoir souring. All Days. Published online March 2, 1993. [CrossRef]
- Alkindi A, Prince-Wright R, Moore WR, Walsh J, Morgenthaler LN, Kuijvenhoven C. Challenges for waterflooding in a deepwater environment. SPE Production & Operations. 2008;23(03):404-410. [CrossRef]
- Gruesbeck C, Collins RE. Entrainment and deposition of fine particles in porous media. Society of Petroleum Engineers Journal. 1982;22(06):847-856. [CrossRef]
- Davis J, Updegraff DM. MICROBIOLOGY IN THE PETROLEUM INDUSTRY. Bacteriological Reviews. 1954;18(4):215-238. [CrossRef]
- Tufenkji N. Modeling microbial transport in porous media: Traditional approaches and recent developments. Advances in Water Resources. 2007;30(6-7):1455-1469. [CrossRef]
- Jensen JL, Currie ID. A new method for estimating the Dykstra-Parsons coefficient to characterize reservoir heterogeneity. SPE Reservoir Engineering. 1990;5(03):369-374. [CrossRef]
- Ligthelm DJ, De Boer RB, Brint JF, Schulte WM. Reservoir souring: an analytical model for H2S generation and transportation in an oil reservoir owing to bacterial activity. All Days. Published online September 3, 1991. [CrossRef]
- Maxwell S, Spark ISC. Souring of reservoirs by bacterial activity during seawater waterflooding. All Days. Published online February 2, 2005. [CrossRef]
- Mitchell, A. F., Skjevrak, I., and Jone W. A Re-Evaluation of Reservoir Souring Patterns and Effect of Mitigation in a Mature North Sea Field. Paper presented at the SPE International Conference on Oilfield Chemistry, Montgomery, Texas, USA, April 2017. [CrossRef]
- De Blanc PC, McKinney DC, Speitel GE. Chapter 1 Modeling subsurface biodegradation of non-aqueous phase liquids. In: Advances in Porous Media. ; 1996:1-86. [CrossRef]
- Hosseininoosheri, P., Lashgari, H., and Sepehrnoori K. Numerical Prediction of Reservoir Souring under the Effect of Temperature, Ph, and Salinity on the Kinetics of Sulfate-Reducing Bacteria. Paper presented at the SPE International Conference on Oilfield Chemistry, 2017, Montgomery, Texas, USA, April. [CrossRef]
- Cheng Y, Hubbard CG, Zheng L, et al. Next generation modeling of microbial souring – Parameterization through genomic information. International Biodeterioration & Biodegradation. 2018;126:189-203. [CrossRef]
- Al-Refai, S. R., Al-Ajmi, M. , Oduola, L., and Carlos C.M. Souring Prediction on Mature Waterflooded Reservoirs in North Kuwait, Paper presented at the SPE Europec featured at 81st EAGE Conference and Exhibition, London, England, UK, 2019, June. [CrossRef]
- PETEX. 2021. https://www.petex.com/products/ipm-suite/reveal/.
- Snippe, J., and Lingli W. An Efficient and Internally Consistent Reactive Transport Modelling Scheme for Sour Gas Injection Simulations. Paper presented at the Abu Dhabi International Petroleum Exhibition and Conference, Abu Dhabi, UAE, November 2014. [CrossRef]
- Li H, Zhang L, Liu L, Shabani A. Impact of rock mineralogy on reservoir souring: A geochemical modeling study. Chemical Geology. 2020;555:119811. [CrossRef]
- Kathrada, M. Combining Sparse Data with Reaction Kinetics Using Fuzzy Logic to Predict Reservoir Souring. Paper presented at the International Petroleum Technology Conference, Virtual, March 2021. [CrossRef]
- Coombe D, Hubert C, Voordou G. Mechanistic modelling of H2S souring treatments by application of nitrate or nitrite. Canadian International Petroleum Conference. Published online January 1, 2004. [CrossRef]
- Coombe D, Jack T, Voordouw G, Zhang F, Clay B, Miner K. Simulation of bacterial souring control in an Alberta Heavy-Oil reservoir. Journal of Canadian Petroleum Technology/Journal of Canadian Petroleum Technology. 2010;49(05):19-26. [CrossRef]
- Alkan, H., Mukherjee, S., Kögler, F.(2022). Microbial Enhanced Oil Recovery in book Recovery Improvement, Edition: 1st. Chapter: 8 Publisher: Gulf Professional Publishing. [CrossRef]
- Siqueira A, Araujo CHV, Reksidler R, De Castro Pereira M. Uncertainty analysis applied to biogenic reservoir souring simulation. All Days. Published online June 8, 2009. [CrossRef]
- Delshad M, Bryant SL, Sepehrnoori K, Farhadinia MA. Development of a reservoir simulator for souring predictions. All Days. Published online February 2, 2009. [CrossRef]
- Skjælaaen I, Ebigbo A, Espedal MS, Helmig R. A model for transport of hydrogen sulfide in oil- and water-saturated porous media. Computing and Visualization in Science. 2010;13(6):265-273. [CrossRef]
- Farhadinia MA, Bryant SL, Sepehrnoori K, Delshad M. Application of a 3D Reservoir Simulator with Biodegradation Capability to Evaluate Reservoir Souring Predictive Models. Petroleum Science and Technology. 2010;28(4):382-392. [CrossRef]
- Haghshenas M, Sepehrnoori K, Bryant SL, Farhadinia MA. Modeling and simulation of nitrate injection for reservoir souring remediation. SPE Journal. 2012;17(03):817-827. [CrossRef]
- Evans, P. Reservoir Souring Modelling, Prediction and Mitigation. Proceedings of the ASME 2008 27th International Conference on Offshore Mechanics and Arctic Engineering. 2009. Volume 5: Materials Technology; CFD and VIV. Estoril, Portugal. June 15–20, pp. 67-73. ASME. [CrossRef]
- Evans, P., Ambruss J., Maliska C.R., Kabche, J.P. Simulation of Reservoir Souring Considering Multiple Carbon Sources and Environmental Aspects, 4th International Symposium on Applied Microbiology and Molecular Biology in Oil Systems, 2013. [CrossRef]
- Sugai Y, Owaki Y, Sasaki K, Kaneko F, Sakai T. Numerical prediction of reservoir souring based on the growth kinetics of sulfate-reducing bacteria indigenous to an oilfield. All Days. Published online May 12, 2014. [CrossRef]
- Cheng, Y.,Hubbard, C., Li, L., Bouskill, N. Molins, S., Zheng, L., Sonnenthal, E., Conrad, M., Engelbrektson, A., Coates, J., Ajo-Franklin, J. (2016). A Reactive Transport Model of Sulfur Cycling as Impacted by Perchlorate and Nitrate Treatments. Environmental Science & Technology. [CrossRef]
- Chaban, F., Garduno, J., Osorio, N., and Lee J. Multi-Domain Integrated Workflow for Reservoir Souring Modeling and Prediction to Effectively Define and Mitigate H2S Production Risk in Offshore Developments Undertaking Waterflooding. Paper presented at the SPE Annual Technical Conference and Exhibition, Virtual, October 2020. [CrossRef]
- Kane RD, Surinach PP. A field study of microbiological growth and reservoir souring. Corrosion. Published online March 9, 1997. https://onepetro.org/NACECORR/proceedings/CORR97/All-CORR97/NACE-97208/113386.
- Hubert C, Voordouw G. Oil Field Souring Control by Nitrate-Reducing Sulfurospirillum spp. That Outcompete Sulfate-Reducing Bacteria for Organic Electron Donors. Applied and Environmental Microbiology. 2007;73(8):2644-2652. [CrossRef]
- Paulsen IT, Brown MH, Skurray RA. Proton-dependent multidrug efflux systems. Microbiological Reviews. 1996;60(4):575-608. [CrossRef]
- Da Silva MLB, Soares HM, Fúrigo A, Schmidell W, Corseuil HX. Effects of nitrate injection on microbial enhanced oil recovery and oilfield reservoir souring. Applied Biochemistry and Biotechnology. 2014;174(5):1810-1821. [CrossRef]
- Ferreira J a. S, De Almeida PF, Santos JND, et al. Bioreactor for accurately assessing biocide effectiveness in controlling biogenic souring in mature oil wells. SPE Journal. 2018;23(05):1809-1816. [CrossRef]
- Hubbard CG, Cheng Y, Engelbrekston A, et al. Isotopic insights into microbial sulfur cycling in oil reservoirs. Frontiers in Microbiology. 2014;5. [CrossRef]
- Cannon S. Petrophysics: A Practical Guide.; 2015. https://openlibrary.org/books/OL27518758M/Petrophysics.
- Tiab D, Donaldson EC. Petrophysics: Theory and practice of measuring reservoir rock and fluid transport properties.; 1996. http://ci.nii.ac.jp/ncid/BB01127722?l=en.
- Ma Y.Z. Petrophysical Data Analytics for Reservoir Characterization. In: Quantitative Geosciences: Data Analytics, Geostatistics, Reservoir Characterization and Modeling. Springer, Cham. 2019. [CrossRef]
- Gunaltun Y, De Reus H, Nyborg R. The reliability of laboratory and field parameters used in the prediction models. Corrosion. Published online January 1, 2003. https://onepetro.org/NACECORR/proceedings/CORR03/All-CORR03/NACE-03622/114464.
- Cavallaro AN, Martinez M, Ostera HA, Panarello HO, Cordero R. Oilfield Reservoir Souring During Waterflooding: A Case Study with Low Sulphate Concentration in Formation and Injection Waters. All Days. Published online February 2, 2005. [CrossRef]
- CMG Computer Modelling Group Ltd. (2021) Reservoir Simulation Software (cmgl.ca).
- Alkan, H., Namazova, G., Hatscher, S. et al.(2018). Modelling approaches to assess biogenic souring during waterflooding and EOR operations, Proceedings of First EAGE/IFPEN Conference on Sulfur Risk Management in Exploration and Production, 18-20 September, Rueil-Malmaison, France, Proceedings. [CrossRef]
- Alkan, H., Klueglein, N., Mahler, E., et al.An integrated German MEOR project update: Risk management and Huff’n Puff design. 2016. This study SPE-179580-MS, SPE Improved Oil Recovery Conference, 11-13 April, Tulsa, Oklahoma, USA, . [CrossRef]
- Bülltemeier, H., Alkan, H., and Moh’d A. A New Modeling Approach to MEOR calibrated by Bacterial Growth and Metabolite Curves. Paper presented at the SPE EOR Conference at Oil and Gas West Asia, Muscat, Oman, March 2014. [CrossRef]
- Jenneman GE, McInerney MJ, Knapp RM. Effect of nitrate on biogenic sulfide production. Applied and Environmental Microbiology. 1986;51(6):1205-1211. [CrossRef]
- Reinsel MA, Sears J, Stewart PS, McInerney MJ. Control of microbial souring by nitrate, nitrite or glutaraldehyde injection in a sandstone column. Journal of Industrial Microbiology. 1996;17(2):128-136. [CrossRef]
- Jenneman GE, Moffitt PD, Bala GA, Webb RH. Sulfide removal in reservoir brine by indigenous bacteria. SPE Production & Facilities. 1999;14(03):219-225. [CrossRef]
- Mahmoodi A, Kiapi MRA, Nick HM. When nitrate treatment wins the battle against microbial reservoir souring but loses the war. Ecological Modelling. 2023;481:110329. [CrossRef]
- Yin B, Wunch K. Combined effects of microbes and nitrate on SRB growth, souring and corrosion. Corrosion. Published online March 26, 2017. https://onepetro.org/NACECORR/proceedings/CORR17/All-CORR17/NACE-2017-9425/125625.
- Dopffel N, Kögler F, Hartmann H, et al. Microbial induced mineral precipitations caused by nitrate treatment for souring control during microbial enhanced oil recovery (MEOR). International Biodeterioration & Biodegradation. 2018;135:71-79. [CrossRef]
- Martin RL. Corrosion Consequences of Nitrate/Nitrite additions to oilfield brines. All Days. Published online September 21, 2008. [CrossRef]
- Peck HD. The Role of Adenosine-5′-phosphosulfate in the Reduction of Sulfate to Sulfite by Desulfovibrio desulfuricans. Journal of Biological Chemistry/the Journal of Biological Chemistry. 1962;237(1):198-203. [CrossRef]
- Tenti, P., Roman, S., Storelli, N. Molybdate to Prevent the Formation of Sulfide during the Process of Biogas Production. , 2019. [CrossRef]
- Wilson LG, Bandurski RS. An enzymatic reaction involving adenosine triphosphate and selenate. Archives of Biochemistry and Biophysics. 1956;62(2):503-506. [CrossRef]
- Engelbrektson A, Hubbard CG, Tom LM, et al. Inhibition of microbial sulfate reduction in a flow-through column system by (per)chlorate treatment. Frontiers in Microbiology. 2014;5. [CrossRef]
- Veshareh MJ, Kjeldsen KU, Findlay A, Nick HM, Røy H, Marietou A. Nitrite is a more efficient inhibitor of microbial sulfate reduction in oil reservoirs compared to nitrate and perchlorate: A laboratory and field-scale simulation study. International Biodeterioration & Biodegradation. 2021;157:105154. [CrossRef]
- Klueglein, N.. , Mahler, E.. , Sonwa, R.. , Herold, A.. , Hatscher, S.. , and Alkan H.Testing of H2S Inhibitors for Application in a MEOR Field Pilot in Germany. Paper presented at the SPE International Oilfield Corrosion Conference and Exhibition, Aberdeen, Scotland, UK, May 2016. [CrossRef]
- Greene EA, Brunelle V, Jenneman GE, Voordouw G. Synergistic inhibition of microbial sulfide production by combinations of the metabolic inhibitor nitrite and biocides. Applied and Environmental Microbiology. 2006;72(12):7897-7901. [CrossRef]
- Voordouw G, Grigoryan AA, Lambo AJ, et al. Sulfide Remediation by Pulsed Injection of Nitrate into a Low Temperature Canadian Heavy Oil Reservoir. Environmental Science & Technology. 2009;43(24):9512-9518. [CrossRef]
- Veshareh MJ, Kjeldsen KU, Findlay A, Nick HM, Røy H, Marietou A. Nitrite is a more efficient inhibitor of microbial sulfate reduction in oil reservoirs compared to nitrate and perchlorate: A laboratory and field-scale simulation study. International Biodeterioration & Biodegradation. 2021;157:105154. [CrossRef]
- Engelbrektson A, Hubbard CG, Tom LM, et al. Inhibition of microbial sulfate reduction in a flow-through column system by (per)chlorate treatment. Frontiers in Microbiology. 2014;5. [CrossRef]
- Wu Y, Cheng Y, Hubbard CG, Hubbard SS, Ajo-Franklin J. Biogenic sulfide control by nitrate and (per)chlorate – A monitoring and modeling investigation. Chemical Geology. 2018;476:180-190. [CrossRef]
- Maxwell S, Mackenzie G, Kuijvenhoven C, Lomans BP, Granli T. Laboratory studies of microbicide and nitrate strategies for mic and reservoir souring mitigation. Corrosion. Published online January 1, 2008. https://onepetro.org/NACECORR/proceedings/CORR08/All-CORR08/NACE-08663/119128.
- Kalpakci B, Magri NF, Ravenscroft P, McTeir MDK, Arf GT. Mitigation of Reservoir Souring—Decision Process. All Days. Published online February 14, 1995. [CrossRef]
Figure 1.
Schematic of the various states of sulfur due to biogenic reactions in the presence of sulfate-reducing microorganisms (SRMs). SCI: Sulfur cycle intermediates. Red arrows: Most relevant pathways in biogenic reservoir souring.
Figure 1.
Schematic of the various states of sulfur due to biogenic reactions in the presence of sulfate-reducing microorganisms (SRMs). SCI: Sulfur cycle intermediates. Red arrows: Most relevant pathways in biogenic reservoir souring.
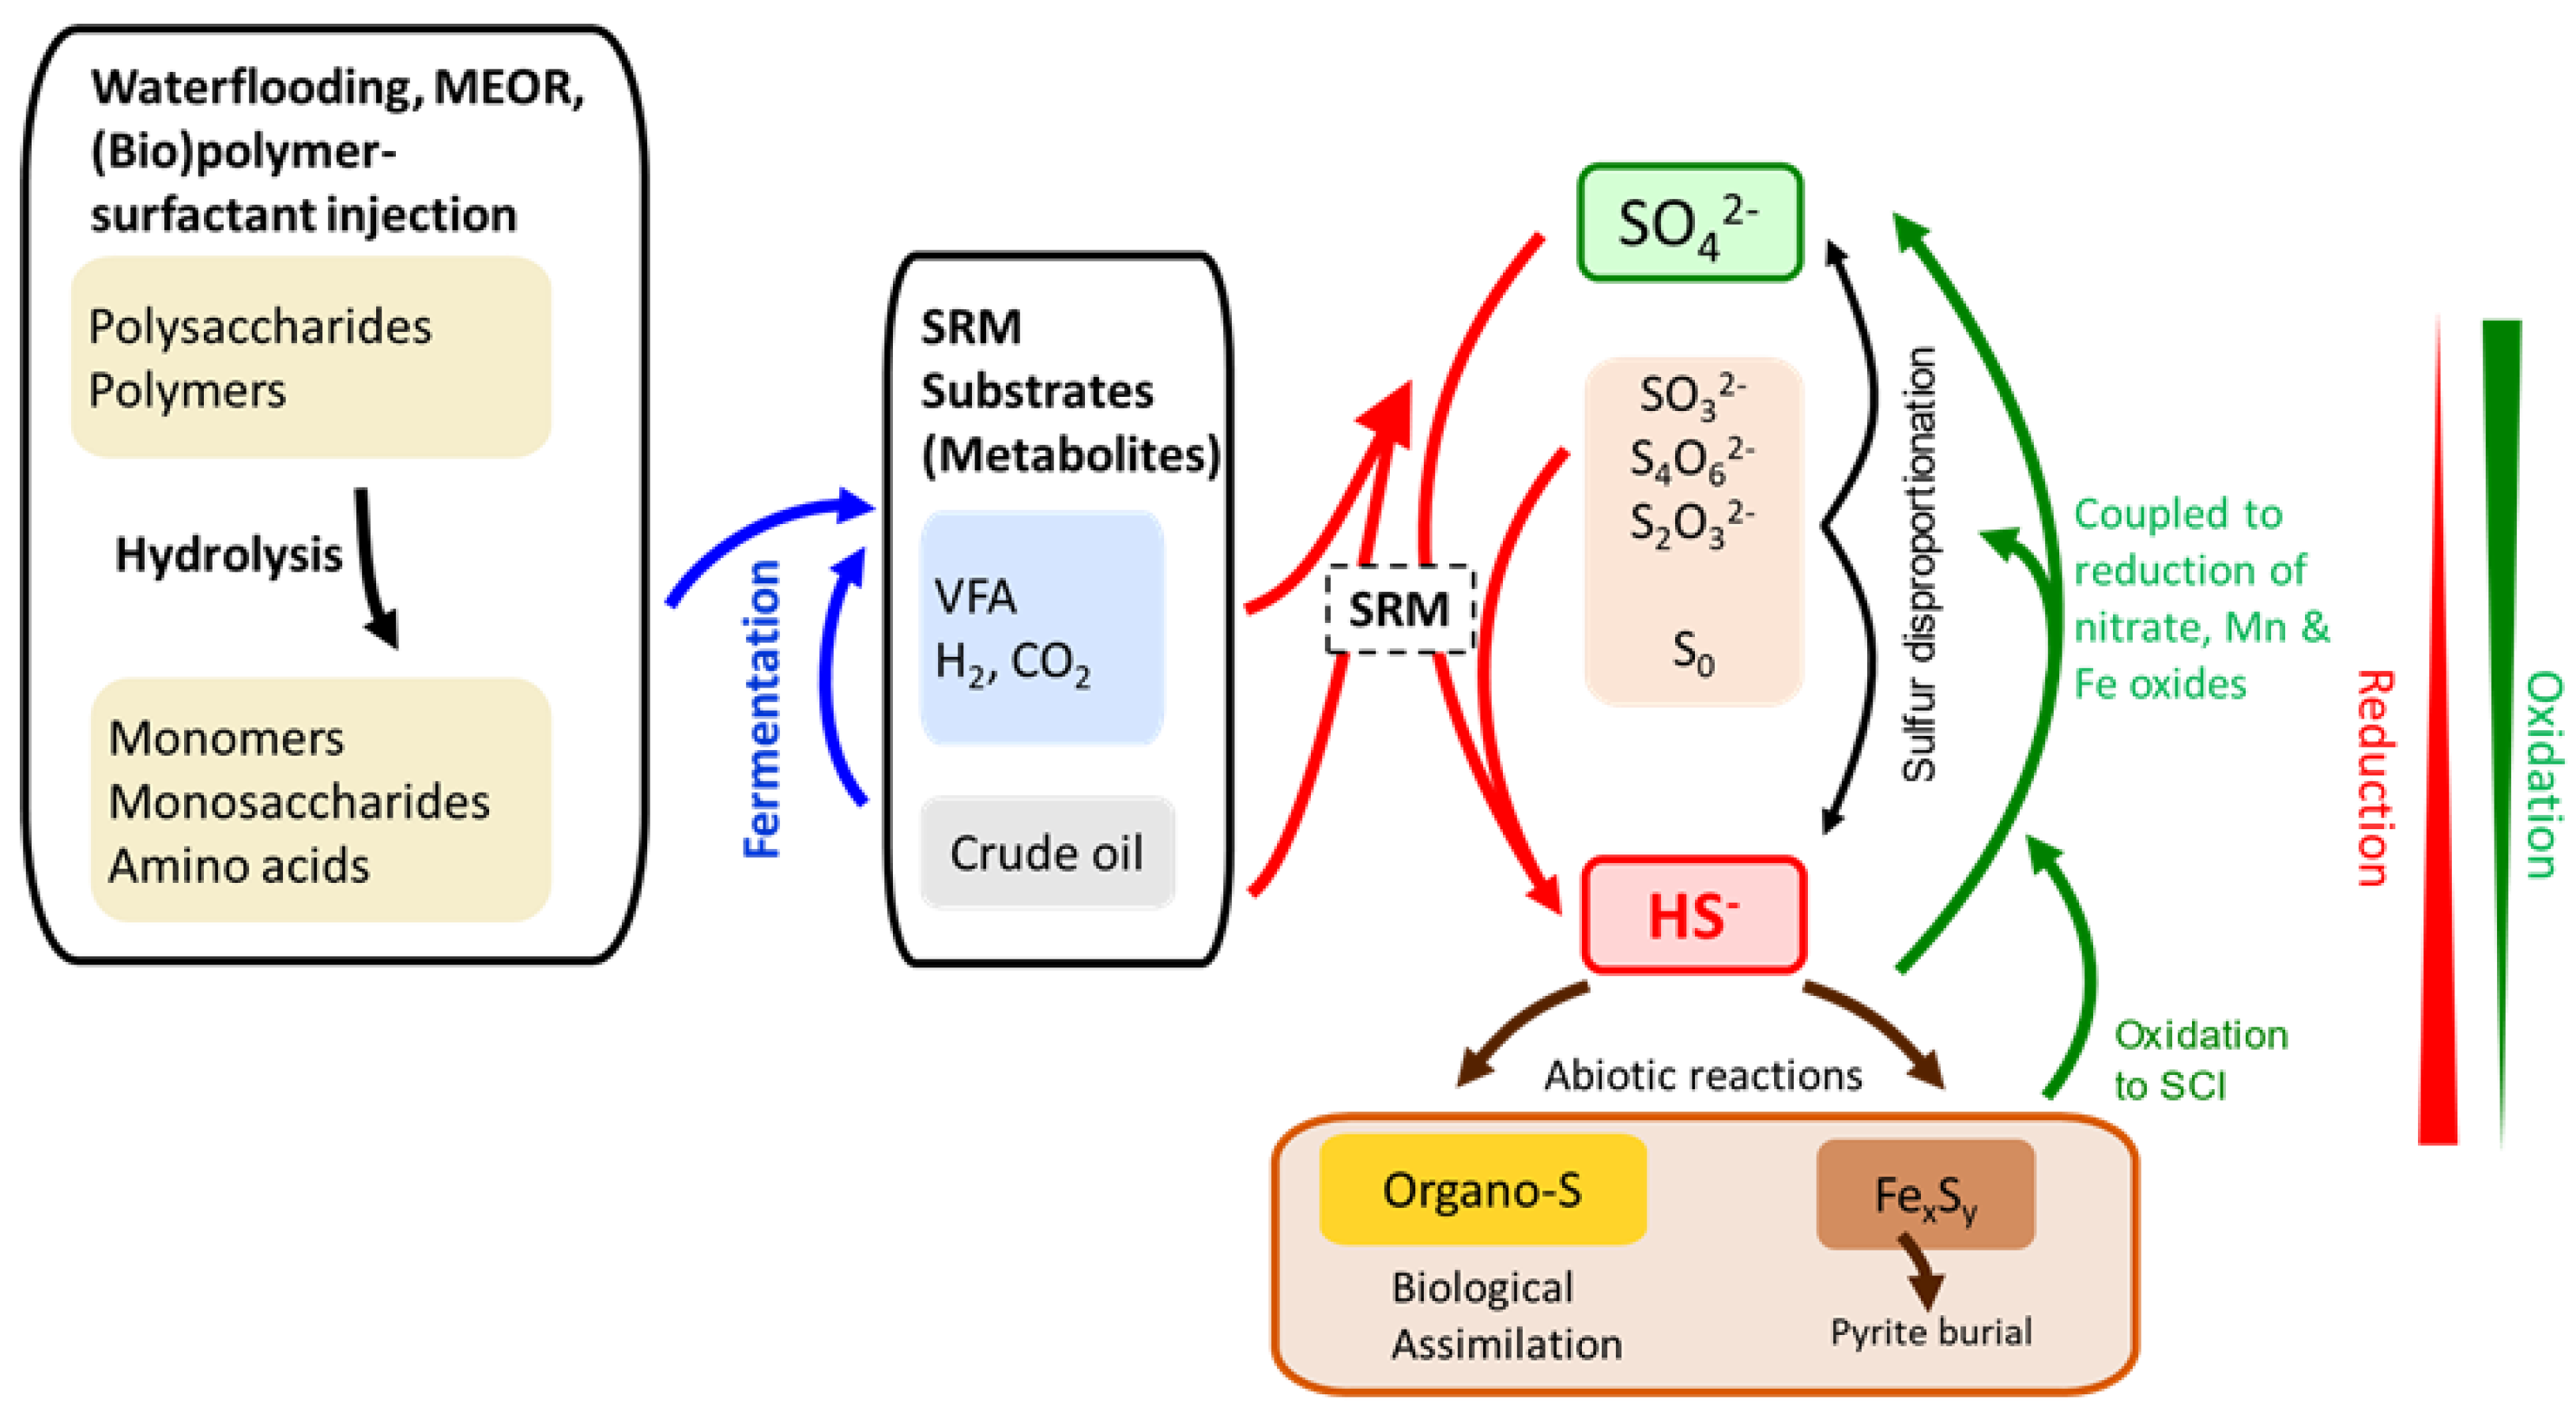
Figure 2.
Growth and surviving envelops of the SRB in North Sea Fields (after [39]).
Figure 2.
Growth and surviving envelops of the SRB in North Sea Fields (after [39]).
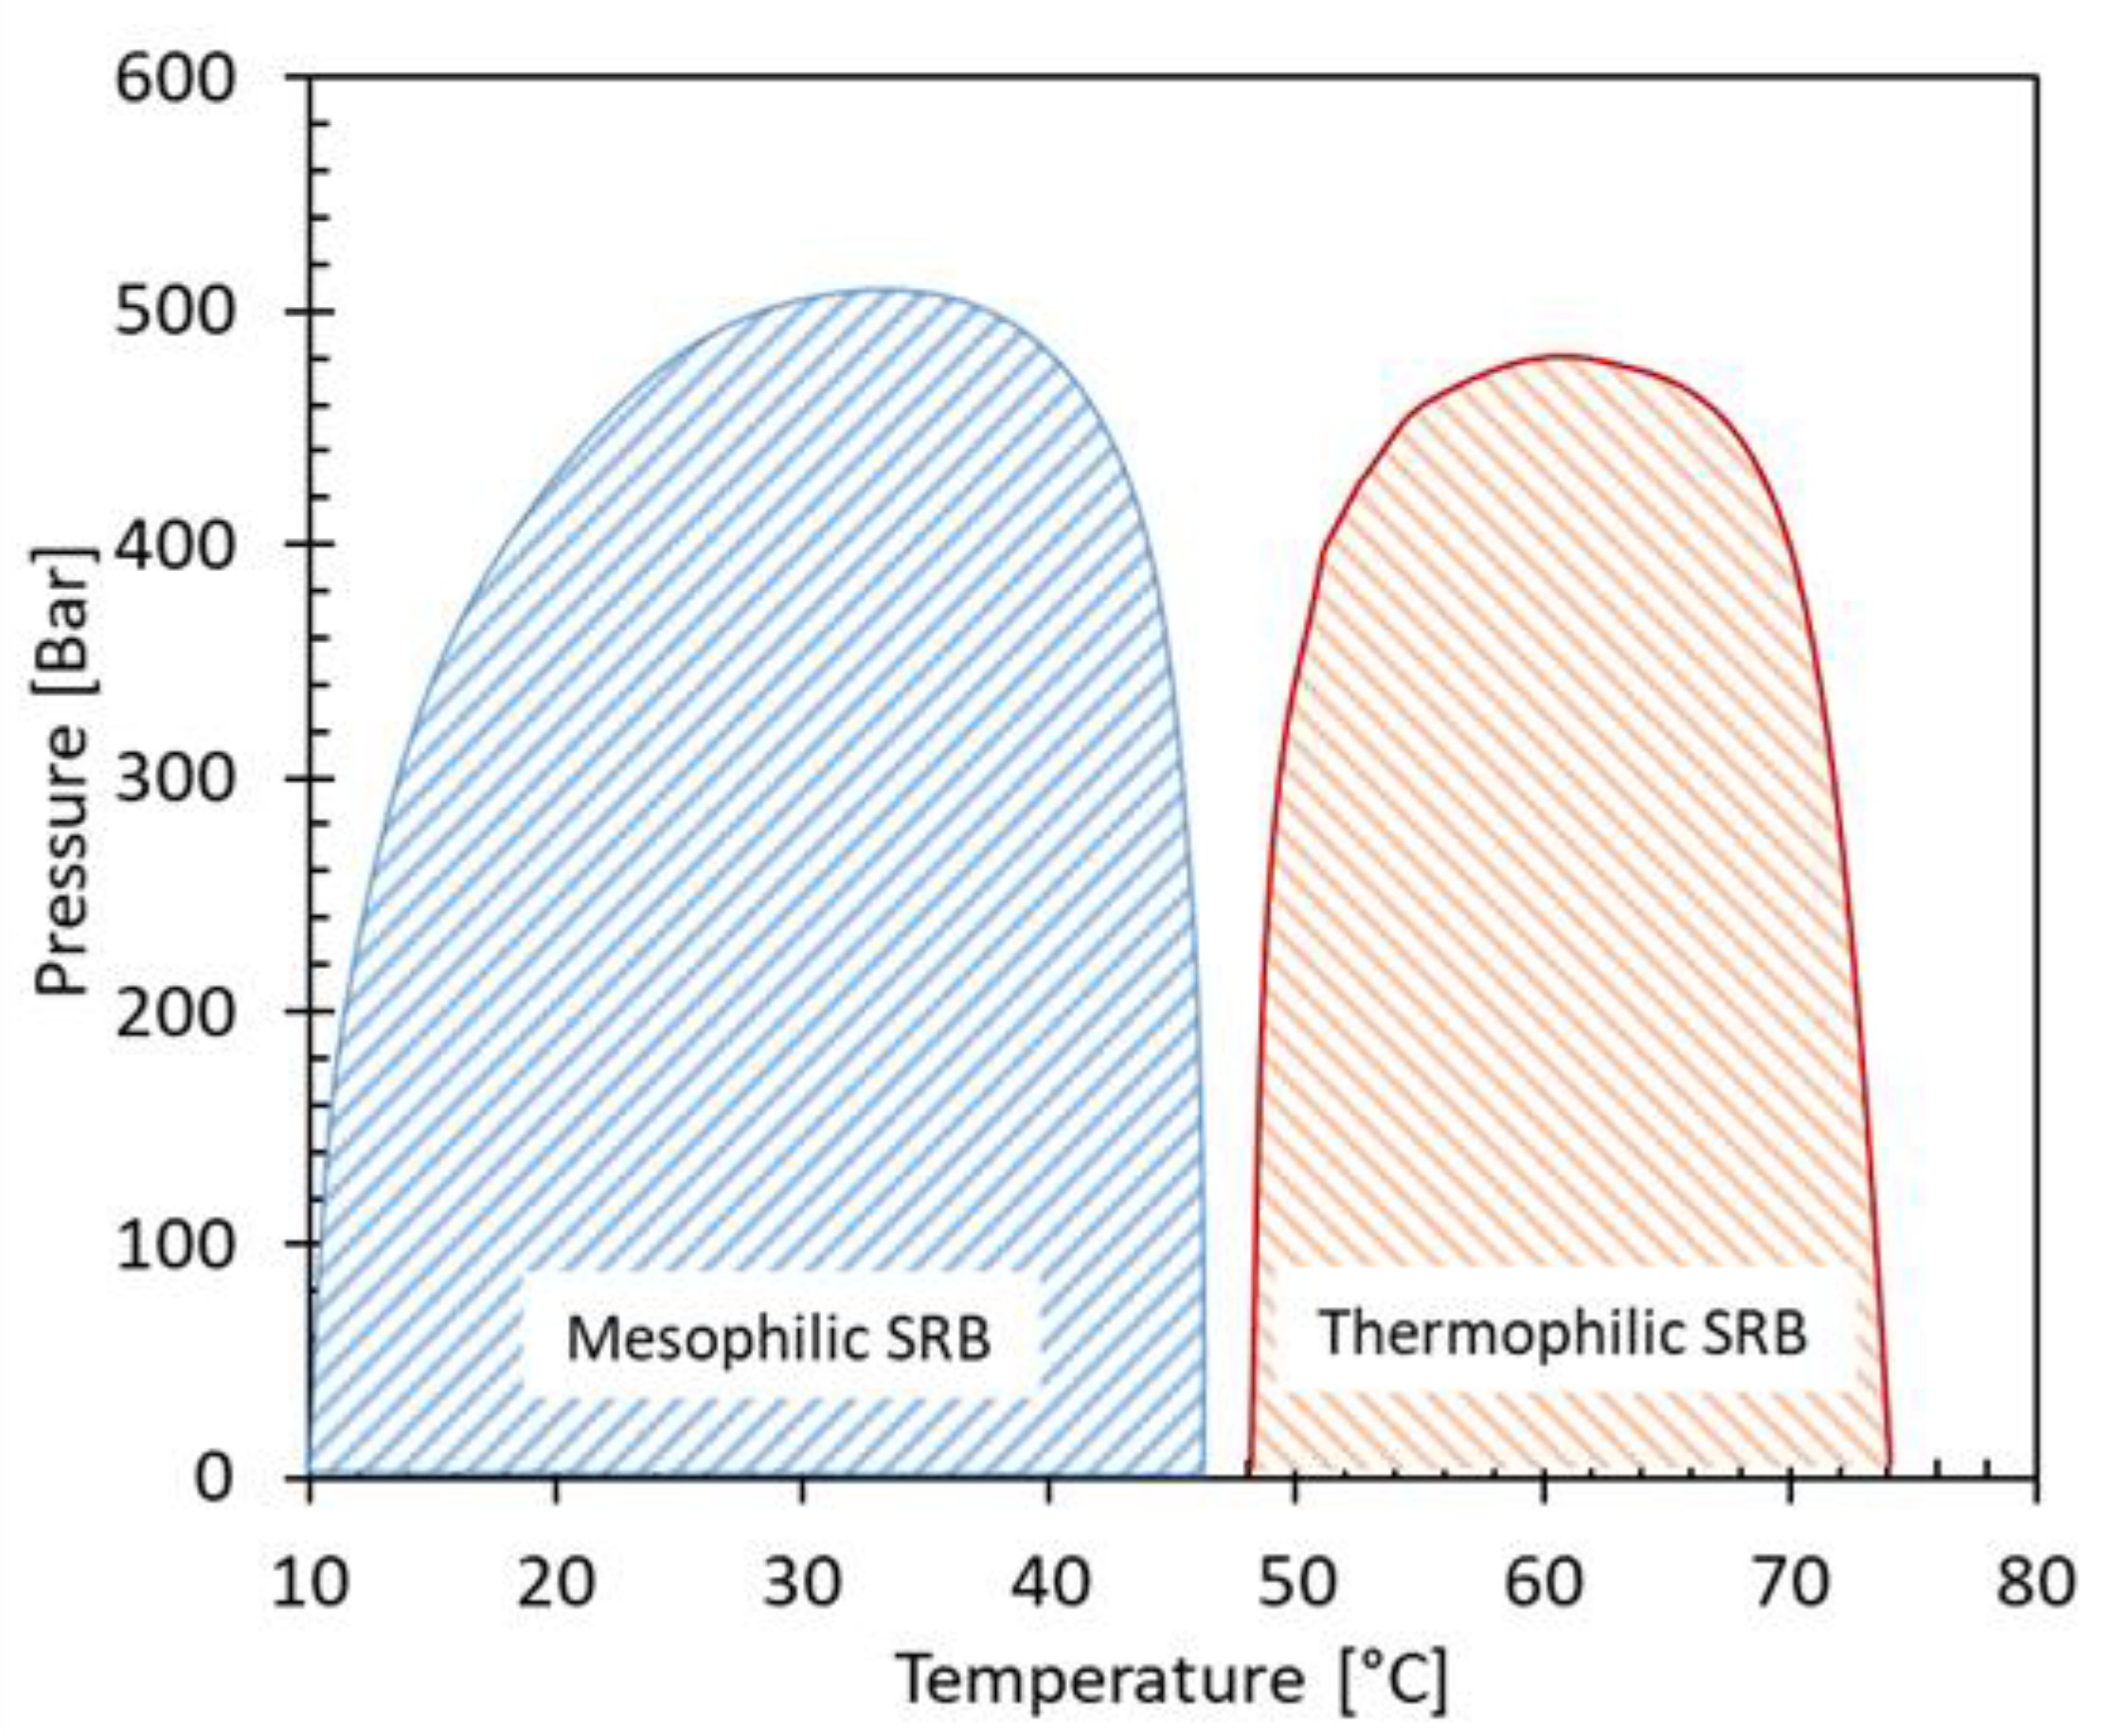
Figure 4.
Partitioning coefficient oil-water of the H2S in n-hexadecane and oil (A) -brine systems of various salinity (pH=6.0; performed using PVTSim, [45]).
Figure 4.
Partitioning coefficient oil-water of the H2S in n-hexadecane and oil (A) -brine systems of various salinity (pH=6.0; performed using PVTSim, [45]).
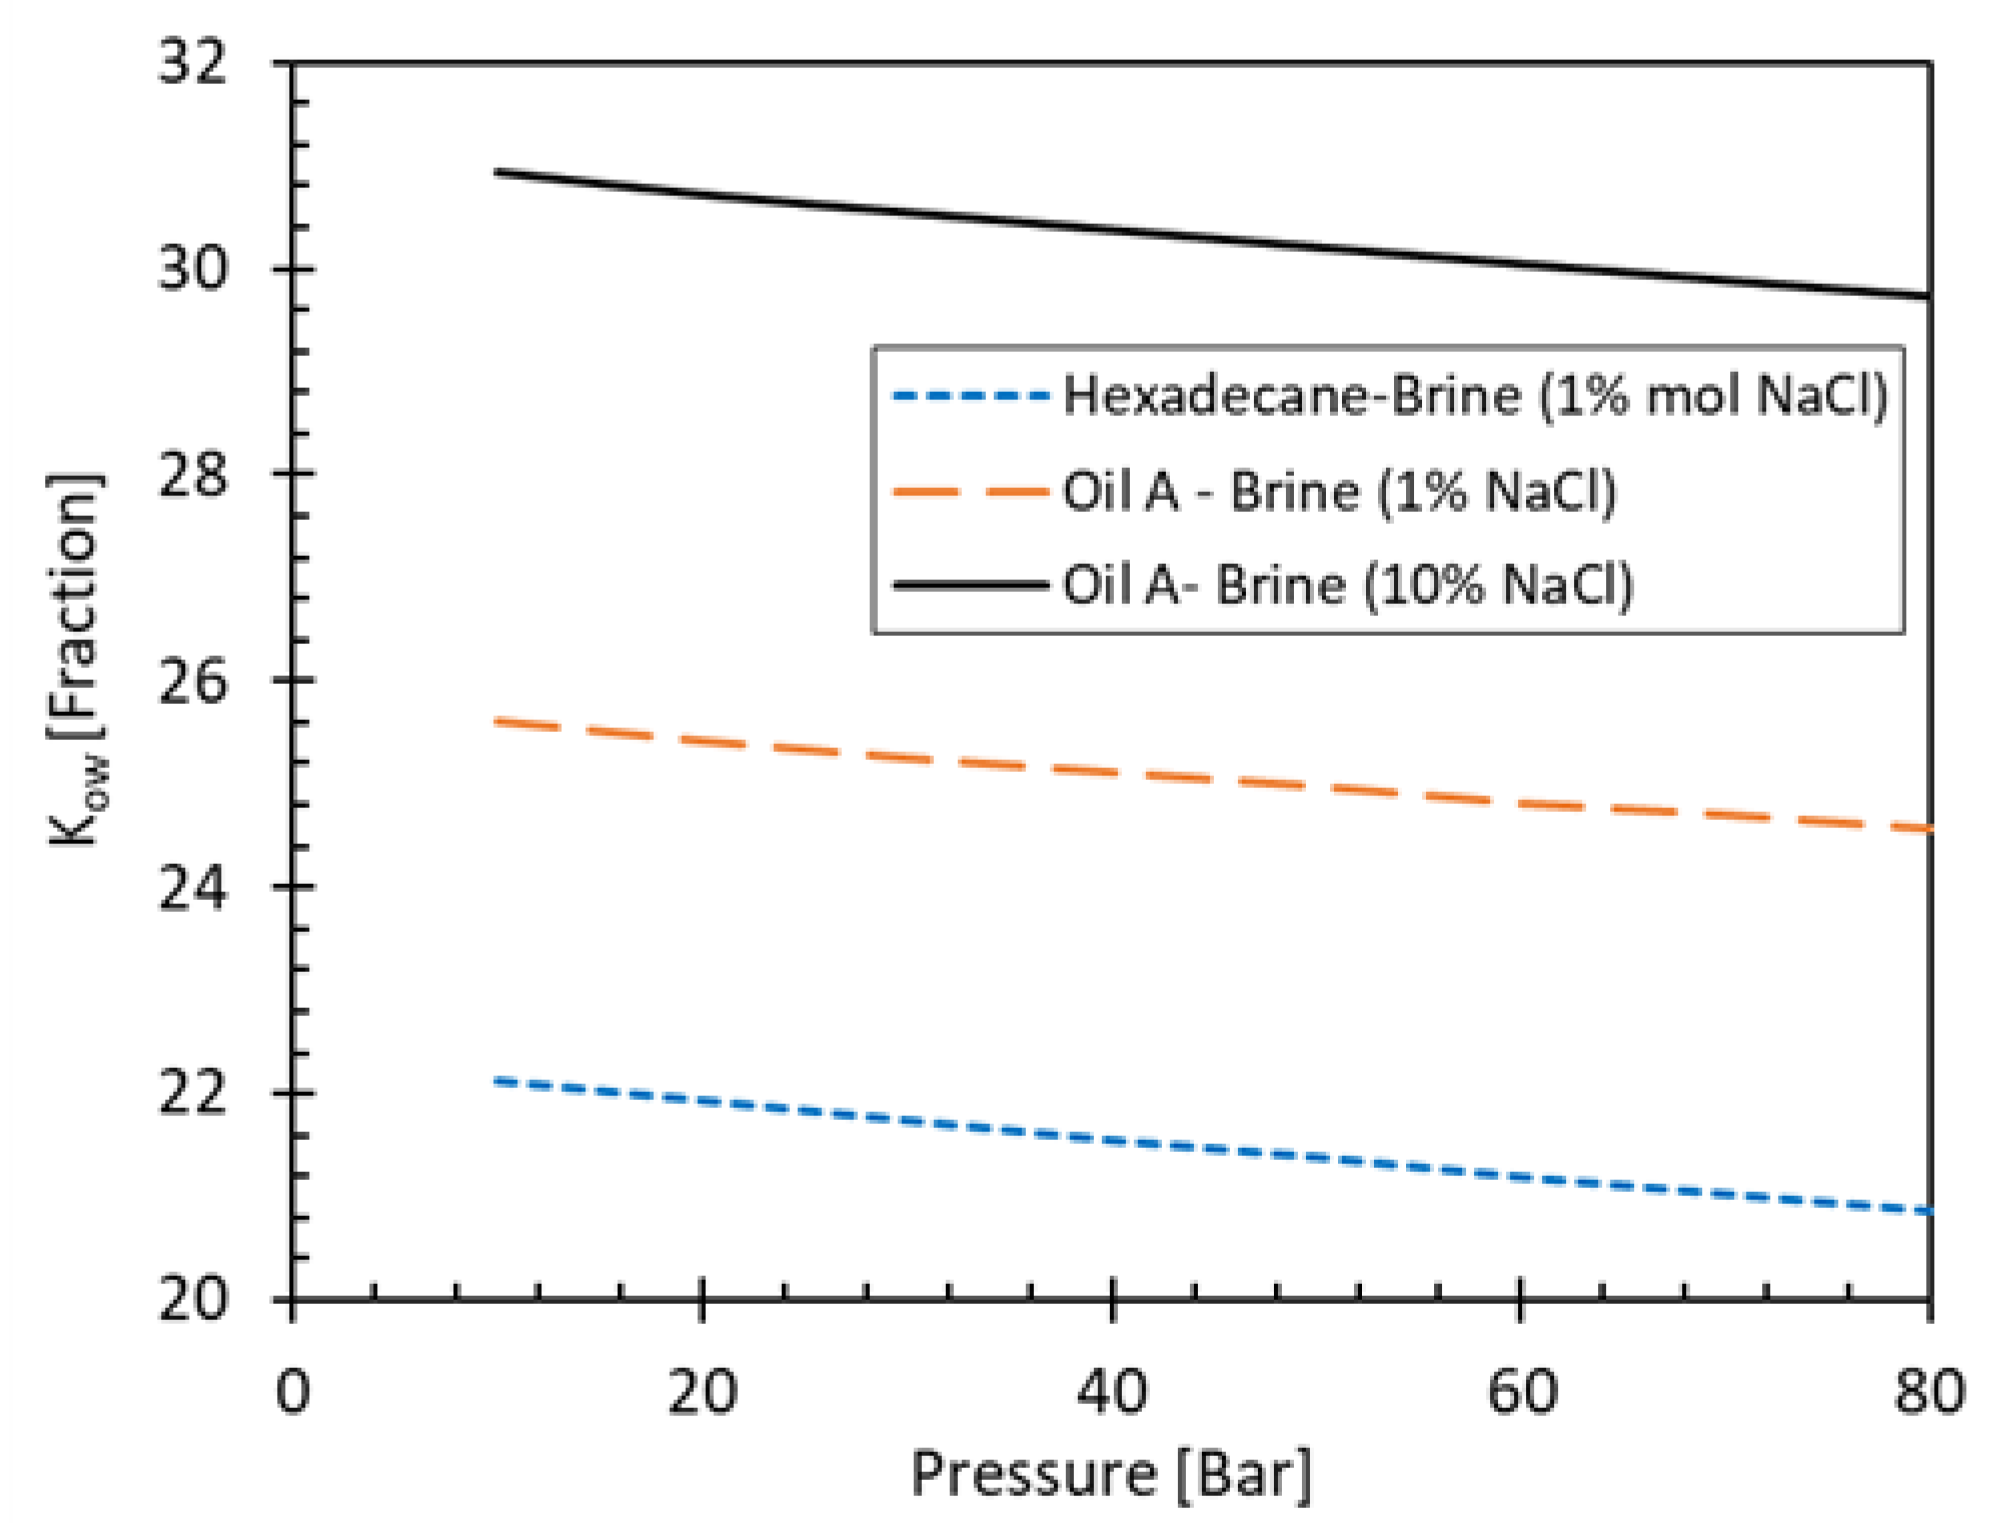
Figure 5.
Effect of the pH on the partitioning coefficients (performed using PVTSim, [45]) .
Figure 5.
Effect of the pH on the partitioning coefficients (performed using PVTSim, [45]) .
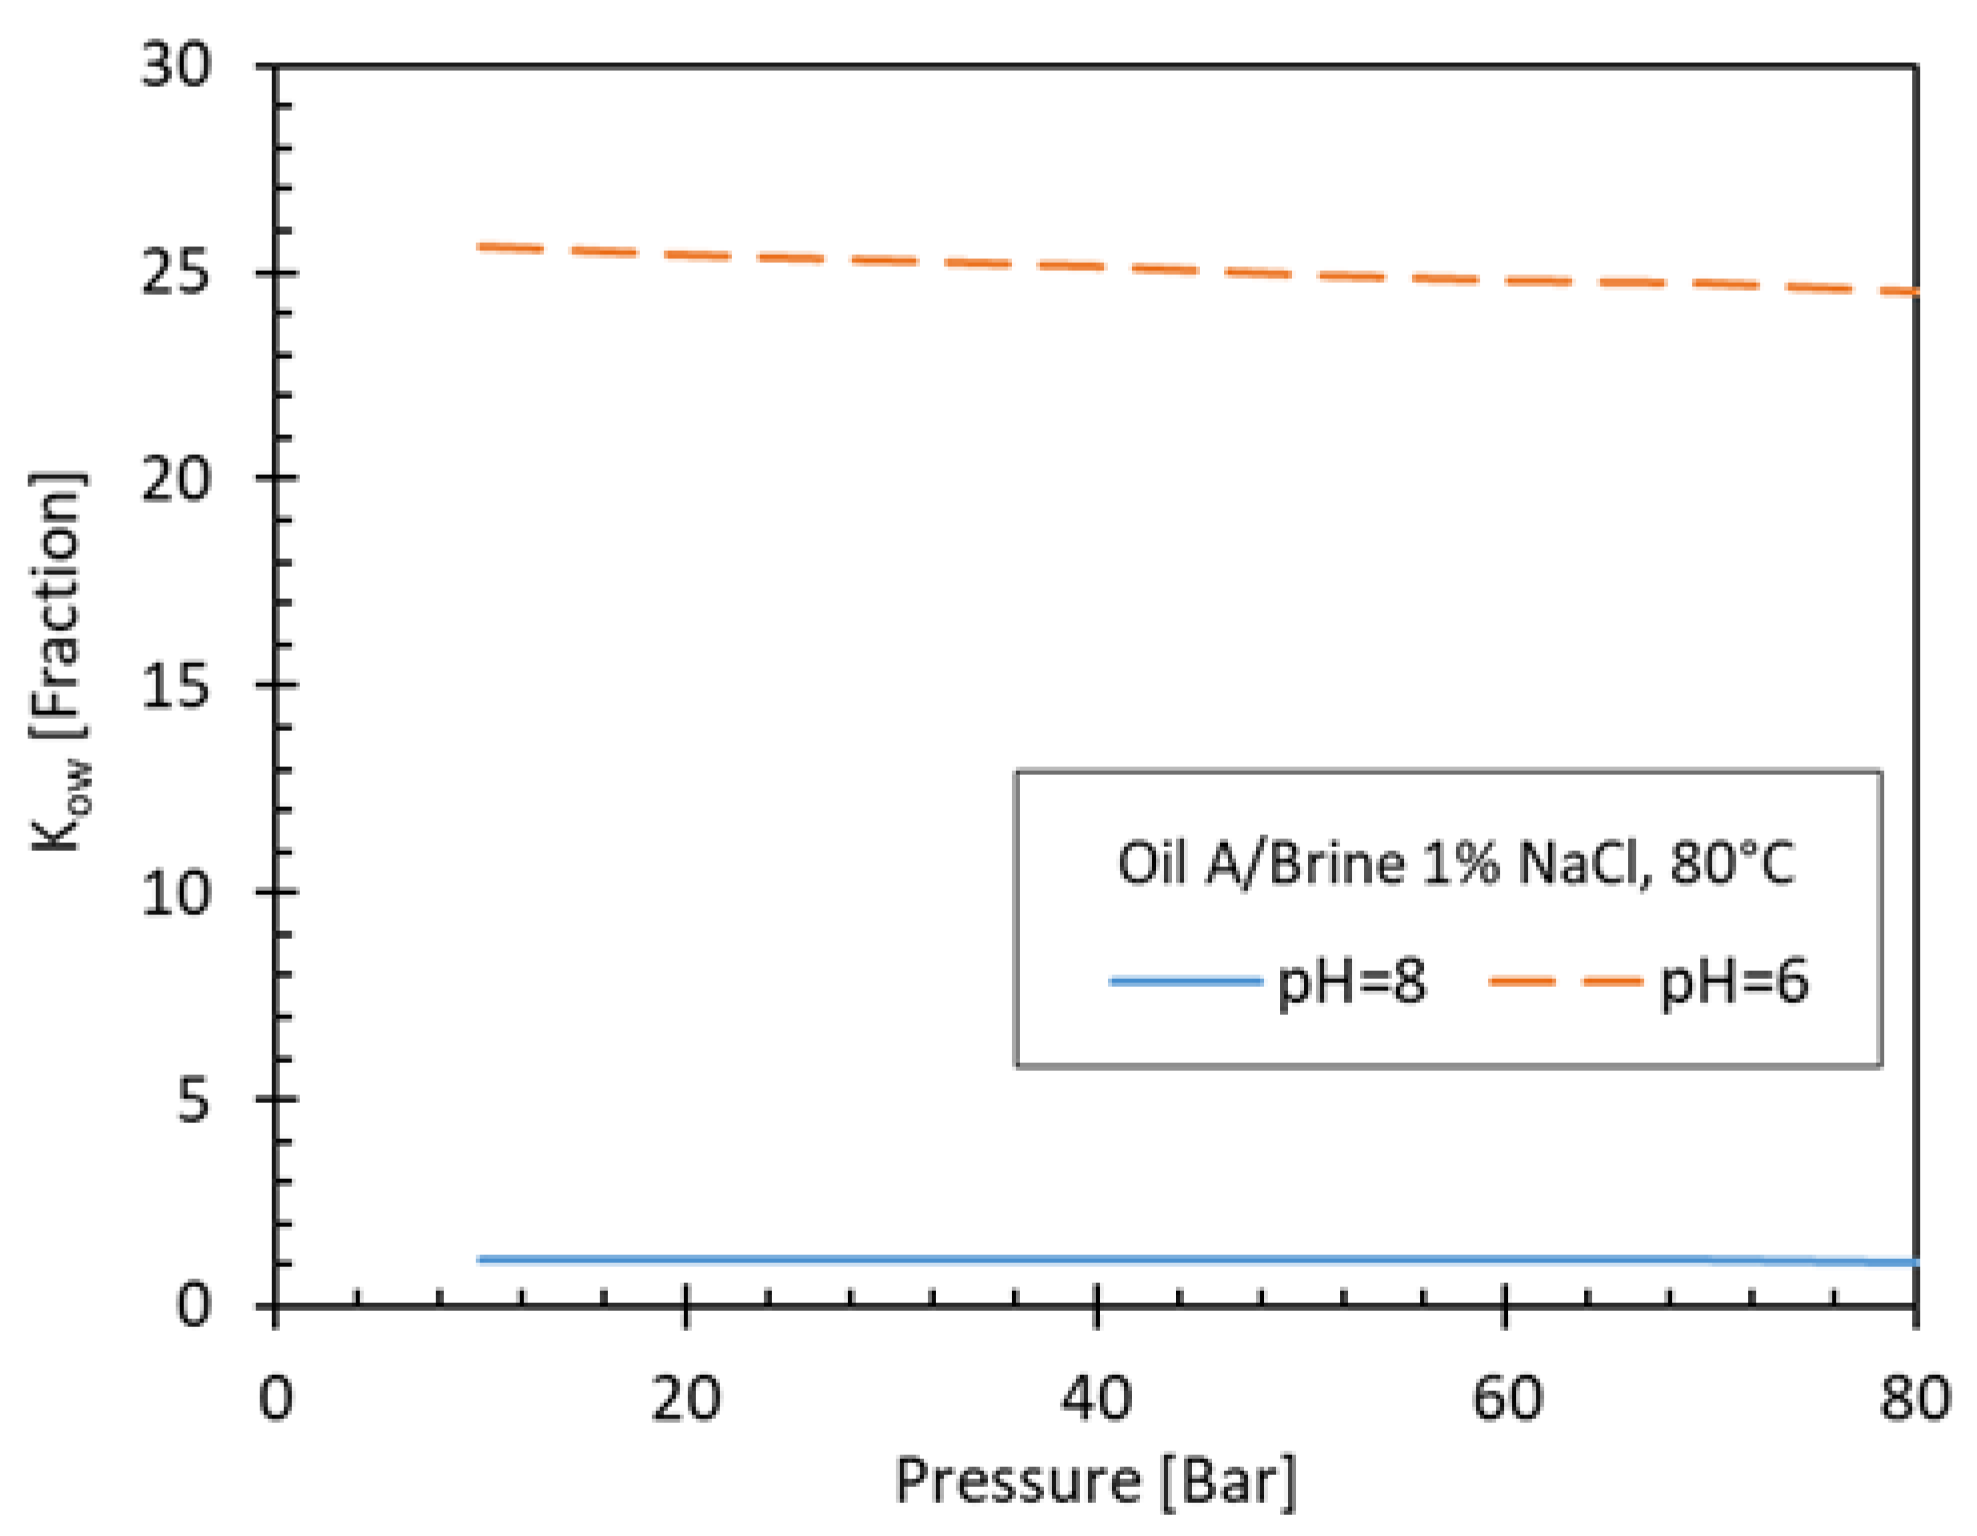
Figure 6.
SCHEMATIC of the biogenic souring and transport processes in an oil reservoir.
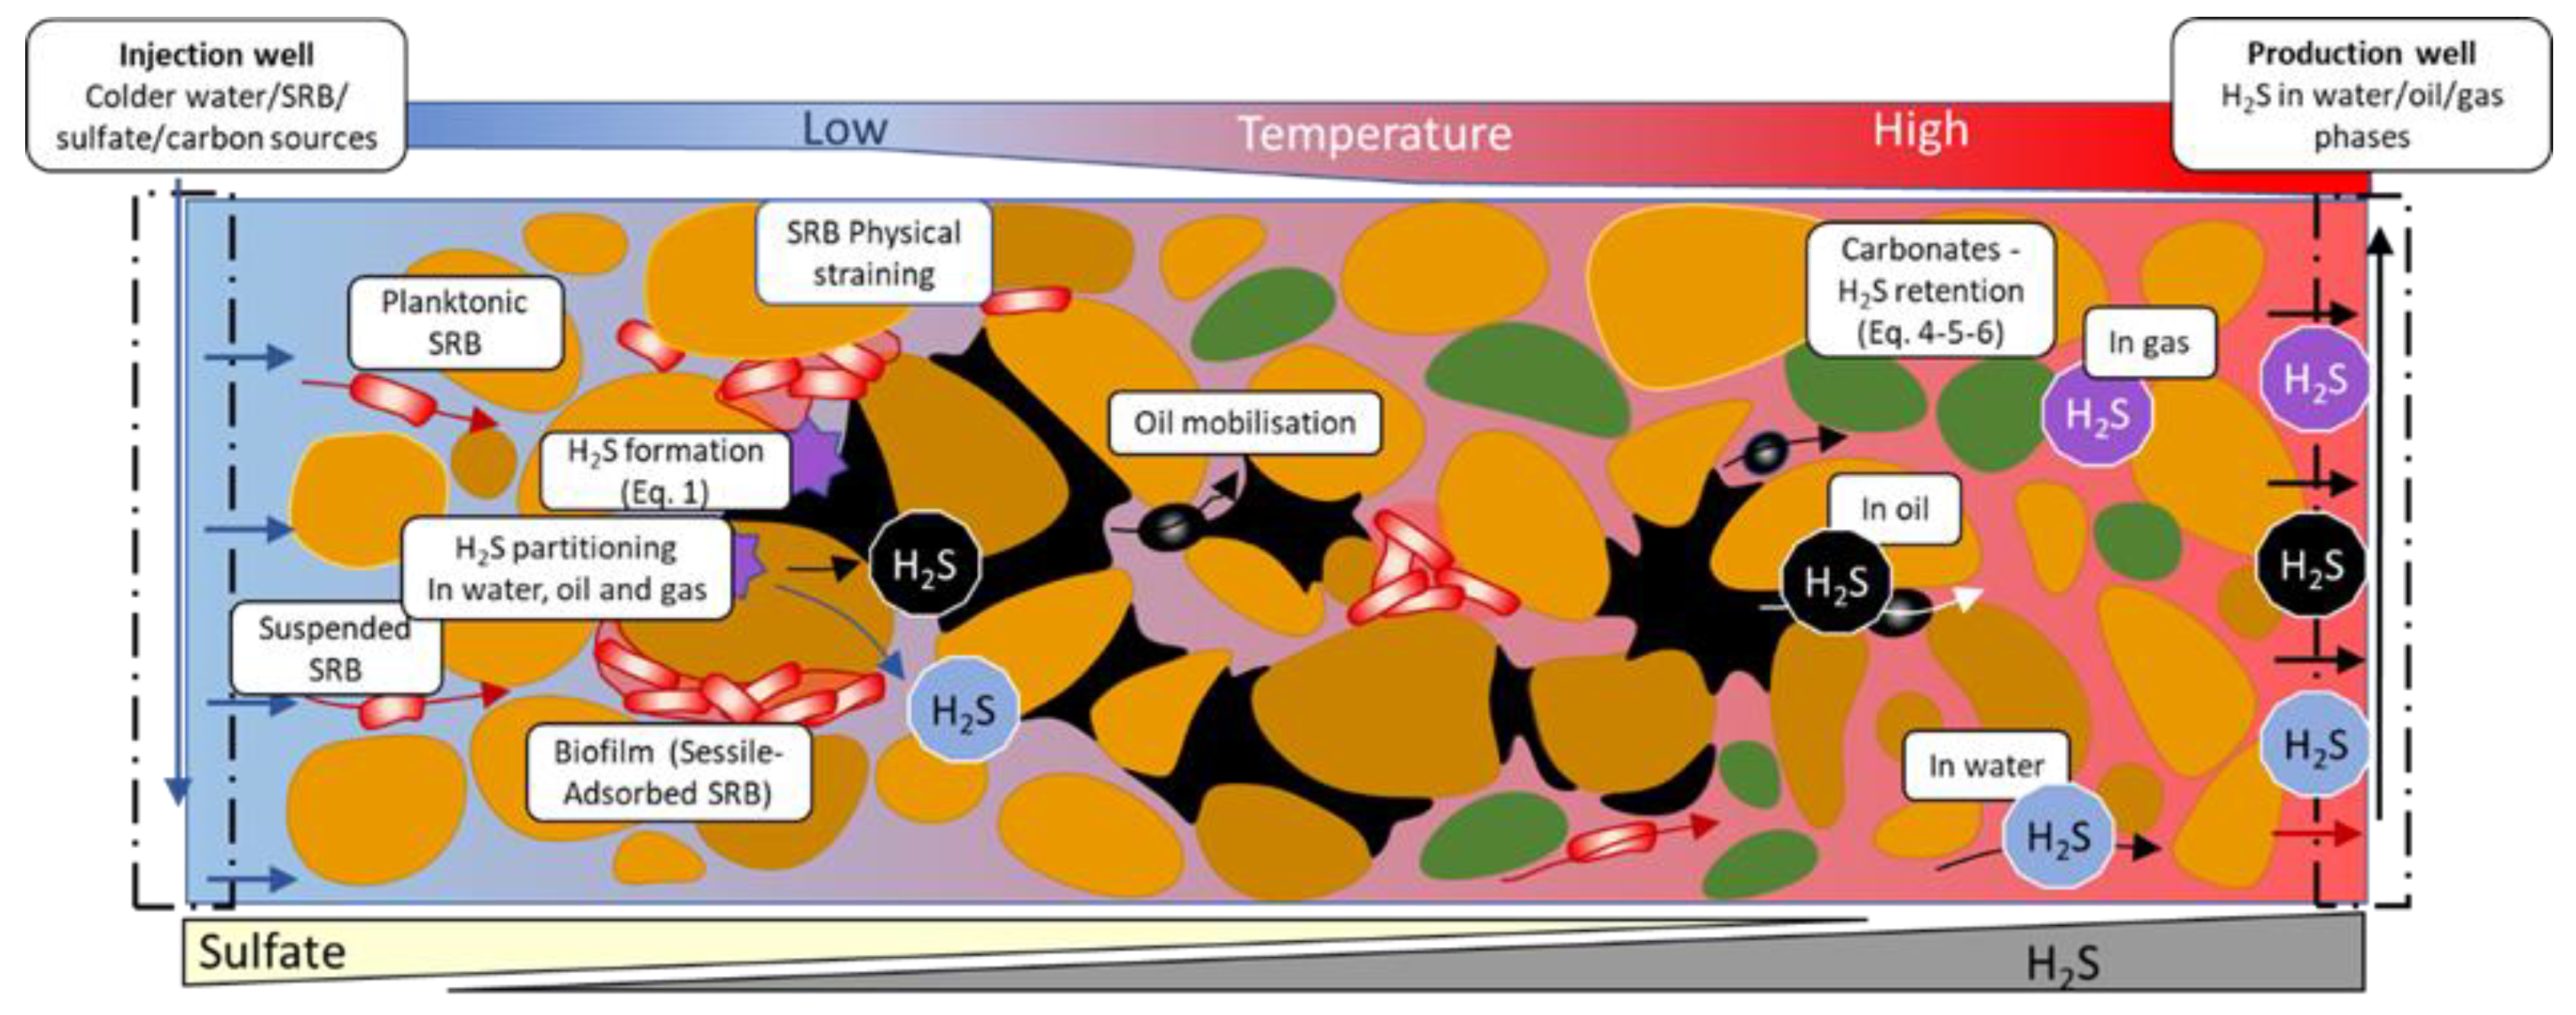
Figure 7.
Numerical model of the North Sea reservoir studied, aerial view. Color coding indicates oil saturation (red: highest; blue: lowest).
Figure 7.
Numerical model of the North Sea reservoir studied, aerial view. Color coding indicates oil saturation (red: highest; blue: lowest).
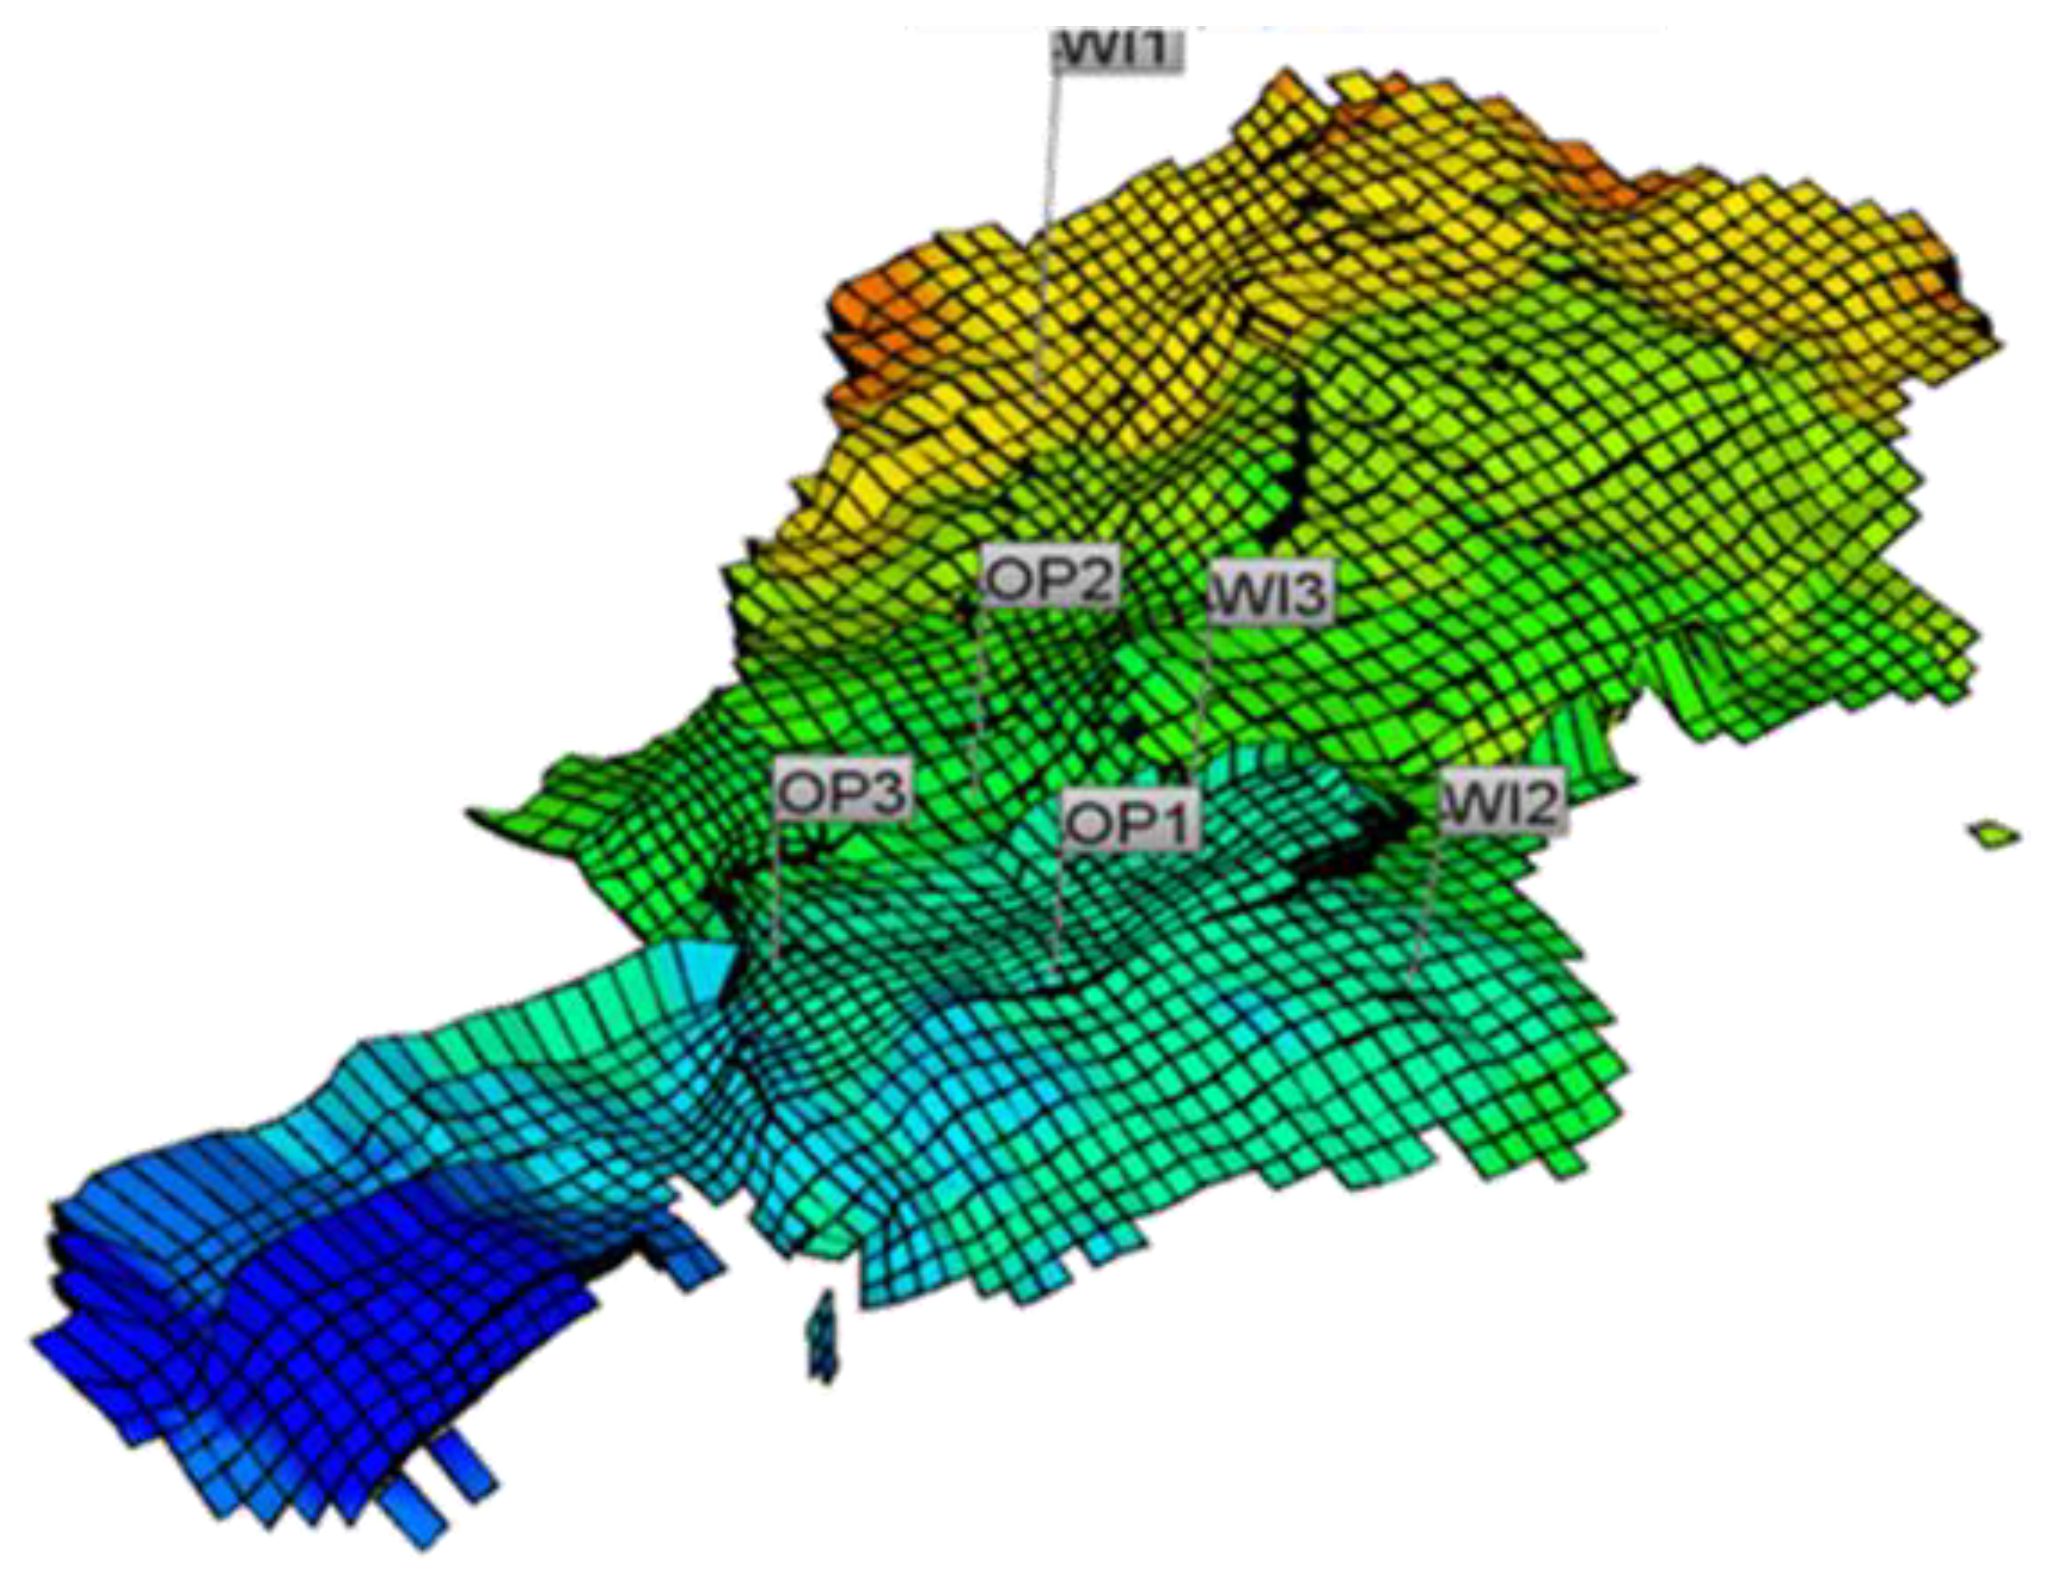
Figure 8.
Predicted water and H2S rates from the production wells of the studied North Sea field. The dashed lines refer to water rates.
Figure 8.
Predicted water and H2S rates from the production wells of the studied North Sea field. The dashed lines refer to water rates.
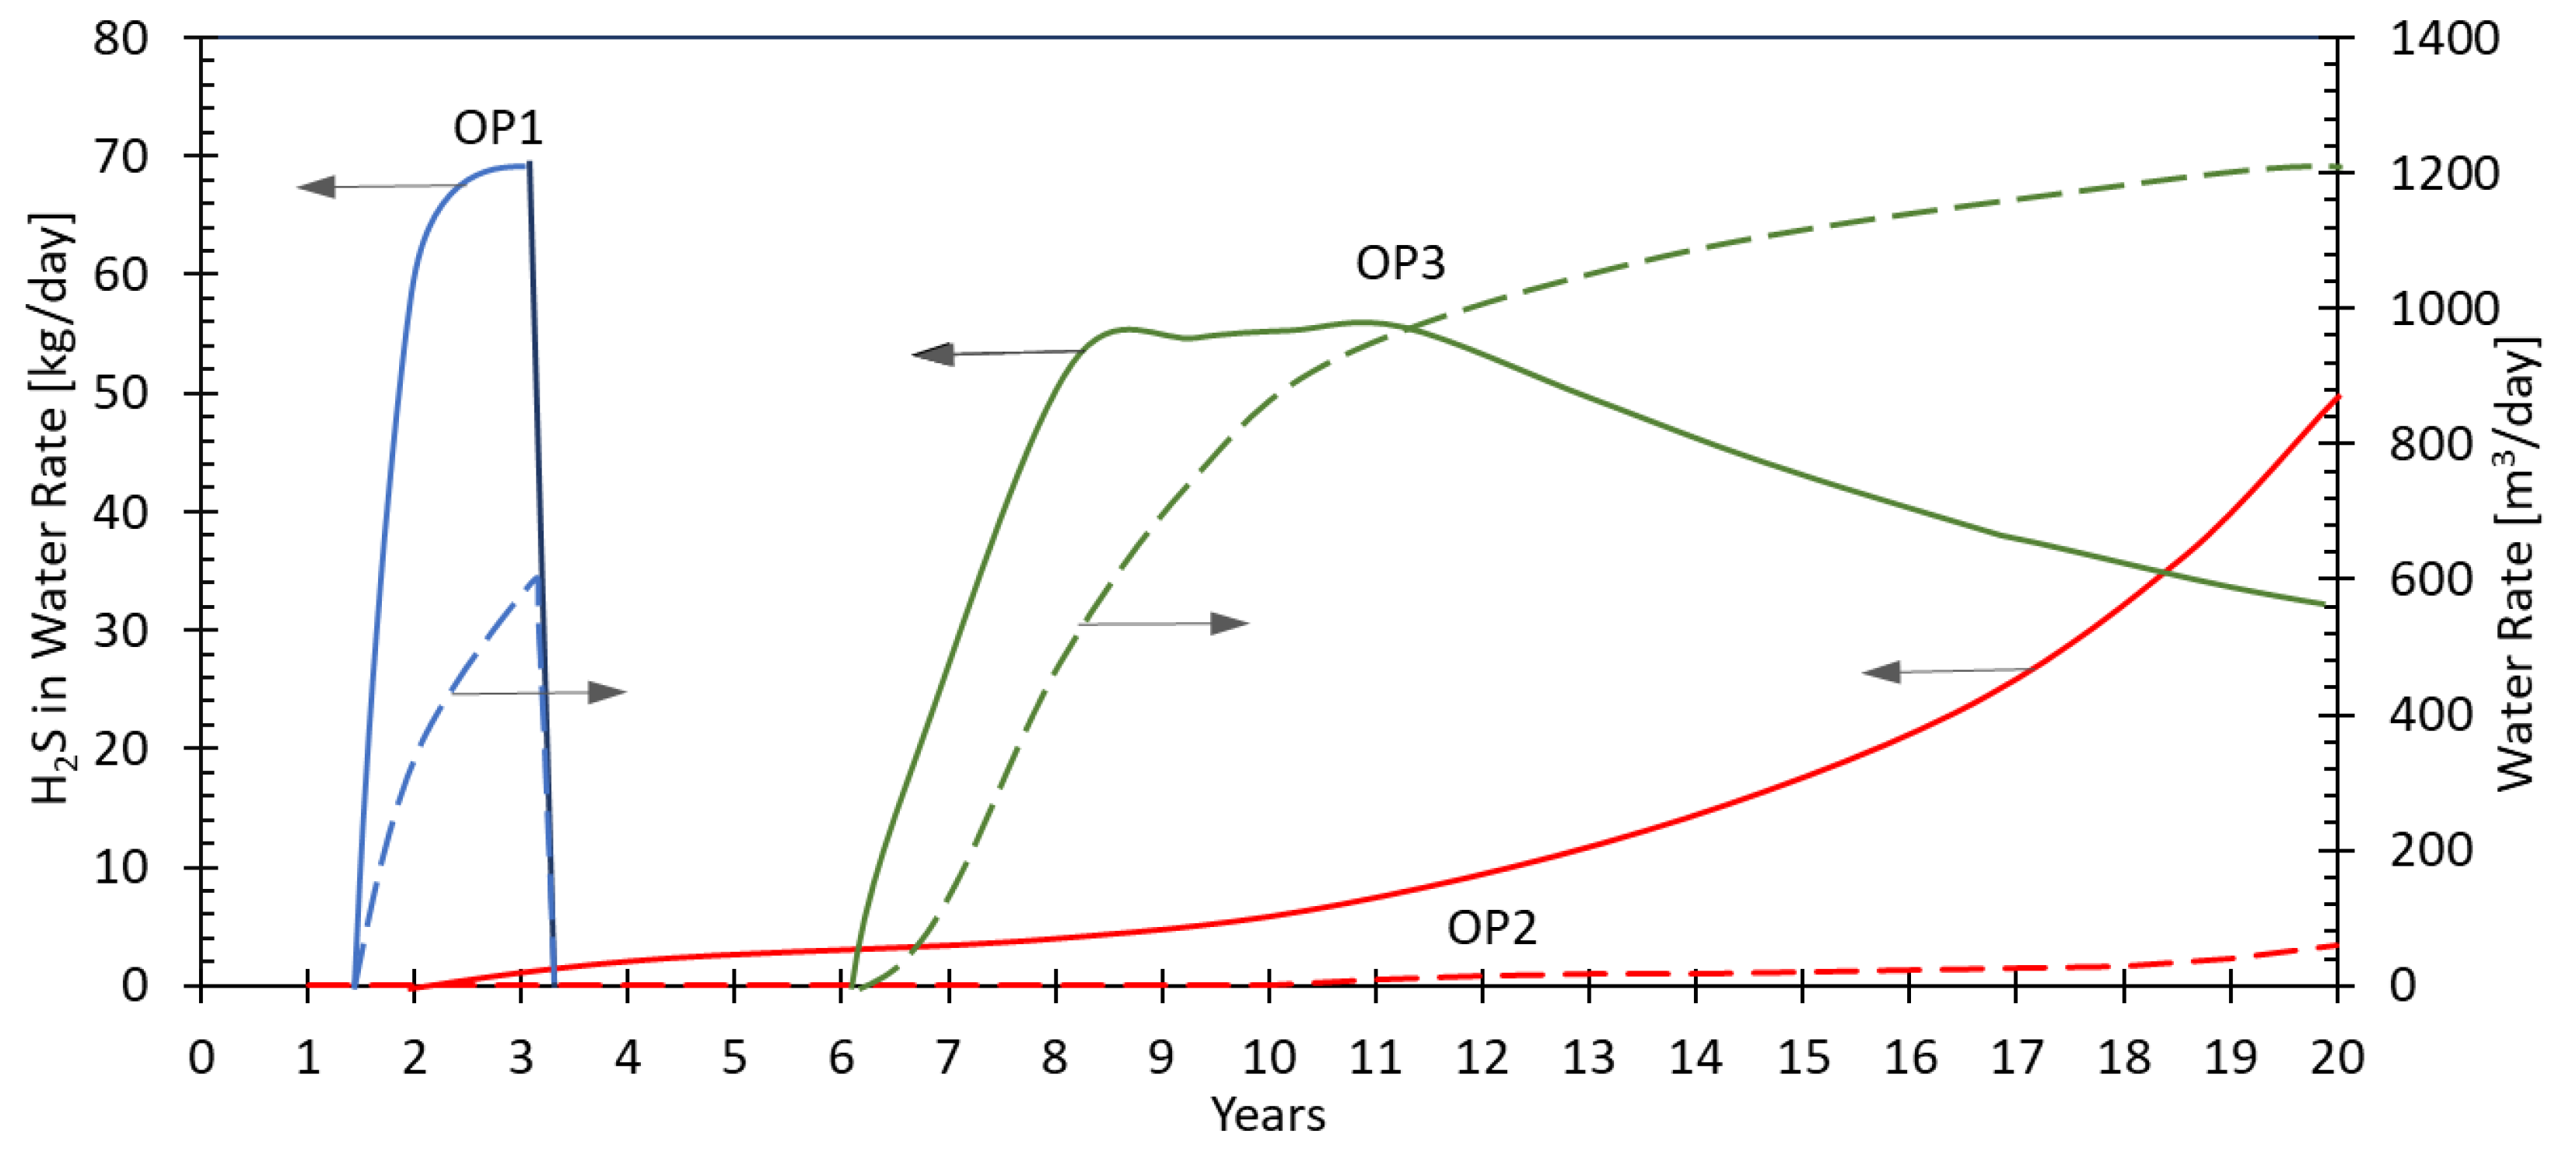
Figure 9.
Measured H2S concentrations in batch (a) and sand pack (b) experiments. In sand pack (b) gaseous H2S was not detected between 1-30 injected PV. In (c) the sand pack column used for the experiments is shown (FW: Formation water; VFA: Volatile fatty acids).
Figure 9.
Measured H2S concentrations in batch (a) and sand pack (b) experiments. In sand pack (b) gaseous H2S was not detected between 1-30 injected PV. In (c) the sand pack column used for the experiments is shown (FW: Formation water; VFA: Volatile fatty acids).
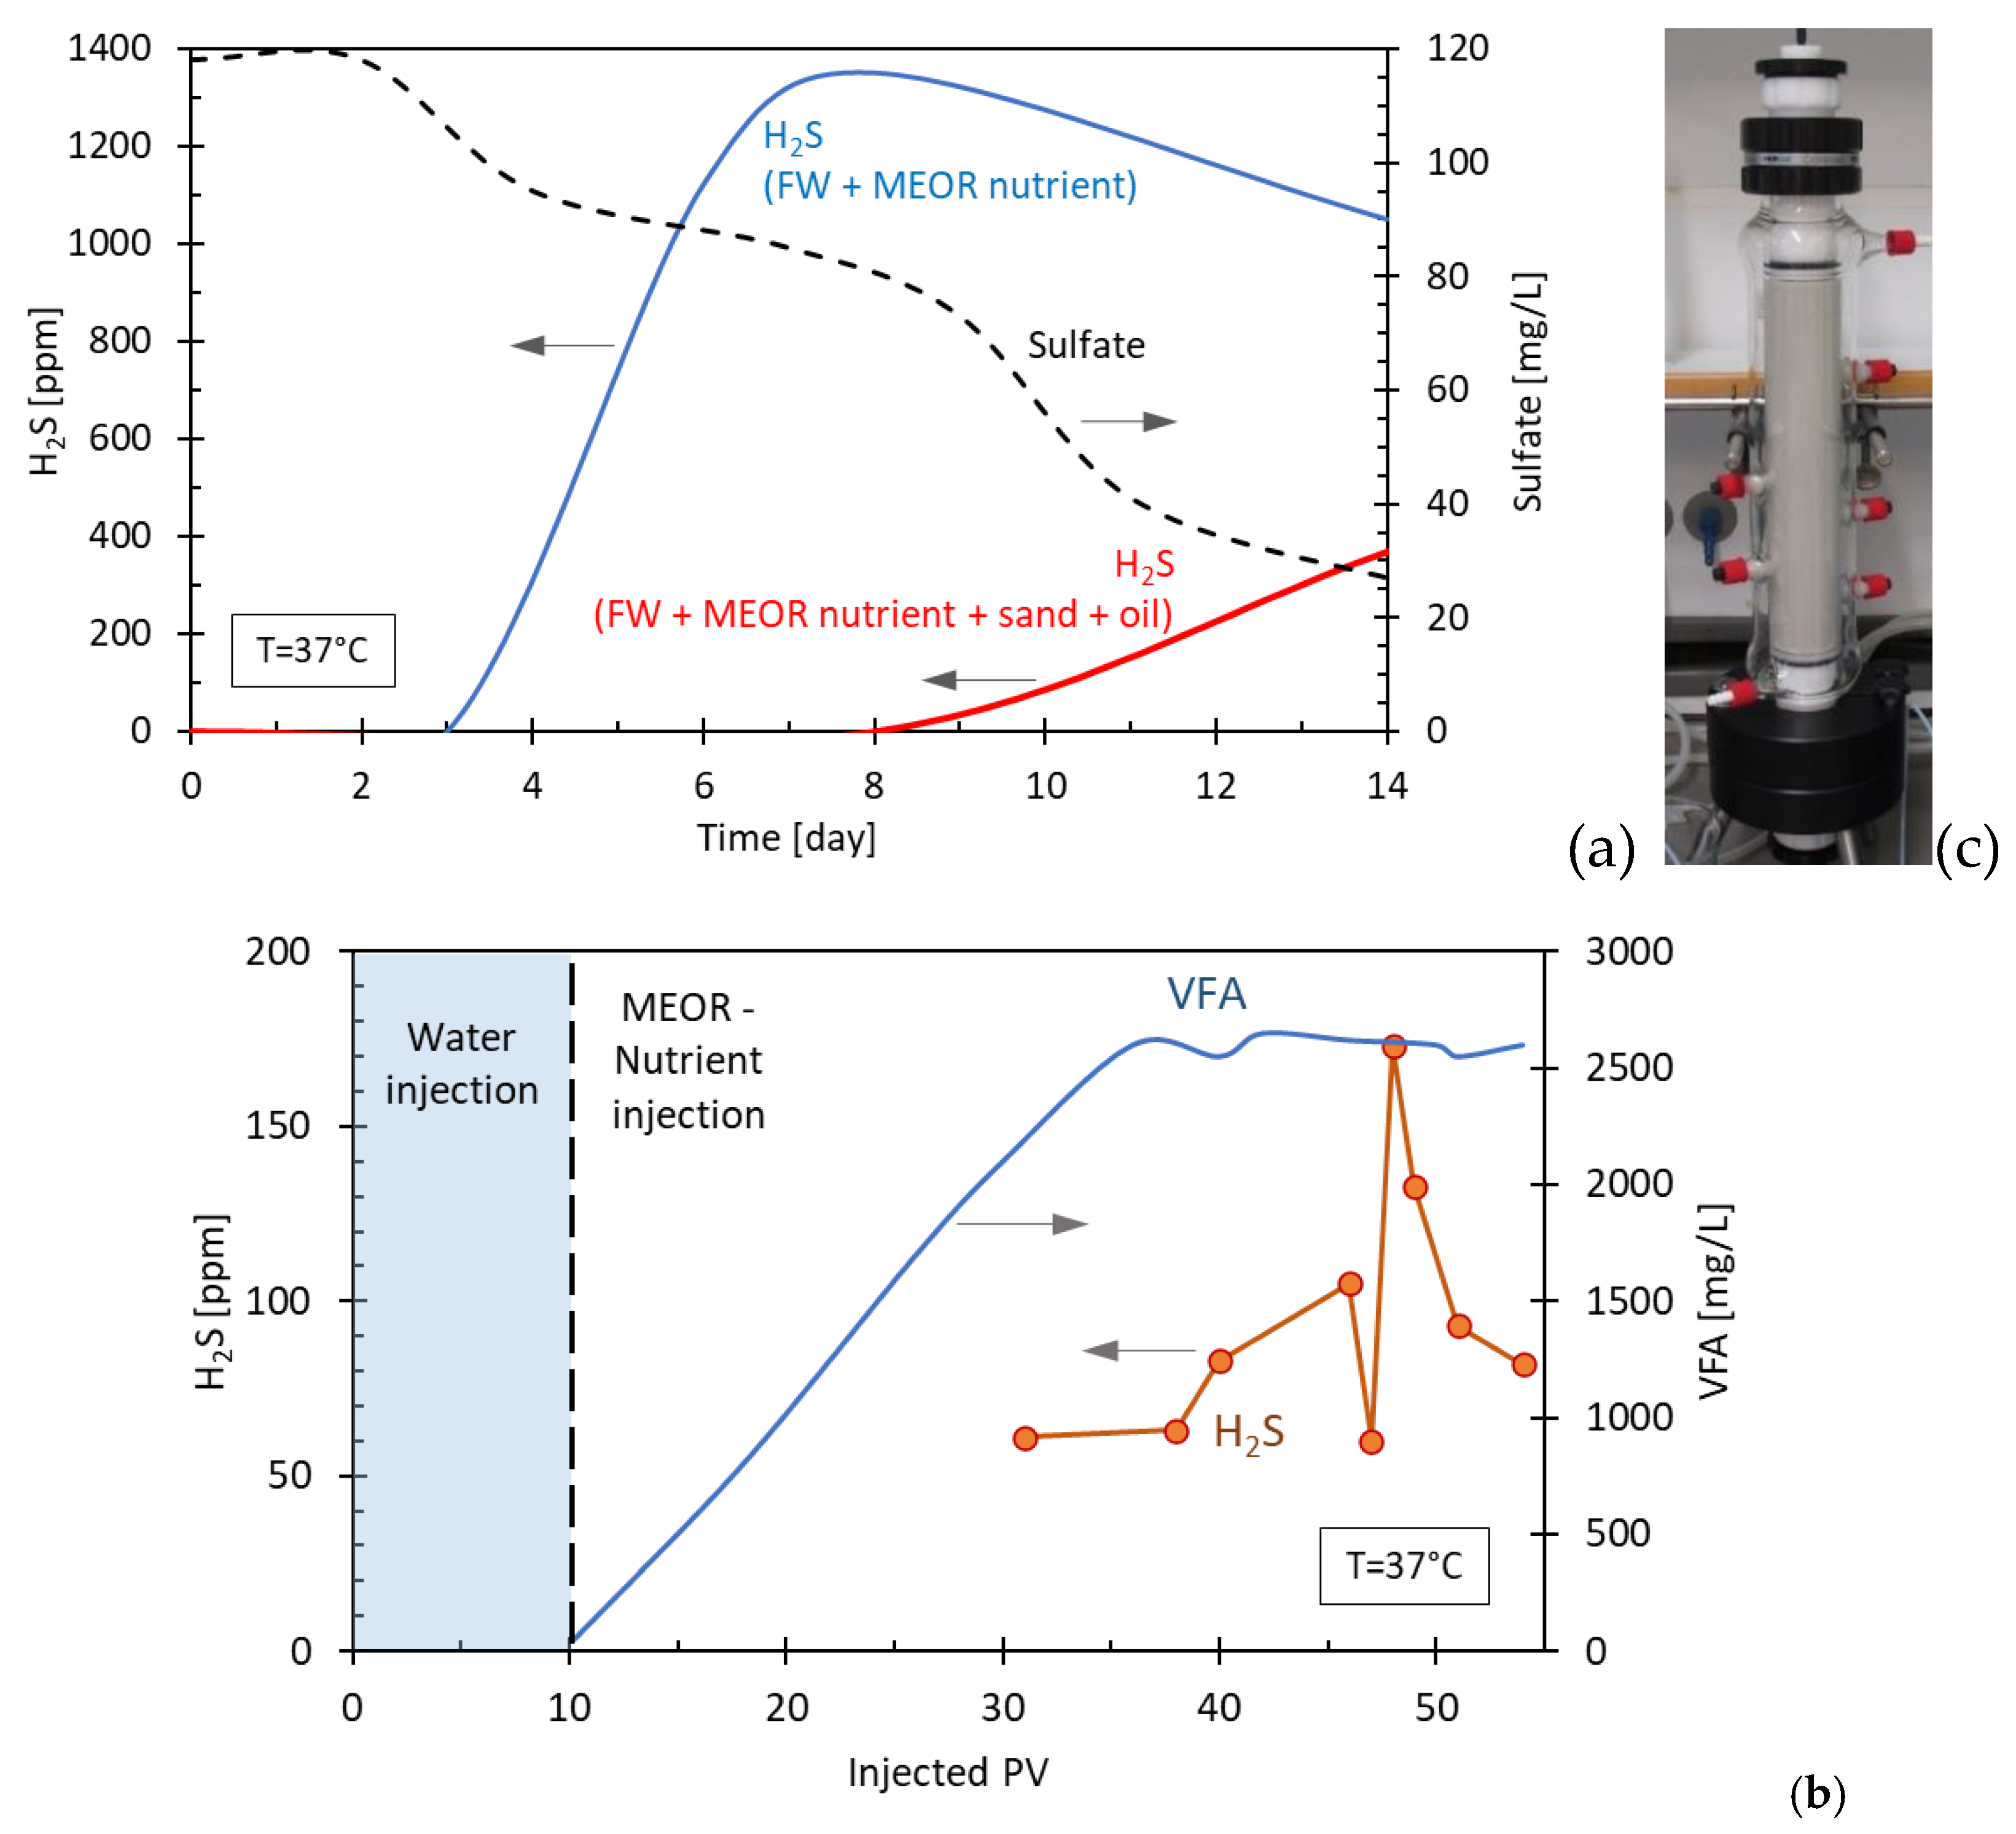
Figure 10.
Calculated H2S profiles in produced oil and water (at reservoir conditions) in modelling MEOR study (Case 2).
Figure 10.
Calculated H2S profiles in produced oil and water (at reservoir conditions) in modelling MEOR study (Case 2).
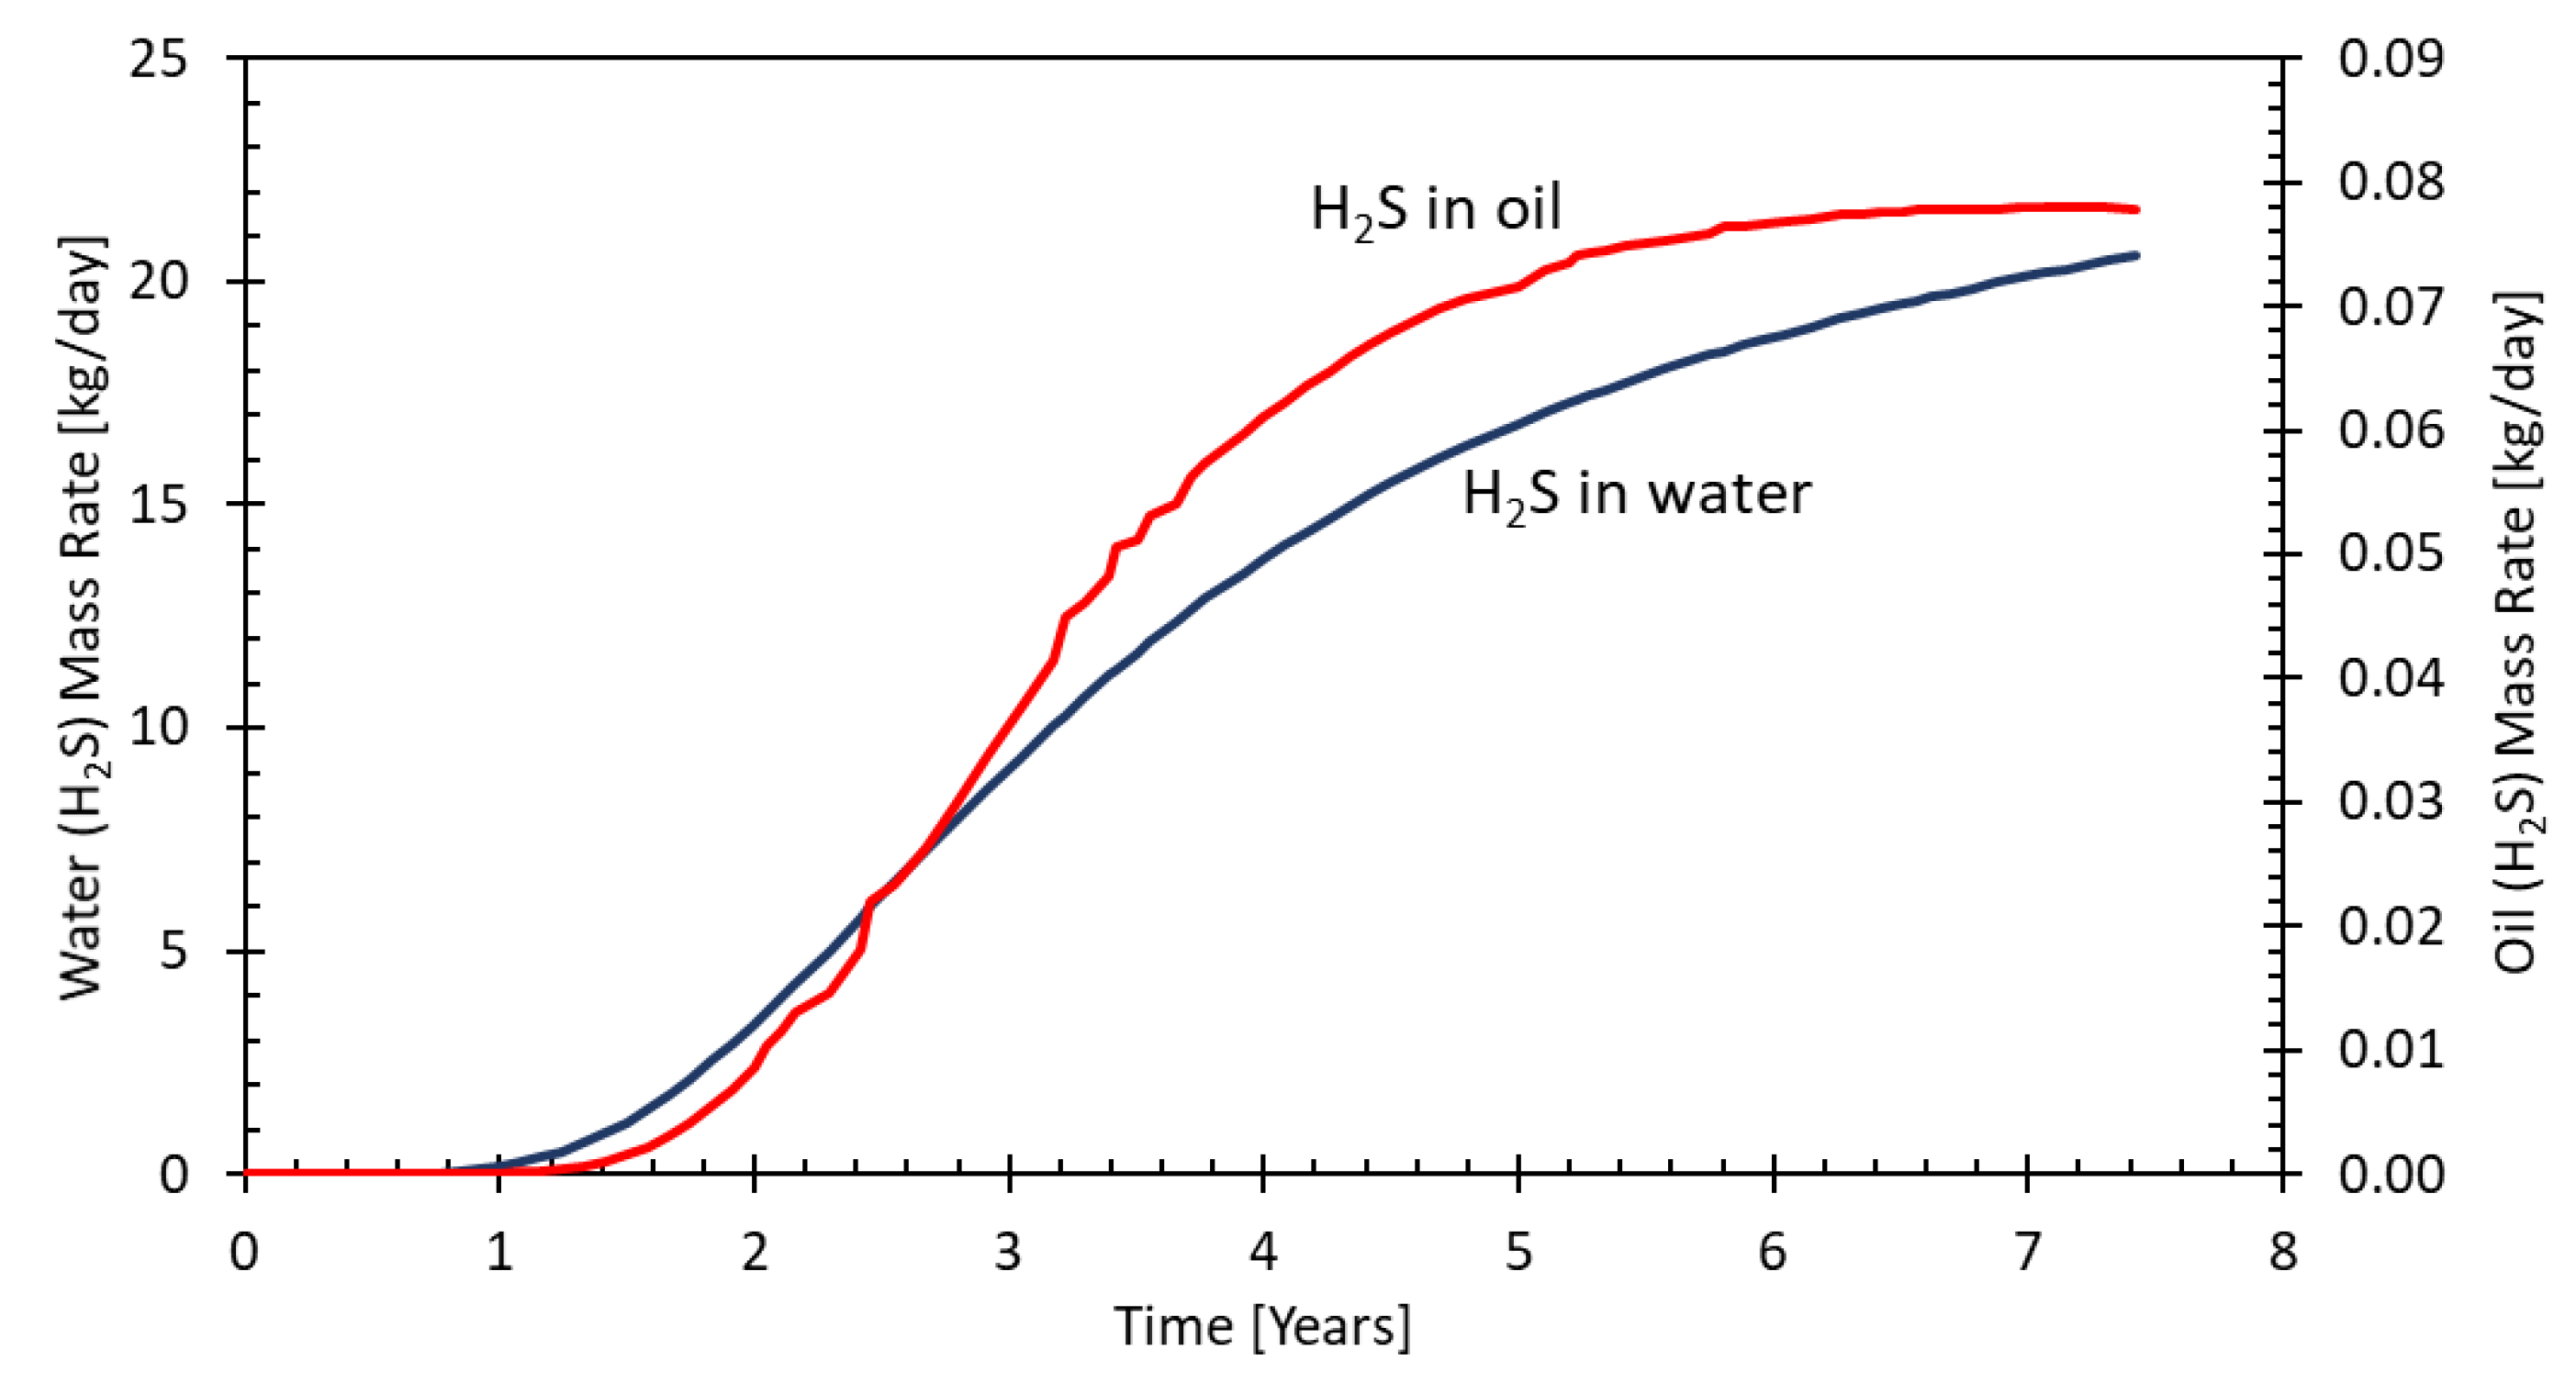
Figure 11.
H2S distribution (mol fraction in oil) in the layer 4 of the model (Case 2: MEOR) at the end of the simulation time (8th year). (a) no retention case, (b) with very low retention of H2S (0.001 mg/g), (c) low retention case (0.01 mg/g) (d) most realistic case based on the siderite content of the reservoir mineralogy (0.1 mg/g). Legend unit: mg H2S/g rock.
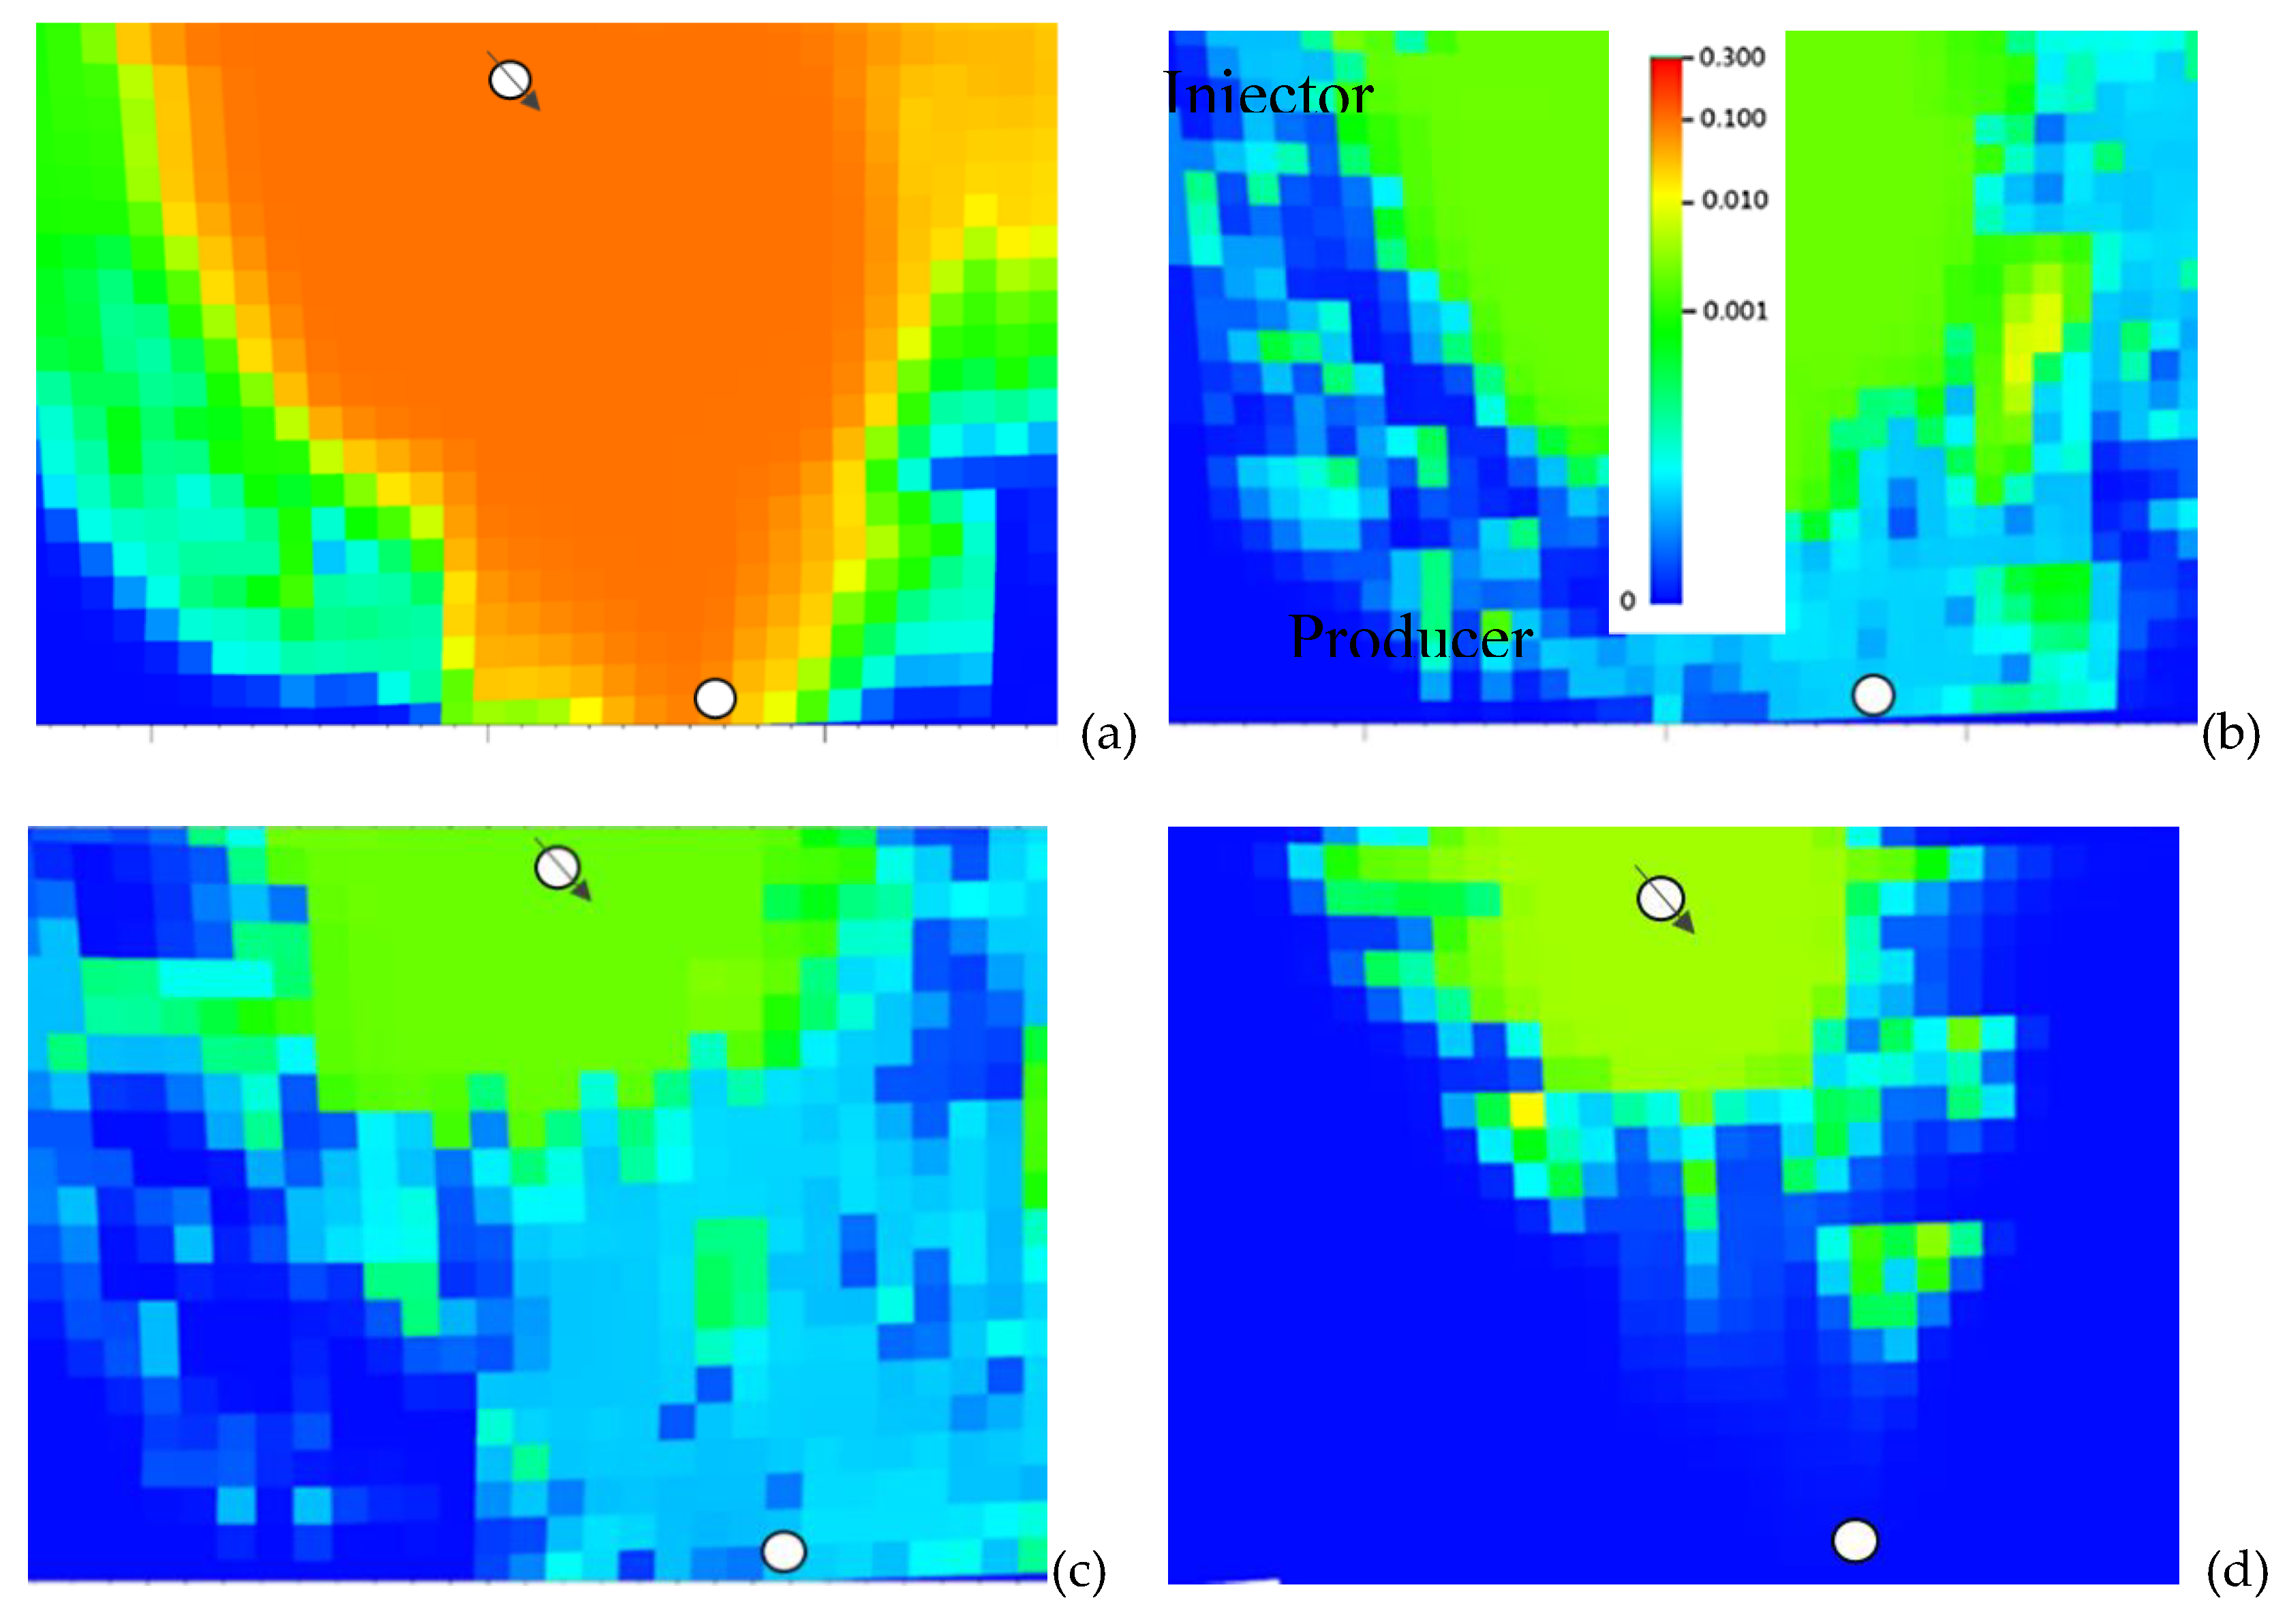
Figure 12.
Probabilistic estimation of the total H2S production (kg) in oil production (low retention case) from the well P-1 calculated with Monte Carlo method in MEOR case study.
Figure 12.
Probabilistic estimation of the total H2S production (kg) in oil production (low retention case) from the well P-1 calculated with Monte Carlo method in MEOR case study.
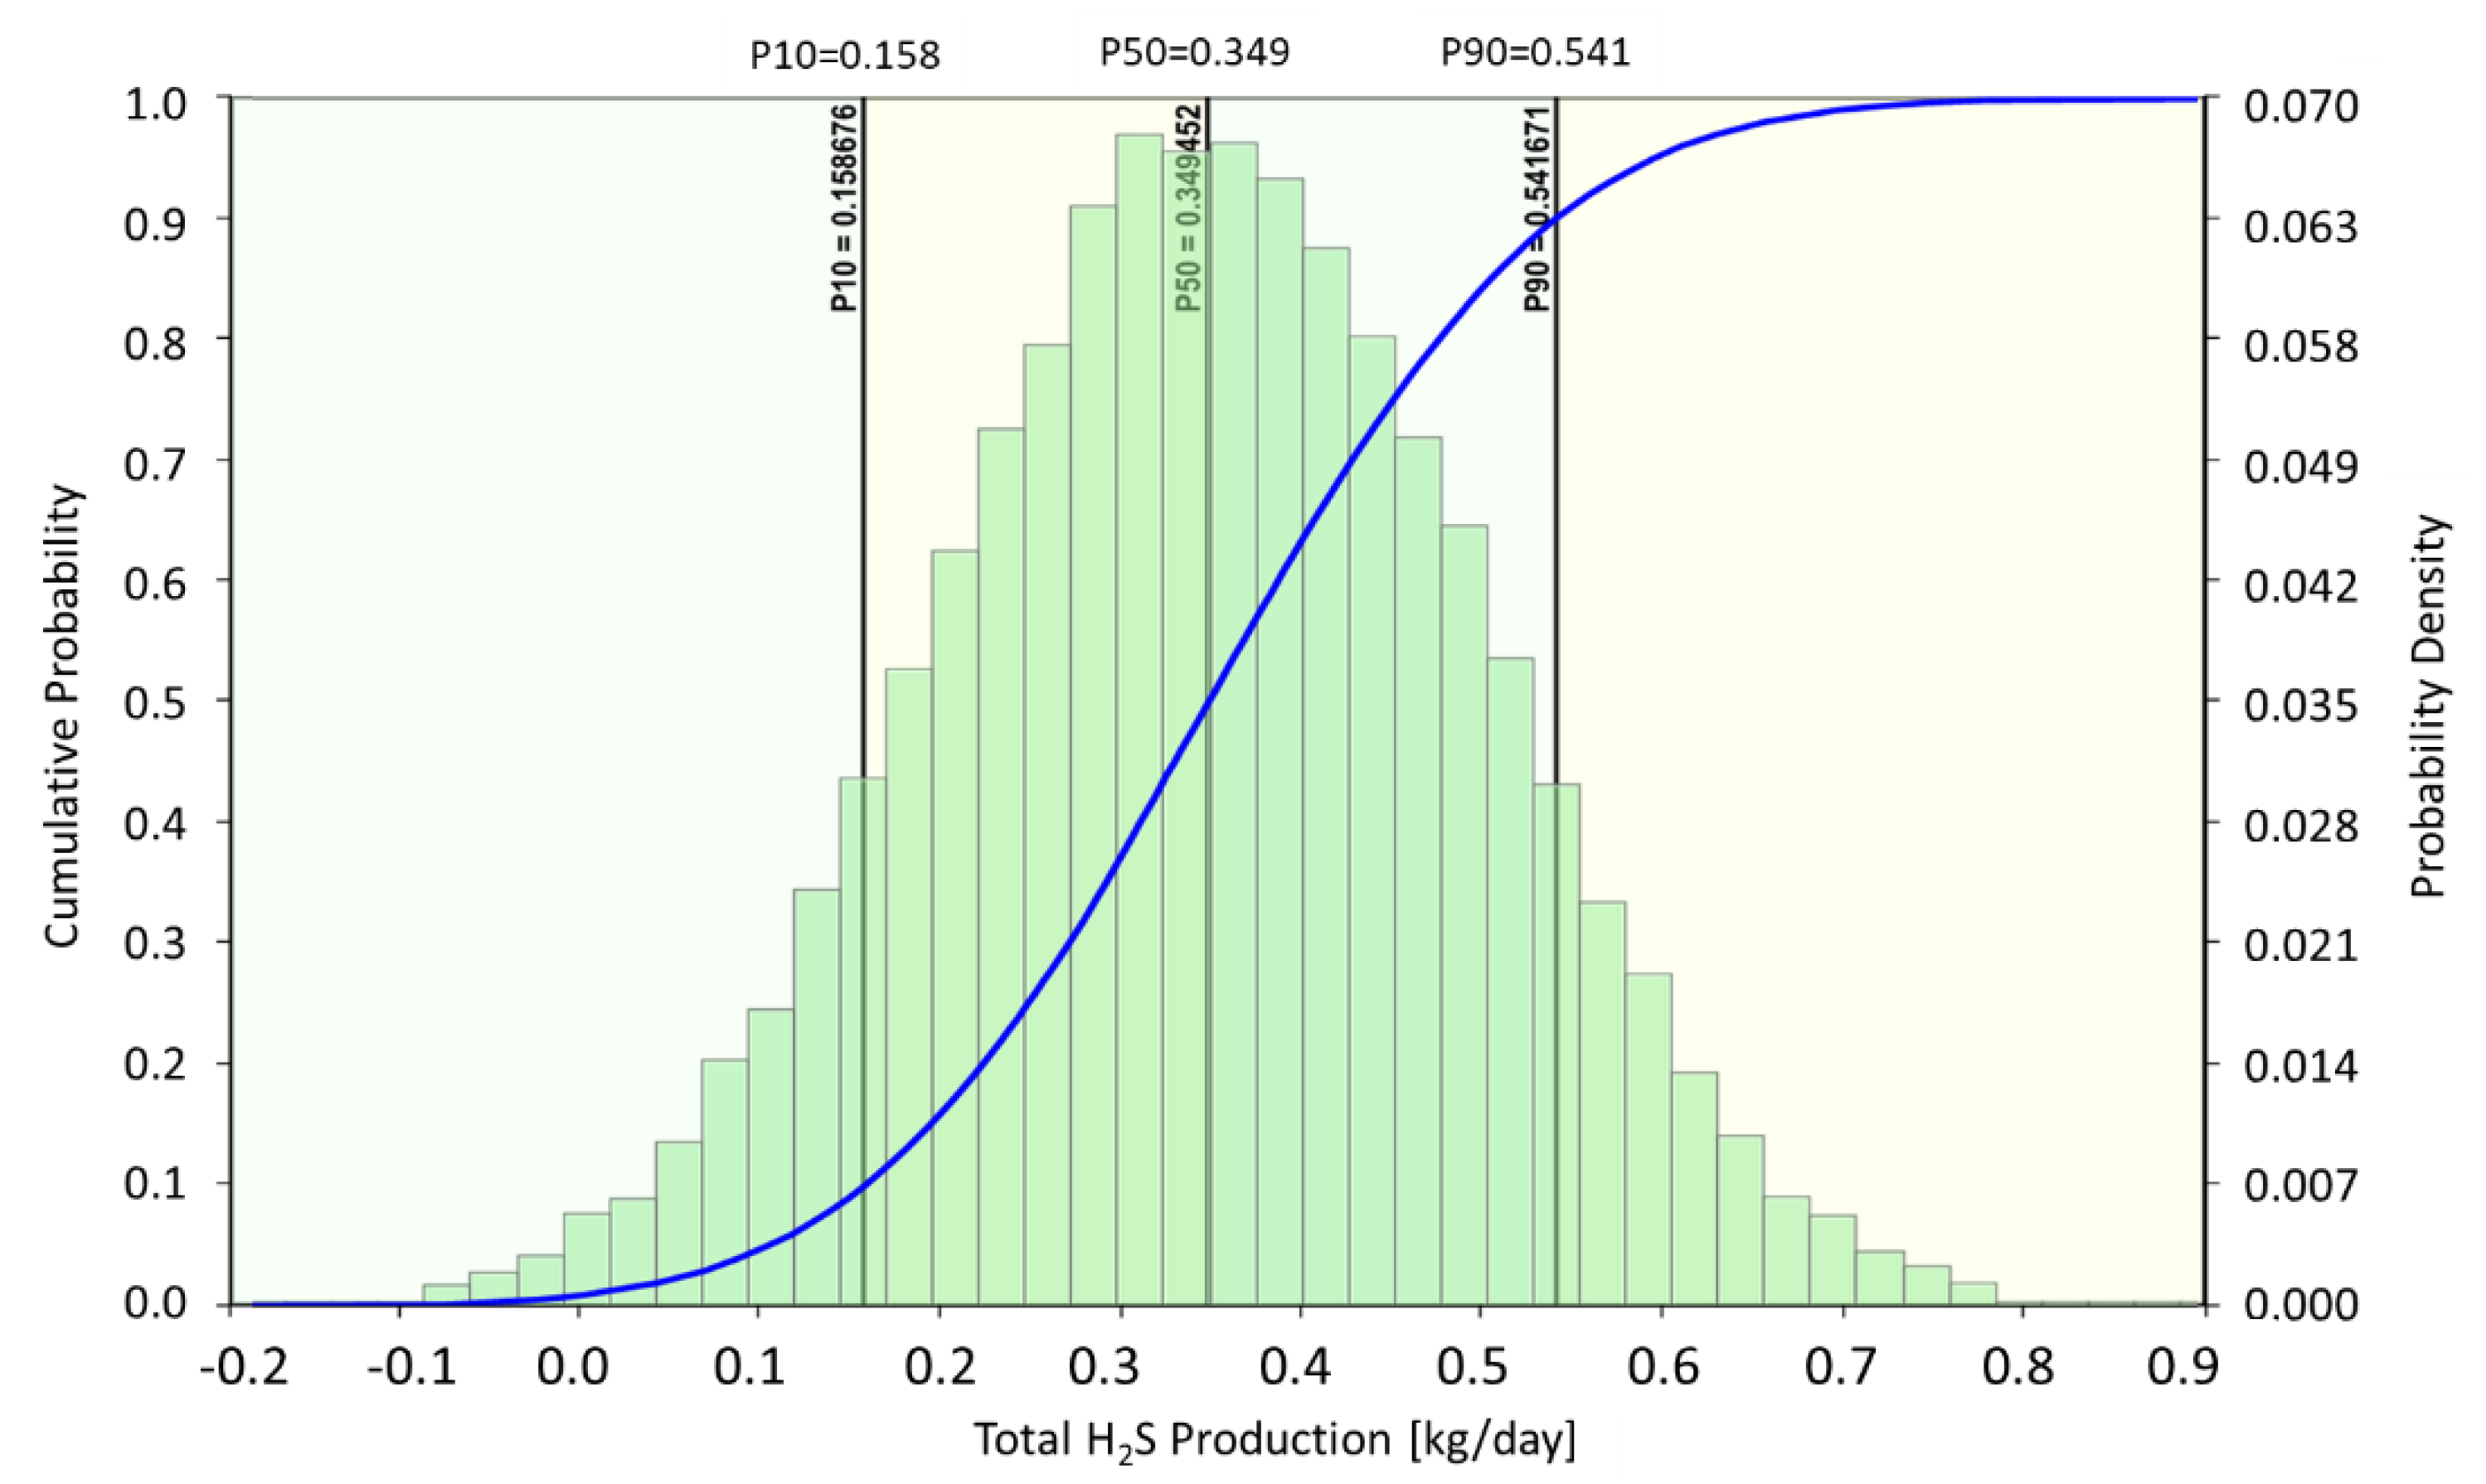
Figure 13.
Effect of nitrate (brown, +NO3-, 100 mM) and molybdate (green, +MoO42-, 0.5 mM) on sulfate consumption (continuous lines) and H2S formation (dashed lines), for the field studied. No inhibition case (blue, No) is also shown as comparison. The experiments are performed as batch and H2S concentrations are measured at the head space. Reproduced with permission from [27].
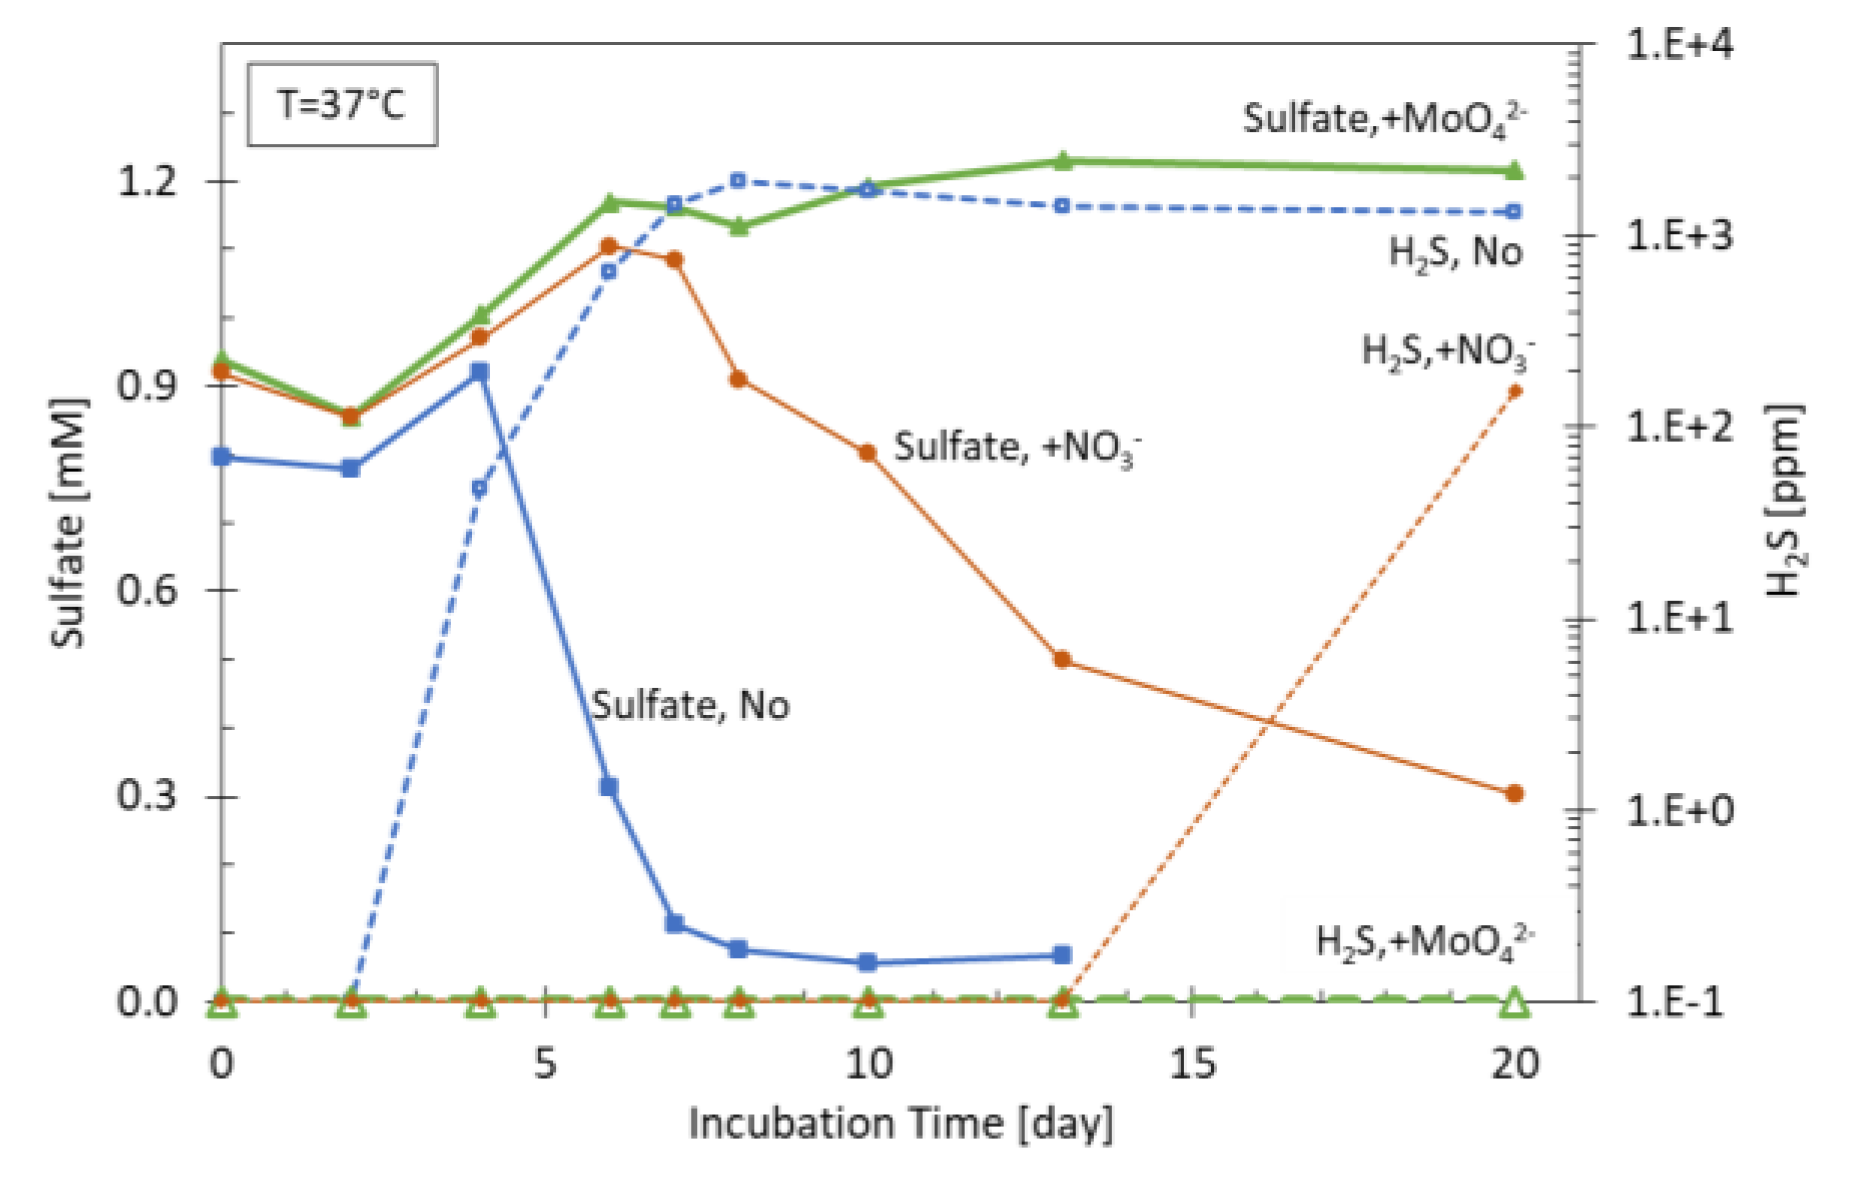
Table 1.
Data on mineral scavenging of H2S from the available references.
| Type of evaluation | Rock type | H2S retention [mg/g] | Reference |
| Dynamic | Cores from various reservoirs, k=5,200 mD | 0.014 | [48] |
| Dynamic | Cores from various reservoirs, k=0.4 mD | 0.0196 | [48] |
| Dynamic | Cores from various reservoirs, k=8,200 mD | 0.55 | [48] |
| Dynamic | Cores from various reservoirs, k=740 mD | 1.95 | [48] |
| Static | Crushed cores with siderite content (<814 mm) | 0.24 | [49] |
| Dynamic | Cores with siderite content; from the available data | 0.003 | [49] |
| Static | Crushed rock (100-315 mm) with 20% wt siderite | 0.5 - 3.7 | [47] |
| Static | Crushed rock (<100 mm) with 20% wt siderite | 2.08 - 9.70 | [47] |
| Dynamic | Sand packs filled with sand with 4% wt siderite | 1.03 - 1.74 | [47] |
| Dynamic | Sand packs filled with formation rock with 10% wt. siderite | 0.14 | [27] |
| Theoretical | Based on stoichiometry for 1% wt siderite content | 0.34 | This study |
Table 2.
Overview of controlling parameters of biogenic souring and their influences.
| Parameter | Range, influence |
| Solubility H2S | Higher in oil than in water; higher in complex oil compositions containing asphaltenes, aromatics, lower in brines with increasing salinities |
| Partitioning, Kow, Kog, Kwg | Depending on the H2S solubility in oil and water phases, salinity, temperature, pressure, pH |
| pH | Over reservoir typical ranges, not relevant for the activation of SRB in oil reservoirs. The higher the pH, the higher the solubility in water, thus lower the Kow |
| Water chemistry | Divalent cations in the formation water may precipitate with both sulfate (Ba2+, Sr2+ , Ca2+) and sulfide (Fe2+, Zn2+), acting as scavengers |
| Rock mineralogy | The presence of iron-bearing minerals is crucial for the in-situ retention of H2S by precipitation |
| Temperature | Most SRB are not active at temperatures higher than 80°C |
| Pressure | Not relevant effect on SRB activity for most common pressures in oilfields, therefore no relevant effect on H2S generation |
| Sulfate | One of the main components of biogenic souring, concentration has a strong impact on the possible H2S concentration generated |
| Salinity | Certain SRB species live in higher salinity brines up to ca. 180 g/L; H2S solubility in water decreases as the salinity increases (salting-out effect) |
| Presence of SRB | If no indigenous SRB exist in the reservoir no biogenic souring is expected - however SRB can be introduced with injection water |
| Permeability | Low permeability, small pore radius limits the transport of microbes therefore their planktonic movement; no relevant effect on H2S transport once generated |
| Heterogeneity | Important for the transport of SRB and H2S; if high, less retention in the reservoir and rapid breakthrough of H2S to the producers can be expected |
| Carbon sources | Completes the souring reaction; VFA can be an important source; oil components may also be a nutrient source for SRB |
Table 3.
List of the relevant studies on the numerical modelling of biogenic souring.
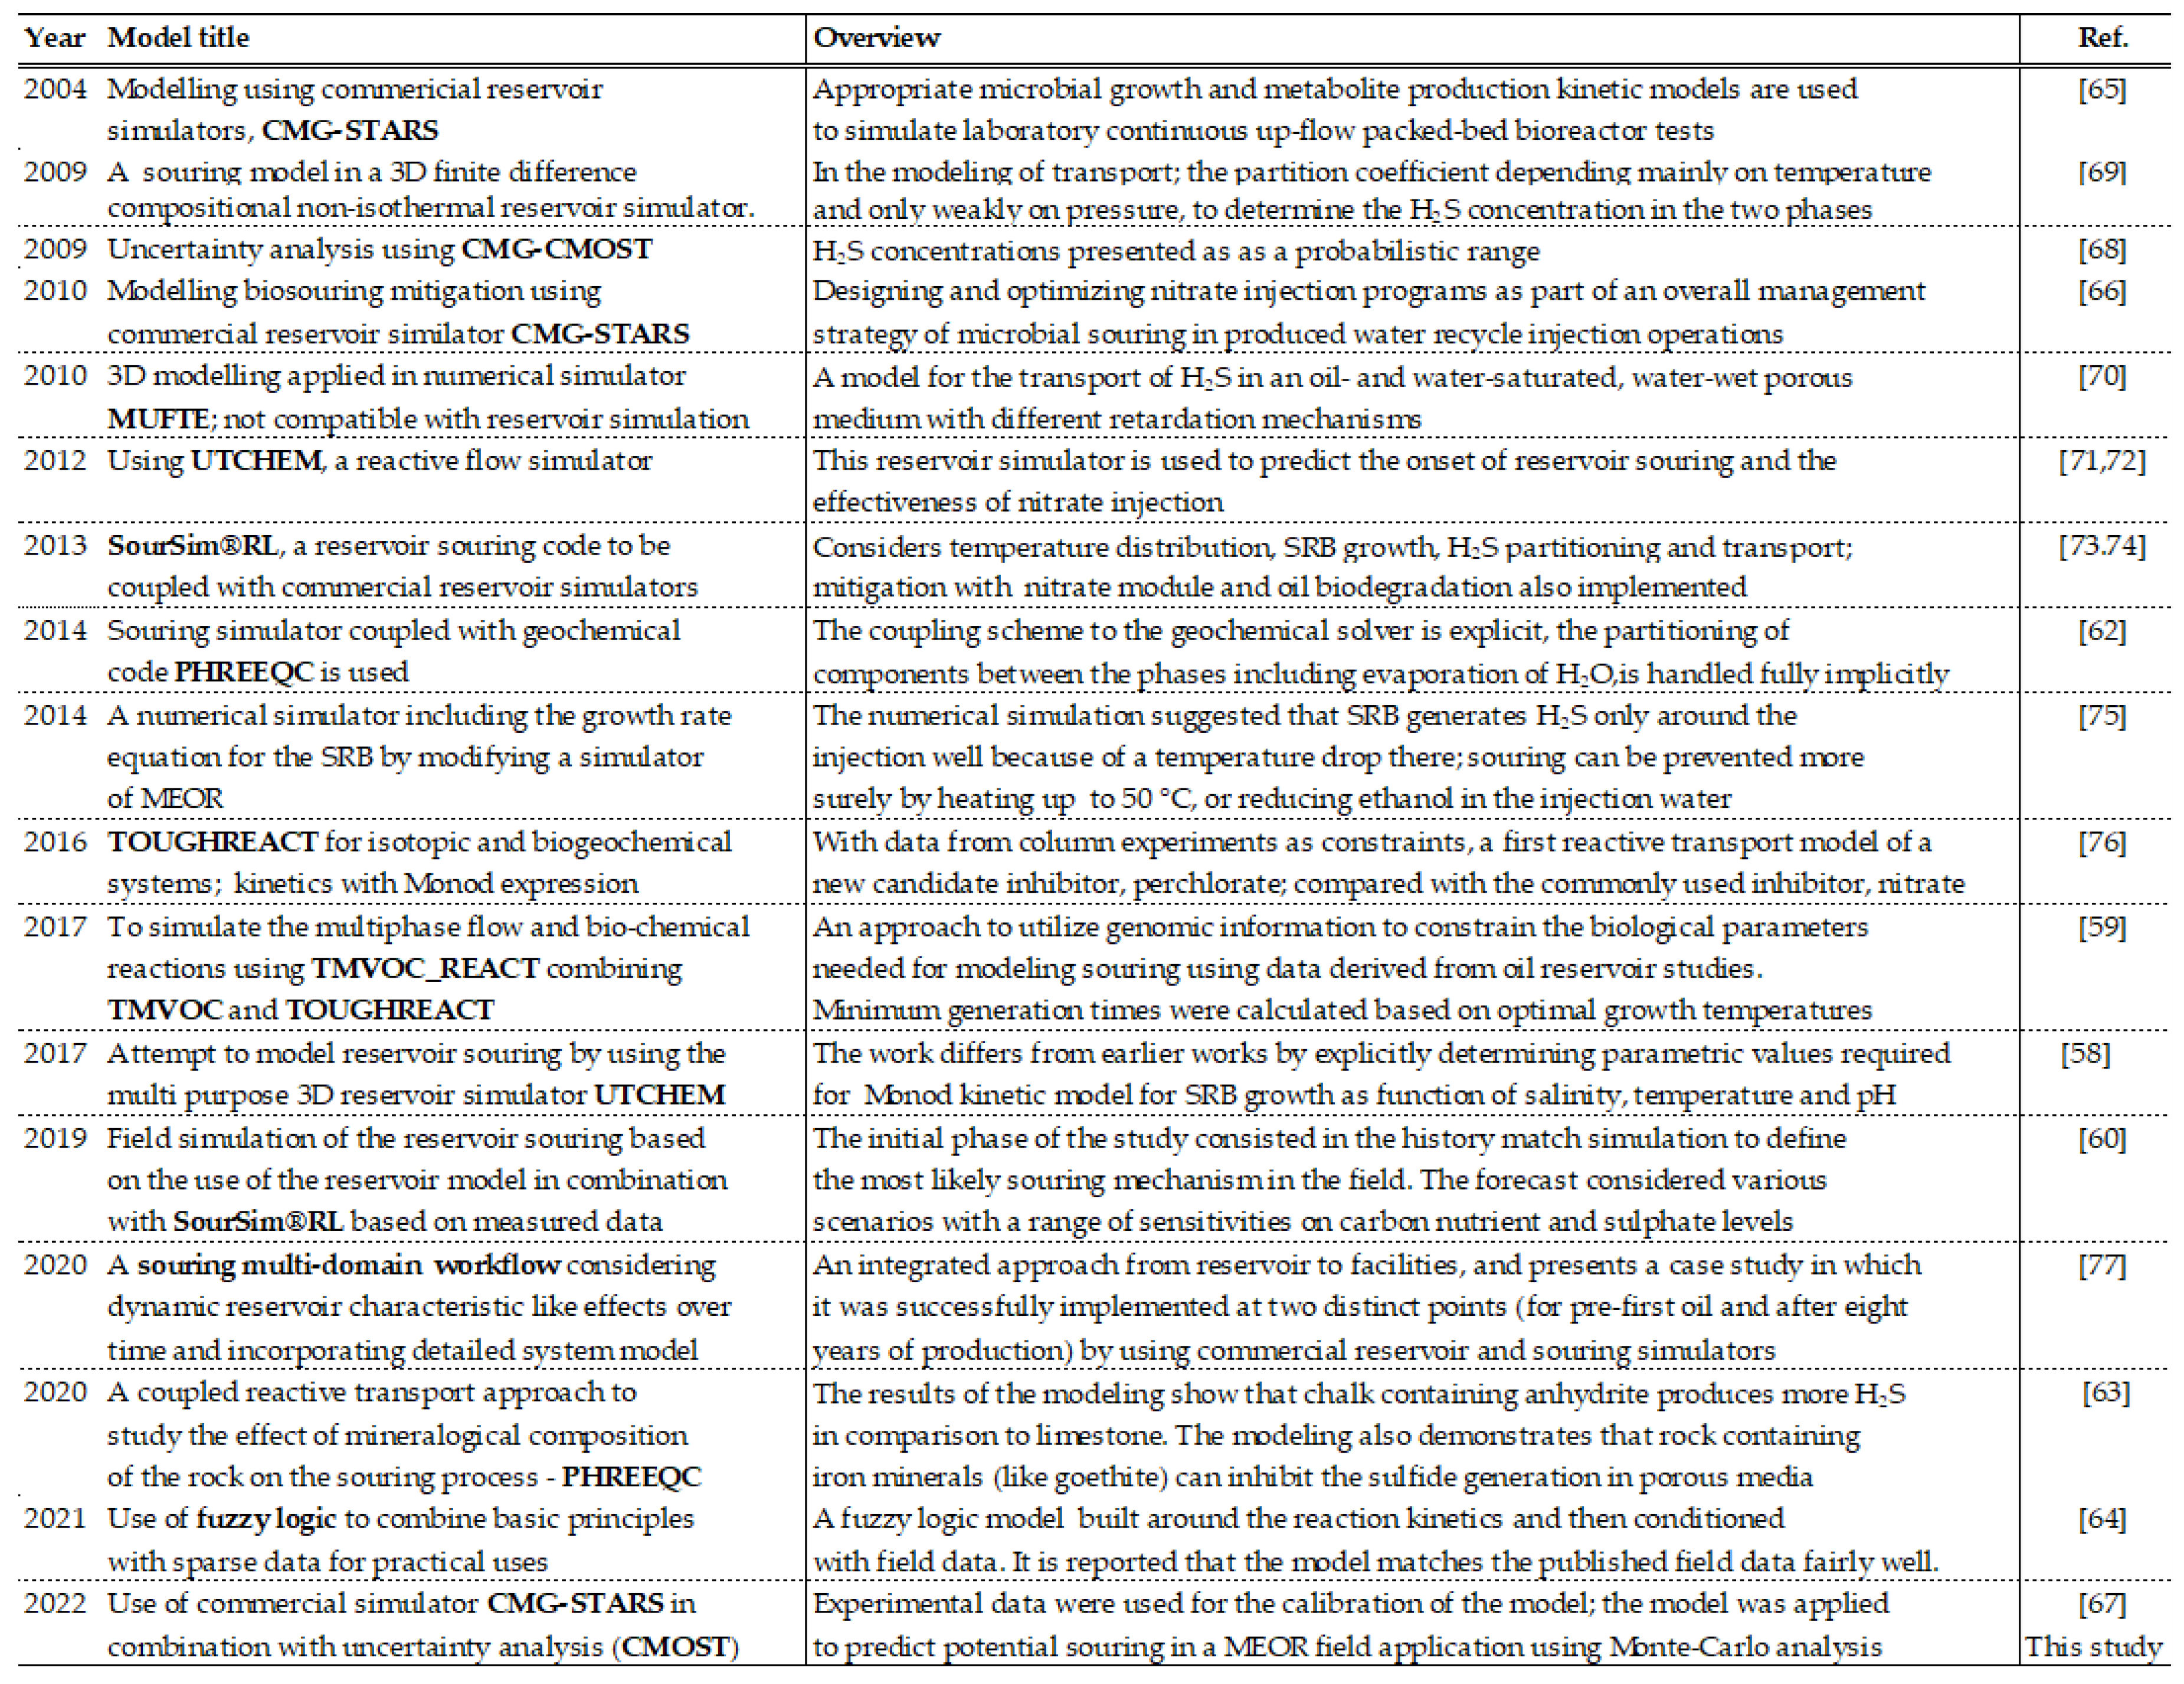
Table 4.
List of the experiments and analyses that can support reservoir modelling studies.
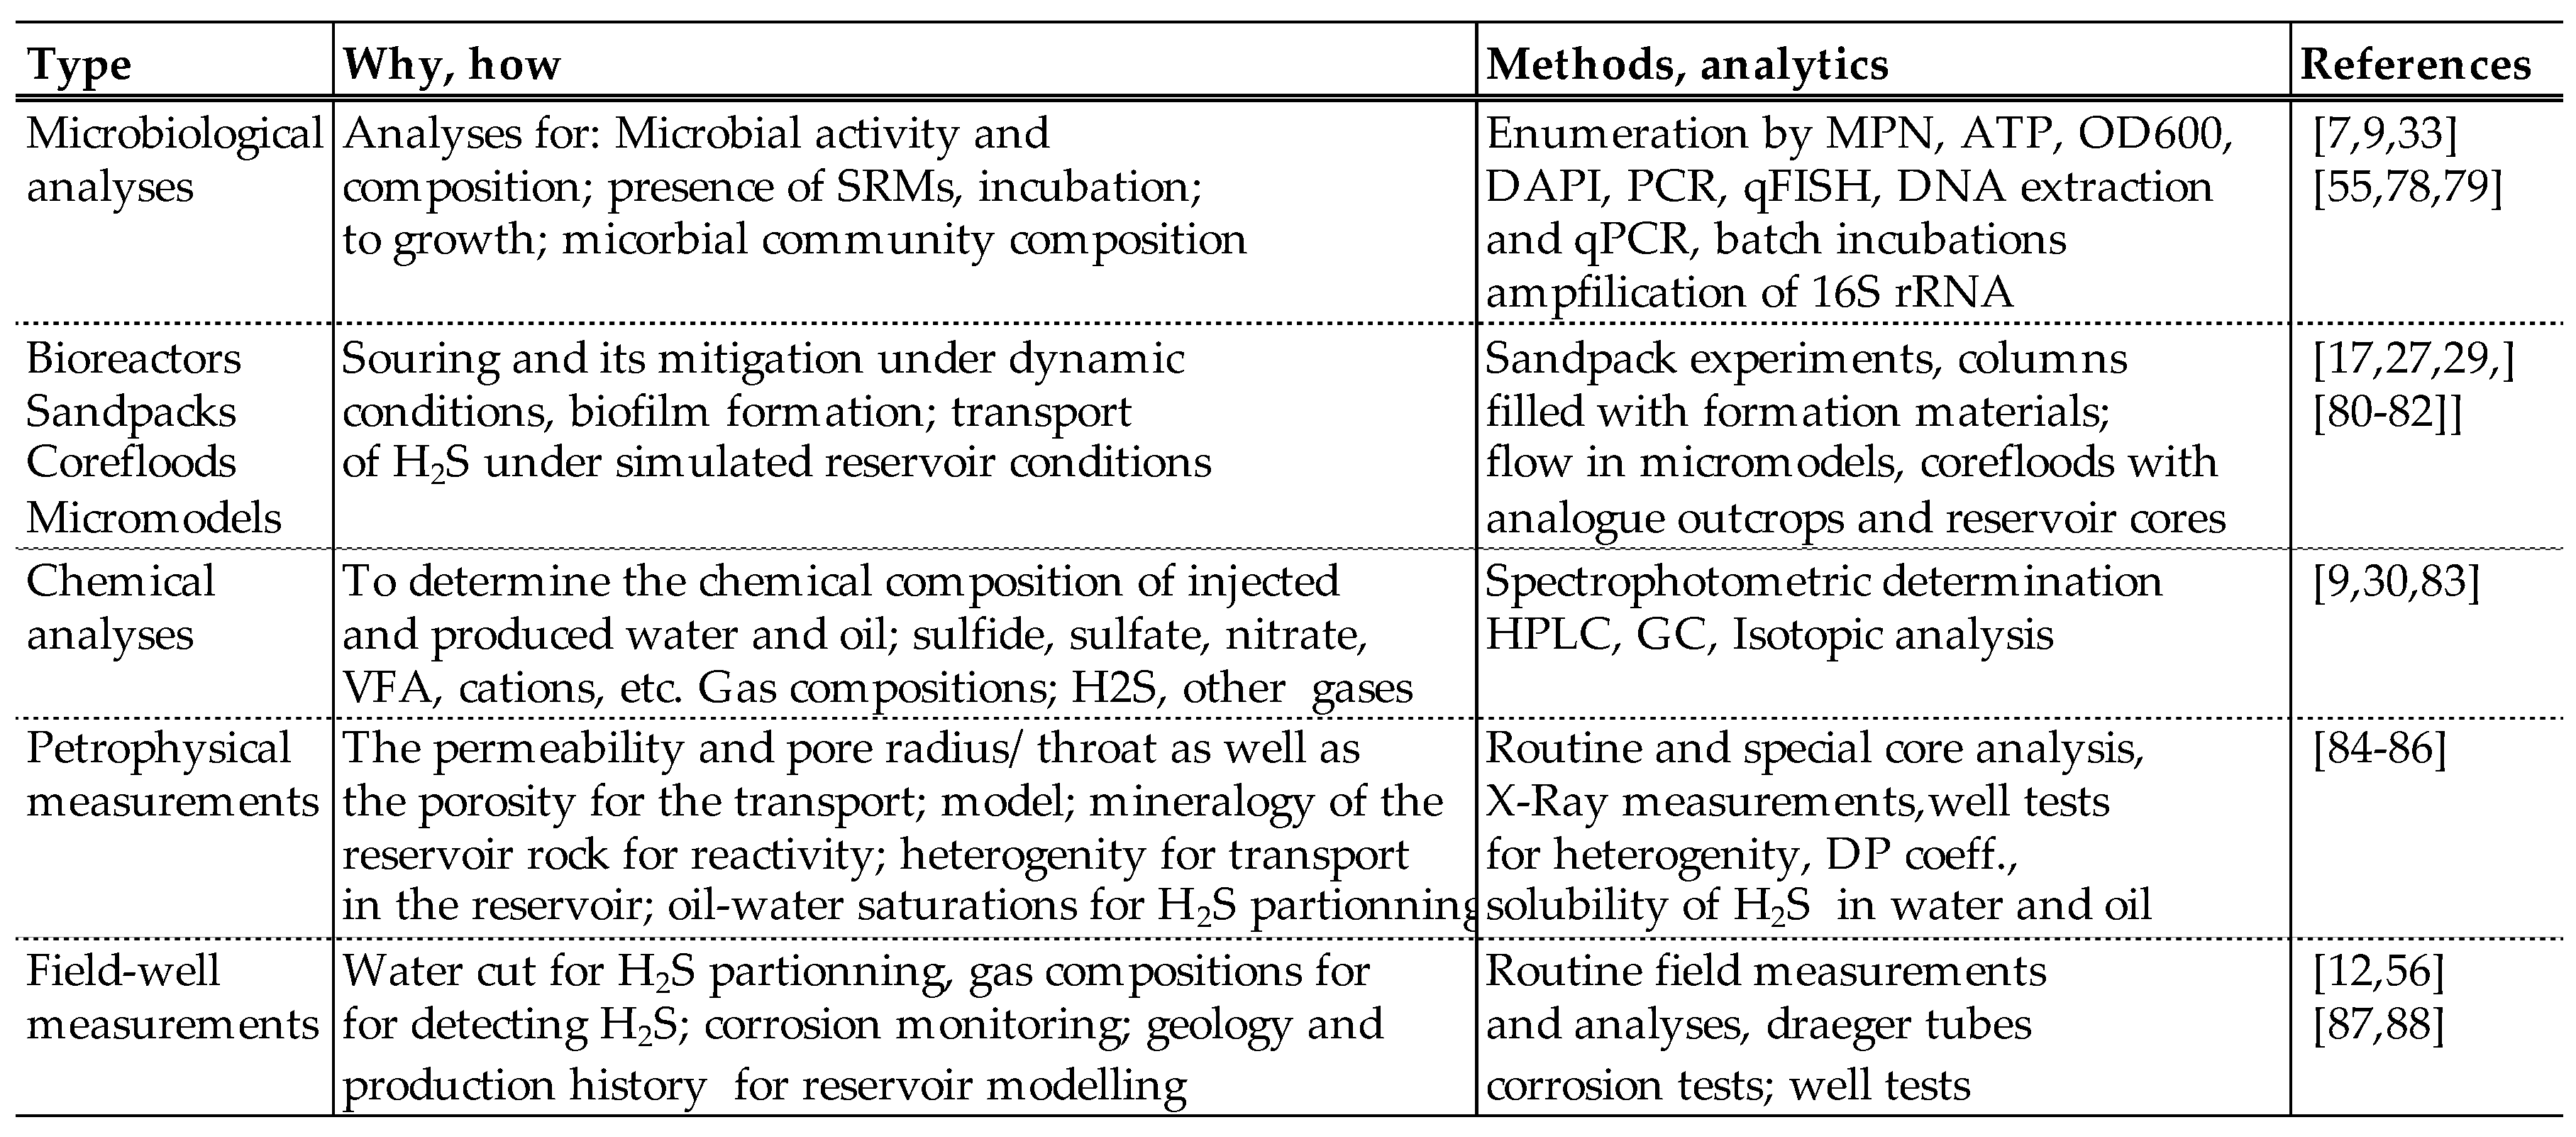
Table 5.
Properties of the field studied (Case 2) for biogenic souring
| Property | Data |
| Formation salinity | Injection water: highly saline, up to 160 g/L, sulfate content around 70 mg/L. Produced water: highly saline up to 180 g/L, no detectable sulfate |
| Formation rock mineralogy | Sandstone with siderite content of 2-10% wt. |
| SRB | Microbiological analysis of the samples from the field confirmed the presence of Desulfovibrionales (Desulfohalobiaceae) in produced water as well as in injection water; the field is under PWRI |
| Organic acids, VFA | Organic acids (e.g., acetate, lactate, formate) are products of the MEOR process. Their amount is high enough for complete reduction of the available sulfate by SRB |
| Pressure | 30-70 bar under reservoir conditions; no detrimental effect on the SRB |
| Temperature | Injection water, calculated at bottom hole 20-25°C during injection, reservoir temperature between 37° and 41°C. Since SRB are present in the reservoir already, they can be active in a range valid for the reservoir studied |
| pH | Formation water pH~6.5, VFA due to MEOR can reduce the pH down to 5 (not considering pH-buffering effects of the formation rock); pH is in the range still allowing the activity of SRB |
| Permeability | Average permeability and the pore diameter are kavr 300 mD and 20 m successively. This is high enough for the free movement of the SRB throughout the reservoir. On the other hand, the reservoir is highly heterogeneous |
| Injection rate | 150 m3/day, including a defined concentration of nutrients for in-situ MEOR |
| Partitioning coefficient | Based on high salinity formation water and with the assumption of a pH of 6, Kow is taken as 30 in the base case |
Table 6.
General characteristics of the sector model used in the study.
| GRID | CORNER POINT |
|---|---|
| Number of cells | 36(x)*31(y)*16(z) |
| Cell size Refinement |
50 x 50 x 1.3 m 10 x 10 x 1.3 |
| Porosity | 0.018 - 0.291 |
| Permeability | 1 – 6130 mD (5 rock types) |
Table 8.
Workflow for the assessment of biogenic reservoir souring.
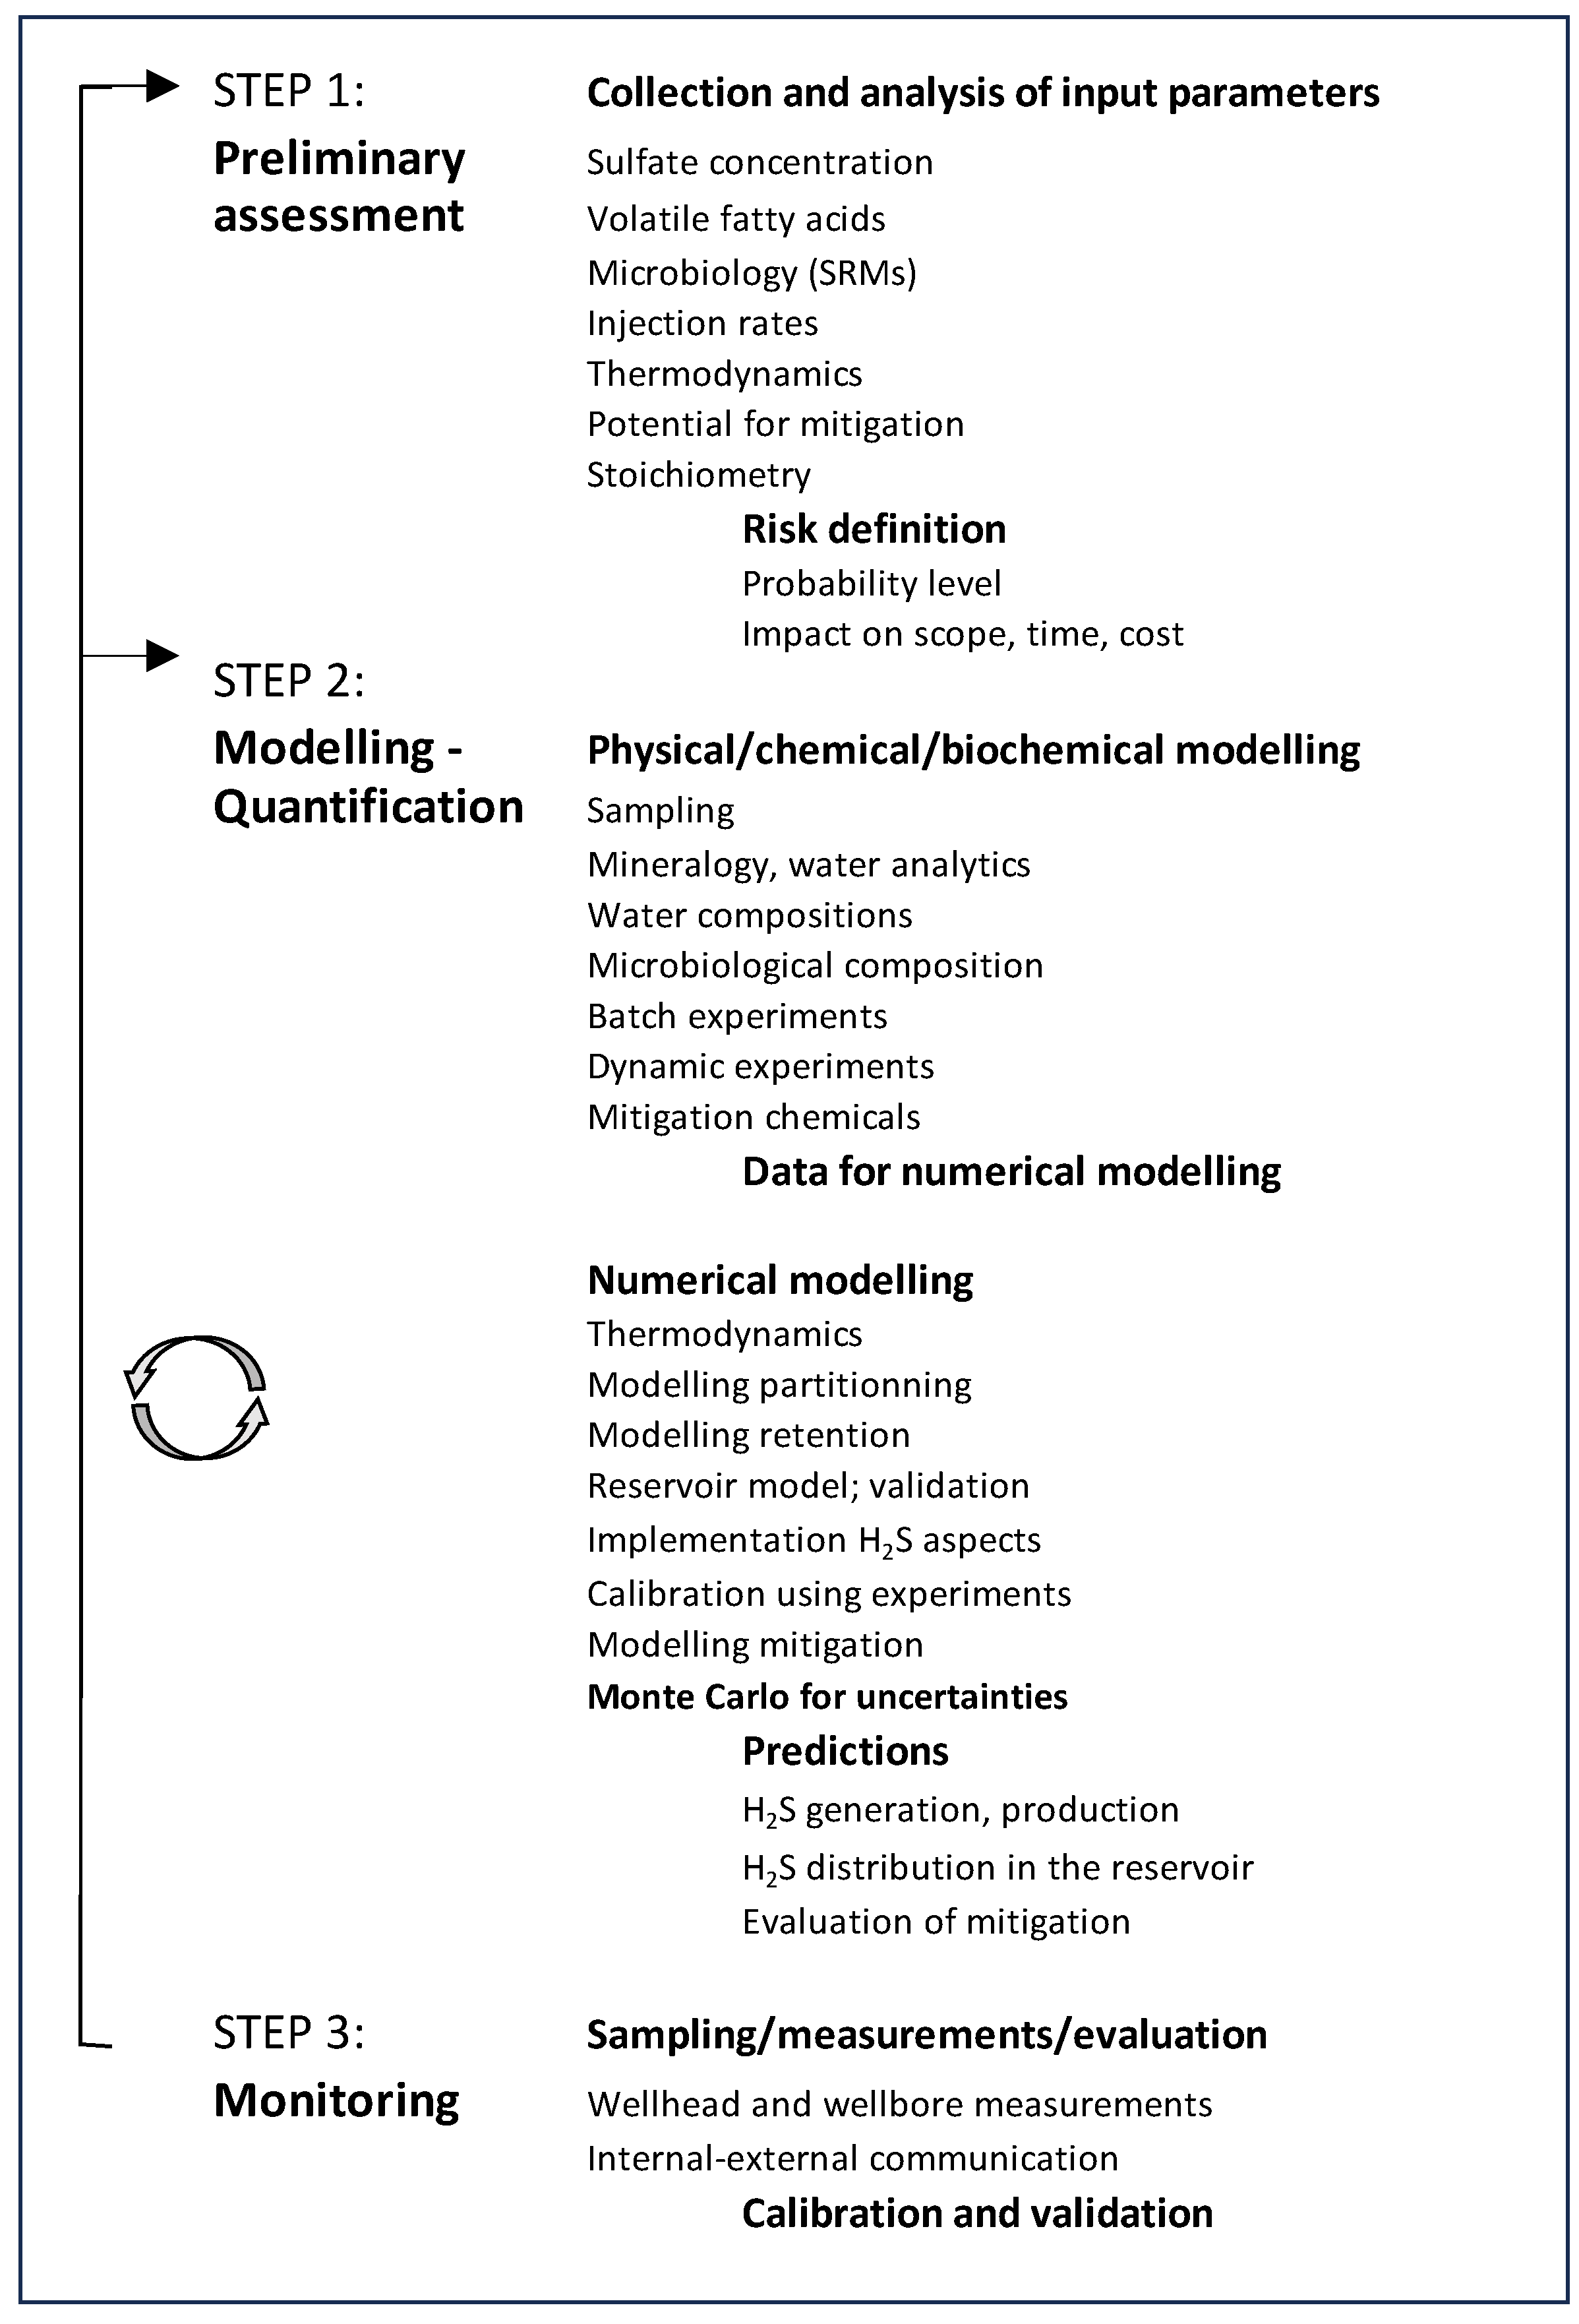
Disclaimer/Publisher’s Note: The statements, opinions and data contained in all publications are solely those of the individual author(s) and contributor(s) and not of MDPI and/or the editor(s). MDPI and/or the editor(s) disclaim responsibility for any injury to people or property resulting from any ideas, methods, instructions or products referred to in the content. |
© 2024 by the authors. Licensee MDPI, Basel, Switzerland. This article is an open access article distributed under the terms and conditions of the Creative Commons Attribution (CC BY) license (http://creativecommons.org/licenses/by/4.0/).
Copyright: This open access article is published under a Creative Commons CC BY 4.0 license, which permit the free download, distribution, and reuse, provided that the author and preprint are cited in any reuse.


