
Submitted:
15 December 2025
Posted:
17 December 2025
You are already at the latest version
Abstract
The Overseer model is widely used in New Zealand for estimating nitrate (NO₃⁻) leaching losses in agricultural systems. This study evaluated the accuracy of the Over-seer model in simulating nitrate (NO₃⁻) leaching through a two-year lysimeter experi-ment conducted at Woodhaven Gardens, New Zealand, under beetroot and pak choi cultivation. Seven distinct nitrogen (N) fertiliser treatments were applied to assess model performance. In Year 1, Overseer overestimated NO₃⁻ leaching by an average of 45.2 kg N/ha (15.7%), due to underestimated crop uptake. Similarly, overestimations were observed in Year 2, with overprediction rates reaching up to 63.5%. Sensitivity analysis highlighted soil texture, impeded layer depth and crop residue incorporation as key drivers of leaching variability, underscoring the need for improved model cali-bration. Overseer performed reasonably well under lysimeter conditions, with a strong linear relationship (Pearson’s correlation coefficient r = 0.89, P < 0.0001) between measured and predicted values and explaining 77% of the variance (R2=0.77) in the observed data. The model predicted a baseline leaching loss of 39.4 kg N/ha/year even when measured losses were zero. Overseer demonstrates moderate reliability in simulating NO₃⁻ leaching under vegetable cropping systems but exhibits notable limi-tations in handling crop-specific N dynamics, soil hydrology, and fertiliser timing.
Keywords:
controlled release fertiliser
; leaching
; lysimeter
; overseer
; nitrate
1. Introduction
Vegetable cropping systems in New Zealand are recognised as a significant source of nitrate (NO3−) leaching, largely due to the high nitrogen (N) fertiliser inputs and rapid mineralisation of crop residues. These practices often leave substantial amounts of mineral N in the soil, which are susceptible to leaching during periods of high rainfall, posing risks to groundwater quality [1]. In recent decades, increasing awareness of NO3− leaching from intensive cropping systems has prompted growers to adopt more sustainable nutrient management practices. This shift is driven by both economic imperatives, such as input efficiency and environmental concerns, particularly the protection of groundwater and surface water quality. Accurate quantification of NO3− leaching losses remains a significant challenge due to the complex and dynamic nature of N transformations within the soil–plant–water–atmosphere continuum. These transformations are influenced by soil type, climate variability, crop species, and management practices, making direct measurement both costly and impractical at scale. As a result, simulation models have emerged as essential tools for estimating nutrient losses and informing precision agriculture strategies [2,3].
Among these tools, the Overseer model, developed by AgResearch in New Zealand, has gained widespread use as a decision-support and regulatory instrument. Overseer estimates long-term average nutrient flows and losses from agricultural systems, including nitrate leaching, phosphorus runoff, and greenhouse gas emissions [4,5]. Its strength lies in its calibration to New Zealand conditions, underpinned by decades of empirical data from pastoral systems. The model’s nutrient budget framework enables users to simulate farm-specific scenarios and evaluate the environmental impact of different management strategies. Recent evaluations have reinforced Overseer’s utility in estimating N losses under pastoral systems, while also highlighting the challenges of extending its application to cropping systems. Overseer’s N leaching estimates from grazed pastures showed strong correlation with experimental data, though performance varied across cropping scenarios due to limited calibration datasets [6]. Studies emphasised the importance of refining N leaching estimates for greenhouse gas inventories, noting that model outputs must be interpreted with caution when applied to non-pastoral land uses [7]. These findings underscore the need for ongoing validation and scenario-based testing to ensure robust predictions across diverse farming systems. Furthermore, the model’s modular structure and integration of climate, soil, and management inputs make it a valuable tool for scenario analysis and policy development in nutrient management [8].
While Overseer’s pastoral module is well validated, its cropping module has undergone recent updates to accommodate a broader range of plant types, including deeper-rooted species and vegetable crops [9]. These enhancements aim to improve the model’s sensitivity to soil depth, climate inputs, and fertiliser regimes. Recent studies have highlighted the importance of validating simulation outputs against empirical data to model reliability in diverse cropping contexts. For example, nitrate-N leaching losses quantified under intensive vegetable rotations in the Lower North Island reveals substantial leaching during fallow periods and under excessive fertiliser regimes [10]. Their findings underscore the need for calibrated models that reflect site-specific dynamics and fertiliser practices.
Refined leaching estimates are crucial in improving national greenhouse gas inventories and nutrient loss assessments, particularly for cropping systems that deviate from pastoral systems [7]. These insights align with broader efforts to enhance N use efficiency and reduce diffuse pollution from agriculture [11]. Therefore, this study aimed to investigate the application of the Overseer cropping module as a precision agriculture tool for estimating nitrate leaching losses in commercial vegetable systems. Specifically, it evaluates the model’s predictive accuracy under varying fertiliser management scenarios by comparing simulated outputs with empirical data from lysimeter trials. Such validation is critical for building confidence in the model’s use beyond pastoral systems and for supporting growers in meeting regulatory requirements and sustainability goals.
2. Materials and Methods
2.1. Site Description and Soil
A lysimeter experiment was conducted at Woodhaven Gardens in Levin, New Zealand, an area with an average annual rainfall of 1181 mm and temperatures ranging from 6.5 °C to 21 °C. The soil profile shows textural variation from loamy to clay loam within the top 60 cm (Table S1). Total carbon and N percentages were highest in the upper 20 cm, with available N content between 8.4 and 53.6 kg N/ha. Bulk density ranged from 1.11 to 1.64 g/cm3. The upper 20 cm had good hydraulic conductivity, while a flow barrier at 50 cm had very low conductivity ranging from 0.3 mm/h to negligible levels. The agricultural land in this region supports intensive vegetable production, such as beetroot, pak choi, lettuce, broccoli, cabbage, and onion.
2.2. Lysimeter Design, and Arrangement
The lysimeters were constructed using plastic bins with a depth of 60 cm and an internal diameter of 40 cm. Installation followed the protocol and methodology described by [12]. In summary, the constructed lysimeters were placed into a prepared field trench, and the soil within each lysimeter was refilled to match the surrounding field’s surface level. The area outside each lysimeter was backfilled with soil to ensure uniformity with the surrounding field surface (Figure S1). The physical and chemical properties of the soil at the trial site were analysed in five replicates to a depth of 60 cm prior to the installation of the lysimeters (Table S1).
2.3. Experimental Design, Planting, and N Fertiliser Treatments
The experiment was conducted using a randomized complete block design (RCBD) with seven N fertiliser treatments in five replicates, resulting in a total of 35 lysimeters (Figure S2). Basal application of 300 kg/ha of Nitrophoska Blue (12% N) was applied to each lysimeter (excluding the control) prior to the application of mineral N fertilisers. Beetroot (Beta vulgaris) seeds were sown as the first trial crop, and after thinning, five plants per lysimeter were maintained for growth. Nitrogen fertiliser treatments in year 1 included water-soluble Calcium Ammonium Nitrate (CAN, 27% N) and N-Control 75 (44% N), applied at varying rates to establish seven treatment groups, as detailed in Table 1. The N application rates of 81 kg N/ha (equivalent to 300 kg/ha of CAN) and 79.2 kg N/ha (equivalent to 180 kg/ha of N-Control 75) reflected the standard grower practices for beetroot cultivation at Woodhaven Gardens. An intensive application rate of 162 kg N/ha was also tested using CAN. The planned harvest at 12 weeks after planting was not conducted due to corona virus lockdown. As a result, all beetroots harvested from the lysimeters exceeded acceptable size and weight specifications and were determined to be unrepresentative of marketable produce. Consequently, the entire field harvest was incorporated back into the soil by the grower. To maintain consistency with the field’s crop and soil management practices, the beetroots harvested from the lysimeters were also incorporated into the soil.
In the 2nd year, pak choi (Brassica rapa var. chinensis) was sown as the second trial crop on the lysimeters. The N fertiliser treatments used in year 2 were water-soluble Calcium Ammonium Nitrate (CAN) and N-Control 75 (CRF) at different application rates to formulate seven treatments (Table 1). The treatment rates of 180 kg/ha of CAN and 110.45 kg/ha of CRF were selected based on the growers’ regular practice for pak choi at Woodhaven Gardens. The application rate of 360 kg/ha of CAN represents an intensive application rate. Pak choi plants meeting marketable standards were harvested from the lysimeters. Following the harvest, Italian ryegrass (Lolium multiflorum) seeds were sown as a fallow cover crop in the lysimeters.
2.4. Total Nitrogen Uptake Determination
Beetroot, pak choi and ryegrass plants from the lysimeters were sampled by removing all plants at harvest in both years. The total fresh weight of the harvested plant material was recorded in the field. Subsamples of approximately 150 g were taken for oven drying at 65 °C for a minimum of five days. Once dried, the samples were ground using a Foss Cyclotech mill (ThermoFisher Scientific) and passed through a 0.25 mm sieve. The total nitrogen (N) uptake by the plants was determined by digesting 0.1 g of subsample from each treatment using the micro-Kjeldahl digestion method. The total N concentration was then analysed using a Technicon Autoanalyser. The total N uptake of the plants was estimated as the product of dry matter yield and plant N concentration (%).
2.5. Measurement and Modelling of Nitrate Leaching Losses from the Lysimeters
Nitrate leaching losses were measured from lysimeter drainage in twelve sampling events in year 1 and eight events in year 2. Drainage water samples were collected after each significant rainfall event (greater than 20 mm). The samples were analysed for NO3−-N using a Technicon Autoanalyser, Series 2 [13]. The latest version of Overseer at the time of the experiments (Version 6.4.2) was utilized to estimate NO3− leaching losses. This model was chosen due to its calibration for various farming systems under New Zealand conditions. Additionally, Overseer calibrations have predominantly focused on NO3− leaching below the root zone (approximately 0.4 to 0.6 m), using lysimeters [14].
2.5.1. Overview of Overseer Model
It is an empirical model and readily available data from existing farms can be used to calculate nutrient budgets at a farm scale level [4,15]. Overseer consists of separate sub-models for pastoral, cropping and horticulture enterprises. The model calculates NO3− leaching losses as a difference between the sum of input and the sum of N in yield. It produces long-term annual averages, assuming constant inputs and production from year to year for a given site. The model requires climate inputs, soil characteristics, animal type (where relevant), crop type, and management aspects including fertiliser or irrigation inputs. It runs on a monthly time step using long term average climate rather than daily climate inputs, with crop yields pre-defined by the user and does not consider the losses of ammoniac or organic N from the field, limiting its focus to NO3− losses only. The relative NO3− leaching losses vary with soil group and soil drainage characteristics [9].
2.5.2. Input data requirements of the model for lysimeter simulations
(i) Soil data
Each simulation was based on 1ha of block with silt loam over clay, which was considered as well drained to resemble lysimeter conditions. Details about soil parameters were obtained from laboratory analysis. Key soil input data values and soil conditions defined in Overseer simulations are given in Table 2.
(ii) Weather data
Overseer used constant values of 1126 mm, 13.3OC and 831 mm for rainfall, temperature, and ET respectively, based on the location of the experimental site, as the database has been designed to ignore year to year climate variation. Data on average temperature, rainfall, and potential evapotranspiration for each block were used by the model using 30-year average climate data for the location. Overseer used regional seasonality to extrapolate the annual average to monthly or daily values.
(iii) Crop data
Crop management data pertaining to beetroot cultivation in year 1 and pak choi cultivation in year 2 were used. These data as required by the model were obtained from direct field measurements (Table 3). Ryegrass growth was simulated on lysimeters after the harvest of pak choi in year 2 as a removal of soil residual N. However, the simulation scenarios in year 1 did not have grass growth on lysimeters, as the ryegrass did not germinate in lysimeters in year 1.
(iv) Input data on N additions
Input data related to N fertilisation information for the simulation site included type, timing, amounts and dates and rate of fertilisation. The incorporated crop materials in year 1 were treated as organic fertiliser with user defined amounts and N concentrations of these inputs (Table 4).
2.5.3. Nitrate Leaching Simulations
The fertiliser treatments applied to beetroot in year 1 and pak choi in year 2 were used as different scenarios to run through Overseer. Overseer-predicted NO3− leaching estimates were compared with lysimeter-measured NO3− leaching losses for the years year 1 and year 2 at Woodhaven Gardens in Levin. The simulation utilized the Block, Soil, Pasture/Crops, and Fertiliser modules. Each treatment was simulated individually with a block area of 1.0 ha to assess the significance of NO3− loss variations. The simulated NO3− leaching from Overseer was compared with measured values obtained from lysimeter studies. All simulations represented a free-draining lower boundary. The specific scenarios modeled in Overseer are detailed in Table 1.
2.6. Error Analysis of Overseer
2.6.1. Mean Difference (Md)
Mean difference of each scenario was estimated to determine the average deviation of the measured values from the predicted values for each treatment. A t test was used to check the null hypothesis that Md = 0. A small, non-significant Md was used to test the accuracy of the model prediction. The positive and negative signs of the Md were treated that on average the model underestimated or overestimated the values, respectively.
……. Equation 1
2.6.2. Root Mean Square Error (RMSE)
RMSE was determined as a measure of the deviation of the predicted values from the measured values. Lower values of RMSE imply higher simulation accuracy.
……. Equation 2
2.6.3. Percent of Relative Error (Er %)
Relative error measures the average tendency of the simulated losses to be larger or smaller than their measured counterparts [16].
……. Equation 3
Where Si is the model Overseer simulated loss, Mi is the corresponding measured loss, and n is the number of observations.
2.6.4. Regression Equation
A linear regression equation was derived from the relationship between simulated and measured data. Overseer’s predictive capacity was evaluated using the coefficient of determination (R2), correlation coefficient (r), and a 1:1 relationship (intercept = 0, slope = 1.0) as the degree of association between the measured and simulated losses. A t-test (P < 0.05) was used to assess whether the intercept differed significantly from zero and the slope from one.
2.7. Sensitivity Analysis
Sensitivity analysis was carried out on selected input parameters to identify the most sensitive parameter that influences NO3− leaching losses and to contextualise the relative implications of errors in Overseer. It was conducted by varying one variable at a time and the relative changes in the output were evaluated with respect to NO3− leaching losses.
2.8. Data Analysis
All statistical analysis were performed using MINITAB [17] (version 19.1.1, USA).
3. Results
3.1. Simulated Annual Water Fluxes
The model was validated for its simulative capacity and precision by comparing Overseer simulated drainage and NO3− leaching results against the mean of five replicated lysimeter measurements (Table 5). Precision of the measured losses is dependent on the measured drainage through the lysimeters. Therefore, applying the 95% confidence interval (C.I) criterion indicated that Overseer reasonably simulated annual water drainage fluxes below 60 cm depth for the CTRL, CRF 1, CRF 2, STD 1, and EXC 2 simulation scenarios under the beetroot cropping system in year 1. However, Overseer did not predict the annual water fluxes for the STD 2 and EXC 1 simulations. The simulated drainage fluxes were within the 95% C.I range for all the simulation scenarios in year 2 under pak choi cultivation (Table 5).
3.2. Cumulative Nitrate Leaching Losses During Beetroot Cropping
The simulation results reveal that Overseer consistently overestimated NO3− leaching losses across six of the seven treatment scenarios under beetroot cultivation, with the exception of CRF 2, where the model underestimated losses by 32.4%. The largest overprediction occurred in STD 2, where the model estimated 392 kg N/ha, exceeding the measured value of 302.1 kg N/ha by 89.9 kg N/ha. Similarly, EXC 2 showed an overprediction of 69.1 kg N/ha (356 predicted vs. 286.9 measured), and STD 1 was overestimated by 44.4 kg N/ha (344 vs. 299.6). EXC 1 had a moderate overprediction of 36 kg N/ha (313 vs. 277.0), while CRF 1 was overestimated by 26.8 kg N/ha (326 vs. 299.2). In contrast, CTRL and CRF 2 were more closely predicted by Overseer. CTRL showed a relatively small underprediction of 34.9 kg N/ha (226 predicted vs. 260.9 measured), and CRF 2 was underpredicted by 131.2 kg N/ha (273 vs. 404.2), making it the only treatment with substantial underestimation (Table 6). On average, the model overestimated NO3− leaching by 45.2 kg N/ha (15.7%).
3.3. Cumulative Nitrate Leaching Losses During Pak Choi Cropping
Overseer predictions of NO3− leaching varied across treatments, with both overestimations and underestimations relative to measured values during pak choi cropping. The largest overprediction occurred in STD 2, where Overseer estimated 131 kg N/ha, exceeding the measured value of 78.3 kg N/ha by 52.7 kg N/ha (Table 7). Similarly, STD 1 was overpredicted by 33.3 kg N/ha (130 predicted vs. 96.7 measured), and CTRL showed an overestimation of 46.6 kg N/ha (120 vs. 73.4). EXC 1 was also over predicted by 18.6 kg N/ha (112 vs. 93.4). However, CRF 2 and EXC 2 were under predicted by Overseer. CRF 2 had a measured leaching loss of 111.2 kg N/ha, while the model predicted only 97 kg N/ha, resulting in an underestimation of 14.2 kg N/ha. EXC 2 showed the largest underprediction, with Overseer estimating 71 kg N/ha compared to a measured value of 95.5 kg N/ha, a difference of 24.5 kg N/ha. CRF 1 was closely predicted, with a small overestimation of 24.6 kg N/ha (101 vs. 76.4). On average, Overseer overestimated NO3− leaching by 33.8 kg N/ha (41%) during pak choi cultivation.
3.4. Crop N Uptake
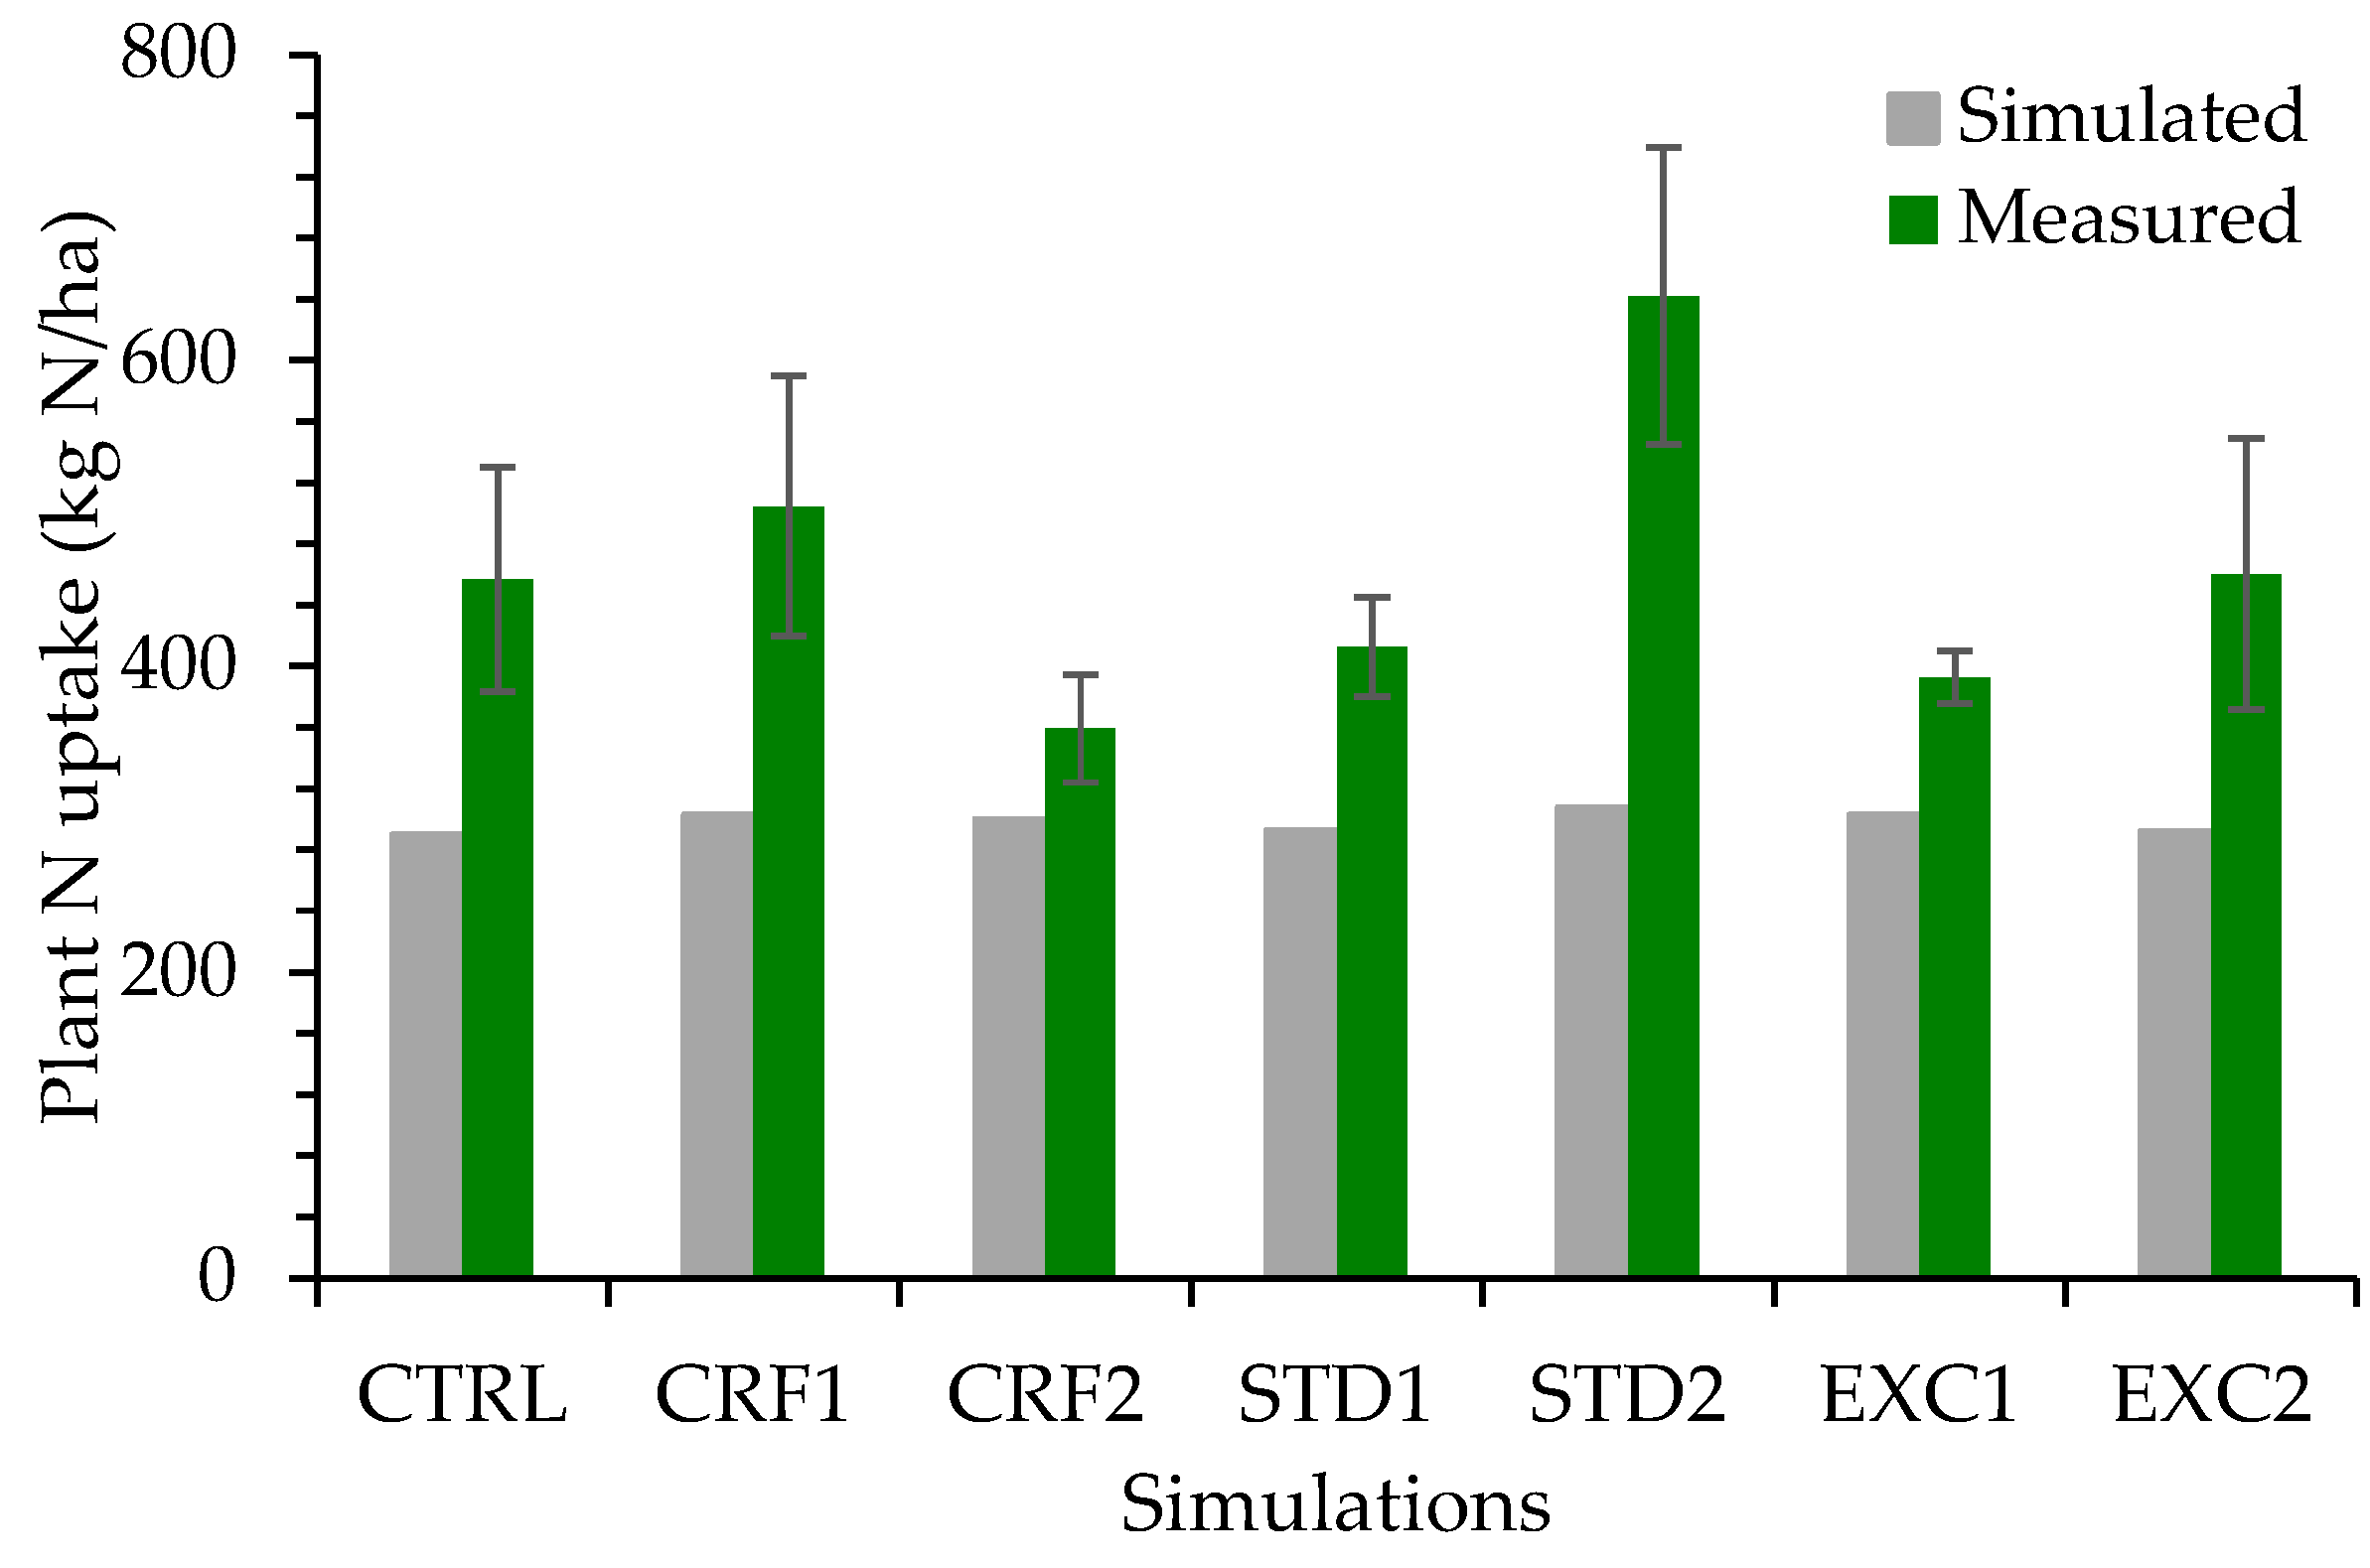
During beetroot cropping, the greatest underestimation of plant N uptake occurred in STD 2, where the simulated plant N uptake was 308 kg N/ha compared to a measured value of 642.1 kg N/ha, resulting in a 52.0% discrepancy. In contrast, the smallest gap was observed in CRF 2, with a simulated uptake of 300 kg N/ha and a measured value of 359.2 kg N/ha, reflecting a 16.4% underestimation. For the remaining treatments, CTRL (290 vs. 456.7), CRF 1 (303 vs. 504.5), STD 1 (293 vs. 412.5), EXC 1 (303 vs. 392.5), and EXC 2 (292 vs. 460.2). Overall, the model consistently underpredicted plant N uptake, with varying degrees of discrepancy ranging between approximately 22% and 46% (Figure 1).
During pak choi cultivation, the greatest overestimation of plant N uptake occurred in CRF1, where the simulated value was 520 kg N/ha compared to a measured uptake of 250.03 kg N/ha, resulting in a 107.9% overprediction. In contrast, the smallest discrepancy was observed in EXC 2, with a simulated uptake of 387 kgN/ha and a measured value of 373.91 kgN/ha, reflecting a modest 3.5% overestimation. For the remaining treatments, CTRL (473 vs. 318.5), CRF 2 (504 vs. 461.5), STD 1 (503 vs. 325.67), STD 2 (513 vs. 379.26), and EXC 1 (562 vs. 302.94) the model consistently overpredicted plant N uptake, with overestimation ranging from approximately 9% to 85%, depending on the fertiliser strategy applied (Figure 2).
3.5. Sensitivity Analysis
Based on the simulation accuracy, the scenario CRF 2 for the year 2 was used to test the sensitivity of different input parameters for their impact on NO3− leaching losses. The Overseer output for this scenario shows a leaching loss of 97 kg N/ha against the measured loss of 111.2 kg N/ha, respectively. Key input parameters influencing NO3− losses included fallow duration, impeded layer depth, soil group, hydraulic conductivity, and crop material incorporation.
3.5.1. Length of Fallow Period
The sensitivity analysis of the Overseer model revealed its dependency on both the duration and timing of fallow crop planting. The model predicted a reduction in NO3− leaching by 4% to 22% over a six-month fallow period when planting was simulated one month earlier (June). Total predicted NO3− losses for June planting were 75 kg N/ha, compared to 96 kg N/ha for July planting over the same period (Figure 3), indicating a 22% reduction in leaching. Additionally, if ryegrass remained in the lysimeters for one month under the July planting scenario, NO3− leaching would reach 112 kg N/ha/year. In contrast, six months of fallow with grass would result in 96 kg N/ha/year, while the absence of grass on lysimeters would lead to significantly higher losses of 165 kg N/ha/year (Figure 3).
3.5.2. Impeded Layer Depth
Model validation for the CRF 2 simulation scenario estimated a NO3− leaching loss of 97 kg N/ha under free-draining conditions with no impeded layer. When the impeded layer depth was reduced from 50 cm to 10 cm, NO3− losses increased by 12.3% to 108.2% relative to the validated losses (Figure 4). The model was particularly sensitive to depth variations between 10 and 50 cm, indicating that within this range, lower available water capacity leads to frequent flushing during drainage. However, Overseer showed no sensitivity beyond 60 cm.
3.5.3. Soil Group and Texture
Overseer simulated a NO3− leaching loss of 97 kg N/ha for the CRF 2 scenario in year 2 from a medium-textured, free-draining brown soil. The model predicted a reduction of 15% and 6% in NO3− losses for gley and allophanic soils, respectively, while increases of 6%, 23%, 8%, and 1% were observed for melanic, granular, pallic, and recent soils. Soil texture also influenced NO3− losses, with a 48% increase in light-textured soils and a 9% rise in heavy-textured soils compared to medium- textured soil (Figure 5). However, changes in drainage class (well, moderately well, imperfect, poor, and very poor) had minimal impact on NO3− leaching losses.
3.5.4. Saturated Hydraulic Conductivity
Overseer demonstrated sensitivity to changes in hydraulic conductivity between 1 and 3 mm/day. Nitrate leaching losses increased by 46% when conductivity rose from 1 to 2 mm/day. However, the model did not accept values below 1 mm/day and rounded decimal values (1.1–1.4 mm/day to 1.0 and 1.5–1.9 mm/day to 2.0). Sensitivity was observed only up to 4 mm/day, while values above 3 mm/day resulted in minimal changes in simulated NO3− leaching losses (Figure 6).
3.5.5. Amount of Incorporated Material
The incorporation of crop residues into the soil had a significant impact on NO3− leaching losses. A 50% increase in residue incorporation following harvest resulted in a predicted increase in NO3− leaching from 111.5 to 167.3 kg N/ha, representing a 50% rise in losses. Conversely, a 50% reduction in residue incorporation led to a corresponding 50% decrease in NO3− leaching losses (Figure 7). Sensitivity analysis of fertiliser type, pH, bulk density, drainage class, soil carbon percentage, and rooting depth had minimal influence on the estimated NO3− leaching losses (±20% of the validated values).
3.6. Evaluation of the Precision of Overseer
In this study, Overseer generally overestimated NO3− leaching, as evidenced by negative Md values across most scenarios. The exceptions observed in the CRF 2 scenario in year 1 and the STD 2 scenario in year 2, where Md values were statistically significant. Even though the lowest possible value of RMSE should be closer to zero for better simulation accuracy, none of the simulations met this criterion by showing higher RMSE values in both years. The relative error % (Er%) in year 1 remained below 10%, indicating acceptable performance. However, in year 2, simulations such as CTRL and STD 2 exceeded this threshold, with Er% values of −12.7% and −13.4%, respectively (Table 8).
Regression analysis between Overseer-simulated and lysimeter-measured NO3− leaching losses revealed a consistent overestimation of 39.4 kg N/ha/year across most scenarios, with data points diverging above the 1:1 line (Figure 8). The regression model yielded an R2 value of 0.77, indicating that 77% of the variation in measured NO3− leaching was explained by the simulated values. Overseer showed a good agreement between the measured and the predicted losses across all simulation scenarios in both years. Even though Overseer did not meet the statistical criteria for a few individual simulations, its overall performance in both years resulted in a high positive significant correlation coefficient (r =0.89, P <0.0001) indicating a good agreement between measured and predicted data. The model shows that the slope is not significantly different from one (P<0.0001) implying that Overseer did not meet the non-significant slope criteria, implying deviation of data points away from the 1:1 line. A non-significant intercept indicates that it is not significantly different from 0 and suggests that the overestimated loss of 39.4 kgN/ha was not a significant amount (Table 9).
4. Discussion
4.1. Nitrate Leaching Predictions
Overall variability in NO3- leaching was found to be associated with the crop N uptake. N uptake is estimated by the monthly crop biomass accumulation and its N content in Overseer. The N content of beetroots and leaves in year 1 was estimated as 3.1% and 2.7%, respectively (Table S2). However, Overseer used a constant value of 1.0% and 1.5% for roots and leaves, respectively [18]. Since N content is a fixed value used by Overseer and cannot be defined by the user, the crop uptakes were underestimated by Overseer during beetroot cultivation. Thus, the simulated higher NO3- leaching was due to less crop N uptake (Figure 1).
Another factor to be noted here is that Overseer simulates rapid mineralisation of organic matter. Large quantities of crop material were incorporated into the soil during the beetroot cropping cycle. When this was entered in Overseer as organic matter, it estimated higher NO3- leaching losses. Large overestimation of NO3- leaching losses following incorporation of ryegrass in vegetable growing conditions were also reported in the literature [19]. Overall, the average overestimation of 45.2 kgN/ha (15.7%) across year 1 simulations indicate a moderate bias in Overseer’s predictions under beetroot cultivation. This aligns with findings from recent evaluations, which rated Overseer’s performance in cropping systems as variable, depending on soil type, crop rotation, and fertiliser strategy [20].
The simulation results under pak choi cultivation in year 2 indicate that Overseer predicted comparatively lower NO3− leaching losses than in year 1, aligning with the reduced N input applied during that year. This trend reflects the model’s sensitivity to input-driven changes in N availability. However, despite the overall reduction, the model still overestimated NO3− losses in five of the seven scenarios, with overprediction rates ranging from 19.8% (EXC 1) to 63.5% (CTRL). These discrepancies suggest that while Overseer captures general input trends, its magnitude of prediction may not consistently reflect measured leaching, particularly under low N fertiliser treatments.
Moreover, growth of annual ryegrass was simulated during the fallow period on lysimeters in year 2. Consequently, the crop N uptake was found to be influenced by simulation of five months of fallow period, which resulted in overestimated N uptake in all scenarios (Figure 2). The N content of pak choi and ryegrass was determined as 3.2% and 2.2%, respectively (Table S2), but Overseer predictions were based on the model’s fixed values of 2.6% and 3.7%, respectively for pak choi and ryegrass which simulated overestimated plant uptake. Hence, relatively greater crop N uptake was found to be associated with lower NO3- leaching during pak choi cropping (Table 7). Nitrate leaching losses were also overestimated in a potato-oats-onion rotation where Overseer predicted NO3- loss of 220 kg N/ha when the measured losses were 80 to 15 kgN/ha under winter potato in a similar environment [21]. However, the authors did not provide any explanation for this modelling discrepancy.
4.2. Sensitivity of the Model
The sensitivity analysis of the Overseer cropping module underscores the model’s responsiveness to key soil and management parameters influencing NO3− leaching. Notably, fallow duration and timing emerged as critical factors, with early ryegrass establishment reducing leaching losses (Figure 3). This aligns with previous findings demonstrating that NO3− leaching is highly sensitive to crop cover and timing, primarily due to their influence on nitrogen uptake and water percolation dynamics [22]. Similarly, the depth of the impeded layer showed strong influence on leaching, particularly within the 10–50 cm range, where reduced water-holding capacity promotes frequent drainage events (Figure 4). These results are consistent with global sensitivity analyses indicating that soil hydraulic properties, especially saturated hydraulic conductivity and water retention, are among the most influential parameters in nitrate transport models [23].
Overseer’s sensitivity to soil texture group further highlights the importance of accurate soil classification in model calibration. Granular and light-textured soils exhibited elevated NO3− losses, likely due to their lower retention capacity and higher permeability (Figure 5). However, minimal sensitivity to drainage class and small changes in hydraulic conductivity suggest limitations in the model’s granularity for certain soil hydrological traits (Figure 6). The pronounced effect of crop residue incorporation on NO3− leaching, up to 50% variation emphasises the role of post-harvest N mineralisation in leaching dynamics [24]. These findings collectively suggest that while Overseer captures major leaching drivers, refinement in its treatment of soil hydrology and residue decomposition could enhance predictive accuracy in vegetable cropping systems.
4.3. Evaluation of the Precision of Overseer Under Different Fertiliser Regimes
The mean difference (Md) between measured and simulated NO3− leaching losses serves as a critical metric for model validation, with non-significant Md values indicating acceptable simulation accuracy. However, the majority of these differences were statistically non-significant, suggesting that the model’s predictions were not significantly (P<0.05) different from empirical measurements. This aligns with findings noting that while Overseer tends to overpredict N losses under certain conditions, its long-term averages remain within acceptable bounds for regulatory use [6]. Significant Md values for CRF 1 in year 1 and STD 2 in year 2 highlight the model’s limitations under specific fertiliser regimes and crop rotations. These discrepancies may stem from the model’s simplified representation of N mineralisation, residue decomposition, and soil water dynamics, which are known to vary significantly across cropping systems [25]. The scenario CRF 2 in year 1 involved two equal split applications of N-Control 75 in January and March so that Overseer may have treated these two applications to estimate NO3− leaching losses in three monthly steps. The model tended to reduce losses when the time steps increased, and consequently, the predicted loss was 16.2% lower than the single application scenario CRF 1 (Table 6).
The scenario STD 2 with four split applications where three of the split applications were made in January in two-weeks interval and the final split application was made in March, in year 1. Overseer, having a monthly time step, considered that the uptake was complete by the time additional fertiliser application was made, treating any extra fertiliser as unused, despite crop growth and N uptake [19]. This shows that the user interface of Overseer’s fertiliser module does not reflect the reality of fertiliser applications under vegetable growing conditions. Consequently, STD 2 scenario in year 2 resulted in some uncertainties when simulating frequent fertiliser applications. However, in general, Overseer did not adequately predict the other split application scenarios (CRF 2 and EXC 2), as indicated by their higher Er%. Moreover, the lack of dynamic feedback mechanisms in Overseer, such as real-time crop uptake and rainfall variability, may contribute to its reduced accuracy in scenarios with high temporal variability.
RMSE is a widely accepted metric for assessing model performance, as it quantifies the average magnitude of error between observed and predicted values [26]. The elevated RMSE values suggest that Overseer may not fully capture the N dynamics occurring under lysimeter conditions, particularly in systems with variable soil moisture and fertiliser regimes. While Overseer performs well in pastoral systems, its cropping module yields variable accuracy due to limited calibration datasets and simplified assumptions about soil–plant interactions [6]. This decline in accuracy in Er% may be attributed to the model’s limited responsiveness to dynamic soil moisture and fertiliser regimes. Overseer was compared with the SCRUM-APSIM model, and it was found that while long-term averages aligned under benchmark conditions, Overseer struggled to replicate crop-specific N dynamics under varied soil and climate sequences [27].
4.4. Overall Simulation Performance of Overseer
Regression slope and intercept deviations are useful indicators for refining model structure and improving calibration [28]. The average overprediction of 39.4 kg N/ha/year highlights a systematic bias in the model’s cropping module. Despite this, R2 value of 0.77 suggests that Overseer captures the general trend of nitrate losses reasonably well, even if absolute values deviate (Figure 8). Strong correlations between Overseer outputs and field measurements have been reported in pastoral systems, but reduced accuracy has been noted in cropping contexts [6]. The consistent divergence above the 1:1 line also raises concerns about the implications of overestimated NO3− losses for growers and regulators. Overprediction may lead to unnecessary restrictions or misinformed nutrient budgeting, potentially affecting farm profitability and compliance. This level of correlation coefficient (r) of 0.89 suggests that the model captures the general trend of NO3− leaching across diverse scenarios. Theoretically, for a perfect simulation (simulated values should be the same as the measured values), the r value should be 1, the intercept (a) should be 0, and the slope of the regression line (b) should be 1. However, the significant slope of the regression line (P < 0.0001) indicates a systematic bias in the magnitude of predictions (Table 9). This deviation from the 1:1 line suggests that while Overseer tracks the direction of change in NO3− leaching, it tends to overestimate leaching values. Slope deviations are common in empirical models when applied to systems with complex N dynamics, especially under variable fertiliser regimes and soil textures [28]. The non-significant intercept in this study further supports that the overestimation was not constant across scenarios but rather influenced by specific input sensitivities such as crop type, rooting depth, and residue incorporation. Despite these deviations, the overall agreement between measured and simulated NO3− losses supports a moderately successful validation of the Overseer cropping module.
4.5. Uncertainties Associated with the Simulation Scenarios
The accuracy of Overseer simulations for vegetable crops in New Zealand is limited, as only a few crops can be modeled. Beetroot was categorized under root crops in year 1, while pak choi was treated as regular cabbage due to the absence of a suitable category, potentially leading to discrepancies in crop characteristics. Additionally, Overseer used 30-year averaged climate data (1981–2010) instead of actual daily climate data for year 1 and year 2, ignoring interannual variability in rainfall and evapotranspiration. The recorded rainfall and evapotranspiration were 1048.4 mm and 577 mm in year 1 and 1264 mm and 786 mm in year 2, whereas the model used fixed values of 1126 mm and 831 mm, respectively. This omission likely affected NO3− loss predictions, as climate variability influences leaching [29]. Overseer also did not distinguish between NO3− leaching and runoff N, potentially overestimating NO3− losses. Furthermore, fertiliser N was assumed to be incorporated within 20 cm, overlooking variations in NO3− distribution, as surface soils generally exhibit higher N concentrations than deeper layers. The model extrapolated equations from pastoral systems to horticultural crops, which may have influenced N uptake estimates, potentially leading to discrepancies in leaching predictions [5,9]. Moreover, Overseer defined NO3− leaching as percolation below 60 cm, disregarding field soil heterogeneity beyond this depth. Therefore, Overseer’s modeling accuracy provides a reliable estimate, and it is attributed to the model’s simplifications in crop, soil, and nutrient interactions, which closely resemble lysimeter conditions [30].
5. Conclusions
The Overseer model demonstrated moderate success in predicting NO3− leaching losses under lysimeter conditions, with a generally good agreement between measured and simulated data. While most scenarios showed non- significant mean differences, indicating reasonable accuracy, the model tended to overestimate NO3− losses in both years, with an average overestimation of 39.4 kg N/ha/year. Despite some deviations from statistical criteria for individual scenarios, the model’s overall performance was acceptable, as indicated by a high correlation coefficient (r = 0.89, P < 0.0001) and an R2 value of 77%. The regression analysis further confirmed that Overseer’s predictions were overestimations but still provided a useful estimate for comparative assessments of nitrate leaching.
Supplementary Materials
The following supporting information can be downloaded at the website of this paper posted on Preprints.org, Table S1. Baseline soil physical and chemical properties at the experimental site at different depths prior to the commencement of the experiment. Table S2. Nitrogen concentration (%) in beetroot leaves, roots, pak choi, and ryegrass under varying N fertiliser treatments. Figure S1. Schematic diagram of a single lysimetric arrangement for the collection of leachates at Woodhaven Gardens, Levin. Figure S2. Treatment allocation for the 35 lysimeters in Woodhaven Gardens in Randomized Complete Block Design (RCBD). Each circle shows the lysimeter and treatment identification.
Author Contributions
Bawatharani Raveendrakumaran: Conceptualisation, investigation, data collection and analysis, and writing original draft. (ii) Miles Grafton: Supervision, methodology, writing—review & editing, and project administration. (iii) Paramsothy Jeyakumar: Supervision, methodology, and writing—review & editing.
Funding
The authors sincerely acknowledge the financial support provided by Massey University’s Research Fund (MURF) for this study.
Data Availability Statement
The data presented in this study are available on request from the corresponding author.
Acknowledgments
The authors sincerely acknowledge Woodhaven Gardens for generously providing their field site for the lysimeter experiments.
Conflicts of Interest
The authors report there are no competing interests to declare.
Abbreviations
The following abbreviations are used in this manuscript:
| N | Nitrogen |
| NO3- | Nitrate |
| Md | Mean difference |
| RMSE | Root Mean Square Error |
| Er | Error |
| CAN | Calcium Ammonium Nitrate |
| CRF | Controlled Release Fertiliser |
| EXC | Excess |
| STD | Standard |
| SCRUM-APSIM | Simple Crop Resource Uptake Model-Agricultural Production Systems sIMulator |
References
- Francis, G. S.; Trimmer, L. A.; Tregurtha, C. S.; Williams, P. H.; Butler, R. C. Winter nitrate leaching losses from three land uses in the Pukekohe area of New Zealand. New Zealand Journal of Agricultural Research 2003, 46(3), 215–224. [Google Scholar] [CrossRef]
- Cichota, R.; Snow, V. O. Estimating nutrient loss to waterways—An overview of models of relevance to New Zealand pastoral farms. New Zealand Journal of Agricultural Research 2009, 52(3), 239–260. [Google Scholar] [CrossRef]
- Lilburne, L.; Webb, T.; Ford, R.; Bidwell, V. J. Estimating nitrate-N leaching rates under rural land uses in Canterbury. Environment Canterbury. Regional Council, Christchurch. 2010. Available online: https://www.researchgate.net/publication/277039127_Estimating_nitrate-nitrogen_leaching_rates_under_rural_land_uses_in_Canterbury#fullTextFileContent.
- Wheeler, D. M.; Ledgard, S. F.; Monaghan, R. M.; McDowell, R. W.; de Klein, C. A. M. Overseer nutrient budget model—what it is, what it does. In Implementing sustainable nutrient management strategies in agriculture. Occasional Report No. 19. Fertiliser and Lime Research Centre, Massey University, Palmerston North, New Zealand, 2006. 231-236; Currie, L.D., Hanly, J.A., Eds.; Available online: https://www.researchgate.net/profile/Rw-Mcdowell/publication/285807876_OVERSEER_nutrient_budget_model_-_what_it_is_what_it_does/links/566f242d08aec0bb67bf038b/OVERSEER-nutrient-budget-model-what-it-is-what-it-does.pdf.
- Williams, R.; Brown, H.; Dunbier, M.; Edmeades, D.; Hill, R.; Metherell, A.; Thorburn, P. A critical examination of the role of Overseer® in modelling nitrate losses from arable crops. In Accurate and efficient use of nutrients on farms Occasional Report No. 26; Currie, L.D., Christensen, C.L., Eds.; Fertiliser and Lime Research Centre, Massey University: Palmerston North, New Zealand, 2013; pp. 1–8. Available online: https://www.massey.ac.nz/~flrc/workshops/13/Manuscripts/Paper_Williams_2013.pdf.
- Tavernet, J.P. Overseer assessment of modelling N leaching under pasture. In Opportunities for improved farm and catchment outcomes. Occasional Report No. 36. Farmed Landscapes Research Centre, Massey University. Massey University, Palmerston North, New Zealand; Christensen, C.L., Horne, D.J., Singh, R., Eds.; 2024; pp. 1–7. Available online: https://flrc.massey.ac.nz/workshops/24/Manuscripts/Tavernet_JP.pdf.
- Welten, B.; Mercer, G.; Smith, C.; Sprosen, M.; Ledgard, S. Refining estimates of N leaching for the New Zealand agricultural greenhouse gas inventory. 2021. MPI Technical Paper No: 2022/05. Available online: https://www.mpi.govt.nz/dmsdocument/50431-Refining-estimates-of-N-leaching-for-the-New-Zealand-agricultural-greenhouse-gas-inventory-Report/.
- Selbie, D. R.; Buckthought, L. E.; Shepherd, M. A. The challenge of the urine patch for managing nitrogen in grazed pasture systems. Advances in agronomy 2015, 129, 229–292. [Google Scholar] [CrossRef]
- Ledgard, S.; Williams, P.; Broom, F.; Thorrold, B.; Wheeler, D.; Willis, V. Overseer–A nutrient budgeting model for pastoral farming, wheat, potatoes, apples and kiwifruit. In Best soil management practices for production. Occasional report No. 12. Fertilizer and Lime Research Centre, Massey University; Currie, L.D, Hedley, M.J, Horne, D.J, Loganathan, P., Eds.; Palmerston North, New Zealand, 1999; pp. 143–152. Available online: https://flrc.massey.ac.nz/workshops/older/paperlist-99.html.
- Avendaño, F.; Horne, D.; Singh, R.; Palmer, A.; Cichota, R.; Bloomer, D. Quantification of nitrate-N losses under intensive vegetable production systems in New Zealand. New Zealand Journal of Crop and Horticultural Science 2025, 53(5), 3091–3112. [Google Scholar] [CrossRef]
- Quemada, M.; Baranski, M.; Nobel-de Lange, M.; Vallejo, A.; Cooper, J. M. Meta-analysis of strategies to control nitrate leaching in irrigated agricultural systems and their effects on crop yield. Agriculture, Ecosystems & Environment 2013, 174, 1–10. [Google Scholar] [CrossRef]
- Zhao, C.; Hu, C.; Huang, W.; Sun, X.; Tan, Q.; Di, H.J. Design, construction and installation of large soil core lysimeters. Transactions of the Chinese Society of Agricultural Engineering 2010, 26(2), 48–53. [Google Scholar] [CrossRef]
- Blakemore, L.; Searle, P.; Daly, B. Methods for Chemical Soil Analysis, New Zealand Soil Bureau Scientific Report 80; Department of Scientific and Industrial Research: Lower Hutt, New Zealand, 1987; pp. 72–103. [Google Scholar] [CrossRef]
- Watkins, N.; Shepherd, M. A compendium of New Zealand pasture farmlet experiments measuring N leaching Occasional Report No.27. In Nutrient Management for the Farm, Catchment and Community. Fertiliser and Lime Research Centre, Massey University, Palmerston North, New Zealand; L.D. Currie, L.D, Christensen, C.L., Eds.; 2014; pp. 1–13. Available online: http://tur-www1.massey.ac.nz/~flrc/workshops/14/Manuscripts/Paper_Watkins_2014.pdf.
- Wheeler, D. Overseer scenarios. In Nutrient management in a rapidly changing world. Occasional Report 22, Fertiliser and Lime Research Centre, Massey University, Palmerston North, New Zealand; Currie, L.D., Lindsay, L., Eds.; 2009; pp. 335–340. Available online: https://flrc.massey.ac.nz/workshops/09/Abstracts%202009.pdf.
- Addiscott, T.; Whitmore, A. Computer simulation of changes in soil mineral N and crop N during autumn, winter and spring. The Journal of Agricultural Science 1987, 109(1), 141–157. [Google Scholar] [CrossRef]
- Minitab. Minitab, version 19.1.1 Statistical software, USA. 2010. [Google Scholar]
- Wheeler, D. M. OVERSEER Technical Manual: Technical manual for the description of the OVERSEER® Nutrient Budgets engine—Characteristics of crops. Wellington Overseer Ltd. 2018, pp. 18–20. Available online: https://www.researchgate.net/publication/289904795_OVERSEER_Technical_Manual.
- Science Advisory Panel. Overseer whole-model review: Assessment of the model approach. MPI Technical Paper no: 2021/12. New Zealand Government. ISSN: 2253-3923. 2021. Available online: https://www.mpi.govt.nz.
- Overseer Ltd. New report backs OverseerFM. Overseer | Farming Software New Zealand. 2023. Available online: https://overseer.org.nz/articles/new-report-backs-overseerfm/.
- Thomas, S. M.; Ledgard, S. F.; Francis, G. S. Improving estimates of nitrate leaching for quantifying New Zealand’s indirect nitrous oxide emissions. Nutrient cycling in Agroecosystems 2005, 73(2), 213–226. [Google Scholar] [CrossRef]
- Rathnappriya, R.H.K.; Sakai, K.; Okamoto, K.; Kimura, S.; Haraguchi, T.; Nakandakari, T.; Setouchi, H.; Bandara, W.B.M.A.C. Global sensitivity analysis of key parameters in the APSIMX-Sugarcane model to evaluate nitrate balance via treed Gaussian process. Agronomy 2022, 12(8). [Google Scholar] [CrossRef]
- Liang, H.; Qi, Z.; DeJonge, K. C.; Hu, K.; Li, B. Global sensitivity and uncertainty analysis of nitrate leaching and crop yield simulation under different water and N management practices. Computers and Electronics in Agriculture 2017, 142, 201–210. [Google Scholar] [CrossRef]
- Wey, H.; Hunkeler, D.; Bischoff, W.A.; Bünemann, E.K. Field-scale monitoring of nitrate leaching in agriculture: Assessment of three methods. Environmental Monitoring and Assessment 2022, 194(1), 4. [Google Scholar] [CrossRef] [PubMed]
- Snow, V. O.; Cichota, R.; McAuliffe, R. J.; Hutchings, N. J.; Vejlin, J. Increasing the spatial scale of process-based agricultural systems models by representing heterogeneity: The case of urine patches in grazed pastures. Environmental Modelling & Software 2017, 90, 89–106. [Google Scholar] [CrossRef]
- Willmott, C. J.; Matsuura, K. Advantages of the mean absolute error (MAE) over the root mean square error (RMSE) in assessing average model performance. Climate research 2005, 30(1), 79–82. [Google Scholar] [CrossRef]
- Khaembah, E.; Brown, H. Testing of OVERSEER N loss estimates from crop systems. Plant & Food Research Report SPTS No. 14014. Foundation for Arable Research. 2016. Available online: https://assets.ctfassets.net/bo1h2c9cbxaf/2wflP90wzwZNMiGcf6ykm5/7bda1fcdd5ef8b0e699cecfd1ef7dfe3/Crop_Model_Review.pdf.
- Børgesen, C. D.; Pullens, J. W.; Zhao, J.; Blicher-Mathiesen, G.; Sørensen, P.; Olesen, J. E. NLES5–An empirical model for estimating nitrate leaching from the root zone of agricultural land. European Journal of Agronomy 2022, 134, 126465. [Google Scholar] [CrossRef]
- Nonhebel, S. The effects of use of average instead of daily weather data in crop growth simulation models. Agricultural systems 1994, 44(4), 377–396. [Google Scholar] [CrossRef]
- Shepherd, M.; Wheeler, D.; Selbie, D.; Buckthought, L.; Freeman, M. Overseer: accuracy, precision, error and uncertainty. In Accurate and efficient use of nutrients on farms Occasional Report No. 26. Annual FLRC workshop; Fertilizer and Lime Research Centre, Massey University, Palmerston North, New Zealand, Currie, L.D., Christensen, C.L., Eds.; 2013; pp. 1–8. Available online: https://www.researchgate.net/profile/Mark-Shepherd-10/publication/275251993_OVERSEER_accuracy_precision_error_and_uncertainty/links/55361a9b0cf20ea35f1102f3/OVERSEER-accuracy-precision-error-and-uncertainty.pdf.
Figure 1.
Comparison of Overseer simulated average beetroot N uptake against measured beetroot N uptake from lysimeters in year 1. Measured values are the mean of five replicates.
Figure 1.
Comparison of Overseer simulated average beetroot N uptake against measured beetroot N uptake from lysimeters in year 1. Measured values are the mean of five replicates.
| Treatments | Measured leaching losses (kg N/ha) | predicted leaching losses (kg N/ha) |
| CTRL | 73.4 | 120 |
| CRF 1 | 76.4 | 101 |
| CRF 2 | 111.2 | 97 |
| STD 1 | 96.7 | 130 |
| STD 2 | 78.3 | 131 |
| EXC 1 | 93.4 | 112 |
| EXC 2 | 95.5 | 71 |
| Treatments | Measured leaching losses (kg N/ha) | Overseer predicted leaching losses (kg N/ha) |
| CTRL | 260.9 | 266 |
| CRF 1 | 299.2 | 326 |
| CRF 2 | 404.2 | 273 |
| STD 1 | 299.6 | 344 |
| STD 2 | 302.1 | 392 |
| EXC 1 | 277.0 | 313 |
| EXC 2 | 286.9 | 356 |
| Year | Simulation scenario | Cumulative water drainage (mm) | |
| Measured (mean ± 95% C.I) | Overseer simulated | ||
| Year 1 | CTRL | 440 ± 183 | 621 |
| CRF1 | 425 ± 221 | 621 | |
| CRF2 | 641 ± 162 | 621 | |
| STD 1 | 490 ± 230 | 621 | |
| STD 2 | 439 ± 140 | 621† | |
| EXC 1 | 466 ± 109 | 621† | |
| EXC 2 | 410 ± 255 | 621 | |
| Year 2 | CTRL | 422 ± 368 | 556 |
| CRF1 | 383 ± 220 | 529 | |
| CRF2 | 559 ± 147 | 529 | |
| STD 1 | 482 ± 380 | 556 | |
| STD 2 | 522 ± 288 | 556 | |
| EXC 1 | 431 ± 265 | 529 | |
| EXC 2 | 439 ± 290 | 529 | |
|
No. |
Input variables |
Simulation scenarios | |||||||
| Ctrl | CRF 1 | CRF 2 | STD 1 | STD 2 | EXC 1 | EXC 2 | |||
| Beetroot (year 1) | |||||||||
| 1. | Soil residual N (kg N/ha) | 32 | 32 | 32 | 32 | 32 | 32 | 32 | |
| 2. | Fresh yield (t/ha) | 64 | 70 | 69 | 65 | 73 | 70 | 65 | |
| 3. | Month and amount of fertiliser application (kg N/ha) (including Nitrophoska) | 0 | Jan, 115.2 | Jan, Mar 115.2 | Jan, 117.0 | Jan, Feb 117.0 | Jan, 198.0 | Jan, 198.0 | |
| 4. | Amount of incorporated harvest material, dry matter (DM) and N concentration | ||||||||
| (a) Beetroots | Amount (kg) | 63632 18 3.3 |
70208 14 3.5 |
68560 14 2.7 |
65112 16 3.0 |
72620 17 3.4 |
69888 16 2.7 |
65024 15 3.5 |
|
| DM% | |||||||||
| N % | |||||||||
| (b) Beetroot leaves | Amount (kg) | 33696 11 2.5 |
34544 11 2.8 |
34080 11 2.6 |
35776 11 2.7 |
38928 11 2.7 |
32496 12 2.5 |
36736 11 2.9 |
|
| DM% | |||||||||
| N % | |||||||||
| Pak choi (year 2) | |||||||||
| 1. | Soil residual N (kg N/ha) | 92.2 | 110.4 | 97.4 | 80.9 | 120 | 84.2 | 94.4 | |
| 2. | Fresh yield (t/ha) | 102 | 117 | 112 | 111 | 114 | 130 | 124 | |
| 3. | Amount of harvest material incorporated | 0 | 0 | 0 | 0 | 0 | 0 | 0 | |
| 4. | Month and amount of fertiliser application (kg N/ha) | 0 | Jan, 48 | Jan, Mar 48 | Jan, 49 | Jan, Mar 48 | Jan, 97 | Jan, Mar 98 | |
Figure 2.
Comparison of Overseer simulated average pak choi N uptake against measured pak choi N uptake from lysimeters in year 2. Measured values are the mean of five replicates.
Figure 2.
Comparison of Overseer simulated average pak choi N uptake against measured pak choi N uptake from lysimeters in year 2. Measured values are the mean of five replicates.
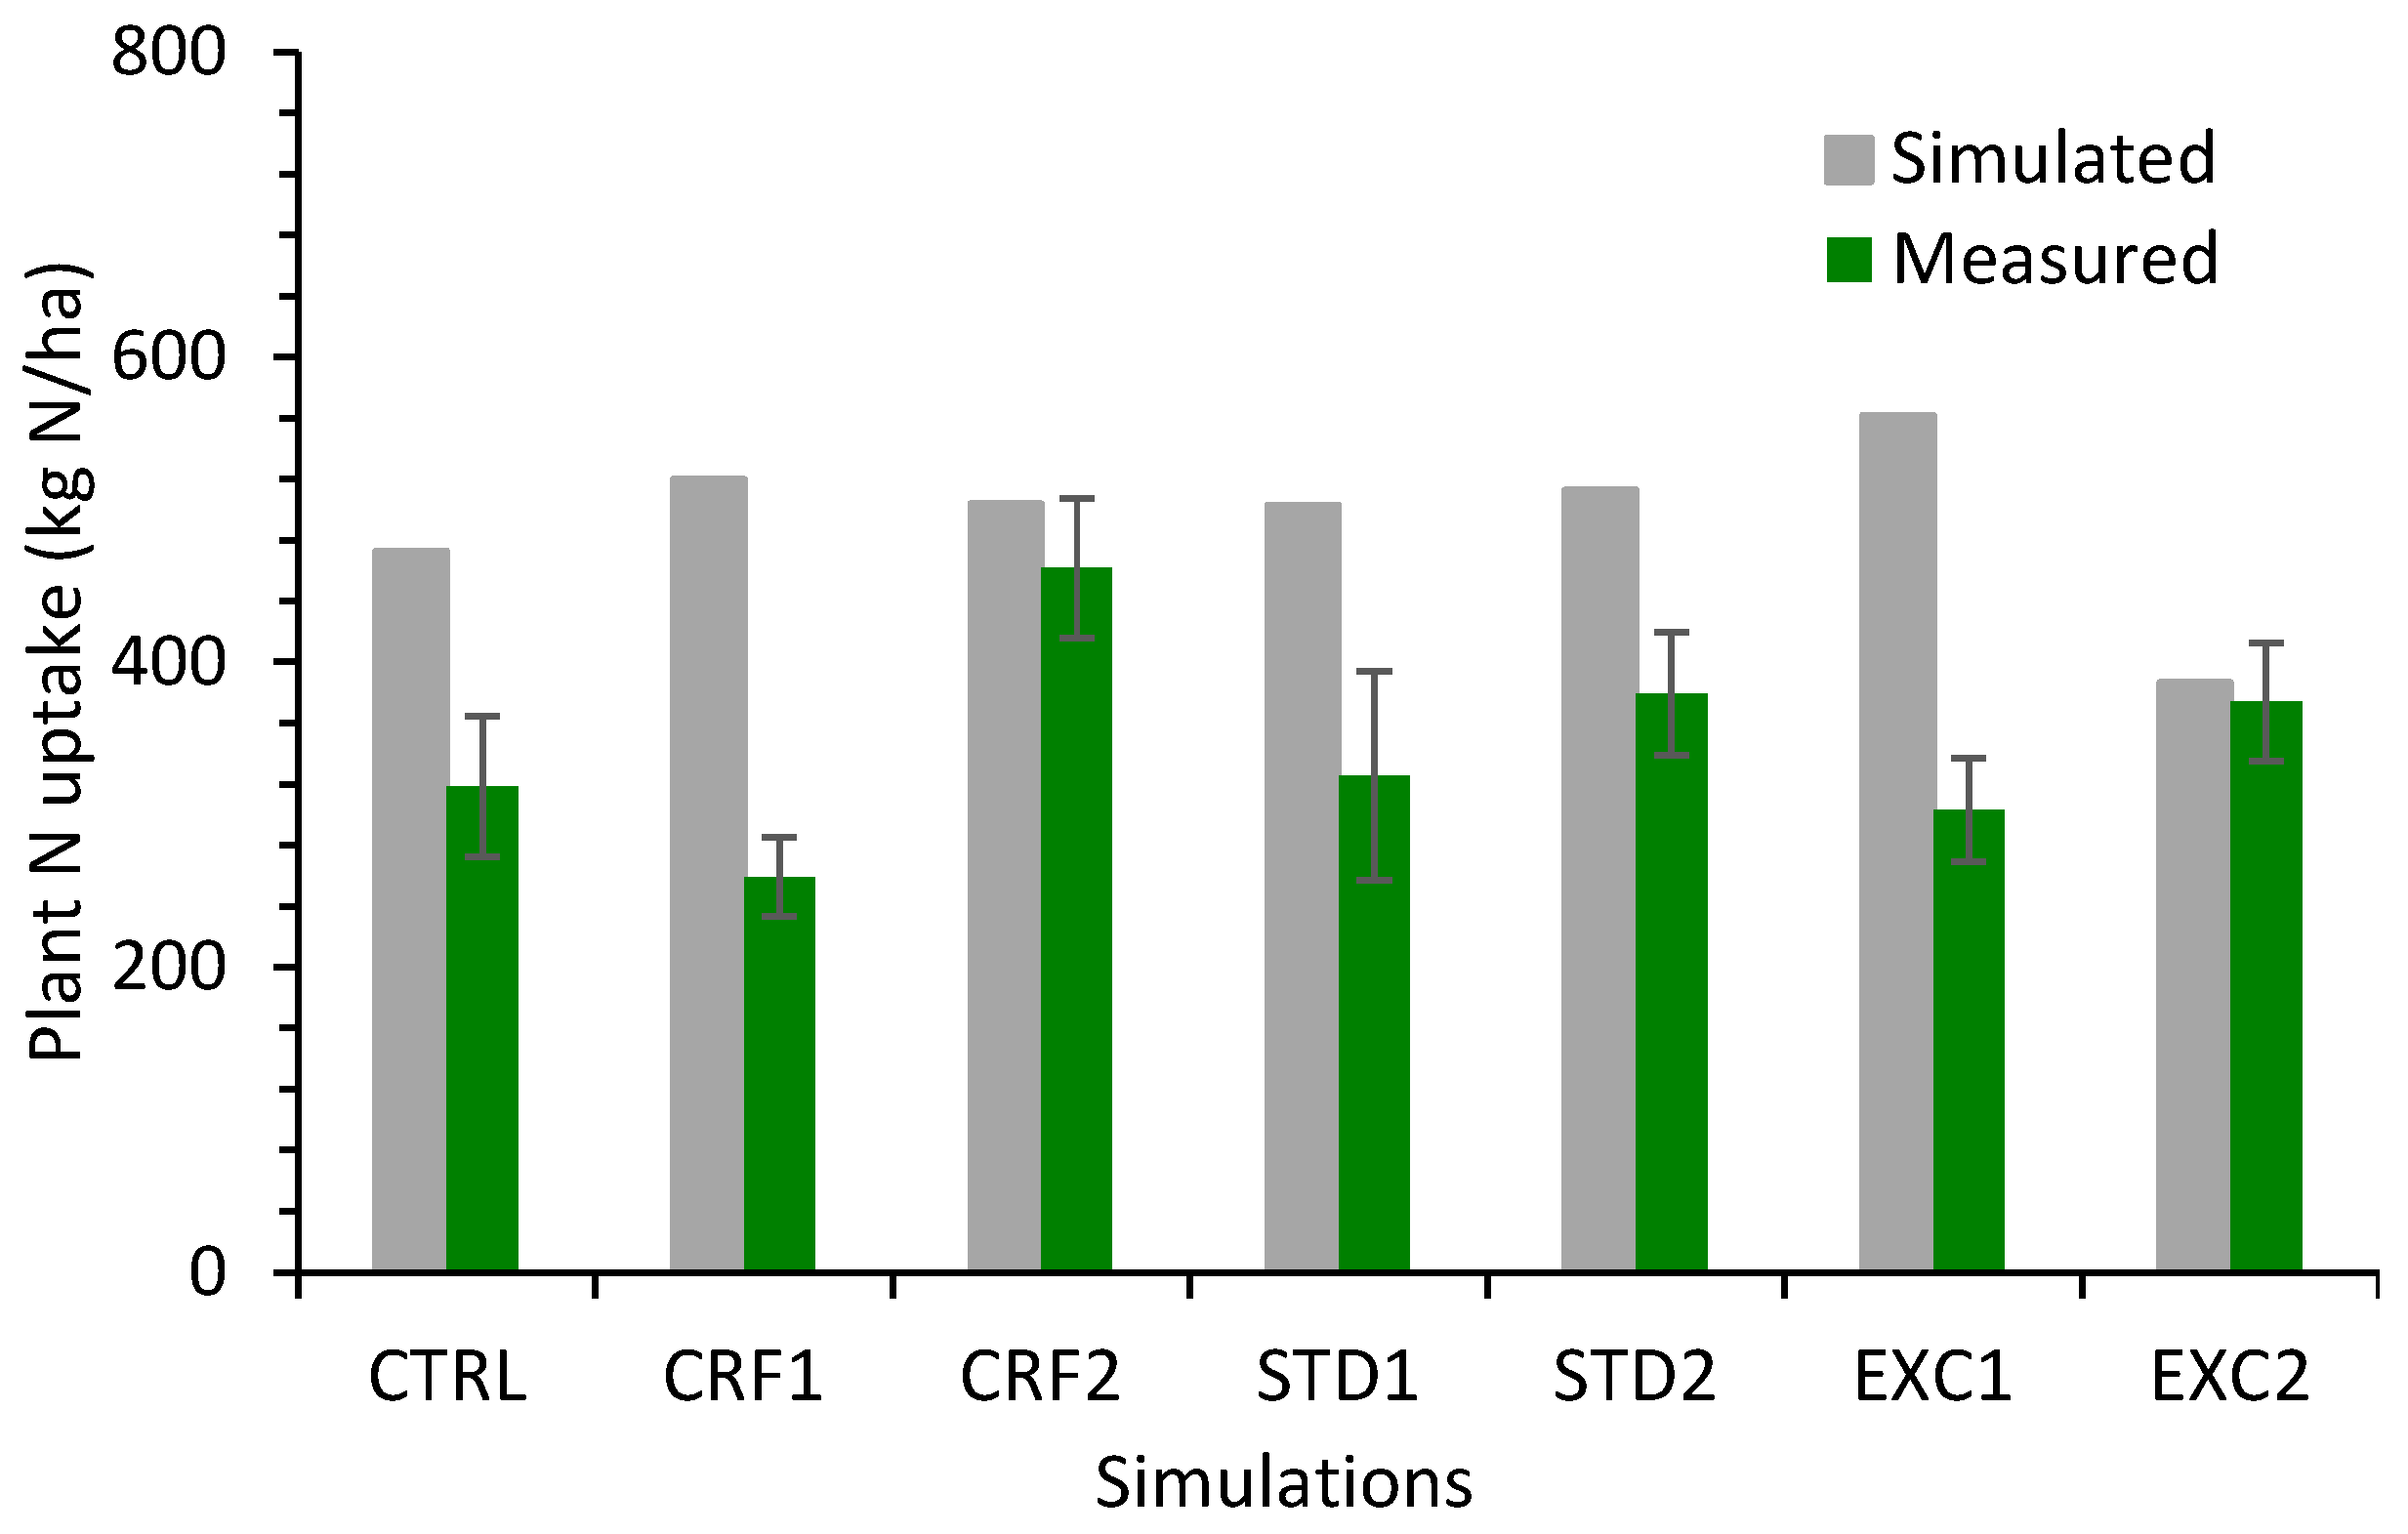
Figure 3.
Effect of fallow period on Overseer simulated NO3− leaching loss.
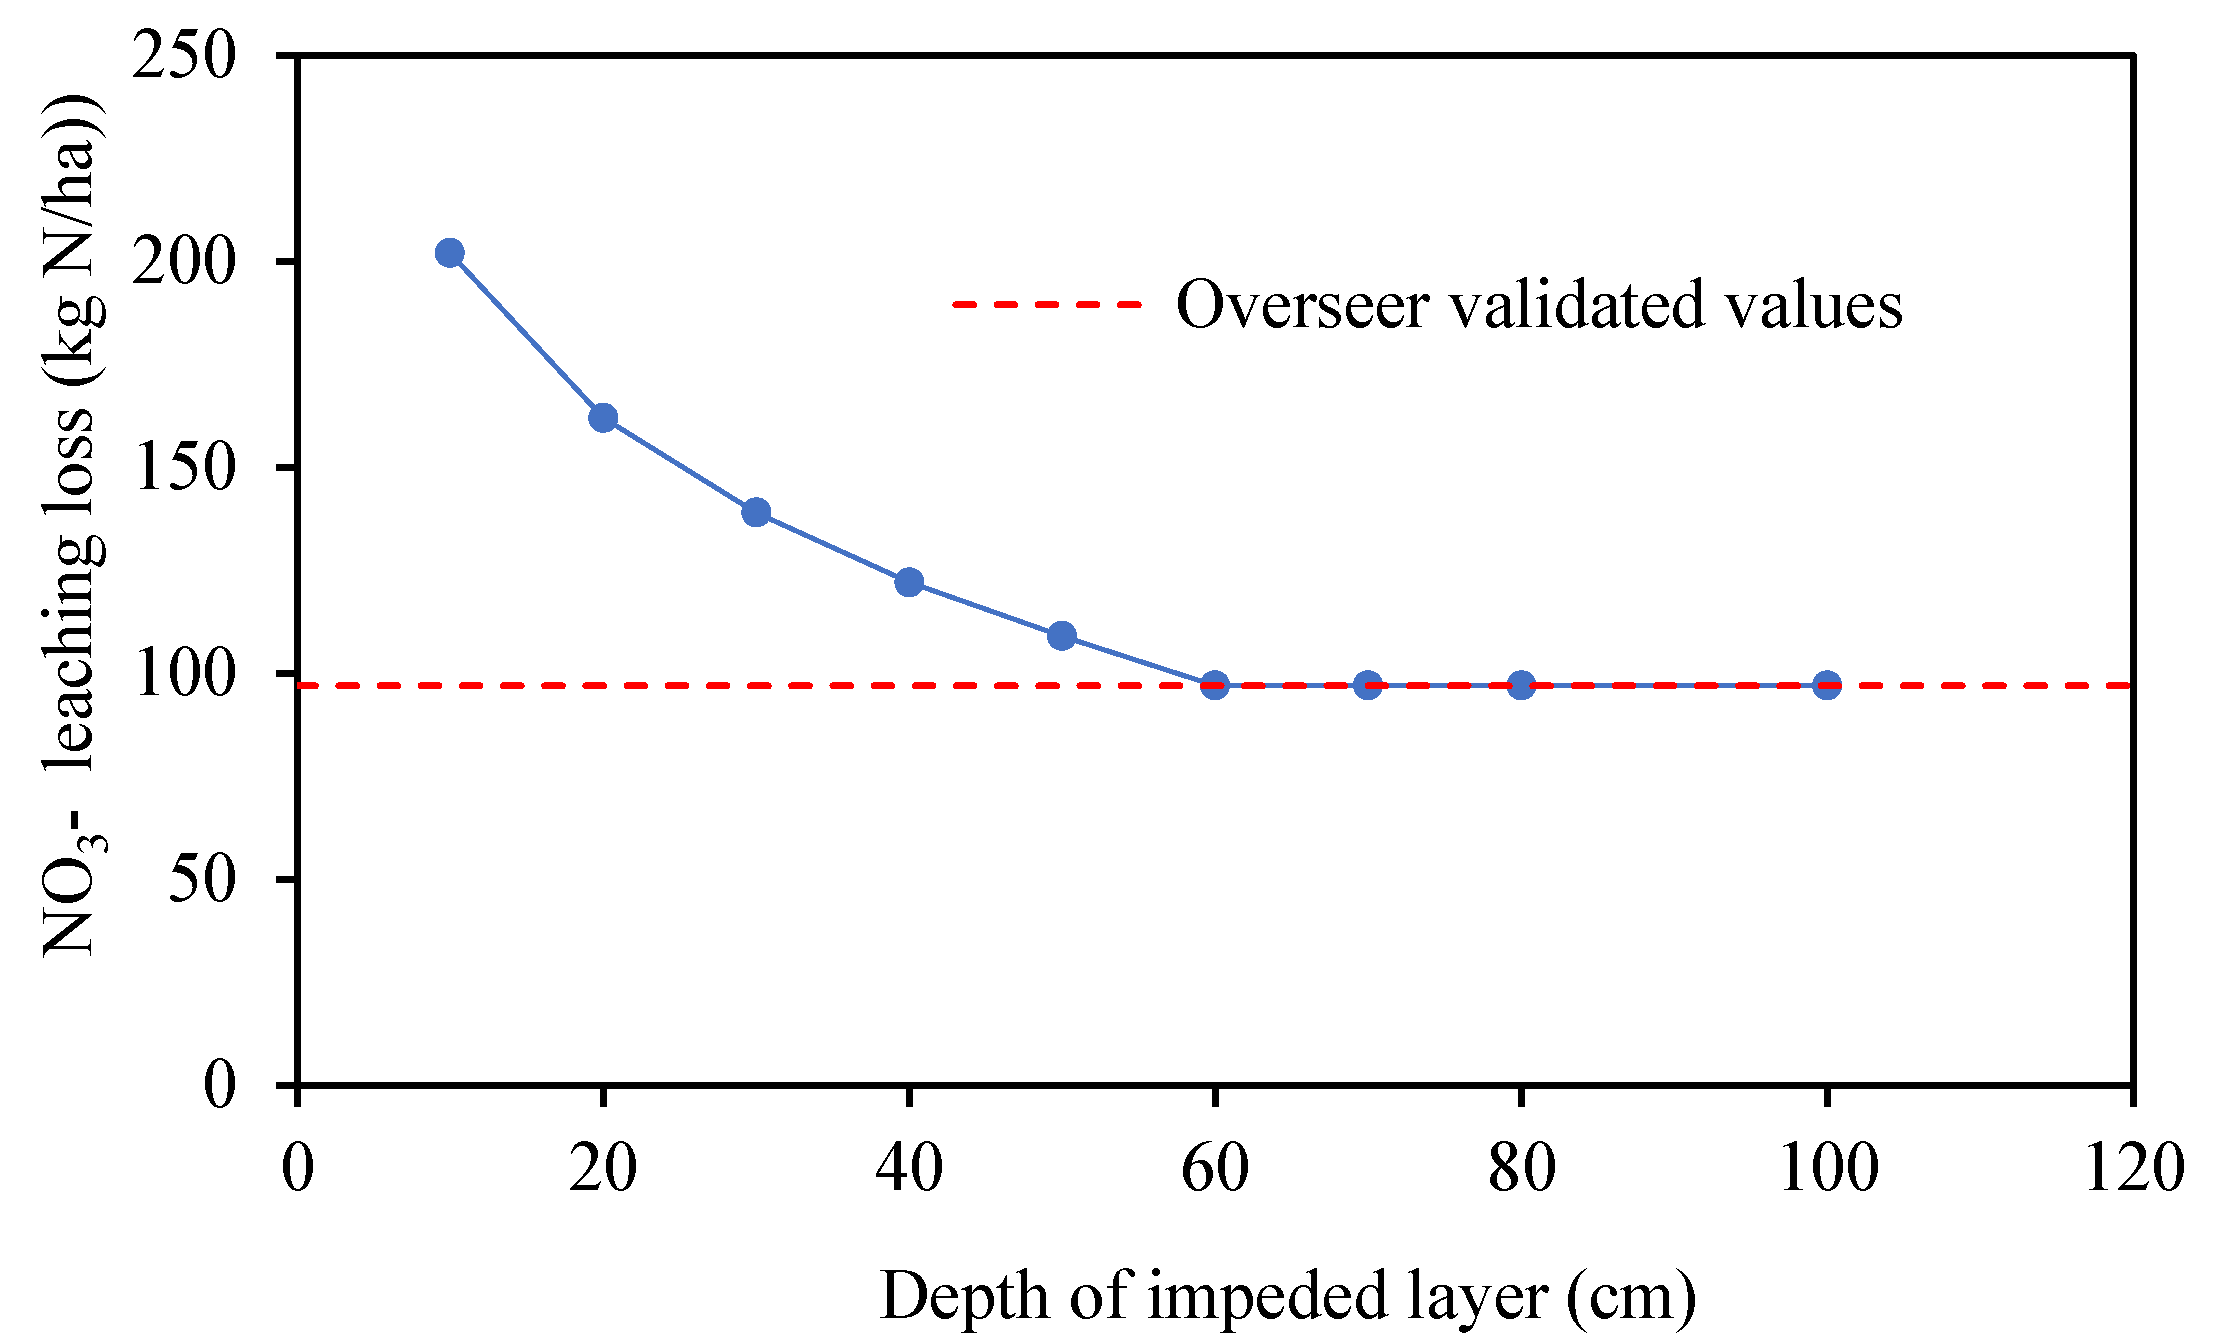
Figure 4.
Effect of depth of impeded layer on Overseer simulated NO3− leaching loss.
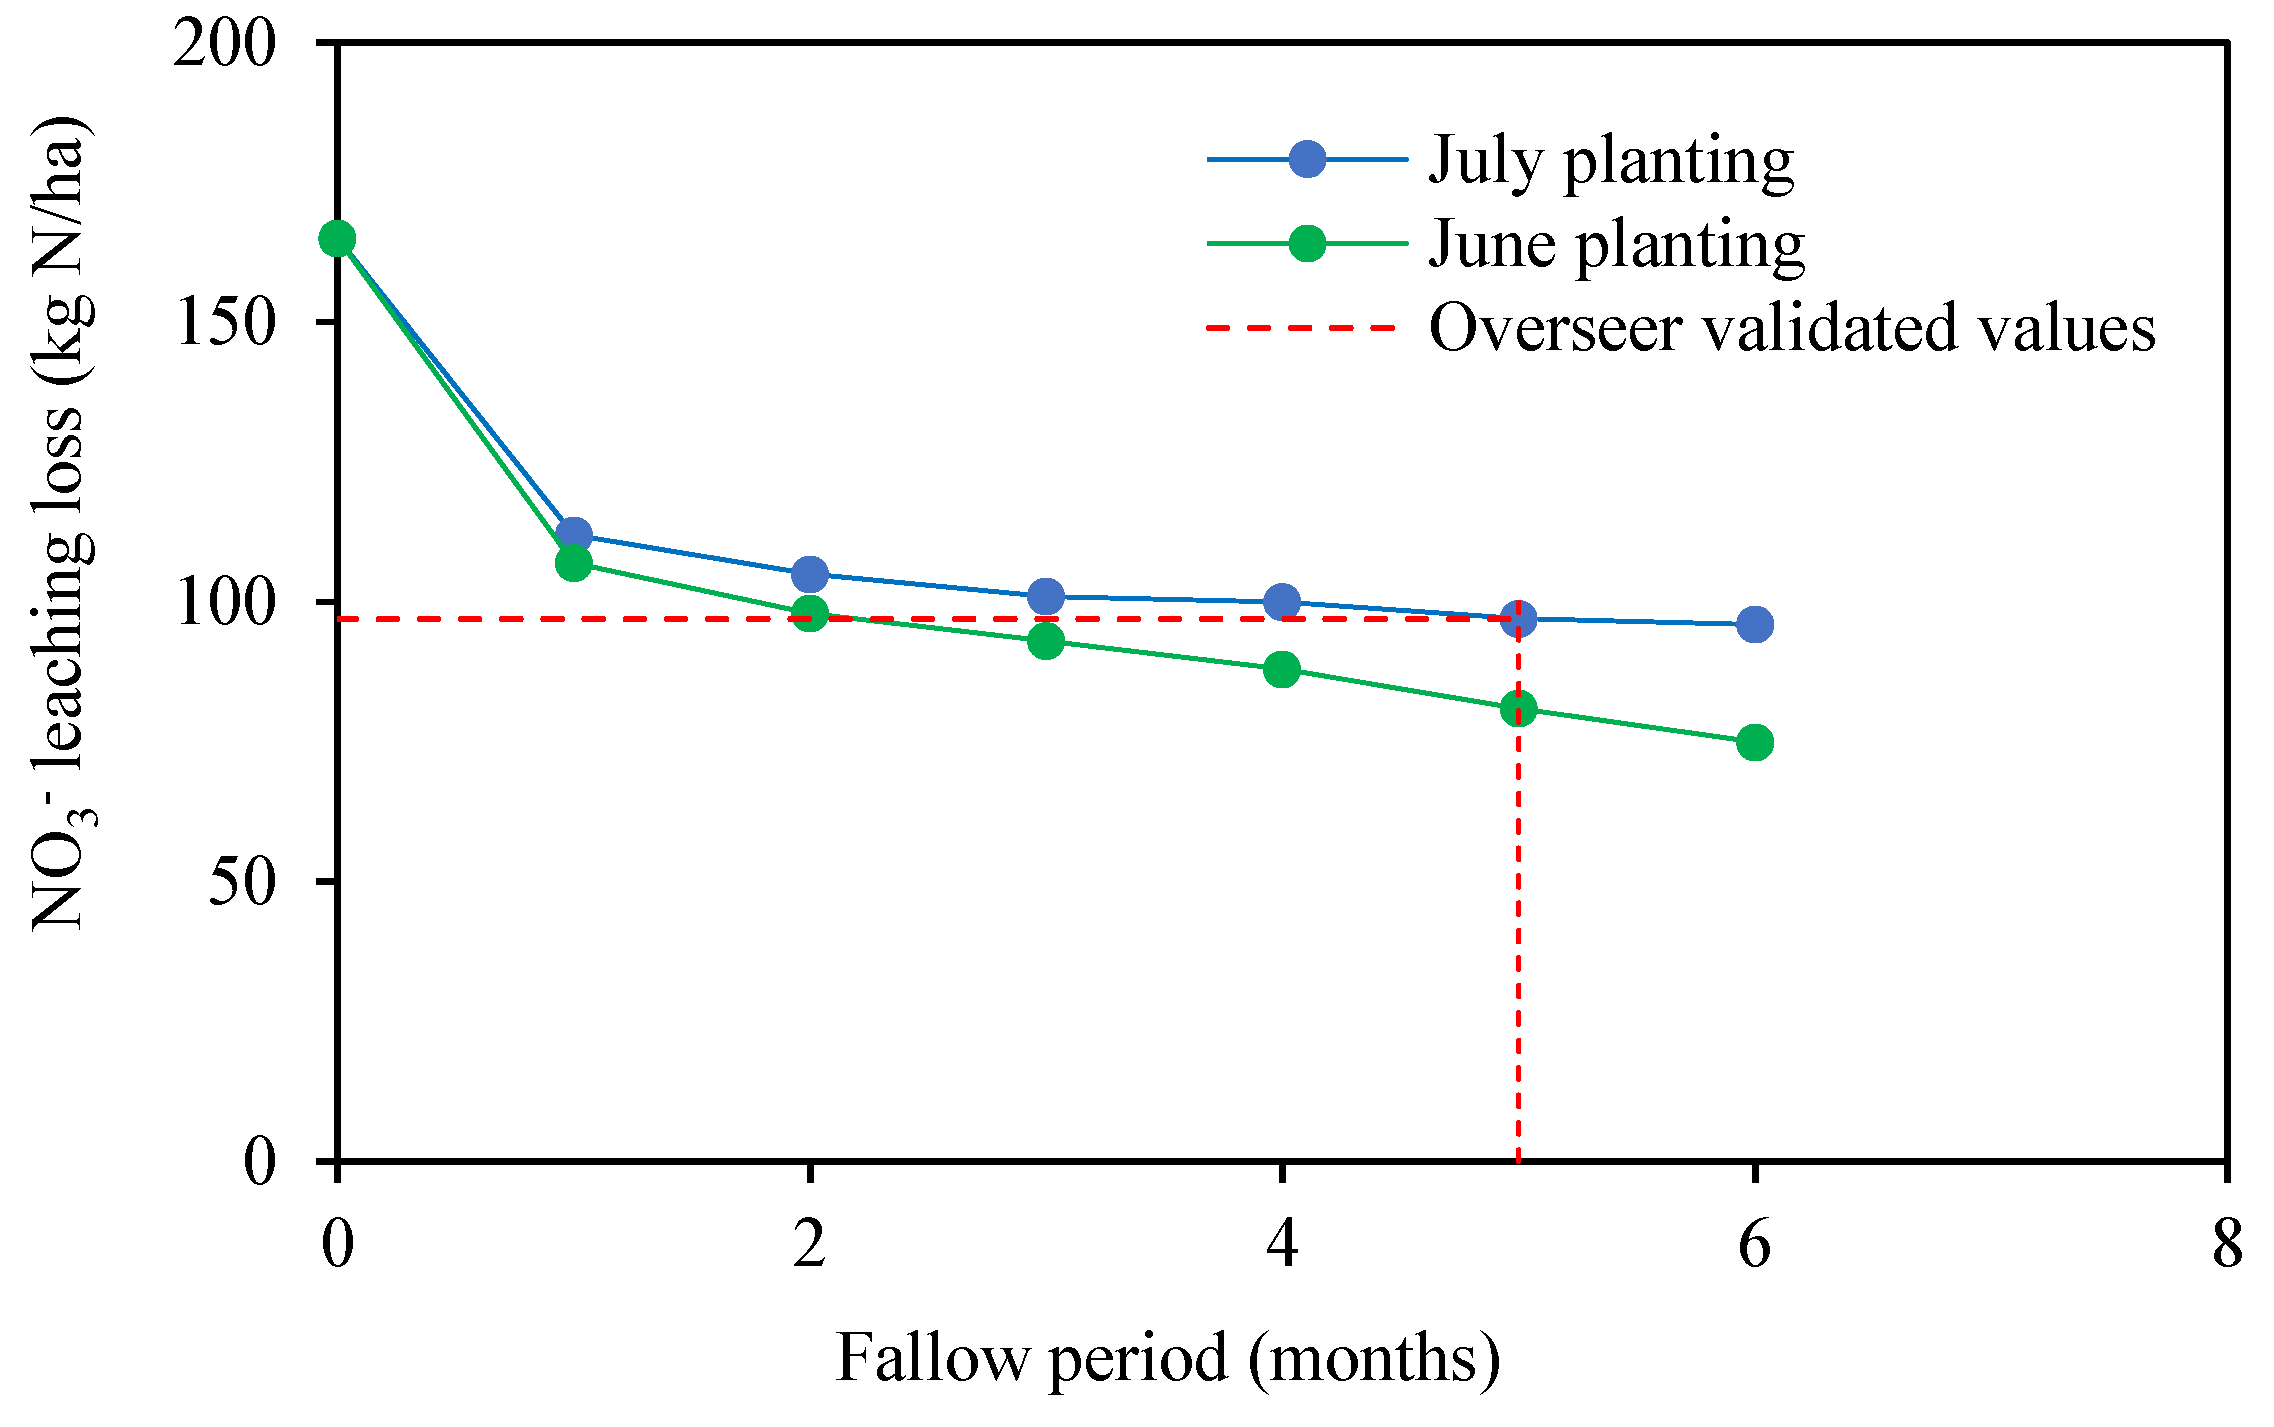
Figure 5.
Effect of soil textural group on Overseer simulated NO3− leaching loss.
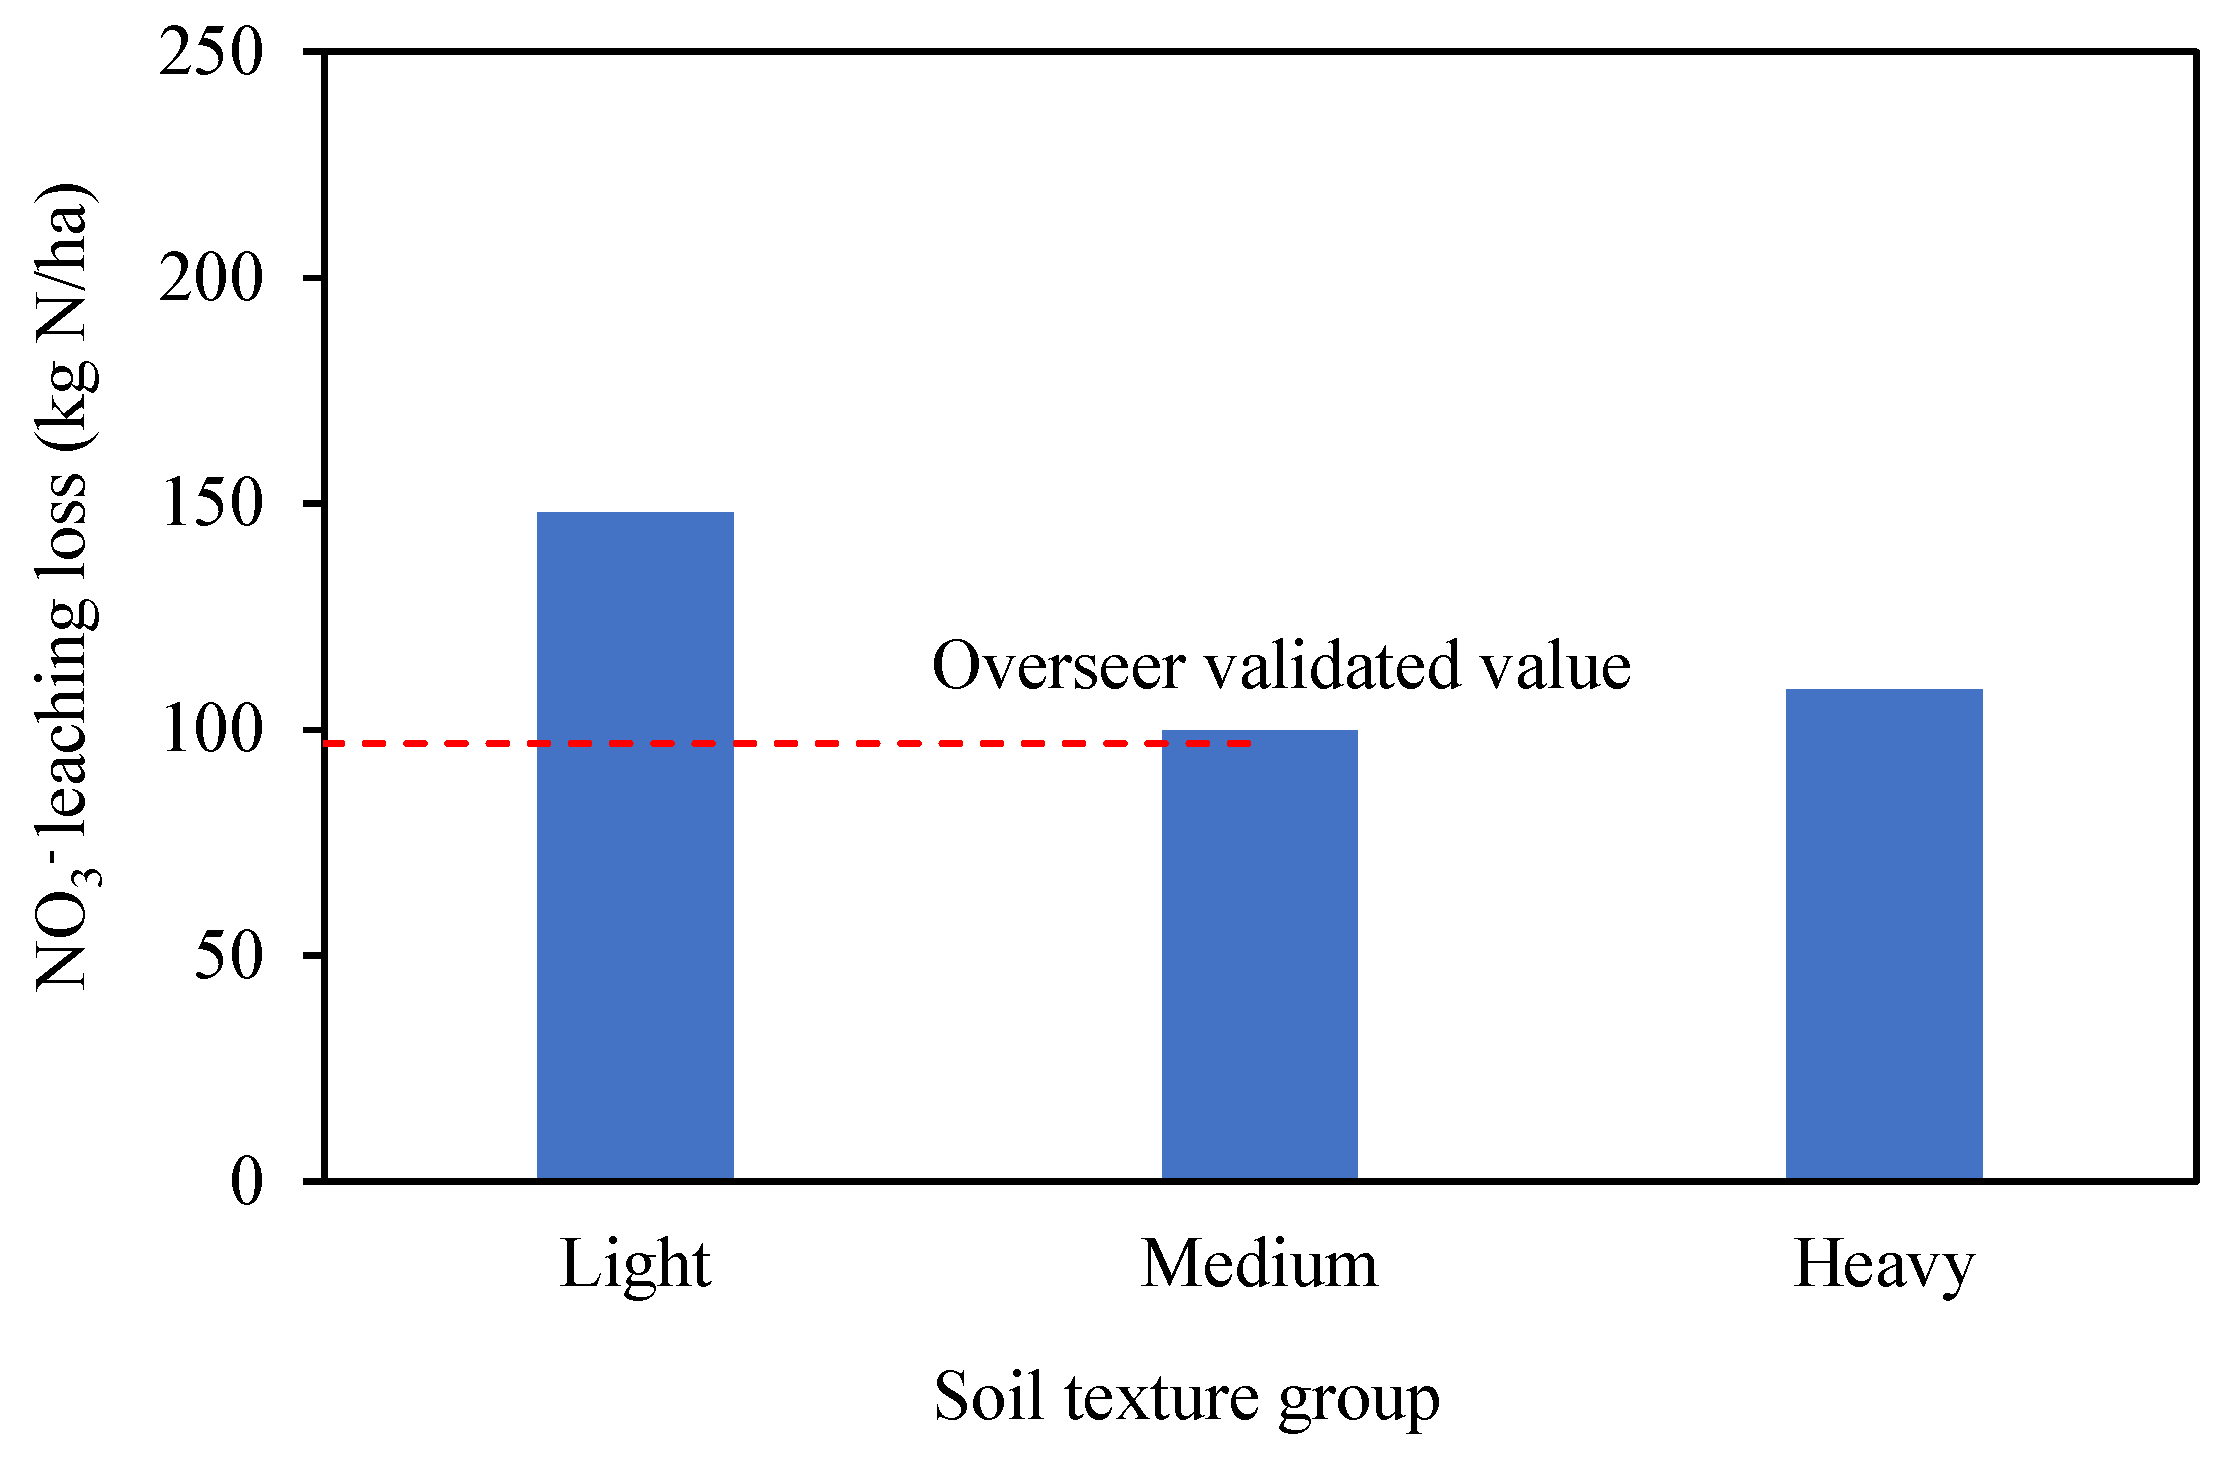
Figure 6.
Effect of saturated hydraulic conductivity on Overseer simulated NO3− leaching loss.
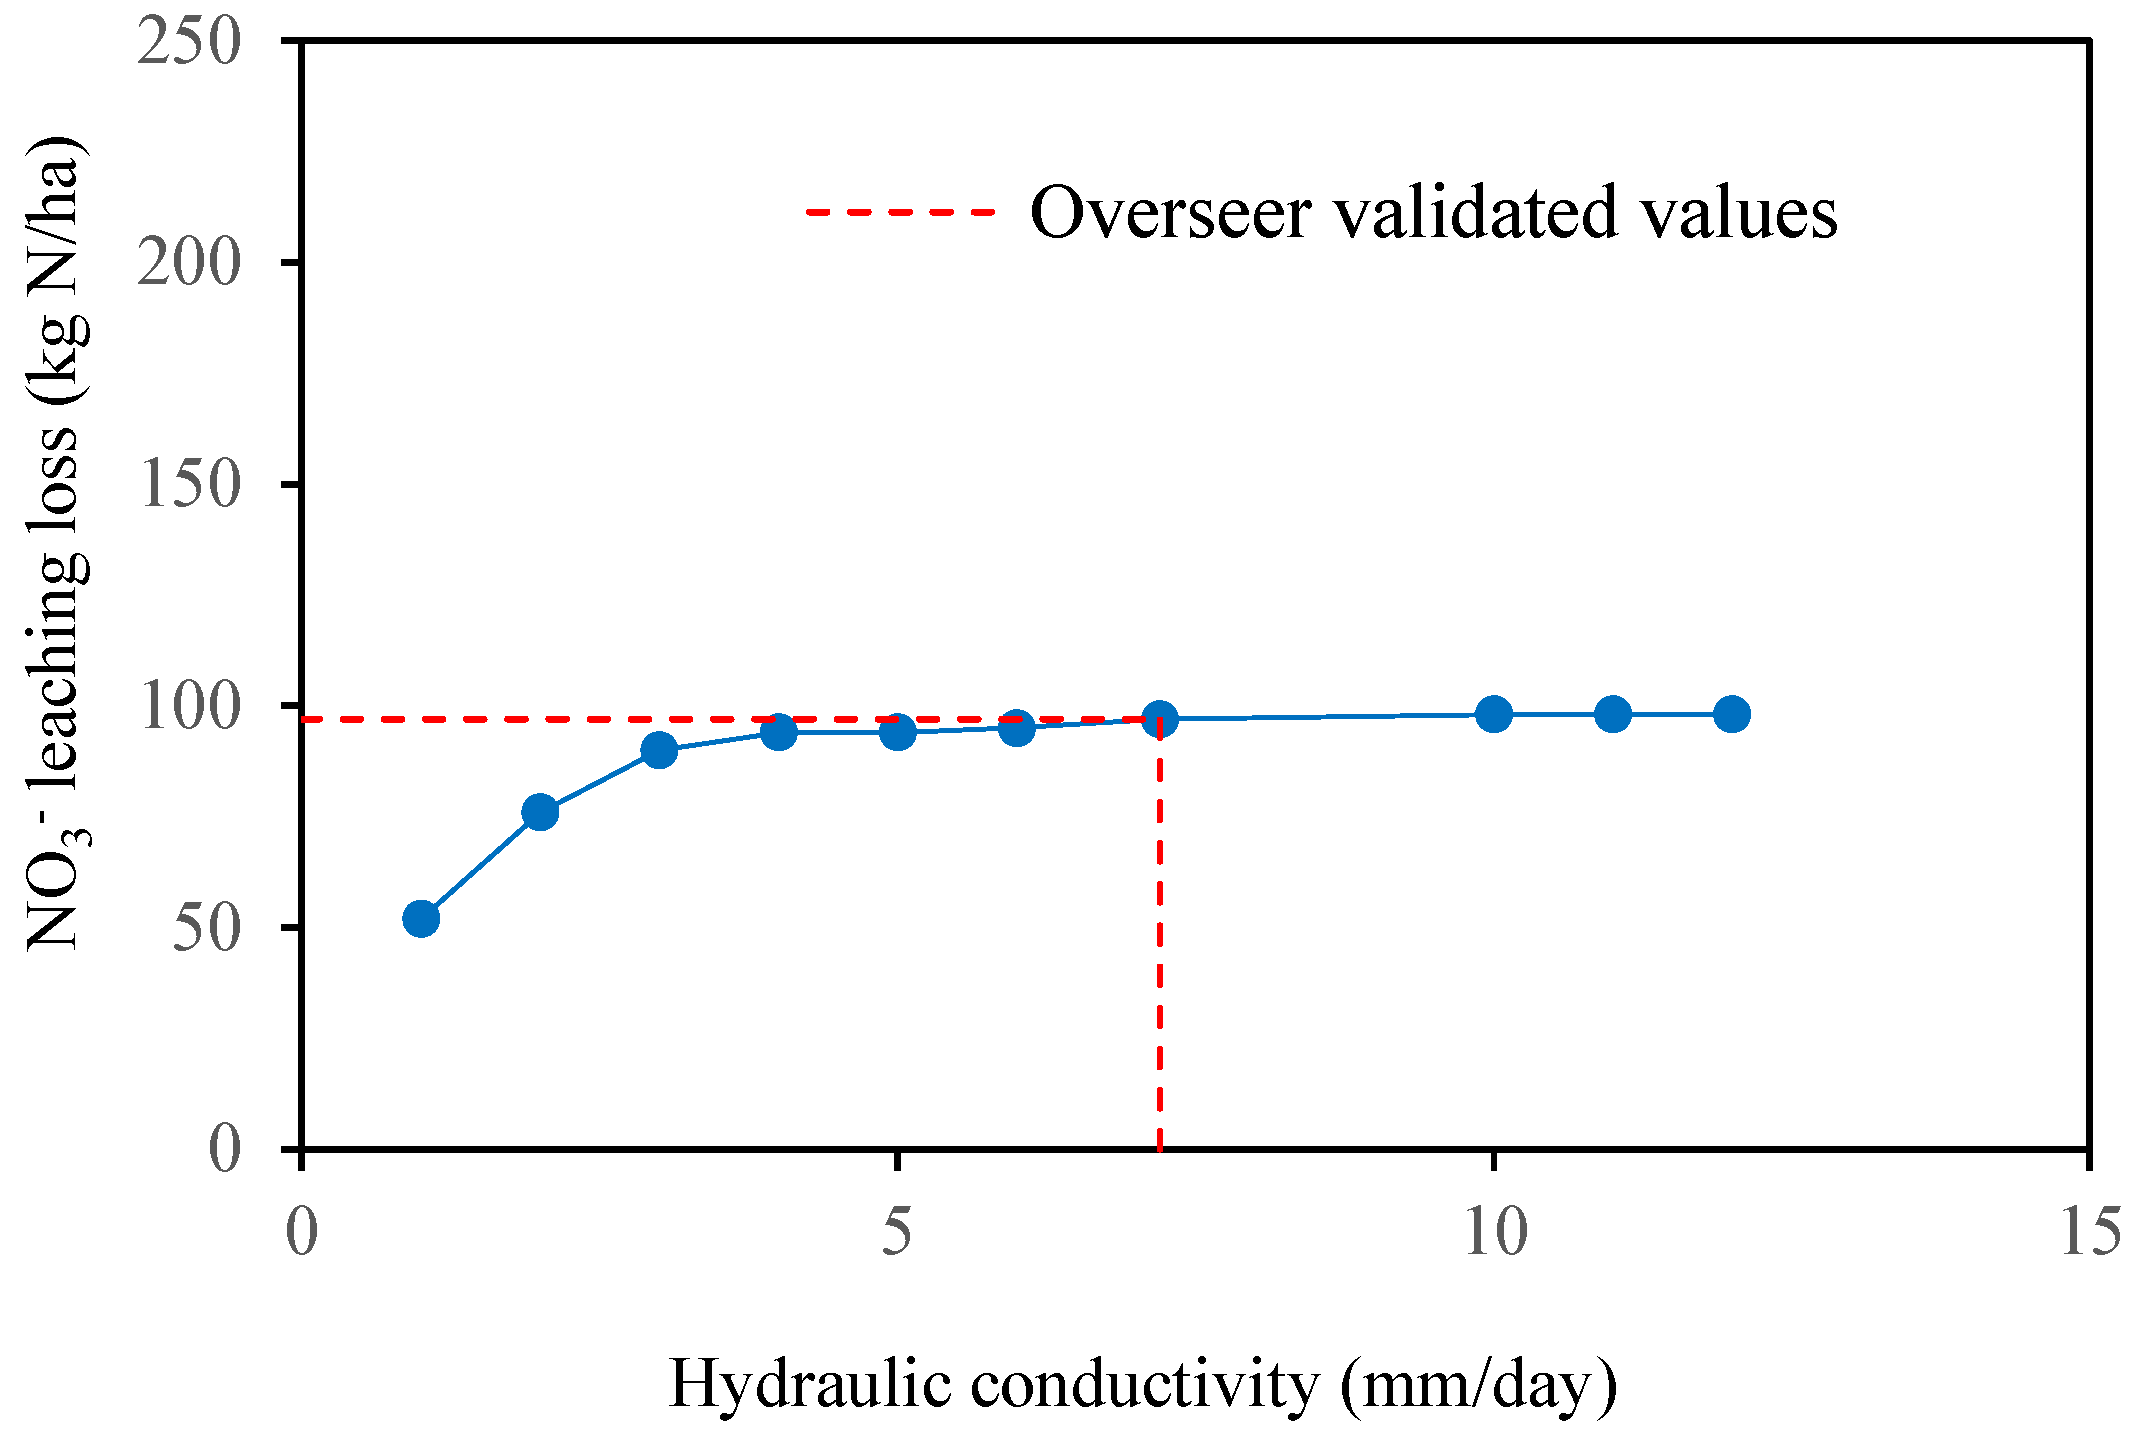
Figure 7.
Effect of crop material incorporation into the soil on Overseer simulated NO3− leaching loss.
Figure 7.
Effect of crop material incorporation into the soil on Overseer simulated NO3− leaching loss.
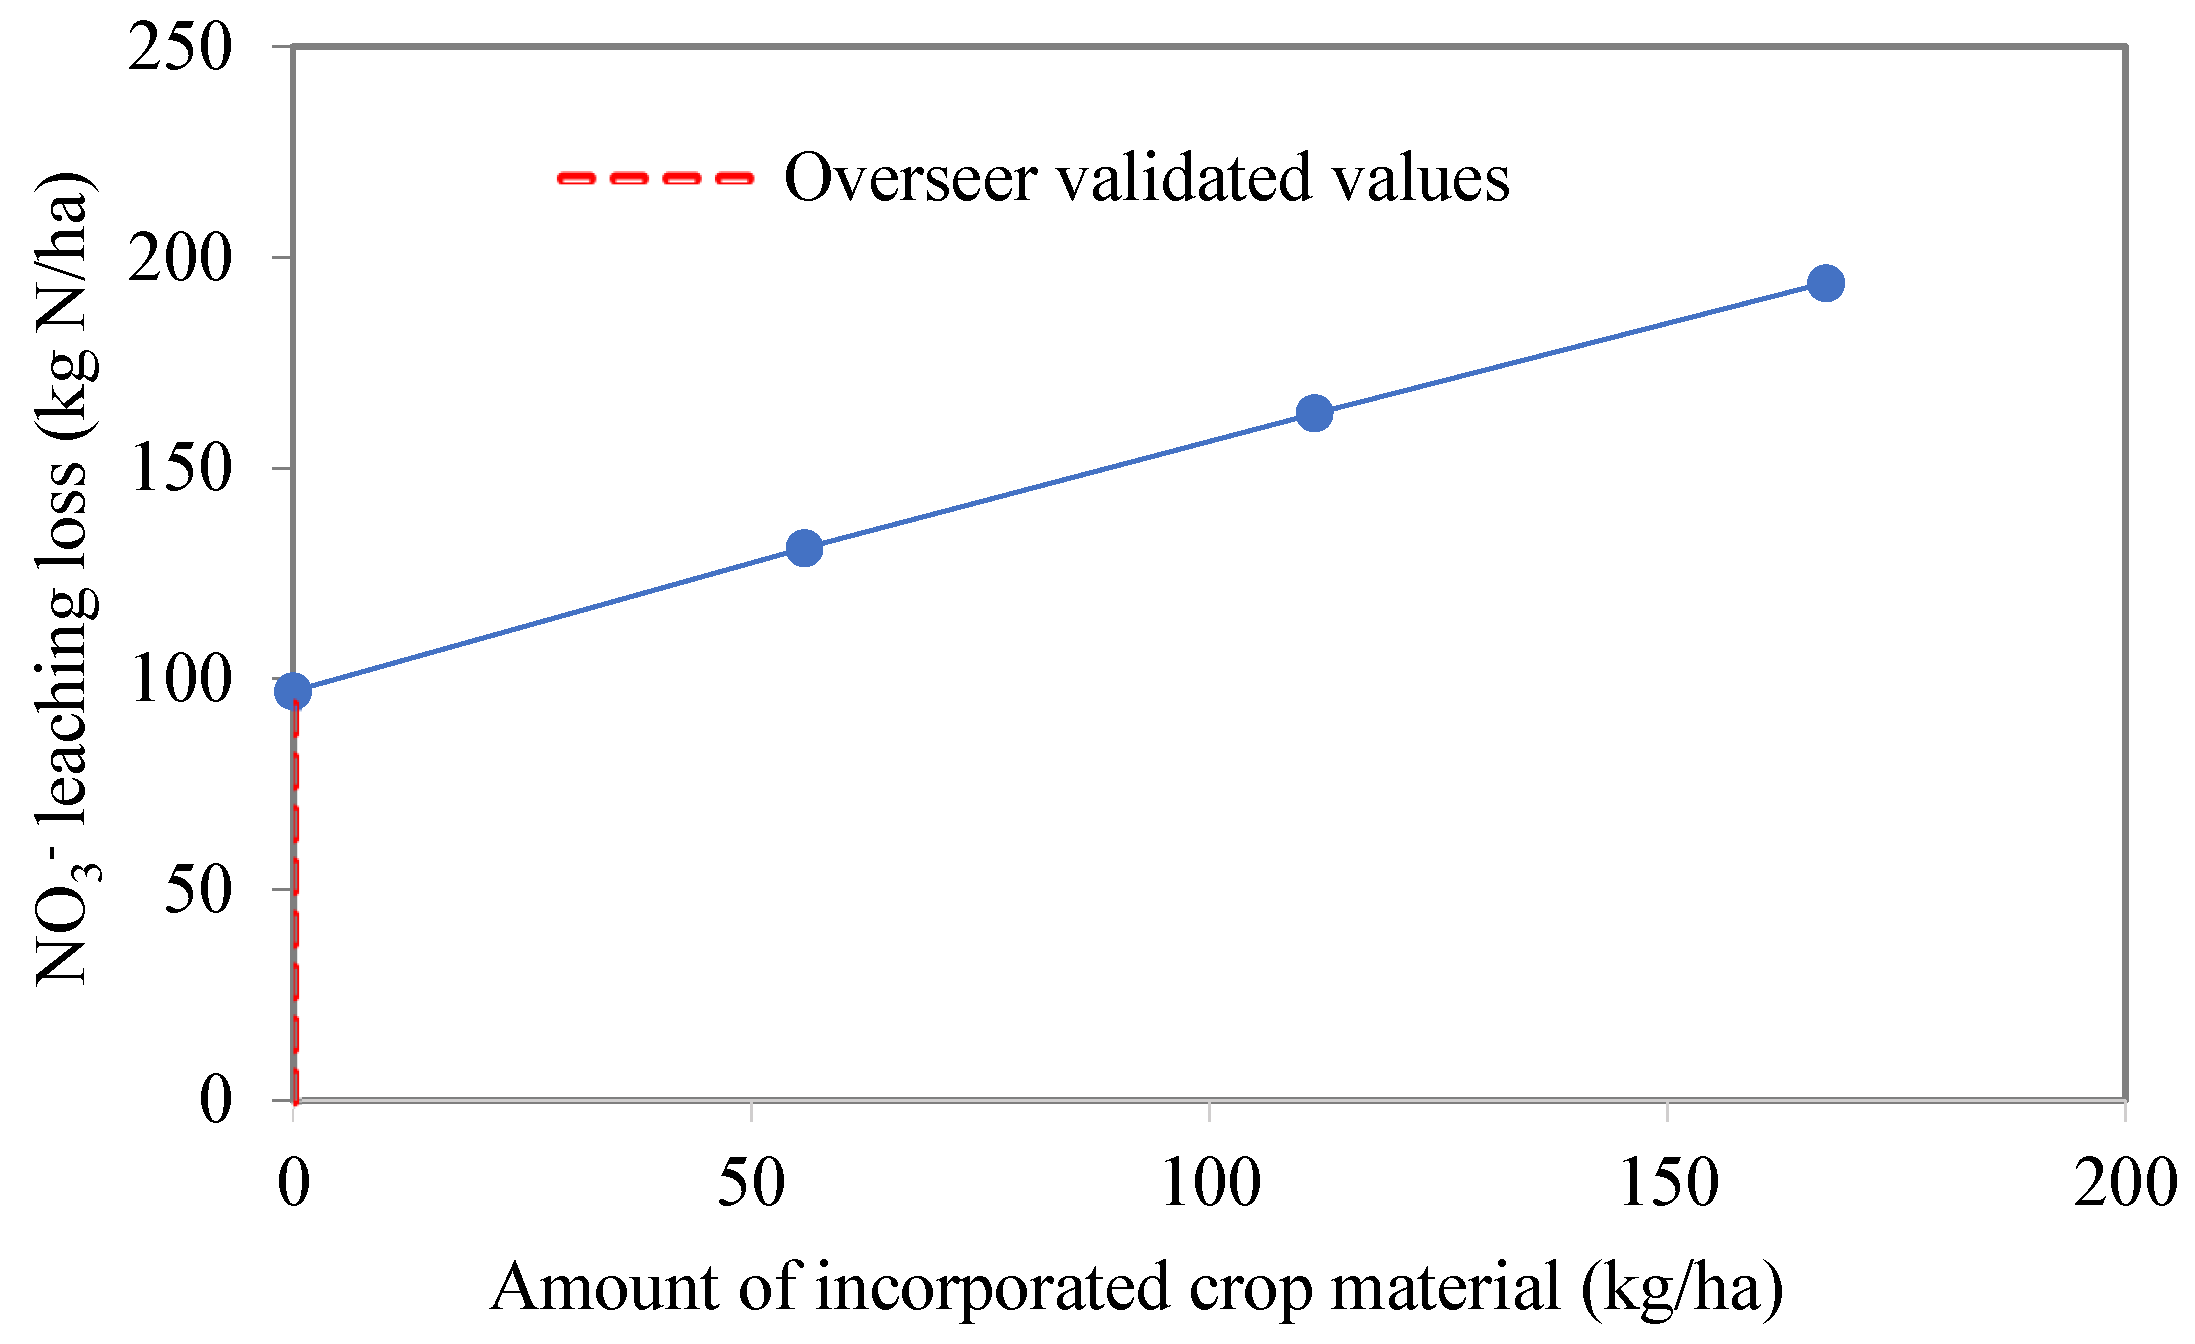
Figure 8.
Validation of overall measured and Overseer simulated NO3− leaching losses below 60 cm for the two years from lysimeter studies. The solid line is the 1:1 line. Significance *** P < 0.001.
Figure 8.
Validation of overall measured and Overseer simulated NO3− leaching losses below 60 cm for the two years from lysimeter studies. The solid line is the 1:1 line. Significance *** P < 0.001.
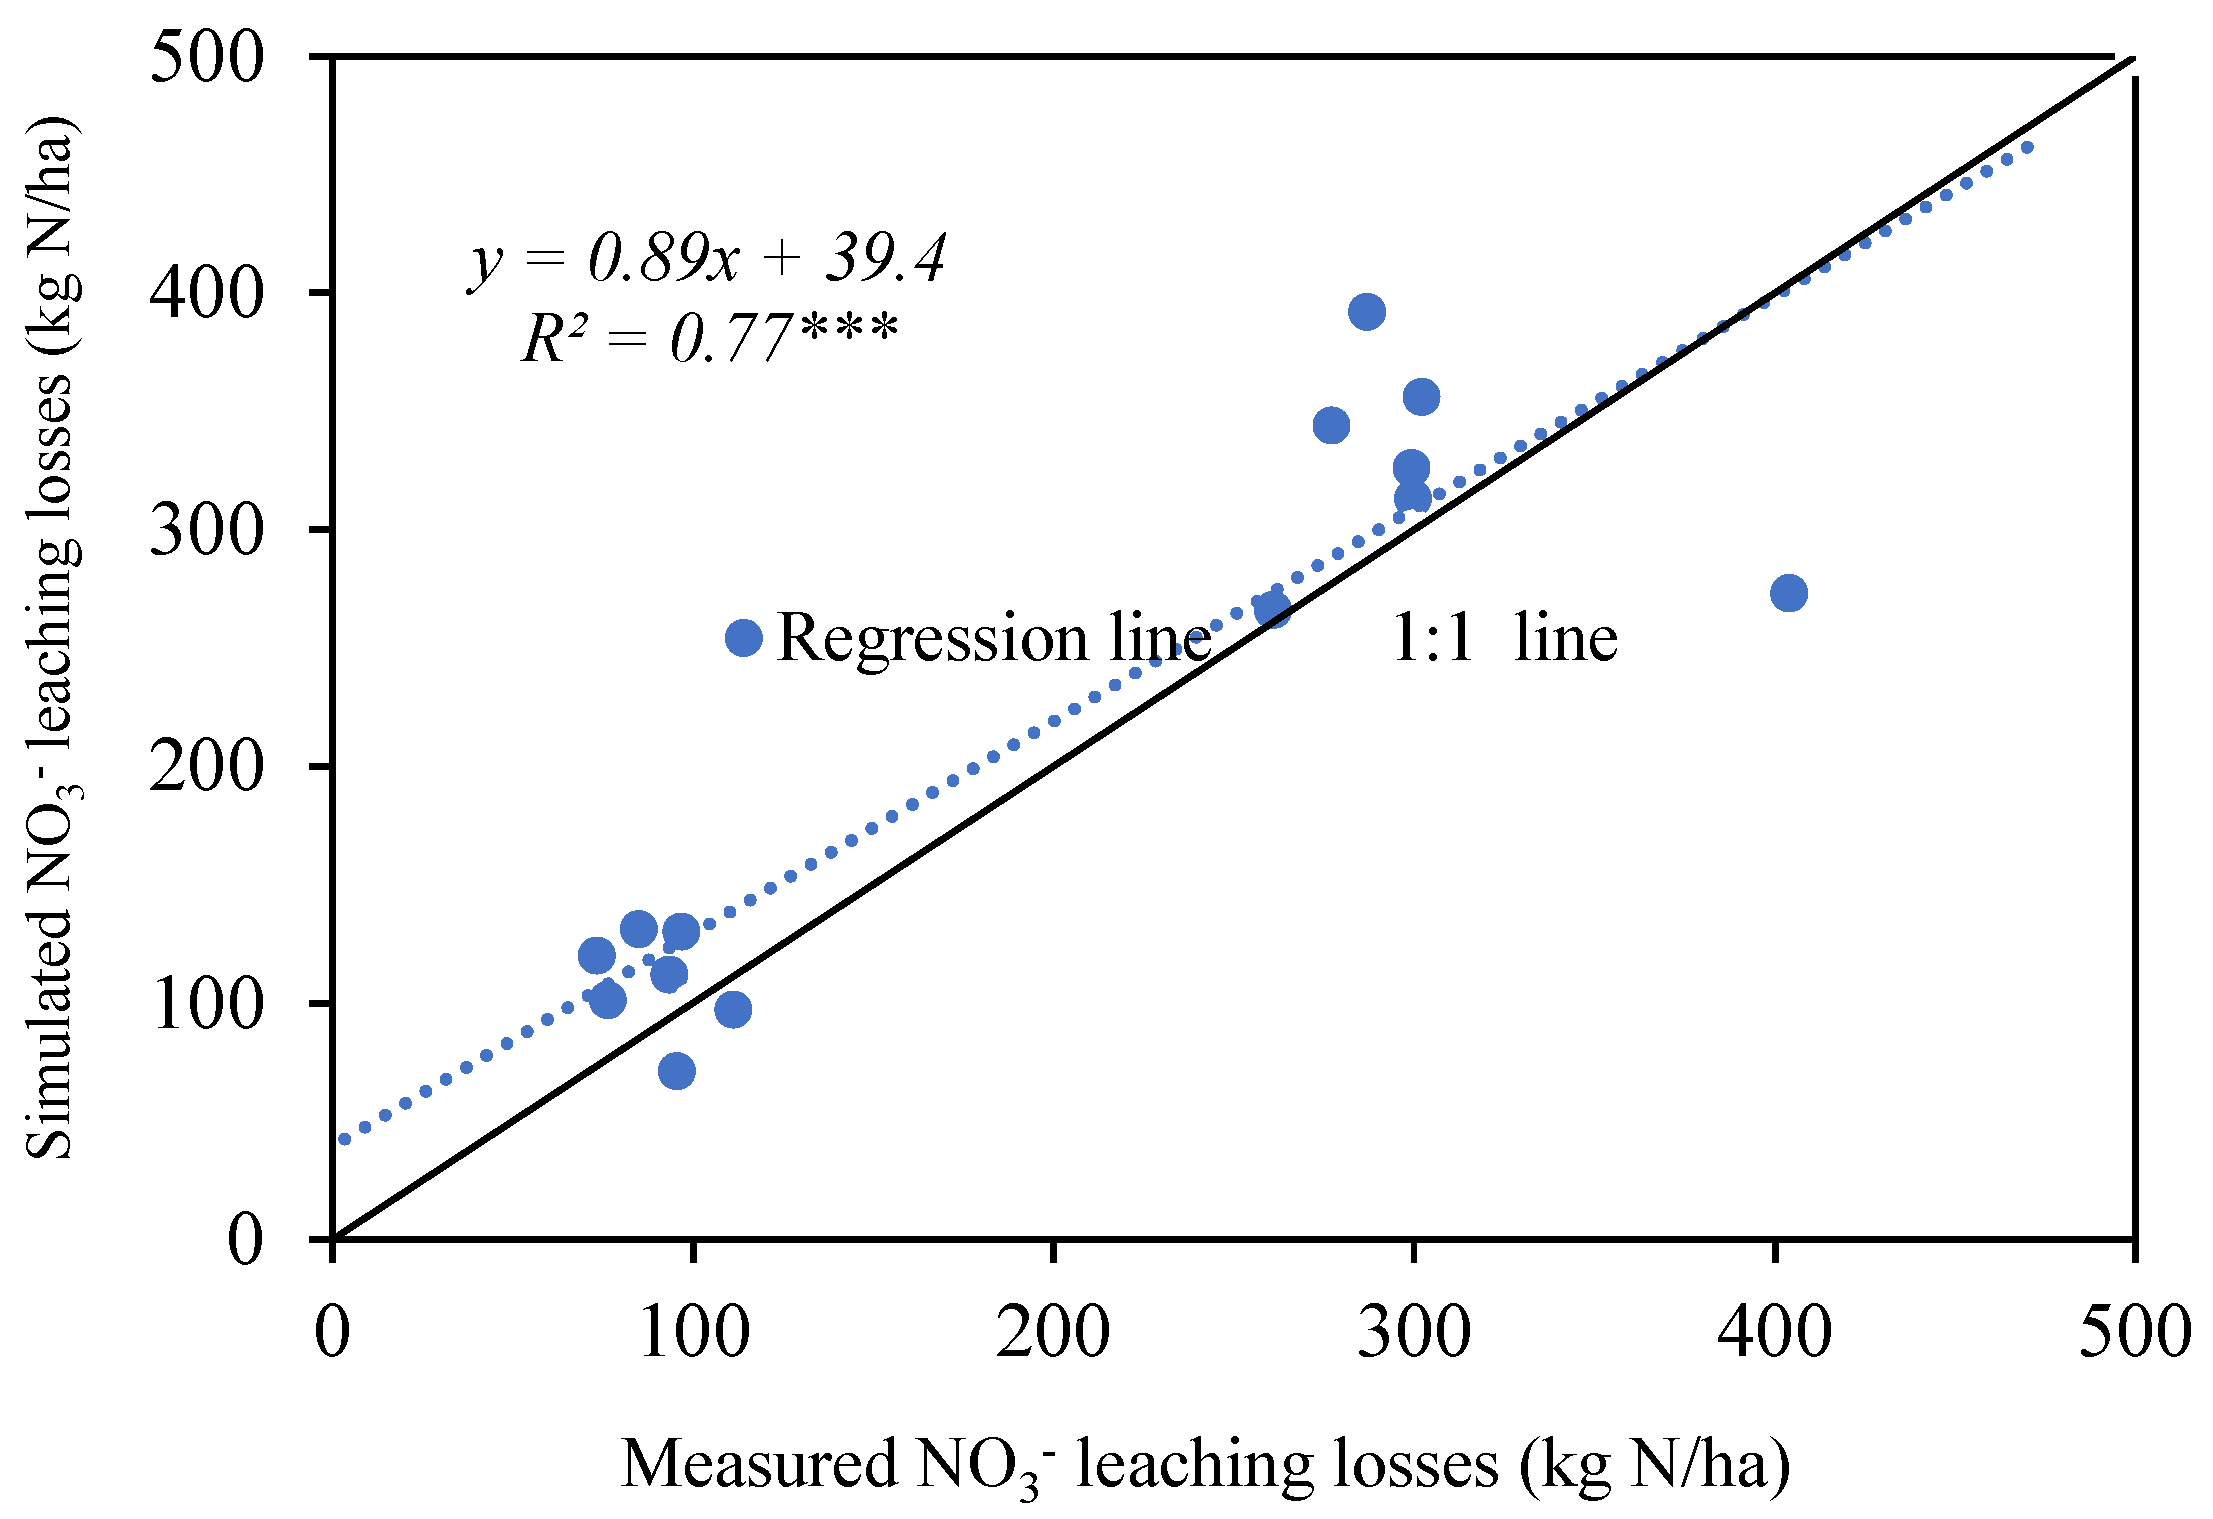

Table 1.
Simulation scenarios used in Overseer to predict NO3− leaching losses in year 1 and year 2.
Table 1.
Simulation scenarios used in Overseer to predict NO3− leaching losses in year 1 and year 2.
An additional N input of 36 kg N/ha of Nitrophoska was included in scenarios 2,3,4,5,6 and 7 for year 1. Scenarios 2, 4 and 6 were treated as single applications. CAN refers to Calcium Ammonium Nitrate.
Table 2.
Key soil profile information used in Overseer for simulating NO3− leaching.
Table 3.
Crop management data used in the Overseer for beetroot and pak choi cultivation.
Table 4.
Key management information used in the Overseer model for beetroot and pak choi cropping in year 1 and year 2.
Table 4.
Key management information used in the Overseer model for beetroot and pak choi cropping in year 1 and year 2.
|
No. |
Input variables |
Simulation scenarios | |||||||
| Ctrl | CRF 1 | CRF 2 | STD 1 | STD 2 | EXC 1 | EXC 2 | |||
| Beetroot (year 1) | |||||||||
| 1. | Soil residual N (kg N/ha) | 32 | 32 | 32 | 32 | 32 | 32 | 32 | |
| 2. | Fresh yield (t/ha) | 64 | 70 | 69 | 65 | 73 | 70 | 65 | |
| 3. | Month and amount of fertiliser application (kg N/ha) (including Nitrophoska) | 0 | Jan, 115.2 | Jan, Mar 115.2 | Jan, 117.0 | Jan, Feb 117.0 | Jan, 198.0 | Jan, 198.0 | |
| 4. | Amount of incorporated harvest material, dry matter (DM) and N concentration | ||||||||
| (a) Beetroots | Amount (kg) | 63632 18 3.3 |
70208 14 3.5 |
68560 14 2.7 |
65112 16 3.0 |
72620 17 3.4 |
69888 16 2.7 |
65024 15 3.5 |
|
| DM% | |||||||||
| N % | |||||||||
| (b) Beetroot leaves | Amount (kg) | 33696 11 2.5 |
34544 11 2.8 |
34080 11 2.6 |
35776 11 2.7 |
38928 11 2.7 |
32496 12 2.5 |
36736 11 2.9 |
|
| DM% | |||||||||
| N % | |||||||||
| Pak choi (year 2) | |||||||||
| 1. | Soil residual N (kg N/ha) | 92.2 | 110.4 | 97.4 | 80.9 | 120 | 84.2 | 94.4 | |
| 2. | Fresh yield (t/ha) | 102 | 117 | 112 | 111 | 114 | 130 | 124 | |
| 3. | Amount of harvest material incorporated | 0 | 0 | 0 | 0 | 0 | 0 | 0 | |
| 4. | Month and amount of fertiliser application (kg N/ha) | 0 | Jan, 48 | Jan, Mar 48 | Jan, 49 | Jan, Mar 48 | Jan, 97 | Jan, Mar 98 | |
Table 5.
Measured and Overseer simulated values of cumulative (annual) drainage losses below 60 cm soil depth.
Table 5.
Measured and Overseer simulated values of cumulative (annual) drainage losses below 60 cm soil depth.
| Year | Simulation scenario | Cumulative water drainage (mm) | |
| Measured (mean ± 95% C.I) | Overseer simulated | ||
| Year 1 | CTRL | 440 ± 183 | 621 |
| CRF1 | 425 ± 221 | 621 | |
| CRF2 | 641 ± 162 | 621 | |
| STD 1 | 490 ± 230 | 621 | |
| STD 2 | 439 ± 140 | 621† | |
| EXC 1 | 466 ± 109 | 621† | |
| EXC 2 | 410 ± 255 | 621 | |
| Year 2 | CTRL | 422 ± 368 | 556 |
| CRF1 | 383 ± 220 | 529 | |
| CRF2 | 559 ± 147 | 529 | |
| STD 1 | 482 ± 380 | 556 | |
| STD 2 | 522 ± 288 | 556 | |
| EXC 1 | 431 ± 265 | 529 | |
| EXC 2 | 439 ± 290 | 529 | |
†Values indicate that simulated values are not within the 95% C.I of the measured values.
Table 6.
Comparison of measured and Overseer-simulated NO3− leaching losses under beetroot cultivation across fertiliser treatments (kg N/ha).
Table 6.
Comparison of measured and Overseer-simulated NO3− leaching losses under beetroot cultivation across fertiliser treatments (kg N/ha).
| Treatments | Measured leaching losses (kg N/ha) | Overseer predicted leaching losses (kg N/ha) |
| CTRL | 260.9 | 266 |
| CRF 1 | 299.2 | 326 |
| CRF 2 | 404.2 | 273 |
| STD 1 | 299.6 | 344 |
| STD 2 | 302.1 | 392 |
| EXC 1 | 277.0 | 313 |
| EXC 2 | 286.9 | 356 |
Table 7.
Comparison of measured and Overseer-simulated NO3− leaching losses under pak choi cultivation across fertiliser treatments (kg N/ha).
Table 7.
Comparison of measured and Overseer-simulated NO3− leaching losses under pak choi cultivation across fertiliser treatments (kg N/ha).
| Treatments | Measured leaching losses (kg N/ha) | predicted leaching losses (kg N/ha) |
| CTRL | 73.4 | 120 |
| CRF 1 | 76.4 | 101 |
| CRF 2 | 111.2 | 97 |
| STD 1 | 96.7 | 130 |
| STD 2 | 78.3 | 131 |
| EXC 1 | 93.4 | 112 |
| EXC 2 | 95.5 | 71 |
Table 8.
Statistical evaluation of Overseer simulated NO3− leaching losses from different scenarios.
Table 8.
Statistical evaluation of Overseer simulated NO3− leaching losses from different scenarios.
| Year | Simulations | Md | RMSE | Er% |
| Year 1 | CTRL | -5.0 ns | 157.0 | - 0.4 |
| CRF 1 | - 26.8 ns | 113.7 | -1.8 | |
| CRF 2 | 131.1* | 151.0 | 6.5 | |
| STD 1 | - 13.3 ns | 135.3 | - 0.9 | |
| STD 2 | -53.8 ns | 114.0 | -3.5 | |
| EXC 1 | - 66.9 ns | 124.1 | -4.8 | |
| EXC 2 | - 105 ns | 180.3 | - 7.3 | |
| Year 2 | CTRL | - 46.6 ns | 59.4 | - 12.7 |
| CRF 1 | 24.6 ns | 39.8 | -6.4 | |
| CRF 2 | 14.2 ns | 47.8 | 2.5 | |
| STD 1 | - 33.2 ns | 67.6 | - 6.8 | |
| STD 2 | - 52.7* | 62.6 | - 13.4 | |
| EXC 1 | - 18.5 ns | 48.0 | - 3.9 | |
| EXC 2 | 24.5ns | 51.5 | 5.1 |
Significance * P < 0.05 ns—non significant.
Table 9.
Values of the goodness of fit criteria computed for overall performance for Overseer simulated NO3− leaching losses.
Table 9.
Values of the goodness of fit criteria computed for overall performance for Overseer simulated NO3− leaching losses.
| Statistical parameter | NO3-leaching loss (kgN /ha) |
P value |
| Correlation coefficient (r) | 0.89 | < 0.0001 |
| Slope (b) | 0.89 | < 0.0001 |
| Intercept (a) | 39.4 | 0.21 |
Disclaimer/Publisher’s Note: The statements, opinions and data contained in all publications are solely those of the individual author(s) and contributor(s) and not of MDPI and/or the editor(s). MDPI and/or the editor(s) disclaim responsibility for any injury to people or property resulting from any ideas, methods, instructions or products referred to in the content. |
© 2025 by the authors. Licensee MDPI, Basel, Switzerland. This article is an open access article distributed under the terms and conditions of the Creative Commons Attribution (CC BY) license (http://creativecommons.org/licenses/by/4.0/).
Copyright: This open access article is published under a Creative Commons CC BY 4.0 license, which permit the free download, distribution, and reuse, provided that the author and preprint are cited in any reuse.


