
Submitted:
15 December 2025
Posted:
16 December 2025
You are already at the latest version
Abstract
This study aimed to investigate the efficacy of a 12-week blood flow restriction (BFR) resistance training (BFRRT) program in enhancing anaerobic power. Changes in anaerobic power were compared following 12 weeks of resistance training using three approaches: low-load resistance training with BFRRT at 30% of one-repetition maximum (1RM), traditional high-load resistance training (HRT) at 80% of 1RM, and traditional low-load resistance training (LRT) at 30% of 1RM. Twenty-one male college students were randomly assigned to the BFRRT (n = 7), HRT (n = 7), or LRT (n = 7) groups. The BFR for BFRRT was applied to the proximal femur at 100–130 mmHg. Each group exercised three times per week for 12 weeks. Anaerobic power and metabolic fatigue levels were evaluated using the Wingate Anaerobic Test (WAnT) every 3 weeks, with blood lactate concentrations measured before and after each session. Outcomes included peak power, mean power, fatigue rate, and time to peak power, analyzed via two-way mixed-model analysis of variance. Results showed no significant differences across groups except for an interaction between training periods and group with respect to peak power. Post-hoc analysis revealed that BFRRT improved peak power by Week 6, HRT by Week 9, and LRT showed no improvements. BFRRT significantly enhanced anaerobic power in a shorter duration compared with HRT, despite utilizing lower loads and normal-speed exercises. These findings suggest that BFRRT is an effective and safe method for improving anaerobic power while reducing the risk of injury associated with HRT.
Keywords:
1RM
; anaerobic power
; blood flow restriction resistance training
; anaerobic test
; Wingate cycle ergometer test
1. Introduction
Blood flow restriction (BFR) resistance training (BFRRT) involves applying an occlusion device to the proximal limb to restrict venous return [1,2]. BFR is primarily applied in low-load exercise training [2]. Typically, muscle hypertrophy and strength improvement require resistance exercise with a weight load of at least 65% of one-repetition maximum (1RM). For optimal results, a load of 80% 1RM or higher is usually recommended [3,4,5]. However, applying such high loads increases the risk of injuries and accidents [6]. Conversely, reducing the weight load to minimize risks lowers mechanical stress and metabolic alteration, thereby reducing the training's effectiveness [7,8,9].
Interestingly, BFRRT has been shown to induce significant muscle hypertrophy and strength gains even at low loads of 20%–30% 1RM, surpassing the effects of traditional low-load resistance training (LRT) at similar loads [10]. In some studies, the benefits of BFRRT were comparable with those of high-load resistance training (HRT) with 80% 1RM [11,12,13,14]. Therefore, BFRRT is proposed as a training method that bridges the limitations of HRT and traditional LRT at 20%–30% 1RM.
In anaerobic performance tasks requiring rapid strength and speed such as sprint sports, the capacity for anaerobic metabolism is a key determinant [15]. Anaerobic metabolism heavily relies on fast-twitch (FT) fibers using ATP, PCr, glycogen, and glucose. Prior studies have shown that BFR training, which increases FT fiber recruitment, acutely elevates anaerobic biomarkers such as creatine phosphokinase and lactate levels [13,16]. Additionally, EMG studies have revealed greater muscle activation during BFR training compared to unrestricted training [13,17,18,19], and Yasuda et al. [20] reported a significant increase in FT fiber cross-sectional area after only two weeks of twice-daily BFR training. These findings collectively support the potential for chronic adaptations in anaerobic power through BFRRT, although direct investigations remain limited.
Furthermore, unlike conventional strength assessments via isokinetic equipment, anaerobic capacity can be more accurately assessed through performance-based measures like the Wingate test, which has the added advantage of predicting sprint performance more directly. The effectiveness of BFRRT at such low weights is attributed to its unique ability to engage more muscle fibers [10,11,21]. For instance, Tanimoto et al. [21] observed that BFR increases the mobilization of fast-twitch muscle fibers by enhancing hypoxic conditions during muscle contractions. Plasma creatine kinase and blood lactate concentrations, which are indicators of anaerobic energy metabolism, are elevated to levels higher than LRT immediately after BFRRT in these intramuscular environments [13,22,23,24]. Similarly, Takarada et al. [25] reported that blood lactate concentration changes during BFRRT were greater than those observed during HRT combined with BFR.
Muscle fiber recruitment and resistance to energy metabolism are influenced by the load applied and exercise velocity [26,27,28]. Research indicates that BFRRT is effective when performed at normal speeds with low loads (20%–30% 1RM), using concentric and eccentric contractions lasting 3–4 s. This approach significantly elevates lactate concentrations, demonstrating the intensity of BFRRT [29]. Elevated plasma creatine kinase and lactate levels after BFRRT reflect increased anaerobic adenosine triphosphate (ATP) production through the ATP-phosphocreatine (PC) and glycolytic pathways [24]. Consequently, BFRRT induces muscle fatigue and exercise intensity comparable with HRT [22,25]. Because muscle fatigue is a precursor to muscle growth, BFRRT's distinctive energy metabolism could improve both anaerobic power and 1RM, as evidenced by previous studies [30].
However, the extent of anaerobic power improvement through BFRRT remains unclear. Most previous BFRRT studies have used 1RM as an indicator of muscle strength [10]. Although 1RM is correlated with anaerobic power, the improvement in anaerobic power due to long-term BFRRT remains inconclusive. While BFRRT has been shown to elevate plasma creatine kinase and blood lactate concentrations—indicators of anaerobic metabolism—directly linking 1RM improvement to anaerobic power capacity is challenging. This limitation arises because the 1RM test evaluates maximal muscle strength over a very short duration (a few seconds), which is insufficient to assess temporal changes in anaerobic power or the dynamic characteristics relevant to specific sports.
Anaerobic power is a critical determinant of athletic performance across various sports and is considered one of the most reliable indicators of exercise capacity [15,31]. The Wingate Anaerobic Test (WAnT) is widely regarded as one of the most effective methods for evaluating anaerobic power. Unlike many other assessments, the WAnT provides insights into both the maximum power achieved within the initial 4–5 s of effort and the persistence of anaerobic power over a 30-s duration. This comprehensive evaluation engages both the ATP-PC and glycolytic energy systems, making it a valuable tool for assessing anaerobic capacity [32,33]. For individuals or populations where performing high-intensity resistance training with free weights is impractical, the cycle ergometer used in the WAnT offers a feasible and effective alternative [34,35].
This study, therefore, aimed to analyze the effects of BFRRT on anaerobic power using the WAnT and to compare these effects with those of HRT and LRT.
2. Materials and Methods
2.1. Participants
A total of 24 male college students participated in the study. Exclusion criteria included neuromuscular diseases or injuries within the 6 months preceding the study. Participants were randomly assigned to one of three groups: BFRRT group (low weight with BFR, n = 8), HRT group (high weight without BFR, n = 8), and LRT group (low weight without BFR, n = 8). After accounting for three dropouts, the final analysis included 21 participants (Figure 1).
All participants were free of mental or physical illness and exhibited no restrictions on independent ambulation. Before participating, they provided informed consent in accordance with the ethical standards outlined in the Declaration of Helsinki. The study received approval from the institutional Bioethics Committee (approval number: 7002016-A-2015-030). No adverse events were reported during the study period, and participant retention was 100%.
2.2. Exercise Program
Participants in the BFRRT group underwent supervised exercise sessions during the 12-week program, conducted three times per week (Monday, Wednesday, and Friday) between 7:00 AM and 12:00 PM. A 5-min warm-up and cool-down targeting the joints and muscles of the lower body was performed both before and after the primary workout sessions. Resistance exercise equipment was used for seated leg extensions, lying leg curls, and seated leg presses. Each exercise was performed for 10 repetitions at 25%–30% of 1RM across four sets, with rest intervals of 60–90 s between sets.
The 1RM value was assessed to determine the appropriate exercise intensity for the 12-week training program. The indirect estimation equation (1RM = [0.025 × rep wt. × reps] + rep wt.) was applied to calculate the 1RM for each exercise [36]. The participants were male college students who did not engage in regular physical activity. Since they were inexperienced with resistance training, we determined that direct 1RM testing might pose a safety risk. Therefore, we adopted an indirect estimation method to minimize the risk of injury during maximal load testing.
In this study, the external load was maintained at the initial 30% of 1RM throughout the 12-week period. This fixed-load protocol was adopted to standardize the metabolic stimulus and ensure adherence to safety guidelines for BFR training [10,37], while simultaneously isolating the specific effects of blood flow restriction from potential confounding variables driven by load increments [11,12].
Pressurized treatment was administered using a 9-cm-wide, 80-cm-long automatic tourniquet system (DTS-2000w; Daesung Maref, Korea, 2012). The intensity of the BFRRT pressure was set between 100 and 130 mmHg [37,38]. Before each exercise session, an incremental pressure of 100 mmHg was applied, which gradually increased by 5 mmHg every 4 weeks throughout the 12-week exercise program. The HRT group performed exercises similar to those of the BFRRT group, but without the use of BFR, using weights equivalent to 75%–80% of 1RM. Conversely, the LRT group used weights equivalent to 25%–30% of 1RM.
2.3. Experiment Procedures
2.3.1. Rate of Change in Blood Lactate Concentration
During the 12-week exercise program, changes in blood lactate concentrations were evaluated to assess the metabolic fatigue levels of participants. Measurements were taken on the first day (baseline) and the last day of the program (Week 12). A Lactate Pro™ LT-1710 analyzer (Arkray Inc., Japan) was used to collect 5 µL of blood samples from the fingertip. The rate of change in blood lactate concentration was calculated using the following formula: Rate of change = 100 × (Blood lactate value after session − Blood lactate value before session)/Blood lactate value before session).
2.3.2. Wingate 30-s Cycle Ergometer Test
The WAnT was conducted five times at 3-week intervals over the 12-week exercise program (i.e., baseline and at Weeks 3, 6, 9, and 12). The protocol was based on the method described by Bar-Or [39] using a cycle ergometer (Lode Excalibur, Netherlands). The load assigned to participants was determined using the formula: weight × 0.075, which was configured in the Wingate for Windows software (version 1.0.14).
Each participant completed a 5-min warm-up at 80 rpm and rested for 10 min before the measurement. Participants pedaled at 40 rpm starting 20 s before the test, and the measurement supervisor initiated the punctual counter 10 s before the "start" command. Participants were instructed to pedal to exhaustion.
Peak power (watts [W]) was defined as the maximum power output achieved, typically within the first 5 s of the test. Mean power refers to the average power maintained throughout the test duration. The rate of fatigue was calculated as the percentage decline in power output during the test: Rate of fatigue = Peak power − Minimum power/Time from peak to minimum power (W/s). The time to peak power was defined as the duration taken to reach peak power from baseline.
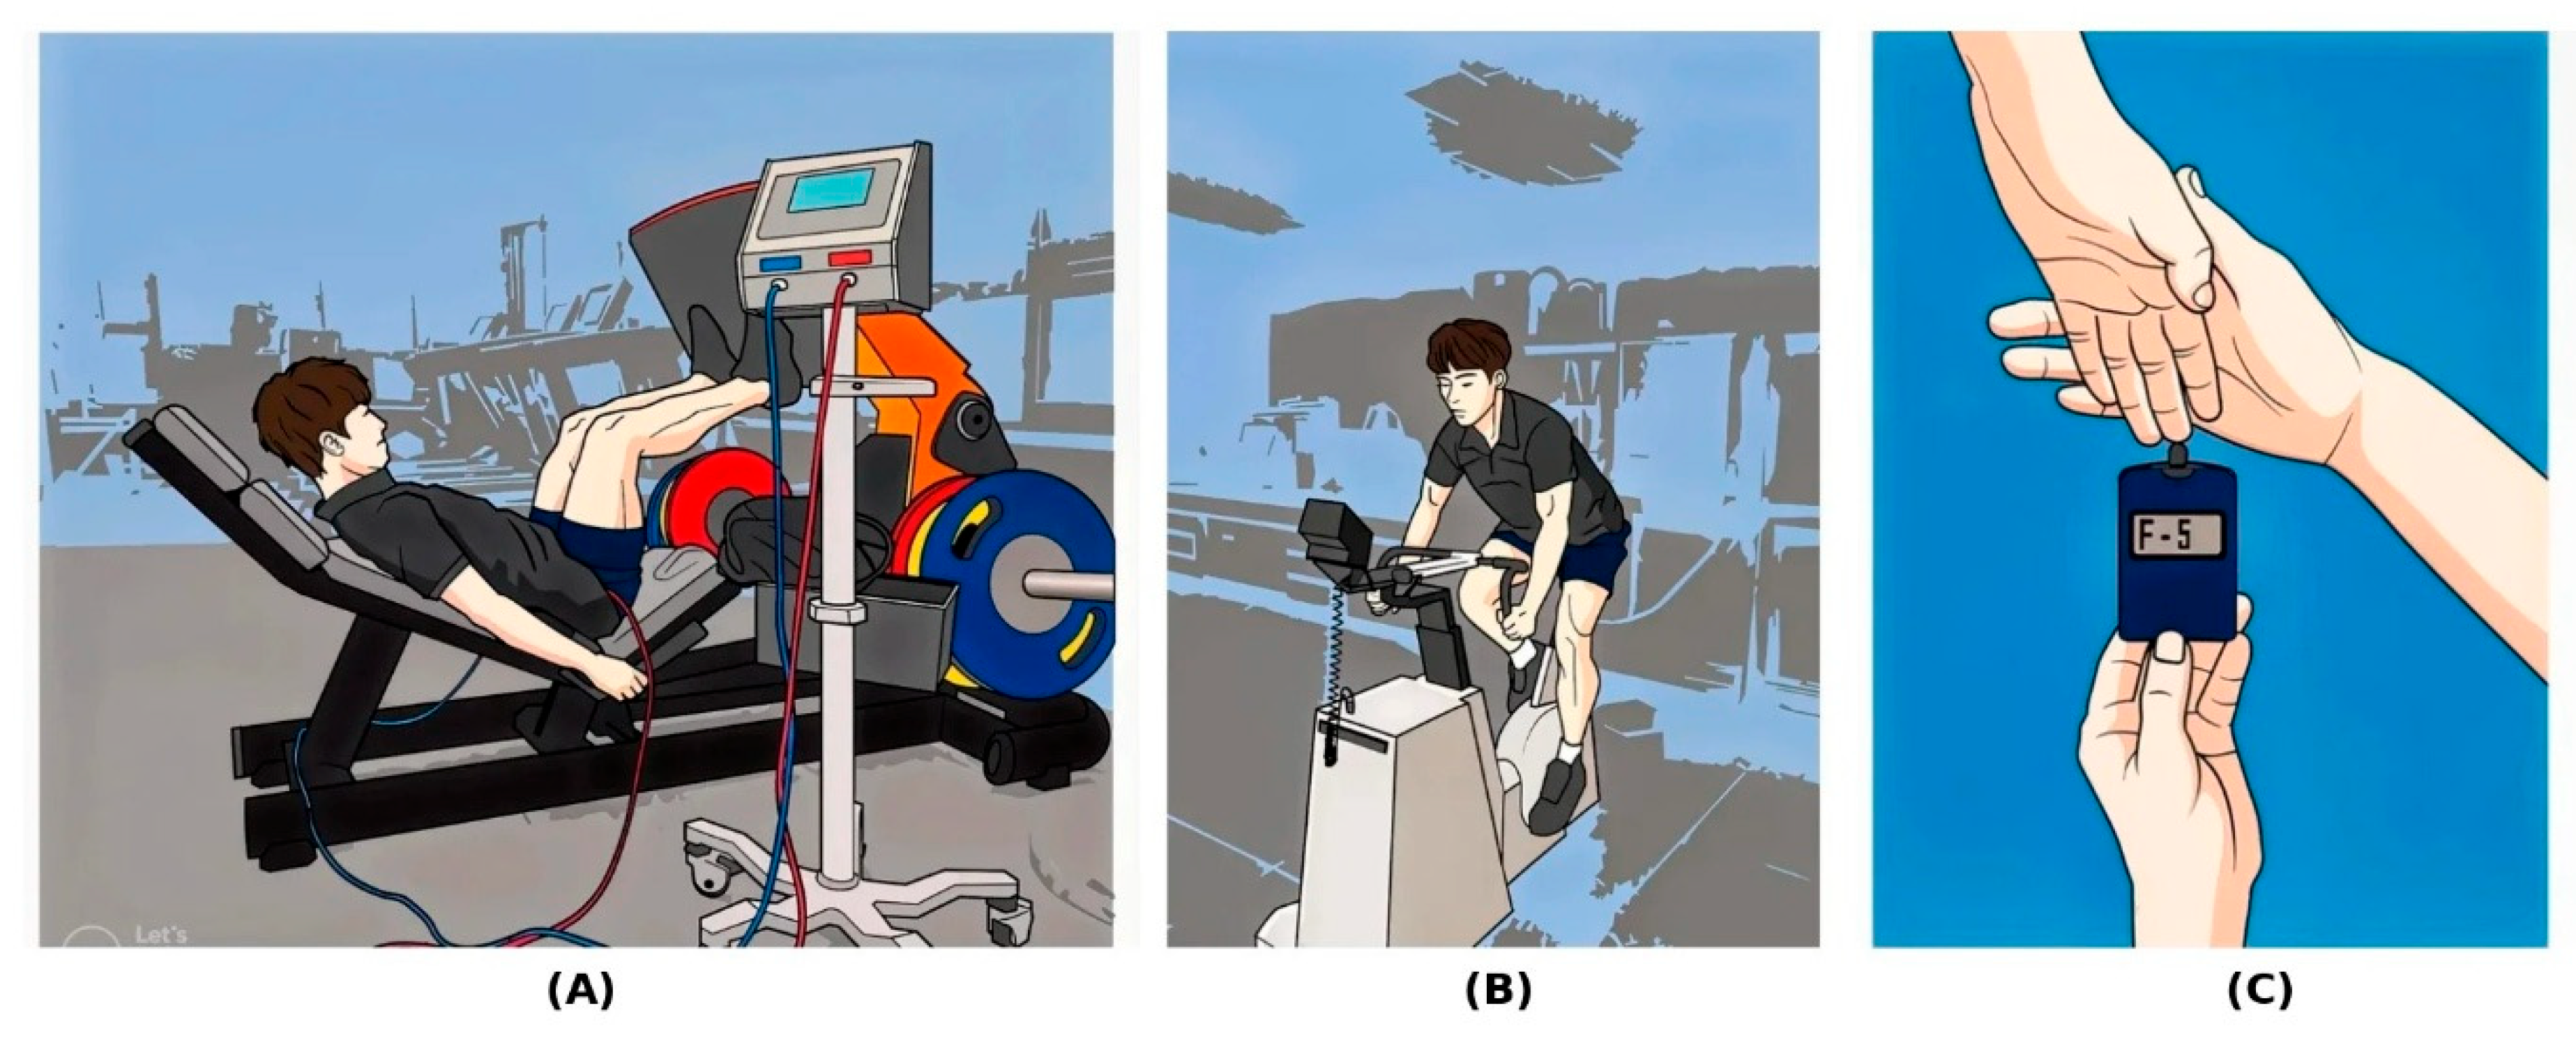
Figure 2.
Experimental protocol for the 12-week blood flow restriction resistance training (BFRRT) sessions: (A) BFRRT execution, (B) Wingate Anaerobic Test, and (C) blood lactate concentration measurement.
Figure 2.
Experimental protocol for the 12-week blood flow restriction resistance training (BFRRT) sessions: (A) BFRRT execution, (B) Wingate Anaerobic Test, and (C) blood lactate concentration measurement.
2.4. Statistical Analysis
Data were analyzed using SPSS 23 (SPSS Inc., Armonk, New York) and expressed as mean ± SD. The rate of change in blood lactate concentration was evaluated using a 3 (group: BFRRT, HRT, LRT) × 2 (experimental periods: baseline, 12 weeks) mixed-model analysis of variance (ANOVA). Mean power, peak power, rate of fatigue, and time to peak power were analyzed with a 3 (group: BFRRT, HRT, LRT) × 5 (time points: baseline, Weeks 3, 6, 9, and 12) mixed-model ANOVA. When the sphericity assumption was not met, Greenhouse-Geisser corrections were used. Post-hoc Bonferroni tests were conducted, with significance thresholds adjusted to 0.05/n. Effect sizes were reported as partial eta squared (, and interpreted according to Cohen’s guidelines: small (0.01 medium(0.06 [40].
Effect sizes for ANOVA results were reported as partial eta-squared (). A power analysis using the G*Power computer program [41] indicated a total sample of 21 participants would be sufficient to detect a medium effect (f = 0.25) with 69% power. Statistical significance was set at α = 0.05.
3. Results
3.1. Group Comparisons of Demographic Characteristics
Table 1 presents the demographic characteristics of participants in each group. There were no significant differences among the groups in terms of age, height, body weight, BMI, skeletal muscle mass, Basal Metabolic Rate, right leg muscle mass, and left leg muscle mass (p > 0.05). However, significant differences were observed in body fat percentage (p = 0.040), body fat mass (p = 0.037), and waist-hip ratio (p = 0.007).
3.2. Changes in Anaerobic and Metabolic Responses over Time
The 12-week intervention resulted in distinct adaptations across the HRT, BFRRT, and LRT groups. A summary of all outcome variables is provided in Table 2.
Rate of Change in Blood Lactate Concentration: The rate of change in blood lactate concentration did not show a significant interaction effect for group × time (F(2, 18) = 0.23, p = 0.25, = 0.03) or a main effect of time (F(1, 18) = 0.63, p = 0.43, = 0.03). However, a significant main effect of the group was observed (F(2, 18) = 67.83, p < 0.01, = 0.88). Participants in the HRT group showed significantly higher rates of change than the BFRRT group (p < 0.01) and the LRT group (p < 0.01). Additionally, the BFRRT group demonstrated a significantly higher rate of change than the LRT group (p = 0.03). These results are shown in Figure 3.
Mean Power: The mean power did not significantly differ across groups over time (F(8, 72) = 1.48, p = 0.18, = 0.14). There was also no significant main effect of the group (F(2, 18) = 0.07, p = 0.94) or time (F(4, 72) = 0.84, p = 0.50). These results are presented in Figure 4.
Peak Power: Peak power significantly differed across groups over time (F(8, 72) = 3.29, p < 0.01, = 0.27). Post-hoc analysis revealed that participants in the BFRRT group experienced significant improvements in peak power at the sixth week (p < 0.01), ninth week (p < 0.01), and 12th week (p < 0.01) compared with baseline. Similarly, the HRT group demonstrated significant improvements in peak power in the ninth week (p < 0.01) and 12th week (p < 0.01) compared with the baseline. Conversely, no significant improvements were observed in the LRT group (p = 1.00). These results are illustrated in Figure 5.
Rate of Fatigue: The rate of fatigue did not significantly differ across groups over time (F(8, 72) = 1.31, p = 0.25, = 0.13). There was also no significant main effect of the group (F(2, 18) = 0.14, p > 0.05,). However, a strong main effect of time was observed (F(4, 72) = 9.67, p < 0.01, = 0.35). These findings are depicted in Figure 6.
Time to Peak Power: Time to peak power did not significantly differ across groups over time (F(8, 72) = 0.52, p = 0.84, = 0.06). There was also no significant main effect of group (F(2, 18) = 0.83, p = 0.45) or time(F(4, 72) = 2.10, p = 0.09). These results are shown in Figure 7.
4. Discussion
The primary objective of this study was to evaluate the effects of a 12-week strength training program—BFRRT, HRT, or LRT—on blood lactate concentration, peak power, fatigue index, and time to peak power. This study is the first to evaluate whether BFRRT can improve anaerobic power during a prolonged 30-s dynamic load test. The main finding was that the BFRRT group exhibited significant improvements in peak power as early as 6 weeks, compared with 9 weeks in the HRT group. Conversely, the LRT group showed no significant improvements throughout the study period. These results indicate that anaerobic power, which traditionally improves with HRT, can also be effectively enhanced using low-intensity weights combined with BFR.
Prior research supports BFRRT's efficacy in promoting muscle hypertrophy [13,42] and muscle strength [43]. First, BFRRT induced moderate to high levels of metabolic fatigue, as evidenced by changes in blood lactate concentration. The rate of change in blood lactate concentration during BFRRT was 78.4%, which was lower than HRT (86.4%) but higher than LRT (55.0%). Notably, the total volume load of BFRRT was 40% of HRT, and the load used was only 33%–37.5% of HRT. Despite this reduced intensity, BFRRT effectively induced moderate fatigue, highlighting its potential as an efficient and impactful training strategy.
Regarding the training protocol, it is noteworthy that the external load in the BFRRT group was kept constant at 30% 1RM without progressive increments. Although traditional resistance training relies on progressive overload to maximize mechanical tension [4], BFR training is primarily driven by metabolic stress and the recruitment of fast-twitch muscle fibers induced by hypoxic conditions [15,21]. Previous studies have established that a constant low-load BFR protocol (20–30% 1RM) is sufficient to induce muscular adaptations comparable to high-load training, as the primary mechanism of adaptation is metabolic accumulation rather than mechanical load [10,11]. Therefore, the constant-load approach employed in this study was intended to strictly isolate the physiological effects of blood flow restriction and to prioritize participant safety, consistent with established BFR methodologies [19,25].
Second, BFRRT demonstrated comparable improvements in anaerobic power to those achieved by HRT. Peak power increased by 14.9% at the 12th week of BFRRT, which was close to the 15.7% increase seen in the HRT group. These findings align with previous research comparing these three training modalities, which consistently indicate that high-intensity exercise is the most effective for developing anaerobic capacity, while BFRRT is more effective than LRT [11,12,14,25].
Third, time to peak power did not significantly improve in any group. This finding suggests that the 12-week training protocol, regardless of modality, may not have provided sufficient stimulus to enhance the rate of force development. Future studies with longer durations or higher training frequencies may be needed to elicit improvements in this variable. Despite this, the study found no significant improvement in anaerobic mean power over 30 s. This lack of significant improvement in mean power and fatigue index may be attributable to insufficient glycolytic stress or the absence of progressive intensity increases throughout the intervention [10,44]. Unlike the HRT group, the fixed-load BFR protocol may not have provided sufficient stimulus to drive continuous metabolic adaptations in anaerobic pathways [45,46].
Finally, the study found that while BFRRT improved anaerobic peak power within 12 weeks, it did not enhance the persistence of anaerobic capacity. The present study's 12-week BFRRT protocol presents a longer duration compared with previous studies, which typically span 2–8 weeks.
Limitations: The sample size calculation yielded a statistical power of only 69%, which falls below the conventional 80% threshold. Second, the 1RM was estimated rather than directly measured. Third, while the training protocol utilized a constant load to standardize metabolic stress and ensure safety, future studies are warranted to explore the potential additive benefits of implementing progressive overload within BFR contexts. Fourth, the absence of a non-training control group may limit the interpretation of observed changes.
5. Conclusions
This study demonstrates that a 12-week, low-intensity BFRRT program is an effective and time-efficient strategy for enhancing anaerobic power, as measured by the WAnT. Notably, significant improvements in peak power were observed within 6 weeks, indicating that BFRRT is more efficient and safer than traditional HRT. Consequently, BFRRT presents a promising alternative for optimizing anaerobic power, particularly for individuals seeking effective training methods with reduced injury risk.
Author Contributions
Conceptualization, K.-S.K. and S.S.; Methodology, K.-S.K., G.B.K. and S.S.; Formal Analysis, K.-S.K. and S.S.; Investigation, K.-S.K. and S.S.; Resources, S.S.; Writing—Original Draft Preparation, K.-S.K., G.B.K. and S.S.; Writing—Review and Editing, K.-S.K., G.B.K. and S.S.; Visualization, K.-S.K. and S.S.; Supervision, G.B.K. and S.S.; Project Administration, G.B.K. and S.S.; Funding Acquisition, G.B.K. and S.S. All authors have read and agreed to the published version of the manuscript.
Funding
This research was supported by the Basic Science Research Program through the National Research Foundation of Korea (RS-2021-NR060125) and funded by the Ministry of Education (2025).
Institutional Review Board Statement
The study was conducted according to the guidelines of the Declaration of Helsinki, and approved by the Institutional Bioethics Committee of Yeungnam University (approval number: 7002016-A-2015-030).
Informed Consent Statement
Informed consent was obtained from all subjects involved in the study.
Data Availability Statement
The data presented in this study are available on request from the corresponding author.
Conflicts of Interest
The authors declare no conflict of interest.
References
- Pope, Z.K.; Willardson, J.M.; Schoenfeld, B.J. Exercise and blood flow restriction. J. Strength Cond. Res. 2013, 27, 2914–2926.
- Sato, Y. The history and future of KAATSU training. Int. J. KAATSU Train. Res. 2005, 1, 1–5. [CrossRef]
- Campos, G.E.; Luecke, T.J.; Wendeln, H.K.; Toma, K.; Hagerman, F.C.; Murray, T.F.; et al. Muscular adaptations in response to three different resistance-training regimens: Specificity of repetition maximum training zones. Eur. J. Appl. Physiol. 2002, 88, 50–60. [CrossRef]
- Kraemer, W.J.; Ratamess, N.A. Fundamentals of resistance training: Progression and exercise prescription. Med. Sci. Sports Exerc. 2004, 36, 674–688. [CrossRef]
- McDonagh, M.J.; Davies, C. Adaptive response of mammalian skeletal muscle to exercise with high loads. Eur. J. Appl. Physiol. Occup. Physiol. 1984, 52, 139–155. [CrossRef]
- Faigenbaum, A.D.; Myer, G.D. Resistance training among young athletes: Safety, efficacy and injury prevention effects. Br. J. Sports Med. 2010, 44, 56–63. [CrossRef]
- Henneman, E. The size-principle: A deterministic output emerges from a set of probabilistic connections. J. Exp. Biol. 1985, 115, 105–112. [CrossRef]
- Henneman, E.; Somjen, G.; Carpenter, D.O. Functional significance of cell size in spinal motoneurons. J. Neurophysiol. 1965, 28, 560–580. [CrossRef]
- Kraemer, W.J.; Deschenes, M.R.; Fleck, S.J. Physiological adaptations to resistance exercise. Sports Med. 1988, 6, 246–256. [CrossRef]
- Loenneke, J.P.; Wilson, J.M.; Marín, P.J.; Zourdos, M.C.; Bemben, M.G. Low intensity blood flow restriction training: A meta-analysis. Eur. J. Appl. Physiol. 2012, 112, 1849–1859. [CrossRef]
- Karabulut, M.; Abe, T.; Sato, Y.; Bemben, M.G. The effects of low-intensity resistance training with vascular restriction on leg muscle strength in older men. Eur. J. Appl. Physiol. 2010, 108, 147. [CrossRef]
- Kubo, K.; Komuro, T.; Ishiguro, N.; Tsunoda, N.; Sato, Y.; Ishii, N.; et al. Effects of low-load resistance training with vascular occlusion on the mechanical properties of muscle and tendon. J. Appl. Biomech. 2006, 22, 112–119. [CrossRef]
- Takarada, Y.; Nakamura, Y.; Aruga, S.; Onda, T.; Miyazaki, S.; Ishii, N. Rapid increase in plasma growth hormone after low-intensity resistance exercise with vascular occlusion. J. Appl. Physiol. 2000, 88, 61–65. [CrossRef]
- Yasuda, T.; Ogasawara, R.; Sakamaki, M.; Ozaki, H.; Sato, Y.; Abe, T. Combined effects of low-intensity blood flow restriction training and high-intensity resistance training on muscle strength and size. Eur. J. Appl. Physiol. 2011, 111, 2525–2533. [CrossRef]
- Gastin, P.B. Energy system interaction and relative contribution during maximal exercise. Sports Med. 2001, 31, 725–741. [CrossRef]
- Tanimoto, M.; Ishii, N. Effects of low-intensity resistance exercise with slow movement and tonic force generation on muscular function in young men. J. Appl. Physiol. 2005, 100, 1150–1157. [CrossRef]
- Moritani, T.; Sherman, W.M.; Shibata, M.; Matsumoto, T.; Shinohara, M. Oxygen availability and motor unit activity in humans. Eur. J. Appl. Physiol. Occup. Physiol. 1992, 64, 552–556. [CrossRef]
- Moore, D.R.; Phillips, S.M.; Babraj, J.A.; Smith, K.; Rennie, M.J. Myofibrillar and collagen protein synthesis in human skeletal muscle in young men after maximal and submaximal resistance exercise. J. Physiol. 2004, 561, 965–971.
- Takarada, Y.; Takazawa, H.; Ishii, N. Applications of vascular occlusion diminish disuse atrophy of knee extensor muscles. Med. Sci. Sports Exerc. 2000, 32, 2035–2039. [CrossRef]
- Yasuda, T.; Brechue, W.F.; Fujita, T.; Shirakawa, J.; Sato, Y.; Abe, T. Muscle activation during low-intensity muscle contractions with blood flow restriction. J. Sports Sci. 2009, 27, 479–489.
- Tanimoto, M.; Madarame, H.; Ishii, N. Muscle oxygenation and plasma growth hormone concentration during and after resistance exercise: Comparison between "KAATSU" and other types of regimen. Int. J. KAATSU Train. Res. 2005, 1, 51–56. [CrossRef]
- Abe, T.; Yasuda, T.; Midorikawa, T.; Sato, Y.; Kearns, C.F.; Inoue, K.; et al. Skeletal muscle size and circulating IGF-1 are increased after two weeks of twice daily "KAATSU" resistance training. Int. J. KAATSU Train. Res. 2005, 1, 6–12. [CrossRef]
- Hunter, J.B.; Critz, J.B. Effect of training on plasma enzyme levels in man. J. Appl. Physiol. 1971, 31, 20–23. [CrossRef]
- Sanders, T.; Bloor, C. Effects of repeated endurance exercise on serum enzyme activities in well-conditioned males. Med. Sci. Sports 1975, 7, 44–47. [CrossRef]
- Takarada, Y.; Takazawa, H.; Sato, Y.; Takebayashi, S.; Tanaka, Y.; Ishii, N. Effects of resistance exercise combined with moderate vascular occlusion on muscular function in humans. J. Appl. Physiol. 2000, 88, 2097–2106. [CrossRef]
- Cheetham, M.E.; Boobis, L.H.; Brooks, S.; Williams, C. Human muscle metabolism during sprint running. J. Appl. Physiol. 1986, 61, 54–60. [CrossRef]
- Gollnick, P.D.; Armstrong, R.B.; Sembrowich, W.L.; Shepherd, R.E.; Saltin, B. Glycogen depletion pattern in human skeletal muscle fibers after heavy exercise. J. Appl. Physiol. 1973, 34, 615–618. [CrossRef]
- Thorstensson, A.; Grimby, G.; Karlsson, J. Force-velocity relations and fiber composition in human knee extensor muscles. J. Appl. Physiol. 1976, 40, 12–16. [CrossRef]
- Yasuda, T.; Loenneke, J.P.; Thiebaud, R.S.; Abe, T. Effects of blood flow restricted low-intensity concentric or eccentric training on muscle size and strength. PLoS ONE 2012, 7, e52843. [CrossRef]
- Vechin, F.C.; Libardi, C.A.; Conceição, M.S.; Damas, F.R.; Lixandrão, M.E.; Berton, R.P.; et al. Comparisons between low-intensity resistance training with blood flow restriction and high-intensity resistance training on quadriceps muscle mass and strength in elderly. J. Strength Cond. Res. 2015, 29, 1071–1076. [CrossRef]
- Chaabene, H.; Negra, Y.; Bouguezzi, R.; Capranica, L.; Franchini, E.; Prieske, O.; et al. Tests for the assessment of sport-specific performance in Olympic combat sports: A systematic review with practical recommendations. Front. Physiol. 2018, 9, 386. [CrossRef]
- Beneke, R.; Pollmann, C.; Bleif, I.; Leithäuser, R.; Hütler, M. How anaerobic is the Wingate Anaerobic Test for humans? Eur. J. Appl. Physiol. 2002, 87, 388–392. [CrossRef]
- Yilmaz, G. The effects of power, speed, skill and anaerobic capacity of different training models in young male basketball players. Anthropologist 2014, 18, 877–883. [CrossRef]
- Laursen, P.B.; Jenkins, D.G. The scientific basis for high-intensity interval training: Optimising training programmes and maximising performance in highly trained endurance athletes. Sports Med. 2002, 32, 53–73.
- Wun, C.H.; Zhang, M.J.; Ho, B.H.; McGeough, K.; Tan, F.; Aziz, A.R. Efficacy of a Six-Week Dispersed Wingate-Cycle Training Protocol on Peak Aerobic Power, Leg Strength, Insulin Sensitivity, Blood Lipids and Quality of Life in Healthy Adults. Int. J. Environ. Res. Public Health 2020, 17(13), 4860. [CrossRef]
- Brzycki, M. Strength testing—Predicting a one-rep max from reps-to-fatigue. J. Phys. Educ. Recreat. Dance 1993, 64, 88–90. [CrossRef]
- Wernbom, M.; Apro, W.; Paulsen, G.; Nilsen, T.S.; Blomstrand, E.; Raastad, T. Acute low-load resistance exercise with and without blood flow restriction increased protein signalling and number of satellite cells in human skeletal muscle. Eur. J. Appl. Physiol. 2013, 113, 2953–2965. [CrossRef]
- Wernbom, M.; Augustsson, J.; Raastad, T. Ischemic strength training: A low-load alternative to heavy resistance exercise? Scand. J. Med. Sci. Sports 2008, 18, 401–416. [CrossRef]
- Bar-Or, O. The Wingate anaerobic test an update on methodology, reliability and validity. Sports Med. 1987, 4, 381–394.
- Cohen, J. Statistical Power Analysis for the Behavioral Sciences; 2nd ed.; Lawrence Erlbaum Associates: Hillsdale, NJ, USA, 1988.
- Faul, F.; Erdfelder, E.; Lang, A.; Buchner, A. A flexible statistical power analysis program for the social, behavioral and biomedical sciences. Behav. Res. Methods 2007, 39, 175–191. [CrossRef]
- Manini, T.M.; Clark, B.C. Blood flow restricted exercise and skeletal muscle health. Exerc. Sport Sci. Rev. 2009, 37, 78–85. [CrossRef]
- Slysz, J.; Stultz, J.; Burr, J.F. The efficacy of blood flow restricted exercise: A systematic review & meta-analysis. J. Sci. Med. Sport 2016, 19, 669–675. [CrossRef]
- Behi, A.; Amani, A.; Fahey, T.D.; Afsharnezhad, T. Effect of High Intensity Interval Training with Blood Restriction on Anaerobic Performance. Int. J. Appl. Exerc. Physiol. 2017, 6, 45–52. [CrossRef]
- Plowman, S.A.; Smith, D.L. Exercise Physiology for Health Fitness and Performance; Lippincott Williams & Wilkins: Philadelphia, PA, USA, 2013.
- Scott, B.R.; Loenneke, J.P.; Slattery, K.M.; Dascombe, B.J. Exercise with blood flow restriction: An updated evidence-based approach for enhanced muscular development. Sports Med. 2015, 45, 313–325. [CrossRef]
Figure 1.
Flowchart of the study.
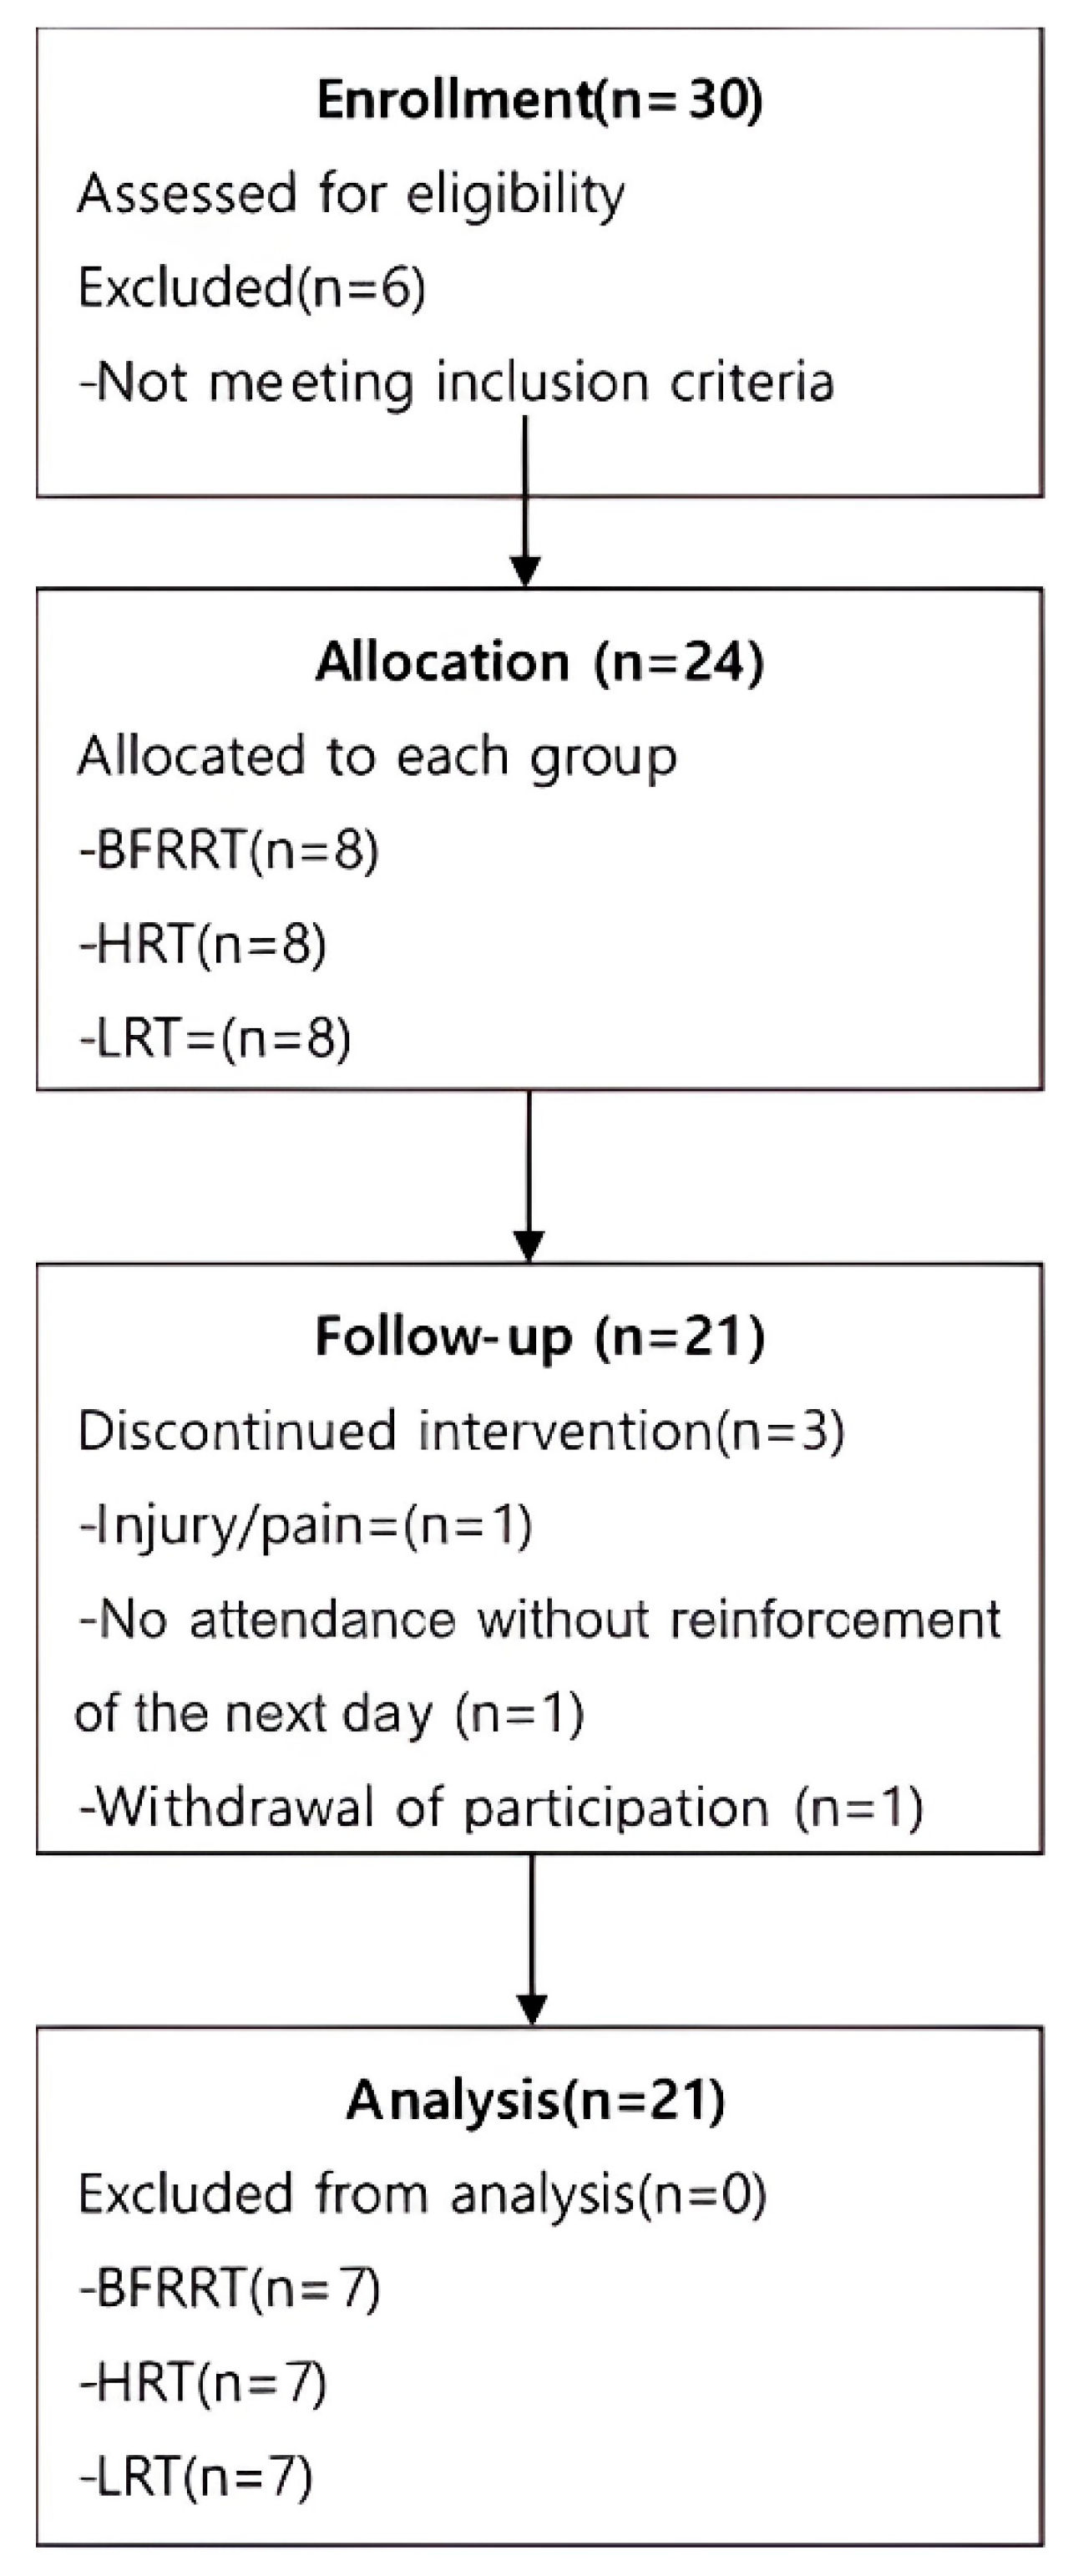
Figure 3.
Rate of change in blood lactate concentration by group. BFRRT, blood flow restriction resistance training; HRT, high-load resistance training; LRT, low-load resistance training.
Figure 3.
Rate of change in blood lactate concentration by group. BFRRT, blood flow restriction resistance training; HRT, high-load resistance training; LRT, low-load resistance training.
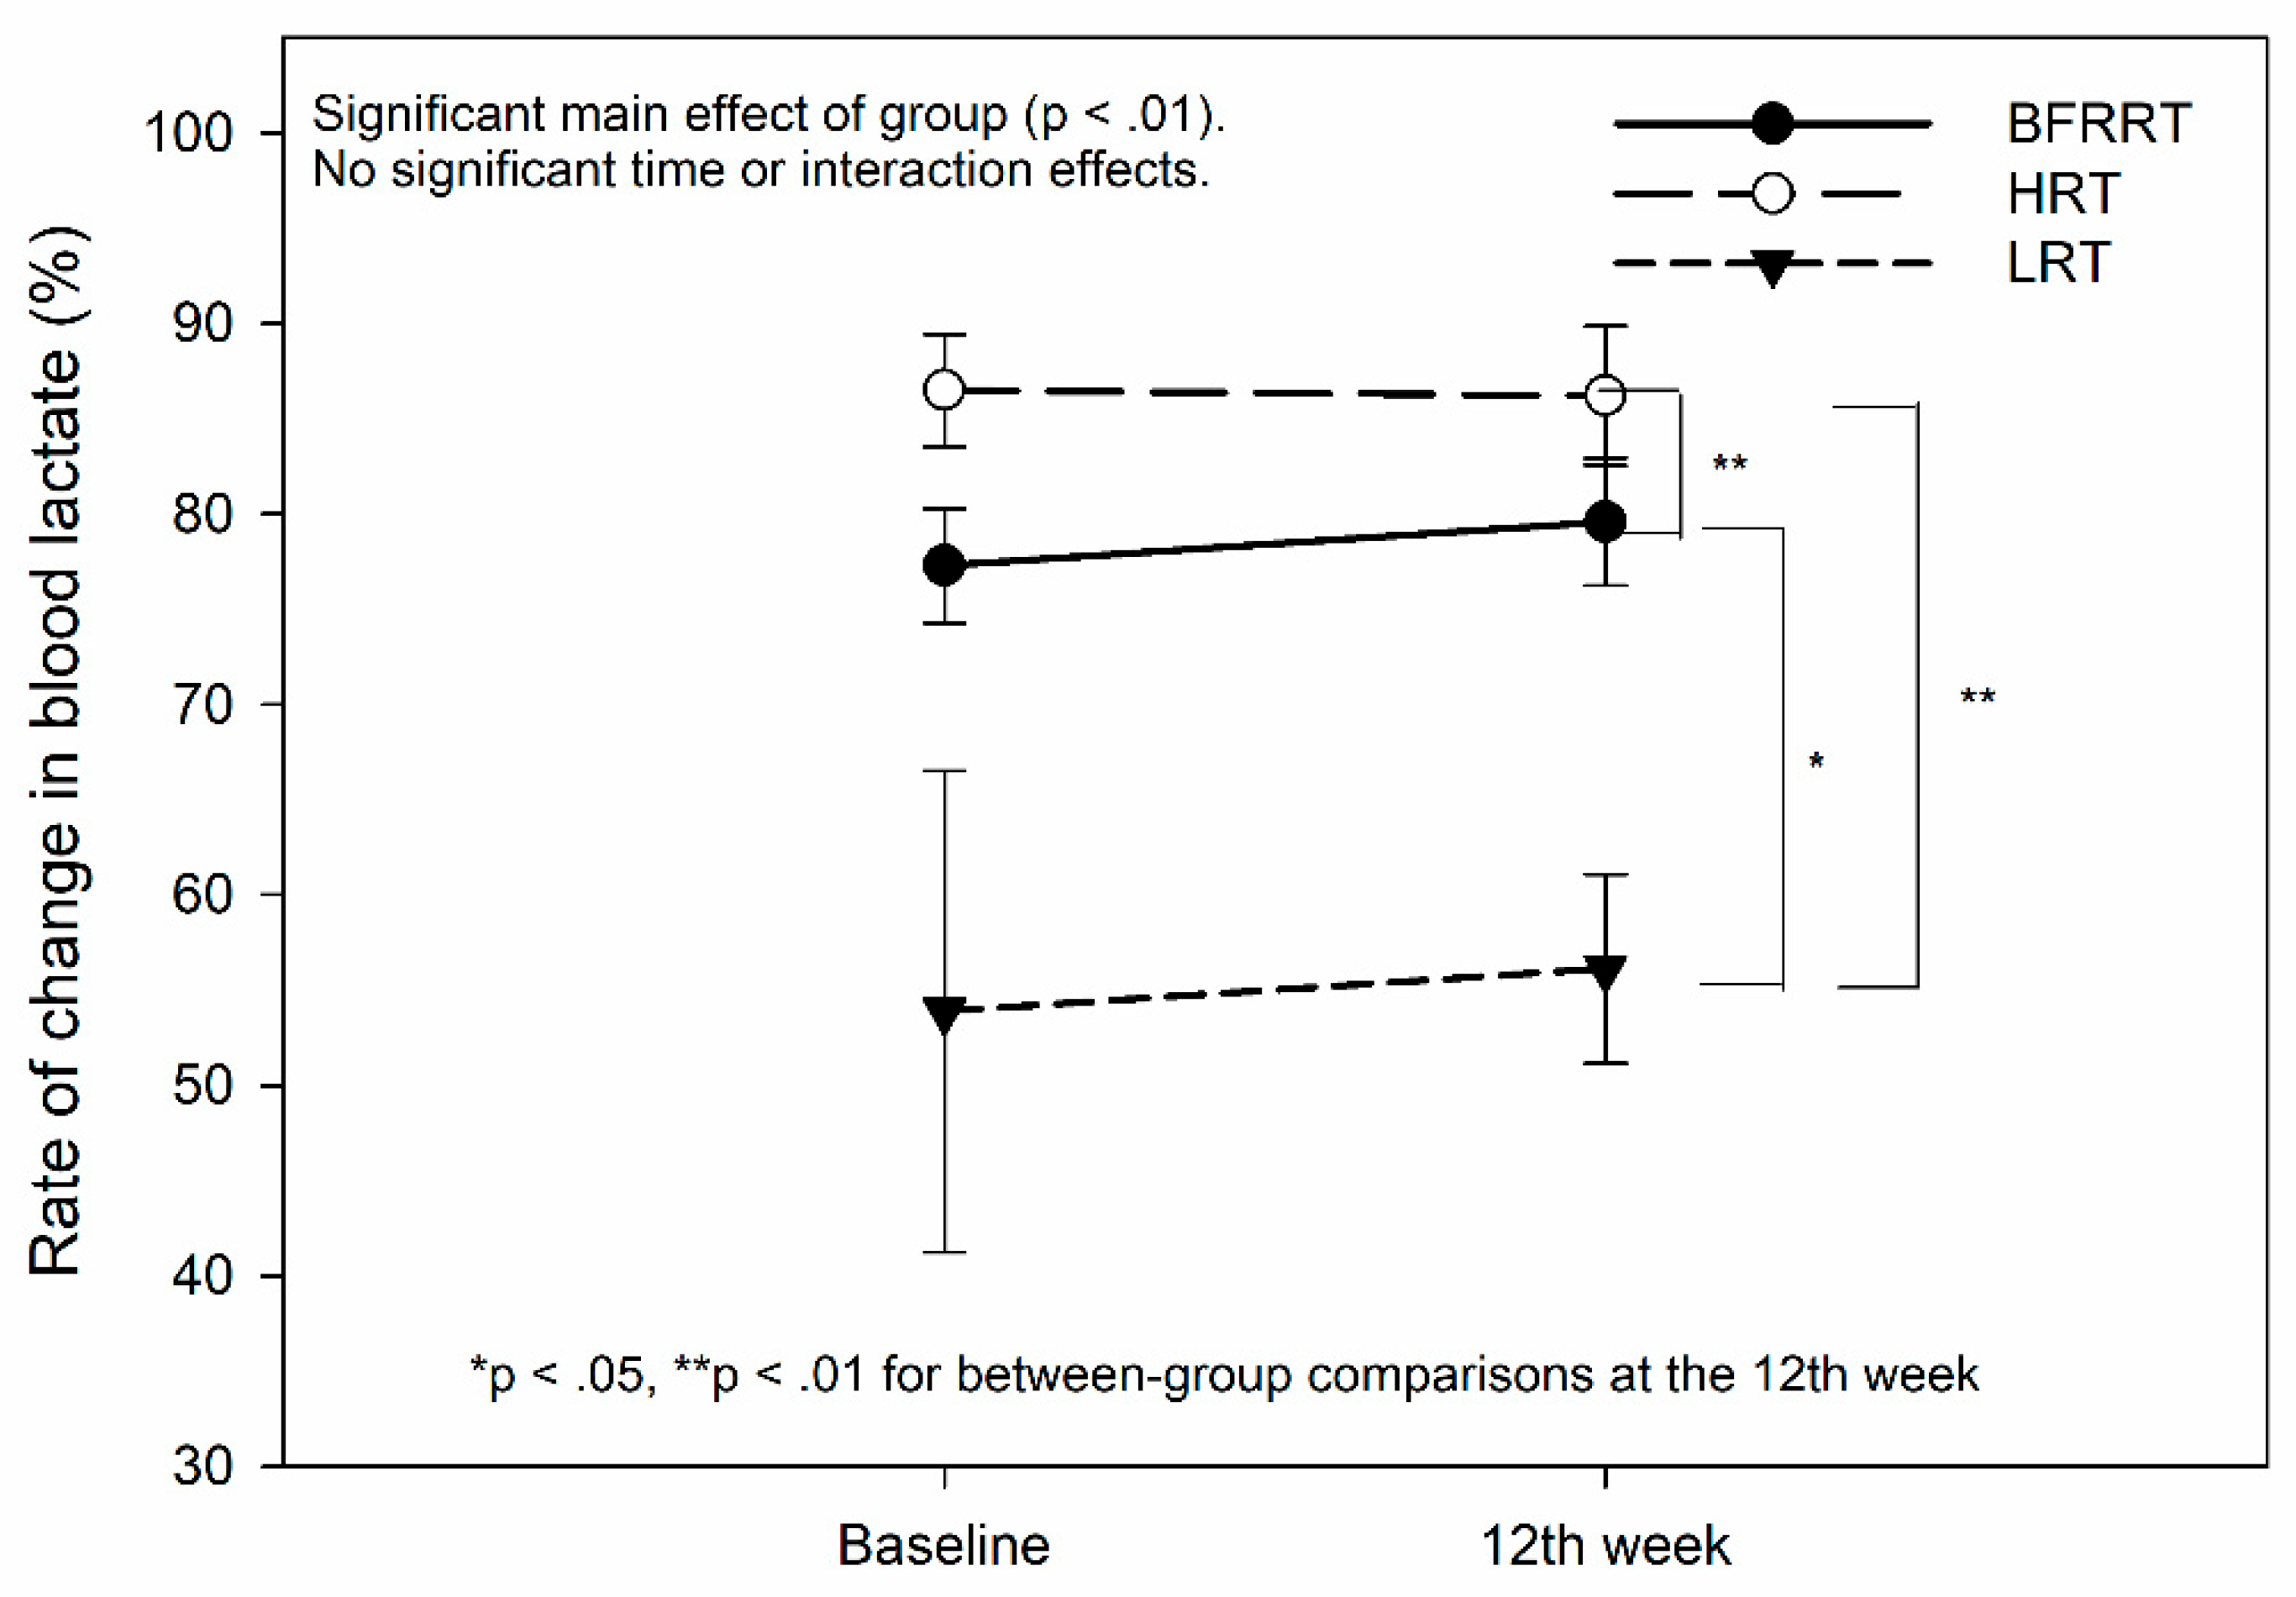
Figure 4.
Mean power based on the test performed. BFRRT, blood flow restriction resistance training; HRT, high-load resistance training; LRT, low-load resistance training.
Figure 4.
Mean power based on the test performed. BFRRT, blood flow restriction resistance training; HRT, high-load resistance training; LRT, low-load resistance training.
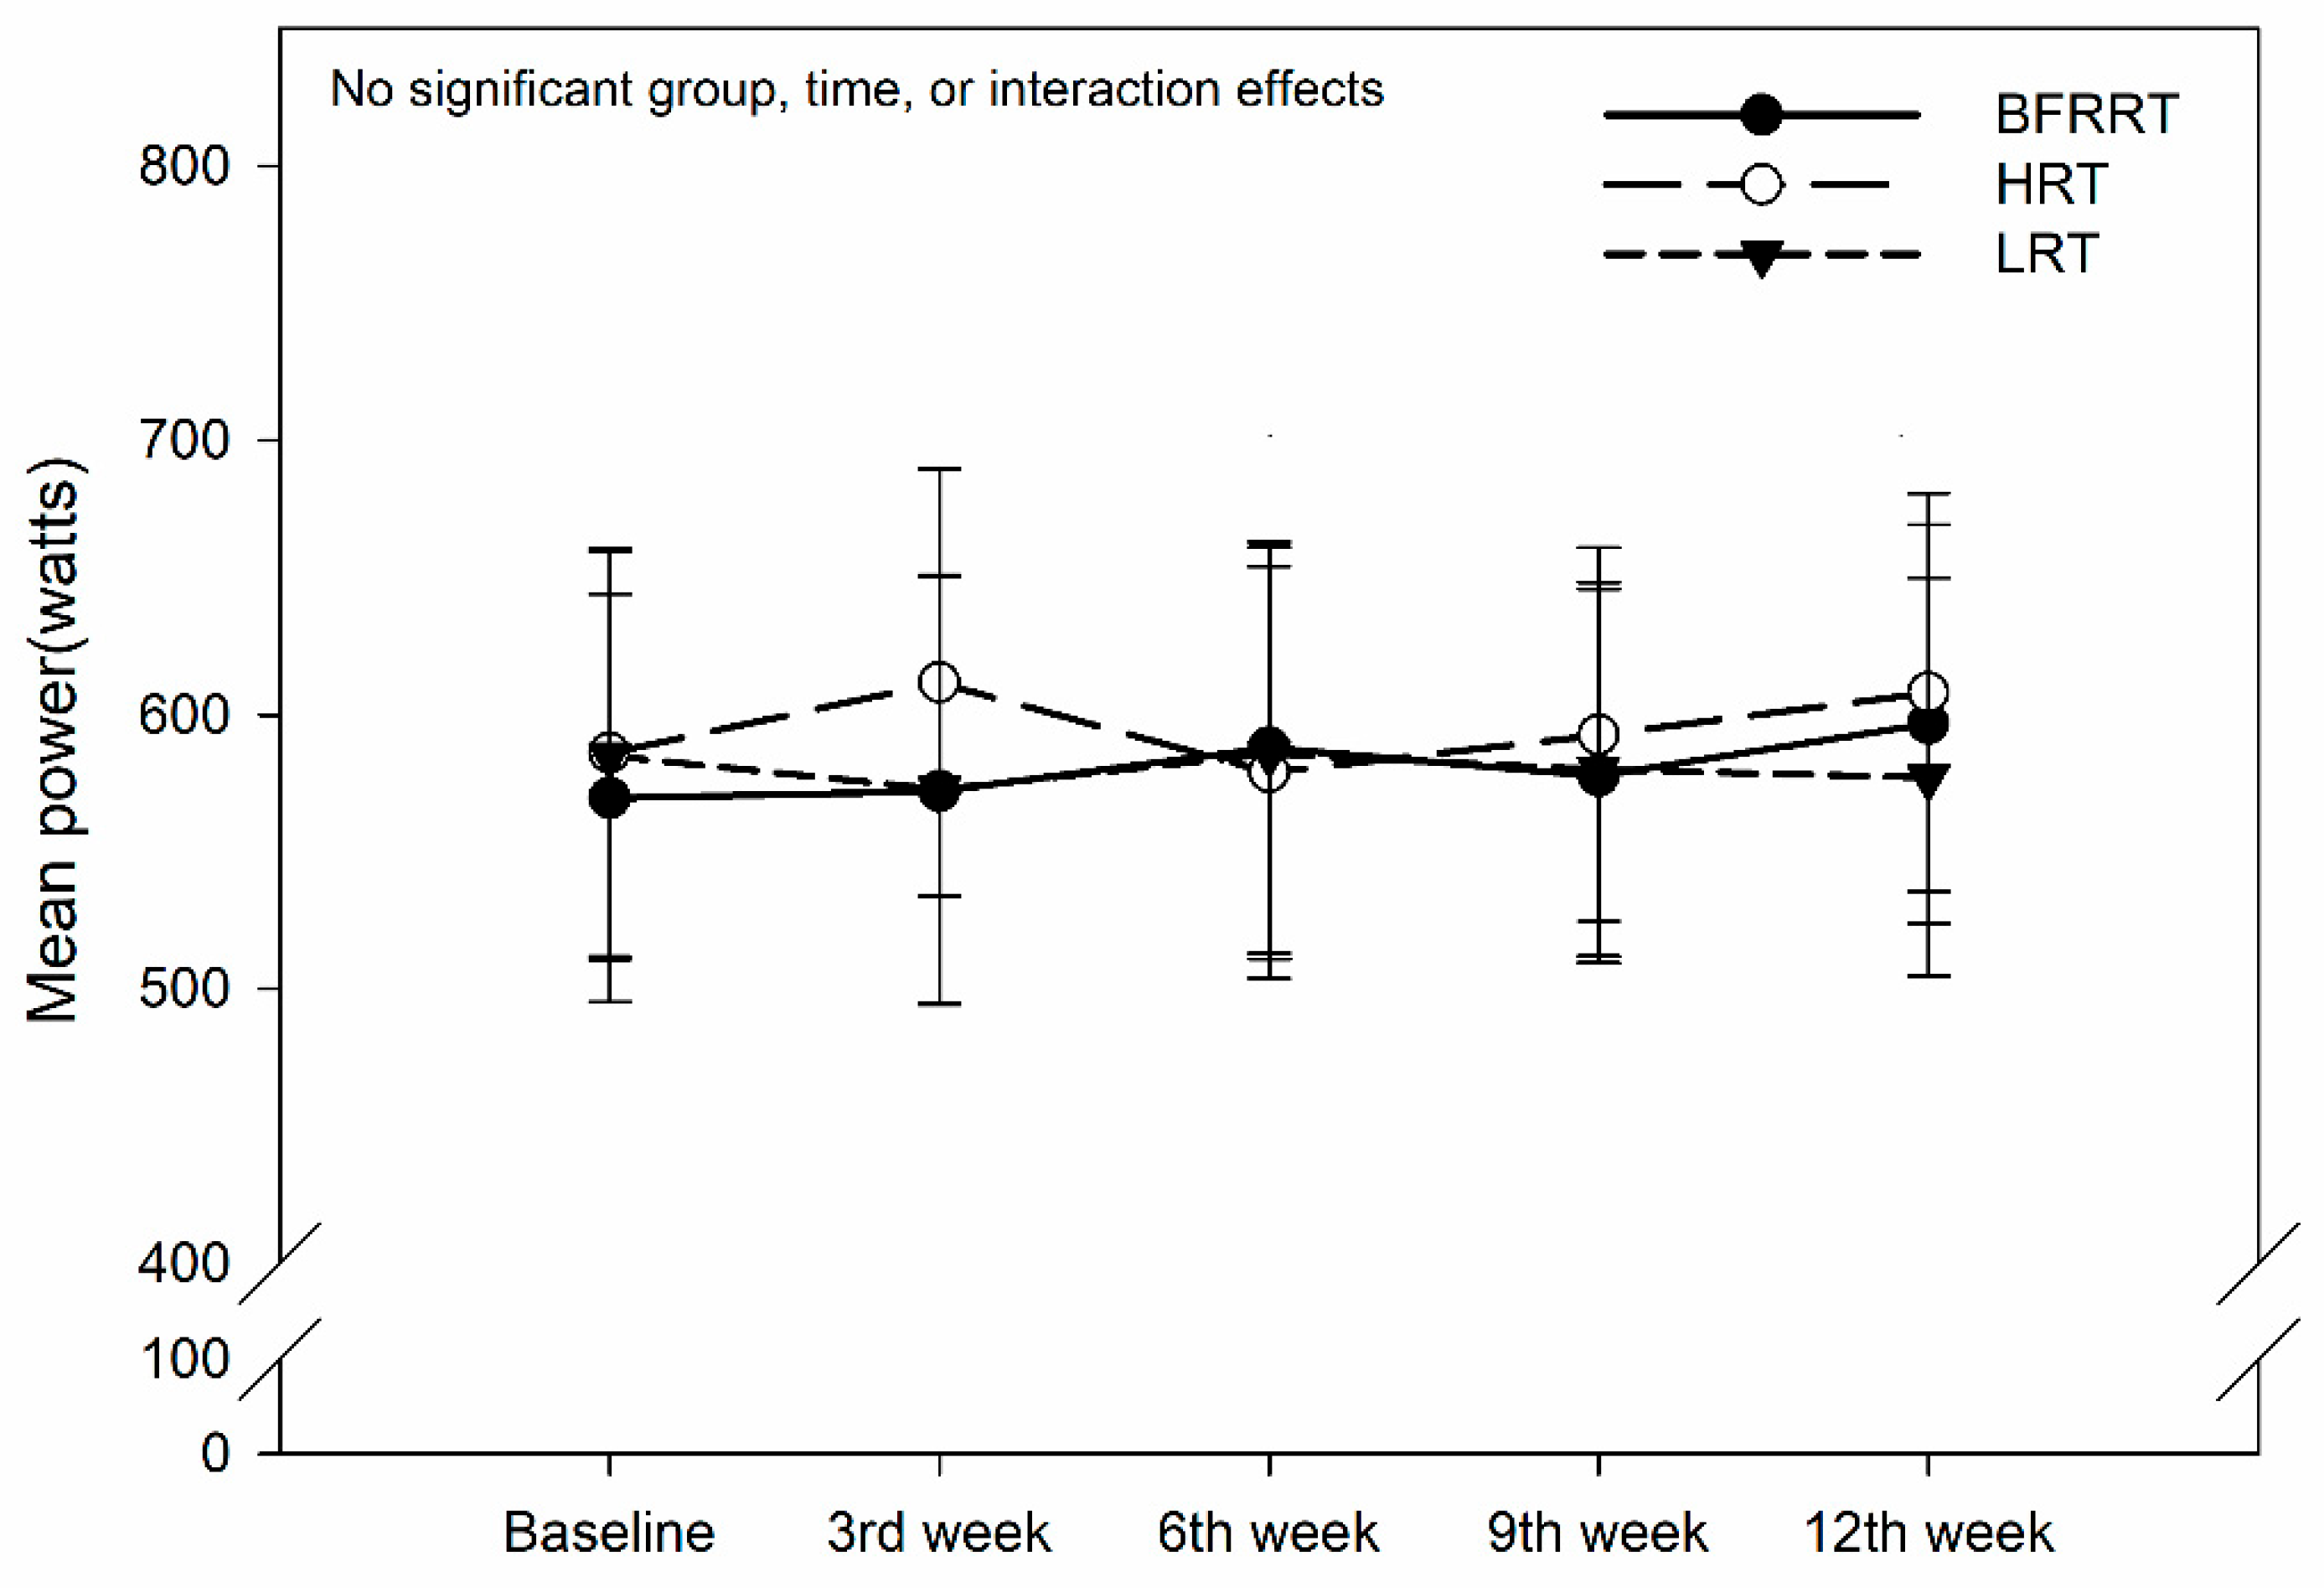
Figure 5.
Peak power according to the test performed. BFRRT, blood flow restriction resistance training; HRT, high-load resistance training; LRT, low-load resistance training.
Figure 5.
Peak power according to the test performed. BFRRT, blood flow restriction resistance training; HRT, high-load resistance training; LRT, low-load resistance training.
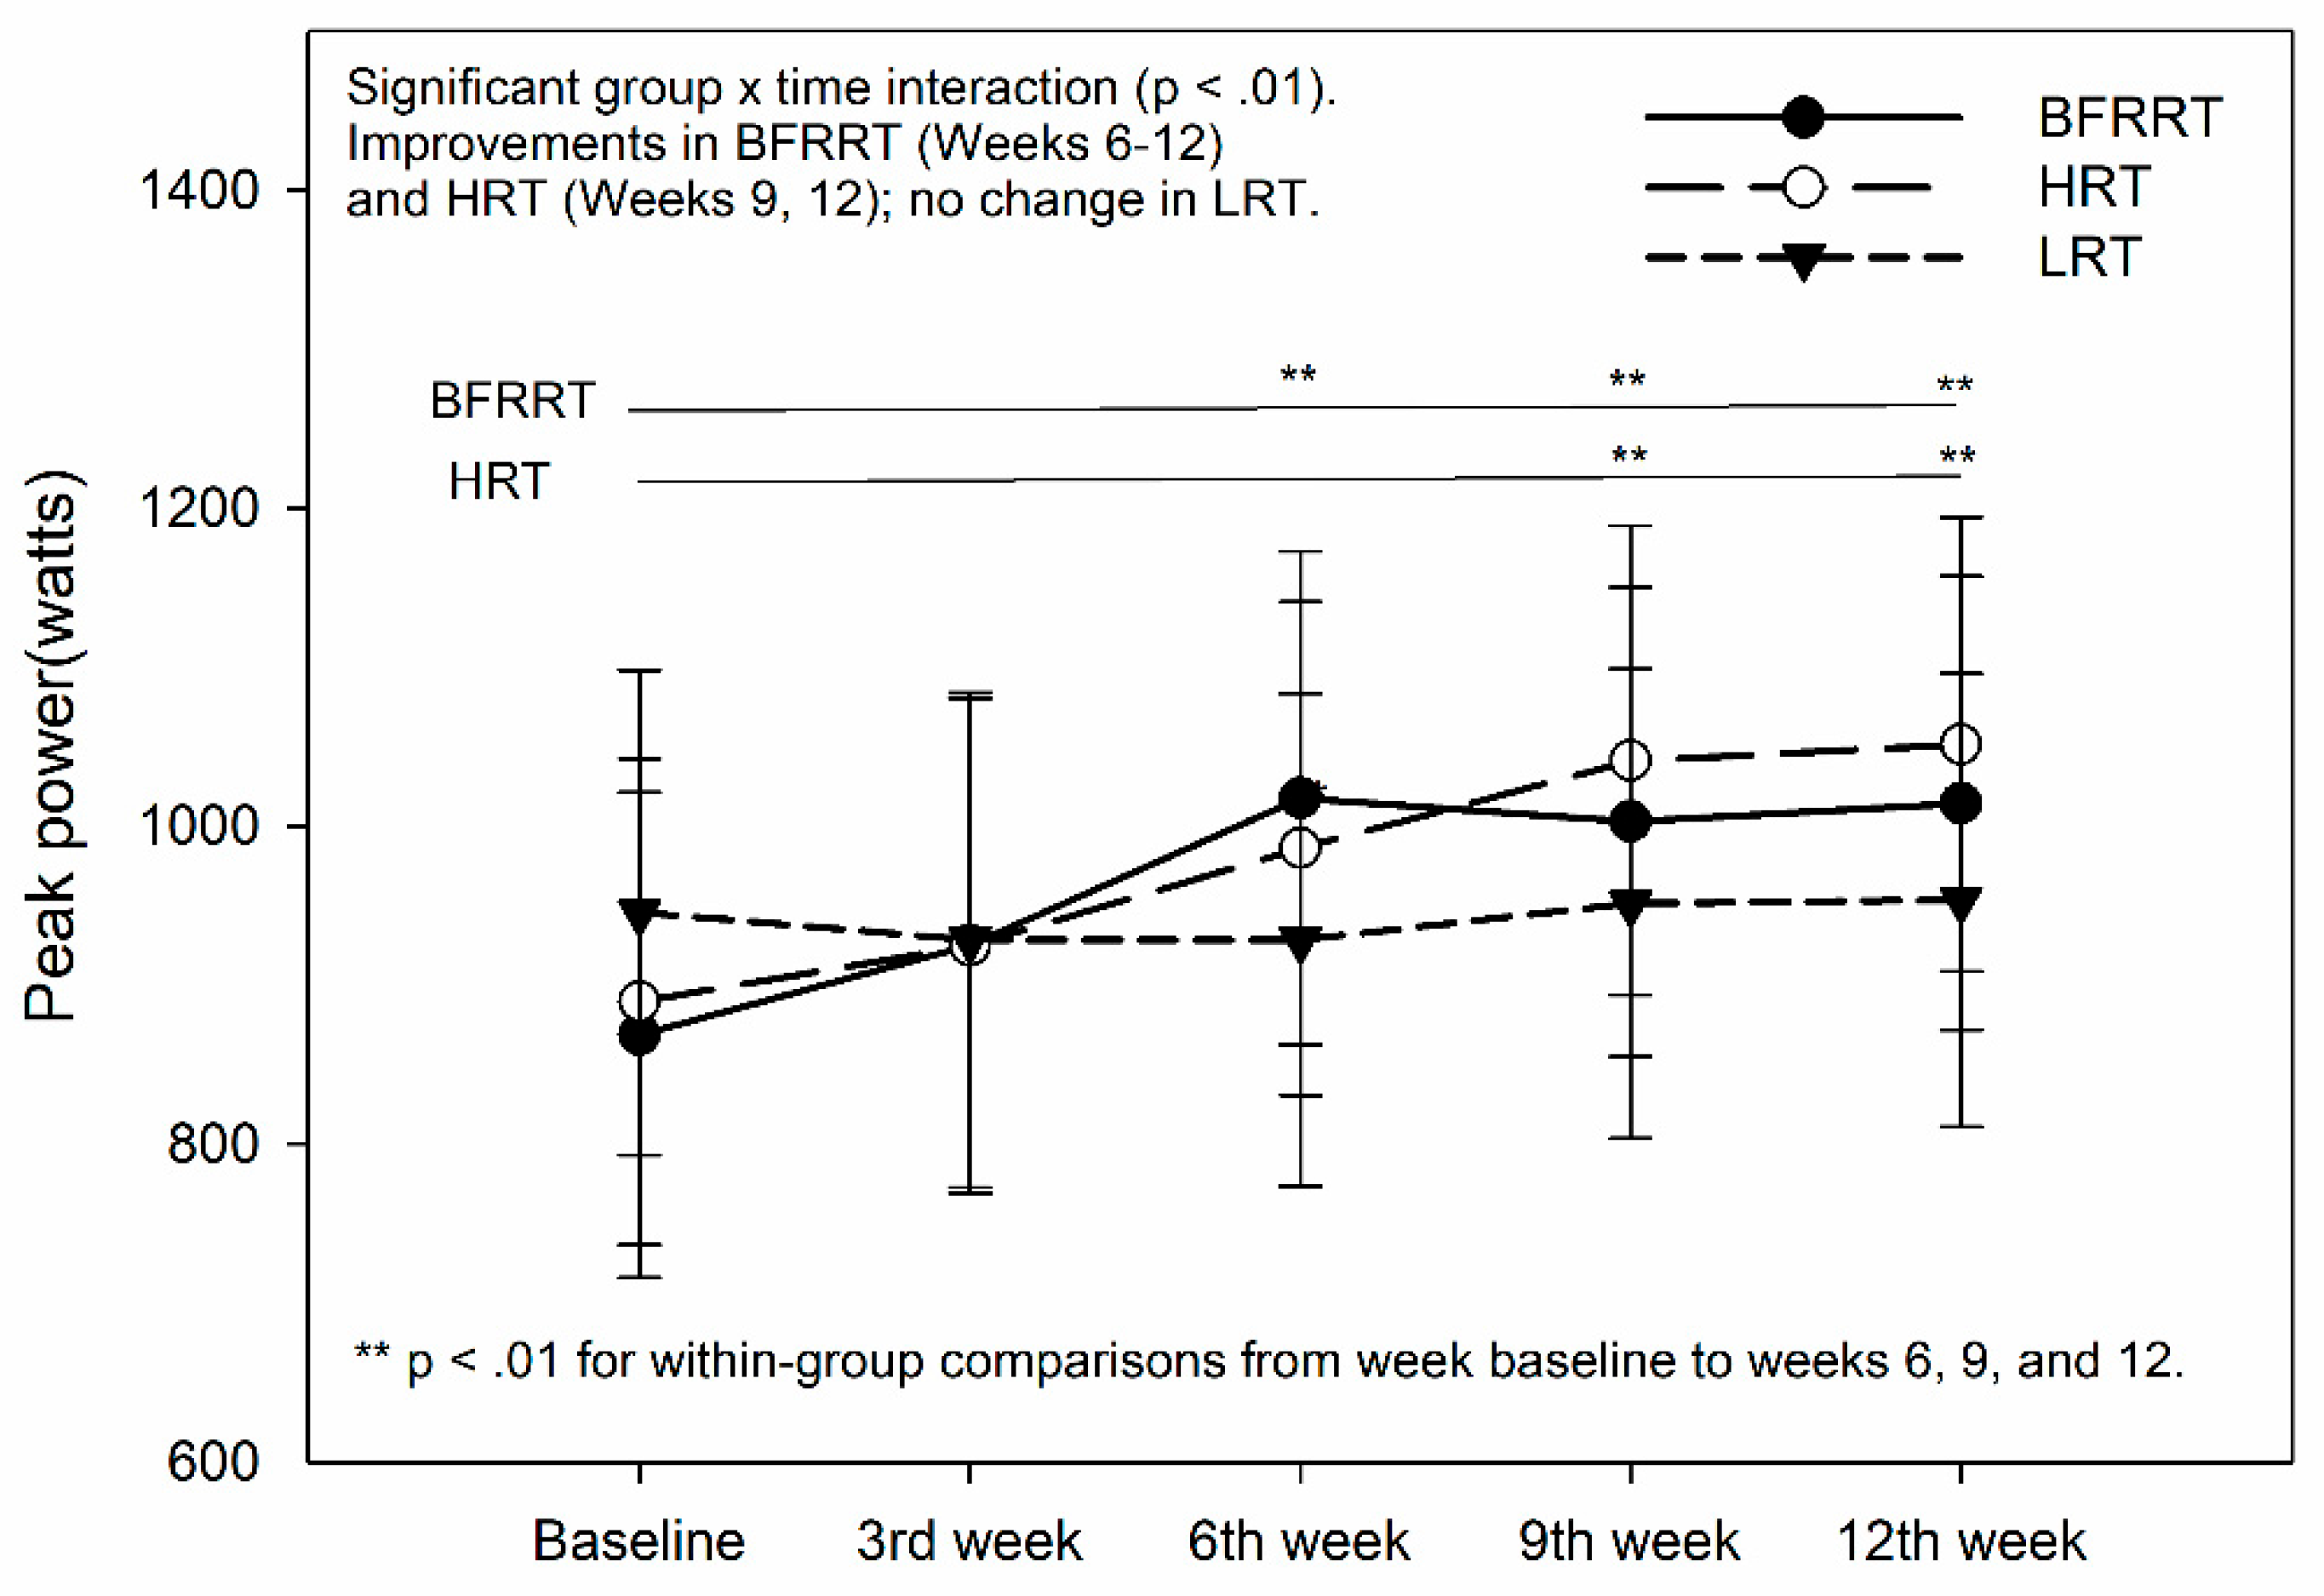
Figure 6.
Rate of fatigue based on the test performed. BFRRT, blood flow restriction resistance training; HRT, high-load resistance training; LRT, low-load resistance training.
Figure 6.
Rate of fatigue based on the test performed. BFRRT, blood flow restriction resistance training; HRT, high-load resistance training; LRT, low-load resistance training.
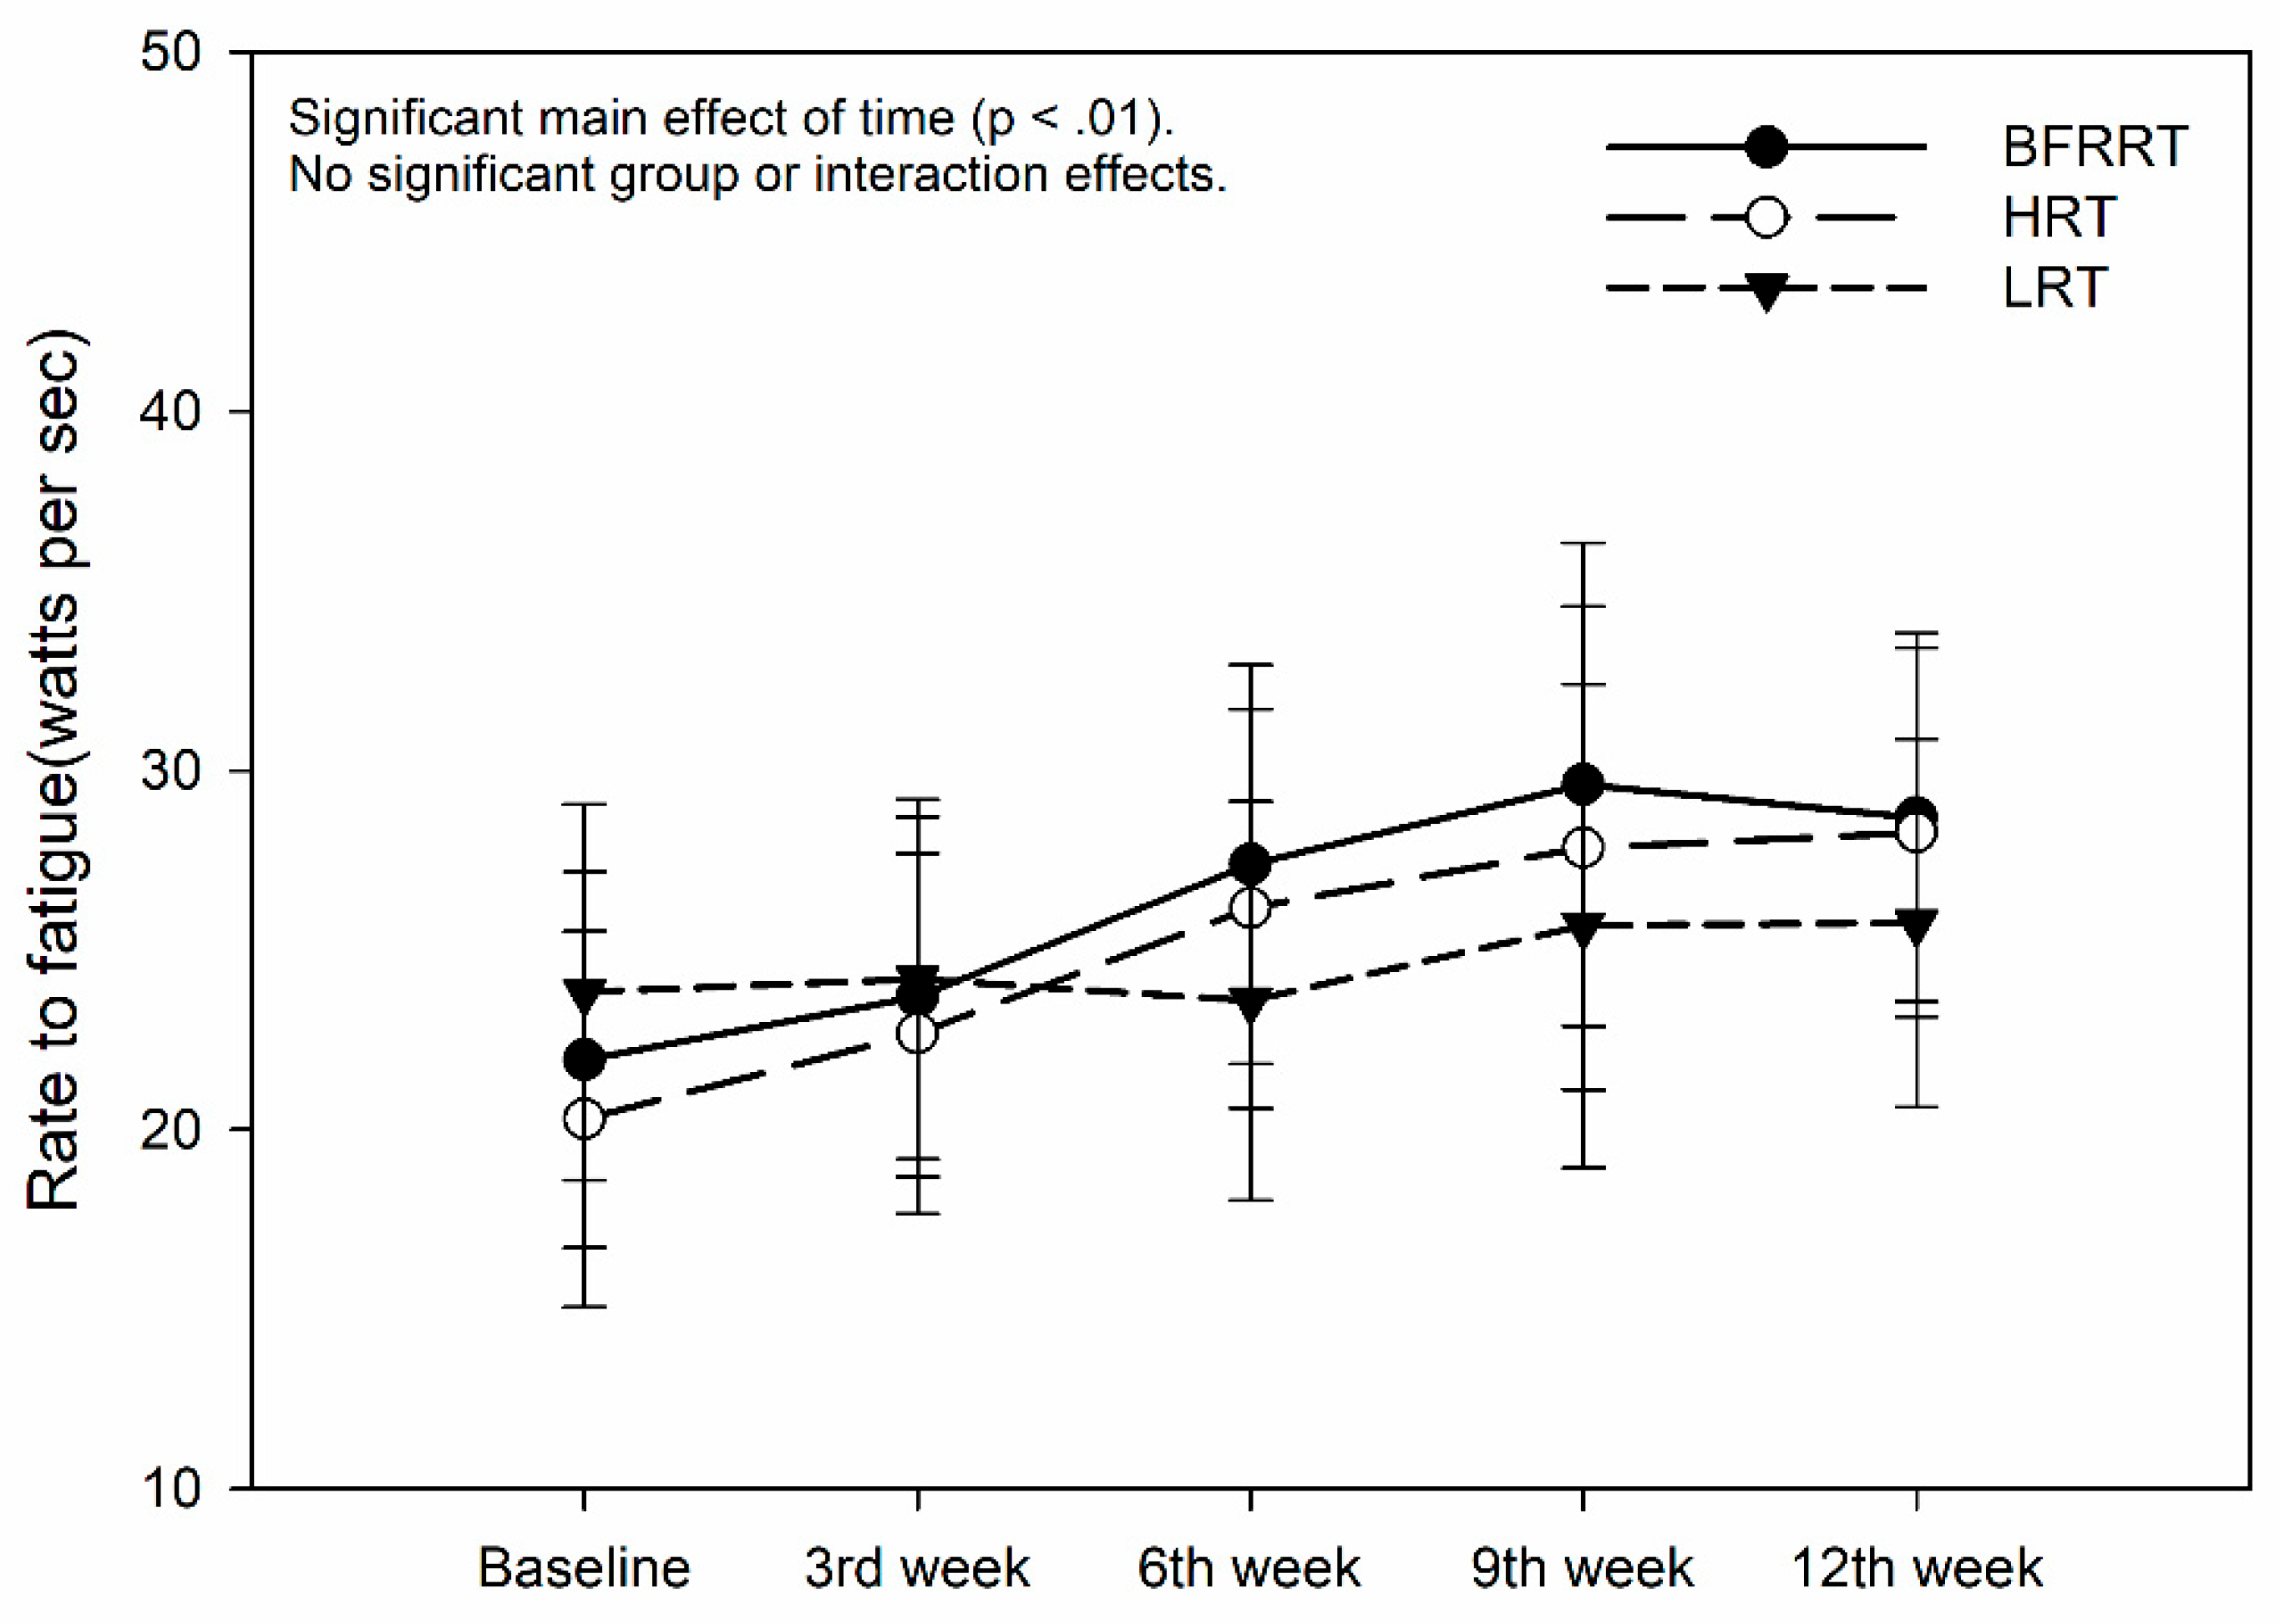
Figure 7.
Time to peak power based on the test performed. BFRRT, blood flow restriction resistance training; HRT, high-load resistance training; LRT, low-load resistance training.
Figure 7.
Time to peak power based on the test performed. BFRRT, blood flow restriction resistance training; HRT, high-load resistance training; LRT, low-load resistance training.
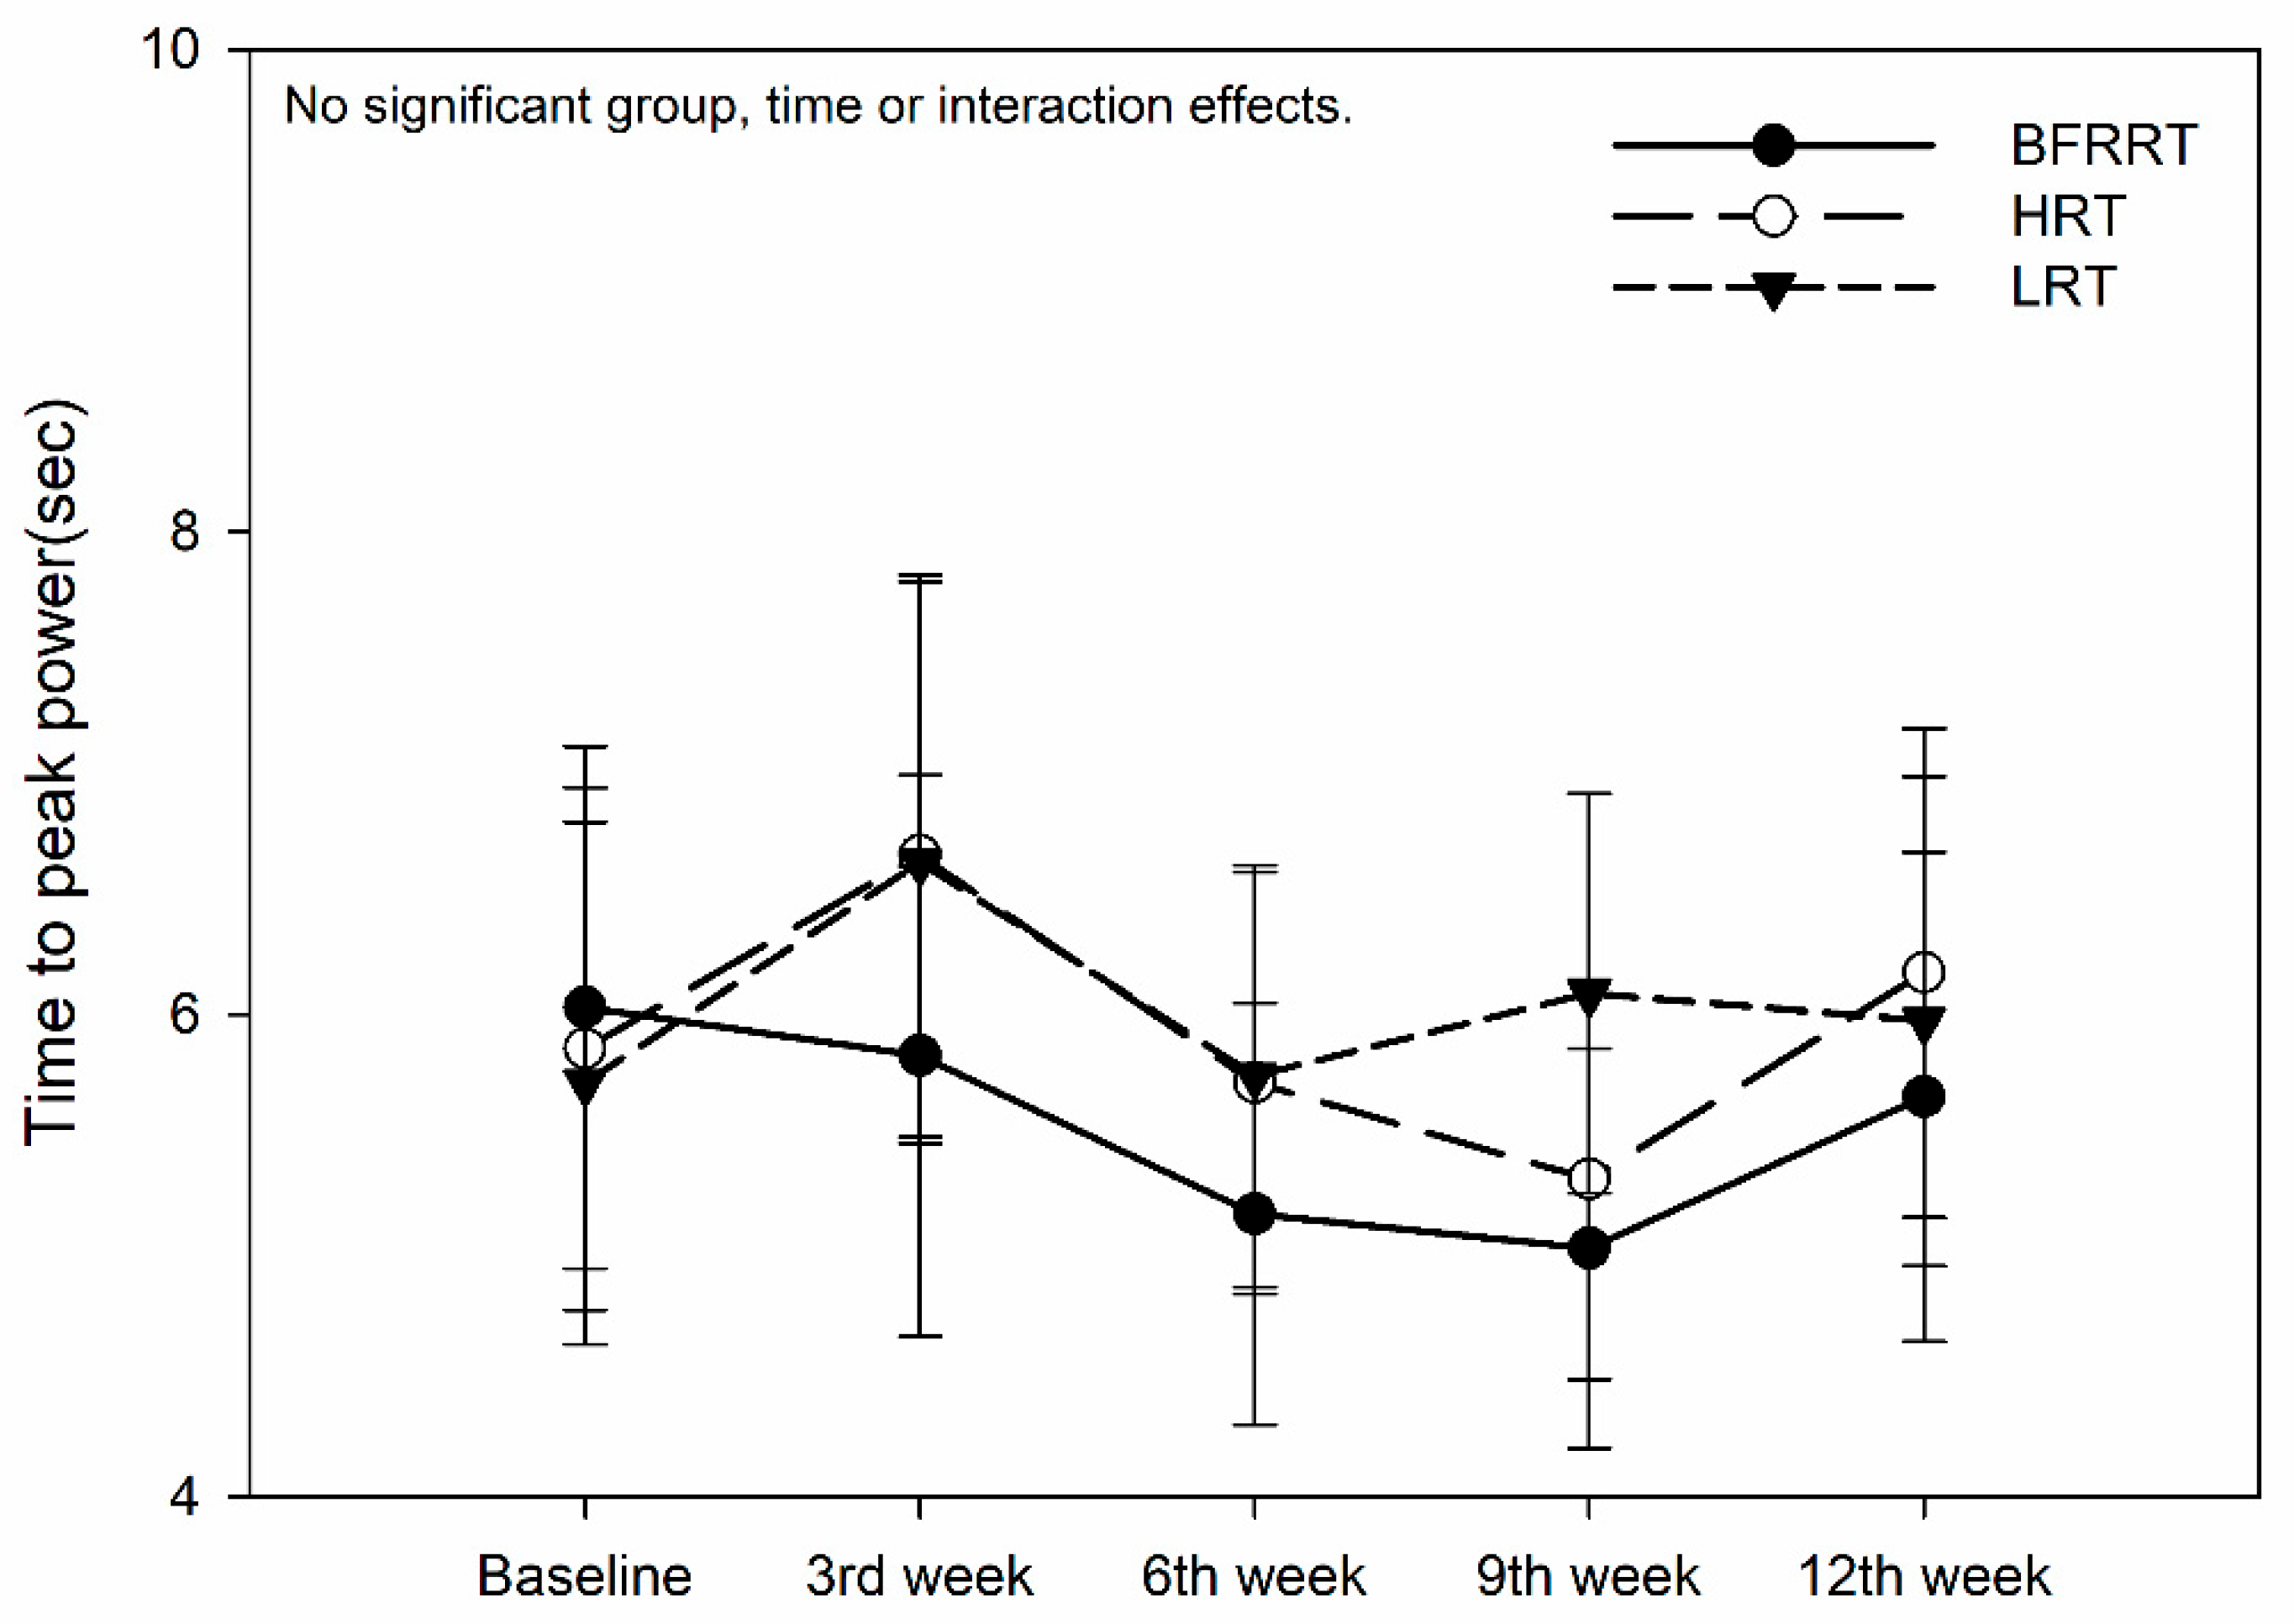

Table 1.
Demographic characteristics of participants in each group.
| Variable | BFRRT (n = 7) | HRT (n = 7) | LRT (n = 7) | F value |
|---|---|---|---|---|
| Age (years) | 24.05 ± 2.69 | 22.6 ± 2.38 | 23.37 ± 2.95 | 0.81 |
| Height (cm) | 174.66 ± 6.71 | 172.28 ± 4.19 | 174.42 ± 5.56 | 0.40 |
| Body Weight (kg) | 73.65 ± 11.18 | 67.24 ± 9.13 | 70.75 ± 6.11 | 1.296 |
| Body Fat (%) | 21.1 ± 7.23 | 14.14 ± 3.77 | 18 ± 4.96 | 3.244 * |
| BMI (kg/m²) | 24.16 ± 1.47 | 22.6 ± 2.38 | 23.37 ± 2.95 | 0.926 |
| Skeletal Muscle Mass (kg) | 33.22 ± 5.28 | 32.75 ± 4.4 | 32.81 ± 1.61 | 0.028 |
| Body Fat Mass (kg) | 16.75 ± 6.43 | 9.61 ± 3.15 | 12.98 ± 4.37 | 3.801 * |
| Waist-Hip Ratio | 0.86 ± 0.05 | 0.79 ± 0.03 | 0.84 ± 0.02 | 5.389 ** |
| Basal Metabolic Rate (kcal) | 1634.85 ± 186.40 | 1615.14 ± 155.43 | 1618.57 ± 56.92 | 0.037 |
| Right Leg mass(kg) | 9.31 ± 1.28 | 9.26 ± 0.95 | 9.19 ± 0.35 | 0.29 |
| Left Leg mass(kg) | 9.19 ± 1.26 | 9.19 ± 0.96 | 9.14 ± 0.34 | 0.007 |
| Note: Values are presented as mean ± SD. * p < 0.05, ** p < 0.01. | ||||
Table 2.
Summary of key performance variables across the 12-week intervention.
| Variable | Group | Baseline → Week 6 | Week 6 → Week 12 | Overall | Interaction |
|---|---|---|---|---|---|
| Peak Power (W) | BFRRT | Increased (p < .01) | No change (ns) | Significant improvement | Yes (p < .01) |
| HRT | Large increase (p < .001) | Increased (p < .05) | Strong improvement | No | |
| LRT | No change (ns) | No change (ns) | No improvement | No | |
| Mean Power (W) | BFRRT | No change (ns) | No change (ns) | No improvement | No |
| HRT | Increased (p < .01) | Increased (p < .05) | Significant improvement | No | |
| LRT | No change (ns) | No change (ns) | No improvement | No | |
| Fatigue Index (%) | BFRRT | No change (ns) | No change (ns) | No improvement | No |
| HRT | Decreased (p < .05) | No change (ns) | Improvement | No | |
| LRT | No change (ns) | No change (ns) | No improvement | No | |
| Time to Peak (s) | BFRRT | No change (ns) | No change (ns) | Improvement | No |
| HRT | No change (ns) | No change (ns) | Strong improvement | No | |
| LRT | No change (ns) | No change (ns) | No improvement | No |
Disclaimer/Publisher’s Note: The statements, opinions and data contained in all publications are solely those of the individual author(s) and contributor(s) and not of MDPI and/or the editor(s). MDPI and/or the editor(s) disclaim responsibility for any injury to people or property resulting from any ideas, methods, instructions or products referred to in the content. |
© 2025 by the authors. Licensee MDPI, Basel, Switzerland. This article is an open access article distributed under the terms and conditions of the Creative Commons Attribution (CC BY) license (http://creativecommons.org/licenses/by/4.0/).
Copyright: This open access article is published under a Creative Commons CC BY 4.0 license, which permit the free download, distribution, and reuse, provided that the author and preprint are cited in any reuse.


