
Submitted:
13 December 2025
Posted:
16 December 2025
You are already at the latest version
Abstract
Accurate predictions of heathland plant species are crucial for ecological monitoring and assessing biodiversity. Previous research has predominantly utilized convolutional neural networks (CNNs), which process images arranged on a regular grid. Although CNNs are effective at extracting local visual features, they frequently do not capture the irregular spatial relationships characteristic of heathland vegetation. Earlier approaches employing graph neural networks (GNNs) for plant classification have generally relied on basic or dataset-wide graph constructions, with limited consideration for edges that represent the actual morphological structure of plants. This study presents PlantGraphNet, a hybrid CNN–GNN framework that integrates visual and structural information for heathland plant species classification. PlantGraphNet extracts image-specific keypoints and local descriptors to construct graphs, where nodes correspond to plant regions and edges encode spatial relationships. The resulting graphs are processed using graph convolution and graph attention layers to capture relational context, while a CNN backbone provides complementary appearance features. These two modalities are combined into a unified representation for classification. To ensure scalability, PlantGraphNet employs distributed data-parallel training, enabling efficient gradient synchronisation across devices and near-linear performance scaling. When evaluated on Danish aerial heathland datasets, PlantGraphNet achieves a precision of 98.98 percent, substantially outperforming CNN-only baselines. In addition to improved accuracy, the explicit graph construction increases interpretability by associating classification outcomes with specific plant structures. These findings indicate that integrating CNN-derived features with purposefully designed graph representations of plant morphology yields a robust and interpretable approach for fine-grained heathland plant species classification.
Keywords:
plant species classification
; land use
; ecological monitoring
; deep neural networks
1. Introduction
Heathlands are semi-natural ecosystems with low plant species diversity, dominated by dwarf shrubs, and typically found on nutrient-poor sandy soils. These ecosystems perform essential functions, including carbon sequestration in biomass and soils and regulation of hydrological cycles [1]. Vegetation in heathlands reduces soil erosion and mitigates flood risk [2]. Anthropogenic pressures such as urbanisation, elevated nitrogen deposition, intensified agriculture, and climate change compromise the ecological integrity of heathlands. These disturbances facilitate tree encroachment, diminish native biodiversity, and reduce the ecosystem services provided by heathlands [3,4]. Conservation and restoration strategies are required to sustain the long-term functionality and resilience of these ecosystems [5,6,7,8,9]. Accurate mapping and taxonomic identification of heathland vegetation are critical for effective monitoring and evidence-based management. Current plant abundance assessments use plot-based approaches, in which species cover is manually estimated within small sample plots [9,10]. These approaches are labour-intensive, require specialised expertise, and are limited in spatial coverage. Additionally, the subjectivity of visual assessments introduces variability and reduces reproducibility across surveys and time periods.
With the increasing availability of high-resolution imagery from field-deployed cameras, unmanned aerial systems, and mobile devices, there is a growing need for automated, scalable, and interpretable systems capable of performing fine-grained plant classification under diverse and often challenging conditions. Various studies have explored the potential of deep learning algorithms, particularly convolutional neural networks (CNNs), to enhance the accuracy and efficiency of plant species classification [11,12,13]. Models like ResNet50 [14], AlexNet [15], MobileNetV2 [16], and GoogleNet [17] have achieved strong results by learning hierarchical visual characteristics from images of leaves or canopies of plants [11,18,19,20]. [21,22] applied U-net [23] to establish the efficacy of the convolutional network in effectively delineating the types and disturbances of heathland within the Atlantic rainforest, using high-resolution images. Their results revealed that the U-net model could precisely segment natural forests and eucalyptus plantations, achieving a high degree of precision. Similarly, [24,25] introduced an extensive deep-fusion model designed to leverage high-resolution satellite imagery for detailed forest mapping at the level of individual tree species. Their research underscored the importance of multitemporal data in achieving high classification accuracy, with reported results reaching 94.8 % when using Sentinel-2 imagery. However, the investigation by [26] highlighted the challenges inherent in mapping rare or nondominant over-storey plant species, especially within the complex structure of heathland ecosystems. Their findings suggest that although high-resolution imagery can aid in identifying dominant species, precisely mapping less prevalent species remains challenging due to their frequent, indistinct presence within the canopy. [27] reiterates this limitation, indicating that although their methodologies attained high precision in forest type classification, the complexities inherent in species-level differentiation within heathlands necessitate further refinement of the employed algorithms. Integrating semi-supervised and weakly supervised learning techniques has emerged as a promising avenue for addressing some of these limitations. [28] utilised CNN models to explore the potential of these approaches to enhance plant species classification.
Convolutional neural networks (CNNs) have proven effective in computer vision tasks, but they rely on rigid, grid-like data. The reliance on grid data may limit their performance in classifying plant species whose structural morphology is taxonomically significant. In fact, in plant classification, fine-grained morphological cues, such as leaf venation patterns, stem-leaf arrangements, and interleaf distances, are often critical in distinguishing between morphologically similar species. Standard CNNs are prone to overemphasising superficial features such as colour and texture, which are susceptible to variation caused by lighting, occlusion, and viewpoint changes. Moreover, the computational resources required for training deep learning models, especially when dealing with large datasets, make this task more challenging for scientists with constrained resources. This issue is especially pertinent in remote sensing applications, where high-resolution images can produce large amounts of data that require efficient processing [29].
Graph Neural Networks (GNNs) effectively handle non-Euclidean data and are applied in many fields, including but not limited to computer vision [30,31,32], plant disease detection [33,34] environmental monitoring [35,36], and urban planning [37,38]. GNNs effectively capture the relational dynamics that CNNs may not recognise [39,40]. However, GNNs have not been extensively used in classifying heathland plant species despite the intricate morphological structures present in plant species. Existing approaches employing graph neural networks (GNNs) for plant classification have generally relied on basic or dataset-wide graph constructions, with limited consideration for edges that represent the actual morphological structure of plants [33,34,41,42].
We propose PlantGraphNet, a novel graph-based framework for the classification of plant species that captures both structural and contextual morphological cues in a modular and extensible manner, including: (1) a hybrid GNN-CNN architecture that fuses graph-level relational reasoning with global visual feature extraction and (2) an implementation of a distributed training pipeline to handle high-resolution inputs efficiently and accelerate training. In this paper, the model is applied and tested in heathland classification, demonstrating superior performance compared to several baseline CNN architectures in terms of accuracy and robustness. Our architecture combines CNN-derived global descriptors with localised relational reasoning from GNNs, capturing interregional dependencies and subtle morphological patterns. To improve scalability and efficiency in handling large, high-resolution plant images, we utilise the distributed data-parallel (DDP) training paradigm, facilitating memory-efficient training and faster convergence across multiple computational nodes. Our computational analysis shows that the hybrid model achieves superior performance in fine-grained plant species benchmarks, outperforming established CNN baselines such as VGG16 [43], VGG19 [44], ResNet50 [14], ResNet101 [45], AlexNet [15], MobileNetV2 [16], GoogleNet [17], and YOLOv8 [46]. The key contributions of this work are as follows.
- We present PlantGraphNet, a scalable hybrid GNN-CNN architecture that fuses graph-level relational reasoning with global visual feature extraction.
- We implement a distributed training pipeline using DDP to handle large dataset inputs efficiently and accelerate GraphPlantNet model training.
- We demonstrate that GraphPlantNet achieves state-of-the-art performance, outperforming several standard CNN architectures in accuracy and robustness in heathland plant species classification.
2. Materials and methods
2.1. Dataset
2.1.1. Study site and Data Acquisition
The dataset was collected from an experimental 12-hectare dune heath area located at Vust Heath 1 in Northern Jutland, Denmark (57.12317°N, 9.01179°E; see Figure 1). This site is part of NATURA 2000 area no. 16, Løgstør Bredning, Vejlerne og Bulbjerg. Historically, Vust Heath formed part of a larger coastal heathland, but large-scale afforestation with spruce and pine during the 19th and 20th centuries significantly reduced its size.
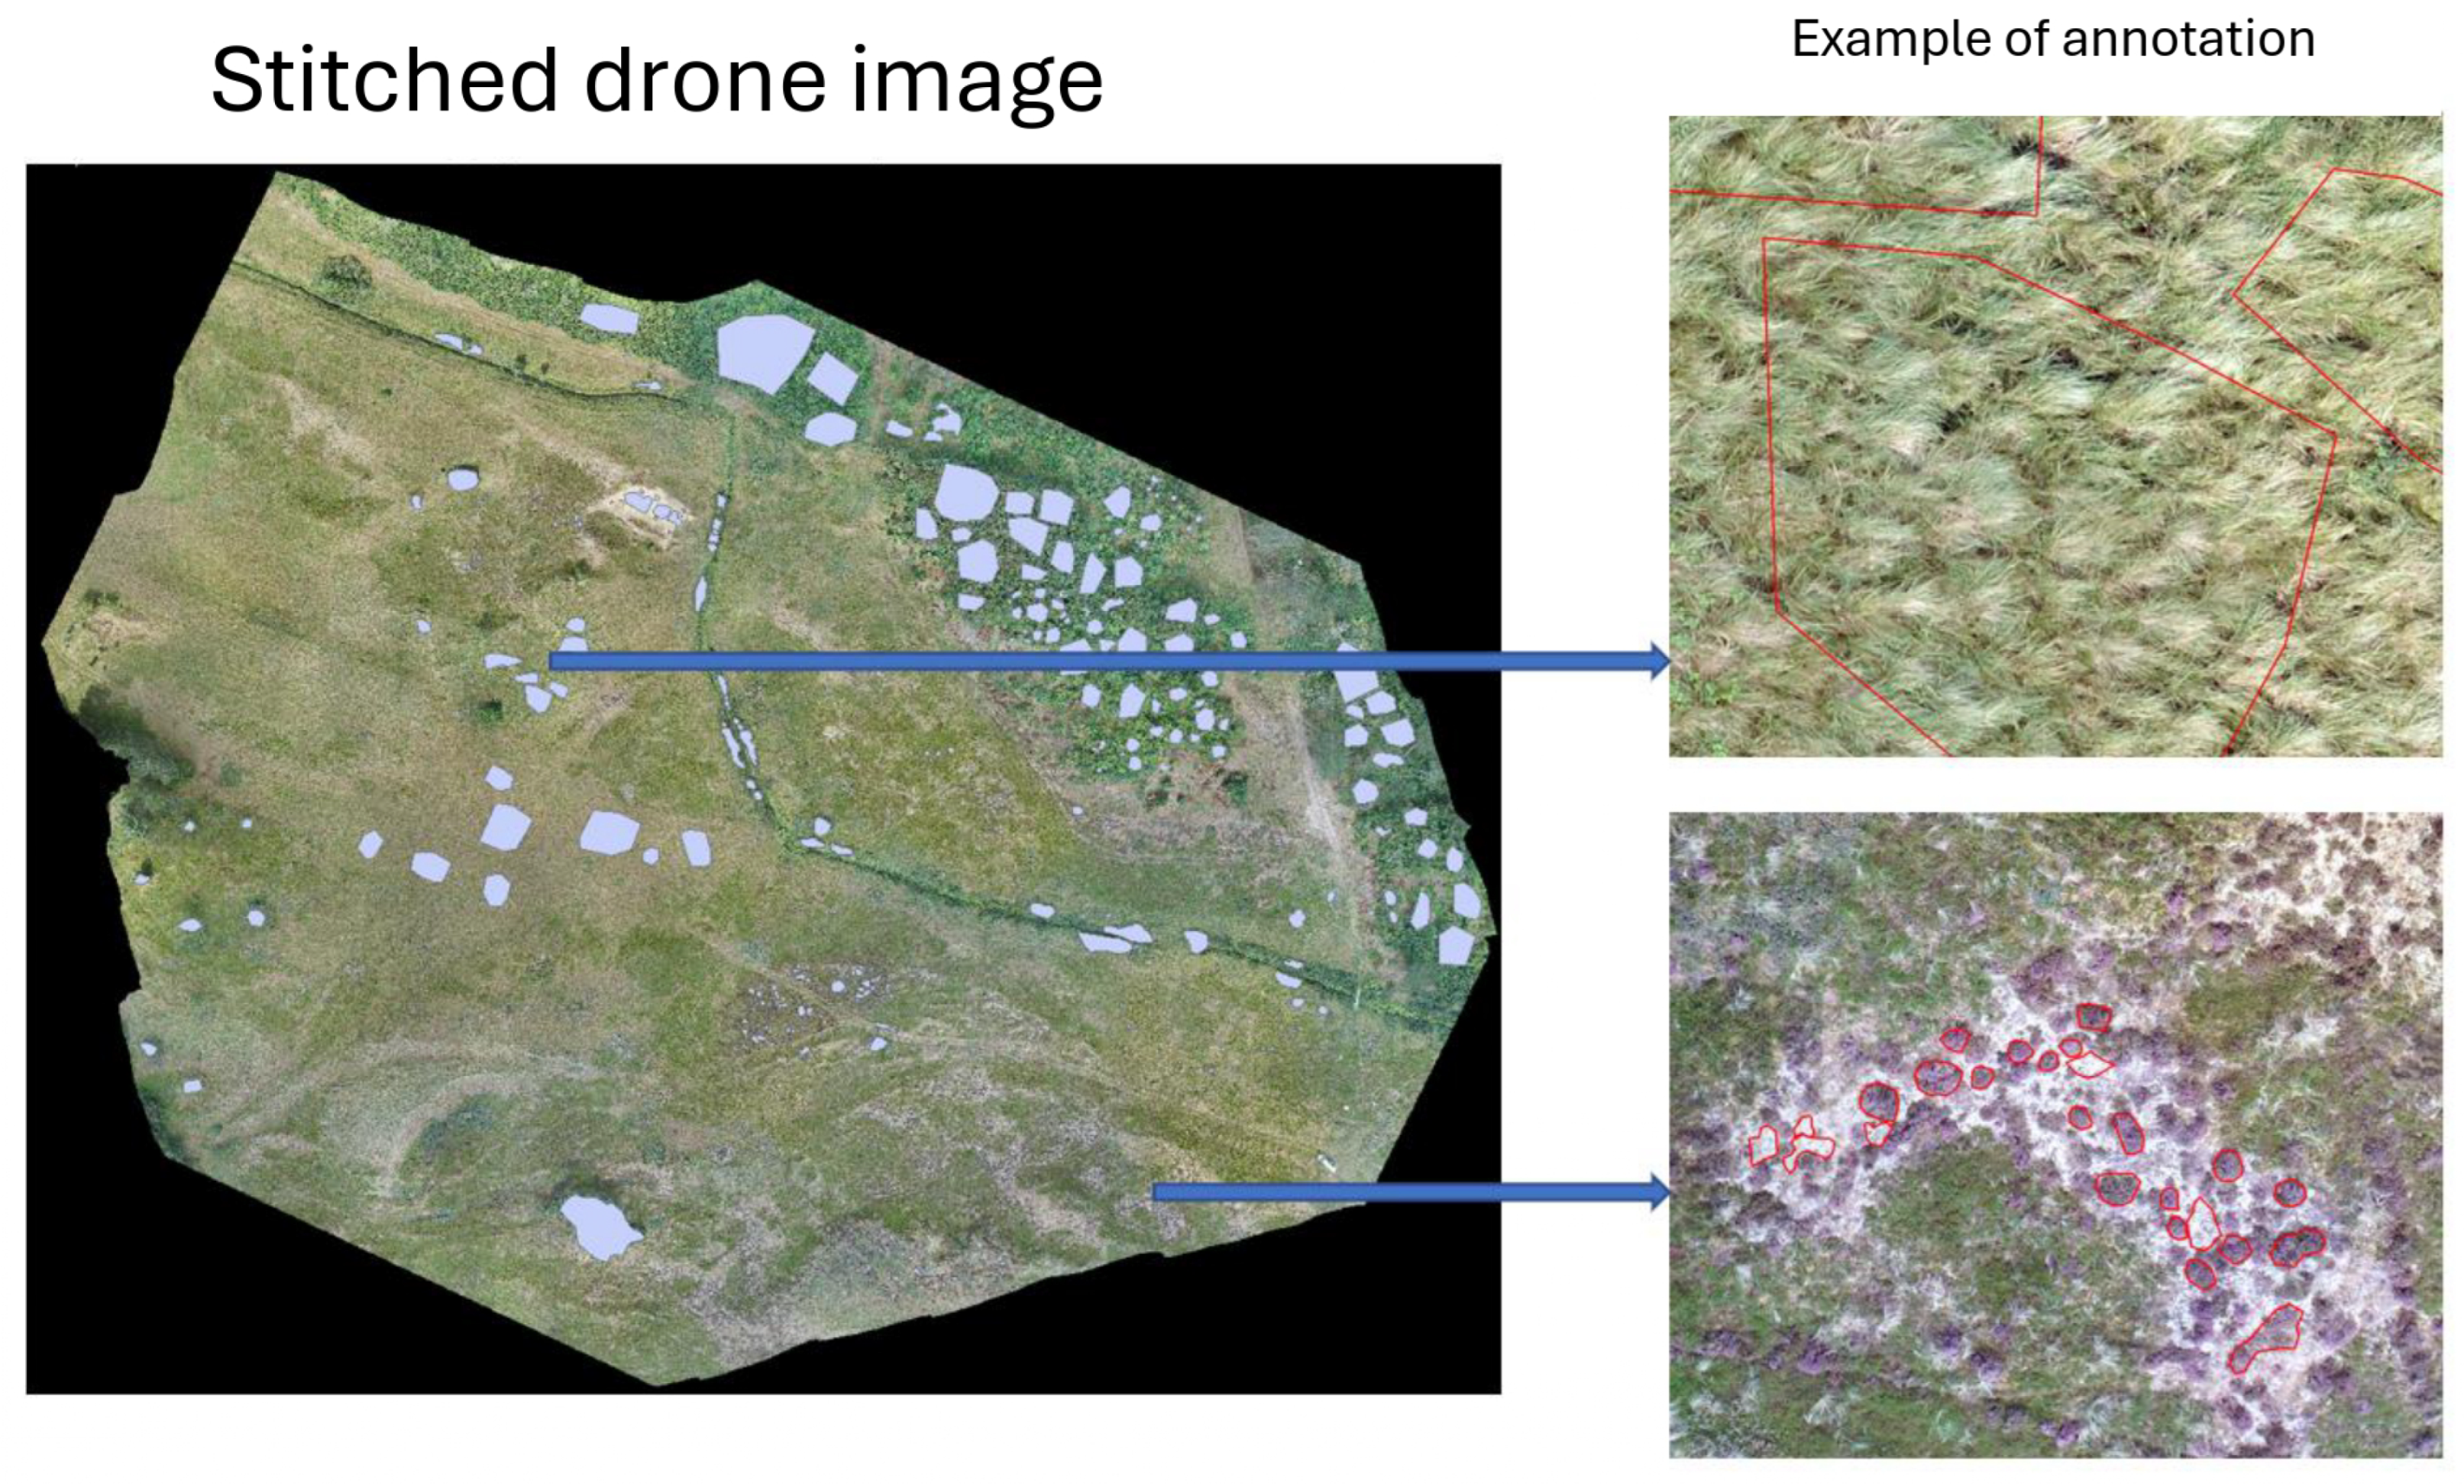
Aerial imagery was captured using a drone-mounted RGB camera under stable lighting conditions to ensure radiometric consistency and provide high-resolution detail. The captured images were subsequently processed with ArcSoft, a photogrammetry and image stitching software, to produce a high-resolution orthomosaic. The resultant stitched image has dimensions of 37,155 × 32,783 pixels, with a ground sampling distance (GSD) of 1.2 cm per pixel (Figure 2). The image stitching process was carried out for the following purposes: (i) to assign precise geospatial coordinates to each pixel for accurate ground-truth alignment, (ii) to integrate visual data from overlapping images, and (iii) to enable efficient annotation of continuous vegetation structures.
Figure 1.
Experimental area at Vust Heath in Northern Jutland, Denmark.
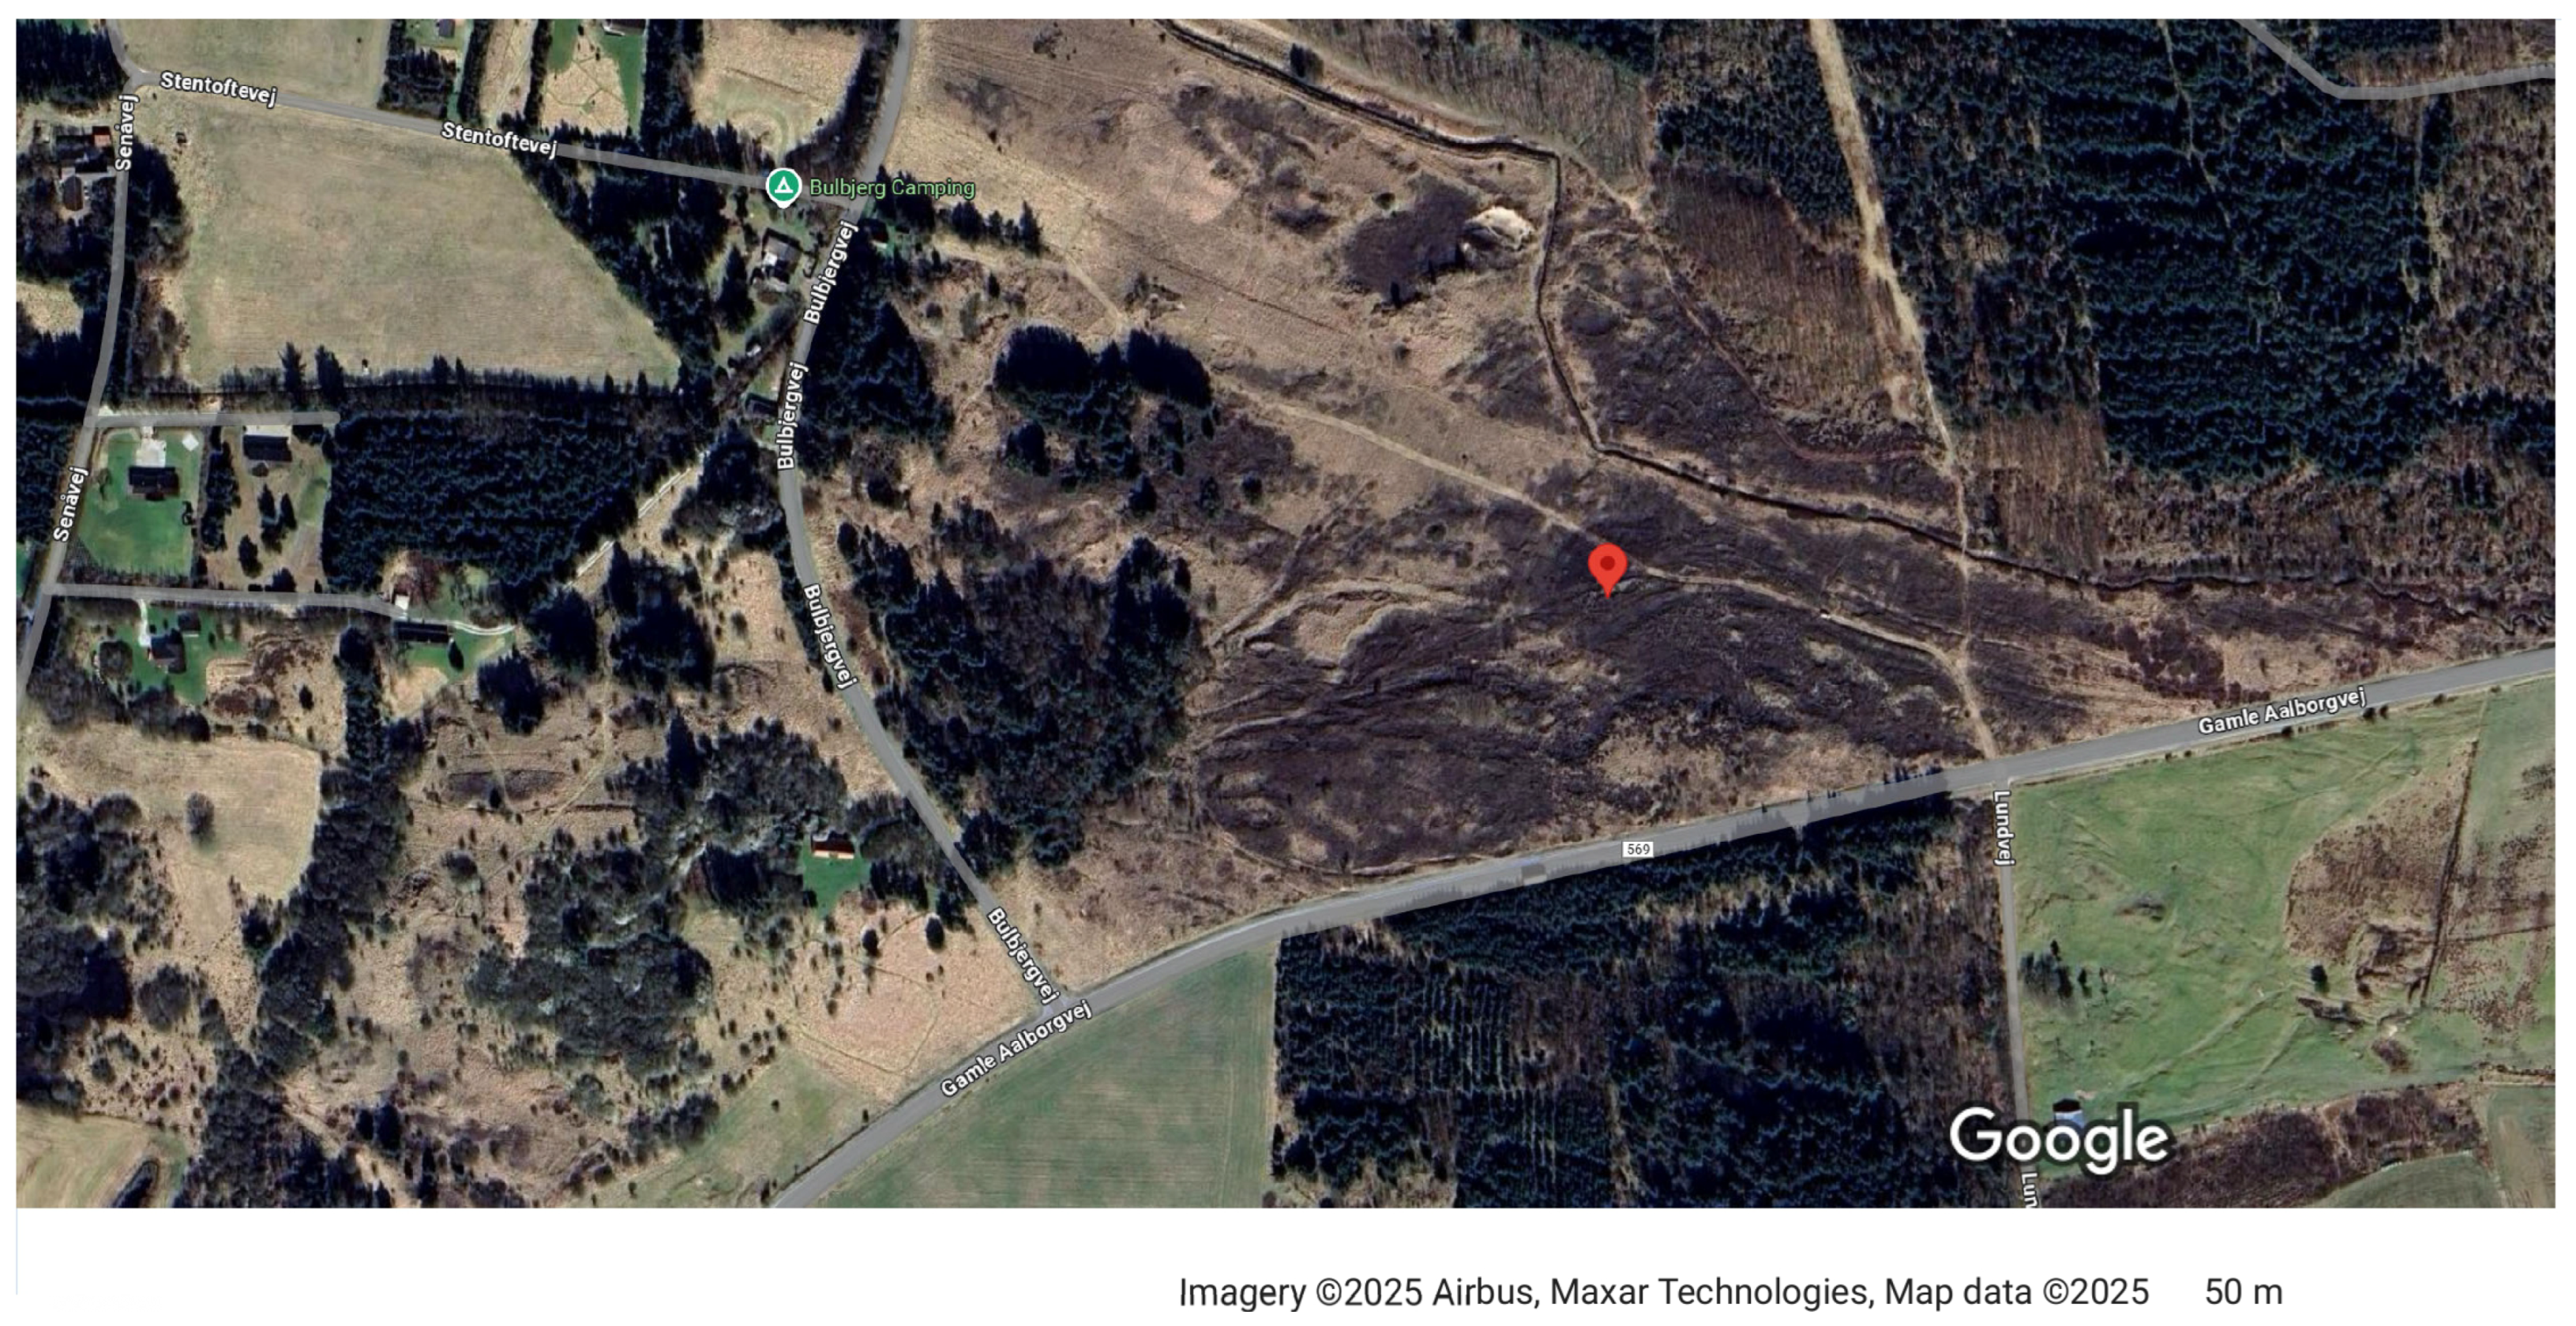
Figure 2.
Stitched orthomosaic generated using ArcSoft with annotation.
2.1.2. Preprocessing and Data Split
We conducted manual annotation of the orthomosaic image. Manual annotation was performed by trained ecologists using GIS software. Polygons were delineated and classified into one of 10 predefined land cover classes, comprising 10 vegetation types, bare soil, and nine species or species groups (e.g., trees, lichens). These annotations correspond to ecologically significant boundaries and were validated by domain experts to ensure the accuracy of the labelling. The annotated polygons are cut as quadratic pictures of pixels. Figure 3 shows examples of the three vegetation types. This patch size was selected to strike a balance between ecological resolution and computational feasibility. Standard image augmentation techniques were applied to augment training data and enhance model robustness, including random rotations, horizontal and vertical flipping, and zooming. Our dataset consists of 12,140 images sourced from the annotated orthomosaic. We split the dataset into training, validation, and test sets, using 60% (7,281 images) for training, 20% (2,424 images) for validation, and 20% (2,435 images) for testing.
2.2. Methods
The proposed method constructs graph representations of plant images by detecting SIFT keypoints and connecting them using k-nearest neighbor relationships, which preserves spatial structure for relational learning. These graph-based features are combined with image-based features within a hybrid GNN-CNN architecture, as illustrated in Figure 4, to facilitate multimodal classification. Model training is performed efficiently using a distributed data-parallel framework.
2.2.1. Graph Dataset Construction from Images
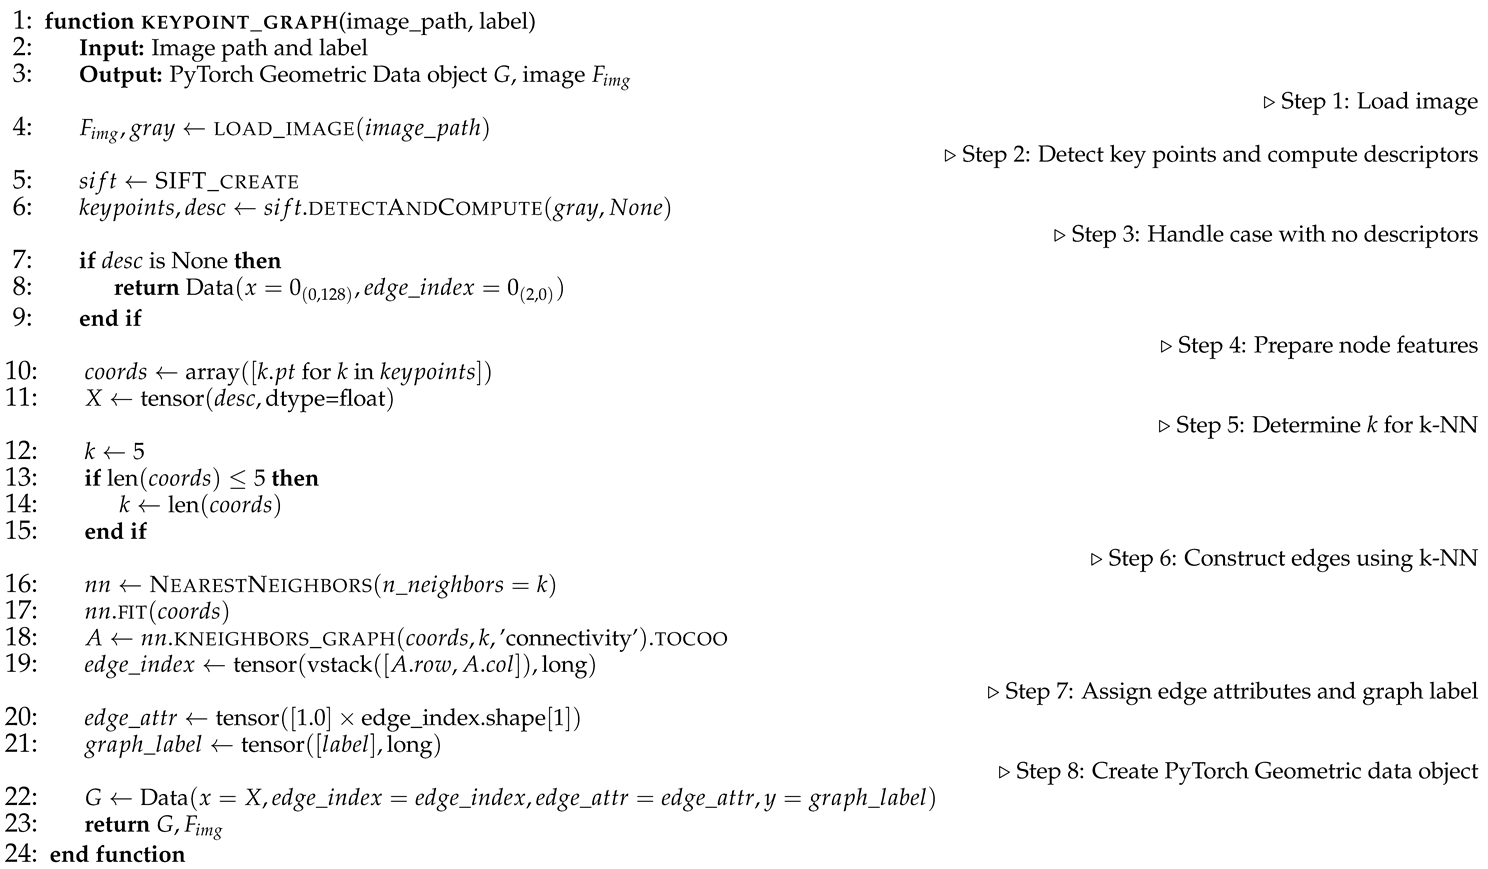
Graph-based representations of plant images are used to preserve the spatial relationships between local features, which are essential for robust analysis (Algorithm 1). Graph representations encapsulate the spatial structure among image regions, enabling learning algorithms to incorporate spatial context effectively. Specifically, we adopt keypoint-based graphs, where each keypoint refers to a distinctive location in the image (e.g., corners or blobs) robust to scale and rotation. These key points are detected using the Scale-Invariant Feature Transform (SIFT) algorithm [47,48,49] applied to images. Each detected keypoint is treated as a node in the graph and is associated with a 128-dimensional feature vector , corresponding to its SIFT descriptor. Edges are formed by connecting each node to its k nearest neighbours in the 2D spatial domain, where pairwise distances are computed using the Euclidean metric. The value of k is set to 5 when at least five key points are detected; otherwise, it is adjusted to match the total number of available key points. The resulting edge connections define the graph’s edge index structure and each edge attribute is assigned a constant value of 1.0. Figure 5 illustrates the original input image, the detected key points, and the graph that has been constructed from these key points.
| Algorithm 1 Keypoint-based Graph Construction Method |
 |
2.2.2. Hybrid GNN-CNN Architecture
We propose a hybrid neural architecture that synergistically integrates graph-structured data and image-based information for improved multimodal classification. The model incorporates a GNN backbone for relational reasoning over structured inputs alongside a CNN module for extracting high-level semantic representations from images. This architectural design enables joint modelling of both topological and spatial contexts.
Graph Representation Learning
Let be a graph, where V denotes the set of nodes and E is the set of edges. In GNNs, a neural "layer" is reformulated as a two-step message-passing framework. At each layer, k, the representation of a node is updated by first aggregating information from its neighbourhood using an aggregation function Agg to compute . This aggregated information is then combined with the previous representation of the node using a combination function Comb. The result is processed through a series of transformations: normalisation Norm, which stabilises training by reducing internal covariate shift; dropout , which serves as a regularisation technique to prevent overfitting by randomly zeroing some nodes; and a non-linear activation function , which introduces non-linearity into the model [50]. The update procedure is formally expressed as:
where represents the initial feature vector of node i , and denotes the dropout operator.
Our GNN model consists of three graph convolutional layers, , applied over a batch of B graphs. To accommodate graphs with a variable number of nodes, all node features are concatenated into a single tensor , where is the total number of nodes across the batch, and F is the feature dimension. Edge features , edge indices , and a batch vector , which maps each node to its graph, are also included as inputs.
Each convolutional layer follows a unified structure comprising graph convolution, normalization, Dropout, and activation. The first layer is expressed as:
with subsequent layers defined similarly:
To derive a graph-level embedding, global additive pooling is performed over the node embeddings of the final layer:
yielding , where d is the output dimension. This pooled representation is then passed through a fully connected layer:
where is initialized using Xavier uniform initialization and is a zero-initialized bias term.
Image Representation Learning
To efficiently extract semantically significant features from raw plant imagery, we leverage the capabilities provided by pretrained CNNs, which function as robust visual encoders due to their extensive training on large-scale annotated datasets. Specifically, the ResNet-50 architecture, pre-trained on ImageNet-1K, a benchmark database encompassing more than one million natural images, is utilised. This pretraining enables the network to acquire hierarchical visual representations, ranging from low-level edges to complex semantic structures, which effectively generalise to domain-specific imagery, such as photographs of plants. Given a set of input images , the ResNet-50 encoder processes each image to produce a global feature vector through the global average pooling of the final convolutional block. This methodology produces a feature tensor , where denotes the dimension of the final layer in ResNet-50.
We apply a linear transformation to map these features into a shared embedding space (e.g., for multimodal learning or downstream tasks).
where is a learnable projection matrix and is a bias term, initialized to zero. The resulting embeddings provide compact and transferable representations of the input images.
Multimodal Fusion and Classification
In the multimodal configuration, the final joint representation is constructed by concatenating the learned embeddings from the graph and image modalities, followed by dropout regularisation:
Here, Dropout is used as a stochastic regularisation technique that randomly zeroes a proportion p of the input units during training. It mitigates the risk of overfitting by discouraging the co-adaptation of features. This work uses a dropout rate of .
The resulting multimodal representation is then passed through a linear classifier to compute the class logits:
where is the learned weight matrix, is the bias term, and C denotes the number of target classes.
The classification pipeline is adapted accordingly in the unimodal setting, where only a single modality is utilised. For instance, in the graph-only variant, the image embedding is omitted, and classification is performed directly on the graph representation:
All linear transformations are initialised using the Xavier uniform initialisation scheme, and all biases are initialised to zero. Dropout is consistently applied before the final classification layer in multimodal and unimodal regimes to promote generalisation.
2.2.3. Distributed Data-Parallel Training Framework
We employ a DDP training strategy to efficiently scale model training across multiple computational units. This paradigm replicates the model on each processing unit and partitions the global training dataset so that each unit receives a unique mini-batch. This setup allows all devices to perform computation concurrently while maintaining synchronisation of the model parameters.
Let denote the partitioning of the data set among N processing units. In each training step, device computes the gradient of the local loss function with respect to the model parameters , using its local data partition :
where is the task-specific loss function and denotes the model.
After computing the local gradients, a global synchronisation step aggregates the gradients across all devices:
This synchronised gradient is then used to perform a consistent parameter update across all devices, ensuring that:
where is the learning rate.
In distributed training, the accelerator module synchronises the model, the optimiser, and the data loaders while overseeing the allocation of computational resources and distributed sampling. This helps avoid data overlap and maintains the training workflow [51]. By managing gradient calculations, attention can be paid to refining the model without worrying about device-specific challenges, thereby improving computational efficiency and scalability. By using a hierarchical all-reduce protocol, the synchronisation process across devices decreases latency and bandwidth consumption, facilitating nearly linear performance scaling with the increased number of devices, thereby enabling scalable training.
3. Model Evaluation and Results
3.1. Baseline
To rigorously evaluate the performance of our proposed PlantGraphNet architecture, we compared it with a diverse set of baseline convolutional neural network (CNN) architectures widely used in image classification. These baselines include lightweight and deep networks, as well as encoder-decoder architectures. All models are initialised with ImageNet-pretrained weights, and their final classification layers are replaced and fine-tuned for the target number of plant species classes. The backbone layers are frozen to ensure fair comparison, and only the modified classification heads are trained.
- AlexNet [15]: Convolutional neural networks (CNNs) consisting of sequential convolutional and fully connected layers. For the classification task, the original classifier heads are extended with additional non-linear transformations and regularisation techniques such as dropout.
- GoogLeNet [17]: A CNN based on Inception modules, which combine multiple convolutional filter sizes in parallel to capture multi-scale features within the same layer.
- YOLOv8 [46]: An object detection architecture characterized by an anchor-free design, distinct detection heads, and improved backbone efficiency. It has been adapted for classification through the substitution of detection-specific elements with a global pooling and classification head.
All baseline models are implemented in PyTorch and share a unified training pipeline for consistency in optimisation and evaluation. Performance is measured using classification accuracy, precision, and the F1 score on the same plant species dataset used to evaluate PlantGraphNet.
3.2. Settings
The training process is guided by the categorical cross-entropy loss, a widely adopted objective function for multi-class classification. Let denote the vector of ground truth encoded with a one-hot vector, and let denote the predicted probability vector after softmax activation, where C is the number of classes. The cross-entropy loss for a single sample is given by:
The model is optimised using the Adam optimiser, which computes adaptive learning rates for each parameter by maintaining estimates of the gradients’ first and second moments, thus facilitating stable and fast convergence across a wide range of deep learning models. During each epoch, model weights are updated based on backpropagated gradients, and the loss is accumulated to track convergence. The model achieving the lowest training loss is checkpointed for subsequent evaluation.
3.3. Evaluation Metrics.
Model performance is evaluated using standard classification metrics, computed per class and aggregated as needed. We use the following:
-
Precision (Positive Predictive Value), defined for class c as:where is the number of true positives and the number of false positives for class c.
-
Recall (Sensitivity or True Positive Rate), defined as:Where is the number of false negatives for class c.
- F1-Score, the harmonic mean of precision and recall:
-
Accuracy, the overall proportion of correctly classified instances, defined as:here N is the total number of samples, the summation adds 1 for each correctly predicted label ; otherwise, it adds 0.
To qualitatively assess classification performance, we also use a confusion matrix. Each entry in the matrix corresponds to the number of instances in class i predicted as class j. Finally, a comprehensive classification report is compiled, presenting the aforementioned metrics for each class individually, along with their weighted average counterparts. This detailed analysis helps us to understand class-specific behaviour.
3.4. Results
Table 1 presents the performance of PlantGraphNet compared to baseline models. ResNet50 achieved the highest performance among conventional architectures, with an accuracy of 97.86%, alongside precision of 0.9788, recall of 0.9786, and an F1-score of 0.9785. The lightweight YOLOv8n model further improved results, reaching an accuracy of 98.95%. PlantGraphNet achieves an accuracy of 98.97%, precision of 0.9898, recall of 0.9897, and an F1-score of 0.9897. This performance highlights the advantages of combining graph-based relational modeling with convolutional feature extraction, enhancing both local and global reasoning for fine-grained vegetation classification. As indicated in Table 2, PlantGraphNet consistently performs well across classes, particularly in dominant categories like grass and nonveg. It retains strong precision and recall in challenging classes such as lichens and rosa_rugosa, though with slight degradation in performance.
An evaluation of class-wise performance between ResNet50 and PlantGraphNet (Figure 6) indicates that PlantGraphNet consistently surpasses ResNet50 across all vegetation classes regarding precision, recall, and F1 score. Despite both models demonstrating commendable overall performance, ResNet50 displays discernible deficiencies in specific courses, such as lichens and rosa_rugosa, where a marked decline in its recall and precision is evident. In contrast, PlantGraphNet achieves near-perfect scores in most classes, including those where ResNet50 performs poorly. Moreover, aggregate measures—such as accuracy, macro average, and weighted average—are markedly enhanced with PlantGraphNet, achieving approximately 99.5 % compared to ResNet50’s approximately 97.5 %. These findings highlight the efficacy of integrating graph-based relational information within vegetation classification tasks.
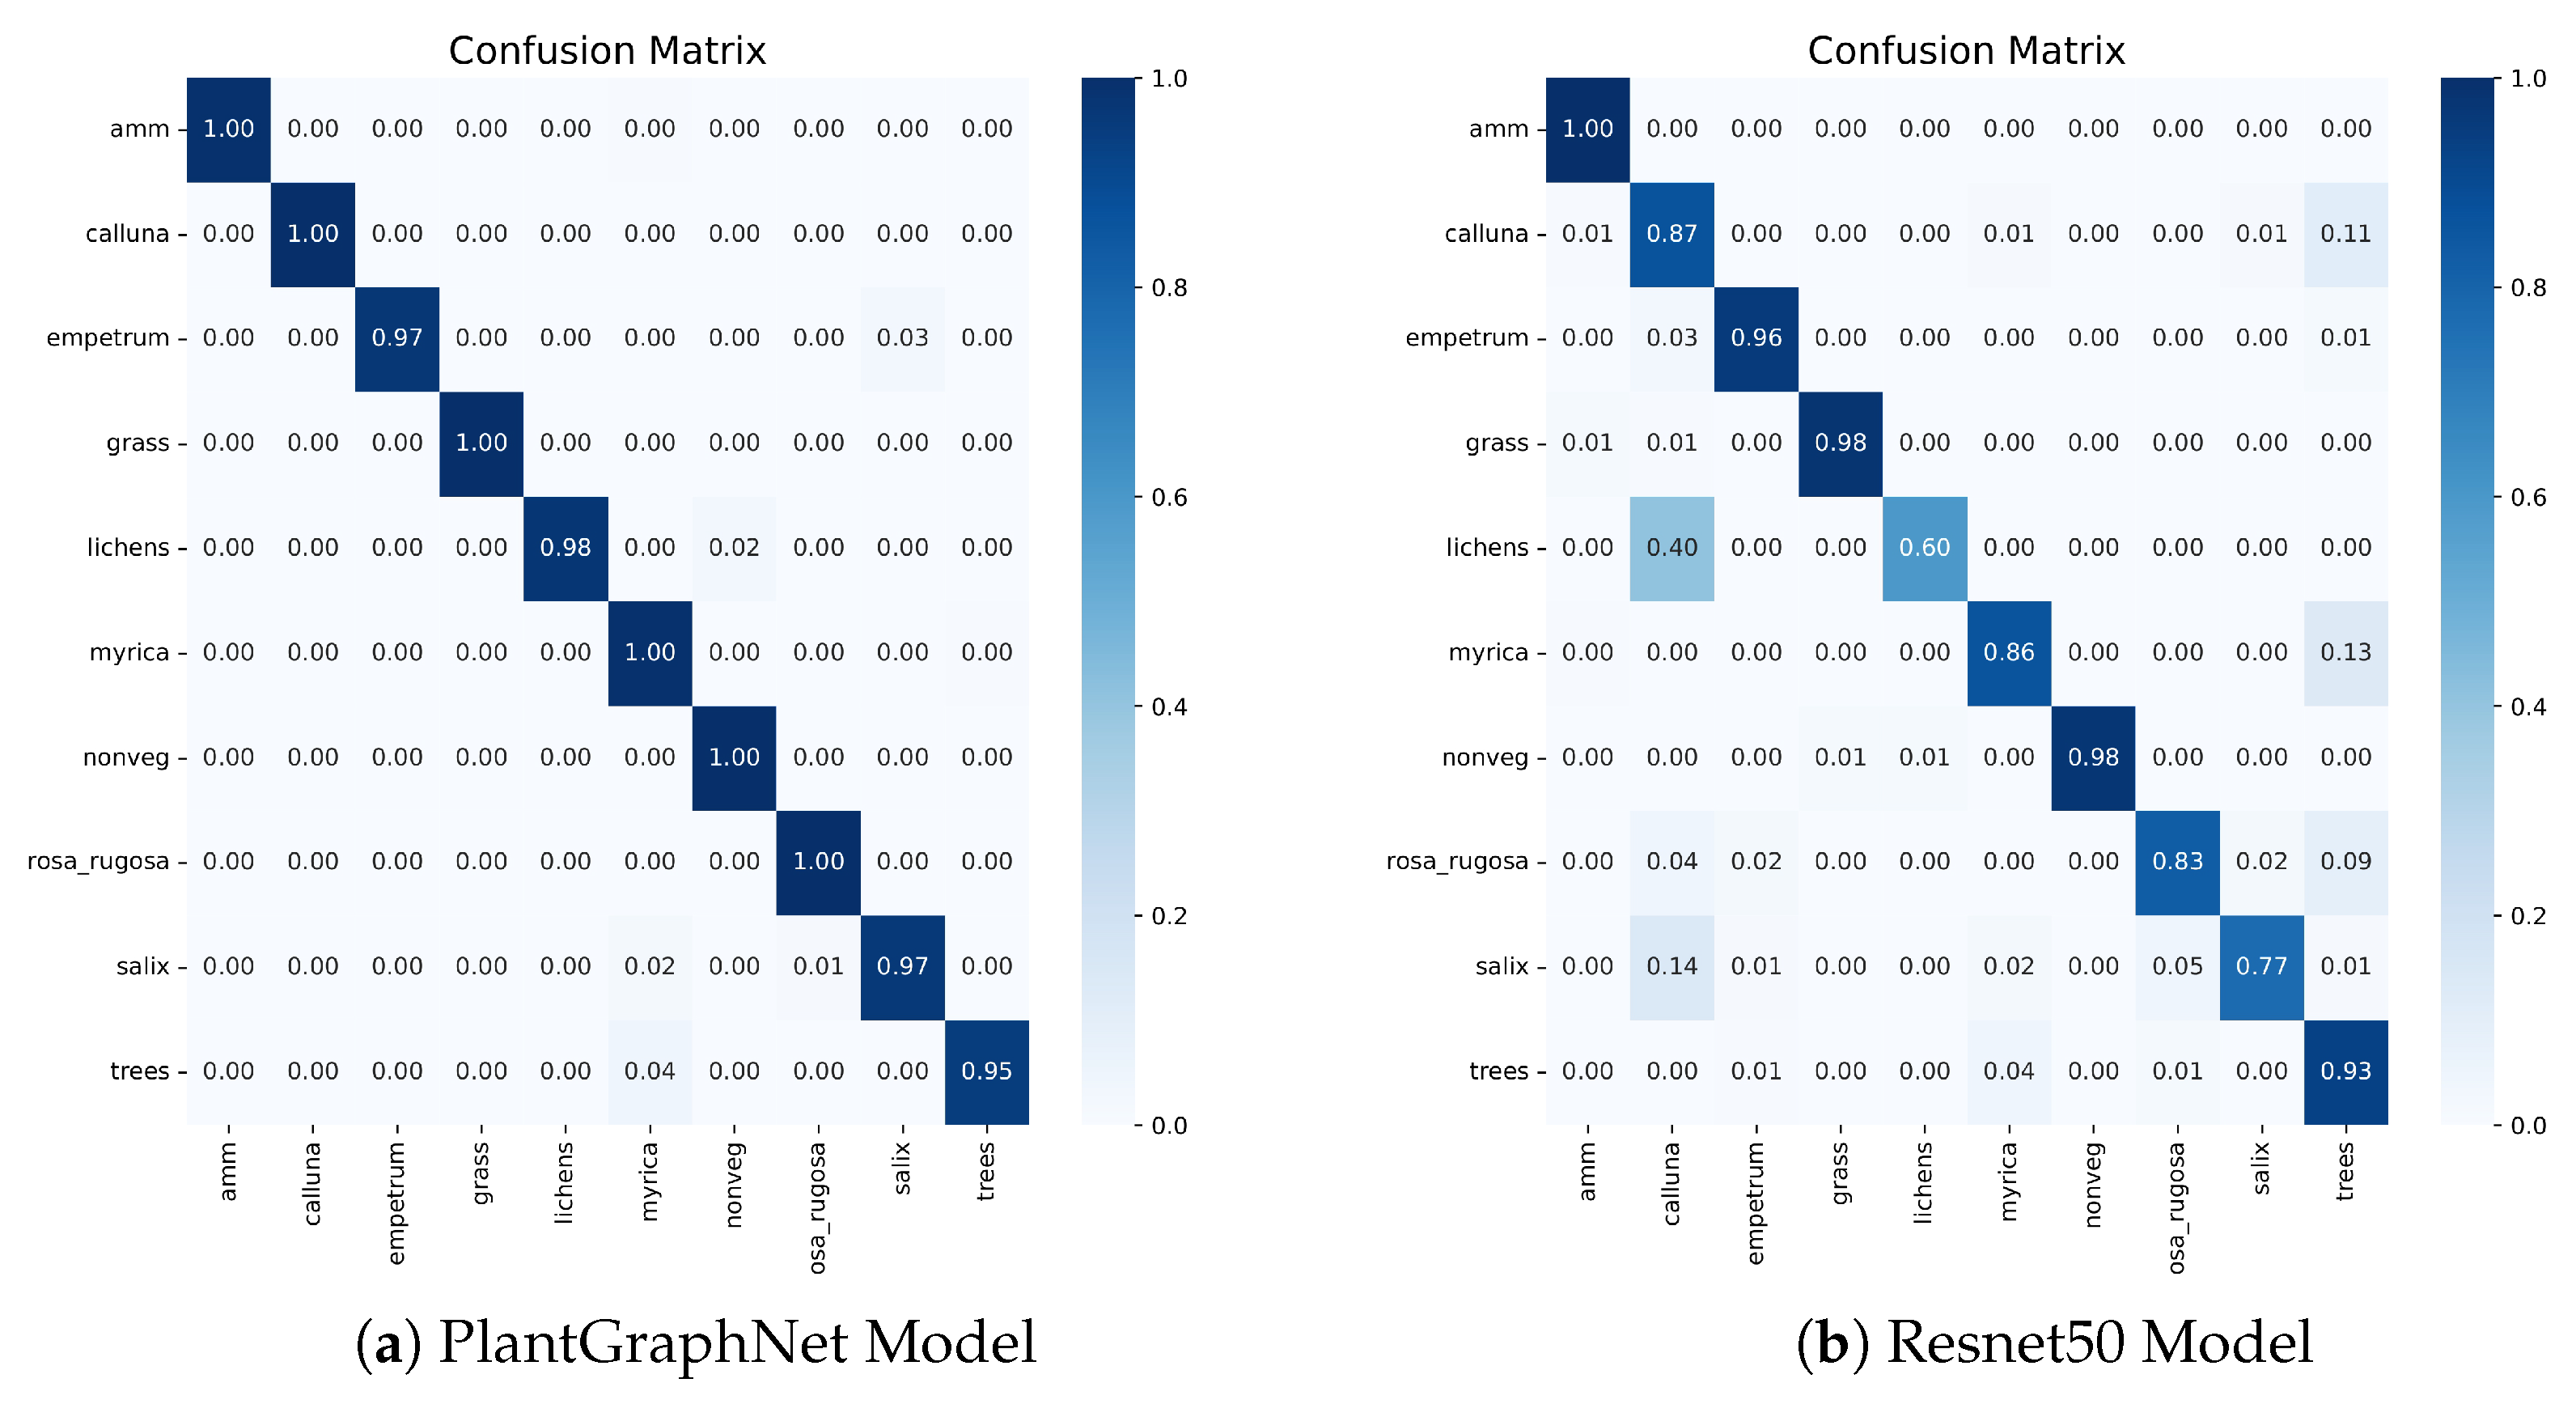
The confusion matrix analysis supports this finding. Figure 7 shows that PlantGraphNet has superior precision with more diagonal concentration, indicating consistent correct predictions. Conversely, ResNet50 shows more off-diagonal elements, indicating greater confusion. These differences highlight PlantGraphNet’s effective use of graph-based features to distinguish similar inputs better. Overall, PlantGraphNet outperforms a conventional CNN backbone in classification.
Figure 6.
class-wise performance between ResNet50 and PlantGraphNet.
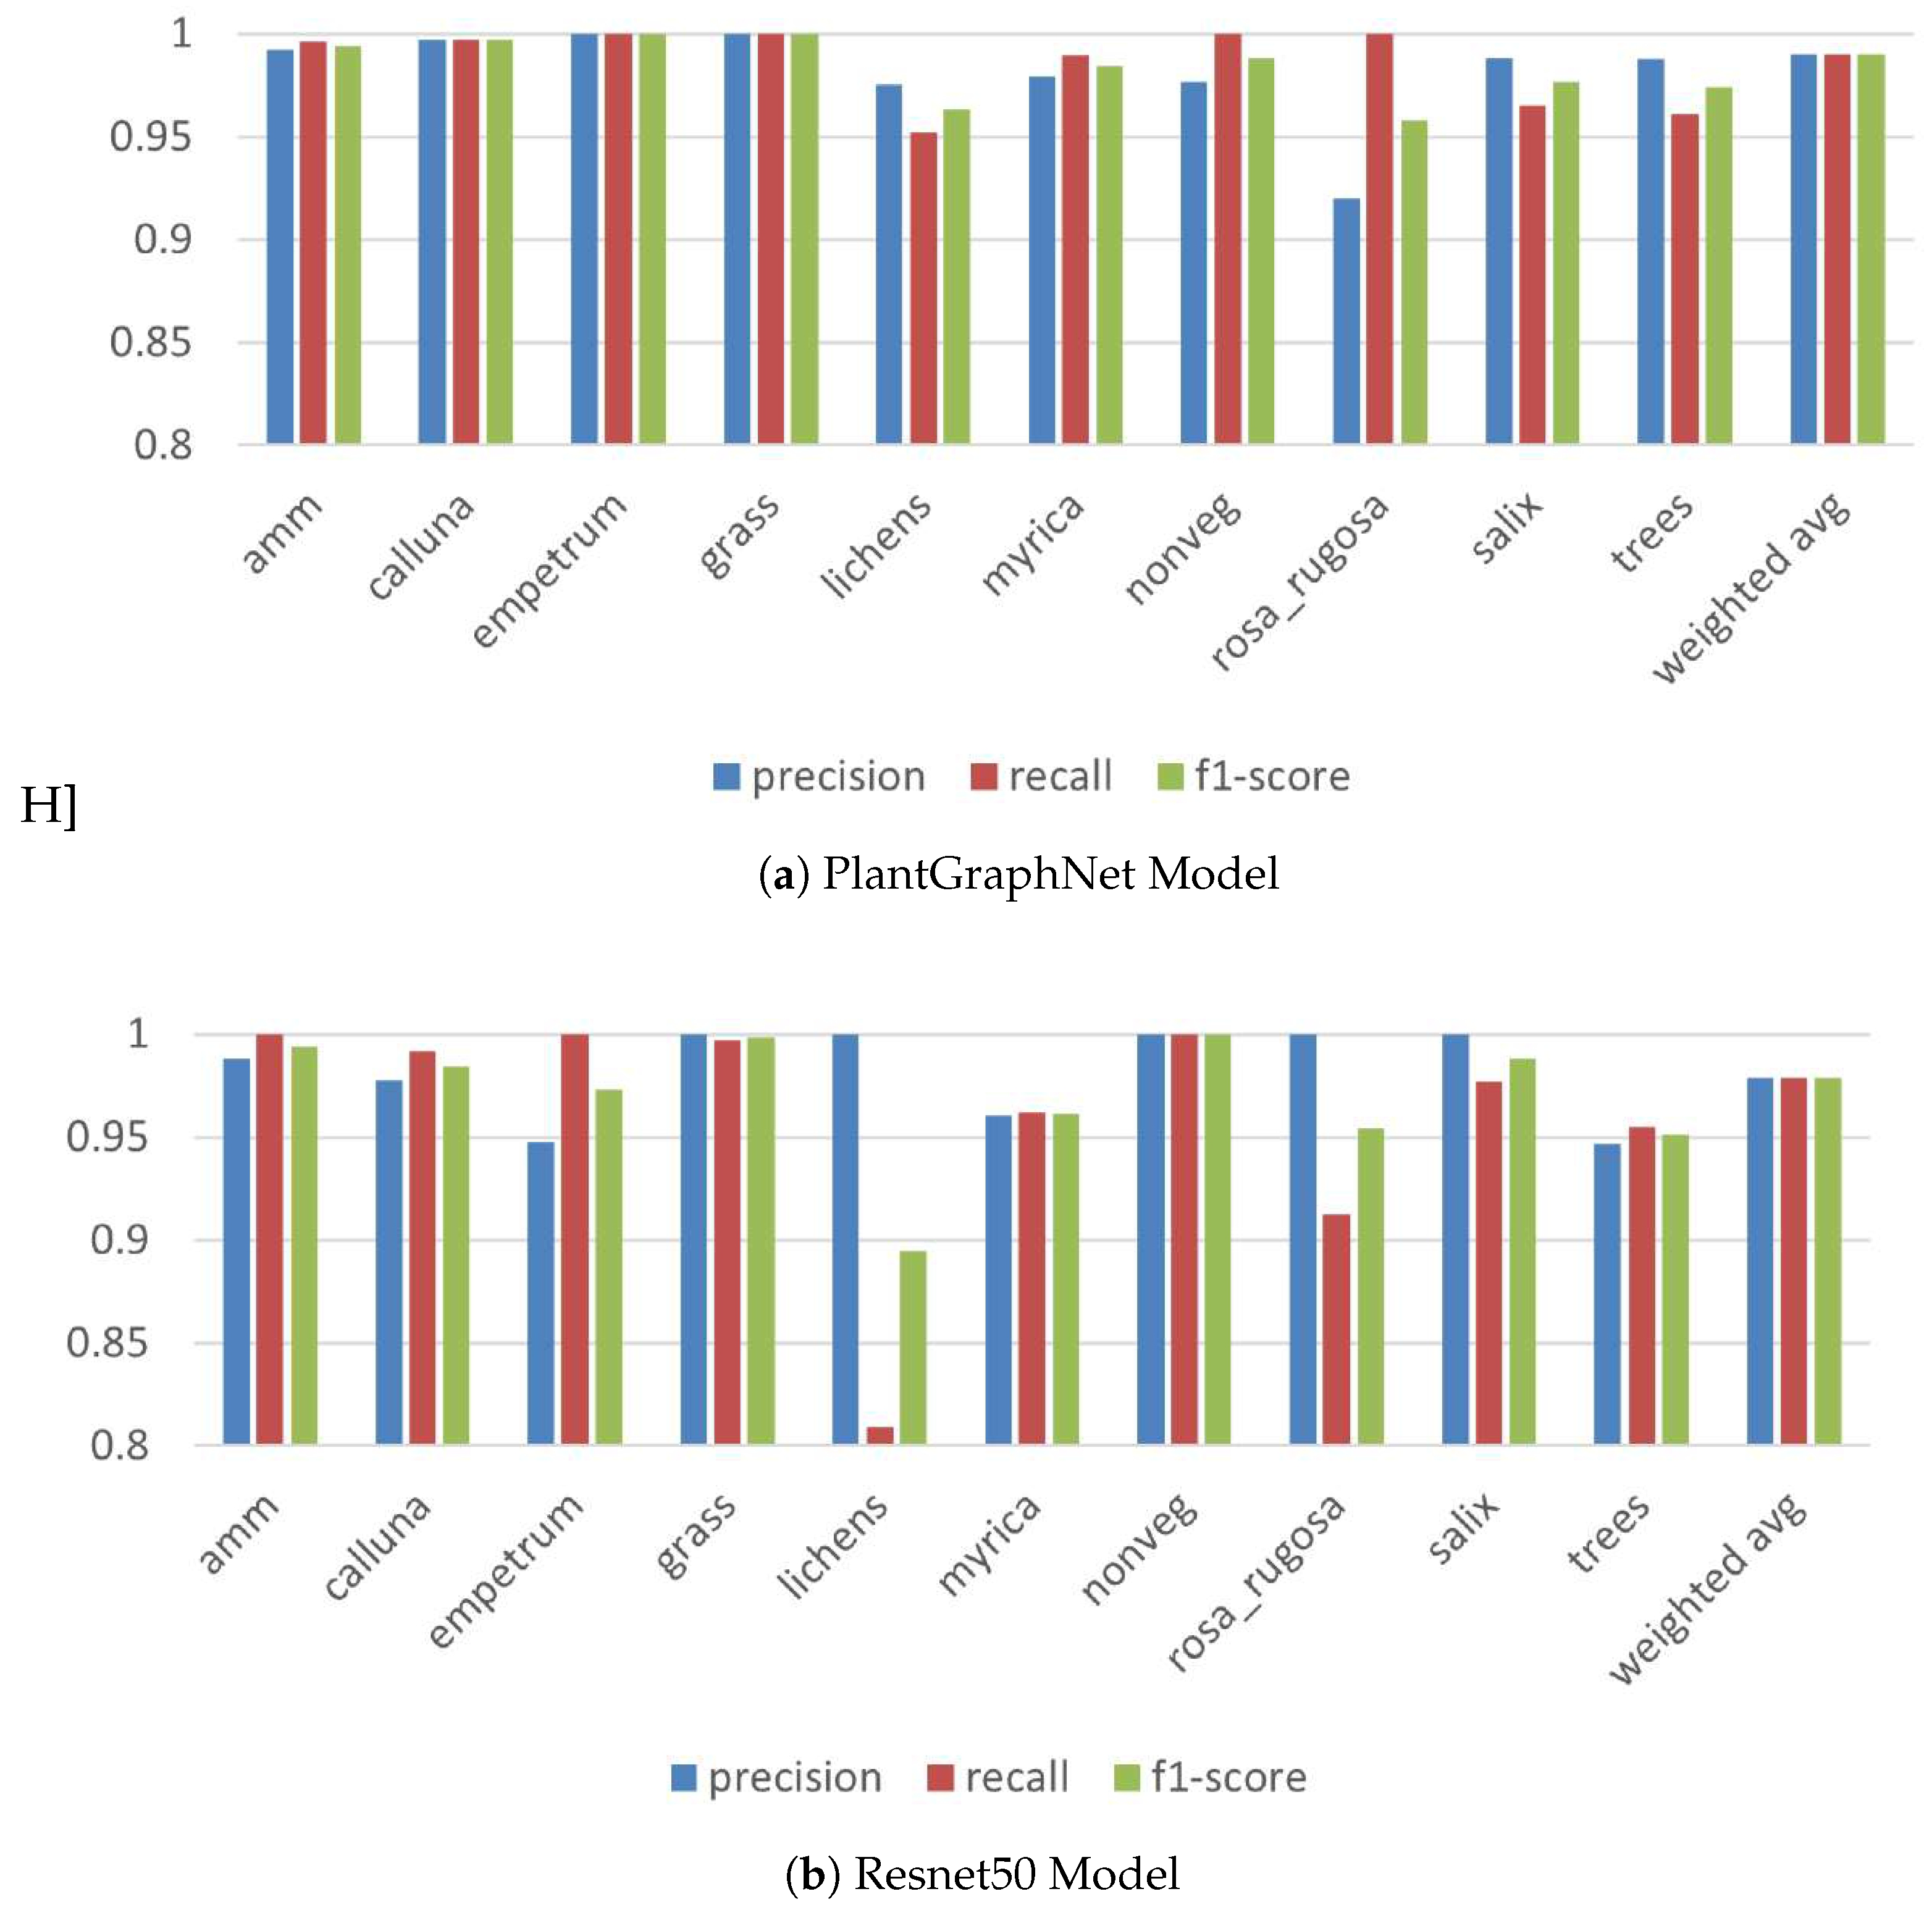
Figure 7.
Confusion Matrix of Resnet50 vs PlantGraphNet.
3.5. Ablation Study
3.5.1. Influence of Graph Construction Method
We investigated the effect of graph construction strategies on model performance by comparing our proposed keypoint-based graph with three alternatives, each encoding distinct structural priors.
- Region Adjacency Graph (RAG): Constructs nodes from superpixel segments using SLIC, with edges formed between adjacent regions and edge weights based on mean colour dissimilarity.
- Superpixel Graph: Similar to RAG, but with adjacency derived explicitly from boundary connectivity rather than a region adjacency graph, yielding a finer representation of local transitions.
- Grid Graph: A dense pixel-level graph with raw RGB features and a 4-connected topology, preserving spatial locality but lacking abstraction.
The analysis of the confusion matrices, presented in Figure 8, indicates that graph construction methods that use spatial abstraction (RAG, Superpixel Graph, and Keypoint-based graph) perform significantly better than the dense grid graph at the pixel level. This highlights the importance of structuring the input data into meaningful components beyond raw pixels for the task of plant species classification. The key point-based graph consistently performs superiorly or equally, outperforming in challenging classifications such as lichens and Rosa rugosa.
3.5.2. Influence of the Hybrid Model
To assess the efficacy of the proposed hybrid GNN-CNN architecture, we conducted ablation studies comparing three configurations: (i) GNN-only, utilising solely graph-structured inputs; (ii) CNN-only, leveraging only image features; and (iii) the hybrid model, which integrates both modalities through late fusion. Empirical results (Figure 9) demonstrate that the hybrid model consistently outperforms the unimodal baseline in all evaluation metrics. Although the GNN-only variant effectively captures topological dependencies in structured data, it lacks sensitivity to fine-grained visual cues. Conversely, the CNN-only model excels at capturing spatially local textures but fails to exploit the relational inductive bias inherent in graph representations. The hybrid model combines the strengths of both GNN and CNN, thereby improving classification accuracy and demonstrating the effectiveness of the hybrid model in modelling plant structures.
3.5.3. Influence of Distributed Data-Parallel Training
The effectiveness of distributed data-parallel training (DDP) for the PlantGraphNet model is evaluated using single-GPU, 2-GPU, 3-GPU, and 4-GPU configurations. The findings, depicted in Figure 10, indicate that DDP facilitates substantial improvements in training efficiency while preserving model convergence and generalisation capabilities. As the quantity of utilised GPUs increases, the wall-clock training time diminishes almost linearly, evidencing this approach’s scalability. This acceleration is achieved while maintaining uniform convergence patterns, as indicated by the analogous metric outcomes observed across all configurations. The enhanced throughput provided by DDP permits larger effective batch sizes, consequently generating more stable gradient estimates and mitigating optimisation noise. These enhancements are particularly pertinent in contexts involving high-resolution input images and expansive graph data, where single-device operations often hinder performance.
We evaluate the impact of Distributed Data-Parallel by studying the scalability and convergence of the hybrid model with various compute nodes, focusing on training time, throughput, and model accuracy and loss for single-node and multi-node setups. Empirical evidence suggests that DDP provides a near-linear speed-up with GPU count, significantly reducing training time while ensuring stable convergence. Gradient synchronisation among replicas ensures consistent updates and distributed sampling eliminates data redundancy, resulting in stable generalisation with minimal variance in validation metrics. By supporting larger batch sizes, DDP improves the efficiency of training data, enhances the precision of gradient estimation, and reduces optimisation noise.
4. Limitations
The hybrid GNN-CNN model exhibits strong performance; however, it faces several challenges. The fixed k-nearest-neighbour approach may lead to suboptimal graph representations, especially when keypoint densities vary. Additionally, its current application is limited to static 2D images, reducing its utility in dynamic or 3D scenarios. Improvements can be achieved by refining the graph parameters, altering the neighbour count k, and employing various edge weighting strategies. Enhancing the GNN/CNN framework, fine-tuning hyperparameters, and adjusting the learning rate are expected to improve generalisation.
5. Conclusions
We present PlantGraphNet, a novel graph-based framework for classifying plant species that captures structural and contextual morphological cues in a modular and extensible manner. Our architecture systematically models spatial and morphological relationships using structured graphs, thus capturing topological information that CNNs typically overlook. Empirical evaluations indicate persistent and substantial improvements over standard baselines, highlighting the essential role of relational reasoning in ecologically complex classification tasks. We use distributed data-parallel training to ensure scalability, facilitating efficient optimisation across large datasets without compromising convergence or generalisation. While our evaluation focuses on single-label classification, our framework is adaptable to multilabel contexts, making it suitable for ecological settings involving species co-occurrence and interaction. PlantGraphNet thus provides a robust, scalable, and ecologically informed approach to automated biodiversity evaluation, laying the groundwork for structurally aware deep learning in environmental monitoring.
Funding
Open access funding provided by Aarhus Universitet.
Institutional Review Board Statement
All authors have read, understood, and have complied as applicable with the statement on "Ethical responsibilities of Authors" as found in the Instructions for Authors.
Data Availability Statement
The datasets generated during and/or analysed during the current study are available from the corresponding author on reasonable request.
Conflicts of Interest
The authors declare no competing interests.
References
- Field, C.D.; Evans, C.D.; Dise, N.B.; Hall, J.R.; Caporn, S.J. Long-term nitrogen deposition increases heathland carbon sequestration. Science of the Total Environment 2017, 592, 426–435. [CrossRef]
- Acreman, M.; Holden, J. How wetlands affect floods. Wetlands 2013, 33, 773–786. [CrossRef]
- Stanton, D.; Dyring, M.; Proud, R.; Williams, P. Wildfire Impact on Coastal Groundwater-Dependent Heathland: Structural and Floristic Responses and Management. Austral Ecology 2025, 50, e70044. [CrossRef]
- Damgaard, C. Ecosystem dynamics in wet heathlands: spatial and temporal effects of environmental drivers on the vegetation. Rangeland Ecology & Management 2025, 100, 47–55. [CrossRef]
- Agboola, P.O.; Bekun, F.V.; Agozie, D.Q.; Gyamfi, B.A. Environmental sustainability and ecological balance dilemma: accounting for the role of institutional quality. Environmental Science and Pollution Research 2022, 29, 74554–74568. [CrossRef]
- Aszalós, R.; Thom, D.; Aakala, T.; Angelstam, P.; Brūmelis, G.; Gálhidy, L.; Gratzer, G.; Hlásny, T.; Katzensteiner, K.; Kovács, B.; et al. Natural disturbance regimes as a guide for sustainable forest management in Europe. Ecological Applications 2022, 32, e2596.
- Damgaard, C. Observed vegetation changes in Danish dry heathlands since 2004. Flora 2025, 327, 152728. [CrossRef]
- Rittl, T.F.; Farsund, P.G.; Pommeresche, R.; Sørheim, K.M.; Wibe, A.; Hellekås, J.; Velle, L.G. Traditional Norwegian farming practices drive biodiversity–A case study from coastal heathlands. Agriculture, Ecosystems & Environment 2025, 388, 109662. [CrossRef]
- Damgaard, C.F.; Irvine, K.M. Using the beta distribution to analyse plant cover data. Journal of Ecology 2019, 107, 2747–2759. [CrossRef]
- Kollert, A.; Bremer, M.; Löw, M.; Rutzinger, M. Exploring the potential of land surface phenology and seasonal cloud free composites of one year of Sentinel-2 imagery for tree species mapping in a mountainous region. International Journal of Applied Earth Observation and Geoinformation 2021, 94, 102208. [CrossRef]
- Dyrmann, M.; Karstoft, H.; Midtiby, H.S. Plant species classification using deep convolutional neural network. Biosystems engineering 2016, 151, 72–80. [CrossRef]
- Chen, S.; Tan, X.; Wang, B.; Hu, X. Reverse attention for salient object detection. In Proceedings of the Proceedings of the European conference on computer vision (ECCV), 2018, pp. 234–250.
- Cai, L.; Kreft, H.; Taylor, A.; Denelle, P.; Schrader, J.; Essl, F.; van Kleunen, M.; Pergl, J.; Pyšek, P.; Stein, A.; et al. Global models and predictions of plant diversity based on advanced machine learning techniques. New Phytologist 2023, 237, 1432–1445. [CrossRef]
- He, K.; Zhang, X.; Ren, S.; Sun, J. Deep residual learning for image recognition. In Proceedings of the Proceedings of the IEEE conference on computer vision and pattern recognition, 2016, pp. 770–778.
- Krizhevsky, A.; Sutskever, I.; Hinton, G.E. ImageNet classification with deep convolutional neural networks. Communications of the ACM 2017, 60, 84–90.
- Dong, K.; Zhou, C.; Ruan, Y.; Li, Y. MobileNetV2 model for image classification. In Proceedings of the 2020 2nd International Conference on Information Technology and Computer Application (ITCA). IEEE, 2020, pp. 476–480.
- Szegedy, C.; Liu, W.; Jia, Y.; Sermanet, P.; Reed, S.; Anguelov, D.; Erhan, D.; Vanhoucke, V.; Rabinovich, A. Going deeper with convolutions. In Proceedings of the Proceedings of the IEEE conference on computer vision and pattern recognition, 2015, pp. 1–9. [CrossRef]
- Barbedo, J.G.A. Plant disease identification from individual lesions and spots using deep learning. Biosystems engineering 2019, 180, 96–107. [CrossRef]
- Ge, X.; Wu, S.; Wen, W.; Shen, F.; Xiao, P.; Lu, X.; Liu, H.; Zhang, M.; Guo, X. LettuceP3D: A tool for analysing 3D phenotypes of individual lettuce plants. Biosystems Engineering 2025, 251, 73–88. [CrossRef]
- Espitalier, V.; Lombardo, J.C.; Goëau, H.; Botella, C.; Høye, T.T.; Dyrmann, M.; Bonnet, P.; Joly, A. Adapting a global plant identification model to detect invasive alien plant species in high-resolution road side images. Ecological Informatics 2025, p. 103129. [CrossRef]
- Wagner, F.H.; Sanchez, A.; Tarabalka, Y.; Lotte, R.G.; Ferreira, M.P.; Aidar, M.P.; Gloor, E.; Phillips, O.L.; Aragao, L.E. Using the U-net convolutional network to map forest types and disturbance in the Atlantic rainforest with very high resolution images. Remote Sensing in Ecology and Conservation 2019, 5, 360–375. [CrossRef]
- Wagner, F.H.; Sanchez, A.; Aidar, M.P.; Rochelle, A.L.; Tarabalka, Y.; Fonseca, M.G.; Phillips, O.L.; Gloor, E.; Aragao, L.E. Mapping Atlantic rainforest degradation and regeneration history with indicator species using convolutional network. PLoS One 2020, 15, e0229448. [CrossRef]
- Ronneberger, O.; Fischer, P.; Brox, T. U-net: Convolutional networks for biomedical image segmentation. In Proceedings of the Medical image computing and computer-assisted intervention–MICCAI 2015: 18th international conference, Munich, Germany, October 5-9, 2015, proceedings, part III 18. Springer, 2015, pp. 234–241.
- Guo, Y.; Li, Z.; Chen, E.; Zhang, X.; Zhao, L.; Xu, E.; Hou, Y.; Sun, R. An end-to-end deep fusion model for mapping forests at tree species levels with high spatial resolution satellite imagery. Remote Sensing 2020, 12, 3324. [CrossRef]
- Guo, Y.; Li, Z.; Chen, E.; Zhang, X.; Zhao, L.; Xu, E.; Hou, Y.; Liu, L. A deep fusion unet for mapping forests at tree species levels with multi-temporal high spatial resolution satellite imagery. Remote Sensing 2021, 13, 3613. [CrossRef]
- Cho, M.A.; Malahlela, O.; Ramoelo, A. Assessing the utility WorldView-2 imagery for tree species mapping in South African subtropical humid forest and the conservation implications: Dukuduku forest patch as case study. International Journal of Applied Earth Observation and Geoinformation 2015, 38, 349–357. [CrossRef]
- Hościło, A.; Lewandowska, A. Mapping forest type and tree species on a regional scale using multi-temporal Sentinel-2 data. Remote Sensing 2019, 11, 929.
- Vermeer, M.; Völgyes, D.; Sørensen, T.K.; Miller, H.; Fantin, D. Semi-and weak-supervised learning for Norwegian tree species detection. In Proceedings of the Proceedings of the Northern Lights Deep Learning Workshop, 2023, Vol. 4, pp. 1–7. [CrossRef]
- Bueso-Bello, J.L.; Dal Molin, R.; Carcereri, D.; Posovszky, P.; González, C.; Martone, M.; Rizzoli, P. Monitoring Forest Degradation in the Amazon Basin with Tandem-X High-Resolution Images and Deep Learning Techniques. In Proceedings of the IGARSS 2023-2023 IEEE International Geoscience and Remote Sensing Symposium. IEEE, 2023, pp. 1473–1476.
- Zhang, S.; Zhao, W.; Guan, Z.; Peng, X.; Peng, J. Keypoint-graph-driven learning framework for object pose estimation. In Proceedings of the Proceedings of the IEEE/CVF conference on computer vision and pattern recognition, 2021, pp. 1065–1073.
- Han, K.; Wang, Y.; Guo, J.; Tang, Y.; Wu, E. Vision gnn: An image is worth graph of nodes. Advances in neural information processing systems 2022, 35, 8291–8303.
- Diao, Q.; Dai, Y.; Wang, J.; Feng, X.; Pan, F.; Zhang, C. Spatial-pooling-based graph attention U-Net for hyperspectral image classification. Remote Sensing 2024, 16, 937. [CrossRef]
- Reddy, K.D.; Ashwini, P.; Raju, S.S.H.; Sonia, M.; Ghimiray, D. Enhancing Early Plant Disease Detection with the Advanced GNN-based Model Leveraging Hyperspectral Imaging. In Proceedings of the 2025 IEEE International Conference on Computer, Electronics, Electrical Engineering & their Applications (IC2E3). IEEE, 2025, pp. 1–6.
- Maruthai, S.; Selvanarayanan, R.; Thanarajan, T.; Rajendran, S. Hybrid vision GNNs based early detection and protection against pest diseases in coffee plants. Scientific reports 2025, 15, 11778. [CrossRef]
- Verma, A.; Ranga, V.; Vishwakarma, D.K. A novel approach for forecasting PM2. 5 pollution in Delhi using CATALYST. Environmental Monitoring and Assessment 2023, 195, 1457. [CrossRef]
- Baskar, G.; Parameswaran, A.; Sathyanathan, R. Optimizing papermaking wastewater treatment by predicting effluent quality with node-level capsule graph neural networks. Environmental Monitoring and Assessment 2025, 197, 176. [CrossRef]
- Zheng, Y.; Lin, Y.; Zhao, L.; Wu, T.; Jin, D.; Li, Y. Spatial planning of urban communities via deep reinforcement learning. Nature Computational Science 2023, 3, 748–762. [CrossRef]
- Mostafazadeh, R.; Alaei, N.; Mirchooli, F.; Hussain, S. Changes in urban green space configuration and connectivity using spatial graph-based metrics in Ardabil developing city, Iran. Environmental Monitoring and Assessment 2024, 196, 778. [CrossRef]
- Scarselli, F.; Gori, M.; Tsoi, A.C.; Hagenbuchner, M.; Monfardini, G. The graph neural network model. IEEE transactions on neural networks 2008, 20, 61–80.
- Oloulade, B.M.; Gao, J.; Chen, J.; Lyu, T.; Al-Sabri, R. Graph neural architecture search: A survey. Tsinghua Science and Technology 2021, 27, 692–708. [CrossRef]
- Mulugeta, A.K.; Sharma, D.P.; Mesfin, A.H. Deep learning for medicinal plant species classification and recognition: a systematic review. Frontiers in Plant Science 2024, 14, 1286088. [CrossRef]
- Zhong, L.; Dai, Z.; Fang, P.; Cao, Y.; Wang, L. A review: Tree species classification based on remote sensing data and classic deep learning-based methods. Forests 2024, 15, 852. [CrossRef]
- Liu, S.; Deng, W. Very deep convolutional neural network based image classification using small training sample size. In Proceedings of the 2015 3rd IAPR Asian conference on pattern recognition (ACPR). IEEE, 2015, pp. 730–734. [CrossRef]
- Simonyan, K.; Zisserman, A. Very deep convolutional networks for large-scale image recognition. arXiv preprint arXiv:1409.1556 2019, 1556.
- He, K.; Zhang, X.; Ren, S.; Sun, J. Deep Residual Learning for Image Recognition, 2015, [arXiv:cs.CV/1512.03385].
- Vaghela, R.; Vaishnani, D.; Srinivasu, P.N.; Popat, Y.; Sarda, J.; Woźniak, M.; Ijaz, M.F. Land cover classification for identifying the agriculture fields using versions of yolo v8. IEEE Journal of Selected Topics in Applied Earth Observations and Remote Sensing 2025.
- Low, D.G. Distinctive image features from scale-invariant keypoints. Journal of Computer Vision 2004, 60, 91–110.
- Qadir, I.; Iqbal, M.A.; Ashraf, S.; Akram, S. A fusion of CNN And SIFT For multicultural facial expression recognition. Multimedia Tools and Applications 2025, pp. 1–19. [CrossRef]
- Jihad, S.M.; Alsaud, A.A.; Almukhtar, F.H.; Kareem, S.; Yousif, R.Z. Investigating feature extraction by SIFT methods for prostate cancer early detection. Egyptian Informatics Journal 2025, 29, 100607. [CrossRef]
- Cai, T.; Luo, S.; Xu, K.; He, D.; Liu, T.; Wang, L. GraphNorm: A Principled Approach to Accelerating Graph Neural Network Training. In Proceedings of the Proceedings of the 38th International Conference on Machine Learning, ICML 2021, 18-24 July 2021, Virtual Event; Meila, M.; Zhang, T., Eds. PMLR, 2021, Vol. 139, Proceedings of Machine Learning Research, pp. 1204–1215.
- Li, S.; Zhao, Y.; Varma, R.; Salpekar, O.; Noordhuis, P.; Li, T.; Paszke, A.; Smith, J.; Vaughan, B.; Damania, P.; et al. Pytorch distributed: Experiences on accelerating data parallel training. arXiv preprint arXiv:2006.15704 2020.
| 1 |
Figure 3.
Representative image samples for each class in the dataset, including various vegetation types and non-vegetated areas. These samples illustrate the diversity and complexity of the categories used for model training and evaluation.
Figure 3.
Representative image samples for each class in the dataset, including various vegetation types and non-vegetated areas. These samples illustrate the diversity and complexity of the categories used for model training and evaluation.
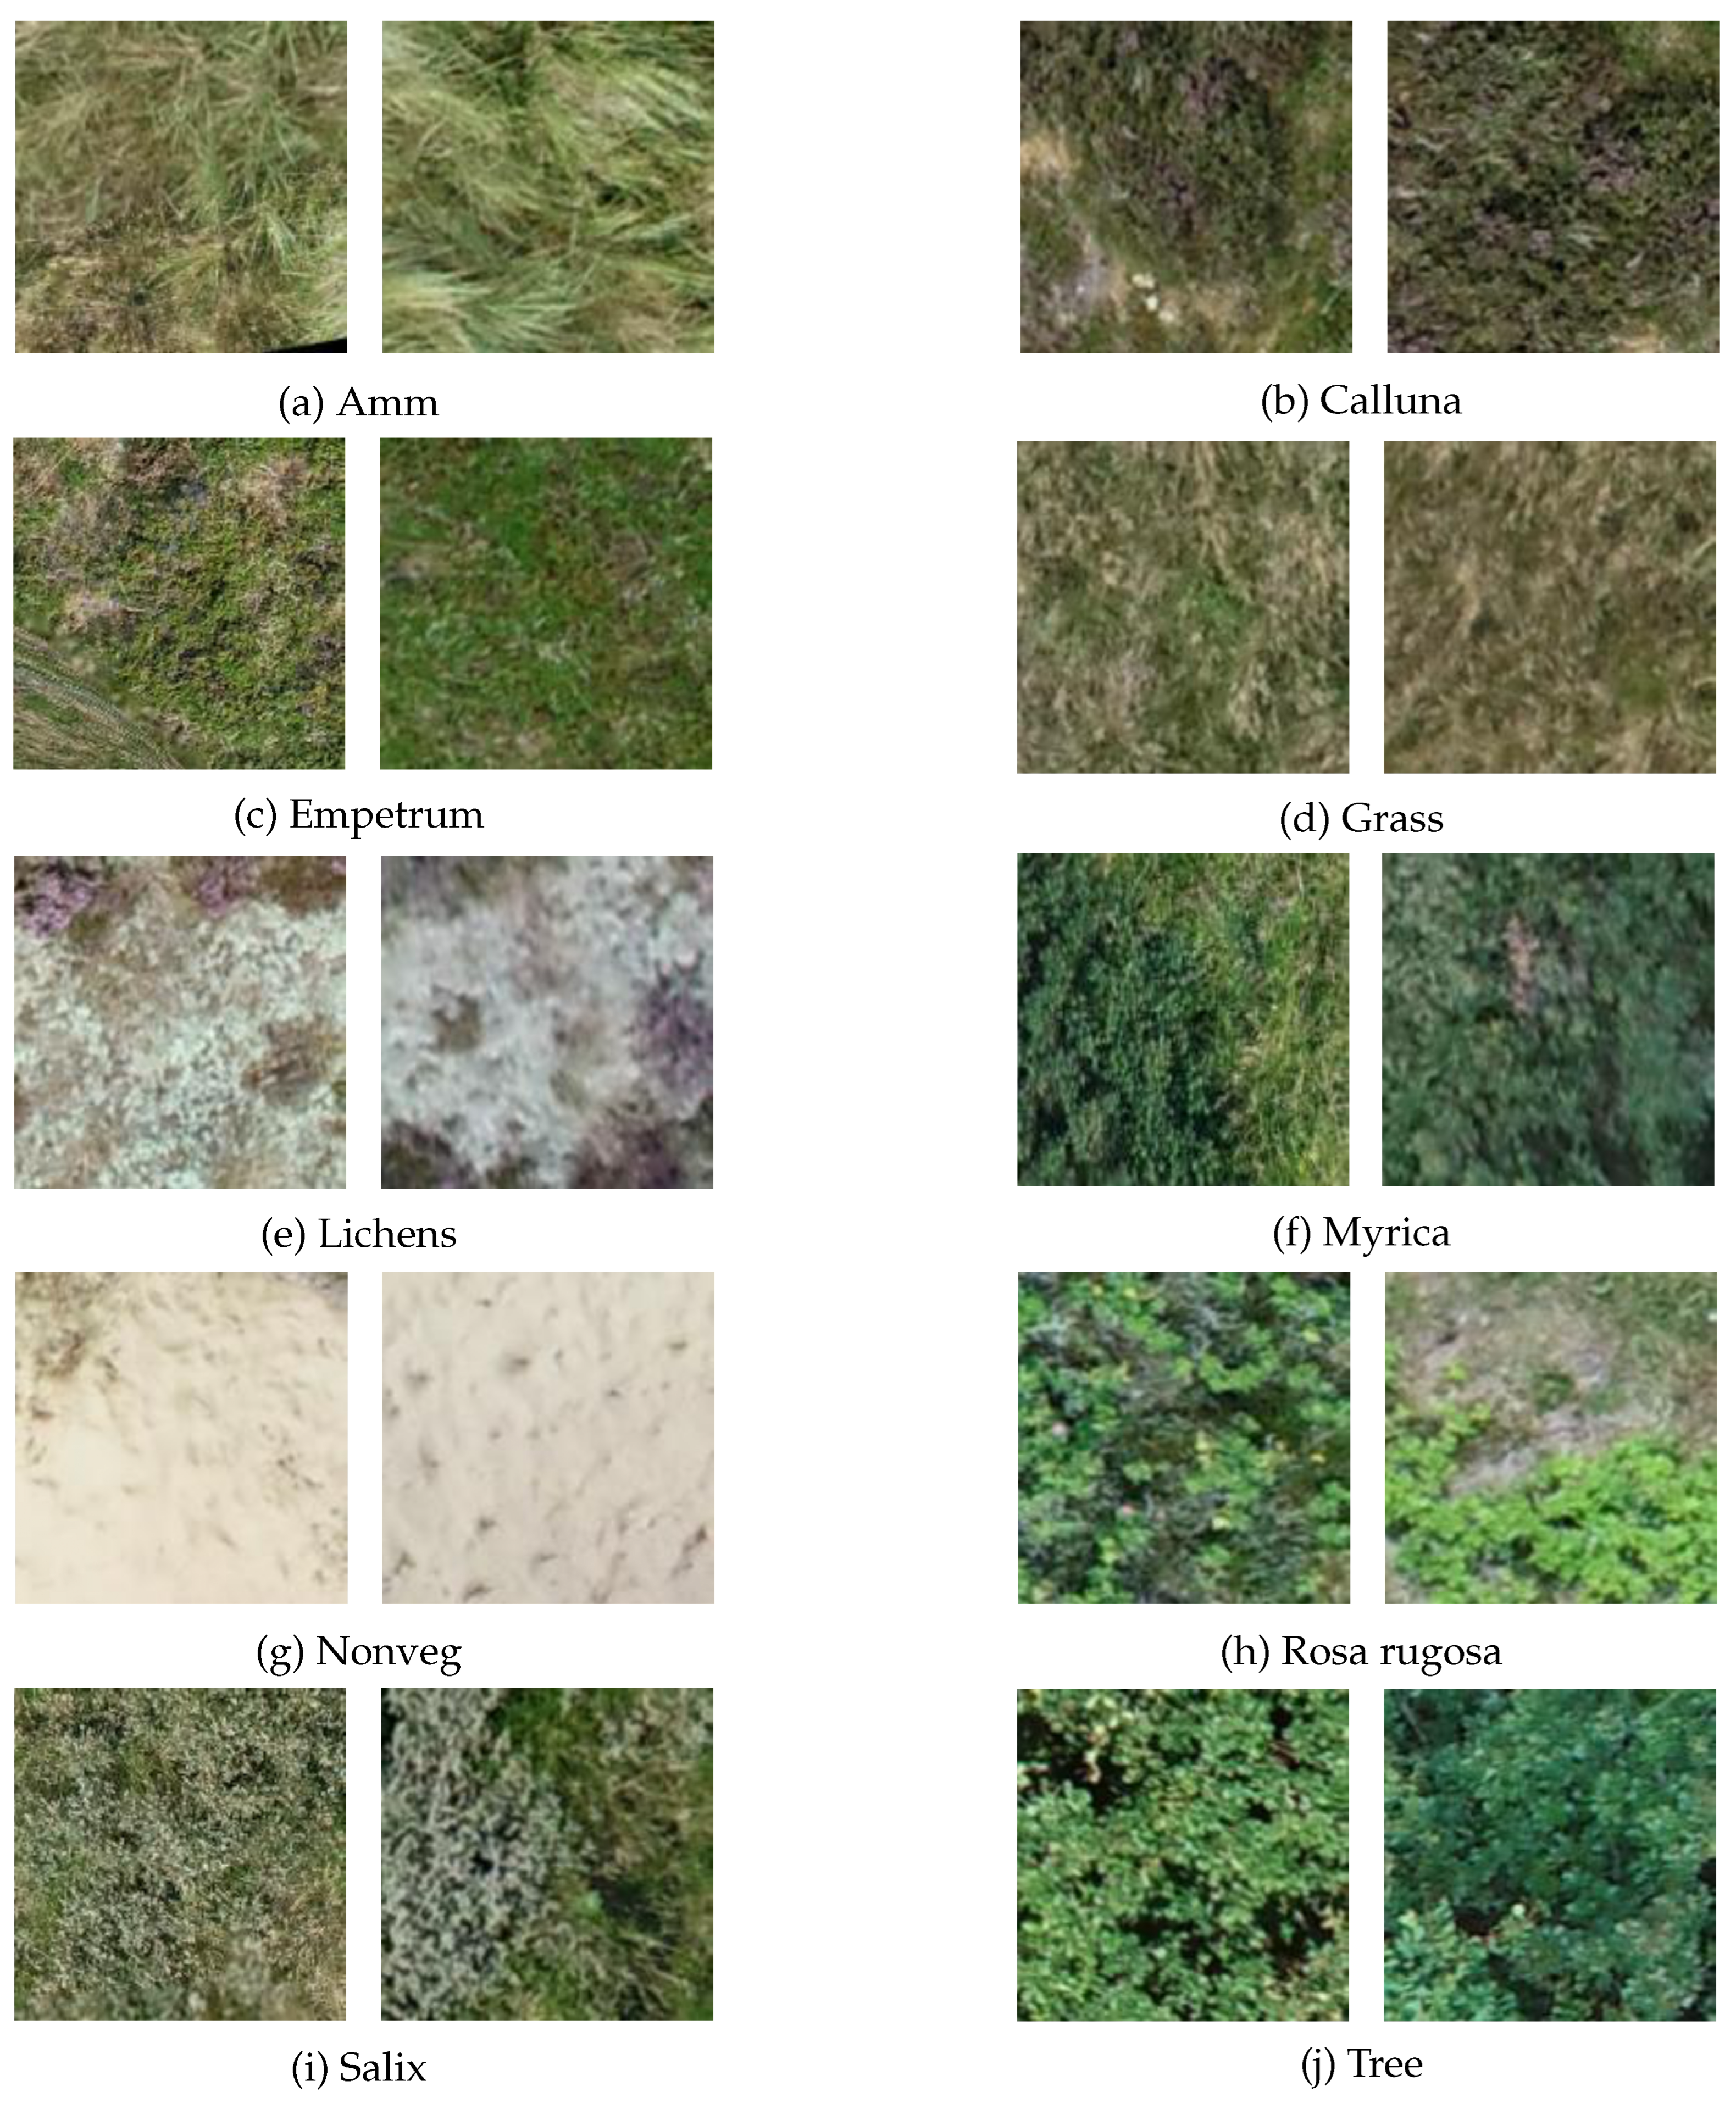
Figure 4.
Overview of the proposed framework.GraphPlantNet processes plant images by converting them into graph data via key points and features. A Graph Neural Network encodes these graphs, and features are fused with image-based features and then refined through neural layers to produce predictions. Training is efficiently distributed across multiple GPUs using a data-centric strategy and all-reduce for gradient updates.
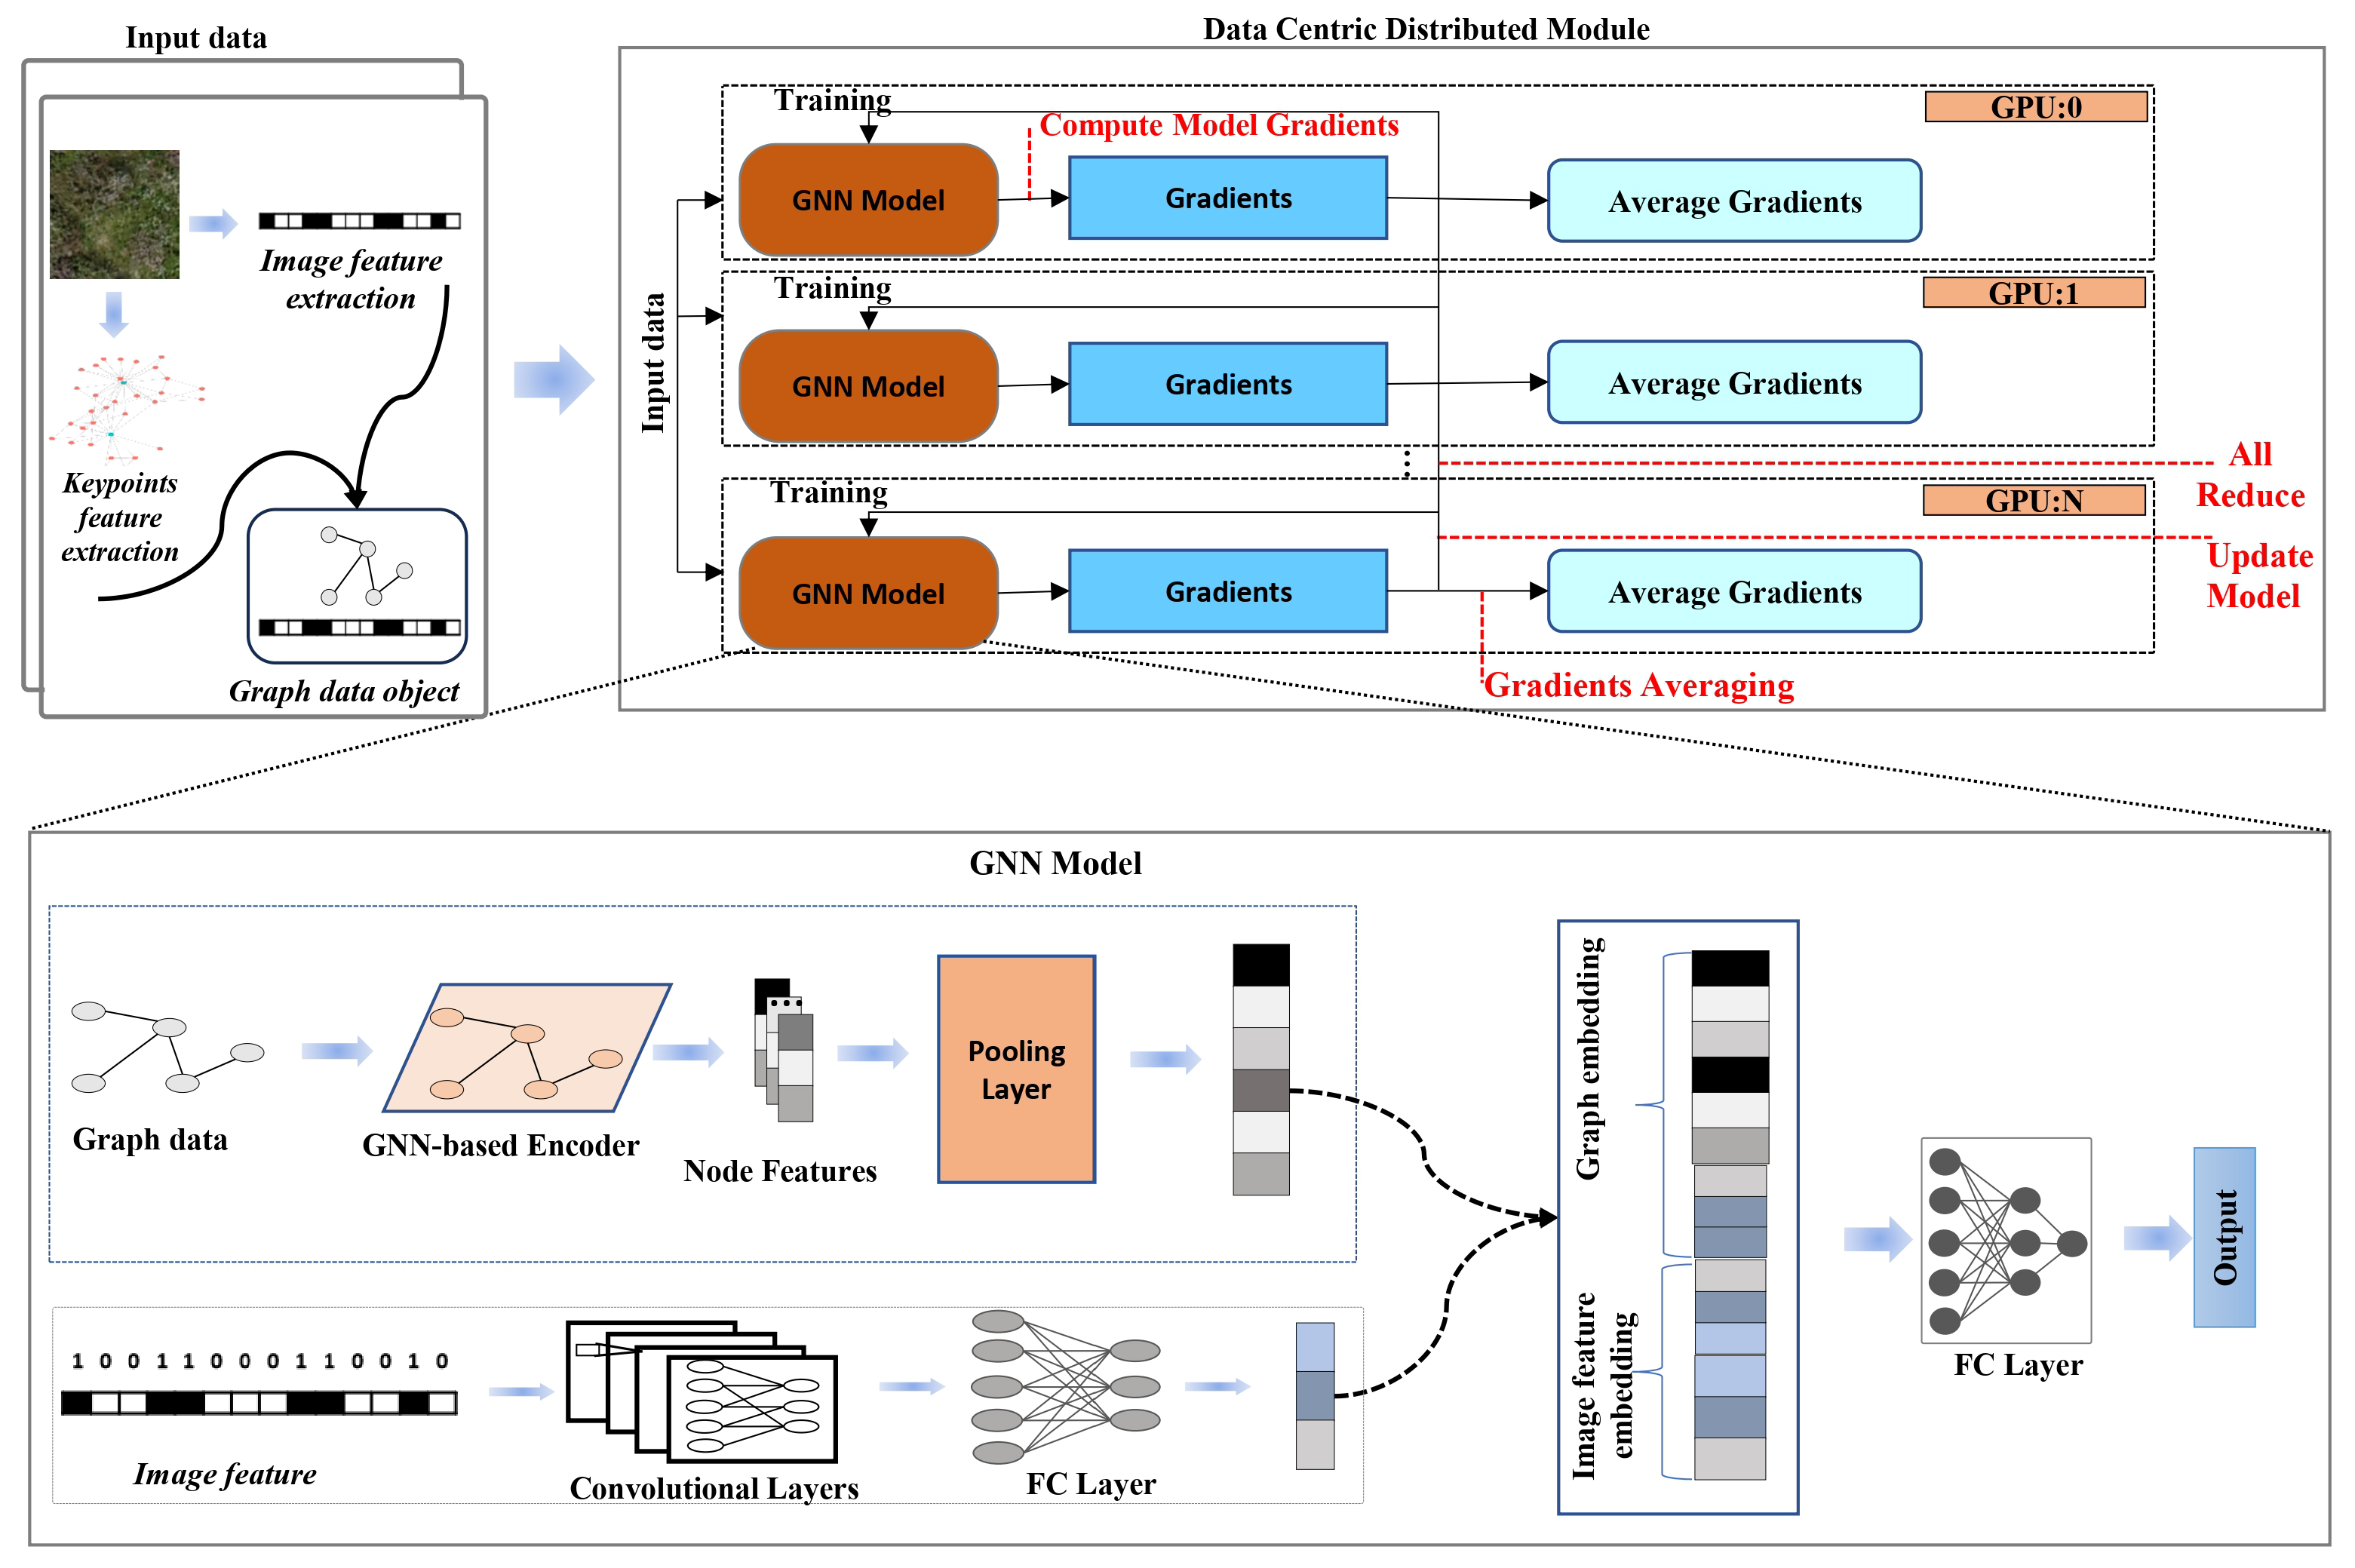
Figure 5.
Sample images of constructed graphs.
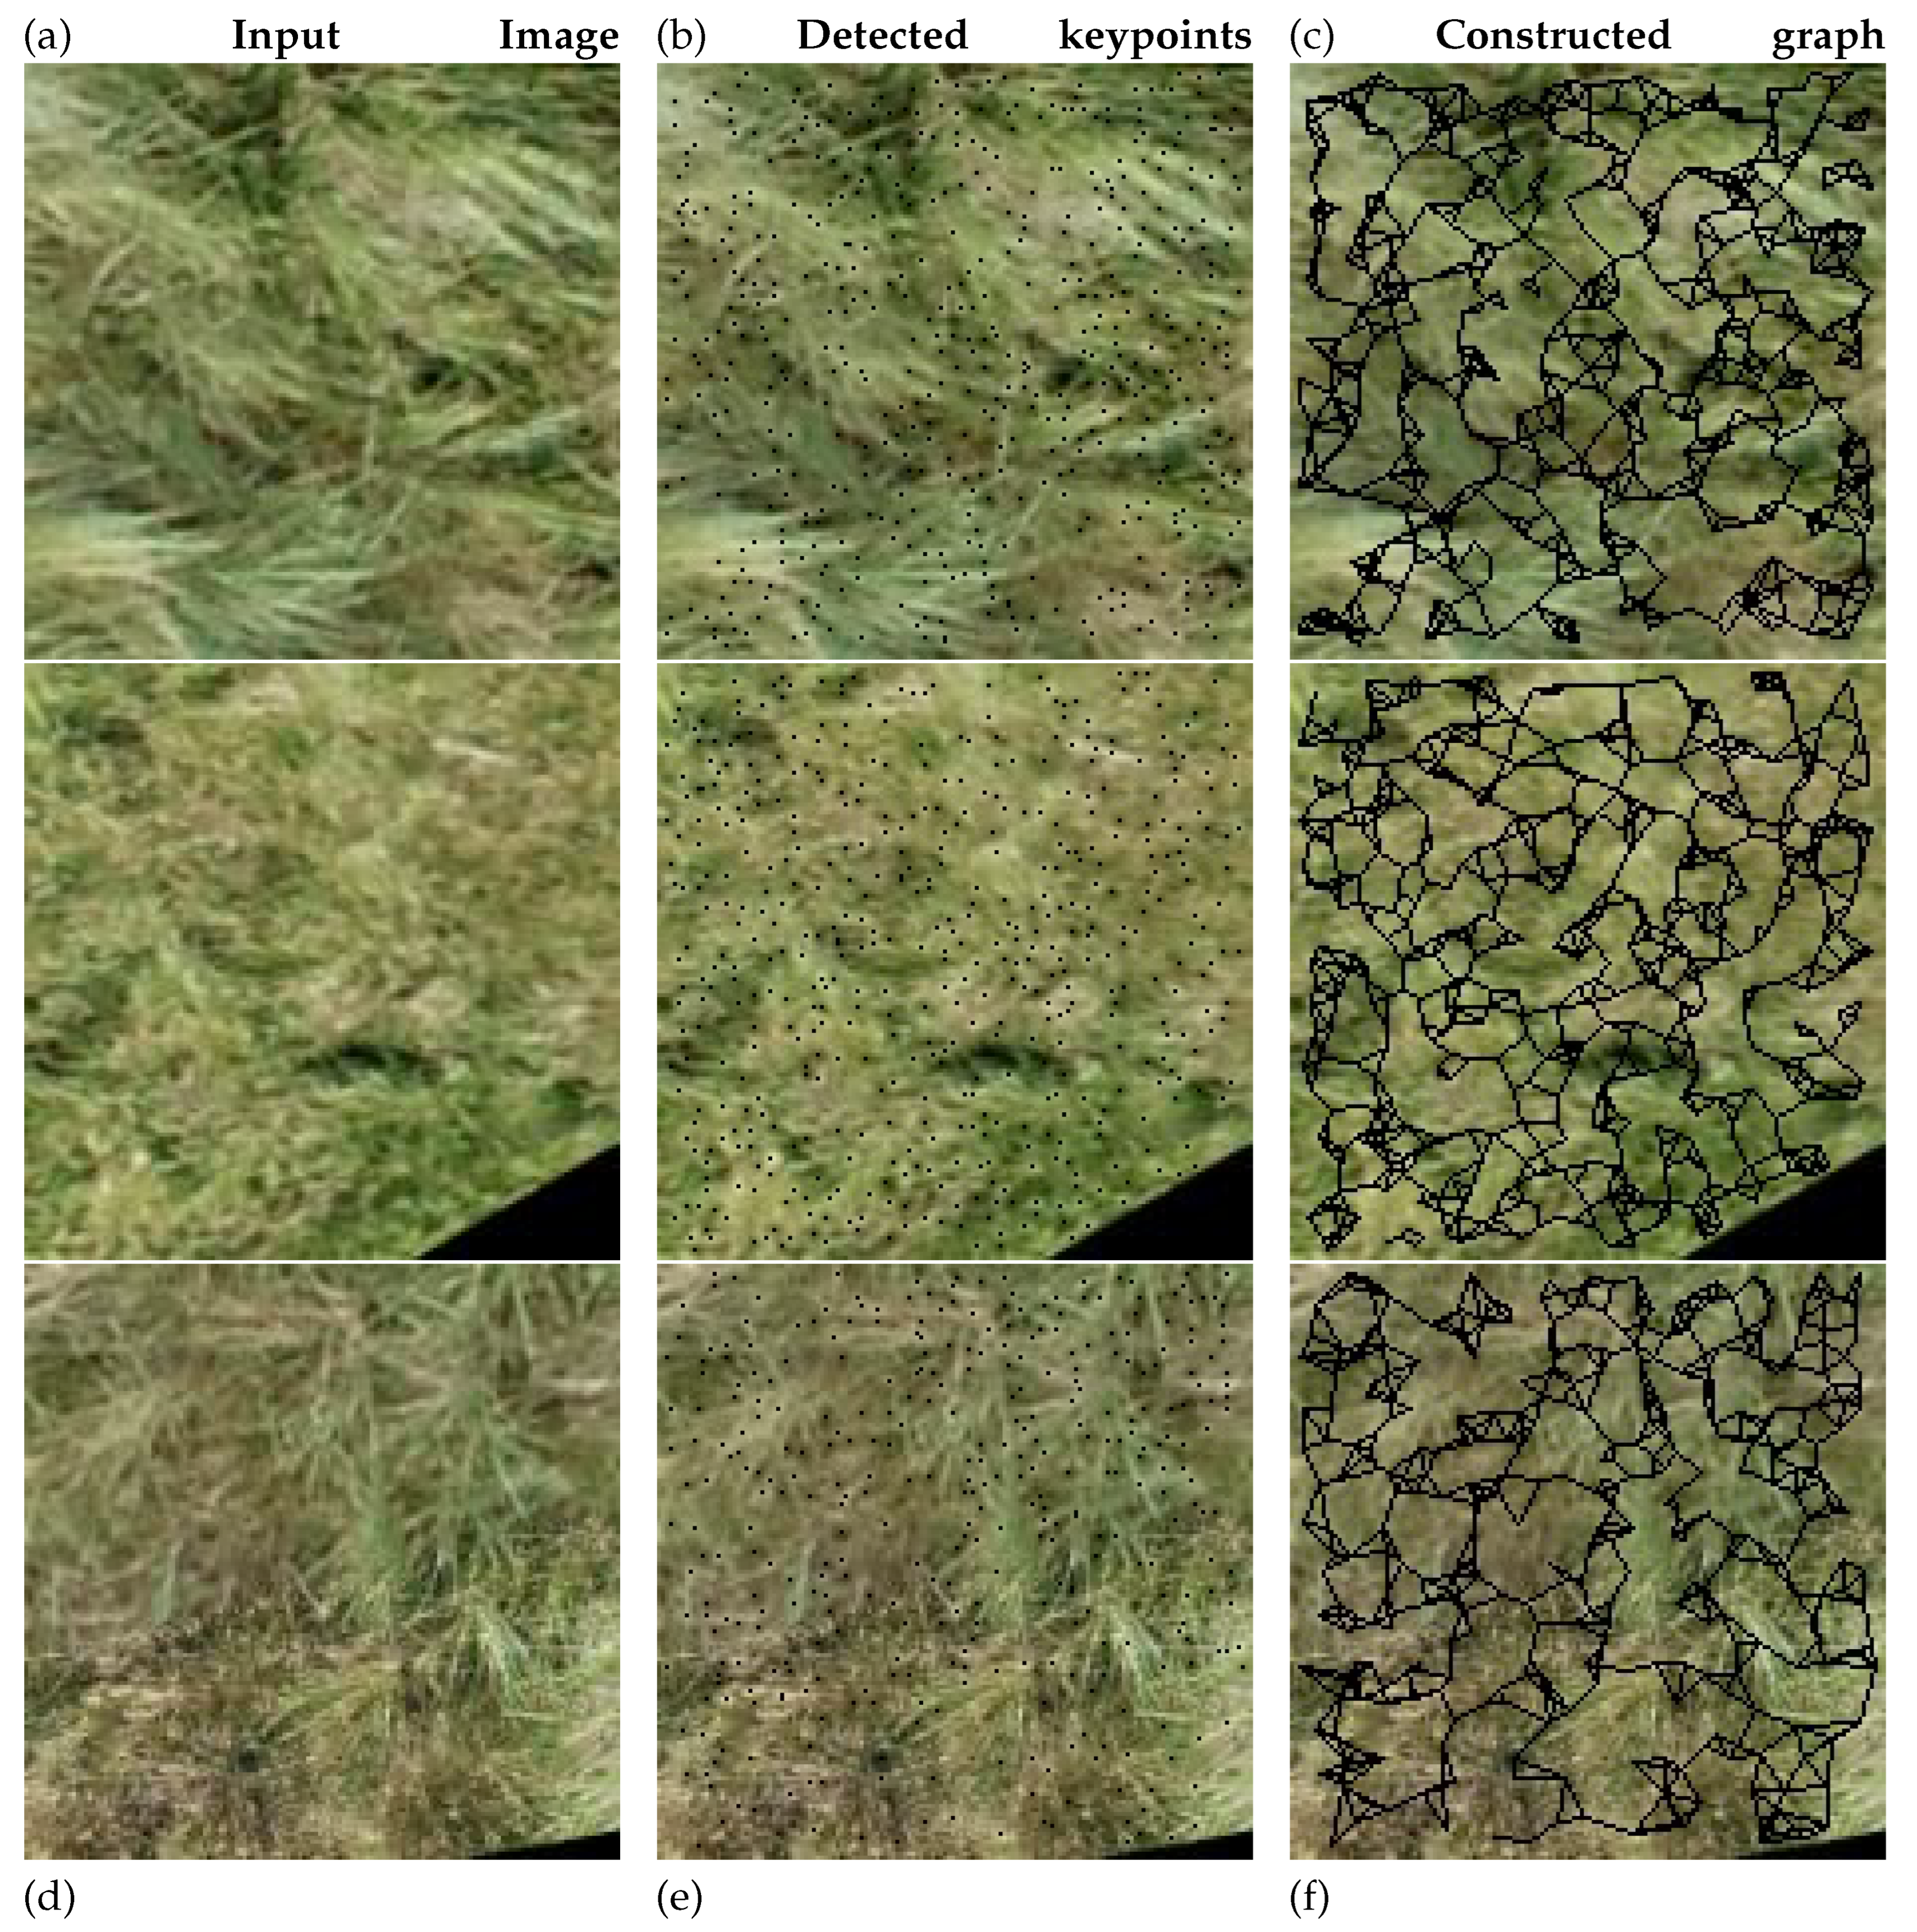
Figure 8.
Confusion Matrix of GNN-based Methods using different graph construction methods.
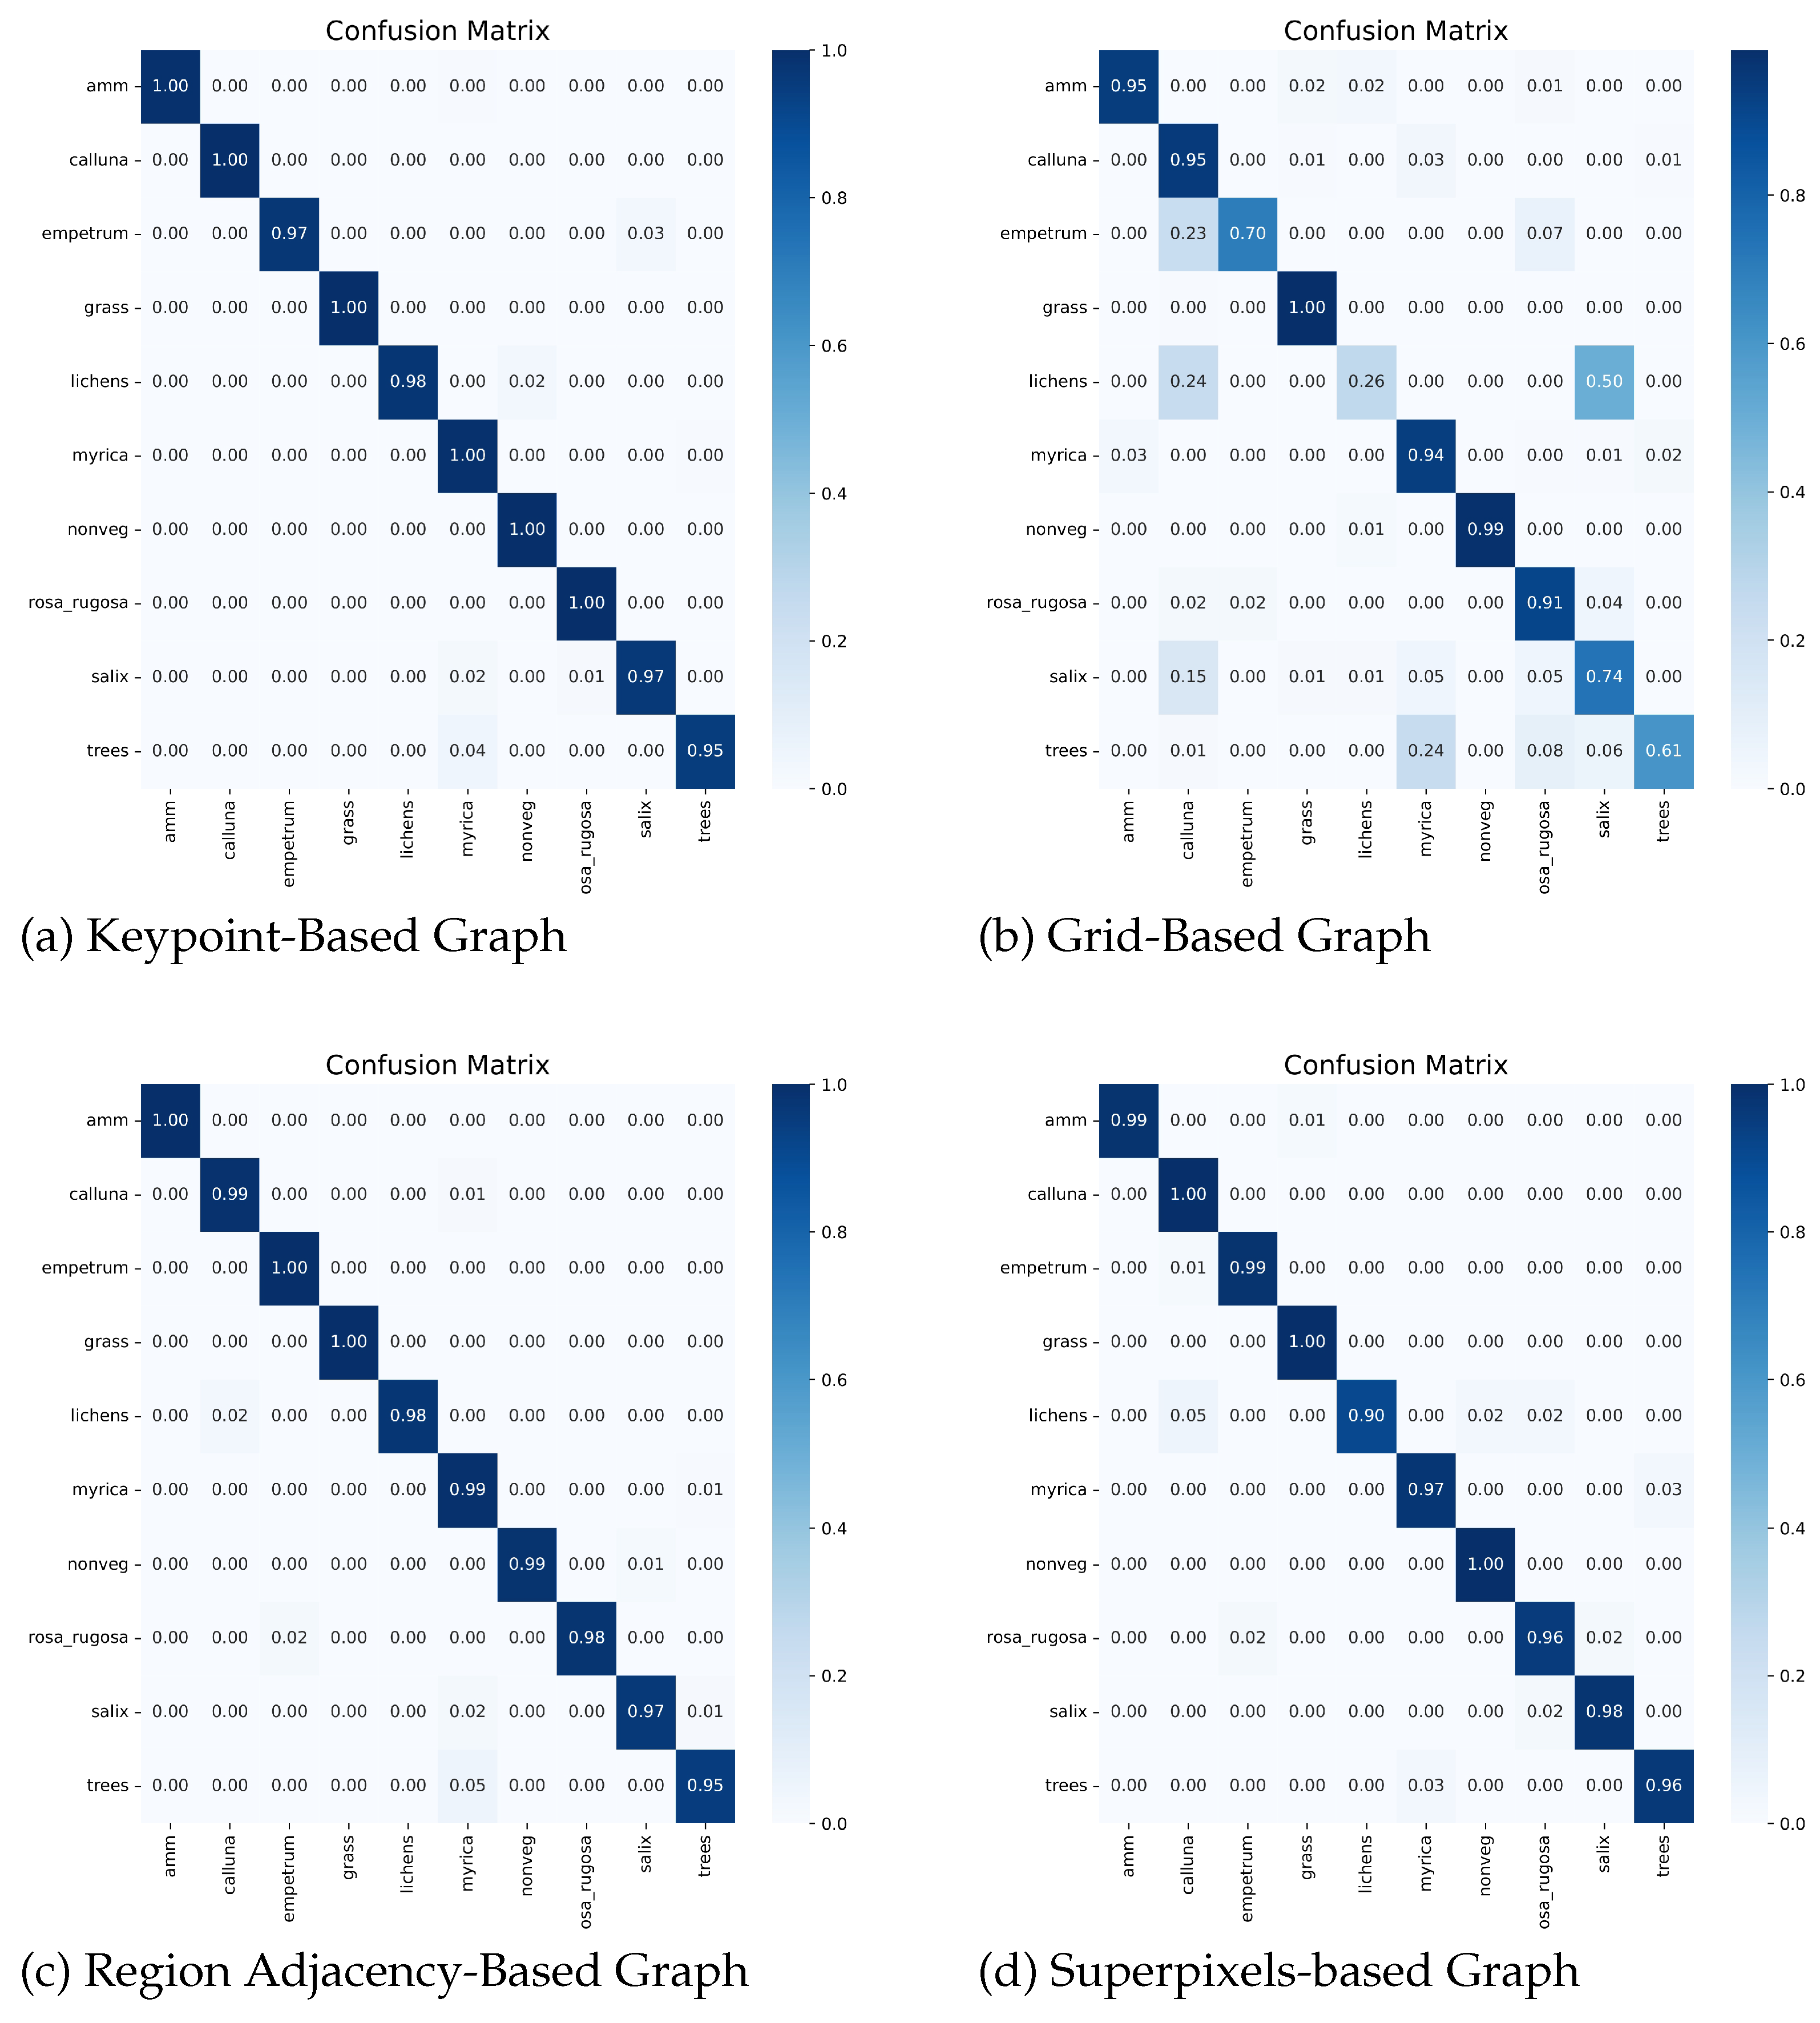
Figure 9.
Influence of the Hybrid model.
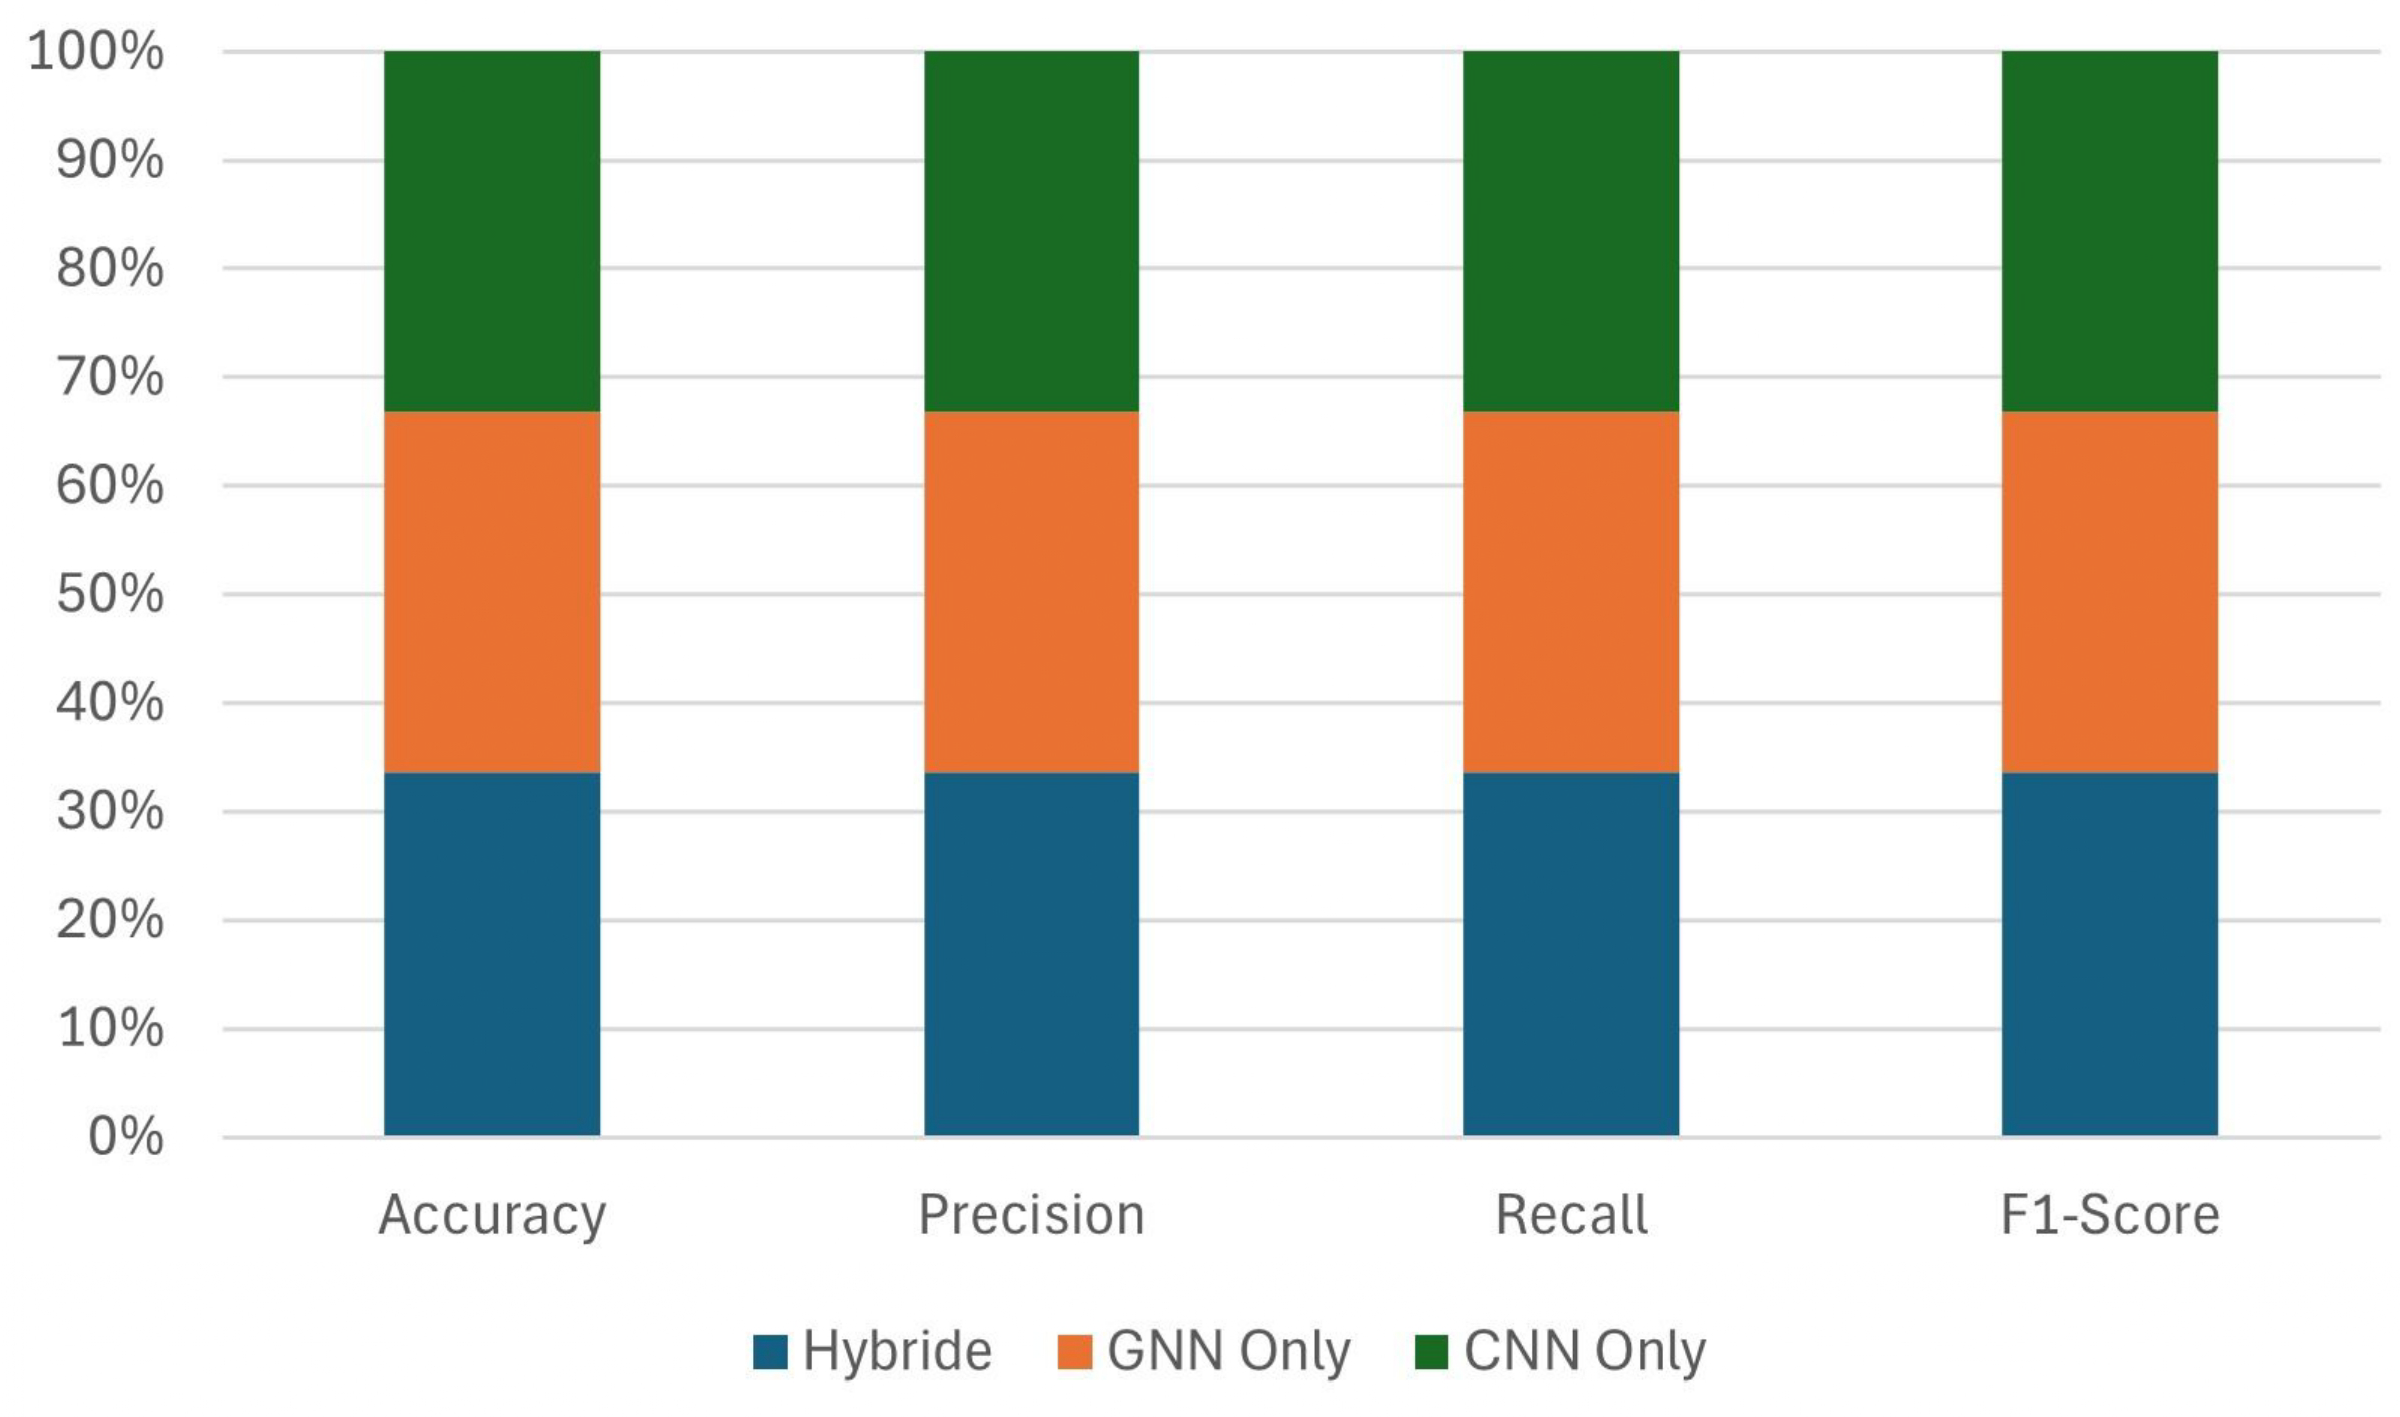
Figure 10.
Impact of Distributed Data-Parallel Training on Accuracy, Recall, Precision, F1-Score, and Training Time for 1–4 GPU Configurations.
Figure 10.
Impact of Distributed Data-Parallel Training on Accuracy, Recall, Precision, F1-Score, and Training Time for 1–4 GPU Configurations.
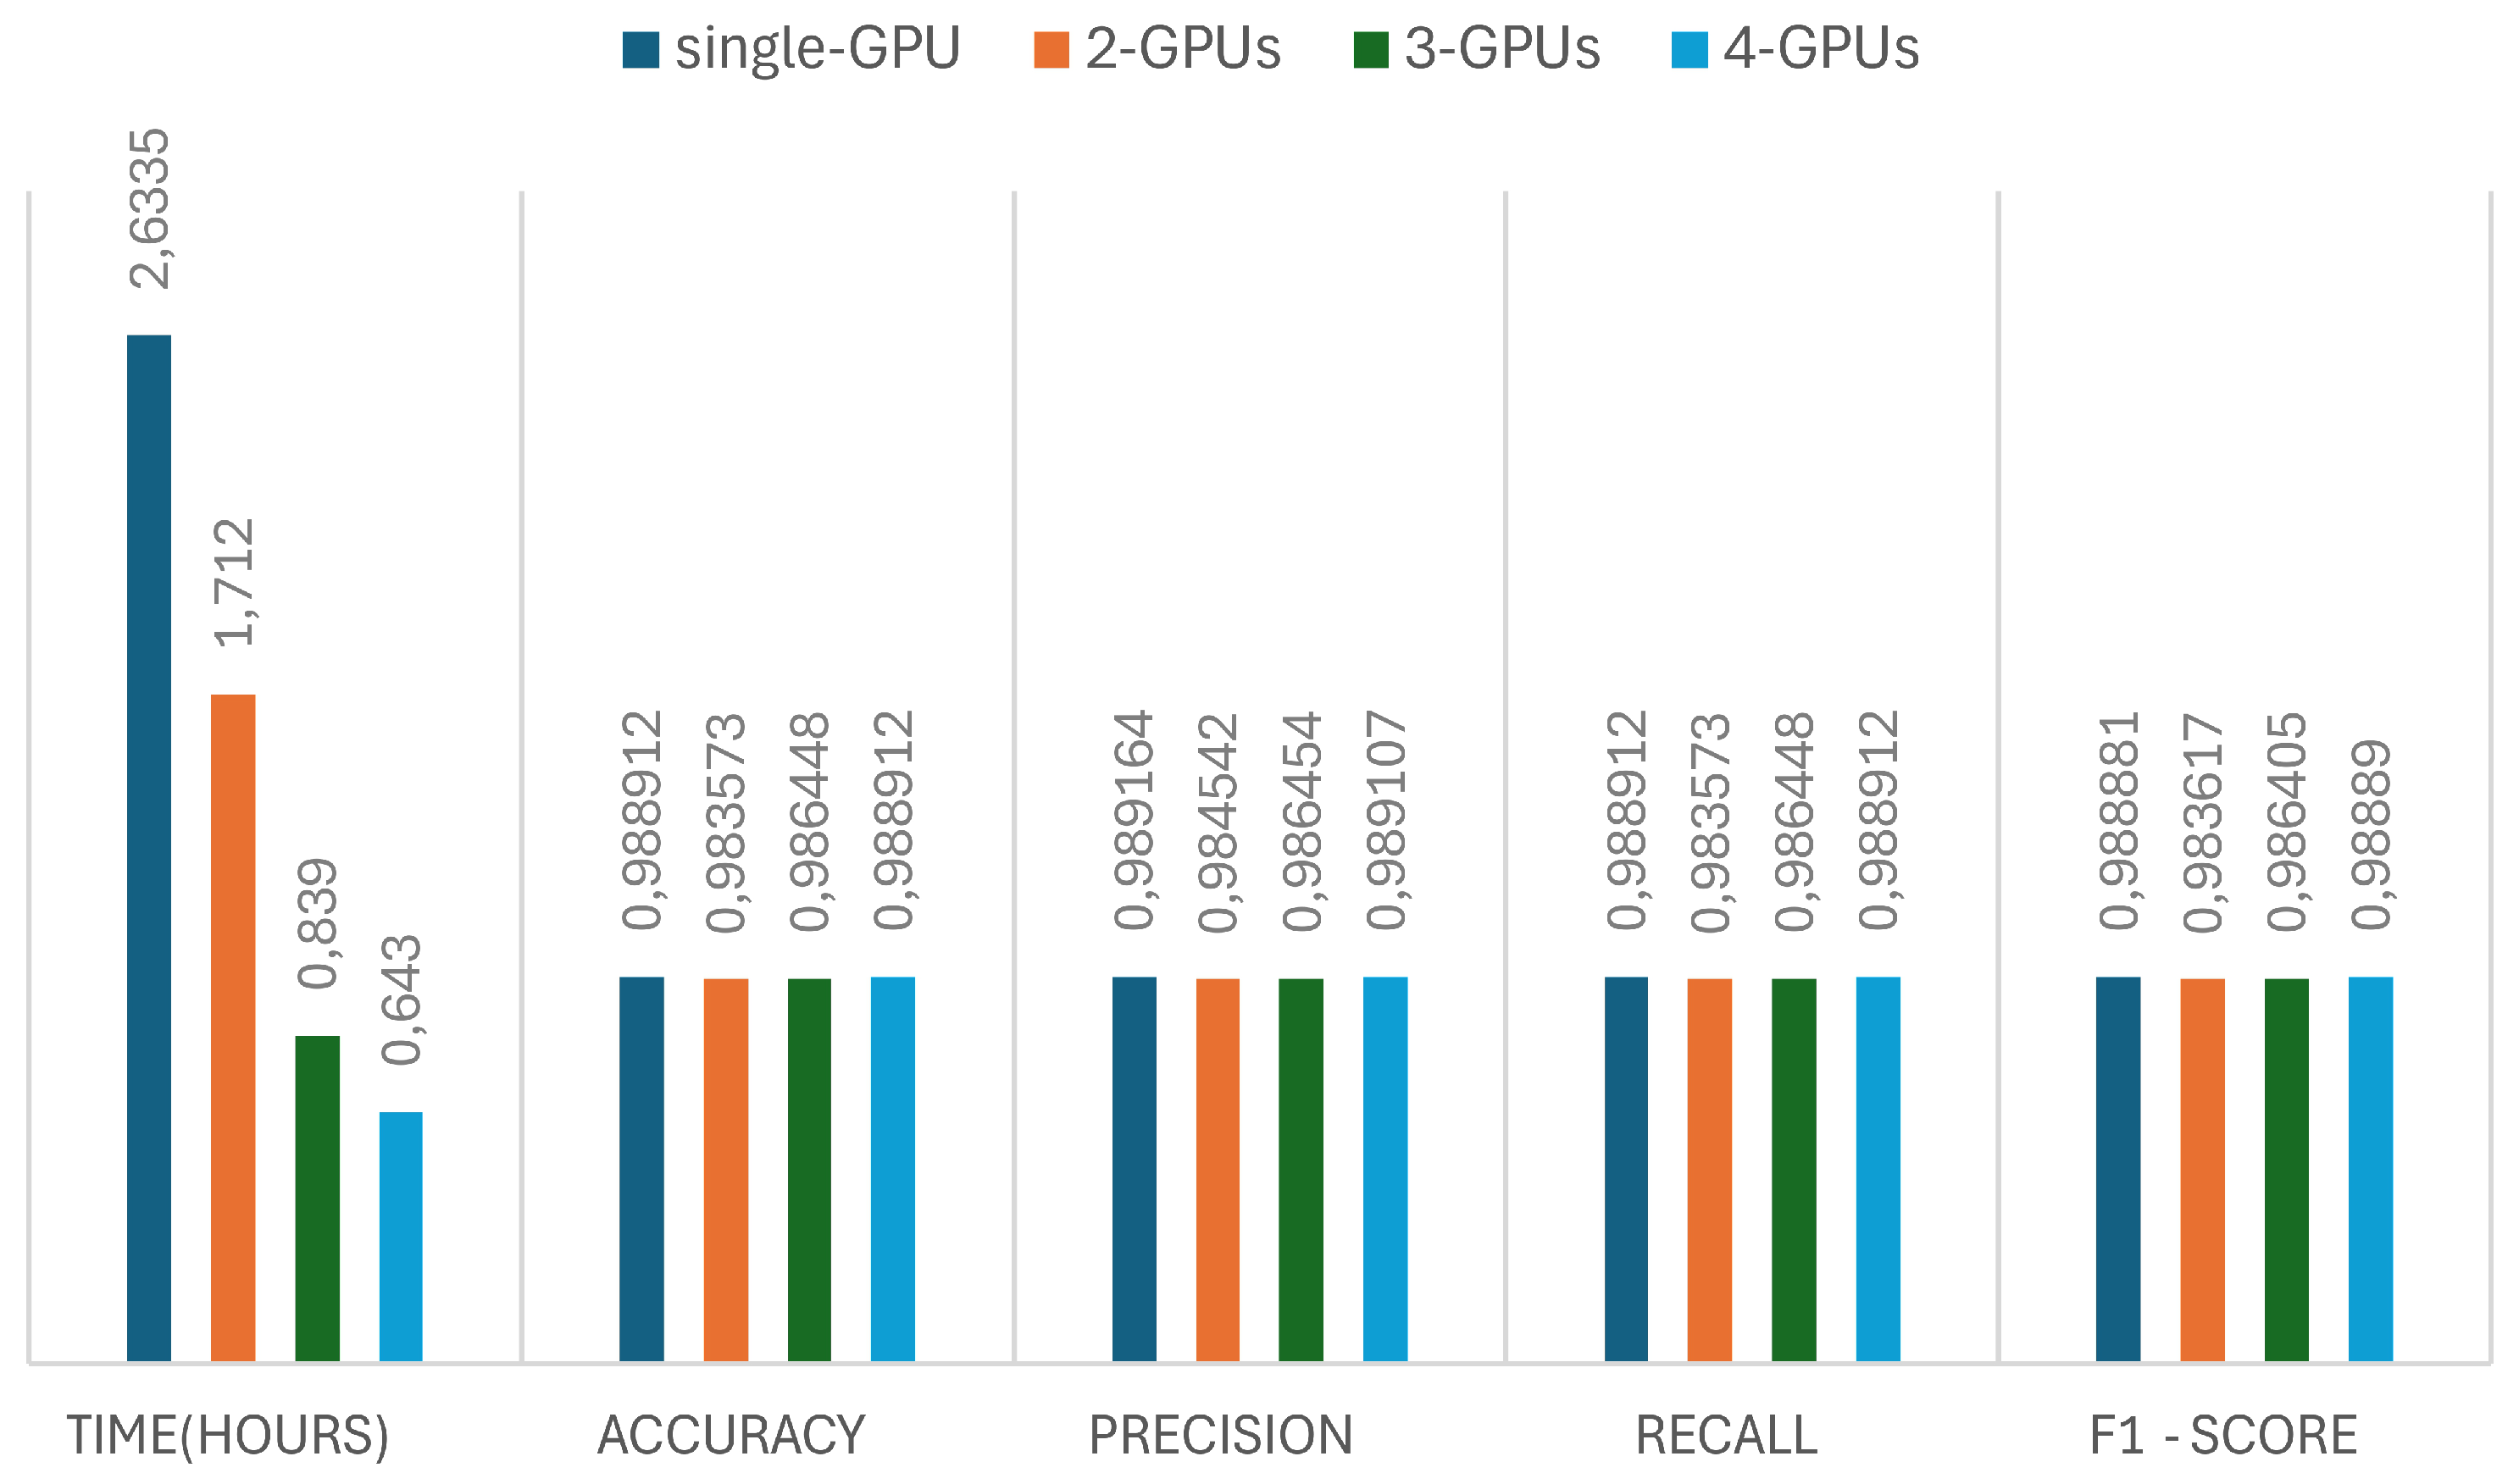

Table 1.
Overall Result Comparisons.
| Model | Accuracy | Precision | Recall | F1-Score |
|---|---|---|---|---|
| VGG16 | 0.9560 | 0.9583 | 0.9560 | 0.9533 |
| VGG19 | 0.9388 | 0.9419 | 0.9388 | 0.9344 |
| ResNet50 | 0.9786 | 0.9788 | 0.9786 | 0.9785 |
| ResNet101 | 0.9609 | 0.9631 | 0.9609 | 0.9570 |
| MobileNetV2 | 0.9589 | 0.9608 | 0.9589 | 0.9576 |
| GoogleNet | 0.9556 | 0.9556 | 0.9556 | 0.9553 |
| AlexNet | 0.9498 | 0.9608 | 0.9576 | 0.9576 |
| YOLOv8n | 0.9895 | 0.9896 | 0.9895 | 0.9894 |
| PlantGraphNet | 0.9897 | 0.9898 | 0.9897 | 0.9897 |
Table 2.
Classification Report of PlantGraphNet.
| Class Name | Precision | Recall | F1-Score |
|---|---|---|---|
| amm | 0.9960 | 1 | 0.9980 |
| calluna | 0.9886 | 0.9914 | 0.9900 |
| empetrum | 1 | 0.9863 | 0.9930 |
| grass | 1 | 0.9985 | 0.9992 |
| lichens | 1 | 0.9285 | 0.9629 |
| myrica | 0.9728 | 0.9748 | 0.9738 |
| nonveg | 1 | 1 | 1 |
| rosa rugosa | 0.9583 | 1 | 0.9787 |
| salix | 0.9838 | 0.9777 | 0.9808 |
| trees | 0.9556 | 0.9584 | 0.9570 |
| Weighted Avg | 0.9898 | 0.9897 | 0.9897 |
Disclaimer/Publisher’s Note: The statements, opinions and data contained in all publications are solely those of the individual author(s) and contributor(s) and not of MDPI and/or the editor(s). MDPI and/or the editor(s) disclaim responsibility for any injury to people or property resulting from any ideas, methods, instructions or products referred to in the content. |
© 2025 by the authors. Licensee MDPI, Basel, Switzerland. This article is an open access article distributed under the terms and conditions of the Creative Commons Attribution (CC BY) license (http://creativecommons.org/licenses/by/4.0/).
Copyright: This open access article is published under a Creative Commons CC BY 4.0 license, which permit the free download, distribution, and reuse, provided that the author and preprint are cited in any reuse.


