Preprint
Article

This version is not peer-reviewed.

Trends in Tuberculosis Incidence and Mortality in South Africa and Bulgaria (2000–2023): The Impact of Income, Poverty, Unemployment, and Universal Health Coverage

Submitted:

12 December 2025

Posted:

16 December 2025

You are already at the latest version

Abstract

Background: Tuberculosis (TB) remains a major global health threat, with burdens distributed unevenly across regions. South Africa continues to record some of the world’s highest TB incidence and mortality rates, while Bulgaria—although a low-burden country has shown stagnant or rising mortality among vulnerable groups. Comparing these contrasting settings offers insight into how epidemiological, socio-economic, and health system factors shape TB outcomes. Objective: This study compares TB incidence and mortality trends in South Africa and Bulgaria from 2000 to 2023 and examines how HIV prevalence, migration, poverty, ageing, incarceration, health system performance, and underreporting influence TB dynamics. Methods: A narrative comparative analysis drawing on WHO Global TB Reports, peer-reviewed literature, and demographic and system indicators was conducted across four policy-aligned periods (2000–2009, 2010–2015, 2016–2020, 2021–2023). Results: South Africa experienced a sharp rise in TB incidence in the early 2000s, largely driven by the HIV epidemic and system bottlenecks. Incidence fell substantially after 2010 following ART expansion, GeneXpert implementation, and increased programmatic investment. In Bulgaria, TB incidence steadily declined, yet mortality remains disproportionately high due to underdiagnosis, population ageing, socioeconomic vulnerability, and surveillance gaps. Conclusion: Despite differing epidemiological profiles, both countries show how TB persists at the nexus of social inequity and system performance. Strengthened, equity-focused strategies are needed to improve early diagnosis, treatment outcomes, and progress toward TB elimination.

Keywords: 
;  ;  ;  ;  ;  ;  ;  

1. Background

Tuberculosis (TB) remains a major global infectious disease, persisting throughout human history with profound social and health implications [43]. Evidence indicates that TB has affected humans for over 70,000 years and currently impacts nearly two billion people worldwide [2]. Furthermore, TB disproportionately affects populations of low socio-economic status and marginalized groups [2,15].
In 2023, approximately 8.2 million people were newly diagnosed with TB, predominantly adults, with men more affected than women [39]. Sub-Saharan Africa (SSA) bears the highest burden, with an incidence of 201 cases per 100,000 population [43]. Evidence suggests that untreated TB has a case fatality rate of around 50% and caused 1.25 million deaths in 2023, particularly among people living with HIV [11].
Adherence to the WHO-recommended 4–6-month therapy can achieve a cure in nearly 85% of TB cases [43]. Moreover, approximately half of affected individuals experience catastrophic costs, encompassing both direct medical expenses and indirect losses, including reduced income and transportation costs [1,43]. Achieving universal health coverage (UHC) alongside social protection is essential to ensure equitable access to care [34]. Effective TB control requires addressing social determinants of health (SDoH) such as poverty, undernutrition, smoking, alcohol use, HIV, diabetes, cultural barriers, and health literacy [15].
Moreover, TB thrives in environments of poverty, overcrowding, malnutrition, unemployment, and limited healthcare access and is both a cause and consequence of social inequality [2,47]. Gender disparities complicate TB control, as men globally account for more cases and deaths, with a male-to-female incidence ratio of 1.8 [37]. However, South Africa and Bulgaria present contrasting TB contexts. The Republic of South Africa (RSA) is among the 30 highest-burdened countries, contributing 3% of global TB cases in 2023, with HIV co-infection at 55% [9]. Progress is impeded by structural inequalities, under-resourced health systems, and gaps in UHC [29]. In contrast, Bulgaria, contributing only 2.1% of global cases, remains high-priority, with Roma communities disproportionately affected due to poverty, discrimination, and limited healthcare access [10,35]. This study compares trends in tuberculosis incidence and mortality in RSA and Bulgaria from 2000 to 2023 and examines the impact of income levels, poverty rates, and Universal Health Coverage on these outcomes. By contrasting these two countries, the analysis highlights how socio-economic factors and health system coverage shape TB burden and progress toward disease control.

2. Methods

Document analysis was used to study TB incidence and mortality trends from 2000 to 2023 in relation to key SDoH. Data were collected from multiple sources, including peer-reviewed literature from PubMed, Scopus, and Google Scholar, as well as grey literature and institutional reports such as WHO Global TB Reports, World Bank DataBank, Statistics South Africa (Stats SA), National Statistical Institute of Bulgaria (NSI), National TB Control Programme reports, and relevant government and policy documents from both countries. We reviewed and compared data for TB outcomes (incidence and mortality) and their related socioeconomic indicators (GDP per capita, proportion of the population living in poverty, unemployment rate).
We used two indicators of poverty as incomplete and inconsistent data of people lie below the international poverty line. This threshold was updated to $2.15 per person per day in 2017 by the World Bank, replacing the previous line of $1.90 per day. The national poverty threshold is specific for each country, and data are available on the official websites of the national statistical institutions.
The average monthly poverty line in Bulgaria was 637.92 BGN (370,22 USD) per person, and R760 (42,237 USD) per person in SA. The unemployment rate is the share of people in the labour force without work. Economists consider a rate between 3% and 5% as a relatively stable economy with sufficient job creation.
The Universal Health Coverage Service Coverage Index (UHC SCI) has been proposed by the WHO and World Bank to assess the progress towards SDG indicator 3.8.1. It is a summary measure which combines 14 indicators of service coverage into a single index; its values range from 0 to 100 (<20, very low to >80, very high) [41,42].
Time-series analysis of TB incidence was applied to better understand TB trends. The absolute change was obtained as a difference between the absolute rate in the period yi and the absolute rate in the reference period y0 (in fixed base, 2000) or the absolute rate in its immediately preceding period (in the base chained), respectively, using the formulae ∆i/0=yi-y0 or ∆i/0=yi-yi-1.
We calculated dynamic index with a fixed base (Ii/0) or with a base chained (Ii/ /i-1), by formulae Ii/0=(yi/y0).100 or Ii/i-1=(yi/yi-1).100. Growth rate was calculated by Ri/0=(yi-y0/y0).100 with a fixed base or Ri/i-1=(yi-yi-1/yi-1).100 with a base chained.
Dynamics of the TB incidence rates were analysed using the SPSS Forecasting module.
Pearson’s correlation analysis was performed, and results were considered to be significant if р≤0.05. Pearson coefficient (r) value was assessed by a 5-point Likert scale (r=0: no correlation; r<0.19 as very weak; 0.2-0.39 as weak; 0.40- 0.59 as moderate; 0.6-0.79 as strong; 0.8-1.0 as very strong). Data was processed by SPPS v.25.0.

3. Results

A brief description of countries
RSA
South Africa has the largest economy in Africa and is classified as an upper-middle-income country with a GDP per capita of USD 6,002.5 in 2023 [46]. However, economic growth has slowed due to factors such as electricity shortages, weak job creation, transportation and logistics constraints [45], resulting in persistently high income inequality and unemployment rates [1].
Bulgaria
Over the past three decades, Bulgaria has undergone significant political and economic transitions [12]. Since 2007, it has been a member of the European Union [12]. According to the World Bank classification for 2023, Bulgaria moved from the upper-middle-income to the high-income group of countries with a modest economic growth [44]. However, the country faces significant social disparities both within and between its regions [12]. Variations of unemployment rates exist between different subgroups of the total population, which are closely related to disparities of economic activity and productivity [12].

4. Country-Specific Trends in TB Incidence and TB Mortality

4.1. TB Incidence and TB Mortality (2000-2023)

Table 1 shows shifts in TB incidence and mortality for the period of 2000-2023. Despite the progress in reducing incidence and mortality rates due to TB over time, there is a significant health gap between the two countries. In Bulgaria, there has been a downward trend in the rate of new cases of TB and TB death rates throughout the observed period. In SA, between 2000 and 2008, TB incidence and mortality increased, largely driven by rising HIV prevalence and drug resistance. A significant reduction has been seen since 2009 [9].

4.2. Time-Series Analysis

Confirming data analysis done (Table 1), we used the SPSS Forecasting module to predict the changes in the rate of new TB cases over the next three years (blue line, Figure 1). We expect the downward trend will be kept.

4.2.1. Absolute Change

A negative absolute change in TB incidence has been found since 2003 in Bulgaria and the success in reduction the rate of new TB cases was remarkable especially in the last years in parallel with a positive trend in treatment success (79% vs. 76% in SA and 88% globally, and far from ideal 90% or higher) [45]. The National TB Control Programme (NTP) was started in 1962 and the current NTP is for the period of 2021-2024.
In contrast, a negative absolute change in TB incidence in RSA has begun later (since 2007 with a basе chained, respectively since 2017 with a fixed base) and the reduction has been significant since 2019 (from -147 to -335). The efforts (screening, treatment, and TB infection prevention and control) have contributed to a decrease in new TB cases and a reduction in TB deaths. Despite the progress, the reduction in TB deaths lags behind the SDG targets, and the country faces challenges with MDR-TB and treatment adherence (only 50% successfully completed the full course of treatment over 6 months) where poverty plays a significant role in TB spread and prevents individuals from accessing to and completing TB treatment [11,36].

4.2.2. Dynamic Index

A relative increase (113.8% to 166.7%) in TB incidence in RSA was observed until 2008, with the percentage change being 56% (using a fixed base of 2000) and 91.2% (using a chained base). In Bulgaria, a downward trend has been observed throughout the period, and one-third of the changes in the measure were calculated in 2023 (with a fixed base of 2000) (Table 2).

4.2.3. Growth Rate

In South Africa, the TB incidence rate declined by 43.9%, from 762 per 100,000 in 2000 to 427 per 100,000 in 2023. In Bulgaria, TB incidence has decreased significantly since 2000, with a 69.2% reduction over the past 23 years. The changes in 2023 are insignificant in South Africa (-8.8%) compared to Bulgaria (-30.4% in 2020) in a chained time series.

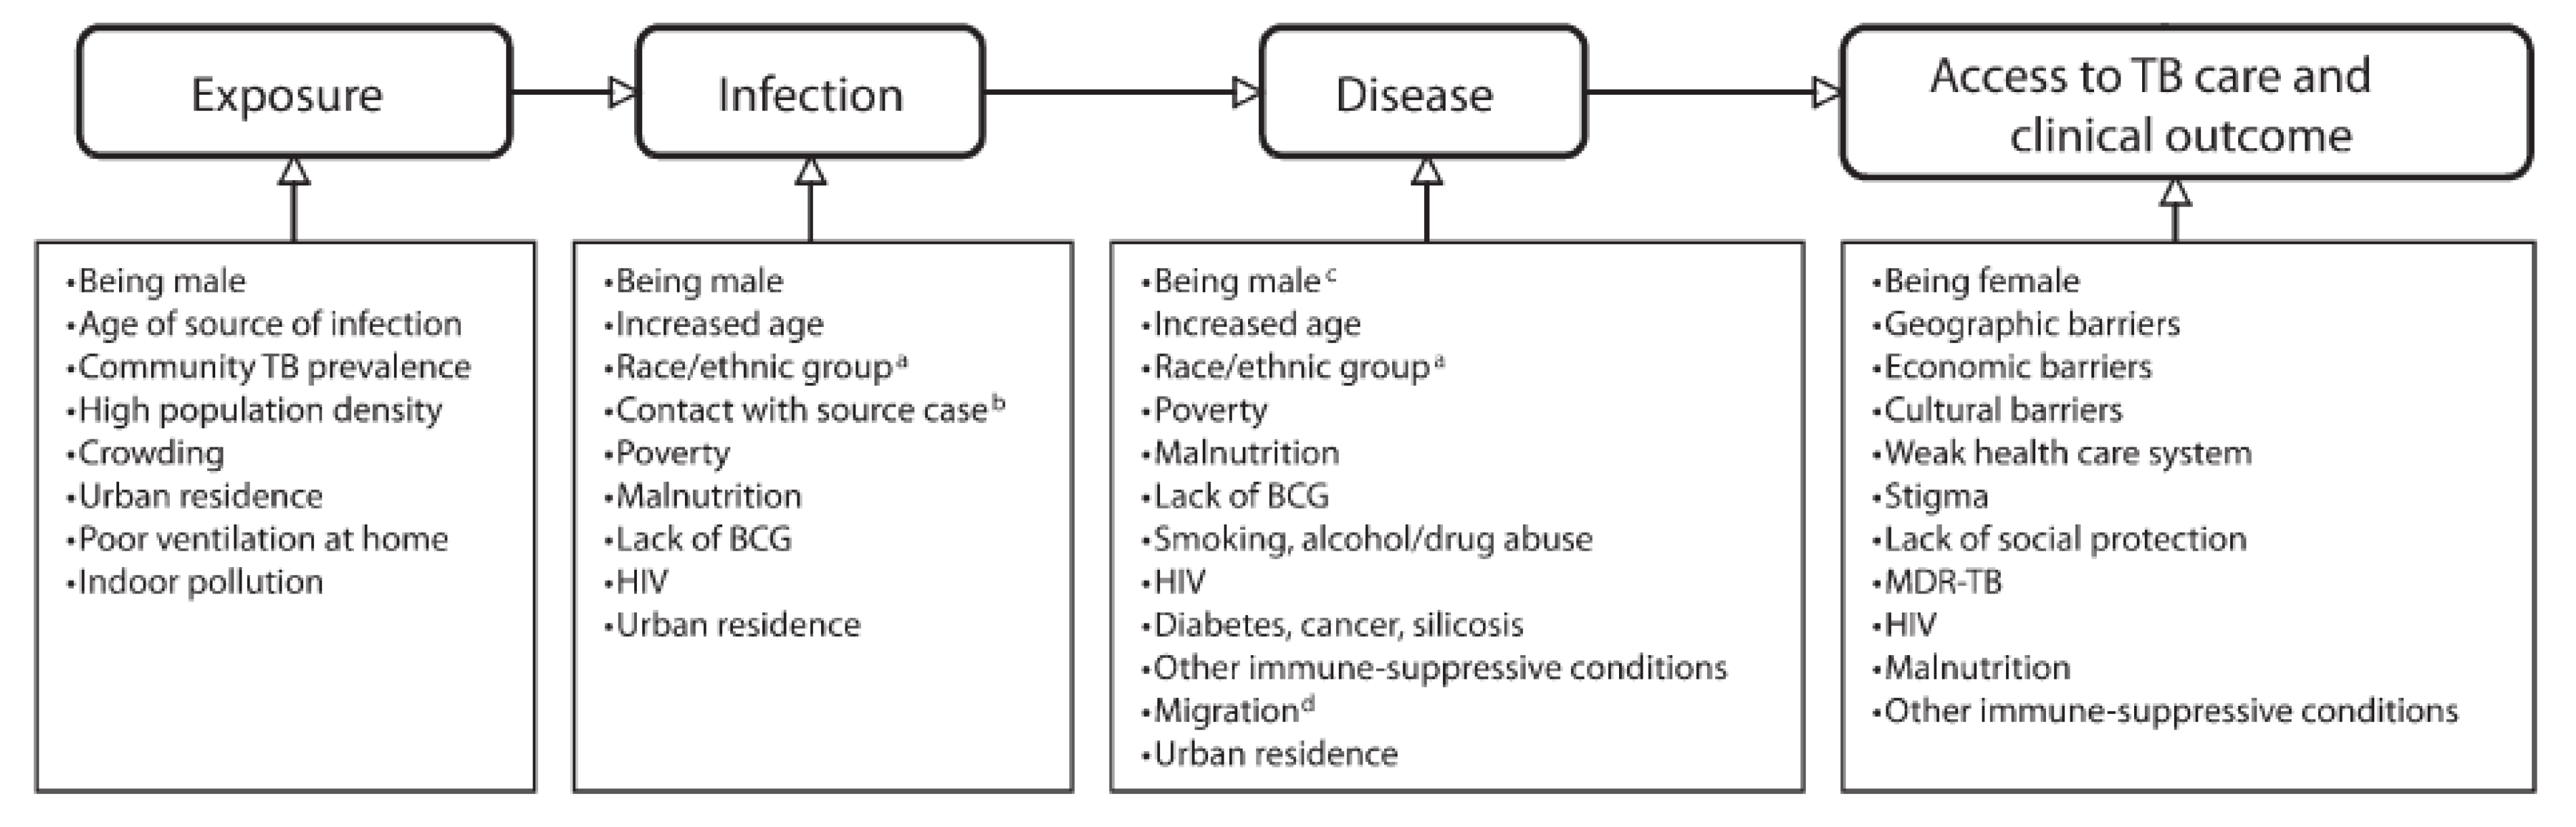
5. Social Determinants of Tuberculosis

SDoH are considered non-medical factors influencing health outcomes [40]. These are conditions where people are born, grow, live, work, and age, and people’s access to power, money, and resources [42].
SDoH heavily influence the complex mechanisms of TB, impacting exposure, progression, diagnosis, treatment, and adherence [42].
Among the key structural determinants of TB epidemiology are: global socioeconomic inequalities, high levels of population mobility, urbanization, demographic transition, and population growth [15,43], which create unequal distribution of social determinants of TB.
As shown in Figure 2, poverty, malnutrition, and hunger may increase susceptibility to infection, whilst poor ventilation and overcrowding in homes, workplaces, and communities increase the likelihood of uninfected individuals being exposed to TB infection. On the other hand, people with TB often face significant social and economic barriers, such as fear of stigmatization and transport issues to health facilities that delay their contact with the health system [7,38].
Studies demonstrated that TB incidence rates have been much more closely related to social and economic determinants than the access to DOTS [17,43]. Education, income, housing, and stigma are high-risk factors for poor TB medication outcomes [15].
Table 3. Social determinants related to TB in SA and Bulgaria from 2000 to 2023.
Year Income (GDP per capita in USD) Poverty ratio at $2.15 a day (% population) % population below the national poverty line Unemployment rate (%) UHC service coverage index Year Income (GDP per capita in USD) Poverty ratio at $2.15 a day (% population) % population below the national poverty line Unemployment rate (%) UHC service coverage index
Republic of South Africa
2000 3220 36.8 53.0 19.84 43 2012 8080 n/a 21.79
2001 2850 48.7 57.0 19.73 2013 7330 n/a 22.04
2002 2690 57.3 48.5 19.66 2014 6860 20.5 55.5 22.61
2003 4060 14 43.3 19.73 2015 6110 n/a 55.5 22.87 70
2004 5220 n/a 55.0 19.63 2016 5650 21.5 55.5 24.02
2005 8840 28.3 66.6 19.56 51 2017 6620 21.5 55.5 23.99 71
2006 6080 66.6 66.6 19.43 2018 6910 47.6 55.5 24.22
2007 6590 n/a 47.6 19.39 2019 6530 48.4 55.5 25.54 71
2008 6180 62.4 62.1 19.51 2020 5580 18.9 55.5 24.34 71
2009 6370 n/a 39.0 20.51 2021 6840 6.3 50.0 28.77 71
2010 7970 18 53.2 23.18 63 2022 6520 21.5 56.8 28.84
2011 8850 14 53.2 21.42 2023 6020 21.5 55.5 27.99 79
Bulgaria
2000 1621 7.9 16.22 56 2012 7430 2.3 21.2 12.27
2001 1770 7.9 17.3 19.92 2013 7690 1.8 21.0 12.94
2002 2090 7.9 18.11 2014 7910 1.7 21.8 11.42
2003 2720 14 20.6 13.73 2015 7080 3.4 22.0 9.14 70
2004 3390 10 21.7 12.04 2016 7570 2 22.9 7.58
2005 3900 n/a 22.0 10.08 61 2017 8380 1.4 23.4 6.16 72
2006 4520 5.8 28.5 8.95 2018 9440 0.9 22.0 5.21
2007 5890 1.8 16.0 6.88 2019 9840 0.9 23.8 4.23 76
2008 7270 1.3 20.6 5.61 2020 10200 0.2 22.1 5.13 73
2009 6990 1.3 20.7 6.82 2021 12270 0.7 22.9 5.27 73
2010 6860 2 22.3 10.28 65 2022 13640 9.0 20.6 4.27
2011 7860 2.5 21.2 11.26 2023 15890 0.7 30.3 4.30

5.1. Gross Domestic Product (GDP) and Its Association with TB Outcomes

A higher GDP is linked to better TB outcomes because of improved socioeconomic conditions, which help reduce the spread of TB risk factors and support a more effective health system [18].
In South Africa, GDP plays a complex role in spreading TB and related challenges. Even though it is a relatively wealthy country in the African region, the main drivers of the TB burden are poverty, inequality, poor nutrition, overcrowding, inadequate housing, the HIV epidemic, mismanagement of healthcare funds, and poor service delivery in resource-poor provinces [9].

5.2. Poverty and TB Outcomes

Poverty reduces investment in the healthcare, nutrition, and education of children, which reduces earnings later in life, perpetuating intergenerational cycles of poverty [1]. The risk of TB transmission and progression usually increases in impoverished communities because of undernutrition, overcrowding, poor living conditions, and barriers to treatment.
However, poverty is a consequence of TB as catastrophic costs for the treatment can drive patients and their families into deeper poverty [13,24]. In Bulgaria, Roma communities and homeless people are target risk groups for TB because of high rates of poverty and social exclusion, and related poor living conditions and lack of health insurance [12,27].

5.3. Income and TB Outcomes

Low income and financial hardship are significant factors influencing TB treatment outcomes and recurrence risk through the limited access to healthcare, adherence to treatment, and increased vulnerability to poverty-related risks [45].
Policies and programs addressing income inequality and social protection can improve TB treatment adherence and outcomes by growing political and financial support from governments, bilateral donors, and other global and regional institutions [16]. These measures and strategies encompass various areas of human rights, ensuring proper nutrition and nourishment, income, housing, and health insurance as well as expanded rights encompassing social assistance and social welfare for TB individuals, which leads to improving their nutritional status and quality of life, reducing catastrophic costs, and expanding access to health services [14].

5.4. Unemployment Rate and TB

Unemployment is associated with increased TB morbidity and mortality due to malnutrition, limited access to healthcare, and leads to social isolation and stigma, hindering TB screening, diagnosis, and treatment. In turn, TB can lead to job loss and reduced income, further exacerbating poverty with further poor health outcomes [35]. An average TB patient loses three to four months of work time and up to 30% of yearly household earnings [22].
In the RSA, the high unemployment rate, coupled with poverty, is a significant factor contributing to the high TB burden [41]. A greater risk of TB exists due to great disparities of unemployment rates (higher youth unemployment than the national average; regional and racial disparities, respectively, Eastern Cape and Black South Africans experiencing higher unemployment [38].

5.5. UHC SCI and TB Outcomes

Improved TB detection, treatment, and outcomes depend on the inclusion of TB services within the national UHC system to ensure accessibility and affordability [30]. Yet in many low- and middle-income countries, TB responses within UHC remain inadequate due to political neglect, discriminatory exclusion, or systemic apathy toward marginalized groups [13]. Compared to South Africa (58), Bulgaria demonstrates stronger performance on UHC SCI5 for TB treatment coverage (≥80) [46]. In South Africa, persistent provincial disparities—marked by fewer PHC facilities and limited access to essential medicines and vaccines in rural and impoverished districts further undermine UHC equity [7,8]
Pearson's correlation analysis
Pearson's correlation analysis was performed to investigate the strength and direction of the relationship between TB incidence and social determinants under study (Table 4).
The analysis revealed notable differences in how social determinants influence TB incidence in the RSA and Bulgaria. In the RSA, TB incidence was found to be strongly and positively correlated with both the unemployment rate (r = 0.805, p = 0.001) and the percentage of the population living below the national poverty line (r = 0.674, p = 0.001). These statistically significant correlations suggest that as poverty and unemployment levels increase, TB incidence also rises. In contrast, the correlation between GDP per capita and TB incidence was negative but not statistically significant (r = -0.246, p = 0.247), indicating a weak and inconclusive association between national income and TB trends in the South African context.

6. Discussion

This comparative analysis highlights divergent tuberculosis (TB) trends in RSA and Bulgaria between 2000 and 2023, highlighting the influence of both epidemiological transitions and social determinants of health (SDoH) on TB outcomes. While both countries achieved notable reductions in TB incidence and mortality during the study period, the pace and drivers of change were markedly different.
In Bulgaria, TB incidence and mortality have shown a consistent decline since 2003, reflecting the effectiveness of long-standing national TB control programmes, improvements in treatment success, and stronger integration of TB care into broader public health systems [3].
The country’s transition to a high-income classification in 2023 and membership in the European Union have facilitated structural health reforms, better social protection, and expanded universal health coverage [26,37]. Pearson’s correlation analysis demonstrated a strong and statistically significant negative association between GDP per capita and TB incidence (r = -0.910, p = 0.001), suggesting that improvements in socioeconomic conditions are strongly linked to declining TB rates.
However, TB incidence remained positively correlated with unemployment (r = 0.723, p = 0.001), reflecting persistent social disparities within vulnerable groups, including Roma communities and homeless populations [21].
By contrast, South Africa continues to carry one of the highest TB burdens globally, shaped mainly by the intersecting epidemics of TB and HIV, socioeconomic inequality, and health system constraints [26]. From 2000 to 2008, TB incidence and mortality increased significantly, peaking during the height of the HIV epidemic. A decline in incidence has been evident since 2009, attributable to the scale-up of TB-HIV co-treatment programmes, expanded diagnostic capacity, and greater emphasis on infection prevention and control [30].
However, the reduction in TB deaths remains insufficient to meet Sustainable Development Goal (SDG) targets, partly due to multidrug-resistant TB (MDR-TB), poor treatment adherence, and high poverty levels [16]. Statistical analysis revealed that TB incidence in RSA is strongly and positively correlated with unemployment (r = 0.805, p = 0.001) and the population living below the national poverty line (r = 0.674, p = 0.001).
These findings highlight the structural vulnerability of disadvantaged groups, particularly unemployed youth and residents in rural provinces, who experience barriers to accessing timely diagnosis and completing treatment [17,32,33].
A comparative perspective reinforces the central role of SDoH in shaping TB epidemiology. Whereas Bulgaria’s improvements in income and social protection policies appear to have contributed to sustained TB reductions, South Africa’s high inequality, persistent unemployment, and health system fragmentation continue to exacerbate vulnerability to TB [31]. Importantly, GDP per capita was not significantly associated with TB incidence in RSA (r = -0.246, p = 0.247), underscoring that aggregate national wealth does not necessarily translate into improved TB outcomes in contexts of deep inequality and systemic poverty [4].
Limitations
This study has several limitations. First, the analysis relied primarily on national-level data, which may mask critical subnational variations in TB incidence, mortality, and SDoH. For example, disparities between rural and urban areas and across different population groups are not fully captured. Second, while the correlation analysis provides insights into associations between socioeconomic indicators and TB incidence, it does not establish causality.
Third, data availability varied across years and sources, with some indicators missing for specific time points, which may affect the comparability between South Africa and Bulgaria. Finally, the reliance on secondary data may introduce reporting biases, especially in contexts where TB case detection is incomplete or social determinants are underreported.

7. Policy Implications and Recommendations

For Bulgaria, sustaining TB control requires continued investment in national TB programmes with a focus on vulnerable and marginalized groups. Strengthening targeted outreach for Roma communities, homeless populations, and uninsured individuals is essential [21].
Policy actions should also emphasize employment generation and regional economic development to address the observed link between unemployment and TB incidence [39]. In addition, maintaining high treatment success rates and aligning TB policies with EU social protection frameworks will ensure that progress is sustained [41].
For South Africa, TB control must be integrated into a broader multi-sectoral strategy that tackles poverty, inequality, and unemployment alongside biomedical interventions [44]. Expanding social protection schemes, such as income support and nutritional supplementation for TB-affected households, could mitigate treatment barriers [23].
Strengthening UHC coverage, particularly in rural provinces with poor service delivery, is critical for improving equitable access to TB care [38]. Moreover, investments in community-based adherence support, improved management of MDR-TB, and health system efficiency are required to accelerate progress toward SDG targets [6]. Without addressing structural determinants, biomedical gains in TB control are unlikely to yield sustained reductions in incidence and mortality [15].

8. Conclusions

The study confirms that social determinants, including poverty, unemployment, and income inequality, are key drivers of TB trends and interact with health system factors such as UHC to shape outcomes. South Africa’s high TB burden is closely linked to socioeconomic deprivation, while Bulgaria’s low TB burden reflects effective health coverage and stronger socioeconomic conditions. Comparative analyses of this nature are essential to guide targeted interventions and policy responses that address both the medical and social dimensions of TB.

Author Contributions

Conceptualization, S.K.; J.S. methodology, S.K.; J.S.; A.Y validation, S.K.; J.S.; D.G.; and A.V.; formal analysis, J.S; A.Y.; A.V; investigation, S.K,;J.S. and D.G.; resources, S.K.;J.S; A.Y;N.K.; and Y.S. data curation, S.K.;J.S.; D.G.; writing—original draft preparation, S.K.; writing—review and editing, S.K.; J.S.; N.K; Y.M.; A.Y.; and A.V. visualization, S.K. and J.S.; supervision, A.Y. and N.K.; project administration, S.K.; funding acquisition, S.K., J.S. N.K.; and A.Y. All authors have read and agreed to the published version of the manuscript.

Funding

This study was funded by the European Union Next-Generation EU, through the National Recovery and Resilience Plan of the Republic of Bulgaria, project N BG-RRP2.004-0004-C01.

Institutional Review Board Statement

We used a publicly available secondary dataset; therefore, ethical approval was not required.

Data Availability Statement

This study did not involve the generation or analysis of new data; therefore, data sharing is not applicable.

Acknowledgments

We thank the Medical University of Sofia and the University of KwaZulu-Natal for their guidance and support in developing this article through the Erasmus+ Mobility Scholarship collaboration.

Conflicts of Interest

The authors confirm that they have no competing interests to disclose.

References

  1. African Development Bank Group. South Africa Economic Outlook. Available online: https://www.afdb.org/en/countries/southern-africa/south-africa/south-africa-economic-outlook (accessed on 8 September 2025).
  2. Barberis, I.; Bragazzi, N. L.; Galluzzo, L.; Martini, M. The History of Tuberculosis: From the First Historical Records to the Isolation of Koch’s Bacillus. J. Prev. Med. Hyg. 2017, 58(1), E9–E12. [Google Scholar] [PubMed]
  3. Bhargava, A.; Bhargava, M.; Pai, M. Tuberculosis: A Biosocial Problem That Requires Biosocial Solutions. Lancet 2024, 403, 2467–2469. [Google Scholar] [CrossRef] [PubMed]
  4. Gabrovska, N.; Spasova, A.; Galacheva, A.; Kostadinov, D.; Yanev, N.; Milanov, V.; Gabrovski, K.; Velizarova, S. Tuberculosis in Adolescents in Bulgaria for a Three-Year Period: 2018–2020. Children 2022, 9, 785. [Google Scholar] [CrossRef]
  5. van der Westhuizen, H. M.; Ehrlich, R.; Somdyala, N.; et al. Stigma Relating to Tuberculosis Infection Prevention and Control Implementation in Rural Health Facilities in South Africa—A Qualitative Study Outlining Opportunities for Mitigation. BMC Glob. Public Health 2024, 2, 66. [Google Scholar] [CrossRef] [PubMed]
  6. Colema, C.; Maughan, S. The Road to UHC: Progress in South Africa’s Journey to Universal Health Coverage; Rural Health Advocacy Project: Johannesburg, 2023. [Google Scholar]
  7. Cramm, J. M.; Koolman, X.; Møller, V.; Nieboer, A. P. Socio-Economic Status and Self-Reported Tuberculosis: A Multilevel Analysis in a Low-Income Township in the Eastern Cape, South Africa. J. Public Health Afr. 2011, 2(2), e34. [Google Scholar] [CrossRef]
  8. Day, C.; Gray, A.; Cois, A.; Ndlovu, N.; Massyn, N.; Boerma, T. Is South Africa Closing the Health Gaps between Districts? Monitoring Progress towards Universal Health Service Coverage with Routine Facility Data. BMC Health Serv. Res. 2021, 21(1). [Google Scholar] [CrossRef]
  9. Dlatu, N.; Longo-Mbenza, B.; Apalata, T. Predictors of Tuberculosis Incidence and the Effects of Multiple Deprivation Indices on Tuberculosis Management in OR Tambo District over a 5-Year Period. PLoS One 2022, 17(3), e0264811. [Google Scholar] [CrossRef]
  10. Doan, T. N.; Varleva, T.; Zamfirova, M.; Tyufekchieva, M.; Keshelava, A.; Hristov, K.; et al. Strategic Investment in Tuberculosis Control in the Republic of Bulgaria. Epidemiol. Infect. 2019, 147, e304. [Google Scholar] [CrossRef]
  11. Erlinger, S.; Stracker, N.; Hanrahan, C.; Nonyane, B. A. S.; Mmolawa, L.; Tampi, R.; et al. Tuberculosis Patients with Higher Levels of Poverty Face Equal or Greater Costs of Illness. Int. J. Tuberc. Lung Dis. 2019, 23(11), 1205–1212. [Google Scholar] [CrossRef]
  12. European Commission. European Economy: Bulgaria Country Profile 2023; Publications Office of the European Union: Luxembourg, 2023. [Google Scholar]
  13. Fenta, M. D.; Ogundijo, O. A.; Warsame, A. A. A.; et al. Facilitators and Barriers to Tuberculosis Active Case Findings in Low- and Middle-Income Countries: A Systematic Review of Qualitative Research. BMC Infect. Dis. 2023, 23, 515. [Google Scholar] [CrossRef]
  14. Ferreira, M. R. L.; Bonfim, R. O.; Bossonario, P. A.; Maurin, V. P.; Valença, A. B. M.; Abreu, P. D.; et al. Social Protection as a Right of People Affected by Tuberculosis: A Scoping Review and Conceptual Framework. Infect. Dis. Poverty 2023, 12. [Google Scholar] [CrossRef] [PubMed]
  15. Hargreaves, J. R.; Boccia, D.; Evans, C. A.; Adato, M.; Petticrew, M.; Porter, J. D. H. The Social Determinants of Tuberculosis: From Evidence to Action. Am. J. Public Health 2011, 101(4), 654–662. [Google Scholar] [CrossRef] [PubMed]
  16. Jaca, A.; Malinga, T.; Iwu-Jaja, C. J.; Nnaji, C. A.; Okeibunor, J. C.; Kamuya, D.; Wiysonge, C. S. Strengthening the Health System as a Strategy to Achieving a Universal Health Coverage in Underprivileged Communities in Africa: A Scoping Review. Int. J. Environ. Res. Public Health 2022, 19(1), 587. [Google Scholar] [CrossRef] [PubMed]
  17. Katende-Kyenda, L. N. Determinants of Non-Adherence to Anti-Tuberculosis Treatment in a Public Primary Healthcare in South Africa: Improving the Quality of Long-Term Care. 2025. [Google Scholar]
  18. Keogh-Brown, M. R.; Sumner, T.; Sweeney, S.; Vassall, A.; Jensen, H. T. Estimating the Health and Macroeconomic Burdens of Tuberculosis in India, 2021-2040: A Fully Integrated Modelling Study. PLoS Med. 2024, 21(12), e1004491. [Google Scholar] [CrossRef]
  19. Lienhardt, C. From Exposure to Disease: The Role of Environmental Factors in Susceptibility to and Development of Tuberculosis. Epidemiol. Rev. 2001, 23(2), 288–301. [Google Scholar] [CrossRef]
  20. Litvinjenko, S.; Magwood, O.; Wu, S.; Wei, X. Burden of Tuberculosis among Vulnerable Populations Worldwide: An Overview of Systematic Reviews. Lancet Infect. Dis. 2023, 23(12), 1395–1407. [Google Scholar] [CrossRef]
  21. Making Health a Right for All: Universal Health Coverage and Tuberculosis: Discussion Paper. March 2014.
  22. Medina-Marino, A.; de Vos, L.; Daniels, J. Social Isolation, Social Exclusion, and Access to Mental and Tangible Resources: Mapping the Gendered Impact of Tuberculosis-Related Stigma among Men and Women Living with Tuberculosis in Eastern Cape Province, South Africa. BMC Glob. Public Health 2025, 3, 50. [Google Scholar] [CrossRef]
  23. Ministry of Health. National Tuberculosis Control Programme (NTP) in Bulgaria. 2021-2025. [Google Scholar]
  24. Musilová, B. The Long Road to Inclusion: Factors Influencing Persistent Marginalization of Roma in Slovakia through the Lens of Public Policy. 2025. [Google Scholar]
  25. Nalugwa, T.; Annerstedt, K. S.; Nabwire, S.; West, N. S.; Kadota, J. L.; Atkins, S.; et al. Identifying Mechanisms by Which Social Determinants of Health Impact TB Diagnostic Evaluation Uptake in Uganda: A Qualitative Study. Int. J. Equity Health 2025, 24. [Google Scholar] [CrossRef]
  26. National Statistical Institute. Poverty and Social Inclusion Indicators in Bulgaria.
  27. NDoH; Republic of South Africa. Policy Dialogue on Universal Health Coverage in South Africa, December 2022. Available online: https://www.health.gov.za/wp-content/uploads/2023/10/Policy-Dialogue-Report.pdf.
  28. NDoH; Republic of South Africa. National Health Insurance for South Africa: Towards Universal Health Coverage, Version 40; Department of Health: Pretoria, 2015. [Google Scholar]
  29. NDoH; Republic of South Africa. National TB Recovery Plan 4.0, April 2025; Pretoria. Available online: https://www.health.gov.za/wp-content/uploads/2025/05/TB-Recovery-Plan-4_final_250526.pdf.
  30. Nguyen, T. A.; Teo, A. K. J.; Zhao, Y.; Quelapio, M.; Hill, J.; Morishita, F.; Marais, B. J.; Marks, G. B. Population-Wide Active Case Finding as a Strategy to End TB. Lancet Reg. Health–West. Pac 2024, 46. [Google Scholar] [CrossRef] [PubMed]
  31. Nhassengo, P. P. The TB-Poverty Cycle: Dynamics, Determinants, and Consequences of Economic Hardship Faced by People with TB in Mozambique. Doctoral Dissertation, Karolinska Institutet, 2024. [Google Scholar]
  32. Ntuli, T. T. Socio-Economic Risk Factors for Acquired Multi-Drug-Resistant Tuberculosis Among Tuberculosis Patients in South Africa, Tshwane Health District: A Retrospective Study; University of Johannesburg: South Africa, 2022. [Google Scholar]
  33. Przybylski, G.; Dąbrowska, A.; Pilaczyńska-Cemel, M.; Krawiecka, D. Unemployment in TB Patients – Ten-Year Observation at Regional Center of Pulmonology in Bydgoszcz, Poland. Med. Sci. Monit. 2014, 20, 2125–2131. [Google Scholar] [PubMed]
  34. Sacks, E.; Schleiff, M.; Were, M.; Chowdhury, A. M.; Perry, H. B. Communities, Universal Health Coverage and Primary Health Care. Bull. World Health Organ. 2020, 98(11), 773–780. [Google Scholar] [CrossRef] [PubMed]
  35. Stanchev, K. Administrative Unfairness: The Case of Roma in Bulgaria. ПУБЛИЧНИ ПОЛИТИКИ. bg 2021, 12(2), 15–32. [Google Scholar]
  36. Ting, H.; Bozzola, M.; Ravetti, C. Tuberculosis and Labour Market Participation: Evidence from South Africa. South. Afr. J. Econ. 2024, 1–31. [Google Scholar] [CrossRef]
  37. UNICEF. Situation Analysis of Children and Adolescents in South Africa 2024; UNICEF for Every Child: Pretoria, 2024. [Google Scholar]
  38. Vanleeuw, L.; Zembe-Mkabile, W.; Atkins, S. I'm Suffering for Food": Food Insecurity and Access to Social Protection for TB Patients and Their Households in Cape Town, South Africa. PLoS One 2022, 17(4), e0266356. [Google Scholar] [CrossRef]
  39. Walt, M.; Moyo, S. The First National TB Prevalence Survey | South Africa 2018.
  40. WHO; Commission on Social Determinants of Health. Closing the Gap in a Generation: Health Equity through Action on the Social Determinants of Health; WHO Press: Geneva, 2008. [Google Scholar]
  41. WHO; World Bank Group; OECD. Tracking Universal Health Coverage 2021: Global Monitoring Report; WHO: Geneva, 2021. [Google Scholar]
  42. WHO. A Conceptual Framework for Action on the Social Determinants of Health; WHO Press: Geneva, 2010. [Google Scholar]
  43. WHO. Global Tuberculosis Report 2024; World Health Organization: Geneva, 2024. [Google Scholar]
  44. World Bank. Country Classifications by Income Level for 2024-2025. Available online: https://blogs.worldbank.org/en/opendata/world-bank-country-classifications-by-income-level-for-2024-2025.
  45. World Bank. Database: Indicators. Available online: https://data.worldbank.org/indicator?tab=all.
  46. World Health Organization. Universal Health Coverage, 2025. Available online: https://www.uhc2030.org/fileadmin/uploads/uhc2030/Documents/UN_HLM_2023/Action_Agenda_2023/UHC_Action_Agenda_long_2023.pdf (accessed on 8 September 2025).
  47. Zumla, A.; Sahu, S.; Ditiu, L.; Singh, U.; Park, Y. J.; Yeboah-Manu, D.; Osei-Wusu, S.; Asogun, D.; Nyasulu, P.; Tembo, J.; Kapata, N.; Alyaqoubi, F.; Maani, A. A.; Blumberg, L.; Zumla, A.; Ahmed, R.; Go, U.; Hui, D. S.; Goletti, D.; Petersen, E. Inequities Underlie the Alarming Resurgence of Tuberculosis as the World's Top Cause of Death from an Infectious Disease—Breaking the Silence and Addressing the Underlying Root Causes. IJID Reg. 2025, 14 Suppl 2, 100587. [Google Scholar] [CrossRef]
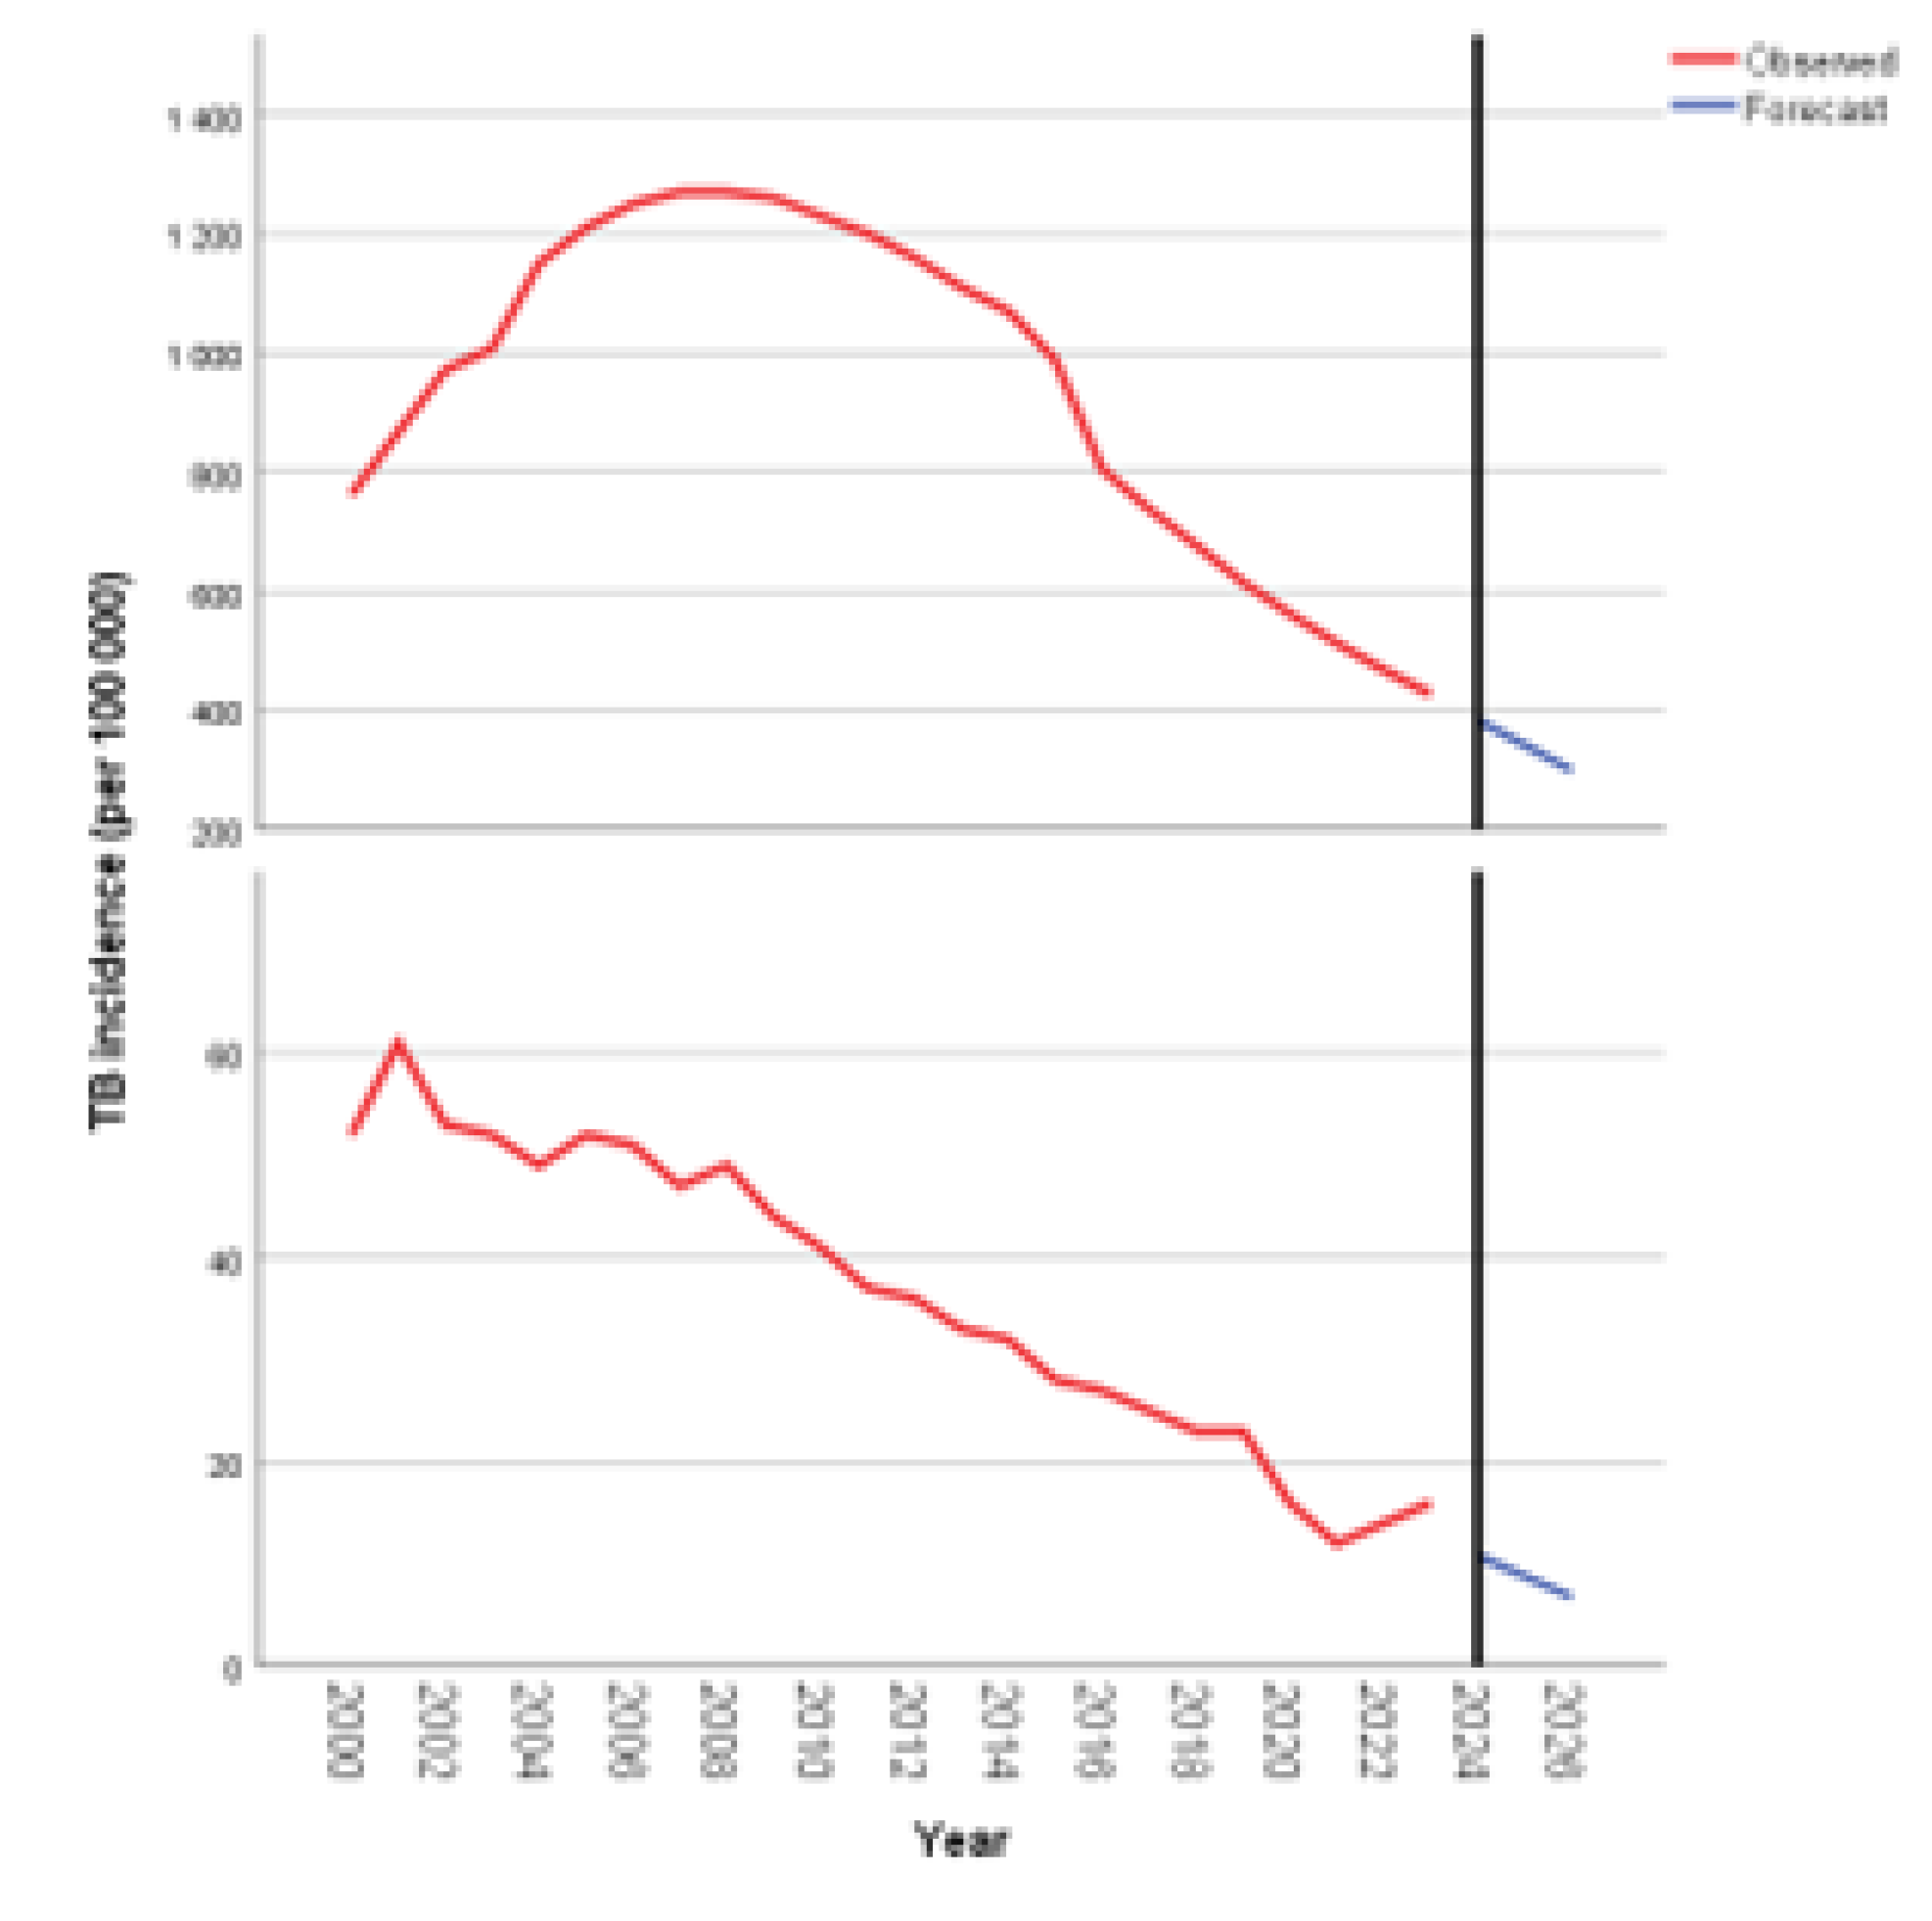
Figure 1. Trends and forecast of TB incidence.
Preprints 189496 g001
Figure 2. Risk factors for different stages of TB pathogenesis and epidemiology [19].
Preprints 189496 g002
Table 1. Incidence and Mortality rates due to Tuberculosis in SA and Bulgaria for the period of 2000-2023.
Year Incidence per 100 000 Mortality per 100,000 population Year Incidence per 100 000 Mortality per 100,000 population
SA
2000 762 95 2012 1160 93
2001 867 113 2013 1110 77
2002 971 132 2014 1070 71
2003 1007 146 2015 988 61
2004 1150 150 2016 805 55
2005 1210 155 2017 738 53
2006 1250 160 2018 677 49
2007 1270 157 2019 615 45
2008 1270 155 2020 562 34
2009 1260 138 2021 513 n/a
2010 1230 124 2022 468 n/a
2011 1200 107 2023 427 n/a
Bulgaria
2000 52 4 2012 36 2
2001 61 4 2013 33 2
2002 53 4 2014 32 2
2003 52 4 2015 28 2
2004 49 4 2016 27 2
2005 52 4 2017 25 1
2006 51 4 2018 23 1
2007 47 4 2019 23 1
2008 49 3 2020 16 1
2009 44 3 2021 12 1
2010 41 3 2022 14 1
2011 37 2 2023 16 1
RSA=Republic of South Africa.
Table 2. Dynamics of Tuberculosis incidence in SA and Bulgaria (2000-2023).
Year
x (t)
Absolute levels(yi) Absolute changei/0
(with fixed base, 2000)
Absolute changei/i-1
(with the base chained)
Dynamic index(with fixed base, 2000) Dynamic index (with the base chained) Growth rate Ri/0(with fixed base, 2000) Growth rate Ri/i-1 (with the base chained)
Republic of South Africa
2000 762 100.0 100.0
2001 867 105 105 113.8 113.8 13.8 13.8
2002 971 209 104 127.4 111.9 27.4 11.9
2003 1007 245 36 132.2 103.7 32.2 3.7
2004 1150 388 143 150.9 114.2 50.9 14.2
2005 1210 448 60 158.8 105.2 58.8 5.2
2006 1250 488 40 164 103.3 64.0 3.3
2007 1270 508 20 166.7 101.6 66.7 1.6
2008 1270 508 0 166.7 100.0 66.7 0.0
2009 1260 498 -10 165.4 99.2 65.4 -0.8
2010 1230 468 -30 161.4 97.6 61.4 -2.4
2011 1200 438 -30 157.5 97.6 57.5 -2.4
2012 1160 398 -40 152.2 96.7 52.2 -3.3
2013 1110 348 -50 145.7 95.7 45.7 -4.3
2014 1070 308 -40 140.4 96.4 40.4 -3.6
2015 988 226 -82 129.7 92.3 29.7 -7.7
2016 805 43 -183 105.6 81.5 5.6 -18.5
2017 738 -24 -67 96.9 91.7 -3.1 -8.3
2018 677 -85 -61 88.8 91.7 -11.2 -8.3
2019 615 -147 -62 80.7 90.8 -19.3 -9.2
2020 562 -200 -53 73.8 91.4 -26.2 -8.7
2021 513 -249 -49 67.3 91.3 -32.7 -8.7
2022 468 -294 -45 61.4 91.2 -38.6 -8.8
2023 427 -335 -41 56 91.2 -43.9 -8.8
Bulgaria
2000 52 100.0 100.0
2001 61 9 9 117.3 117.3 17.3 17.3
2002 53 1 -8 101.9 86.9 1.9 -13.1
2003 52 0 -1 98.1 98.1 0.0 -1.9
2004 49 -3 -3 94.2 94.2 -5.8 -5.8
2005 52 0 -3 100 106.1 0.0 6.1
2006 51 -1 -1 98.1 98.1 -1.9 -1.9
2007 47 -5 -4 90.4 92.2 -9.6 -7.8
2008 49 -3 2 94.2 104.3 -5.8 4.3
2009 44 -8 -5 84.6 89.8 -15.4 -10.2
2010 41 -11 -3 78.8 93.2 -21.2 -6.8
2011 37 -15 -4 71.2 90.2 -28.8 -9.8
2012 36 -16 -1 69.2 97.3 -30.8 -2.7
2013 33 -19 -3 63.5 91.7 -36.5 -8.3
2014 32 -20 -1 61.5 96.9 -38.5 -3.0
2015 28 -24 -4 53.8 87.5 -46.2 -12.5
2016 27 -25 -1 51.9 96.4 -48.1 -3.6
2017 25 -27 -2 48.1 92.5 -51.9 -7.4
2018 23 -29 -2 44.2 92.0 -55.8 -8.0
2019 23 -29 0 44.2 100.0 -55.8 0.0
2020 16 -36 -7 30.8 69.6 -69.2 -30.4
2021 12 -40 -4 23.1 75.0 -76.9 -25.0
2022 14 -38 2 26.9 116.7 -73.1 16.7
2023 16 -36 2 30.8 114.3 -69.2 14.3
Table 4. Correlation between TB incidence trend and social determinants in SA and Bulgaria (2000-2023).
Republic of South Africa Bulgaria
Social determinant TB incidence trend
GDP per capita r=-0.246, p=0.247, N=24 r=-0.910*, p=0.001, N=24
% Population below the national poverty line r=0.674*, p=0.001, N=24 r=0.378, p=0.083, N=24
Unemployment rate (%) r=0.805*, p=0.001, N=24 r=0.723*, p=0.001, N=24
Disclaimer/Publisher’s Note: The statements, opinions and data contained in all publications are solely those of the individual author(s) and contributor(s) and not of MDPI and/or the editor(s). MDPI and/or the editor(s) disclaim responsibility for any injury to people or property resulting from any ideas, methods, instructions or products referred to in the content.
Copyright: This open access article is published under a Creative Commons CC BY 4.0 license, which permit the free download, distribution, and reuse, provided that the author and preprint are cited in any reuse.
Prerpints.org logo

Preprints.org is a free preprint server supported by MDPI in Basel, Switzerland.

Subscribe

Disclaimer

Terms of Use

Privacy Policy

Privacy Settings

© 2025 MDPI (Basel, Switzerland) unless otherwise stated