
Submitted:
22 November 2024
Posted:
22 November 2024
You are already at the latest version
Abstract
Background: Ghana has seen a notable rise in Tuberculosis cases with mired treatment outcomes. However, evidence suggests disparities in the incidence of Tuberculosis and its treatment outcomes across the country. Nzema East Municipal specifically reported a 62.34% increase in TB incidence in 2023 compared to 2022. The study, therefore, aims to determine the geospatial distribution of TB incidence and predictors of TB treatment outcomes in Nzema East Municipal.Methods: The study used a retrospective cohort with a quantitative approach, utilising health records of 545 TB cases from 2018 to 2023 in Nzema East. Data was processed with Microsoft Excel and analysed using ArcGIS Pro version 3.3.2, Joinpoint Regression Programme 5.2.0, and STATA MP version 17.Results: The Moran’s index was 0.03 (p=0.00). All the subdistricts had at least one settlement with 2 to 26 TB cases per squared kilometre. Significant TB hotspots were identified in the population-dense communities and mining communities. Overall, successful TB treatment outcome was 76.70%. There was a significant decline in successful TB treatment outcomes from 2018 to the end of 2020 and through 2023 (p=0.03 and p=0.00, respectively). Having at least one follow-up lab (aOR= 0.25, 95% CI = 0.15, 0.42) and having a treatment supporter (aOR=0.43, 95% CI = 0.23, 0.80) lessens the chances of having an unsuccessful TB treatment outcome. Having started the TB treatment in 2020 increases the chances of having an unsuccessful outcome (aOR = 2.97 95% CI = 1.30, 6.81),Conclusion: TB incidence in Nzema East was spatially dependent, with a higher incidence in the highly populated and mining communities. The overall successful treatment outcome is suboptimal, which demands targeted intervention to mitigate these menaces.
Keywords:
Tuberculosis
; Nzema East
; Geospatial pattern
; Treatment outcome
; Ghana
Introduction
1.1. Background
Tuberculosis (TB), a severe and highly contagious disease, presents a significant global health challenge, being the leading cause of mortality from a single infectious disease among humans globally. The need for collective action to curb this challenge is urgent, given its global burden of approximately 1.3 million mortalities in 2023, surpassing deaths attributed to COVID-19 and about twice the deaths caused by HIV and AIDS [1]. In 2023, over 10.8 million individuals worldwide were diagnosed with active Tuberculosis, of which 8.2 million were newly diagnosed, unacceptably higher than the 7.5 million in 2022 [1].
Tuberculosis is caused by bacillus Mycobacterium tuberculosis (MTB) and can affect any part of the body, although it primarily affects the lungs (known as Pulmonary Tuberculosis). It can also affect individuals of all age groups. The Mycobacterium tuberculosis from an active infected lung TB person can get to those without the bacillus through the air when they cough, sneeze or spit [2]. Individuals who have been infected with MTB might not exhibit symptoms of TB, a condition commonly referred to as latent TB. Approximately 25% of the world’s population have latent TB, giving them a concerning chance of developing active TB [3,4]. About 10% of persons with latent TB acquire active TB [5]. Moreover, those with compromised immune systems are at a greater risk of developing active TB disease [6]. Approximately 6.1% of the global active TB cases were people living with HIV [1].
Efforts in controlling this deliberating disease led to the adoption of the End TB Strategy of the World Health Organisation (WHO) through integrated, patient-centred care and prevention, bold policies and supportive systems, and intensified research and innovations; and the United Nations Sustainable Development Goals 2015, to end this TB epidemic [1]. The WHO's End TB Strategy recommends reducing 90% of TB incidence and 95% of TB deaths by 2035 compared to 2015 by all nationals or other implementing bodies, with one of the monitoring targets for implementation of this strategy of at least 90% in TB treatment success rate [1,7].
Unfortunately, in Ghana, Tuberculosis remains a consistent burden, causing substantial health and economic implications on both individuals and the overall healthcare system, despite ongoing efforts to mitigate its impact. As indicated in the 2022 Ghana Holistic Assessment Report, there has been a notable increase in tuberculosis cases in Ghana. Specifically, between 2018 and 2022, the incidence of new tuberculosis (TB) infections has risen by 13.2%, that is, 14,602 to 16,526, with the number of new cases per 100,000 people increasing from 43.4% to 52.5% [8].
Nevertheless, in addition to curbing the rising TB incidence, there is a higher demand for increasing the successful treatment of persons with tuberculosis in Ghana, as the treatment outcomes stagnated at 87% from 2018 to 2022 [8]. This poor TB treatment outcome could be predicted by clinicodemographic characteristics such as age, sex, and HIV infection [9,10]. It is worth noting that successful treatment of tuberculosis is not only necessary for just its treatment or elimination but also to prevent other public health issues, such as TB-associated morbidity and antimicrobial resistance [11,12,13].
TB data is frequently presented as a single national incidence or prevalence. It is imperative to analyse the TB data at a primary level to gain a more comprehensive understanding of the disease's burden in a particular region or community, which may differ from that of the larger national population.
Nzema East Municipality, one of the fourteen districts of the Western Region, Ghana, is highly burdened with Tuberculosis. Of the about 2000 new Tuberculosis cases reported (both new and relapse) in the Western Region in 2023, 154 (that is 156 cases per 100000 population) were from Nzema East, a 62.34% increase in new cases from what was recorded in the municipality in 2022 [14]. This rise in the incidence of TB cases in the municipality is unacceptable as it directly impedes Nzema East from contributing its quota to achieving the 90% reduction in TB incidence recommended by the World Health Organisation [1]. As such, tailored interventions are urgently needed to prevent and control Tuberculosis in the municipality.
Despite this pressing issue, there remains a critical gap in understanding the geospatial dynamics of TB incidence and factors affecting treatment outcomes within the Nzema East. This gap hinders the development and implementation of effective, evidence-based interventions to mitigate the burdens of TB in the municipality. Hence, the need for this study.
To determine the geospatial distribution of Tuberculosis incidence and the predictors of TB treatment outcomes in Nzema East Municipal.
Methodology
2.1. Study Site Description
This study was conducted in the Nzema East Municipality in the Western Region of the Republic of Ghana. It is located between longitude 2º 05’ and 2º 35’ West and latitude 4º 40’ and 5º 20’ north, covering a land area of 2194km². Nzema East is bounded West by Ellembelle District, East by Ahanta West, North by Tarkwa Nsuem Municipal, and South by the Gulf of Guinea.
The Municipality's inhabitants in the northern part are predominantly farmers and small-scale miners (including Galamsey), while those who reside in the southern part are fishers and fishmongers. The district's population is projected to be 98851 in 2023, based on the 2010 Ghana Population and Housing Census. The population density is higher in the southern sector of the Municipality, which is, incidentally, more endowed with social amenities such as safe and reliable drinking water sources, schools, health facilities, and electricity.
For health administrative purposes, the Municipality is divided into seven (7) Sub-Districts, with one municipal hospital, four (4) health centres, and twelve Community-Based Health Planning and Services (CHPS) zones as of the end of 2023. The Municipality has only one certified diagnostic centre for TB, the Municipal Hospital located in Axim, the municipality’s capital.
2.2. Study Design and Approach
This study adopted a retrospective cohort study of the new TB cases in Nzema East from January 1, 2018, to December 31, 2023, with a quantitative approach. The retrospective cohort study design allowed the use of secondary data for the geospatial analysis and to identify the factors predicting the treatment outcomes of TB cases [15,16].
2.3. Study Population
The study population comprised individuals newly diagnosed with drug-susceptible TB, either bacteriologically or clinically, and was treated in Nzema East Municipal.
2.3.1. Inclusion Criteria
A case was only included in a study when diagnosed and initiated their treatment from January 1, 2018, to December 31, 2023.
2.3.2. Exclusion Criteria
A case was exempted from the study if they had no health records in the Nzema East TB register, were referred to continue their treatment in any facility outside Nzema East Municipal or were still undergoing treatment at the time of the study.
2.4. Sampling
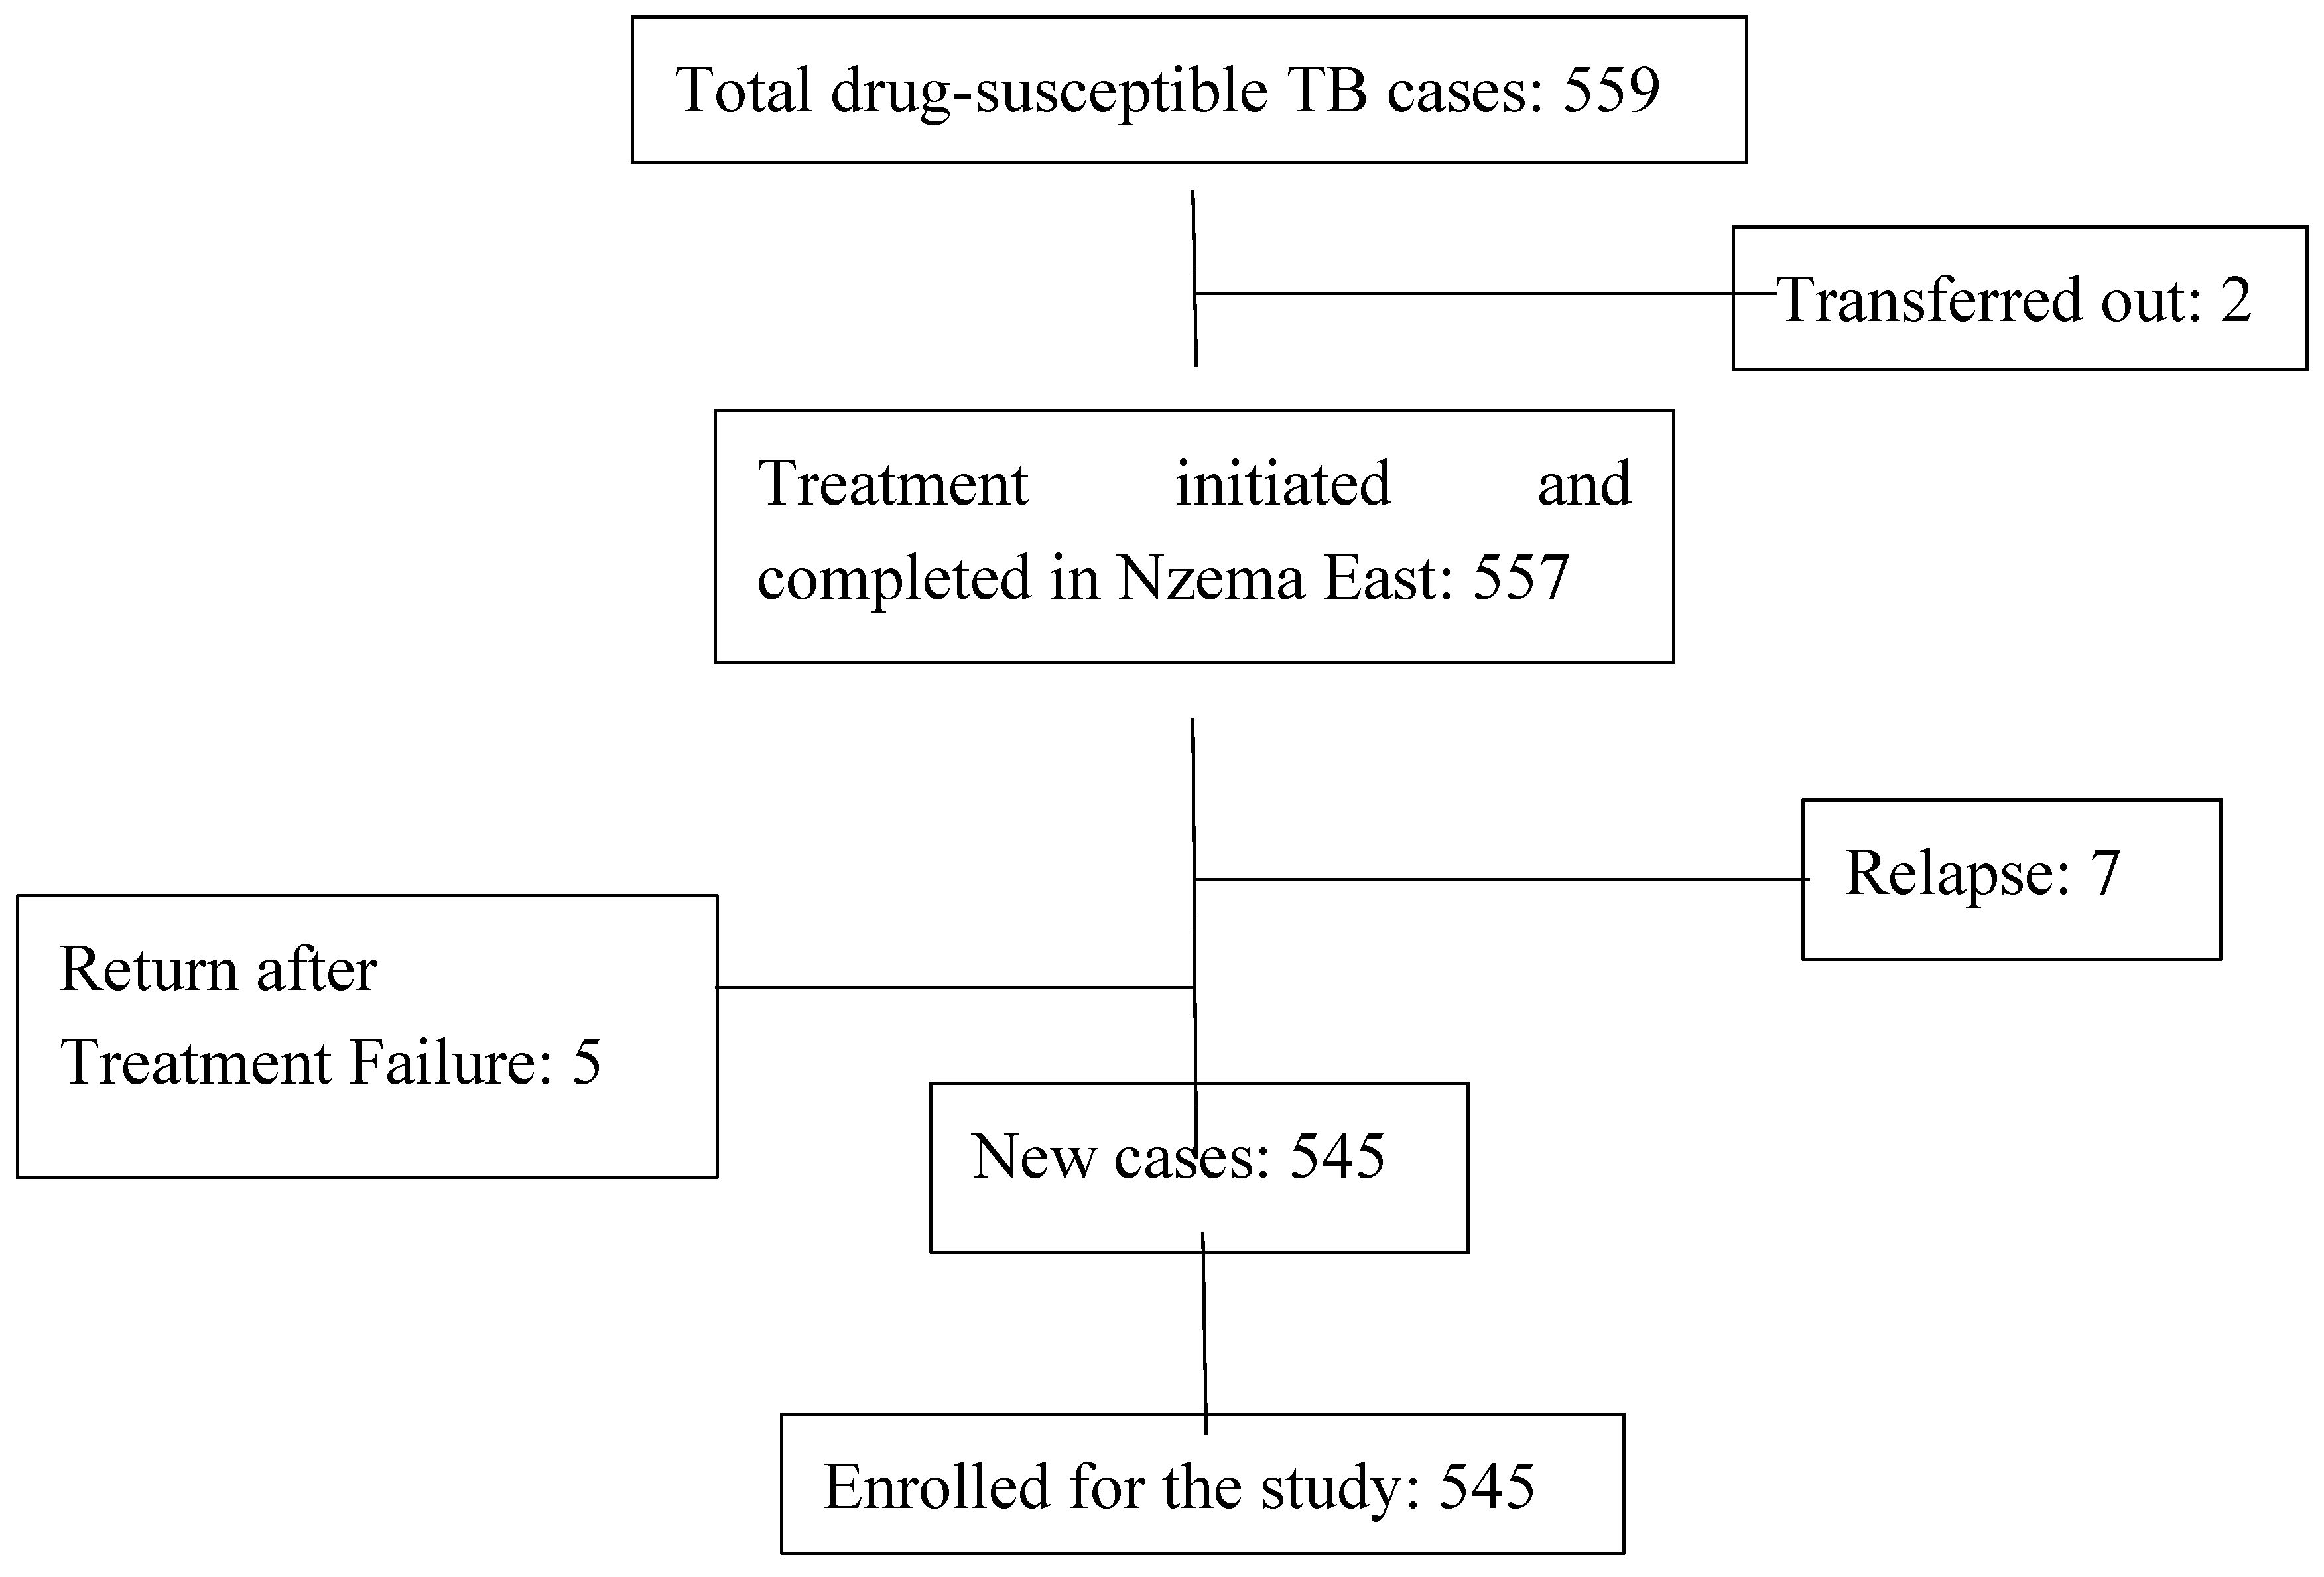
Using a total population sampling technique for this study, five hundred and forty-five (545) cases were eligible and were enrolled for this study.
Figure 1.
Flow chart of sampling of the study participants.
2.5. Study Variables
Dependent variables: Tuberculosis incidence distribution and Tuberculosis treatment outcome.
Independent variables: age, gender, date of TB treatment, disease site, follow-up test results, HIV status, subdistrict of residents, town or community of residents, type of location of residents (either urban or rural), and XY coordinates of the place of residents.
2.6. Data Collection Techniques and Tools
This study was entirely based on secondary data, specifically the Nzema East TB case registers from January 2018 to December 2023. A Microsoft Excel template was designed in English to collect the variables needed for this study electronically. Eight (8) trained Research Assistants collected the data, recruited from healthcare professionals already working in Nzema East.
2.7. Data Analysis
The extracted data was validated by the Nzema East Municipal TB Programme Coordinator to ensure the quality and accuracy of the data for the study. The data were analysed based on the specific objectives and depicted in tables and figures as appropriate.
2.7.1. Determining the Spatial Distribution of the TB Cases
The extracted data were exported into Esri ArcGIS Pro version 3.3.2 for analysis. The cases were georeferenced based on their residence address recorded in the register, which were used to identify their statistically significant distribution. All feature classes were projected into the Ghana Metre Grid coordinate system with metres as a unit of measurement. Spatial Autocorrelation (Global Moran’s I) was used to assess the spatial dependence of the TB cases, and the values were reported as z-scores, p-values, and Moran’s index. Kernel Density Estimation was performed to determine the magnitude of the occurrence of TB cases per square kilometre across the various settlements in the municipality. The data were further analysed using the Hotspot Analysis (Getis-Ord Gi*) tool to identify the statistically significant hotspot zones for the TB incidence in Nzema East Municipality.
2.7.2. Determining the Trend of TB Treatment Outcomes over Time
The data were exported to the US National Cancer Institute Joinpoint Regression Programme software version 5.2.0 to identify significant changes in TB treatment outcomes in Nzema East Municipality over time. The data were aggregated into six-monthly intervals for the six-year study period, analysed and reported as Half-year Percentage Change (HPC), p-values and confidence intervals.
2.7.3. Determining the Predictors of TB Treatment Outcomes
Pearson chi-square or Fisher’s exact test was used to determine the factors influencing the TB treatment outcomes, with STATA MP version 17. Binary logistics regression analysis was further done to assess the association of the individual categories of the variables and adjust for confounding [17,18]. The variables with p-values at or less than 0.15 in the Pearson Chi-square test or Fisher’s exact were purposely included in the multivariable logistics regression and reported as odds ratios and confidence intervals [19].
2.8. Ethical Considerations
The study obtained ethical approval from the Committee on Human Research, Publications and Ethics, Kwame Nkrumah University of Science and Technology, Ghana (CHRPE/AP/336/24), and from the Anglia Ruskin University Research Ethics Board, United Kingdom (ETH2324-6200). Moreover, local permission and approval for the study were sought from the Nzema East Municipal Health Administration using a formal letter of introduction.
Results
3.1. Demographic Characteristics
A total of 545 Tuberculosis cases were followed for this study. Among these 545, an estimated 68.26% were males. The youngest case was four (4) years old, and the average age among the cases was 41. About 60.00% of the cases were from the rural communities (Table 3.1).
3.2. Medical Information of the Cohort
Almost all (97.43%) of the cohort were diagnosed as pulmonary. About 427 (78.35%) of the 545 cases had at least one follow-up lab during treatment. The majority (28.25%) of the cohort started treatment in 2023. Approximately 8.81% of the cases were HIV positive (Table 3.2).
3.3. Spatial Distribution of the TB Cases
3.3.1. Global Moran’s I Summary
The TB incidence in Nzema East Municipality has a clustered pattern. The clustered spatial inference of the TB cases was statistically significant (p=0.00).
Figure 3.2.
Correlation of the TB Cases in Nzema East Municipality.
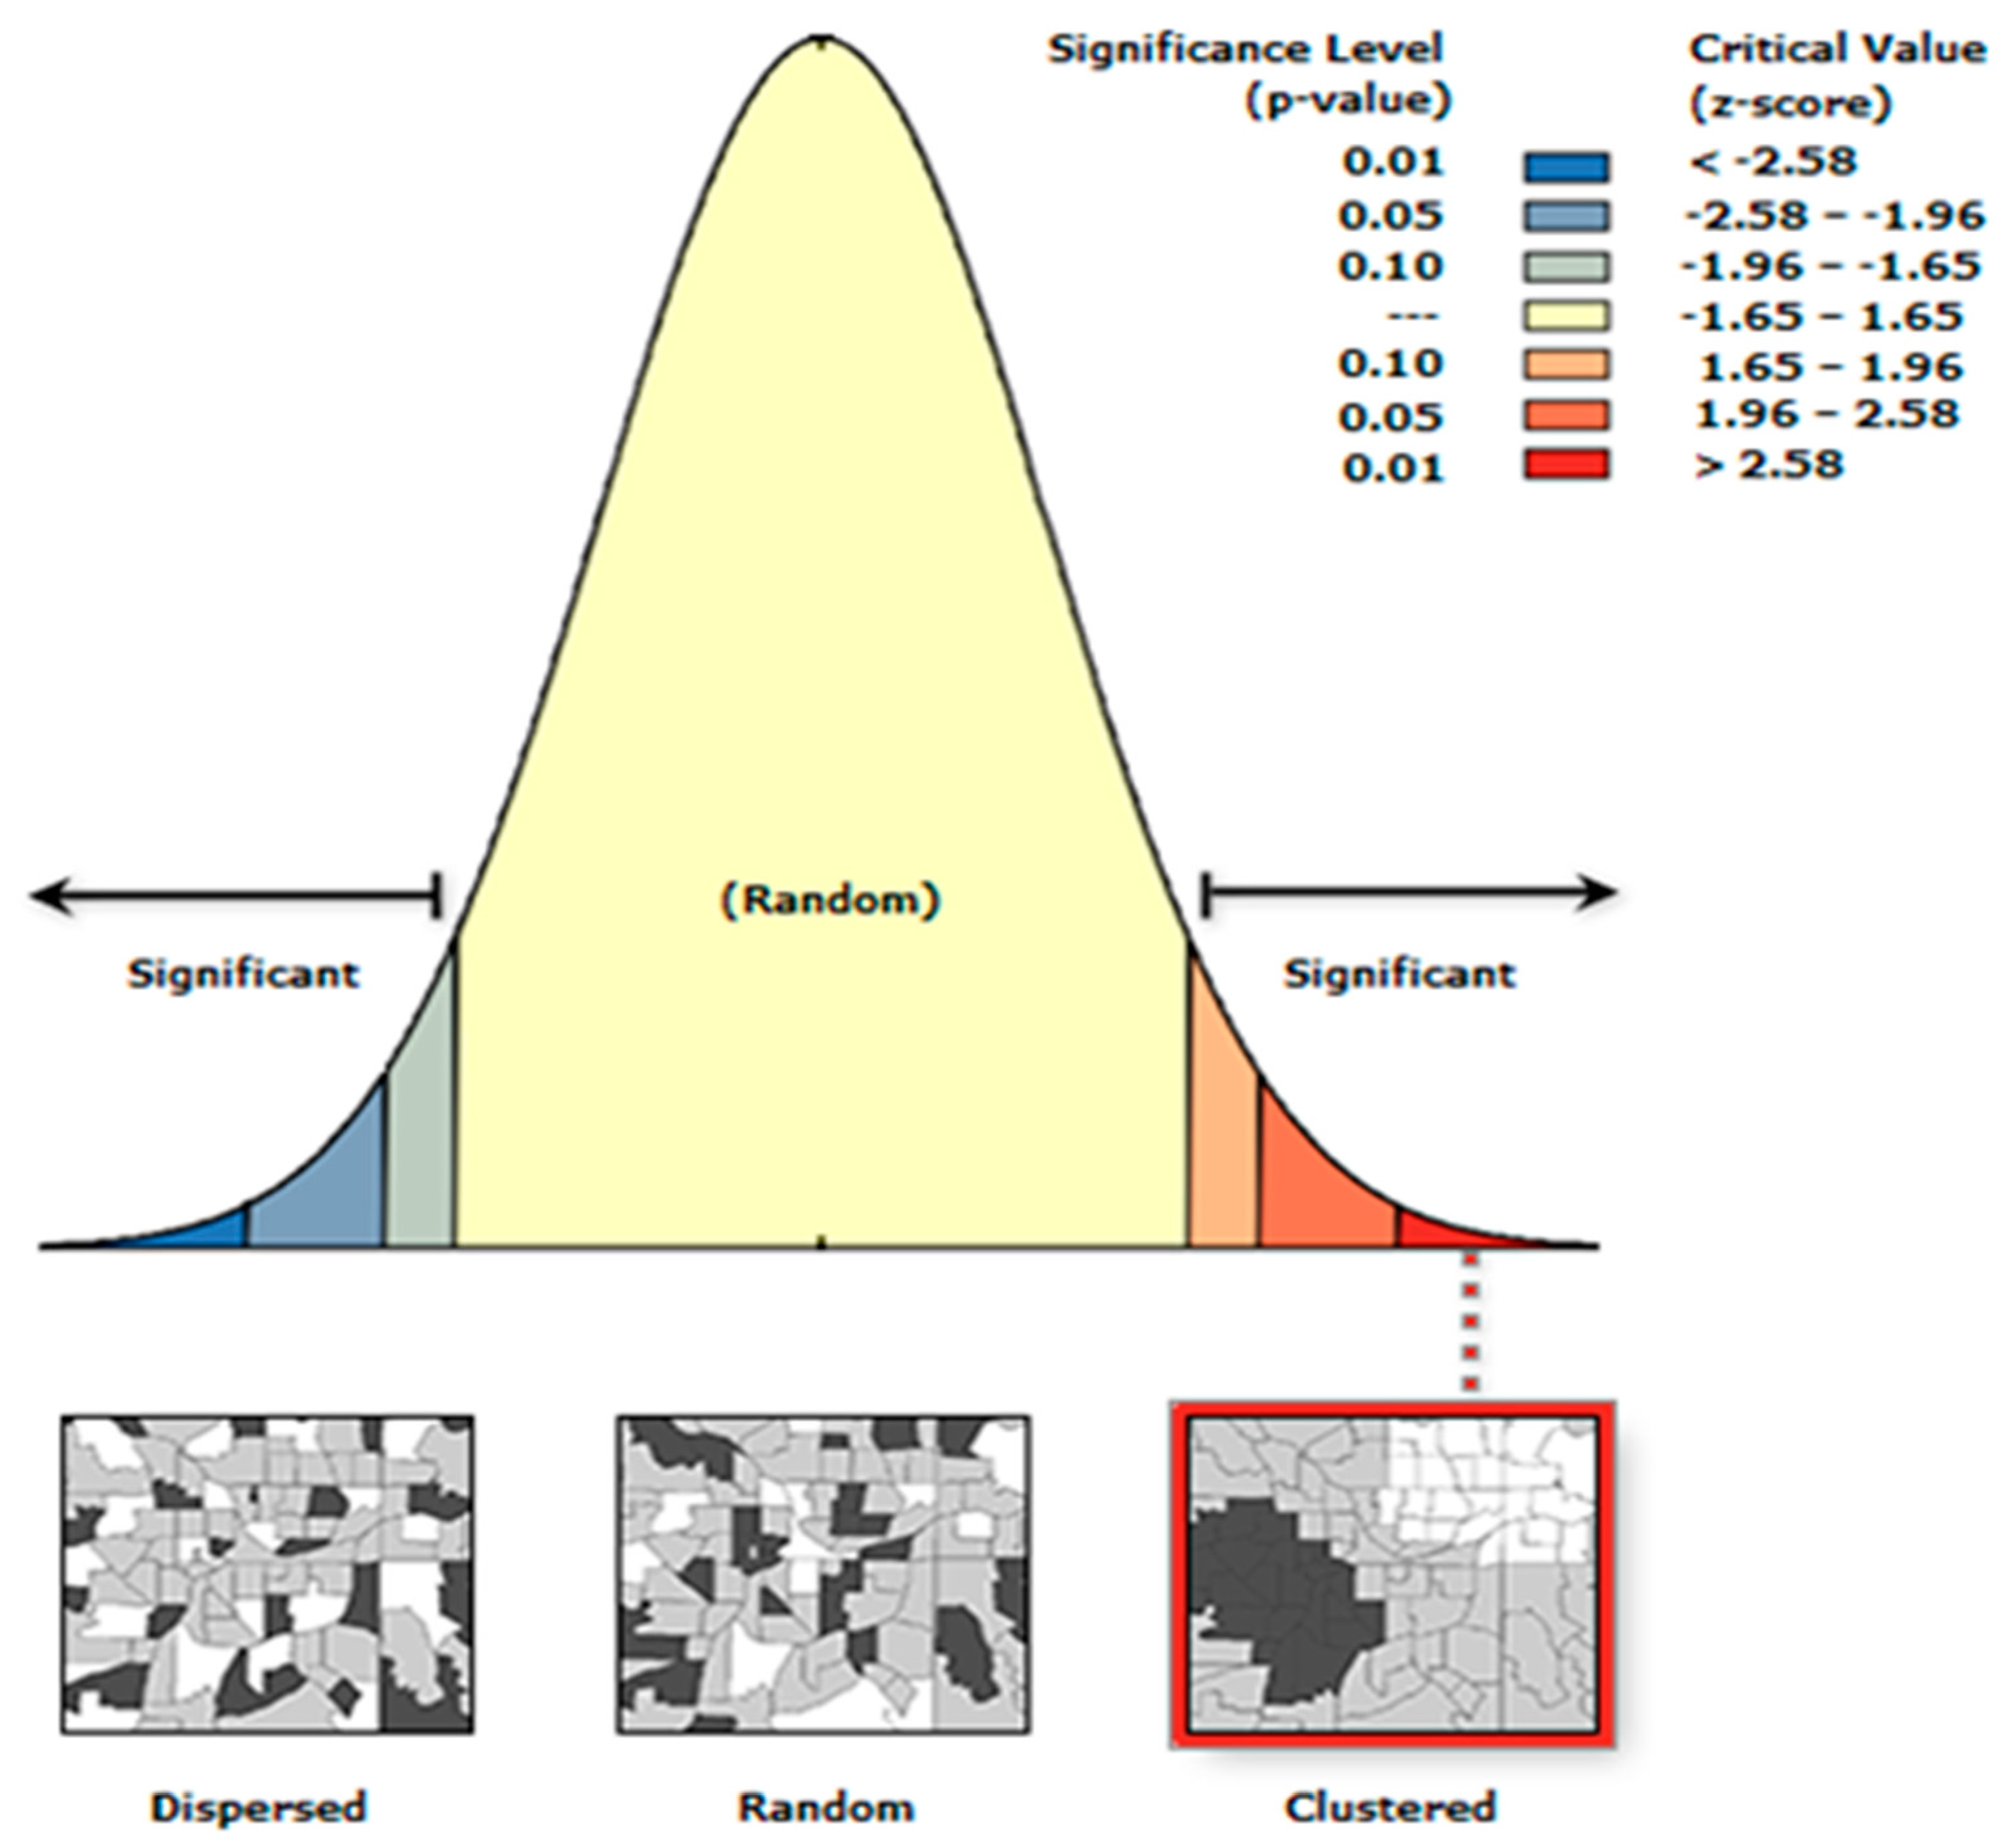

Table 3.3.
Spatial Correlation Summary.
| Characteristics | Value |
|---|---|
| Moran's Index | 0.03 |
| z-score | 19.04 |
| p-value | 0.00 |
3.3.2. Case Density and Hotspots
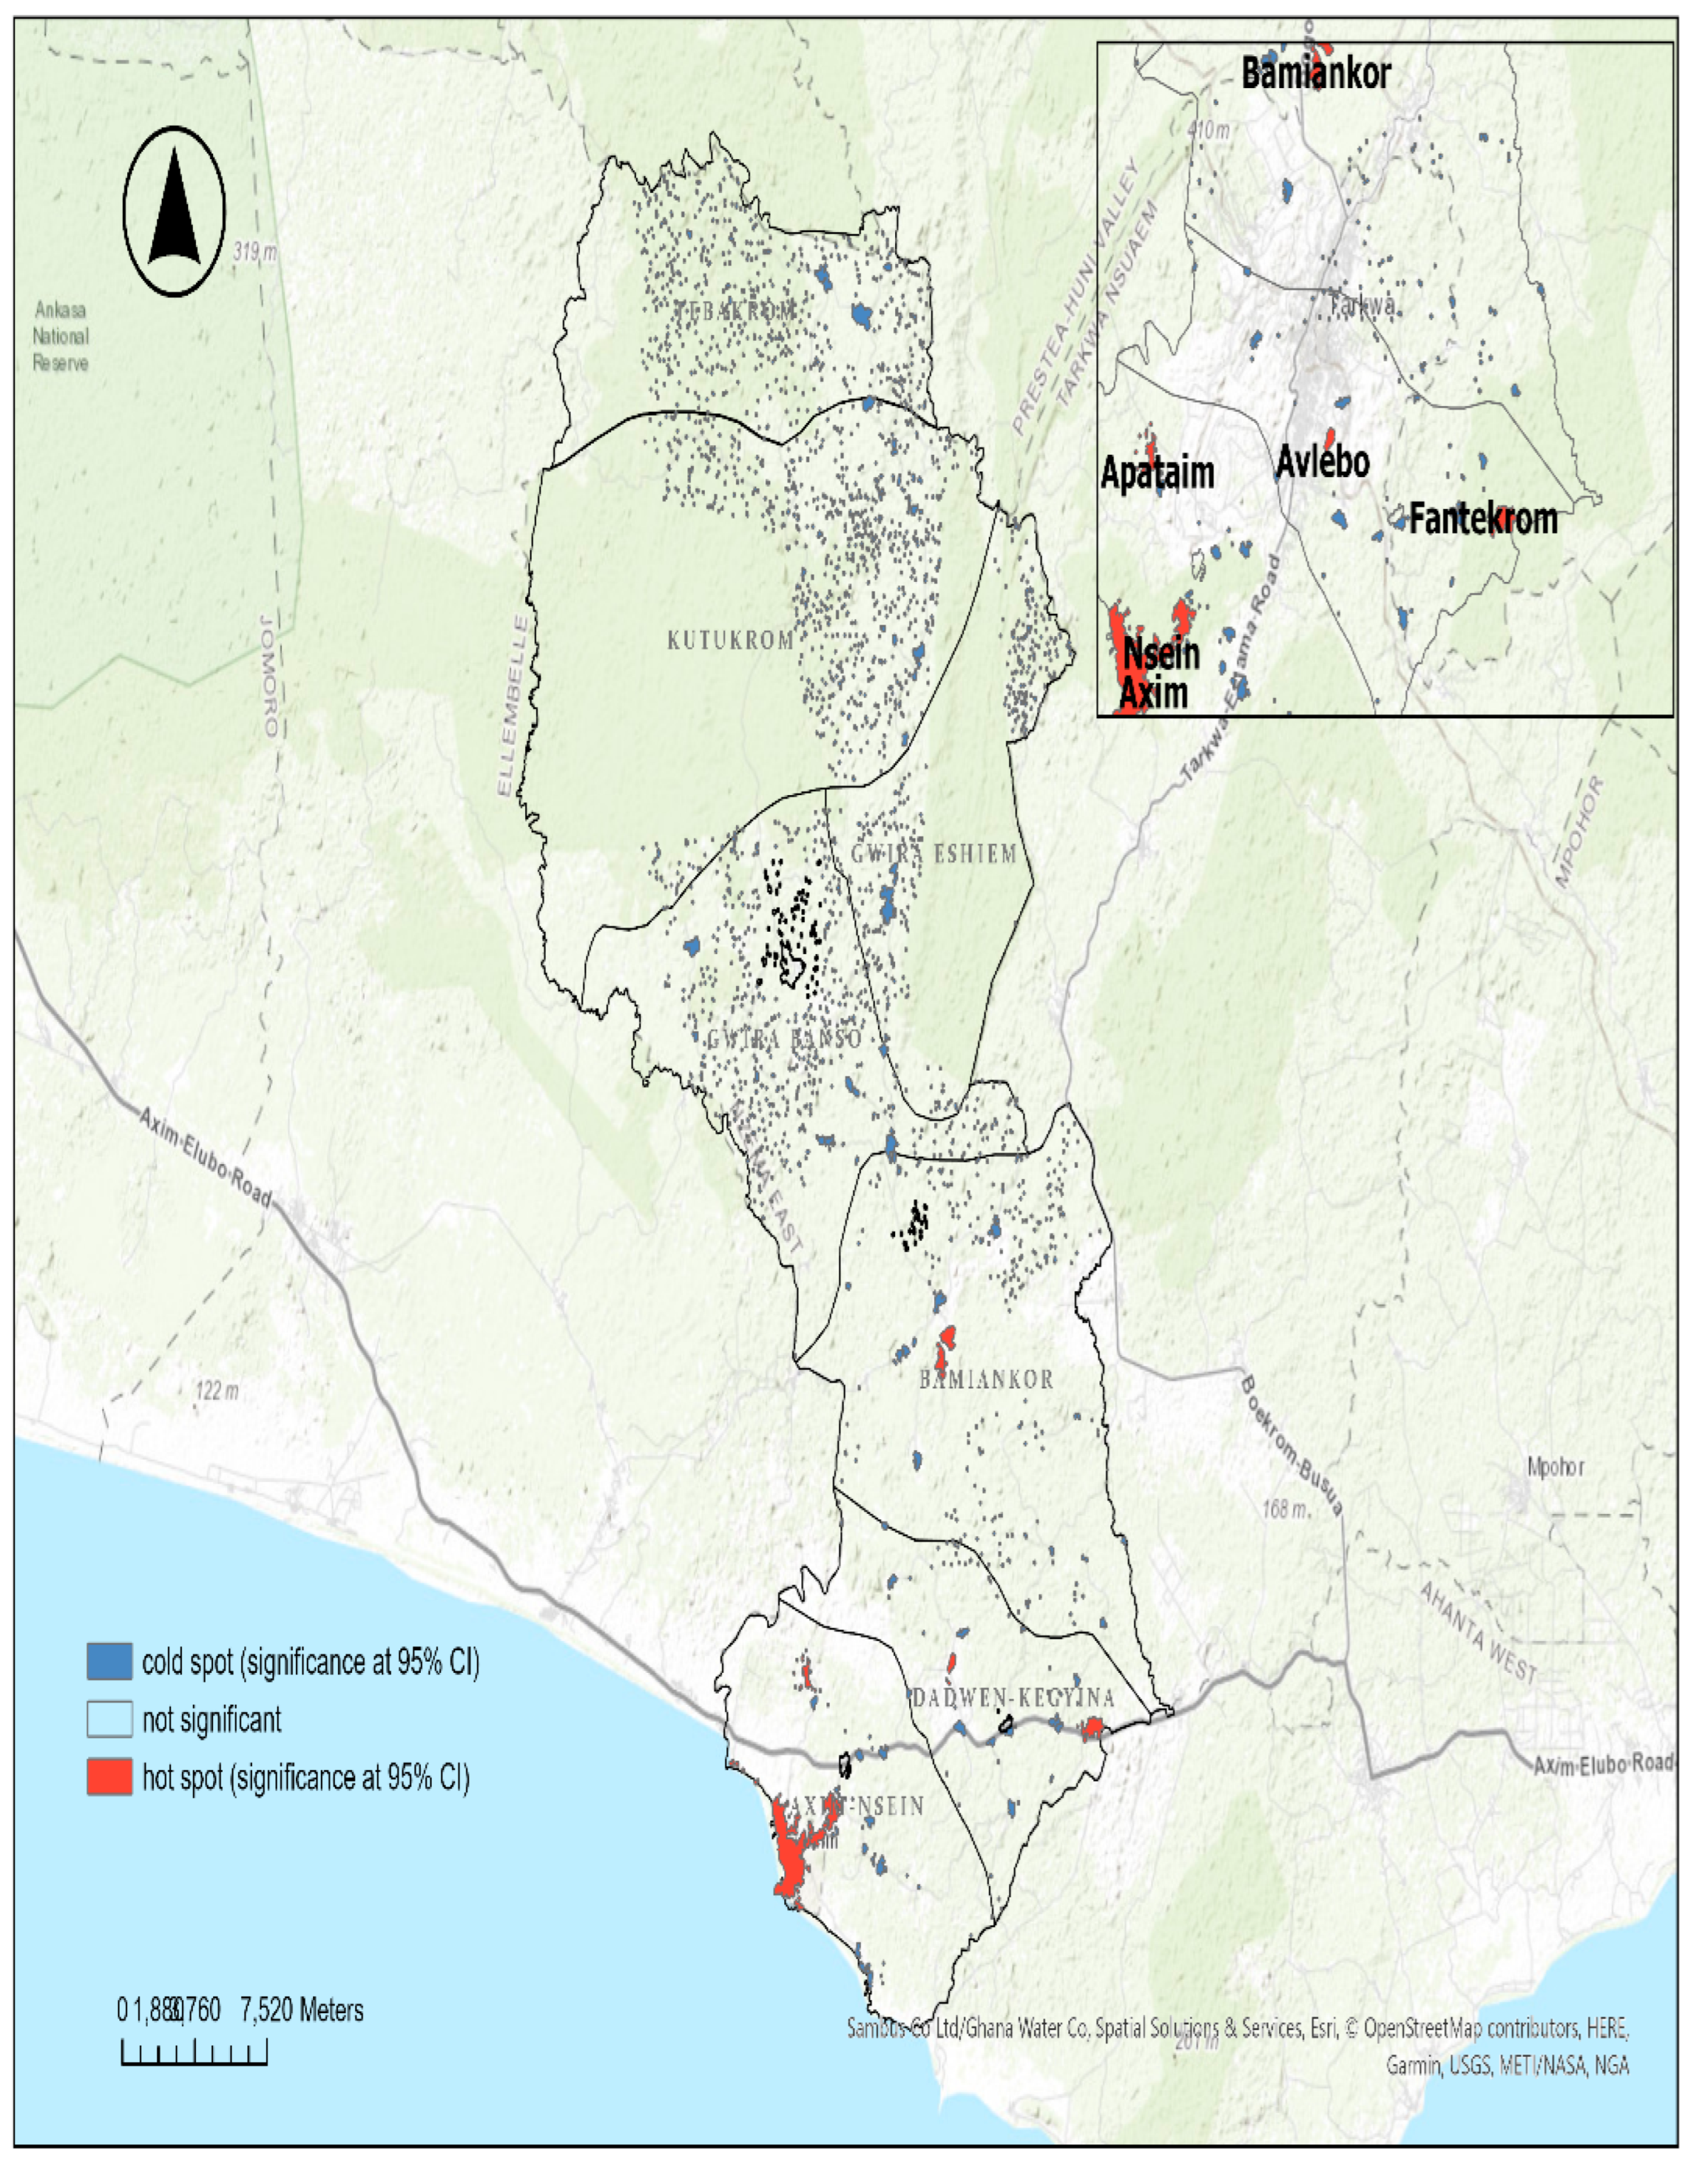
All the sub-municipals of Nzema East had at least one settlement highly dense with TB cases (2 to 26 TB-infected persons within a km2 range). Axim-Nsein and Dadwen-Kegyina sub-municipals had the majority of their settlements with two (2) to 26 TB-infected persons per km2. The Axim and Nsein settlements were inferred to be the major significant hotspot zones for TB incidence in the municipality. Other hotspot zones were found in Bamiankor, Apataim, Fantekrom, and Avlebo,
Figure 3.1 below shows the density of TB cases across the municipality. Figure 3.2 below shows the statistically significant TB hot and cold spot zones in Nzema East Municipality.
Figure 3.3.
Density of TB Cases in Nzema East, 2018-2023.

Figure 3.4.
Hotspot Zones of TB Incidence in Nzema East.
3.4. Tuberculosis Outcomes Treatment over Time
Overall, from 2018 to 2023, Nzema East recorded a 76.70% TB treatment success rate.
The Joinpoint Regression model found three (3) join points (Figure 3.4). The trend was segmented into four (4) changes. Details of the segments are depicted in Table 3.4. There was a statistically significant 18.12% decrease in the successful treatment outcome from the first half-year of 2018 to the end of 2020 (p=0.03). From the second half-year of 2020 to the first half-year of 2021, the municipality observed a 147.88% upward successful TB treatment rate. The change was statistically insignificant (p=0.14). A 7.04% increase in the successful TB treatment outcome was found from the first half-year of 2021 to the first half-year of 2023. The change was statistically insignificant (p=0.14). There was a significant 48.74% decrease in successful treatment from 2023H1 to 2023H2 (p=0.00).
Figure 5.
Overall TB Treatment Outcome.
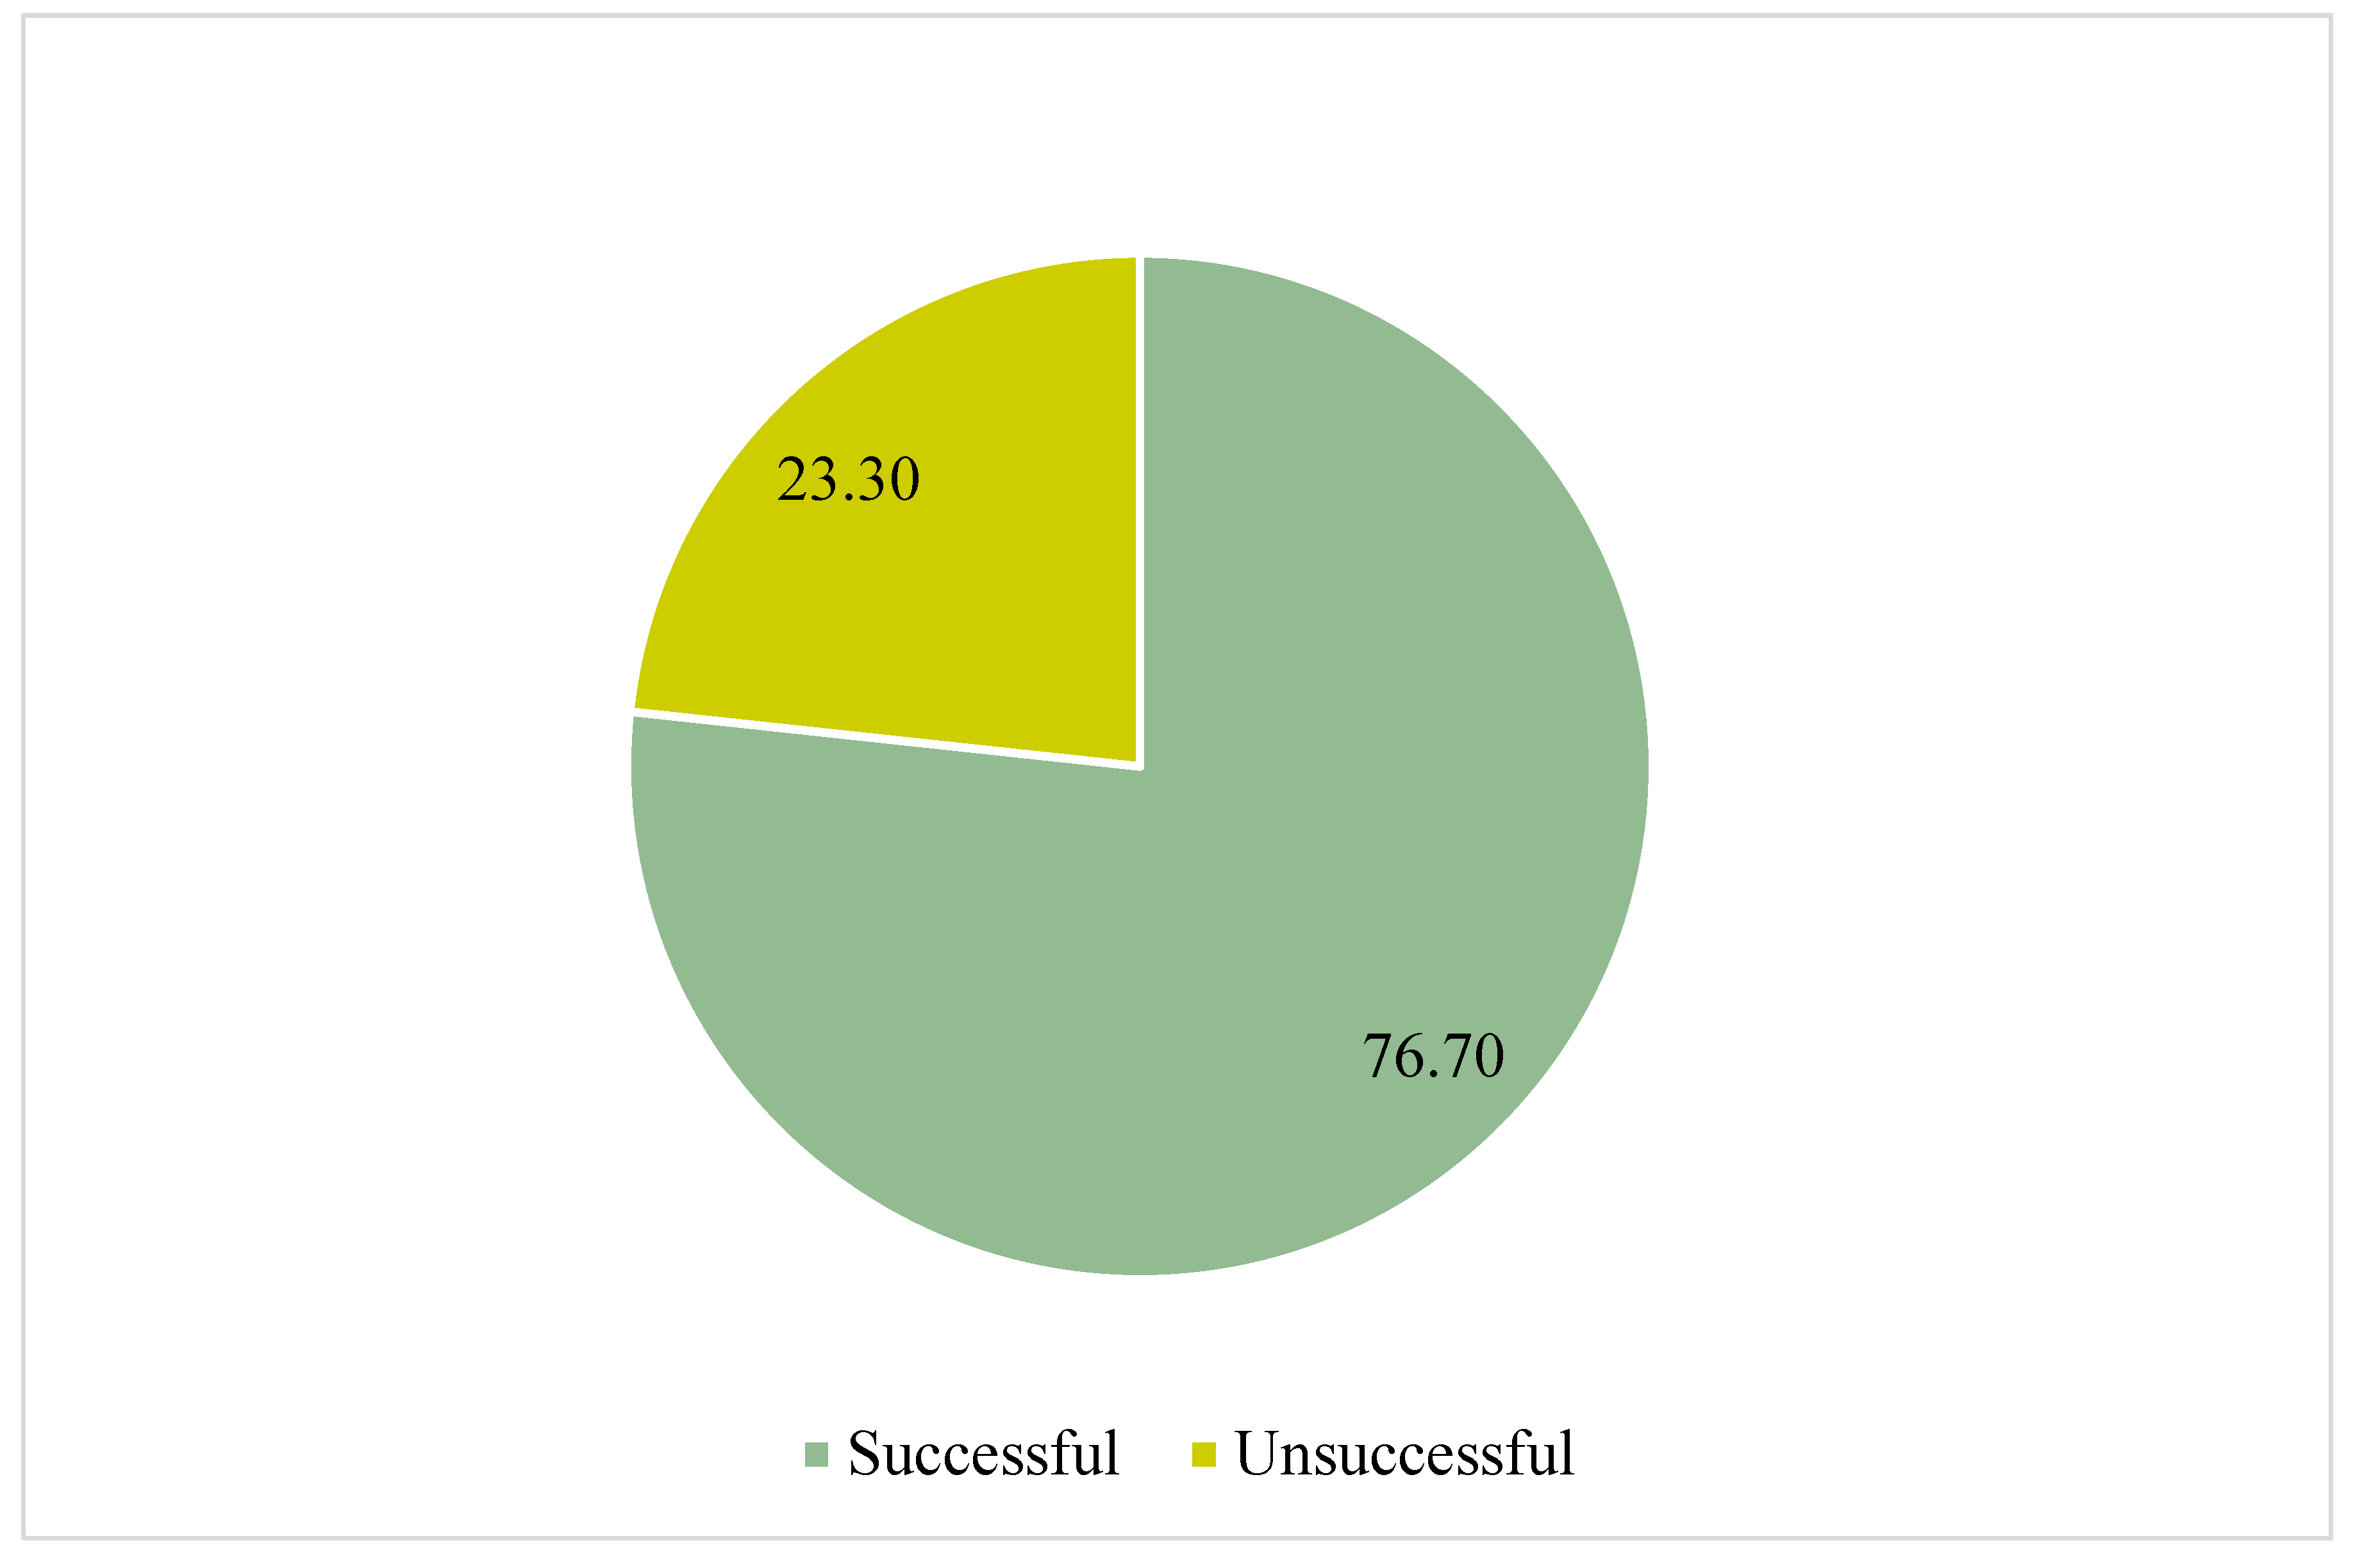
Figure 3.6.
Trend in Successful TB Treatment Outcomes.

Table 3.4.
Trend in the TB Treatment Outcomes, 2018 to 2023.
| Segment | HPC | 95% CI | P-Value |
|---|---|---|---|
| 2018H1 - 2020H2 | -18.12* | -29.25, -9.03 | 0.03 |
| 2020H2 - 2021H1 | 147.88 | -29.53, 236.13 | 0.14 |
| 2021H1-2023H1 | 7.04 | -3.20, 140.58 | 0.14 |
| 2023H1-2023H2 | -48.74* | -65.59, -6.79 | 0.00 |
* indicates the Half-year Percentage Change is statistically significant at 95% CI.
3.5. Predictors of Successful TB Treatment Outcome
3.5.1. Cross-Tabulation of Demographics and Treatment Outcome
There was no significant association between any of the demographic characteristics and the TB treatment outcomes. A comparative majority (24.41%) of the cohort who had unsuccessful treatment outcomes were from the ages of 25 to 34. The paediatrics (those aged below 15) contributed to 1.57% of those not successfully treated. More than half (64.57%) of the study group who were unsuccessfully treated for TB were males (Table 3.5).
3.5.2. Cross-Tabulation of Medical Characteristics and Treatment Outcomes
Table 3.6 below depicts the association between the cohort's medical characteristics and treatment outcomes. The association between either having at least one follow-up lab or not during treatment and the treatment outcomes were statistically significant (χ2=36.34, p=0.00). The year treatment started for the cohort was significantly associated with the TB treatment outcomes (χ2=30.53, p=0.00). A majority (91.34%) of the cohort who had an unsuccessful TB treatment were HIV-negative. Having a treatment supporter was significantly associated with TB treatment outcome (χ2=10.35, p=0.00). An estimated 81.89% of the cohort who had treatment supporters were unsuccessfully treated for TB.
3.5.3. Binary Logistics Regression Predicting the Factors Associated with Unsuccessful TB Treatment Outcome
The cohort aged 55 years and over had 46% more chances of having unsuccessful treatment compared to the paediatrics [aOR=1.46; 95% CI= 0.25-8.49]. The cases who had at least one follow-up lab were 75% less likely to have unsuccessful treatment compared to those who never had any follow-up lab during treatment [aOR = 0.25; 95% CI= 0.15-0.42]. The cases who started their treatment in 2020 were 297% more likely to have unsuccessful treatment outcomes compared to those who started theirs in 2018 [aOR=2.97; 95%CI= 1.30, 6.8]. Cases who had treatment supporters had a 57% lesser chance of having unsuccessful treatment outcomes compared to those who did not [aOR=0.43; 95% CI = 0.23, 0.80].
Table 3.7 below shows detailed predictors of unsuccessful TB treatment outcomes among the cohort.
Discussion
The global burden of tuberculosis (TB) remains a significant public health concern, with disparate geographical incidence patterns and treatment outcomes observed across different regions. This study evidenced the spatial distribution of TB incidence, analysed treatment outcomes over time, and identified key predictors of treatment outcomes in Nzema East Municipality, Ghana, providing valuable insights for effective TB interventions and policy formulation and implementation.
4.1. Geospatial Distribution of the TB Cases
The significant cluster pattern of TB cases identified through Moran's I Autocorrelation in this study suggests that the distribution of TB in Nzema East is non-random and shows spatial dependence. This variation in TB incidence in Nzema East aligns with previous studies conducted in other regions. For example, the study by Tomita et al. [20] in South Africa also identified significant spatial clustering of TB cases. Additionally, a recent study in Ghana by Iddrisu, Amikiya and Bukari, [21] supports the findings of this current study. Similarly, Abdul et al., [22] found a significant clustering of TB cases in Ghana. This clustering of TB indicates that certain areas within Nzema East are more susceptible to TB transmission. Consequently, the universal approach to TB control is unlikely to be effective. Instead, targeted interventions tailored to the specific characteristics of different geographic areas are crucial in preventing and controlling Tuberculosis.
The Kernel Density analysis in this study further corroborated this clustering pattern by identifying areas of highly dense TB incidence across all subdistricts of Nzema East. This ubiquitous incidence of high TB density in at least one settlement in each of the seven (7) sub-municipals indicates that TB is a widespread concern throughout the municipality. However, some of the settlements were more burdened with TB than others.
The Hotspot analysis yielded noteworthy results, identifying higher hotspot zones. The central hotspot zones were found in Axim and Nsein, urban cluster areas with a high population density. Identifying hotspots in population-dense areas is consistent with the known transmission dynamics of TB. As indicated by Teibo et al. [23], higher population density is a major predictor of higher TB incidence. Higher population density often correlates with increased close contact between individuals, facilitating the airborne spread of Mycobacterium tuberculosis [24]. This finding emphasises the importance of urban planning and housing policies that can mitigate overcrowding and improve ventilation in densely populated areas.
Another significant finding is the presence of hotspots in Bamiankor, Avlebo, Apataim, and Fantekrom, small-scale mining communities in Nzema East Municipality. This aligns with existing research on the heightened TB risk among miners, including those in artisanal and small-scale gold mining operations [25]. The elevated TB incidence in mining communities can be attributed to several factors, including exposure to silica dust, which increases susceptibility to TB, and higher HIV prevalence in those communities [26]. These findings collectively point to the complex interplay of occupational, environmental, and socioeconomic factors in shaping the spatial distribution of TB in the Nzema East.
4.2. Trend of TB Treatment Outcomes
Overall, the treatment success rate for the study period was not encouraging, 76.70%, about 13% less than the recommended target by the End TB Strategy [1]. Comparatively, a retrospective study of the 2013 to 2017 cohort conducted in the Volta region of Ghana found an overall TB treatment success rate of 82.5%, although higher than that recorded in this study, but also not up to the recommended 90% minimum success rate by the End TB Strategy [27]. This menace demands immediate strategies for scaling up the treatment outcomes.
Specifically, the trend of tuberculosis treatment outcomes revealed a complex pattern of changes in treatment success rates over the study period. There was a statistically significant decrease in successful TB treatment outcomes from the first half-year of 2018 to the second half-year of 2020. This decline could be attributed to numerous factors, including disruptions caused by the COVID-19 pandemic. Globally, the pandemic led to a sharp reversal of progress in TB treatment coverage, which dropped to levels seen by the end of 2020. This period of decline aligns with global trends where treatment success rates remained static or decreased due to healthcare disruptions and resource reallocations during the pandemic [28].
Following this period, from the second half-year of 2020 to the first half-year of 2021, an increase in successful TB treatment rates was observed, although this change was statistically insignificant. This improvement may reflect the initial recovery efforts and adaptations in healthcare systems to resume TB treatment services. However, the lack of statistical significance suggests that this recovery may have happened by chance.
A significant decrease in successful treatment outcomes was noted from the first half-year of 2023 to the second half-year of 2023. This recent decline could be indicative of ongoing challenges, such as drug resistance and socio-economic factors impacting treatment adherence. Studies have shown that factors like multidrug resistance and socioeconomic barriers significantly affect TB treatment outcomes [29,30].
4.3. Predictors of Tuberculosis Treatment Outcomes
Follow-up laboratory tests during treatment, treatment supporters, and the year treatment was initiated emerged as significant factors influencing TB treatment outcomes.
Comparatively, a systematic review and meta-analysis by Alipanah et al. [31] highlighted the importance of Directly Observed Therapy (DOT) by families and providing psychological support in improving treatment outcomes. Alipanah et al. [31] posited that treatment success rates were higher when patients received ongoing support, similar to the role of treatment supporters in this current study. The presence of a treatment supporter in this study was associated with a 57% reduction in the likelihood of unsuccessful treatment outcomes, underscoring the critical role of psychosocial support in TB management [32].
Moreover, this study found that patients with at least one follow-up lab were 75% less likely to experience unsuccessful treatment outcomes, consistent with other research emphasising the importance of regular monitoring. Regular follow-up during medications allows timely identification and management of complications or non-adherence, thereby improving treatment success rates [33,34]. The follow-ups during treatment ensure the patients' contact with healthcare providers, who in turn provide counselling and support.
Conclusion and Recommendations
5.1. Conclusion
The study has revealed a concerning spatial clustering of TB cases within Nzema East Municipality, characterised by highly dense TB incidence. Notably, hot spot zones were identified in densely populated and mining communities, highlighting the need for targeted interventions. The study further propounded a concerning decline in successful TB treatment outcomes, which fell below the recommended targets of the End TB Strategy. This decline was evident from the first half of 2018 to the end of 2020 and from the first to the second half of 2023. Factors such as follow-up laboratory tests, treatment support, and the year treatment commenced were statistically significant predictors of TB treatment outcomes. These findings highlight the complex interplay of socio-demographic, environmental and programmatic factors influencing TB transmission and treatment success, underscoring the importance of addressing the spatial and temporal factors in TB control efforts.
5.2. Limitations of the Study
- The complete use of secondary data for this study may have introduced potential biases due to the data accuracy. However, the data was extracted twice by two groups, which was validated, and any errors found were duly amended as appropriate. This would limit the potential biases that could have been introduced during the data collection.
- The study may not have fully accounted for potential confounding variables due to the sole use of secondary data, which does not capture the wider determinants.
5.3. Recommendations
5.3.1. For Policymakers
- Implement focused TB control measures in hotspot zones, especially in densely populated and mining communities, including increased screening, awareness campaigns, and community engagement to reduce transmission rates.
- Strengthen the role of TB treatment supporters to improve adherence and treatment success. Training and deploying community health workers to provide support and follow-up can be crucial in these high-risk areas.
- Ensure that patients have at least one follow-up laboratory test during their treatment. This can help detect adverse treatment outcomes early and adjust therapy as needed.
- Incorporating multisectoral approaches, such as involving mining companies in formulating and implementing TB control strategies.
5.3.2. For Future Research
- Prospective studies using primary data are recommended in future research to identify the wider determinants of TB treatment outcomes.
- Future research should expand the geographical area and use a longer period to capture more comprehensive trends and variations in TB incidence and treatment outcomes.
References
- World Health Organisation. Global tuberculosis report 2024 [Internet]. Geneva: 2024. Available from: https://www.who.int/teams/global-tuberculosis-programme/tb-reports.
- Talip BA, Sleator RD, Lowery CJ, Dooley JSG, Snelling WJ. An Update on Global Tuberculosis (TB). Infectious Diseases: Research and Treatment [Internet] 2013;6(1):39–50. Available from: https://www.ncbi.nlm.nih.gov/pmc/articles/PMC3988623/.
- Houben RMGJ, Dodd PJ. The Global Burden of Latent Tuberculosis Infection: A Re-estimation Using Mathematical Modelling. PLoS Med [Internet] 2016;13(10):e1002152. Available from: https://doi.org/10.1371/journal.pmed.1002152. [CrossRef]
- Cohen A, Mathiasen VD, Schön T, Wejse C. The global prevalence of latent tuberculosis: a systematic review and meta-analysis. Eur Respir J 2019;54(3):1900655. [CrossRef]
- Behr MA, Edelstein PH, Ramakrishnan L. Revisiting the timetable of tuberculosis. BMJ 2018;362(1):k2738. [CrossRef]
- Brett K, Dulong C, Severn M. Tuberculosis in People with Compromised Immunity: A Review of Guidelines [Internet]. Ottawa (ON): Canadian Agency for Drugs and Technologies in Health; 2020. Available from: http://www.ncbi.nlm.nih.gov/books/NBK562936/.
- World Health Organisation. Implementing the TB strategy: The Essentials, 2022 update [Internet]. Geneva: 2022. Available from: https://www.who.int/publications/i/item/9789240065093.
- Ministry of Health. 2022 Holistic Assessment Report [Internet]. Accra: 2023. Available from: https://www.moh.gov.gh/annual-reviews/.
- Agyare SA, Osei FA, Odoom SF, Mensah NK, Amanor E, Martyn-Dickens C, et al. Treatment Outcomes and Associated Factors in Tuberculosis Patients at Atwima Nwabiagya District, Ashanti Region, Ghana: A Ten-Year Retrospective Study. Tuberc Res Treat 2021;2021(1):9952806. [CrossRef]
- Bonsu EO, Addo IY, Adjei BN, Alhassan MM, Nakua EK. Prevalence, treatment outcomes and determinants of TB–HIV coinfection: a 10-year retrospective review of TB registry in Kwabre East Municipality of Ghana. BMJ Open [Internet] 2023;13(3):e067613. Available from: https://bmjopen.bmj.com/content/13/3/e067613.
- Chimeh RA, Gafar F, Pradipta IS, Akkerman OW, Hak E, Alffenaar JWC, et al. Clinical and economic impact of medication non-adherence in drug-susceptible tuberculosis: a systematic review. The International Journal of Tuberculosis and Lung Disease 2020;24(8):811–9. [CrossRef]
- Liu L, Zhu Z, Dulberger D, Stanley S, Wilson W, Chung C, et al. Tuberculosis treatment failure associated with evolution of antibiotic resilience. Science (1979) [Internet] 2022;378(6624):1111–8. Available from: https://doi.org/10.1126/science.abq2787. [CrossRef]
- Soedarsono S, Mertaniasih NM, Kusmiati T, Permatasari A, Ilahi WK, Anggraeni AT. Characteristics of Previous Tuberculosis Treatment History in Patients with Treatment Failure and the Impact on Acquired Drug-Resistant Tuberculosis. Antibiotics 2023;12(3):598. [CrossRef]
- Nzema East Health Administration. 2023 Annual Report. 2024.
- Camargo LMA, Silva RPM, Meneguetti DUDO. Research methodology topics: Cohort studies or prospective and retrospective cohort studies. Journal of Human Growth and Development 2019;29(3):433–6. [CrossRef]
- Pearson DR, Werth VP. Geospatial Correlation of Amyopathic Dermatomyositis With Fixed Sources of Airborne Pollution: A Retrospective Cohort Study. Front Med (Lausanne) 2019;6(1):85. [CrossRef]
- Xu W, Zhao Y, Nian S, Feng L, Bai X, Luo X, et al. Differential analysis of disease risk assessment using binary logistic regression with different analysis strategies. Journal of International Medical Research 2018;46(9):3656. [CrossRef]
- Zabor EC, Reddy CA, Tendulkar RD, Patil S. Logistic Regression in Clinical Studies. International Journal of Radiation Oncology*Biology*Physics 2022;112(2):271.
- Chowdhury MZI, Turin TC. Variable selection strategies and its importance in clinical prediction modelling. Fam Med Community Health 2020;8(1):e000262. [CrossRef]
- Tomita A, Smith CM, Lessells RJ, Pym A, Grant AD, Oliveira T De, et al. Space-time clustering of recently-diagnosed tuberculosis and impact of ART scale-up: Evidence from an HIV hyper-endemic rural South African population. Sci Rep 2019;9(1):10724. [CrossRef]
- Iddrisu AK, Amikiya EA, Bukari FK. Spatio-temporal characteristics of Tuberculosis in Ghana. F1000Res 2023;11(1):200.
- Abdul IW, Ankamah S, Iddrisu AK, Danso E. Space-time analysis and mapping of prevalence rate of tuberculosis in Ghana. Sci Afr [Internet] 2020;7(2):e00307. Available from: https://www.sciencedirect.com/science/article/pii/S2468227620300454. [CrossRef]
- Teibo TKA, Andrade RLDP, Rosa RJ, Tavares RBV, Berra TZ, Arcêncio RA. Geo-spatial high-risk clusters of Tuberculosis in the global general population: a systematic review. BMC Public Health 2023;23(1):1586. [CrossRef]
- Coleman M, Martinez L, Theron G, Wood R, Marais B. Mycobacterium tuberculosis Transmission in High-Incidence Settings—New Paradigms and Insights. Pathogens 2022;11(11):1228. [CrossRef]
- Ohene SA, Bonsu F, Adusi-Poku Y, Dzata F, Bakker M. Case finding of tuberculosis among mining communities in Ghana. PLoS One 2021;16(3):e0248718. [CrossRef]
- Mbuya AW, Mboya IB, Semvua HH, Mamuya SH, Msuya SE. Prevalence and factors associated with tuberculosis among the mining communities in Mererani, Tanzania. PLoS One 2023;18(3):e0280396. [CrossRef]
- Osei E, Oppong S, Adanfo D, Doepe BA, Owusu A, Kupour AG, et al. Reflecting on tuberculosis case notification and treatment outcomes in the Volta region of Ghana: a retrospective pool analysis of a multicentre cohort from 2013 to 2017. Glob Health Res Policy 2019;4(1):37. [CrossRef]
- World Health Organisation. Global Tuberculosis Report 2023 [Internet]. Geneva: 2023. Available from: https://www.who.int/teams/global-tuberculosis-programme/tb-reports/global-tuberculosis-report-2023.
- Ebrahimpour S, Saleki K, Agazhu HW, Assefa ZM, Beshir T, Tadesse H, et al. Treatment outcomes and associated factors among tuberculosis patients attending Gurage Zone Public Hospital, Southern Nations, Nationalities, and People’s Region, Ethiopia: an institution-based cross-sectional study. Front Med (Lausanne) 2023;10(1):1105911.
- Torres NMC, Rodríguez JJQ, Andrade PSP, Arriaga MB, Netto EM. Factors predictive of the success of tuberculosis treatment: A systematic review with meta-analysis. PLoS One 2019;14(12):e0226507. [CrossRef]
- Alipanah N, Jarlsberg L, Miller C, Linh NN, Falzon D, Jaramillo E, et al. Adherence interventions and outcomes of tuberculosis treatment: A systematic review and meta-analysis of trials and observational studies. PLoS Med 2018;15(7):e1002595. [CrossRef]
- Maynard C, Tariq S, Sotgiu G, Migliori GB, van den Boom M, Field N. Psychosocial support interventions to improve treatment outcomes for people living with tuberculosis: a mixed methods systematic review and meta-analysis. EClinicalMedicine [Internet] 2023;61(1):102057. Available from: https://www.sciencedirect.com/science/article/pii/S2589537023002341. [CrossRef]
- Appiah MA, Arthur JA, Asampong E, Kamau EM, Gborgblorvor D, Solaga P, et al. Health service providers’ perspective on barriers and strategies to tuberculosis treatment adherence in Obuasi Municipal and Obuasi East District in the Ashanti region, Ghana: a qualitative study. Discover Health Systems 2024;3(1).
- Faridi KF, Peterson ED, McCoy LA, Thomas L, Enriquez J, Wang TY. Timing of First Postdischarge Follow-up and Medication Adherence After Acute Myocardial Infarction. JAMA Cardiol [Internet] 2016;1(2):147–55. Available from: https://doi.org/10.1001/jamacardio.2016.0001. [CrossRef]
Table 3.1.
Demographic Characteristics of the Cohort.
| Characteristics | Frequency (n=545) | Percentage (%) |
|---|---|---|
| Age group (years): | ||
| 4-14 | 8 | 1.47 |
| 15-24 | 60 | 11.01 |
| 25-34 | 116 | 21.28 |
| 35-44 | 150 | 27.52 |
| 45-54 | 130 | 23.85 |
| 55+ | 81 | 14.86 |
| Mean age (SD): | 41 (14.16) | |
| Gender: | ||
| female | 173 | 31.74 |
| male | 372 | 68.26 |
| Residence category: | ||
| rural | 327 | 60.00 |
| urban | 218 | 40.00 |
Table 3.2.
Clinical Characteristics of the Study Group.
| Characteristics | Frequency (n=545) | Percentage (%) |
|---|---|---|
| Infection site: | ||
| extra Pulmonary | 14 | 2.57 |
| pulmonary | 531 | 97.43 |
| At least one follow-up lab: | ||
| no | 118 | 21.65 |
| yes | 427 | 78.35 |
| Year of treatment start: | ||
| 2018 | 68 | 12.48 |
| 2019 | 85 | 15.6 |
| 2020 | 63 | 11.56 |
| 2021 | 79 | 14.5 |
| 2022 | 96 | 17.61 |
| 2023 | 154 | 28.25 |
| HIV status: | ||
| negative | 497 | 91.19 |
| positive | 48 | 8.81 |
Table 3.5.
Contingency Table of Demographics and TB Treatment Outcomes.
| Characteristics | Treatment Outcome | χ2 | P-value | |
|---|---|---|---|---|
| Successful | Unsuccessful | |||
| Age group: | 8.19 | 0.14a | ||
| <15 | 6(1.44) | 2(1.57) | ||
| 15-24 | 49(11.72) | 11(8.66) | ||
| 25-34 | 85(20.33) | 31(24.41) | ||
| 35-44 | 122(29.19) | 28(22.05) | ||
| 45-54 | 102(24.40) | 28(22.05) | ||
| 55+ | 54(12.92) | 27(21.26) | ||
| Gender: | 1.04 | 0.31 | ||
| female | 128(30.62) | 45(35.43) | ||
| male | 290(69.38) | 82(64.57) | ||
| Residents’ category: | ||||
| rural | 243(58.13) | 84(66.14) | 2.60 | 0.11 |
| urban | 174(41.87) | 43(33.86) | ||
a indicates that Fisher’s Exact was used.
Table 3.6.
Contingency Table of the Medical Characteristics and TB Treatment Outcomes.
| Characteristics | Treatment Outcome | χ2 | P-value | |
|---|---|---|---|---|
| Infection site: | Successful | Unsuccessful | ||
| Extra Pulmonary | 12(2.87) | 2(1.57) | 0.65 | 0.33a |
| Pulmonary | 406(97.13) | 125(98.43) | ||
| At least one follow-up lab: | ||||
| no | 66(15.79) | 52(40.94) | 36.34 | 0.00* |
| yes | 352(84.21) | 75(59.06) | ||
| Year of treatment start: | ||||
| 2018 | 55(13.16) | 13(10.24) | 30.53 | 0.00* |
| 2019 | 59(14.11) | 26(20.47) | ||
| 2020 | 33(7.89) | 30(23.62) | ||
| 2021 | 66(15.79) | 13(10.24) | ||
| 2022 | 81(19.38) | 15(11.81) | ||
| 2023 | 124(29.67) | 30(23.62) | ||
| Treatment support: | ||||
| no | 34(8.13) | 23(18.11) | 10.35 | 0.00* |
| yes | 384(91.87) | 104(81.89) | ||
| HIV status: | ||||
| negative | 381(91.15) | 116(91.34) | 0.03 | 0.94 |
| positive | 37(8.85) | 11(8.66) | ||
a indicates that Fisher’s Exact was used. * indicates statistically significant at 95% CI.
Table 3.7.
Associated Factors of Unsuccessful Treatment Outcome.
| Characteristics | Treatment Outcome (Unsuccessful) | |
|---|---|---|
| cOR [95% CI] | aOR [95% CI] | |
| Age group: | ||
| <15 | 1.00(ref) | 1.00(ref) |
| 15-24 | 0.67 [0.12, 3.79] | 0.72[0.12, 4.47] |
| 25-34 | 1.09 [0.21, 5.71] | 0.95 [0.17, 5.42] |
| 35-44 | 0.69 [0.13, 3.59] | 0.70 [0.12, 3.99] |
| 45-54 | 0.82 [0.16, 4.31] | 0.86 [0.15, 4.91] |
| 55+ | 1.50 [0.28, 7.93] | 1.46 [0.25, 8.49] |
| Gender: | ||
| female | 1.00(ref) | |
| male | 0.80 [0.53, 1.22] | |
| Residents’ category | ||
| rural | 1.00(ref) | |
| urban | 0.71 [0.47, 1.08] | |
| Infection site: | ||
| extrapulmonary | 1.00(ref) | |
| pulmonary | 1.85 [0.41, 8.36] | |
| At least one follow-up lab: | ||
| no | 1.00(ref) | 1.00(ref) |
| yes | 0.27 [0.17, 0.42]* | 0.25 [0.15, 0.42]* |
| Year of diagnosis: | ||
| 2018 | 1.00(ref) | 1.00(ref) |
| 2019 | 1.86 [0.87, 3.99] | 1.90 [0.86, 4.24] |
| 2020 | 3.85 [1.76, 8.40]* | 2.97 [1.30, 6.81]* |
| 2021 | 0.83 [0.36, 1.95] | 0.78 [0.32, 1.89] |
| 2022 | 0.78 [0.35, 1.78] | 0.62 [0.26, 1.48] |
| 2023 | 1.02 [0.50, 2.11] | 0.65 [0.29, 1.42] |
| Treatment support: | ||
| no | 1.00(ref) | 1.00(ref) |
| yes | 0.40 [0.23, 0.71]* | 0.43 [0.23, 0.80]* |
| HIV status: | ||
| negative | 1.00(ref) | |
| positive | 0.98 [0.48, 1.98] | |
ref = reference category; * indicates statistically significant at 95% CI.
Disclaimer/Publisher’s Note: The statements, opinions and data contained in all publications are solely those of the individual author(s) and contributor(s) and not of MDPI and/or the editor(s). MDPI and/or the editor(s) disclaim responsibility for any injury to people or property resulting from any ideas, methods, instructions or products referred to in the content. |
© 2024 by the authors. Licensee MDPI, Basel, Switzerland. This article is an open access article distributed under the terms and conditions of the Creative Commons Attribution (CC BY) license (http://creativecommons.org/licenses/by/4.0/).
Copyright: This open access article is published under a Creative Commons CC BY 4.0 license, which permit the free download, distribution, and reuse, provided that the author and preprint are cited in any reuse.


