Submitted:
12 December 2025
Posted:
16 December 2025
You are already at the latest version
Abstract
L-Glutamate (L-Glu) is the major excitatory neurotransmitter in the central nervous system and plays a key role in neuronal communication, energy metabolism, and cellular development. However, excessive glutamatergic transmission can induce excitotoxicity, leading to neuronal damage and death. Beyond its physiological role, L-Glu, commonly used in the food industry as monosodium glutamate (MSG), has raised safety concerns due to its potential adverse effects, highlighting the importance of L-Glu detection in biological and food samples. In this work, we investigate the binding interactions between the glutamate-binding protein (GluB) from Corynebacterium glutamicum and L-Glu under different pH conditions using fluorescence correlation spectroscopy (FCS). GluB was labeled with CF488 and CF647 dyes, and fluorescence fluctuations were analyzed in the absence and in the presence of L-Glu. Steady-state fluorescence measurements were conducted on the unlabeled GluB, supporting FCS. They revealed pH-dependent structural changes of GluB, with conformational rearrangements at acidic pH and partial denaturation at alkaline conditions. At pH 8.0, GluB displayed a stable conformation and a measurable response to L-Glu binding. Moreover, experiments performed on the near-infrared labeled GluB-CF647 suggested a potential applicability of GluB for living cell studies.
Keywords:
fluorescence correlation spectroscopy
; protein fluorescence
; glutamate-binding protein
; glutamate
; protein structure
1. Introduction
L-Glutamate (L-Glu) is the most common free amino acid present in the brain and takes part in many important processes [1]. It works as an excitatory neurotransmitter [2] and it has a role in the development of the central nervous system, as energy source in cells, and in the communication between nerve cells [3]. Although L-Glu plays a crucial role in brain function, excessive glutamatergic transmission can induce harmful intracellular processes that lead to excitotoxicity, resulting in cellular damage and even neuronal death [4]. Monosodium glutamate (MSG) activates taste receptors improving the natural taste and texture of foods, enhancing thickness, fullness, and mildness of flavor [5,6,7]. The use of MSG in humans has raised concerns about its potential effects on health [8]. In fact, high intake of MSG has been associated with adverse cellular responses that involve headache, sweating, and nausea. These body reactions are commonly referred as Chinese Restaurant Syndrome (CRS) [9].
Therefore, it appears interesting to investigate the levels of L-Glu in biological systems. Conventional analytical methods such as magnetic resonance spectroscopy (MRS) [10], capillary electrophoresis (CE) [11], and high-performance liquid chromatography (HPLC) [12] are widely used to quantify L-Glu.
Glutamate-binding protein (GluB) from Corynebacterium glutamicum has been recently isolated and characterized for its affinity to L-Glu [18,19]. GluB is a member of the periplasmic binding proteins (PBPs), a widely distributed protein superfamily found in bacteria and archaea. GluB plays a key role in ATP-binding cassette (ABC) transport systems mediating the substrate uptake. Functionally, it is essential in cellular metabolism, as it selectively binds extracellular L-Glu and facilitates its transport into the cell, contributing to nitrogen metabolism and cellular homeostasis [20,21,22].
In this work we investigated the binding interactions between GluB and L-Glu under different pH conditions by fluorescence correlation spectroscopy (FCS) experiments. FCS is a technique based on the analysis of fluorescence intensity fluctuations that arise from the random motion of fluorescent molecules within a tiny observation volume (femtoliter), defined by a confocal or two-photon fluorescence microscope. Thought the autocorrelation analysis on these fluctuations, FCS provides quantitative information on molecular concentration, diffusion coefficients, interaction kinetics, and conformational dynamics [23,24].
FCS is widely applied both to cellular and protein studies. As regard proteins, FCS allows correlating protein structure with fluorescence properties [25], monitoring conformational changes even in the denatured state [26], and analyzing the diffusion processes of small molecules in protein solution. This analysis might provide valuable insights into protein-ligand interactions or on cellular processes [27,28].
In such applications, the technique allows the determination of key structural parameters such as binding affinity constants, thereby providing a dynamic perspective that cannot be accessed through static methods. However, it should be also highlighted that single-molecule measurements conducted without immobilization are limited by several factors as the short observation time of individual molecules, which rapidly diffuse out of the observation volume due to Brownian motion and the limited collection of data per molecule as consequence of the transient observation time. In addition, there is also the lack of a contextual imaging of the surrounding environment of the observed molecule, which sometimes it is important for better understanding the biological interactions within a complex cellular structure.
Here, we report the effect of pH on the GluB structure as investigated by steady-state fluorescence measurements and FCS experiments. GluB was labeled with the fluorescence dye CF488 and characterized at different pH values in the absence and in the presence of L-Glu. FCS experiments were also performed on GluB labelled with the fluorescence dye CF647 to evaluate possible applications in live-cell imaging, The use of near-infrared dye offers advantages such as low phototoxicity, minimal background fluorescence, and reduced UV light absorption [29].
2. Materials and Methods
2.1. Materials
L-glutamic acid (L-Glu) was obtained from Sigma-Aldrich (Sigma-Aldrich S.r.l., Milan, Italy). Ampicillin, isopropyl β-D-1-thiogalactopyranoside (IPTG), and all reagents used in the preparation of Luria-Bertani (LB) medium for bacterial cultivation were purchased from AppliChem GmbH (Darmstadt, Germany). The sodium acetate, sodium dihydrogen phosphate, sodium phosphate dibasic, sodium carbonate, and hydrochloric acid used to prepare buffer solutions were also sourced from Sigma-Aldrich (Sigma-Aldrich S.r.l., Milan, Italy). Additionally, Rhodamine 110 was acquired from Sigma-Aldrich. The fluorescent dyes CF488 succinimidyl ester (CF488-NHS) and CF647 succinimidyl ester (CF647-NHS) were obtained from Biotium, Inc. (Fremont, CA).
2.2. GluB Purification
The GluB protein was purified following the method described by Kronemeyer et al. [30]. Briefly, E. coli BL21 (DE3) cells transformed with pET22b (+)-GluB were grown in LB medium with ampicillin (50 μg/mL), and the GluB expression was induced with IPTG (0.8 mM) at 22 °C overnight. Cells were harvested, lysed with lysozyme, sonicated, and treated with DNase (0.05 mg/ml) and MgCl2 (5 mM). The obtained lysate was centrifuged and filtered before purification through nickel affinity chromatography using a HisTrap column with imidazole gradient elution. The fractions obtained were analyzed by sodium dodecyl sulfate-polyacrylamide gel electrophoresis (SDS-PAGE), concentrated, and further purified using size exclusion chromatography on a Superdex 75 column equilibrated with phosphate-buffered saline (PBS) at pH 7.4. The purity of the collected fractions was evaluated through SDS-PAGE. The pure fractions were pooled, concentrated, and the concentration of the GluB solution was determined by measuring the absorbance at 278 nm.
2.3. Steady-State Fluorescence Measurements
Fluorescence steady-state experiments were performed on ISS K2 fluorometer (ISS Inc, Champaign, Illinois USA) equipped with a cell temperature-controlled sample holder. To selectively excite the Trp residues, the excitation wavelength was set at 295 nm. The excitation and emission slit widths were fixed at 1.0 nm, and the emission spectra was recorded from 310 nm to 410 nm. The GluB sample was dialyzed against suitable buffer for 18 hours with four buffer exchanges at 4 °C according to Varriale et al. [32]. The concentration of the dialysate GluB was measured by UV/VIS spectrophotometer (Jasco V-730) at 278 nm and diluted until reaching an O.D. at 295 nm value of 0.07 O.D. to avoid the inner filter effect [33].
2.4. GluB Labeling and Characterization
GluB was labeled with the fluorescence dyes CF488 or CF647 following the procedure described by Capo et al. [31]. Labeling reactions were performed under basic conditions (pH 8.3) to have efficient dye conjugation to the protein. For both dyes (CF488 or CF647), 100 µL of concentrated GluB solution (2.66 mg/mL; MW 32.490 Da) was mixed with 9 µL of dye solution (10 mg/mL in DMSO), and the pH was adjusted using 0.1 M sodium carbonate buffer at pH 8.3. The reaction mixtures were incubated at room temperature for 1 hour and purified by gel filtration chromatography using pre-packed Sephadex G-25 columns to remove excess unbound dye. The labeled proteins were then dialyzed overnight at 4 °C against 50 mM phosphate buffer (pH 7.0) using dialysis tubing with a 3,500 Da molecular weight cutoff (Spectrum Labs). Absorption spectra were recorded using a Jasco V-730 spectrophotometer over the range of 220-600 nm. The degree of labeling (DOL) was determined spectrophotometrically according to the following equation:
where Amax is the absorbance at the dye’s maximum wavelength, MW is the molecular weight of GluB, and ε′ is the dye’s molar extinction coefficient of dye: 70.000 M⁻¹ cm⁻¹ for CF488 and 240.000 M⁻¹ cm⁻¹ for CF647.
2.5. pH and Binding Effect
The pH effect on the GluB-CF488 was evaluated in the absence and in the presence of L-Glu. The FCS measurements were performed at three different pH values: 5.0 (10 nM sodium acetate), 8.0 (10 nM sodium phosphate), and 10.0 (10 nM sodium carbonate) diluting the GluB-CF488 at the final concentration of 2 nM. The GluB-CF488 samples at different pH values were analyzed in the absence and in the presence of 5.0 nM L-Glu or 10.0 nM L-Glu. The FCS measurements of GluB-CF647 were performed only at pH 8.0 (10 nM sodium phosphate) in the absence and in the presence of increasing concentrations of 5.0 nM L-Glu or 10 nM L-Glu. Before the FCS measurements, all samples were incubated overnight at 4.0 °C [32].
2.6. Fluorescence Correlation Spectroscopy (FCS) Measurements
The measurements were conducted at room temperature using the ISS Q2 Laser Scanning Nanoscope Sted System for fluorescence correlation spectrometer (FCS), FLIM and STED measurements (ISS, Champaign, Illinois, USA), equipped with a Nikon inverted microscope and with Laser launcher equipped with three lasers (488 nm, 640 nm and 563 nm, and with laser for STED); the output of each laser is aligned to a single mode fiber to produce a Gaussian profile laser beam to be delivered to the instrument. Nikon high-numerical-aperture (NA) water objective (60X; NA 1.2) and focused on the solution sample. To minimize discrepancies in the observation volume and diffusion coefficient values, the instrument alignment and the calibration of the excitation volume was performed using a 2.0 nM solution of rhodamine 110 and 2.0 nM solution of CF647 for GluB-CF488 and GluB-CF647 experiments, respectively [34]. All optical components, pinhole adjustments, filter wheels, stage positioning, and objective alignment were controlled using the Vista software package (ISS Inc., Champaign, Illinois, USA), developed specifically for FCS.
2.7. Fluorescence Correlation Spectroscopy Analysis
The experimental autocorrelation functions were analyzed using Vinci Analysis software (ISS Inc., Champaign, Illinois, USA), applying a fitting model based on a three-dimensional Gaussian, two species observation volume. The fitting function used follows the equation:
where G(τ) is the autocorrelation function, D is the diffusion coefficient, and ω0 and z0 are the lateral and axial dimensions of the observation volume. C represents the molecular concentration. The diffusion coefficient D was calculated from the diffusion time using the equation:
where the beam radius W is determined from the diffusion time of a reference dye with known D. For GluB-CF488, calibration of the observation volume was performed using 75 µL of a 2.0 nM rhodamine 110 solution in water, assuming a diffusion coefficient of 430 µm²/s [35,36]. For GluB-CF647, a 75 µL solution CF647 was used, and the theoretical value was calculated by the Stock-Einstein equation (326 µm²/s). In this case, the diffusion coefficient of the free dye was estimated based on its molecular weight and used to calibrate the observation volume. As previously described by Hess and Webb [37], the presence of free dye in solution can introduce artifacts in FCS measurements. To prevent this, the contribution of the unbound probe was explicitly considered by applying a two-component fitting model, accounting separately for the free dye and the protein.
2.8. Data Analysis
Fluorescence data were analyzed and visualized using OriginPro® 2018 software. FCS data were processed and fitted using Vista Vision software (ISS Inc. Champaign, Illinois, USA).
3. Results and Discussion
3.1. Fluorescence Steady-State Experiments
Fluorescence steady-state experiments were conducted on GluB in the absence and in the presence of L-Glu at different pH values (5.0, 7.0, and 10.0). In particular, the binding effect of L-Glu on GluB was assessed as variations of the intrinsic tryptophan (W58 and W65) fluorescence emission. Figure 1 shows the fluorescence emission spectra of GluB at pH 5.0 (Figure 1A) and pH 8.0 (Figure 1B), both in the absence and in the presence of L-Glu. At pH 5.0, the maximum fluorescence emission was centered at 322 nm, while at pH 8.0 it is red shifted to 335 nm. In both cases, these fluorescence emission values are blue-shifted as compared to the emission of N-acetyl-tryptophanamide (NATA, ~350 nm), indicating that the tryptophan residues of GluB remain in a partially buried and/or rigid environments under these pH conditions. Figure 1C shows the fluorescence emission spectra of GluB at pH 10.0 in the absence and in the presence of L-Glu. The maximum fluorescence emission is at 353 nm both in the absence and in the presence of L-Glu. This value is close to the value registered for the emission of free tryptophan in solution indicating that the ta denatured state of the protein.
3.2. Fluorescence Correlation Spectroscopy (FCS) Experiments
FCS was used to investigate the effect of pH on the diffusion properties of GluB-CF488 in the absence and in the presence of L-Glu. Figure 2 shows the FCS results in the absence of L-Glu.
The experiments were performed at 25 °C in the following buffer solutions: 10 mM sodium acetate (pH 5.0), 10 mM sodium phosphate (pH 8.0), and 10 mM sodium carbonate (pH 10.0). The best fitting of the data was obtained by the Equation 2 (see materials and methos section). The variation of the diffusion coefficients values determined at the three pH values are summarized in Table 1.
The results show that at pH 8.0 the diffusion coefficient value is 98.865 µm²/s. This value is consistent with the theoretical value calculated by the Stokes-Einstein equation for a protein of ~32-34 kDa (~97 µm²/s) [32].
At pH 5.0, it is registered a moderate diminution to 96.360 µm²/s, suggesting a modest reduction of the molecular mobility of GluB because of structural rearrangements associated to ionic interactions present in acidic conditions.
At pH 10.0, the diffusion coefficient value decreases to 60.156 µm²/s, indicating the presence of substantial protein conformational variations and/or a protein oligomerization event, resulting in increased hydrodynamic size as already observed for the maltotriose-binding protein from Thermus thermophilus [32].
Figure 3 shows the FCS measurements in the presence of L-Glu. Also, in this case the experiments were conducted at 25 °C using the above reported three buffer solutions. The best fitting of the data was obtained by using the Equation 2 (see materials and methos section).
The variations of the diffusion coefficients value in the presence of L-Glu are reported in Table 2.
At pH 8.0, the diffusion coefficient value remains almost unchanged. On the contrary, it is observed an increase of GluB diffusion coefficient value from 98.865 µm²/s to 101.68 µm²/s in the presence of L-Glu.
At pH 5.0 and in the presence of L-Glu the GluB diffusion coefficient value decreases from 96.360 µm²/s to 70.106 µm²/s indicating that the binding of L-Glu-induces a protein conformational change that could be ascribed to the protonation effects affecting ligand binding and/or intramolecular interactions. Finally, at pH 10.0, the diffusion coefficient value of GluB increases from 60.156 µm²/s to 65.845 µm²/s in the presence of L-Glu.
In Figure 4 is shown the effect of L-Glu binding to GluB-CF488 at pH 5.0.
The diffusion coefficients values in the presence of 5.0 nM L-Glu or 10.0 nM L-Glu are reported in Table 3.
The data show that the diffusion coefficient (D) values decrease progressively from 96.360 µm²/s to 85.118 µm²/s and to 70.106 µm²/s in the presence of 5.0 nM L-Glu or 10.0 nM L-Glu, respectively. These results are consistent with the hypothesis of ligand-induced structural rearrangement of GluB at acidic pH values.
Figure 5 shows the effect of binding of GluB-CF488 to L-Glu at pH 8.0.
Table 4 shows the diffusion coefficients values of GluB-488 at pH 8.0 in the absence and in the presence of different concentrations of L-Glu. It is observed a slight increase from 98.865 µm²/s to 99.03 µm²/s and to 101.68 µm²/s at 5.0 nM L-Glu or 10.0 nM L-Glu, respectively.
Figure 6 shows the effect of L-Glu binding to GluB-CF488 at pH 10.0.
Table 5 reports the diffusion coefficients values of GluB-488 at pH 10.0 in the absence and in the presence of different concentrations of L-Glu. At pH 10.0 there is an increase from 60.156 µm²/s to 64.381 µm²/s and to 65.845 µm²/s in the presence of 5.0 nM L-Glu or 10.0 nM L-Glu, respectively. This variation indicates the presence of a partial protein structural stabilization in the presence of both concentrations of L-Glu at pH 10.0.
To investigate potential applications of GluB as a probe for L-Glu detection in living cells, FCS measurements were performed by using GluB covalently labeled with the near-IR dye CF647 (GluB-CF647).
Figure 7 shows the FCS analysis of GluB-CF647 at pH 8.0, in the absence and in the presence of 5.0 nM L-Glu or 10.0 nM L-Glu.
Table 6 reports the diffusion coefficients values of GluB-CF647 at pH 8.0 in the absence and in the presence of different concentrations of L-Glu.
The data show that the diffusion coefficient value increases from 92.195 µm²/s to 96.246 µm²/s in the presence of 5.0 nM L-Glu and it increases to 98.903 µm²/s in the presence of 10.0 nM L-Glu.
The data shows that at pH 8.0 both for GluB-CF488 and GluB-CF647 there is an increase of diffusion coefficient values in the presence of the L-Glu. This suggests that L-Glu binding affects the protein’s diffusion and in turn its tertiary structure. This is consistent with observations reported in literature for the ABC transporter family proteins [20,39].
4. Conclusions
In conclusion, we used FCS to study the structural behavior of GluB at different pH conditions and in the absence and in the presence of L-Glu. The marginal different diffusion values observed between GluB-CF647 and GluB-CF488 at this pH can be attributed to differences in the experimental setup, specifically in the calibration procedure. GluB-CF488 measurements were calibrated using Rhodamine 110 solution (2 nM), while in the FCS measurements for GluB-CF647 were calibrated with CF647 (2 nM).
The overall results indicate that GluB undergoes to conformational rearrangements at acidic pH and in the presence of the ligand, while at pH 10.0 it exhibits structural variations that are consistent with a structural destabilization. At pH 8.0, GluB retains a stable structure with a quantifiable response to L-Glu binding. The binding of L-Glu to GluB-CF647 showed a change in the diffusion coefficient value in the presence of L-Glu suggesting a possible utilization for living cell applications.
It should be highlighted that there are limitations in the use of FCS for measurements of molecules free in solution. The main limitation of the use of single-molecule measurements without immobilization such is that FCS is fundamentally designed to measure ensemble averages, not individual events, because molecules are constantly moving. For measurements of a single, individual molecule, especially those requiring a short measurement time (a few milliseconds), FCS may not suitable, as it produce averaged data only valid for multi-molecule systems. This is why an FCS setup could be used in specific situations, even with its limitations, to gather ensemble-average data or to probe dynamics in a system where the individual molecule tracking is not the primary goal of the study.
Author Contributions
Conceptualization, S.D and M.S.; methodology, S.D. and A.V.; software, G.F..; validation, G.F., A.V.; formal analysis, G.F. and A.V.; investigation, G.F..; resources, S.D., M.S.; data curation, A.V.; writing—original draft preparation, G.F..; writing-review and editing, S.D., M.S..; supervision, A.V..; project administration, M.S..; funding acquisition, S.D. All authors have read and agreed to the published version of the manuscript.
Acknowledgments
The FCS measurements were performed on an ISS Q2 Laser Scanning Nanoscope Sted System (ISS, Champaign, Illinois, USA), ISS purchased as part of the project IR0000032 – ITINERIS, Italian Integrated Environmental Research Infrastructures System (D.D. n. 130/2022 - CUP B53C22002150006) Funded by EU - Next Generation EU PNRR- Mission 4 “Education and Research” - Component 2: “From research to business” - Investment 3.1: “Fund for the realization of an integrated system of research and innovation infrastructures”.
References
- Zhou, Y.; Danbolt, N. C. Glutamate as a neurotransmitter in the healthy brain. Journal of neural transmission 2014, 121, 799-817. [CrossRef]
- Pålsson, E.; Jakobsson, J.; Södersten, K.;Fujita Y.; Sellgren, C.; Ekman, C. J.; Landén M. Markers of glutamate signaling in cerebrospinal fluid and serum from patients with bipolar disorder and healthy controls. European Neuropsychopharmacology 2015, 25, 133-140. [CrossRef]
- Mutluay, S. U.; Karataş, H. A review of glutamate and its receptors: their roles in brain physiology and pathology. Acta Medica 2022, 53, 99-109. [CrossRef]
- Nicosia, N.; Giovenzana, M.; Misztak, P.; Mingardi, J.; Musazzi, L. Glutamate-mediated excitotoxicity in the pathogenesis and treatment of neurodevelopmental and adult mental disorders. International Journal of Molecular Sciences 2024, 25, 6521. [CrossRef]
- Kos, I.; Bendelja Ljoljić, D.; Vrdoljak, I.; Glavaš, V.; Kovačević, N.; Pleadin, J.; Vnučec, I. (2023). Glutamate in meat processing–origin, function and novel application. Journal of Central European Agriculture 2023, 24, 624-633. [CrossRef]
- Banerjee, A.; Mukherjee, S.; Maji, B. K. Worldwide flavor enhancer monosodium glutamate combined with high lipid diet provokes metabolic alterations and systemic anomalies: An overview. Toxicology reports 2021, 8, 938-961. [CrossRef]
- Kazmi, Z.; Fatima, I.; Perveen, S.; Malik, S. S. Monosodium glutamate: Review on clinical reports. International Journal of food properties, 2017, 2, 1807-1815. [CrossRef]
- Niaz, K.; Zaplatic, E.; Spoor J. Extensive use of monosodium glutamate: A threat to public health? EXCLI journal, 2018,17, 273–278.
- Cakmakci, S.; Salik, M. A. Monosodium glutamate (MSG) as a food additive and comments on its use. In proceeding of the 4th International Conference on Advanced Engineering Technologies Bayburt, Turkey on September 28-30, 2022 (pp. 289-295).
- Ramadan, S.; Lin, A.; Stanwell, P. Glutamate and glutamine: a review of in vivo MRS in the human brain. NMR in biomedicine, 2013,26, 1630 -1646. [CrossRef]
- Hsieh, Y. H.; Liao, F. Y.; Yang, Y. H.; Weng, J. R.; Chen, S. H.; Feng, C. H. Enantioselective determination of aspartate and glutamate in biological samples by ultrasonic-assisted derivatization coupled with capillary electrophoresis and linked to Alzheimer’s disease progression. Journal of Chromatography A 2018, 1550, 68-74. [CrossRef]
- Soyseven, M.; Aboul-Enein, H. Y.; Arli, G. Development of a HPLC method combined with ultraviolet/diode array detection for determination of monosodium glutamate in various food samples. International Journal of Food Science and Technology 2021, 56(1), 461-467. [CrossRef]
- Bhalla, N.; Jolly, P.; Formisano, N.; Estrela, P. Introduction to biosensors. Essays in biochemistry 2016, 60(1), 1-8. [CrossRef]
- Camarca, A.; Varriale, A.; Capo, A.; Pennacchio, A.; Calabrese, A.; Giannattasio, C.; Murillo Almuzara, C.; D'Auria, S.; Staiano, M. Emergent Biosensing Technologies Based on Fluorescence Spectroscopy and Surface Plasmon Resonance. Sensors (Basel, Switzerland) 2021, 21, 906-940. [CrossRef]
- Xu, Y.; Zhu, T.; Niu, Y. Ye, B. C. Electrochemical detection of glutamate by metal–organic frameworks-derived Ni@ NC electrocatalysts. Microchemical Journal 2022, 175, 107229. [CrossRef]
- Shadlaghani, A.; Farzaneh, M.; Kinser, D.; Reid, R. C. Direct Electrochemical Detection of Glutamate, Acetylcholine, Choline, and Adenosine Using Non-Enzymatic Electrodes. Sensors (Basel, Switzerland) 2019, 19, 447. [CrossRef]
- Sakaguchi-Mikami, A.; Taniguchi, A.; Sode, K.; Yamazaki, T. Construction of a novel glucose-sensing molecule based on a substrate-binding protein for intracellular sensing. Biotechnology and bioengineering 2011, 108, 725-733. [CrossRef]
- Liu, Q.; Li, D.; Hu, Y.; Wang, C. Expression, crystallization and preliminary crystallographic study of GluB from Corynebacterium glutamicum. Acta crystallographica. Section F, Structural biology and crystallization communications 2013, 69, 657–659. [CrossRef]
- Capo, A.; Natalello, A.; Marienhagen, J.; Pennacchio, A.; Camarca, A.; Di Giovanni, S.; Varriale, A. Structural features of the glutamate-binding protein from Corynebacterium glutamicum. International journal of biological macromolecules 2020, 162, 903-912. [CrossRef]
- Ko, W.; Kim, S.; Lee, H. S. Engineering a periplasmic binding protein for amino acid sensors with improved binding properties. Organic & biomolecular chemistry 2017, 15, 8761-8769. [CrossRef]
- Smith, O. B.; Frkic, R. L.; Rahman M. G.; Jackson C. J.; Kaczmarski J. A. Identification and characterization of a bacterial periplasmic solute binding protein that binds L-amino acid amides. Biochemistry 2024, 63, 1322-1334.
- Davidson, A. L.; Chen, J. ATP-binding cassette transporters in bacteria. Annual review of biochemistry 2004, 73, 241–268. [CrossRef]
- Haustein, E.; Schwille, P. Fluorescence correlation spectroscopy: Novel variations of an established technique. Annual Review of Biophysics and Biomolecular Structure 2007, 36, 151-169. [CrossRef]
- Hess, S. T.; Huang, S.; Heikal, A. A.; Webb, W.W. Biological and chemical applications of fluorescence correlation spectroscopy: A review. Biochemistry 2002, 41, 697-705. [CrossRef]
- Engelborghs, Y. Correlating protein structure and protein fluorescence. Journal of Fluorescence 2003, 13, 9-16. [CrossRef]
- Sherman, E.; Itkin, A.; Kuttner, Y. Y.; Rhoades, E.; Amir, D.; Haas, E.; Haran, G. Using fluorescence correlation spectroscopy to study conformational changes in denatured proteins. Biophysical Journal 2008, 94, 4819-4827. [CrossRef]
- Patra, S.; Santhosh, K.; Pabbathi, A.; Samanta, A. Diffusion of organic dyes in bovine serum albumin solution studied by fluorescence correlation spectroscopy. RSC Advances 2012, 2, 6079–6086. [CrossRef]
- Porciani, D.; Alampi, M. M.; Abbruzzetti, S.; Viappiani, C.; Delcanale, P. Fluorescence correlation spectroscopy as a versatile method to define aptamer–protein interactions with single-molecule sensitivity. Analytical Chemistry 2023, 96, 137–144.
- Shang, A.; Shao, S.; Zhao, L.; Liu, B. Far-Red Fluorescent Proteins: Tools for Advancing In Vivo Imaging. Biosensors 2024, 14, 359. [CrossRef]
- Kronemeyer, W.; Peekhaus, N.; Krämer, R.; Sahm, H.; Eggeling, L. Structure of the gluABCD cluster encoding the glutamate uptake system of Corynebacterium glutamicum. Journal of bacteriology 1995, 177, 1152-1158. [CrossRef]
- Capo, A.; Pennacchio, A.; Montagnese, C.; Hadjiantonis, A.; Demosthenous, P.; Giusti, A.; Staiano, M.; D'Auria, S.; Varriale, A. A Förster Resonance Energy Transfer (FRET)-Based Immune Assay for the Detection of Microcystin-LR in Drinking Water. Sensors (Basel, Switzerland) 2024, 24, 3204-3214. [CrossRef]
- Varriale, A.; Marabotti, A.; Mei, G.; Staiano, M.; D’Auria, S. Correlation spectroscopy and molecular dynamics simulations to study the structural features of proteins. Plos one 2013, 8, 64840-64852. [CrossRef]
- Lakowicz J. R. Principles of fluorescence spectroscopy 3°ed.; Springer Boston, MA USA, 2006, pp 55-56.
- Wang, Z.; Zhang, H.; Jian, L.; Ding, B.; Huang, K.; Zhang, W.; Xiao, Q.; Huang S. Principles of fluorescence correlation spectroscopy applied to studies of biomolecular liquid-liquid phase separation. Biophysics reports 2022, 8, 100-118.
- Zhang, X.; Poniewierski, A.; Jelińska, A.; Zagożdżon, A.; Wisniewska, A.; Hou, S.; Hołyst, R. Determination of equilibrium and rate constants for complex formation by fluorescence correlation spectroscopy supplemented by dynamic light scattering and Taylor dispersion analysis. Soft matter 2016, 12(39), 8186-8194. [CrossRef]
- Gendron, P. O.; Avaltroni, F.; Wilkinson, K. J. Diffusion coefficients of several rhodamine derivatives as determined by pulsed field gradient-nuclear magnetic resonance and fluorescence correlation spectroscopy. Journal of fluorescence 2008, 18, 1093-1101. [CrossRef]
- Hess, S. T.; Webb, W. W. Focal volume optics and experimental artifacts in confocal fluorescence correlation spectroscopy. Biophysical Journal 2002, 83, 2300-2317. [CrossRef]
- Young, M. E.; Carroad, P. A.; Bell, R. L. Estimation of diffusion coefficients of proteins. Biotechnology and bioengineering 1980, 22, 947-955. [CrossRef]
- Gyimesi, G.; Ramachandran, S.; Kota, P.; Dokholyan N. V.; Sarkadi B.; Hegedus T. ATP hydrolysis at one of the two sites in ABC transporters initiates transport related conformational transitions. Biochimica et biophysica acta 2011, 1808, 2954-2964. [CrossRef]
Figure 1.
Normalized fluorescence emission spectra of GluB in the absence and in the presence of 100 μM L-Glu at different pH values. Fluorescence emission spectra of GluB in sodium acetate buffer at pH 5.0 in the absence and in the presence of 100 μM L-Glu (A); Fluorescence emission spectra of GluB sodium phosphate buffer at pH 8.0 in the absence and in the presence of 100 μM L-Glu (B); Fluorescence emission spectra of GluB in sodium carbonate buffer at pH 10.0 in the absence and in the presence of 100 μM of L-Glu (C). All the measurements were performed at 25° C upon excitation at 295 nm.
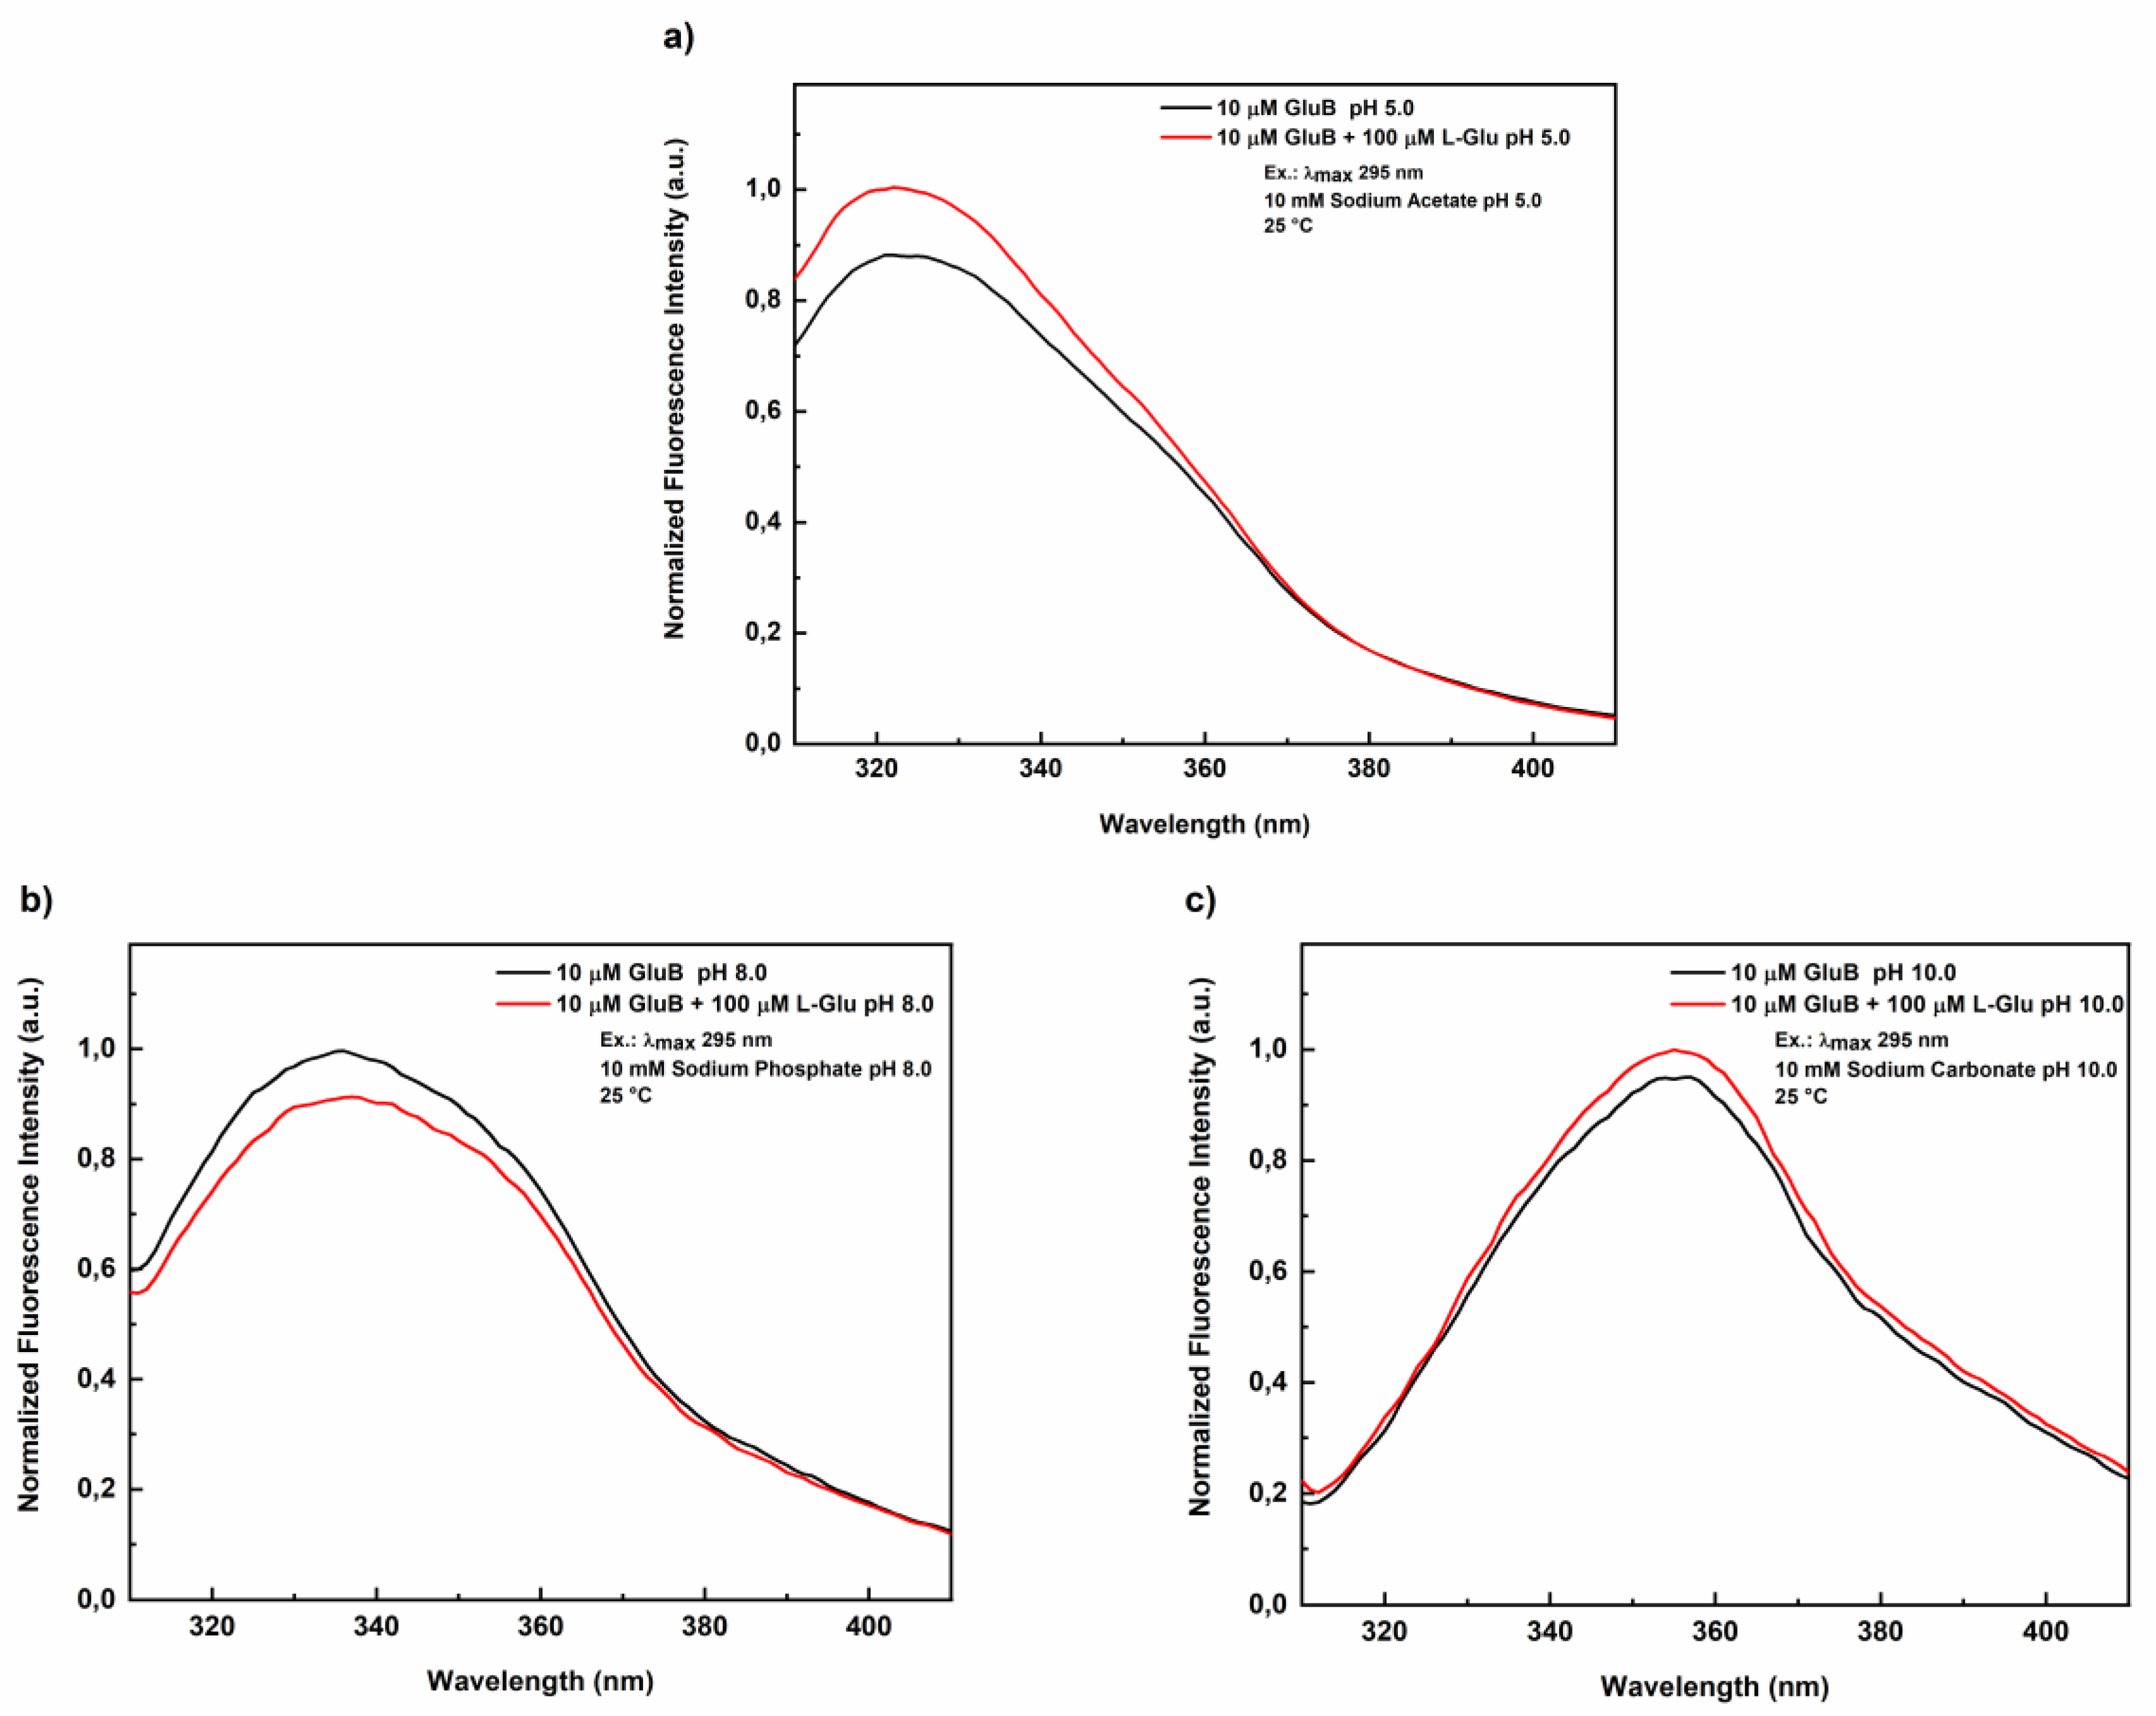
Figure 2.
Fluorescence correlation spectroscopy measurements of GluB-CF488. Normalized autocorrelation spectra of GluB-CF488 at pH 8.0 (green dots), pH 5.0 (red dots) and pH 10.0 (blue dots) compared with the autocorrelation spectrum of Rhodamine 110 (yellow dots).
Figure 2.
Fluorescence correlation spectroscopy measurements of GluB-CF488. Normalized autocorrelation spectra of GluB-CF488 at pH 8.0 (green dots), pH 5.0 (red dots) and pH 10.0 (blue dots) compared with the autocorrelation spectrum of Rhodamine 110 (yellow dots).
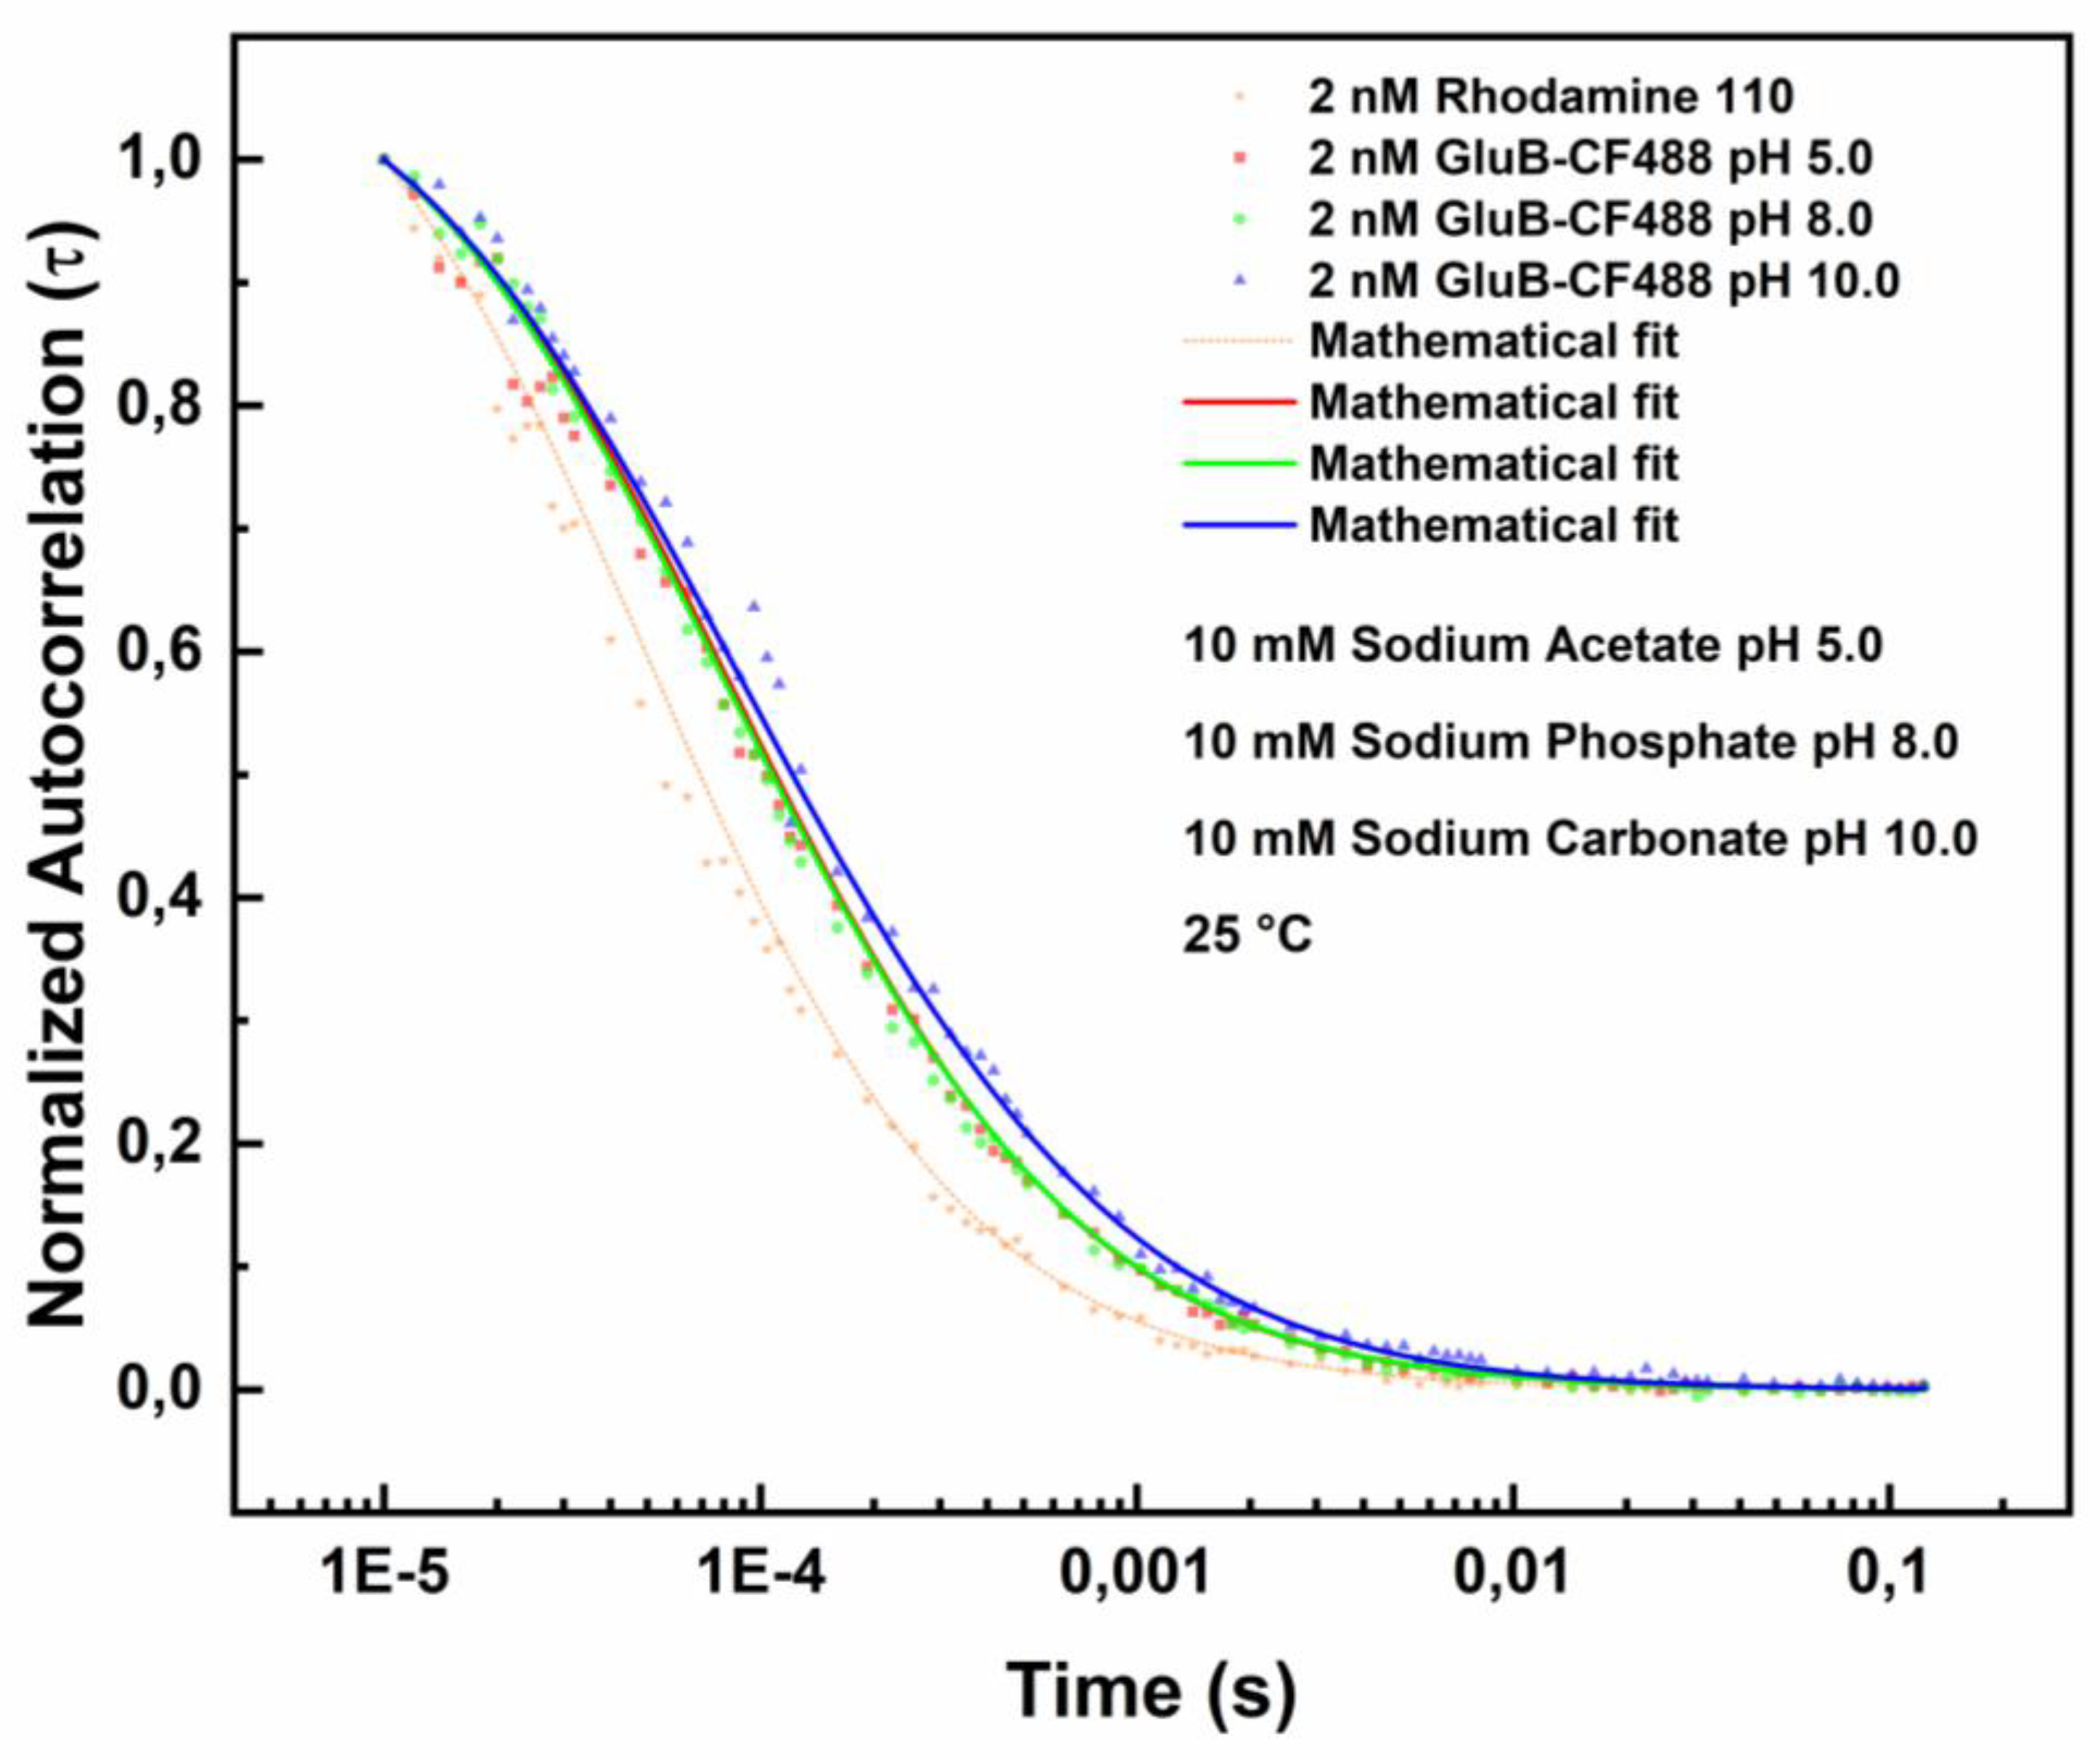
Figure 3.
Fluorescence correlation spectroscopy measurements in the presence of L-Glu. Normalized autocorrelation spectra of GluB-CF488 in the presence of 10 nM L-Glu at pH 8.0 (green dots), pH 5.0 (red dots) and pH 10.0 (blue dots) compared with the autocorrelation spectrum of Rhodamine 110 (yellow dots).
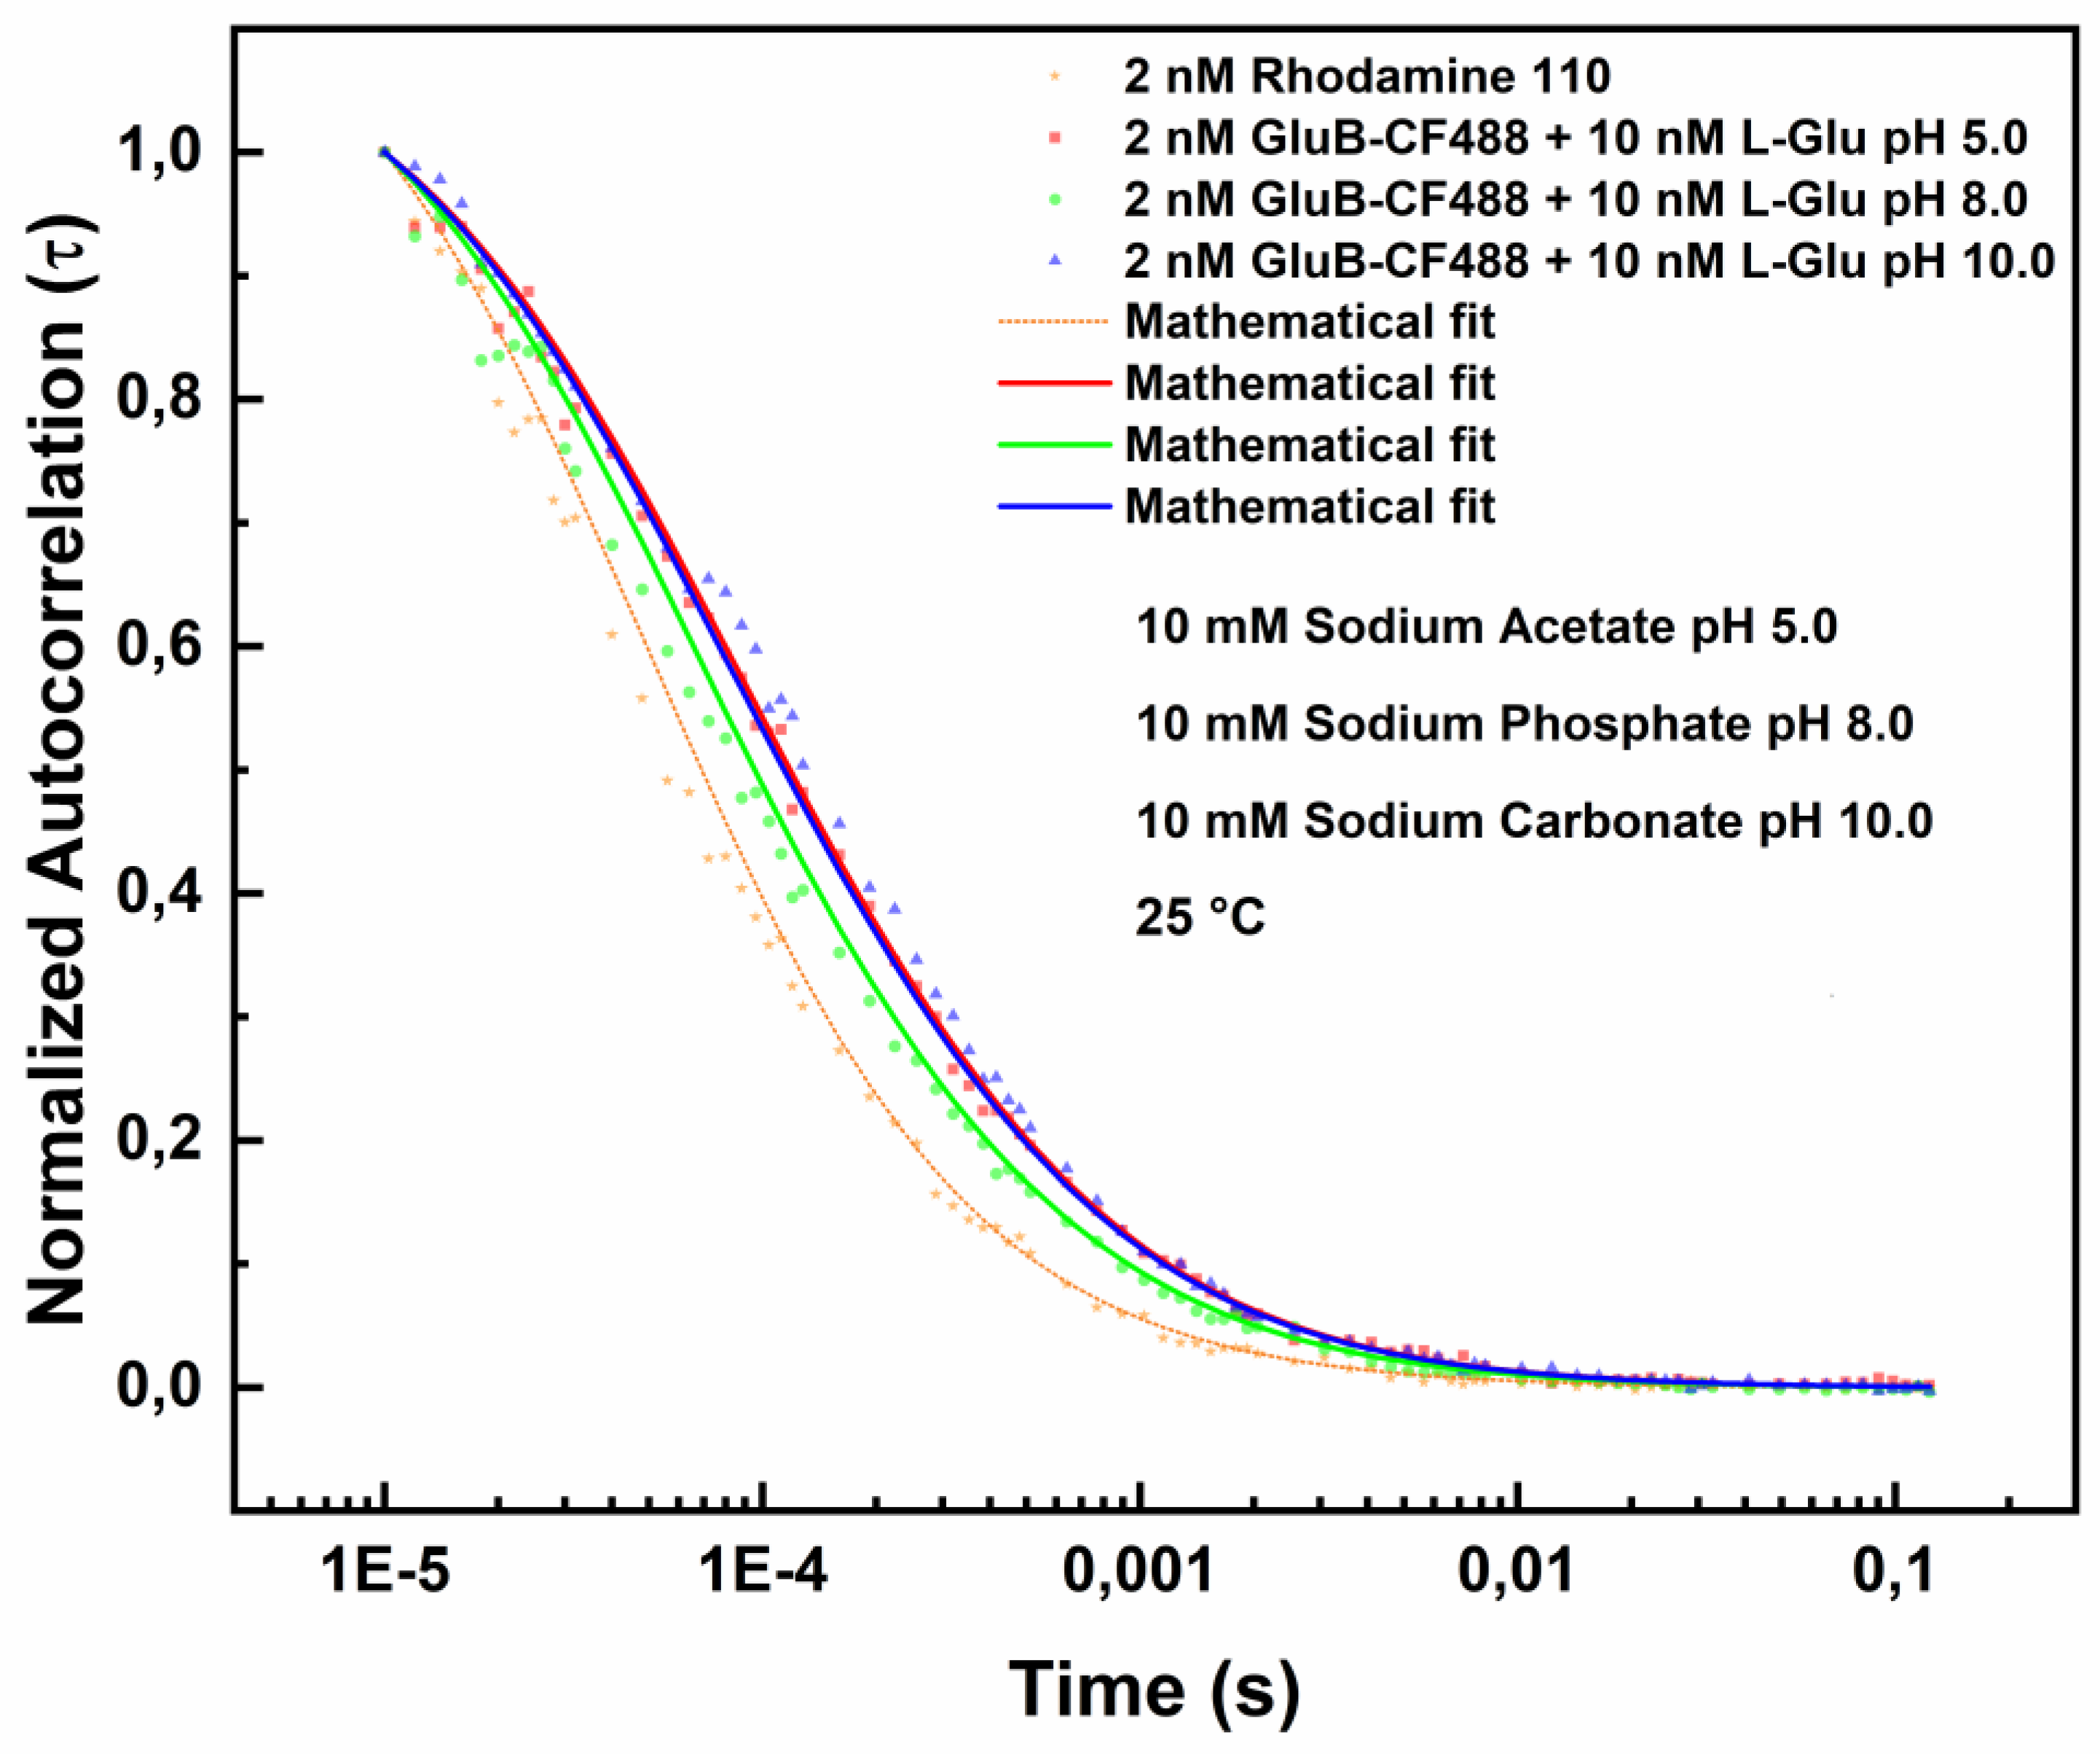
Figure 4.
Fluorescence correlation spectroscopy measurements of GluB-CF488 at pH 5.0 in the absence and in the presence of L-Glu. Normalized autocorrelation spectra of GluB-CF488 at pH 5.0 in the absence (grey dots) and in the presence of 10 nM of L-Glu (red dots), compared with the autocorrelation spectrum of Rhodamine 110 (yellow dots).
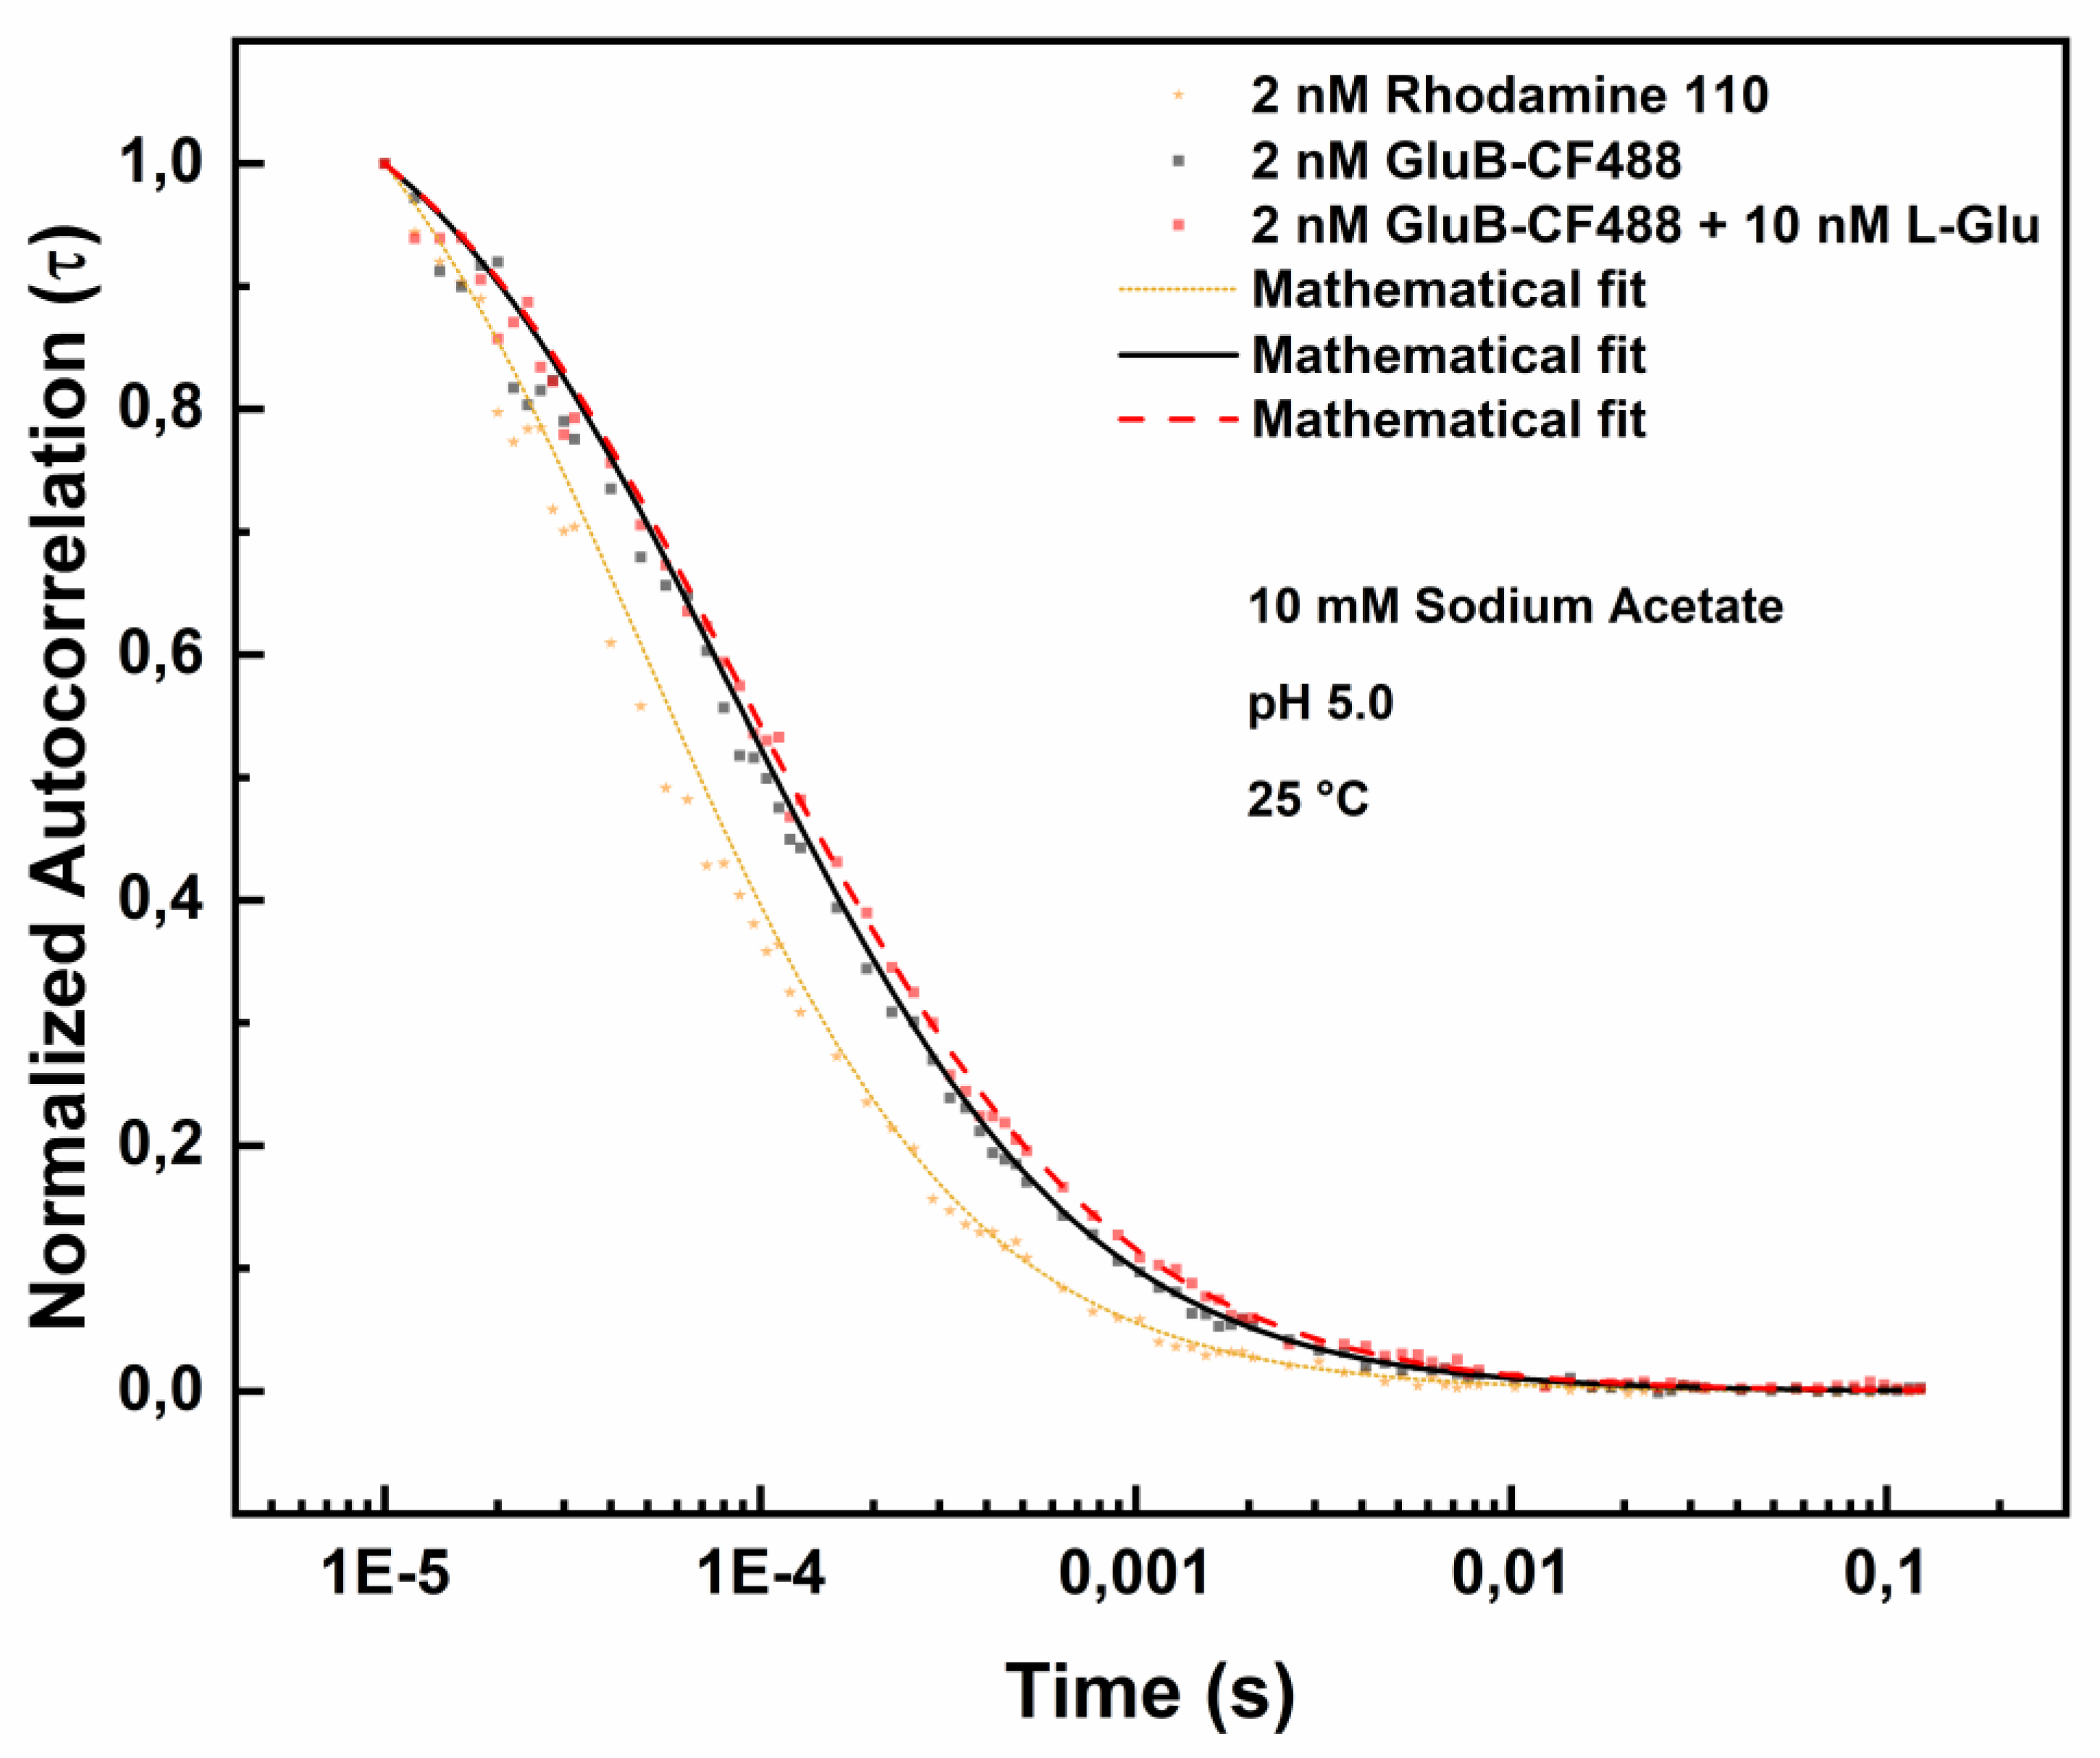
Figure 5.
Fluorescence correlation spectroscopy measurements of GluB-CF488 at pH 8.0 in the absence and in the presence of 10 nM L-Glu. Normalized autocorrelation spectra of GluB-CF488 at pH 8.0 in the absence (grey dots) and in the presence of 10 nM of L-Glu (red dots) compared with the autocorrelation spectrum of Rhodamine 110 (yellow dots).
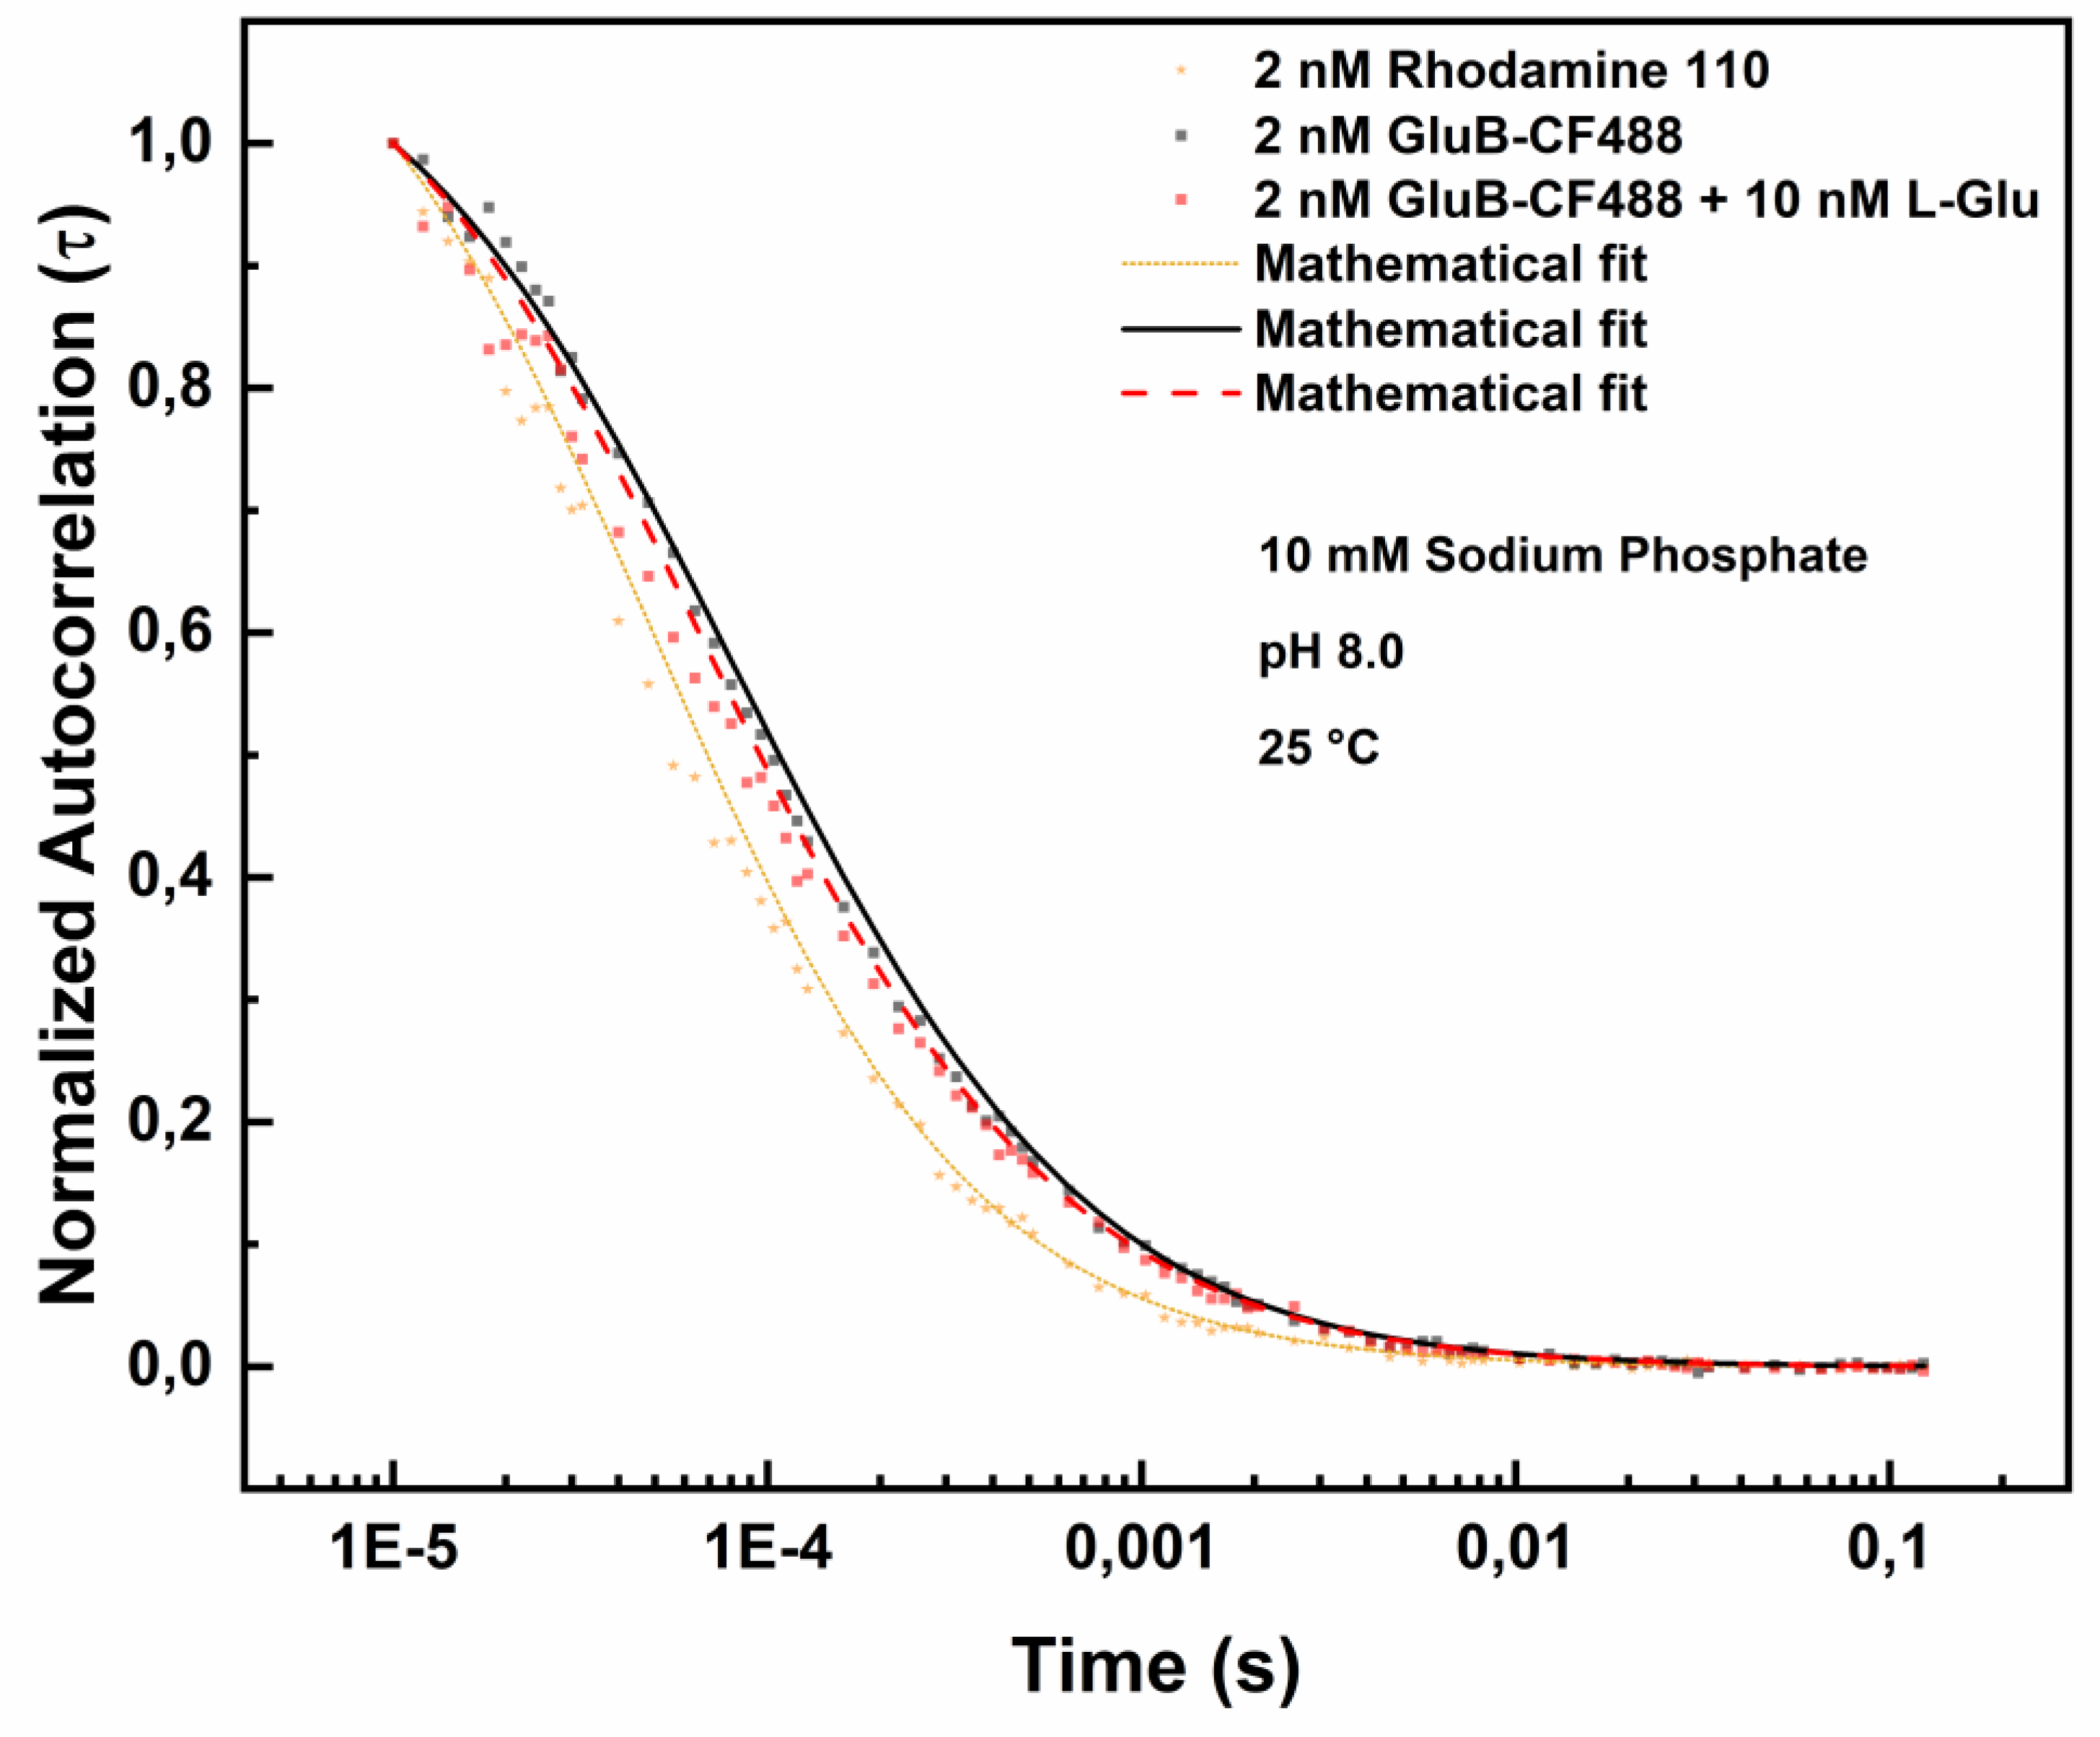
Figure 6.
Fluorescence correlation spectroscopy measurements of GluB-CF488 at pH 10.0 in the absence and in the presence of 10.0 nM L-Glu. Normalized autocorrelation spectra of GluB-CF488 at pH 10.0 in the absence (grey dots) and in the presence of 10.0 nM of L-Glu (red dots) compared with the autocorrelation spectrum of Rhodamine 110 (yellow dots).
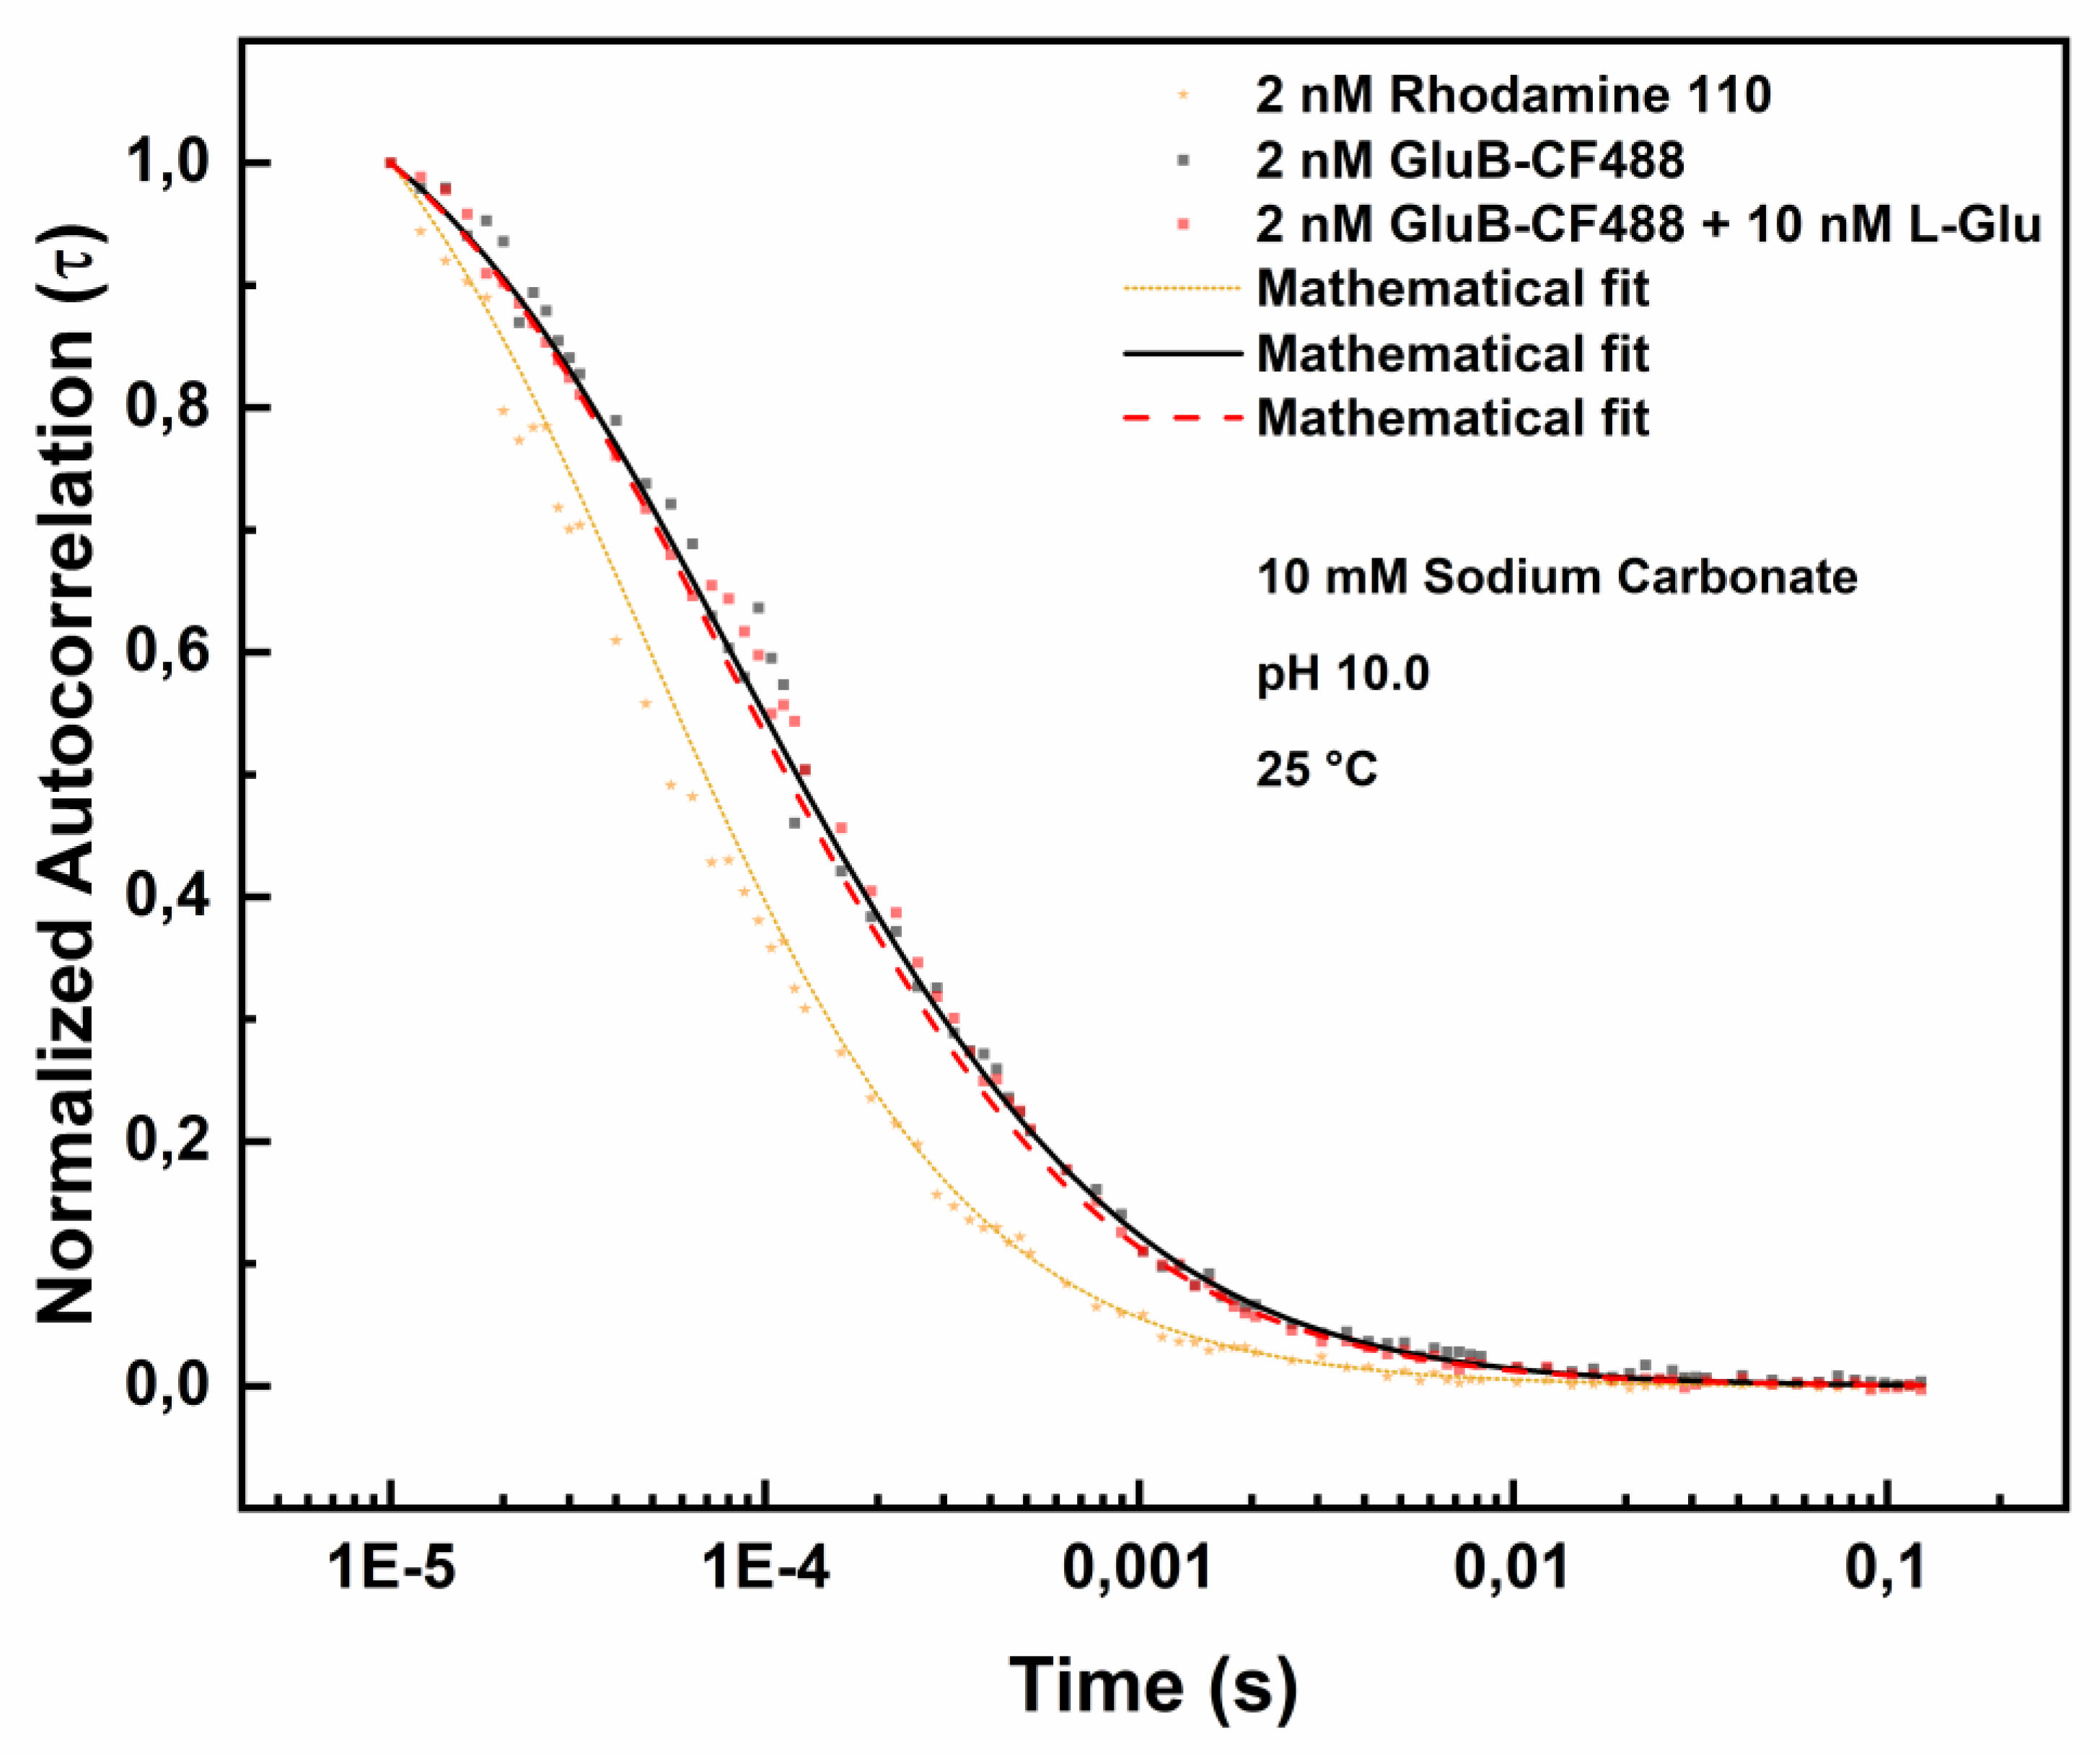
Figure 7.
Fluorescence correlation spectroscopy measurements of GluB-CF647 at pH 8.0 in the absence and in presence of 10 nM L-Glu. Normalized autocorrelation spectra of GluB-CF647 at pH 8.0 in the absence (grey dots) and in the presence of 10 nM of L-Glu (red dots) compared with the autocorrelation spectrum of the CF647 (blue dots).
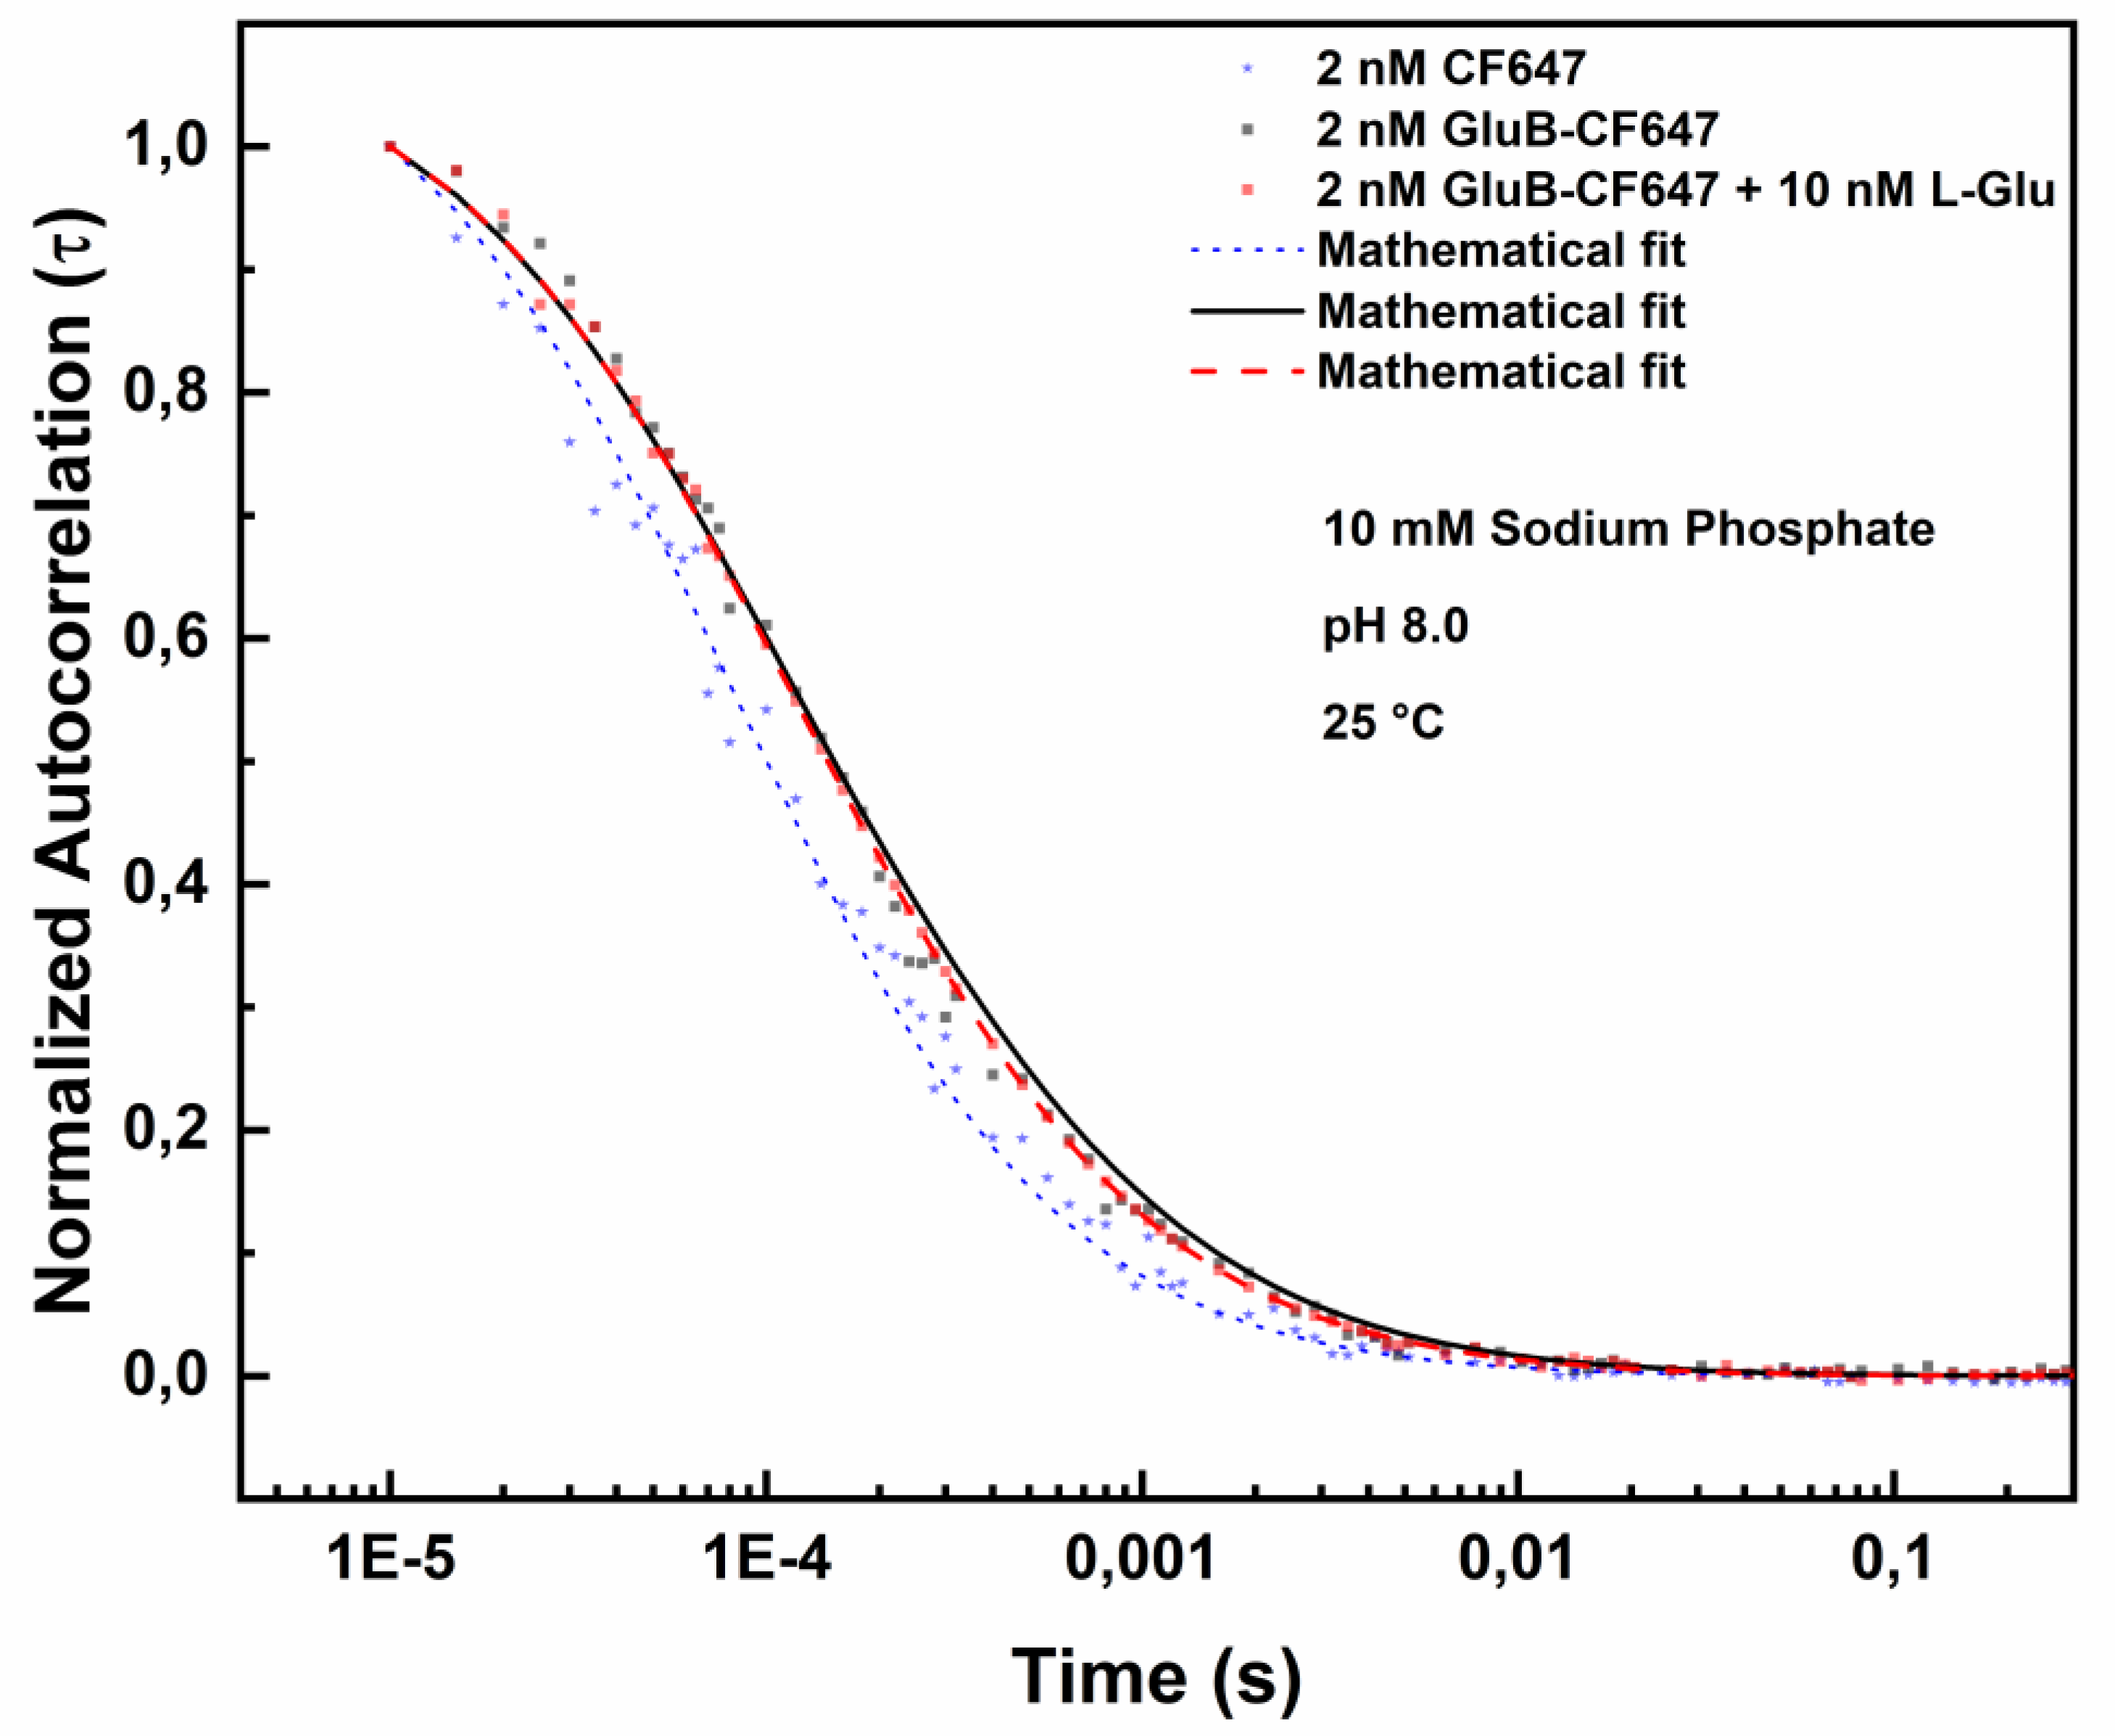

Table 1.
Diffusion coefficient values of GluB at different pH values in the absence of L-Glu. Diffusion coefficient values of GluB-CF488 at different pH values are determined by Equation 2 (see Materials and methods section).
Table 1.
Diffusion coefficient values of GluB at different pH values in the absence of L-Glu. Diffusion coefficient values of GluB-CF488 at different pH values are determined by Equation 2 (see Materials and methods section).
| Sample | pH | Diffusion (µm2/s) | Chi-square |
| 2.0 nM GluB-CF488 | 5.0 | 96.360 | 0.58 |
| 2.0 nM GluB-CF488 | 8.0 | 98.865 | 0.70 |
| 2.0 nM GluB-CF488 | 10.0 | 60.156 | 0.60 |
Table 2.
Variation of the diffusion coefficient values of GluB at different pH in the presence of L-Glu. The diffusion coefficient values of GluB-CF488 in the presence of L-Glu at three different pH values.
Table 2.
Variation of the diffusion coefficient values of GluB at different pH in the presence of L-Glu. The diffusion coefficient values of GluB-CF488 in the presence of L-Glu at three different pH values.
| Sample | pH | Diffusion (µm2/s) | Chi-square |
| 2.0 nM GluB-CF488 + 10 nM L-Glu | 5.0 | 70.106 | 0.69 |
| 2.0 nM GluB-CF488 + 10 nM L-Glu | 8.0 | 101.68 | 0.73 |
| 2.0 nM GluB-CF488 + 10 nM L-Glu | 10.0 | 65.845 | 0.53 |
Table 3.
Diffusion coefficient values of GluB at pH 5.0. The diffusion coefficient values of GluB-CF488 at pH 5.0 in the absence and in the presence of of 5.0 nM L-Glu or 10.0 nM at the three different pH values.
Table 3.
Diffusion coefficient values of GluB at pH 5.0. The diffusion coefficient values of GluB-CF488 at pH 5.0 in the absence and in the presence of of 5.0 nM L-Glu or 10.0 nM at the three different pH values.
| Sample (pH 5.0) | Diffusion (µm2/s) | Chi-square |
| 2.0 nM GluB-CF488 + 0.0 nM L-Glu | 96.360 | 0.58 |
| 2.0 nM GluB-CF488 + 5.0 nM L-Glu | 85.118 | 0.70 |
| 2.0 nM GluB-CF488 + 10.0 nM L-Glu | 70.106 | 0.69 |
Table 4.
Diffusion coefficient values of GluB at pH 8.0. Diffusion coefficient values of GluB-488 at pH 8.0 in the absence and in the presence of 5.0 nM L-Glu or 10.0 nM L-Glu.
Table 4.
Diffusion coefficient values of GluB at pH 8.0. Diffusion coefficient values of GluB-488 at pH 8.0 in the absence and in the presence of 5.0 nM L-Glu or 10.0 nM L-Glu.
| Sample (pH 8.0) | Diffusion (µm2/s) | Chi-square |
| 2.0 nM GluB-CF488 + 0.0 nM L-Glu | 98.865 | 0.70 |
| 2.0 nM GluB-CF488 + 5.0 nM L-Glu | 99.030 | 0.93 |
| 2.0 nM GluB-CF488 + 10.0 nM L-Glu | 101.68 | 0.73 |
Table 5.
Diffusion coefficient values of GluB at pH 10.0 Diffusion coefficient values of GluB-CF488 at pH 10.0 in the absence and in the presence of 5.0 nM L-Glu or 10.0 nM L-Glu.
Table 5.
Diffusion coefficient values of GluB at pH 10.0 Diffusion coefficient values of GluB-CF488 at pH 10.0 in the absence and in the presence of 5.0 nM L-Glu or 10.0 nM L-Glu.
| Sample (pH 10.0) | Diffusion (µm2/s) | Chi-square |
| 2.0 nM GluB-CF488 + 0.0 nM L-Glu | 60.156 | 0.60 |
| 2.0 nM GluB-CF488 + 5.0 nM L-Glu | 64.381 | 0.72 |
| 2.0 nM GluB-CF488 + 10.0 nM L-Glu | 65.845 | 0.53 |
Table 6.
Diffusion coefficient values of GluB labeled with CF647 dye at pH 8.0 Diffusion coefficient values of GluB-CF647 at pH 8.0 in the absence and in the presence of increase concentration of L-Glu (0-10 nM).
Table 6.
Diffusion coefficient values of GluB labeled with CF647 dye at pH 8.0 Diffusion coefficient values of GluB-CF647 at pH 8.0 in the absence and in the presence of increase concentration of L-Glu (0-10 nM).
| Sample (pH 8.0) | Diffusion (µm2/s) | Chi-square |
| 2.0 nM GluB-CF647 + 0.0 nM L-Glu | 92.195 | 0.94 |
| 2.0 nM GluB-CF647 + 5.0 nM L-Glu | 96.246 | 0.80 |
| 2.0 nM GluB-CF647 + 10.0 nM L-Glu | 98.903 | 0.77 |
Disclaimer/Publisher’s Note: The statements, opinions and data contained in all publications are solely those of the individual author(s) and contributor(s) and not of MDPI and/or the editor(s). MDPI and/or the editor(s) disclaim responsibility for any injury to people or property resulting from any ideas, methods, instructions or products referred to in the content. |
© 2025 by the authors. Licensee MDPI, Basel, Switzerland. This article is an open access article distributed under the terms and conditions of the Creative Commons Attribution (CC BY) license (http://creativecommons.org/licenses/by/4.0/).
Copyright: This open access article is published under a Creative Commons CC BY 4.0 license, which permit the free download, distribution, and reuse, provided that the author and preprint are cited in any reuse.


