Submitted:
12 December 2025
Posted:
15 December 2025
You are already at the latest version
Abstract
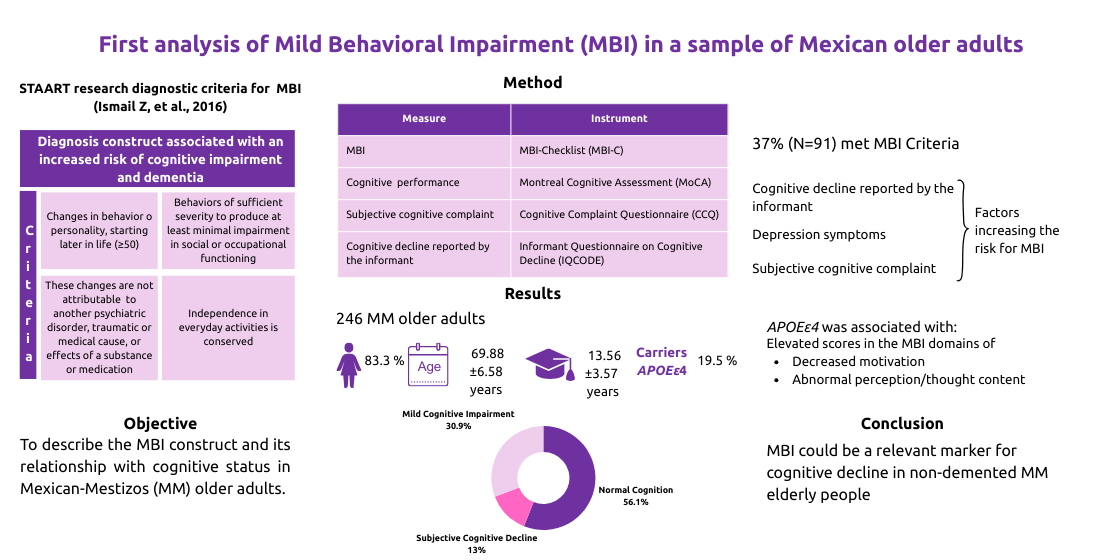
Mild Behavioral Impairment (MBI) constitutes a late-life transition state that is associated with an increased risk of cognitive impairment and dementia. Herein, we described the MBI construct and its relationship with cognitive status in Mexican-Mestizos (MM) older adults. Participants were classified according to their cognitive and behavioral statuses using tests administered to older adults and their informants. APOE_rs429358/rs7412 variants were genotyped by real-time PCR. Multivariate correlation and Principal Components Analysis (PCA) were used in statistical analysis. 246 participants were included, 13.0% had subjective cognitive decline and 30.9% mild cognitive impairment. 37% (91/246) of participants from all the cognitive spectrum met the MBI criteria; among this group, being carrier of APOEε4 was associated with two subdomains of the MBI. Subjective cognitive complaint, symptoms of depression and cognitive decline reported by the informant were associated with an increased risk for MBI (ORs in the range of 4.7-15.89). The first three components of PCA explained 68.0% of the variance of the data set, including MBI-checklist total score as a main contributor. Well-known risk factors for dementia also correlated with this PCA. MBI could be a relevant marker for cognitive decline in non-demented MM elderly people.
Keywords:
mild behavioral impairment
; APOE gene
; subjective cognitive decline
; mild cognitive impairment
; normal cognition
1. Introduction
Research on neurodegenerative disorders, including Alzheimer’s disease (AD) has focused on early detection through clinical markers in pre-dementia states [1,2,3]. In 2024, the first Mexican survey regarding early diagnosis of dementia in primary care revealed that only 17% of patients receive early diagnosis of dementia in primary care centers in the Mexican public health sector. This emphasizes the need to boost early detection rates to ensure the timely referral of patients with dementia to specialized centers [4].
In pre-dementia stages, neuropsychiatric symptoms (NPS) are highly prevalent and have a strong relationship with AD biomarkers, particularly those related to beta-amyloid pathology, across different stages of the cognitive continuum [5,6,7,8]. It is imperative to recognize the role of NPS in the diagnostic criteria for neurodegenerative diseases; their integration in research and clinical practice allows a more accurate detection and facilitates the comprehension of the biological substrate and their relationship with other variables, such as the cognitive component [1]. The International Society to Advance Alzheimer’s Research and Treatment (ISTAART) introduced Mild Behavioral Impairment (MBI) as a diagnostic construct for pre-dementia stages, given its potential for early detection of individuals at risk for developing dementia, and its predictive value for AD [2]. MBI can appear at all stages of the cognitive continuum, i.e., in individuals with normal cognition (NC), subjective cognitive decline (SCD) or mild cognitive impairment (MCI) [2,9]. The Mild Behavioral Impairment-Checklist (MBI-C) operationalizes the concept of MBI from ISTAART, measures a selected list of NPS and can aid in predicting the risk for AD and other neurodegenerative diseases [10,11].
A longitudinal study in 1273 participants with NC or MCI found that those meeting MBI criteria had faster progression to dementia than non-MBI NPS (i.e., NPS that are transient or attributable to psychiatric conditions). Participants with MBI showed a broader pattern of neurodegeneration and additional associations with AD structural biomarkers of interest, including lower bilateral hippocampal volume, and cortical thickness in AD meta-region with the exception of the entorhinal cortex for participants with NC, whereas non-MBI NPS did not [12]. Therefore, MBI could be considered as a diagnostic entity that improves the prognostic accuracy of neurodegenerative diseases in individuals with NC and MCI [12,13].
MBI-C includes five domains: decreased motivation, affective and emotional dysregulation, impulse dyscontrol, social inappropriateness, and abnormal perception or thought content manifesting as delusions and/or hallucinations [2,10,14]. The most frequently reported domains are affective and emotional dysregulation or impulse dyscontrol, followed by decreased motivation in samples of individuals over 50 years of age [15,16,17].
The overall prevalence of MBI in non-demented older adults ≥55 years of age has been documented between 33.5 and 37.2%, this prevalence range varies according to the population studied, recruitment methods, settings, and the specific evaluation scales used [16,17,18]. However, the stratification of individuals by cognitive status shows the following prevalence in MBI: 16.1–27.6% in individuals with NC, 35.8–43.1% in SCD, and 45.5–52.7% in MCI [24,25,26]. MBI is associated with lower cognitive performance, cognitive decline, and an increased risk of progression to dementia [6,18,19,20,21,22,23,24]. The domains of affective and emotional dysregulation and impulse dyscontrol being the most predictive of future diagnoses [11].
The gene encoding for the apolipoprotein E (APOE) is known as the most important modulator of the AD risk, the inheritance of the ε4 allele of APOE significantly increases the AD risk [25]. In Mexican-Mestizo population (MM), the APOEε4 carrier status increases up to two times the risk of cognitive decline [26]. APOEε4 status has been associated with affective and emotional dysregulation [22,27,28]; but no evidence has been found of its association with other subdomains or severity of MBI [23,27]. It has been suggested that APOEε4 status could mediate the relationship between MBI and cognitive decline [22,27,28].
MBI could be conceptualized as a mediator of cognitive decline or product of multifactorial risk, i.e.,: depression, diabetes and vascular conditions associated with AD biomarkers [22,29]. Therefore, this highlights the inquiry of a biopsychosocial and multifaceted approach to detect, manage and prevent MBI [22,29,30]. It is plausible that MBI can serve as an early marker or prodromal state of AD given the strong evidence linking MBI to cognitive decline, altered brain function, neuropathological alterations, and genetic etiology [6,11,12,31]; consequently, the MBI is considered the neurobehavioral axis of pre-dementia risk states, and complementary to the traditional neurocognitive axis [6,9,11,24]. Besides, the MBI has been used as a classification strategy for older adults without dementia, to identify a group at higher risk for AD [31]. The working group of the Clinical Trials on Alzheimer’s Disease Conference (CTAD) recommends using MBI as a paradigm shift in the assessment and management of NPS; it also provides recommendations for an MBI assessment in AD prevention trials [3]. Therefore, the MBI represents a breakthrough in research on cognitive decline associated with pathological aging. However, the reports about MBI in the Latin American populations are scarce. We aimed to characterize MBI in MM older adults and explore its potential associations with cognitive, clinical and sociodemographic parameters, along with APOE genotype. Their contribution to the dimensionality of the data set is relevant to describing the cognitive health of MM older adults.
2. Materials and Methods
Mexican older adults aged ≥60 years, who have finished at least the elementary education level, no dementia, no history of traumatic brain injury, neurological disease, or psychiatric illness except for mild or moderate depression and anxiety were enrolled in this study. In addition, each participant was required to have an informant, defined as a family member or partner with ≥5 years of relationship with the older adult. For blood sampling and the analysis of APOE genotype, participants were required to be MM, defined as descending individuals, on both maternal and paternal lines, from parents and grandparents born in Mexico
A cross-sectional, descriptive, and correlational study was conducted. Participants were invited through the institution’s social media channels and through visits to cultural centers for elderly people of Instituto Nacional de las Personas Adultas Mayores (INAPAM) in Mexico City. The procedure and evaluations were conducted in a single in-person session, lasting ≈120 minutes as described in Figure 1. Two clinical neuropsychologists conducted telephone interviews with informants using the Informant Questionnaire on Cognitive Decline (IQCODE) and the Mild Behavioral Impairment Checklist (MBI-C) [10,32]. The research protocol was approved by the Research and Ethics Committees of the Instituto Nacional de Neurología y Neurocirugía (INNN_139/2023). This study followed the ethics principles contained at the Declaration of Helsinki for research with human participants.
2.1. Instruments
Questionnaire for Sociodemographic data and Medical History. This instrument contains items to collect sociodemographic and medical history information.
Cognitive Complaint Questionnaire (CCQ). To explore cognitive complaints in older adults in the domains of attention, orientation, memory, language, executive functions, praxis, and gnosis. It consists of 24 items, 4 per cognitive domain, and its response format is a Likert scale, namely: 0, never; 1, almost never; 2, sometimes; 3, frequently; 4, always. A cut-off point of 22 is considered for significant subjective cognitive complaint [33].
Montreal Cognitive Assessment (MoCA). It is a screening tool for cognitive function among older adults by assessing the domains of verbal episodic memory, visuospatial ability, executive function, attention/working memory, language, and orientation [34,35]. In this study, scoring of 25 was used as a cut-off point for cognitive impairment, with a sensitivity ranging from 74–83.8% and specificity ranging from 70–70.8% [36,37].
The Beck Depression Inventory (BDI). BDI measures the severity of somatic and cognitive symptoms of depression. It consists of 21 Likert-scale items; 0 represents the absence of symptoms; and 3 represents high symptom frequency and severity. For mild depression, the cut-off point is 10 [38].
Beck Anxiety Inventory (BAI). Consists of 21 Likert-based items, where 0 indicates minimal or no anxiety symptom level; 1=mild anxiety; 2=moderate anxiety; and 3= severe anxiety, with a mild level of anxiety considered to be 6 points or higher [39].
Informant Questionnaire on Cognitive Decline in the Elderly (IQCODE). This questionnaire explores the informant’s report on the changes in the older adults over the past five years regarding performance in areas requiring memory skills and other cognitive domains. This is a 26-item questionnaire with a Likert-based response option: 1, much improved; 2, a bit improved; 3, not much change; 4, a bit worse; 5, much worse [40]. There is a Spanish version validated, 87 is the cut-off point for MCI [32].
The Mild Behavioral Impairment Checklist (MBI-C). MBI-C operationalizes the MBI ISTAART criteria for its measurement [2]. It is a 34-item scale, and its structure is directly aligned with the five domains of the MBI criteria. The scoring system consists of indicating the severity of the behavioral change assessed by the item (0= absent; 1= mild; 2= moderate; 3= severe); these are added together to generate a score for each domain and a total score (ranging from 0 to 102) [10]. Herein, the version of the MBI-C for the Spanish population was used [41], and the cut-off point for MBI was set at 6, as reported elsewhere [42,43].
2.1. Classification of Cognitive Status
The criteria for determining the cognitive status were as follows: NC, participants with normal cognitive performance (MoCA≥25) and absence of significant cognitive complaint (CCQ<22 and/or IQCODE 87/88); SCD, significant subjective cognitive complaint (CCQ≥22) and normal cognitive performance (MoCA≥25) [44,45,46]; MCI, significant cognitive complaint either subjective (CCQ≥22) and/or reported by the informant (IQCODE ≥87/88) and low cognitive performance (MoCA<25) [47,48]. For the multivariate analysis, the cognitive status was considered as an ordinal variable, as follows: 1=NC, 2= SCD and, 3=MCI.
2.2. Genetic Analysis
DNA was extracted from peripheral blood samples using a commercial kit in an automated QIAcube (QIAGEN, Hilden, Germany) system. The qualitative and quantitative analysis of genomic DNA was assessed by agarose gel electrophoresis and using the NanoDrop™ spectrophotometer (Thermofisher, Waltham, MA, USA), respectively. The single nucleotide variants (SNV) rs7412 and rs429358 (c.604C>T: p.Arg176Cys and c.466T>C: p.Cys130Arg, respectively) of APOE were genotyped by real-time PCR (polymerase chain reaction) using a QuantStudio Real-Time PCR system (Thermofisher, Waltham, MA, USA), and allelic discrimination. Commercial TaqMan probes (Thermofisher, Waltham, MA, USA) were used to discriminate ε2, ε3, and ε4 alleles; reference DNA samples of known APOE genotype (confirmed by direct sequencing) and a non-template control were included in each run to validate the method. Then, to facilitate the analysis, the samples with ε2/ε2 and ε2/ε3 genotypes were classified as allelic group ε2, the ε3/ε3 genotype as allelic group ε3, and the ε3/ε4 and ε4/ε4 genotypes as allelic group ε4. APOEε4 carrier status was classified as absent, heterozygous, and homozygous (ε4/ε4) (i.e., 0, 1, or 2 copies of ε4 allele, respectively).
2.3. Statistical Analysis
Frequencies and dispersion measures were used for descriptive statistics. The normality of the variables was assessed by Kolmogorov-Smirnov test. To identify differences between groups based on sociodemographic, clinical, and genetic variants, different tests were used, as appropriate, including Chi-square test, Fisher’s exact test, the Mann-Whitney U or Kruskal-Wallis test. To determine Hardy-Weinberg (HW) equilibrium, expected genotype frequencies were calculated from observed allele frequencies. The Chi-square (χ2) test was used to compare observed vs. expected genotype frequencies; if this test shows a p-value> 0.05 then, the population is considered to be in HW equilibrium.
Odds ratios (ORs) with 95% confidence intervals (CI95%) were calculated to identify associations between variables of interest and presence of MBI. A p-value less than 0.05 was considered statistically significant. Multivariate correlation analysis was used to establish the magnitude of the association between the variables identified as risk factors for MBI. Additionally, Principal Component Analysis (PCA) was carried out to identify the variables with the highest contribution to the data variance, as determined by cognitive status. In accordance with the Kaiser criterion, only components with eigenvalues >1 were considered [49]. A scree plot was considered to determine the number of principal components (PC) to be extracted in the PCA performed. Each PC explains a percentage of the total variance in the data. Statistical analysis of the data was carried out with Statistical Package for the Social Sciences (SPSS) version 27 and R version 4.5.1 [50].
3. Results
3.1. Sociodemographic, Cognitive, Clinical and Genetic Characteristics of the Sample
The sample included 246 MM older adults. 83.3% (N=205) of participants were women, mean age was 69.88±6.58 years and they reported having 13.56±3.57 years of education. The MoCA mean score was 25.06±3.14 and the levels of cognitive status of participants were distributed as follows: 56.1% (N=138) were classified as individuals with NC, 13.0% (N=32) SCD, and 30.9% (N=76) MCI (Table 1).
Participants with NC had significantly lower BDI and BAI scores (p<0.001) and a higher APOEε3 allele frequency (p>0.05) compared to the SCD and MCI groups. The frequency of the APOEε4 allele was higher in the SCD group than in the MCI and NC groups (p=0.018). The group with MCI had fewer years of education and the lowest MoCA scores compared to the other groups (p<0.05). IQCODE and CCQ scores were similar between SCD and MCI groups, but significantly different to the group with NC (Table 1).
Regarding the allelic frequency of APOE, 87.40%, 2.03% and 10.57% of the samples were carriers of APOEε3, APOEε2 and APOEε4 alleles, respectively (Table 1). The distribution of the genotypes was, as follows: APOEε3/ε3 (N=190, 77.2%), APOEε3/ε4 (N=43, 17.5%), APOEε2/ε3 (N=8, 3.3%), APOEε4/ε4 (N=4, 1.6%), one participant showed APOEε2/ε4 genotype (0.4%), and the genotype APOEε2/ε2 was not observed. The relative frequencies of APOE were in the range of equilibrium of Hardy-Weinberg (p>0.05) and were similar to those previously reported MM population values [51,52,53].
3.2. MBI Characteristics and its Frequency in the Cohort
The frequency of each MBI domain reported in the entire cohort (N=246) in descending order was: 59.3% (N=146) for impulse dyscontrol, 49.2% (N=121) affective and emotional dysregulation, 38.6% (N=95) decreased motivation, 26.0% (N=64) social inappropriateness, and 12.2% (N=30) abnormal perception/thought content. Scoring of total and particular domains of MBI-C were similar between the SCD and MCI groups and higher than those of individuals with NC (Table S1).
3.3. Sociodemographic, Clinical Characteristics and APOEε4 Status Between Participants With and Without MBI
37.0% (91/246) of participants met criteria for MBI (cut-off point ≥6.0 in MBI-C); 26.1% (N=36) out of them had NC, while 59.4% (N=19) and 47.4% (N=36) were considered in the groups of SCD and MCI, respectively. The frequency of MBI was higher in SCD vs. MCI group, but this was nonsignificant (p=0.256). From highest to lowest, the reported frequency of the five MBI-C domains within the group of participants with MBI was: impulse dyscontrol (95.6%), affective and emotional dysregulation (89.0%), decreased motivation (84.6%), social inappropriateness (58.2%) and abnormal perception/thought content (31.9%). The group with MBI presented higher levels of cognitive complaints and a higher frequency of depression and anxiety symptoms (p<0.001) than the non-MBI group. Participants with MBI were younger (68.48±6.42 vs. 70.70±6.60 years, p=0.009) and showed higher percentages of depression (53.8% vs. 32.9%, p=0.002) and anxiety history (36.3% vs. 23.9%, p=0.041) than non-MBI group. In contrast, sex, years of education, marital status, cognitive performance (MoCA), and APOE allele distribution were similar in both groups (Table 2).
3.4. Comparison of MBI-C Domain Scores According to the Participants’ APOEε4 Carrier Status
Regarding total or individual domains of MBI-C scoring, no differences were found between APOEε4 carriers vs. non-carriers (Table 3). Then, the comparison of MBI-C domain scores by number of APOEε4 alleles (i.e., absence vs. heterozygous vs. homozygous or 0-1–2 alleles) demonstrated differences in the domains of decreased motivation (0 vs. 2 alleles, p= 0.013) and abnormal perception or thought content (0 vs. 2 alleles, p= 0.027 and 1 vs. 2 alleles, p= 0.021) domains (Table 3 and Figure 2).
3.5. Risk Association and Multivariate Correlation Analysis
To explore the association between all the variables and the presence of MBI, ORs were calculated only for statistically significant variables. This analysis revealed that SCD and MCI groups, scoring of cognitive complaints (IQCODE and CCQ), depression or anxiety (BDI, BAI), as well as history of depression or anxiety were associated with an increased risk for MBI (Table 4). On the contrary, NC and being older than 70 years were found to be protective factors. The multivariate analysis showed correlations between MBI-C total score and IQCODE (r=0.66, p<0.01), CCQ (r=0.41, p<0.01) and BDI (r=0.41, p<0.01) (Figure 3).
3.6. Principal Component Analysis (PCA)
PCA applied to cognitive status was used to explore the contribution of included variables to the variance of the data set. The PCA revealed three components (PC1, PC2 and PC3) with eigenvalues greater than 1.0, explaining 68.0% of the total variance of data (Table 5). Participants with NC clustered around PC2, while the group with SCD was distributed between dimensions PC1 and PC2. The group with MCI showed a more dispersed distribution in the PCA biplot of cognitive status (Figure 4A). The PC1 explained 34.3% of the variance, and the variables with the highest load to this dimension were CCQ, BDI, MBI-C, and BAI. The contribution of PC2 to the total variance of data was 19.3% (Figure 4A). The correlation of PCA with other covariates showed that depression or anxiety history, APOEε4 status, COVID-19, and diabetes were significantly correlated with PC1 (p<0.05) (Figure 4B). The variables that contributed to the greatest variance in PC2 were age, years of education, MoCA, hypertension, and antecedents of COVID-19 (p<0.05). In addition, depression history also correlated with PC2 (p<0.05) (Figure 4B). The variables with the greatest contribution to PC3 (14.4% of contribution to the total variance) were IQCODE, BAI/BDI, MBI-C, sex, and anxiety history (p<0.05).
4. Discussion
There is scarce research regarding MBI within the Latin Americans, including the Mexican population. This is the first integrative study addressing sociodemographic, clinical and cognitive characteristics along with APOE genotype and their association with MBI in MM older adults.
A meta-analysis has reported that the prevalence of MBI is 17.0% in individuals with NC, 35.8% in SCD, and 45.5% in MCI [18]. The frequency of MBI in our sample was 37.o%, which agrees with what has been documented in other populations (33.5%-37.2%) [16,17,18]. Our participants with NC showed the lowest frequency of MBI (26.1%), followed by the group with MCI (57.4%) and by the group with SCD (59.4%). Participants with NC vs. MCI or SCD showed differences in MBI-C; while participants with SCD or MCI exhibited a similar frequency of MBI (p=0.256), which is in accordance with a prior study carried out in a memory clinic [54]. In the same line, there is a study performed in a community-based Southeast Asian cohort in which authors did observe differences between participants with MCI and NC; however, they did not find differences in total or any domain scores of MBI-C between participants with SCD or MCI suggesting that behavioral symptoms emerge before than cognitive ones [55]. One possible explanation for the similar MBI frequencies observed between the SCD and MCI groups could be that the participants with SCD came to this study because of concerns about their cognitive health, as reported elsewhere [54], as opposed to what might have been found in a randomly selected sample or population study.
The most frequently reported domains of MBI-C in the entire cohort (N=246) and in the group with MBI were impulse dyscontrol (59.3% and 95.6%, respectively), preceded by affective and emotional dysregulation (49.2% and 89.0%, respectively). These data are in agreement with what has been previously documented [11,17,56]. There are some reports with differences in the frequencies of the five domains of the MBI-C, but this may be influenced by the age of participants included [15] the type of relationship between the informant and the older adult, cultural beliefs, educational level, and other factors that contribute to the informant’s denial/minimization [17].
Contrary to what is documented in MCI and dementia, herein MBI was non-dependent on sex, years of education, and marital status. The participants with MBI were younger than those of the non-MBI group (p=0.009) (Table 2). The variability in the range of age of participants included in the studies may be a reason for the reported mixed effects of age on MBI [22]. Herein, we included participants with a wider age range (60-87 years) than other studies of MBI (i.e., participants of 72-79 years in Mortby et al. 2018) [17]; therefore, the association of age with MBI could be identified. Two research studies done with older adults cognitively unimpaired found that between 55% and 59% of individuals with emergent NPS convert to MCI [57,58]. In one of these studies, the group of patients with emergent NPS was younger than patients without NPS, and the clinically significant NPS were associated with a 3.92-fold increased risk of developing MCI [58]. Interestingly, in this study, being younger than <70 years doubled the risk of MBI compared to older participants.
In our sample, a subjective cognitive complaint, and cognitive complaints reported by the informants increased the risk of MBI >4-fold and >15-fold, respectively (p<0.001) (Table 4). Consequently, MBI is related to cognitive and functional decline [9,19], and is positioned as an early indicator of neurodegenerative disorders in which, as time progresses, behavioral symptoms are accompanied by cognitive symptoms [2,24,57,58,59]. Therefore, behavioral changes, which often present with cognitive complaints, might be early signs/symptoms of neurocognitive disorders [55].
We did not find differences in the MoCA total score between the groups according to the presence of MBI. This may be due to the fact that 69.12% of the older adults included were cognitively unimpaired (NC+SCD), since the correlation between MBI-C and MoCA total scores becomes stronger as cognitive impairment progresses [24].
SCD and MCI were associated with an increased risk for MBI (p<0.05), in which the cognitive complaint, a common feature of both cognitive states, also was a risk factor for MBI. These findings support that MBI and cognitive status are interconnected conditions [22].
Depression assessed with BDI, and depression history increased the risk of MBI five- and three-fold, respectively(p<0.001) (Table 4). This agrees with previous studies that found association between depressive symptoms or depression history, and increased risk of MBI [22,60,61]. In this regard, the involvement of shared and bidirectional mechanisms between MBI and depression has been suggested [22]. In this context, clinicians should be aware of differentiate the symptoms of depression and anxiety from those MBI-associated symptoms, taking into account the age of onset and its evolution with cognitive decline [14].
Anxiety history and symptoms assessed with BAI increased twofold and threefold the MBI risk, respectively (Table 4). Anxiety is a risk factor for AD and vascular dementia [62]; besides, MBI is related with AD biomarkers and greater volume of white matter hyperintensities, a sign of cerebrovascular disease [11,58,63,64]. Thus, the association between MBI and anxiety supports the hypothesis that this construct could be a clinical manifestation of these diseases.
A higher prevalence of two MBI subdomains were observed in APOEε4 carriers: decreased motivation and abnormal perception or thought content. An association between APOE genotype and affective and emotional dysregulation has been previously documented; however, findings regarding the domain of decreased motivation are inconsistent [27,28]. The subdomain of decreased motivation has been associated with an increased risk of all-cause dementia in adults with NC over 55 years of age [16], suggesting a common biological substrate for these behavioral symptoms of pre-dementia stages with cognitive and functional aspects [22].
In a longitudinal study with 8.1 years of follow-up, the APOEε4 carriers with emergent NPS had the highest rate of conversion to cognitive impairment compared to the other groups with a combination of presence/absence of NPS and APOEε4 carrier status [58]. MBI is a multifactorial state that considers genetic predisposition (e.g., APOEε4 allele) and other AD and cerebrovascular disease-related factors [22,64]. Therefore, the risk association of MBI with age under 70 years and higher cognitive complaints without a significant relationship with cognitive performance (MoCA score) identified in this study could suggest that MBI is an even earlier clinical marker than cognitive impairment.
The variables accounting for the greatest variance of the dataset were CCQ, BDI, BAI, MBI-C, MoCA, age, and years of education. The first dimension of the PCA (PC1) explains the set of affective-behavioral symptoms (neuropsychiatric axis) and cognitive complaints; while PC2 corresponds to the cognitive performance and associated sociodemographic variables (cognitive axis) (Figure 4B).
Additionally, a history of depression or anxiety, APOEε4 carrier status, and hypertension were covariates significantly correlating in both PC1 and PC2. Our results indicate that these variables are common to both MCI and MBI, therefore they could be complementary syndromes [24,59]. Another approach is to consider MBI as a mediator state to explain the relationship between risk factors of brain health and cognitive decline [30]
There is evidence of an association between hypertension and an increased risk of MBI [22,30]. MBI in turn has been associated with a greater number of white matter hyperintensities in non-demented individuals (NC and MCI) from memory clinics [29,65]. It has been suggested that hypertension is one of the causal factors of this imaging sign [66]; and that both hypertension and white matter hyperintensities are risk factors for dementia [66,67]. Thus, hypertension, a common condition in MBI and cognitive impairment, might have potential implications for cognitive or brain health aspects [30].
The strengths of the present integrative study are the inclusion of APOE genotype and other known AD risk factors in non-demented participants, the cognitive status and their stratification by presence of MBI. This is the first report of MBI in MM older adults, analyzing its contribution to the variance of the dataset by using PCA. The main limitation is the low inclusion of male participants in our cohort (N=41, 16.7%) limiting generalizability of study findings; however, comparative analyses could be performed.
Our findings support the inclusion of the MBI in the protocols of assessment of nondemented older adults, as well as in combination with AD biomarkers and other neurodegenerative diseases [22,58,64]; in addition, it would be useful to improve risk stratification for older adults with cognitive complaints and symptoms of depression and/or anxiety. Longitudinal future research should delve deeper into 1) establishing differences in MBI profile regarding risk of cognitive decline in MM population; 2) to identify MBI subtypes and to determine whether their profiles are associated with the etiology of some neurodegenerative diseases; 3) to evaluate MBI as an early detection marker of neurodegenerative diseases in the context of health primary care; 4) to determinate cognitive and imaging correlates of MBI; and 5) to explore MBI evolution and cognitive impairment, and their interactions with other factors.
5. Conclusions
The PCA applied to cognitive status in non-demented MM elderly people revealed a two-component structure describing the variance of the dataset: PC1, a behavioral and affective component along with cognitive complaint, in which MBI has a significant loading, and PC2 corresponded to the cognitive dimension. Our findings suggest that MBI could be an early clinical marker of risk for cognitive decline.
Supplementary Materials
The following supporting information can be downloaded at the website of this paper posted on Preprints.org, Table S1: Comparison of MBI characteristics between the different cognitive status of the participants.
Author Contributions
Conceptualization, Y. R.-A., A.A.-A. and N.M-J.; methodology, A.A.-A., S.-S.-B., A.O.-V., D. J.D-O., R. R.-G.; validation, Y. R.-A., A.A.-A. and N.M-J.; formal analysis, A.A.-A., S. S.-B. and A. O.-V.; investigation, Y. R.-A., A.A.-A., N.M.-J., S.-S.-B., D. J.D-O. and R. R.-G.; data curation, A.A.-A.; writing—original draft preparation, A.A.-A., N.M-J., Y. R.-A., S.-S.-B., A.O.-V., R. R.-G and D. J.D-O.; writing—review and editing, A.A.-A., N.M-J. and Y. R.-A.; visualization, A.A.-A., N.M-J. and Y. R.-A.; supervision, Y. R.-A. and N.M-J.; project administration, Y. R.-A.; funding acquisition, Y.-R.-A. All authors have read and agreed to the published version of the manuscript.
Funding
This research project received funding from Health Research Projects by Secretaría de Salud, grant number FPIS2024-INNN-5196 to Y.R-A. A.A-A was supported by Secretaría de Ciencia, Humanidades, Tecnología e Innovación (SECIHTI, scholarship #1314324).
Institutional Review Board Statement
The study was conducted in accordance with the Declaration of Helsinki and approved by the Ethics in Research Committee of the INSTITUTO NACIONAL DE NEUROLOGÍA Y NEUROCIRUGÍA MANUEL VELASCO SUÁREZ (protocol code 139/2023 approved on February 12th, 2024).
Informed Consent Statement
Informed consent was obtained from all subjects involved in the study.:.
Data Availability Statement
The data presented in this study are available on request from the corresponding author due to confidentiality and ethical issues.
Acknowledgments
We would like to express our gratitude to the Instituto Nacional de las Personas Adultas Mayores (INAPAM) for their support in recruiting participants, as well as to the participants and informants who kindly collaborated in this study.
Conflicts of Interest
The authors declare no conflicts of interest.
Abbreviations
The following abbreviations are used in this manuscript:
| AD | Alzheimer’s disease |
| APOE | Apolipoprotein E |
| BAI | Beck Anxiety Inventory |
| BDI | Beck Depression Inventory |
| CCQ | Cognitive Complaint Questionnaire |
| CTAD | Clinical Trials on Alzheimer’s Disease Conference |
| INAPAM | Instituto Nacional de las Personas Adultas Mayores |
| INNNMVS | Instituto Nacional de Neurología y Neurocirugía, Manuel Velasco Suárez |
| IQCODE | Informant Questionnaire on Cognitive Decline |
| ISTAART | International Society to Advance Alzheimer’s Research and Treatment |
| MBI | Mild Behavioral Impairment |
| MBI-C | Mild Behavioral Impairment Checklist |
| MCI | Mild Cognitive Impairment |
| MM | Mexican-Mestizos |
| MoCA | Montreal Cognitive Assessment |
| NC | Normal Cognition |
| NPS | Neuropsychiatric symptoms |
| PCA | Principal Components Analysis |
| SCD | Subjective cognitive decline |
| SECIHTI | Secretaría de Ciencia, Humanidades, Tecnología e Innovación |
| SNV | Single Nucleotide Variants |
| UAM | Universidad Autónoma Metropolitana |
| UNAM | Universidad Nacional Autónoma de México |
References
- Cummings, J. The Role of Neuropsychiatric Symptoms in Research Diagnostic Criteria for Neurodegenerative Diseases. Am J Geriatr Psychiatry 2021, 29(4), 375–383. [Google Scholar] [CrossRef]
- Ismail, Z. Neuropsychiatric symptoms as early manifestations of emergent dementia: Provisional diagnostic criteria for mild behavioral impairment. Alzheimers Demen 2016, 12(2), 195–202. [Google Scholar] [CrossRef]
- Soto, M.; Rosenberg, P.; Ballard, C.; Vellas, B.; Miller, D.; Gauthier, S.; Carrillo, M. C.; Lyketsos, C.; Ismail, Z. CTAD Task Force Paper: Neuropsychiatric Symptoms in AD: Clinical Trials Targeting Mild Behavioral Impairment: A Report from the International CTAD Task Force. J Prev Alzheimers Dis 2024, 11(1), 56–64. [Google Scholar] [CrossRef]
- Camargo-Ortega, E.A. Are we missing detection of dementia at early stages in Mexico? A survey of dementia experts. Rev Invest Salud Publica 2024, 66(6), 897–989. [Google Scholar] [CrossRef]
- Banning, L.C.P.; Ramakers, I.H.G.B.; Köhler, S.; Bron, E. E.; Verhey, F. R. J.; de Deyn, P. P.; Claassen, J. A. H.R.; Koek, H. L.; Middelkoop, H. A. M.; van der Flier, W. M.; van der Lugt, A.; Aalten, P. Initiative, Alzheimer’s Disease Neuroimaging Group. The Association Between Biomarkers and Neuropsychiatric Symptoms Across the Alzheimer’s Disease Spectrum. Am J Geriatr Psychiatry 2020, 28(7), 735–744. [Google Scholar] [CrossRef]
- Cozza, M.; Boccardi, V. A narrative review on mild behavioural impairment: an exploration into its scientific perspectives. Aging Clin Exp Res 2023, 35(9), 1807–1821. [Google Scholar] [CrossRef]
- Chatzikostopoulos, A. Mapping the Neuropsychiatric Symptoms in Alzheimer’s Disease Using Biomarkers, Cognitive Abilities, and Personality Traits: A Systematic Review. Diagnostics 2025, 15(9), 1085. [Google Scholar] [CrossRef]
- Ferreira, D.A.; Macedo, L.B.C.; Foss, M.P. Neuropsychiatric symptoms as a prodromal factor in Alzheimer’s type neurodegenerative disease: A scoping review. Clin Neuropsychol 2023, 38(5), 1031–1059. [Google Scholar] [CrossRef] [PubMed]
- Ismail, Z.; McGirr, A.; Gill, S.; Hu, S.; Forkert, N. D.; Smith, E. E. Mild Behavioral Impairment and Subjective Cognitive Decline Predict Cognitive and Functional Decline. J Alzheimers Dis 2021, 80(1), 459–469. [Google Scholar] [CrossRef] [PubMed]
- Ismail, Z. The Mild Behavioral Impairment Checklist (MBI-C): A Rating Scale for Neuropsychiatric Symptoms in Pre-Dementia Populations. J Alzheimers Dis 2017, 56(3), 929–938. [Google Scholar] [CrossRef] [PubMed]
- Jin, P. A review of current evidence for mild behavioral impairment as an early potential novel marker of Alzheimer’s disease. Front Psychiatry 2023, 14, 1099333. [Google Scholar] [CrossRef]
- Guan, D.X.; Rehman, T.; Nathan, S.; Durrani, R.; Potvin, O.; Duchesne, S.; Pike, G. B.; Smith, E. E.; Ismail, Z. Neuropsychiatric symptoms: Risk factor or disease marker? A study of structural imaging biomarkers of Alzheimer’s disease and incident cognitive decline. Hum Brain Mapp 2024, 45(13), e70016. [Google Scholar] [CrossRef]
- Ghahremani, M.; Smith, E.E.; Ismail, Z. Improving dementia prognostication in cognitively normal older adults: conventional versus novel approaches to modelling risk associated with neuropsychiatric symptoms. Br J Psychiatry 2025, 226(3), 129–136. [Google Scholar] [CrossRef]
- Ismail, Z. Affective and emotional dysregulation as pre-dementia risk markers: exploring the mild behavioral impairment symptoms of depression, anxiety, irritability, and euphoria. Int Psychogeriatr 2018, 30(2), 185–196. [Google Scholar] [CrossRef]
- Creese, B.; Griffiths, A.; Brooker, H.; Corbett, A.; Aarsland, D.; Ballard, C.; Ismail, Z. Profile of mild behavioral impairment and factor structure of the Mild Behavioral Impairment Checklist in cognitively normal older adults. Int Psychogeriatr 2020, 32(6), 705–717. [Google Scholar] [CrossRef]
- Gracia-García, P.; López-Antón, R.; de la Cámara, C.; Santabárbara, J.; Lobo, E.; Lobo, A. Mild behavioral impairment in the general population aged 55+ and its association with incident dementia. Alzheimers Dement 2024, 16(4), e12610. [Google Scholar] [CrossRef]
- Mortby, M.E.; Ismail, Z.; Anstey, K.J. Prevalence estimates of mild behavioral impairment in a population-based sample of pre-dementia states and cognitively healthy older adults. Int Psychogeriatr 2018, 30(2), 221–232. [Google Scholar] [CrossRef] [PubMed]
- Pan, Y.; Shea, Y. F.; Li, S.; Chen, R.; Mak, H. K.; Chiu, P. K.; Chu, L. W.; Song, Y. Q. Prevalence of mild behavioural impairment: a systematic review and meta-analysis. Psychogeriatrics 2021, 21(1), 100–111. [Google Scholar] [CrossRef] [PubMed]
- Park, J.I.; ADNI. Prevalence of mild behavioural impairment and its association with cognitive and functional impairment in normal cognition, mild cognitive impairment, and mild Alzheimer’s dementia. Psychogeriatrics 2024, 24(3), 555–564. [Google Scholar] [CrossRef] [PubMed]
- Blasutto, B.; Fattapposta, F.; Casagrande, M. Mild Behavioral Impairment and cognitive functions: A systematic review and meta-analysis. Ageing Res Rev 2025, 105, 102668. [Google Scholar] [CrossRef]
- Rouse, H.J. Impact of Mild Behavioral Impairment on Longitudinal Changes in Cognition. J Gerontol A Biol Sci Med Sci 2024, 79(1), glad098. [Google Scholar] [CrossRef] [PubMed]
- Tang, S.L. Risk factors of mild behavioral impairment: a systematic review. Front Psychol 2025, 16, 1586418. [Google Scholar] [CrossRef] [PubMed]
- Matuskova, V. Mild behavioral impairment in early Alzheimer’s disease and its association with APOE and BDNF risk genetic polymorphisms. Alzheimers Res Ther 2024, 16(1), 21. [Google Scholar] [CrossRef] [PubMed]
- Scheuermann, J.S. Mild behavioral impairment in people with mild cognitive impairment: Are the two conditions related? J Alzheimers Dis 2024, 102(3), 792–800. [Google Scholar] [CrossRef]
- Jackson, R.J.; Hyman, B.T.; Serrano-Pozo, A. Multifaceted roles of APOE in Alzheimer disease. Nat Rev Neurol 2024, 20(8), 457–474. [Google Scholar] [CrossRef]
- Genis-Mendoza, A.D. Programa de detección del alelo APOE-E4 en adultos mayores mexicanos con deterioro cognitivo. Gac Med Mex 2018, 154(5), 555–560. [Google Scholar] [CrossRef]
- Angelopoulou, E. Exploring the Genetic Landscape of Mild Behavioral Impairment as an Early Marker of Cognitive Decline: An Updated Review Focusing on Alzheimer’s Disease. Int J Mol Sci 2024, 25(5), 2645. [Google Scholar] [CrossRef]
- Vellone, D. Apathy and APOE in mild behavioral impairment, and risk for incident dementia. Alzheimers Dement (N Y) 2022, 8(1), e12370. [Google Scholar] [CrossRef]
- Suriyawong, W. Mild Behavioral Impairment as a Mediator of the Relationships Among Perceived Stress, Social Support, Physical Activity, and Cognitive Function in Older Adults with Transitional Cognitive Decline: A Structural Equation Modelling Analysis. Can J Aging 2025, 44(3), 413–421. [Google Scholar] [CrossRef]
- Guan, D.X. Vascular risk factor associations with subjective cognitive decline and mild behavioral impairment. Brain Commun 2025, 7(3), fcaf163. [Google Scholar] [CrossRef]
- Creese, B. Genetic risk for Alzheimer’s disease, cognition, and mild behavioral impairment in healthy older adults. Alzheimers Dement (Amst) 2021, 13(1), e12164. [Google Scholar] [CrossRef]
- Cruz-Orduña, I. Detecting MCI and dementia in primary care: effectiveness of the MMS, the FAQ and the IQCODE. Fam Pract 2012, 29(4), 401–6. [Google Scholar] [CrossRef]
- Nuñez, S.L.; Bruno, D. Validación del Cuestionario de Quejas Cognitivas. Neurología Argentina 2021, 13(3), 137–144. [Google Scholar] [CrossRef]
- Nasreddine, Z.S. The Montreal Cognitive Assessment, MoCA: A Brief Screening Tool For Mild Cognitive Impairment. J Am Geriatr Soc 2005, 53, 695–699. [Google Scholar] [CrossRef]
- Aguilar-Navarro, S.G. Validity and Reliability of the Spanish Version of the Montreal Cognitive Assessment (MoCA) for the Detection of Cognitive Impairment in Mexico. Rev Colomb Psiquiatr (Engl Ed) 2018, 47(4), 237–243. [Google Scholar] [CrossRef]
- Islam, N. Accuracy of the Montreal Cognitive Assessment tool for detecting mild cognitive impairment: A systematic review and meta-analysis. Alzheimers Dement 2023, 19(7), 3235–3243. [Google Scholar] [CrossRef]
- Pugh, E.A. Effects of Normative Adjustments to the Montreal Cognitive Assessment. Am J Geriatr Psychiatry 2018, 26(12), 1258–1267. [Google Scholar] [CrossRef]
- Jurado, S. La estandarización del Inventario de Depresión de Beck para los residentes de la Ciudad de México. Salud Ment 1998, 21(3), 26–31. [Google Scholar]
- Robles, R. Versión mexicana del Inventario de Ansiedad de Beck: propiedades psicométricas. Rev Mex Psicol 2001, 18(2), 211–218. [Google Scholar]
- Del-Ser, T. Application of a Spanish version of the “Informant Questionnaire on Cognitive Decline in the Elderly” in the clinical assessment of dementia. Alzheimer Dis Assoc Disord 1997, 11(1), 3–8. [Google Scholar] [CrossRef]
- Aguera-Ortiz, L.F. Mild behavioural impairment as an antecedent of dementia: presentation of the diagnostic criteria and the Spanish version of the MBI-C scale for its evaluation. Rev Neurol 2017, 65(7), 327–334. [Google Scholar]
- Cui, Y. Reliability and Validity of the Chinese Version of the Mild Behavioral Impairment Checklist for Screening for Alzheimer’s Disease. J Alzheimers Dis 2019, 70(3), 747–756. [Google Scholar] [CrossRef]
- Matsuoka, T. Relationship between Loneliness and Mild Behavioral Impairment: Validation of the Japanese Version of the MBI Checklist and a Cross-Sectional Study. J Alzheimers Dis 2024, 97(4), 1951–1960. [Google Scholar] [CrossRef]
- Jack, C.R. Revised criteria for diagnosis and staging of Alzheimer’s disease: Alzheimer’s Association Workgroup. Alzheimers Dement 2024, 20(8), 5143–5169. [Google Scholar] [CrossRef]
- Jack, C.R. NIA-AA Research Framework: Toward a biological definition of Alzheimer’s disease. Alzheimers Dement 2018, 14(4), 535–562. [Google Scholar] [CrossRef]
- Jessen, F. The characterisation of subjective cognitive decline. Lancet Neurol 2020, 19(3), 271–278. [Google Scholar] [CrossRef]
- Petersen, R.C. Mild Cognitive Impairment. Continuum (Minneap Minn) 2016, 22(2 Dementia), 404–18. [Google Scholar] [CrossRef]
- Winblad, B. Mild cognitive impairment--beyond controversies, towards a consensus: report of the International Working Group on Mild Cognitive Impairment. Journal of Internal Medicine J Intern Med 2004, 256(3), 240–6. [Google Scholar] [CrossRef]
- Greenacre, M.; Groenen, P.J.F; Hastie, T; Iodice D’Enza, A.; Markos, A.; Tuzhilina, H. Principal Component Analysis. Rev. Methods Primers 2022, 2(1), 100. [Google Scholar] [CrossRef]
- Olivoto, T.; Dal’Col Lúcio, A. metan: An R package for multi-environment trial analysis. Methods Ecol Evol 2020, 11(6), 783–789. [Google Scholar] [CrossRef]
- Barberena-Jonas, C. Genetic analysis of APOE reveals distinct origins and distribution of ancestry-enrichment haplotypes in the Mexican Biobank. Genes Dis 2025, 13(1), 101542. [Google Scholar] [CrossRef]
- López, M. Apolipoprotein E ε4 allele is associated with Parkinson disease risk in a Mexican Mestizo population. Mov Disord 2007, 22(3), 417–20. [Google Scholar] [CrossRef]
- Martínez-Magaña, J.J. Association between APOE polymorphisms and lipid profile in Mexican Amerindian population. Mol Genet Genomic Med 2019, 7(11), e958. [Google Scholar] [CrossRef]
- Sheikh, F. Prevalence of mild behavioral impairment in mild cognitive impairment and subjective cognitive decline, and its association with caregiver burden. Int Psychogeriatr 2018, 30(2), 233–244. [Google Scholar] [CrossRef]
- Leow, Y.J. Mild Behavioral Impairment and Cerebrovascular Profiles Are Associated with Early Cognitive Impairment in a Community-Based Southeast Asian Cohort. Alzheimers Dis 2024, 97(4), 1727–1735. [Google Scholar] [CrossRef]
- Pan, Y. Prevalence of mild behavioural impairment domains: a meta-analysis. Psychogeriatrics 2022, 22(1), 84–98. [Google Scholar] [CrossRef]
- Wise, E.A. Time course of neuropsychiatric symptoms and cognitive diagnosis in National Alzheimer’s Coordinating Centers volunteers. Alzheimers Dement (Amst) 2019, Apr18(11), 333–339. [Google Scholar] [CrossRef]
- Kim, T.H. Late-life emergence of neuropsychiatric symptoms and risk of cognitive impairment in cognitively unimpaired individuals. Alzheimers Dement 2025, 21(8), e70619. [Google Scholar] [CrossRef]
- Mallo, S.C. Assessing mild behavioral impairment with the mild behavioral impairment checklist in people with subjective cognitive decline. Int Psychogeriatr 2019, 31(2), 231–239. [Google Scholar] [CrossRef]
- Taragano, F.E. Mild behavioral impairment and risk of dementia: a prospective cohort study of 358 patients. J Clin Psychiatry 2009, 70(4), 584–92. [Google Scholar] [CrossRef]
- Rao, A.R. Behavioural issues in late life may be the precursor of dementia- A cross sectional evidence from memory clinic of AIIMS, India. PLoS One 2020, 15(6), e0234514. [Google Scholar] [CrossRef]
- Becker, E. Anxiety as a risk factor of Alzheimer’s disease and vascular dementia. Br J Psychiatry 2018, 213(5), 654–660. [Google Scholar] [CrossRef]
- Creese, B.; Ismail, Z. Mild behavioral impairment: measurement and clinical correlates of a novel marker of preclinical Alzheimer’s disease. Alzheimers Res Ther 2022, 14(1), 2. [Google Scholar] [CrossRef]
- Kan, C.N. Comorbid cerebrovascular and neurodegenerative burden in mild behavioural impairment and their impact on clinical trajectory. Acta Neuropsychiatr 2025, Mar 13, 37, e53. [Google Scholar] [CrossRef]
- Miao, R. White matter hyperintensities and mild behavioral impairment: Findings from the MEMENTO cohort study. Cereb Circ Cogn Behav 2021, Sep 14:2, 100028. [Google Scholar] [CrossRef]
- Wardlaw, J.M.; Smith, C.; Dichgans, M. Small vessel disease: mechanisms and clinical implications. Lancet Neurology Lancet Neurol 2019, 18(7), 684–696. [Google Scholar] [CrossRef]
- Livingston, G. Dementia prevention, intervention, and care: 2024 report of the Lancet standing Commission. Lancet 2024, 404(10452), 572–628. [Google Scholar] [CrossRef]
Figure 1.
Flow chart illustrating the procedures and assessments carried out on the participants.
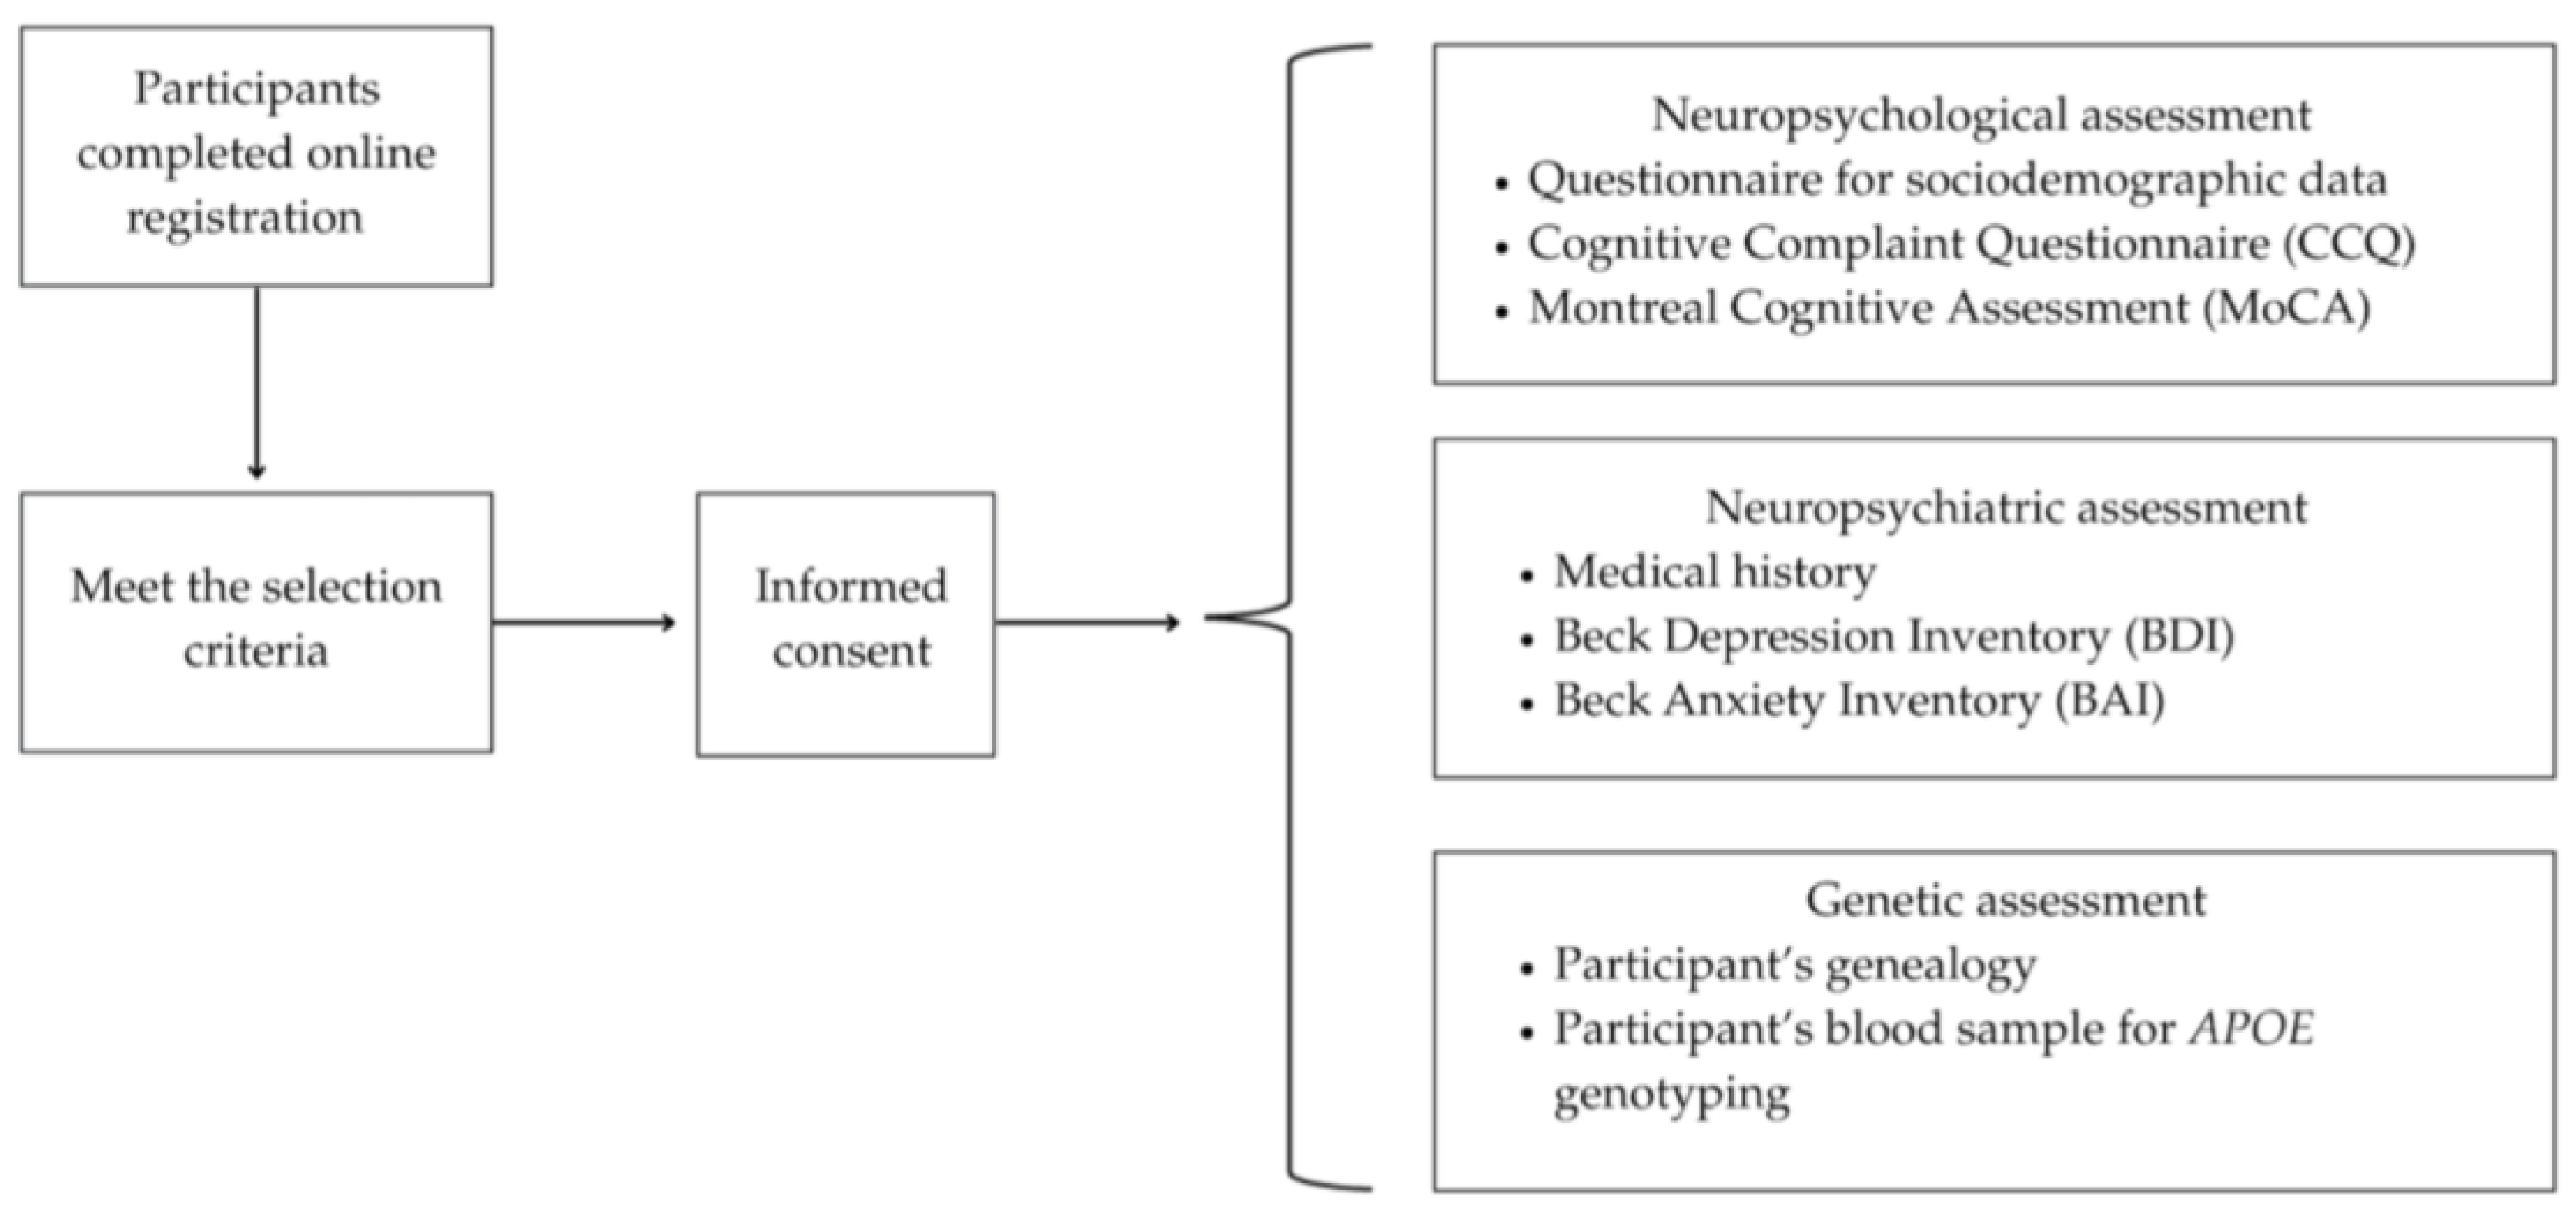
Figure 2.
Boxplots showing the score for each domain of the Mild Behavioral Impairment-Checklist according to the APOEε4 carrier status of participants. Each bar corresponds to the APOEε4 carrier status: absence (white), one allele (light gray) or two APOEε4 alleles (dark gray), respectively. *p<0.05.
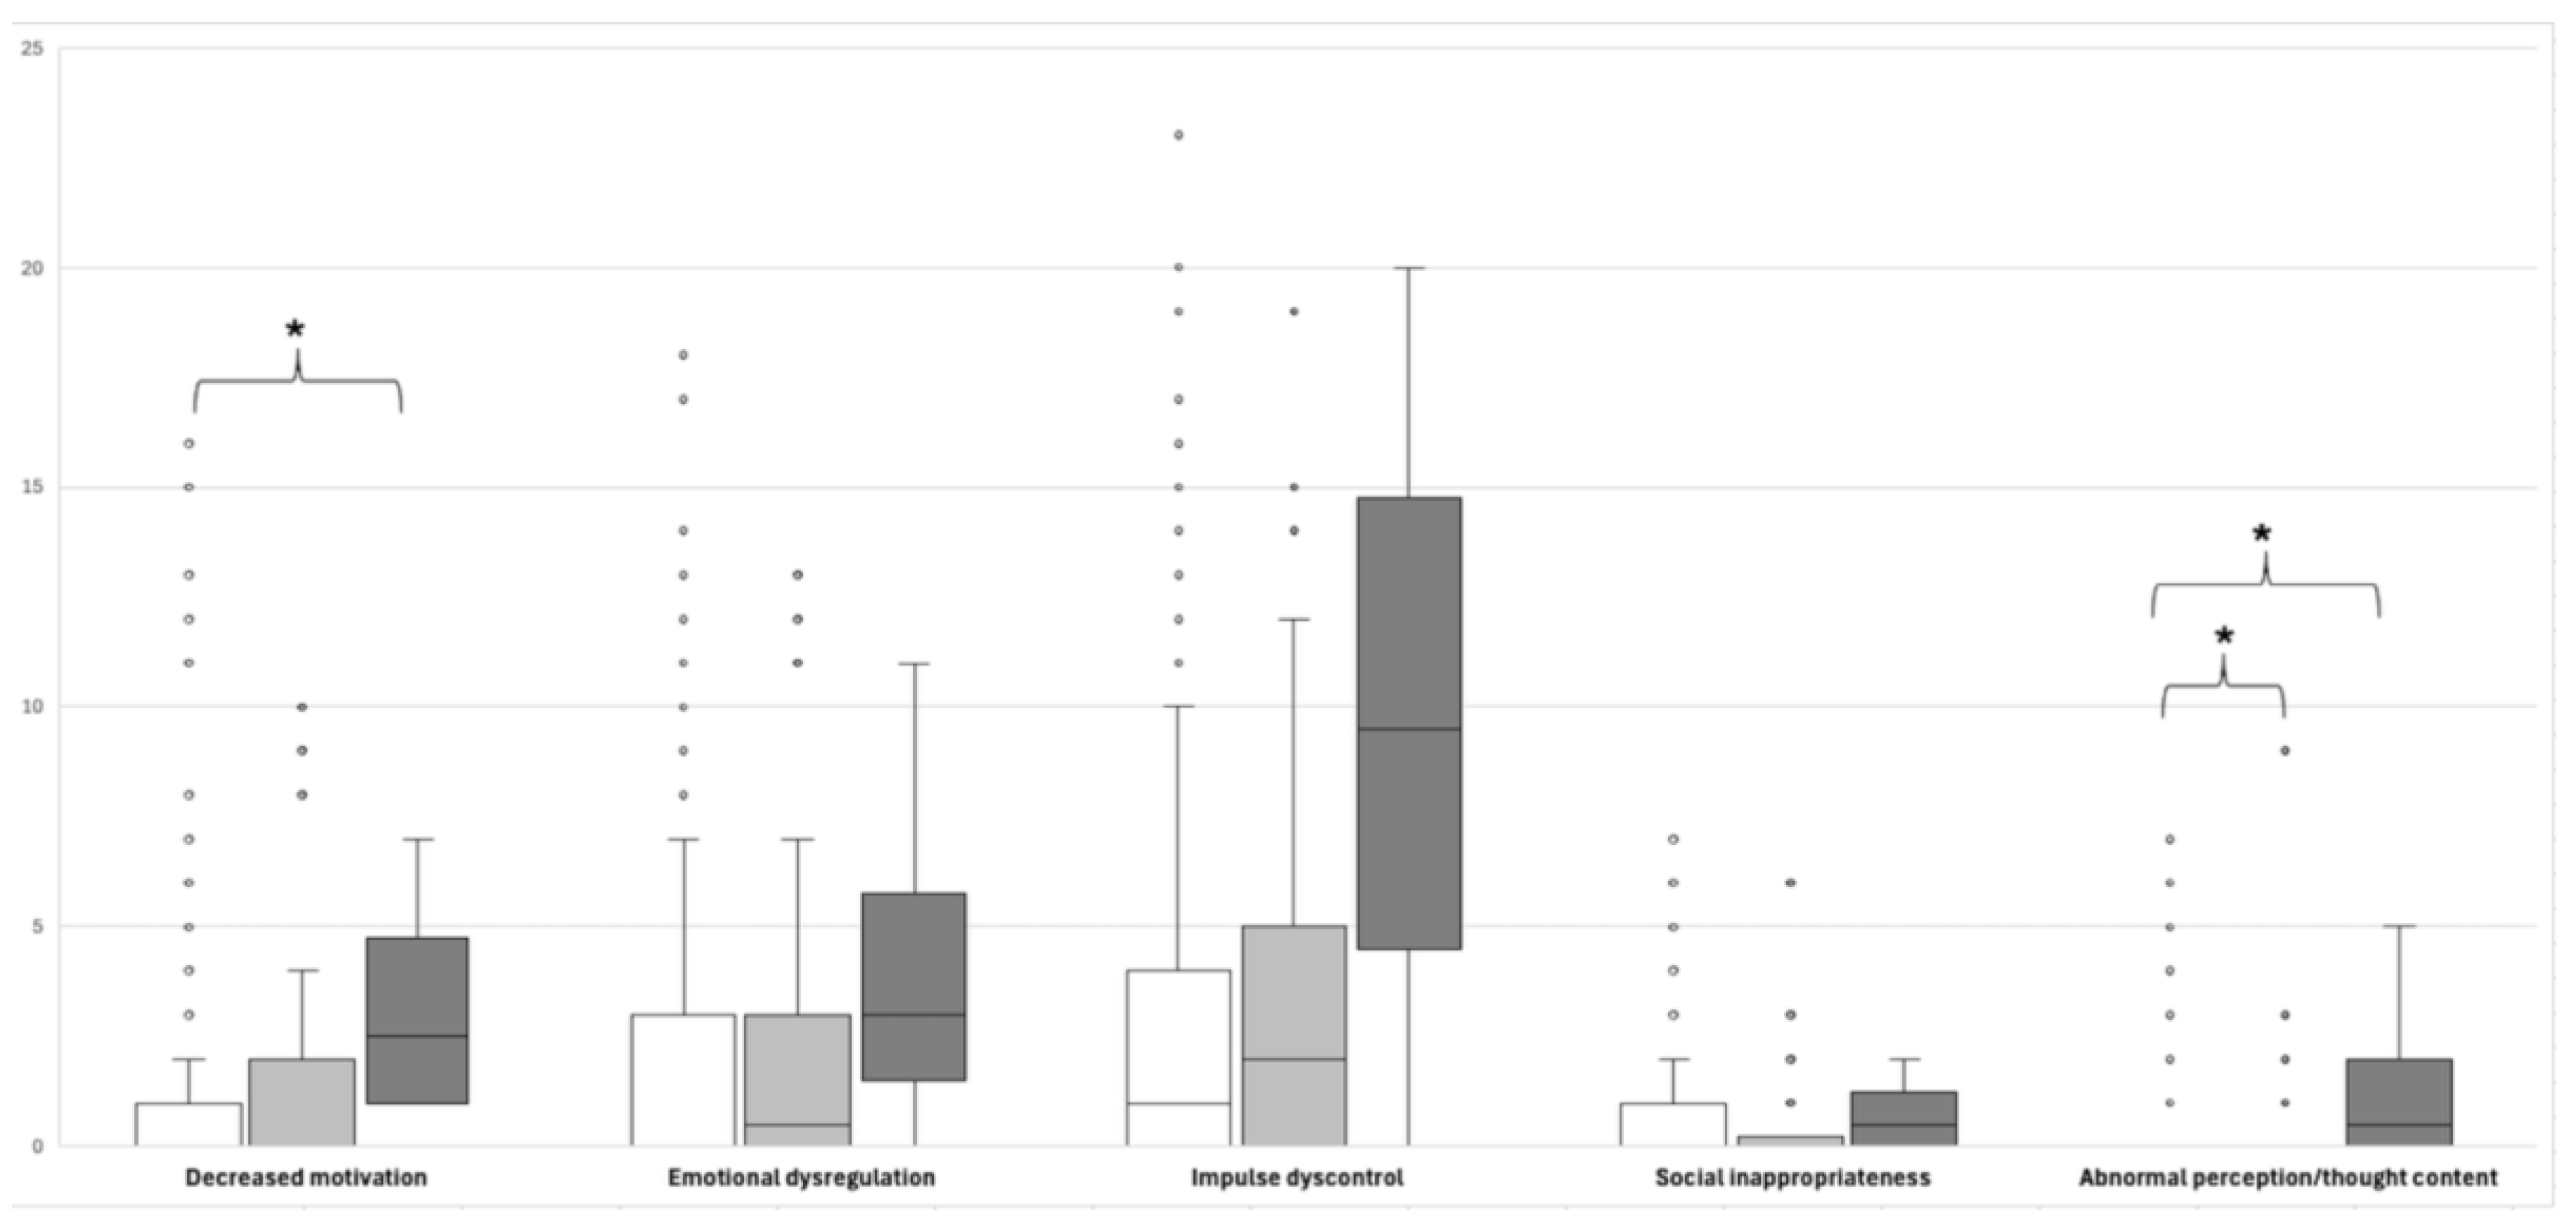
Figure 3.
Multivariate correlation analysis of age, antecedents of depression or anxiety, and psychological variables evaluated in the participants. Pearson’s correlation was used. *p<0.05, **p<0.01. CCQ, Cognitive Complaint Questionnaire; IQCODE: Informant Questionnaire on Cognitive Decline in the Elderly; BDI, Beck Depression Inventory; BAI: Beck Anxiety Inventory. Cognitive status was codified as follows: 1=NC, 2= SCD and, 3=MCI.
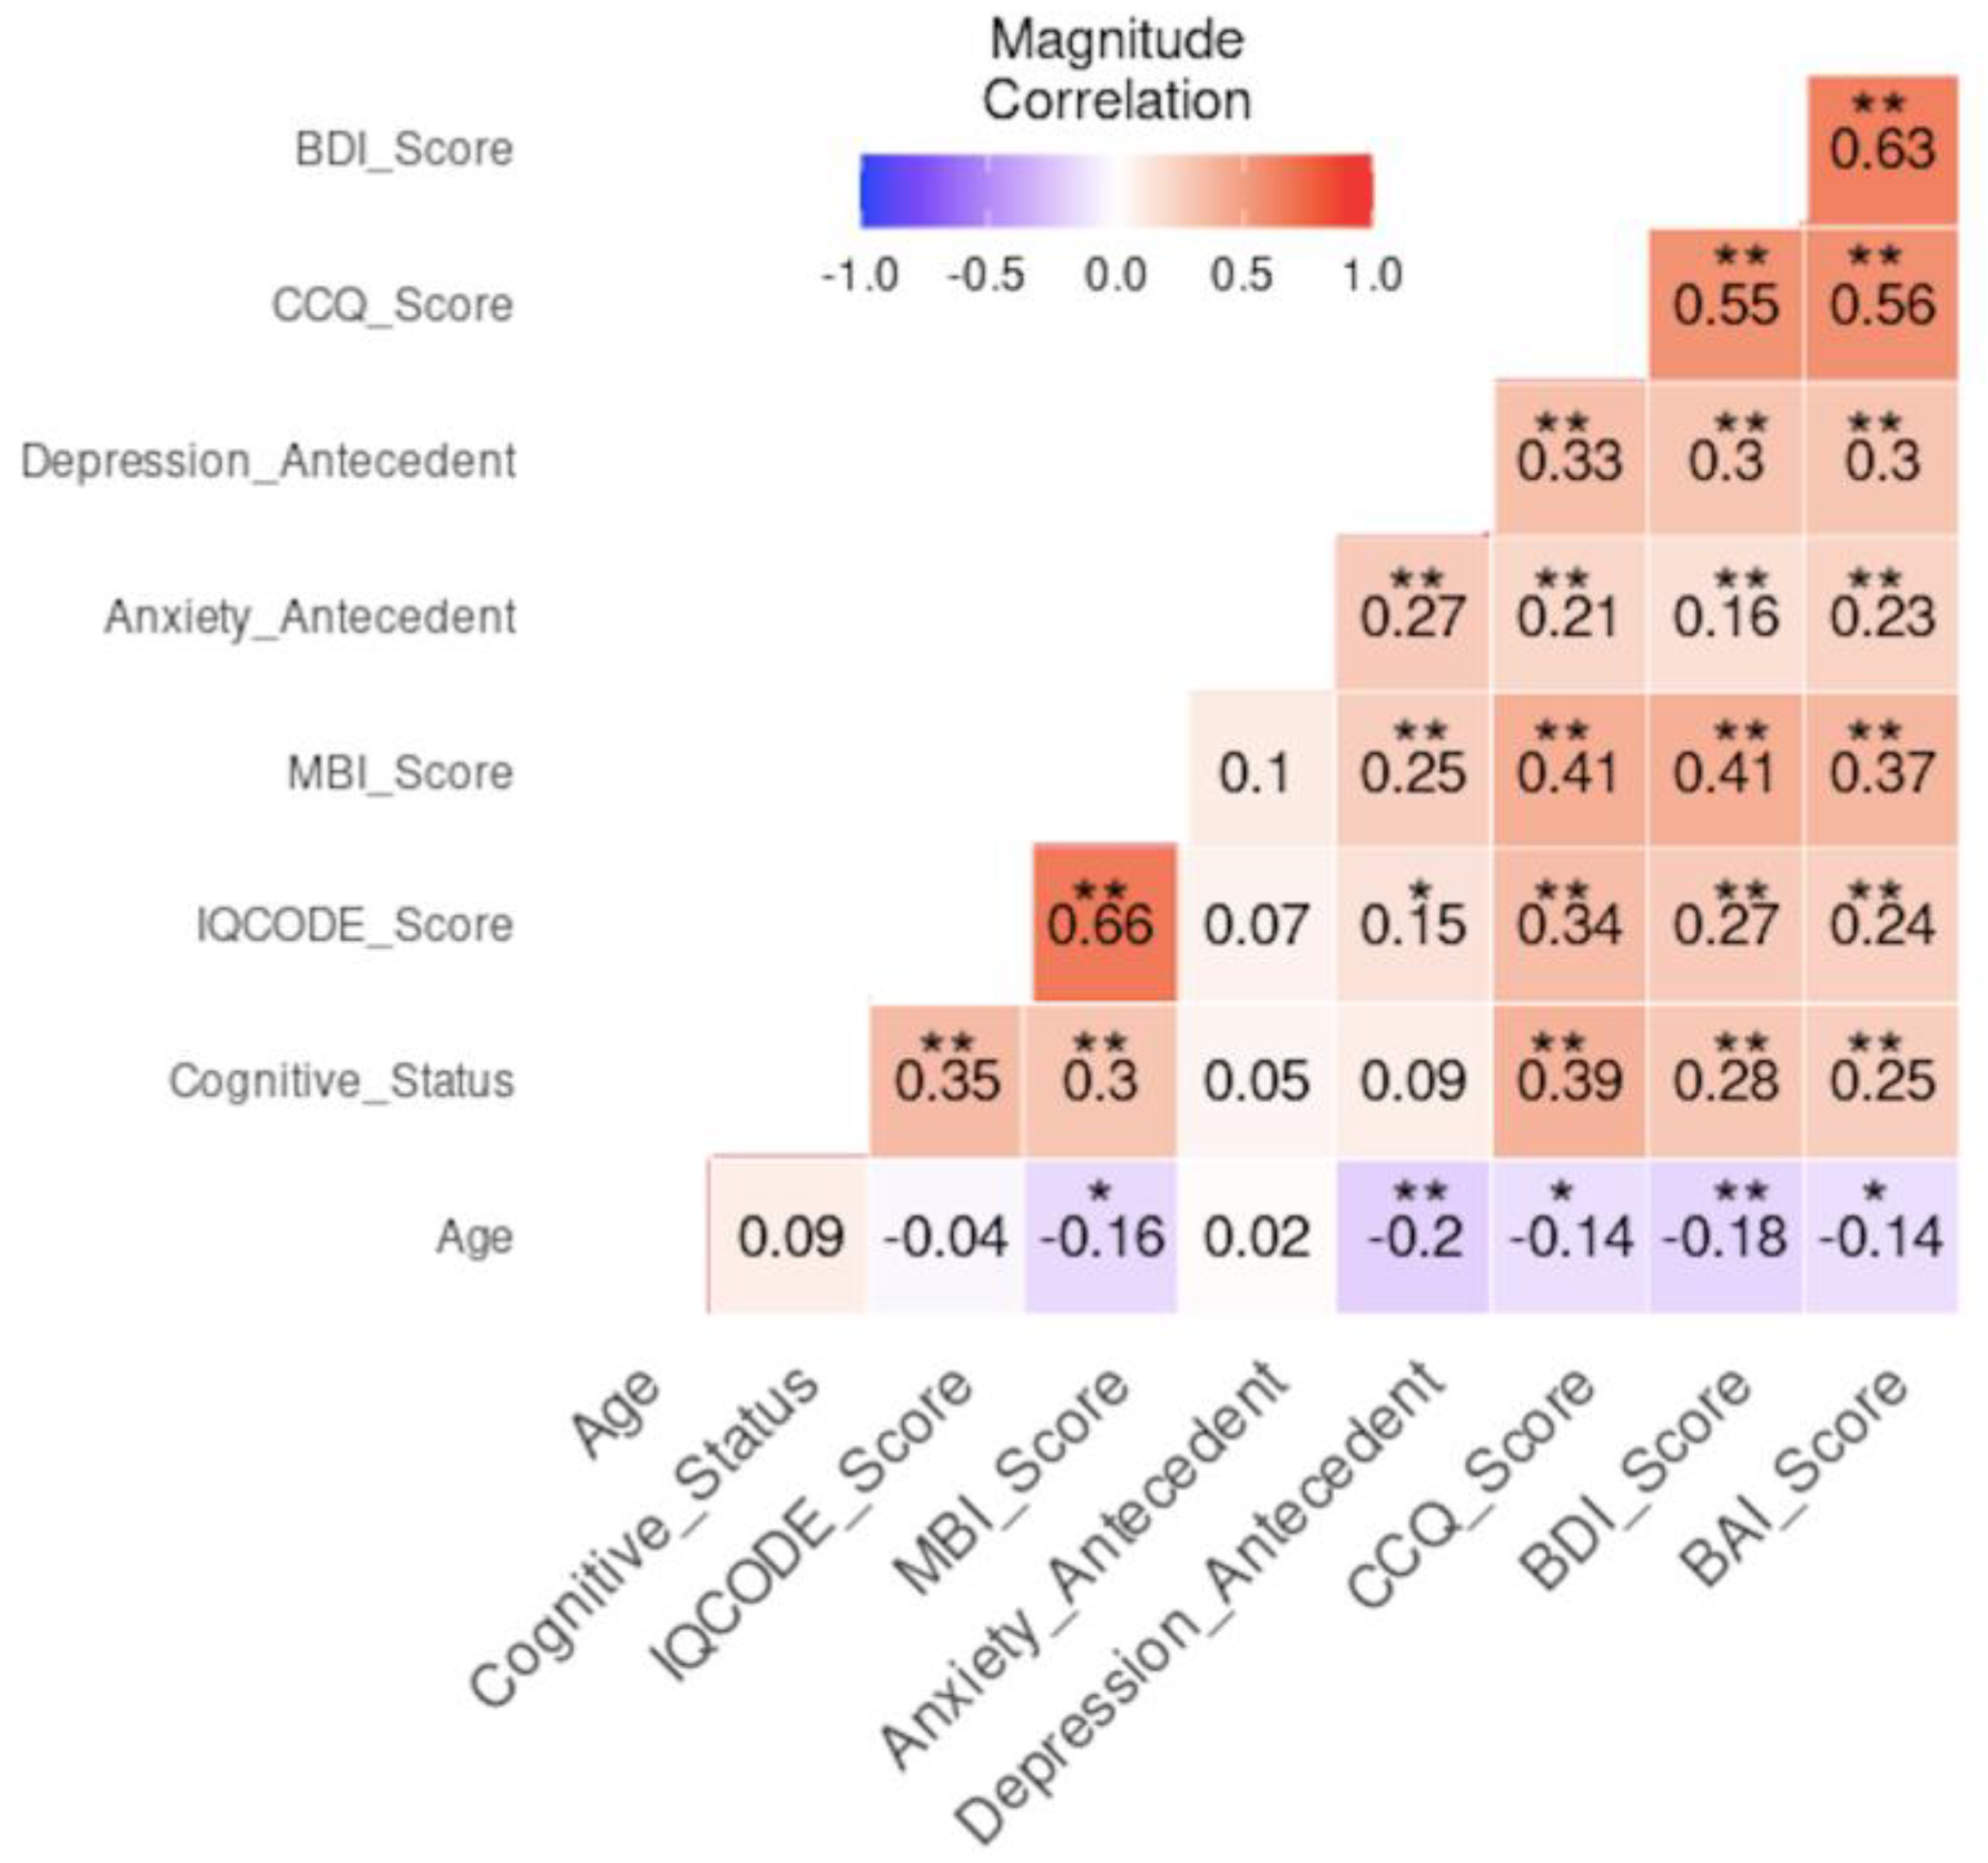
Figure 4.
Principal Component Analysis (PCA) applied to cognitive status of participants. (a) PCA biplot of cognitive status, coded as follows: 1=normal cognition (red), 2= subjective cognitive decline (green) and 3=mild cognitive impairment (blue). Colored arrows indicate the percentage of contribution of variables, the code for this color gradient is depicted in the right bar. Principal Components, PC1 and PC2, contributed with 34.3% and 19.3% of variance, respectively. (b) Heatmap of the correlation analysis of PCA vs covariables. Five PCs are shown. The color gradient bar on the right indicates the magnitude of the correlation and its significance is symbolized by asterisks, *p<0.05, **p<0.01, ***<0.001. BDI, Beck Depression Inventory; BAI: Beck Anxiety Inventory, Cognitive Complaint Questionnaire; IQCODE: Informant Questionnaire on Cognitive Decline in the Elderly; MBI-C, Mild Behavioral Impairment-Checklist; MoCA: Montreal Cognitive Assessment.
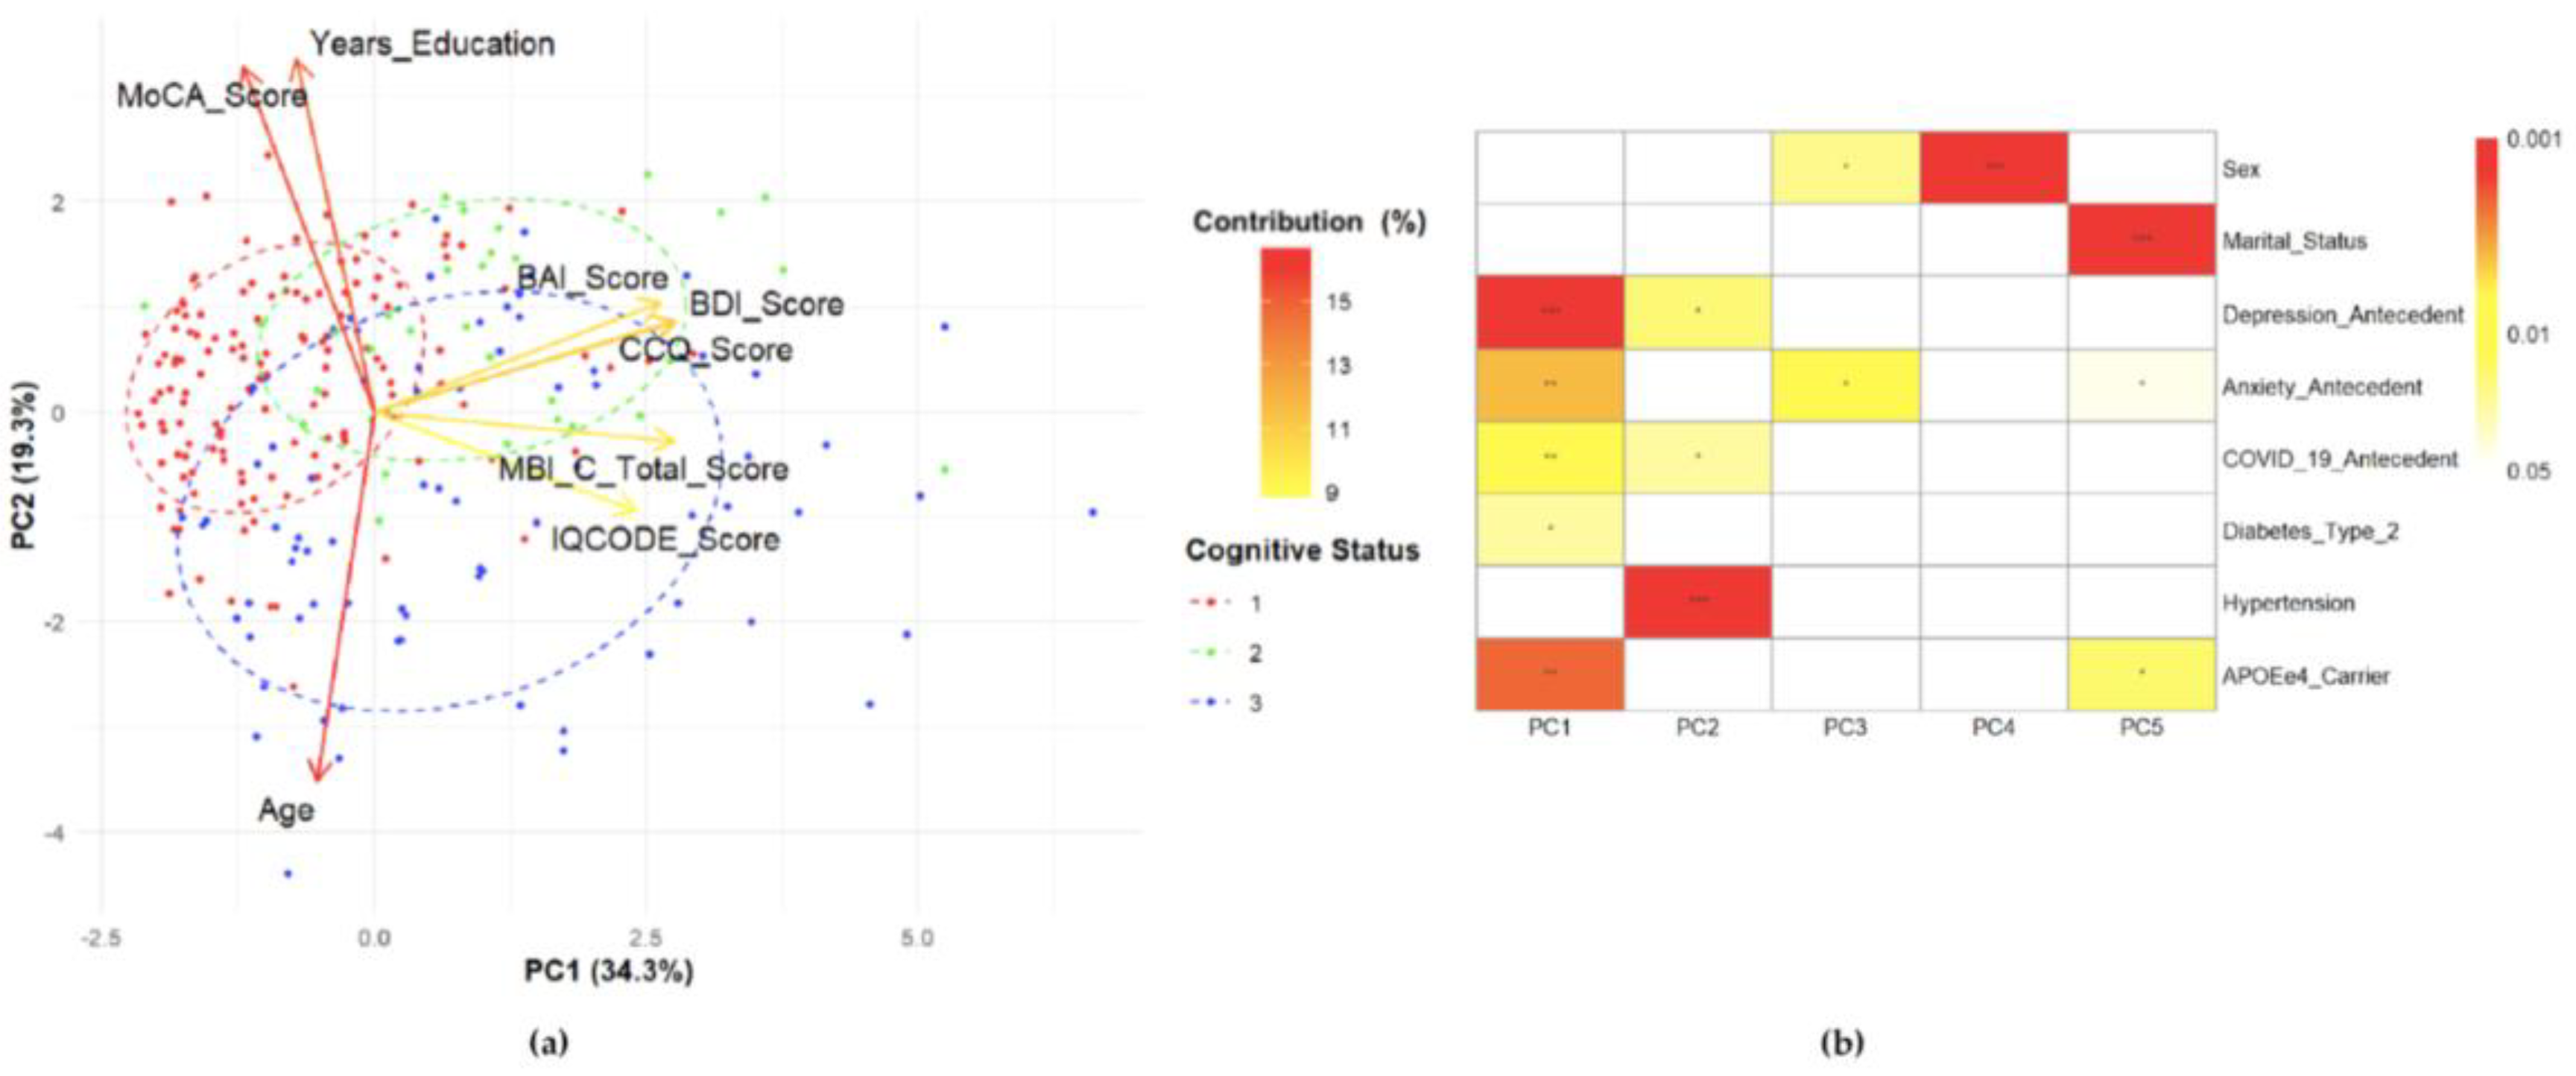

Table 1.
Sociodemographic, cognitive, clinical and genetic characteristics according to the cognitive status of the participants (N=246).
Table 1.
Sociodemographic, cognitive, clinical and genetic characteristics according to the cognitive status of the participants (N=246).
| NC (N=138) |
SCD (N=32) |
MCI (N=76) |
p-value | |
|---|---|---|---|---|
|
Sex (%) Male Female |
22 (15.9) 116 (84.1) |
4 (12.5) 28 (87.5) |
15 (19.7) 61 (80.3) |
0.616 |
|
Age (in years) μ ±SD Range |
69.42±6.27 60 – 87 |
69.4±74.08 60 – 87 |
70.91±6.40 60 – 85 |
0.277 |
|
Y. education μ±SD Range |
14.11±3.22 6 – 22 |
14.05±2.70 9 – 19 |
12.34±4.19 6 – 22 |
0.004** |
|
Marital status (%) W/o partner With partner |
81 (58.7) 57 (41.3) |
23 (71.9) 9 (28.1) |
40 (52.6) 36 (47.5) |
0.179 |
|
MoCA μ±SD Range |
26.72±1.65 25 – 30 |
26.94±1.41 25 – 30 |
21.26±2.31 12 – 24 |
≤0.001*** SCD vs MCI≤0.001*** NC vs MCI≤0.001*** |
|
CCQ μ±SD Min-Max |
10.04±6.04 0 – 21 |
28.31±5.99 22 – 43 |
18.07±12.57 0 – 54 |
≤0.001*** |
|
IQCODE μ±SD Range |
81.67±5.12 66 – 117 |
83.88±9.79 40 – 101 |
86.70±8.57 78 – 125 |
≤0.001*** NC vs SCD=0.004** NC vs MCI≤0.001*** |
|
BDI μ±SD Range |
4.31±4.31 0 – 22 |
8.22±5.98 1 – 23 |
7.78±6.50 0 – 25 |
≤0.001*** NC vs SCD≤0.001*** NC vs MCI≤0.001*** |
|
BAI μ±SD Range |
3.18±4.19 0 – 23 |
8.09±6.32 0 – 21 |
5.66±5.95 0 – 29 |
≤0.001*** NC vs SCD≤0.001*** NC vs MCI=0.004** |
|
APOE N (%) Allele ε2 Allele ε3 Allele ε4 |
5 (1.81) 250 (90.58) 21 (7.61) |
2 (3.13) 51 (79.69) 11 (17.18) |
3 (1.97) 129 (84.87) 20 (13.16) |
0.793 NC vs SCD&MCI=0.021 SCD vs NC&MCI=0.018 |
Kruskal-Wallis and post-hoc tests were used for comparisons of three groups. Fisher (two groups) and χ2 (≥3 groups) tests were used for categorical variables, **p<0.01, ***p<0.001. NC, normal cognition; SCD, subjective cognitive decline; MCI, mild cognitive impairment; N, number; μ, mean value; SD, standard deviation; Y, years; MoCA: Montreal Cognitive Assessment; CCQ, Cognitive Complaint Questionnaire; IQCODE: Informant Questionnaire on Cognitive Decline in the Elderly; Beck Depression Inventory; BAI: Beck Anxiety Inventory.
Table 2.
Comparison of sociodemographic, cognitive, and clinical characteristics, as well as APOE status, between participants with and without MBI.
Table 2.
Comparison of sociodemographic, cognitive, and clinical characteristics, as well as APOE status, between participants with and without MBI.
| Characteristic | Total (N= 246) |
MBI | p-value | |
|---|---|---|---|---|
| Yes (N=91) | No (N=155) | |||
|
Cognitive status (%) NC SCD MCI |
138 32 76 |
36 (26.1) 19 (59.4) 36 (47.4) |
102 (73.9) 13 (40.6) 40 (52.6) |
≤0.001*** ≤0.001*** 0.006** 0.032* |
|
Sex (%) Male Female |
41 205 |
19(46.3) 72 (35.1) |
22 (53.7) 133 (64.9) |
0.215 |
|
Age (years) |
μ±SD Range |
68.48±6.42 60 – 84 |
70.70±6.60 60 – 87 |
0.009** |
|
Y. education |
μ±SD Range |
13.73±3.79 6 – 22 |
13.46±3.44 6 – 22 |
0.379 |
|
Marital status (%) With partner W/o partner |
102 144 |
44 (48.4) 47 (51.6) |
58 (37.4) 97 (62.6) |
0.108 |
|
Antecedents (%)§ Depression Anxiety Diabetes type 2 Hypertension COVID-19 |
100 70 61 106 139 |
49 (53.8) 33 (36.3) 22 (24.2) 46 (50.5) 56 (61.5) |
51 (32.9) 37 (23.9) 39 (25.2) 60 (38.7) 83 (53.5) |
0.002* 0.041* 1.000 0.083 0.234 |
|
Clinical scales (μ±SD) MoCA CCQ IQCODE BDI BAI |
25.06±3.14 14.89±10.64 83.51±7.38 5.89±5.57 4.59±5.37 |
24.85±3.24 20.12±11.77 88.56±8.36 8.58±6.36 6.70±6.17 |
25.19±3.09 11.83±8.58 80.54±4.66 4.31±4.36 3.34±4.40 |
0.440 ≤0.001*** ≤0.001*** ≤0.001*** ≤0.001*** |
|
APOE alleles (%) ε2 ε3 ε4 # copies of ε4 allele 01 2 |
10 430 47 198 44 4 |
3 (1.65) 157 (86.26) 22 (12.09) 72 (79.1) 16 (17.6) 3 (3.3) |
7 (2.26) 273 (88.06) 30(9.68) 126 (81.3) 28(18.1) 1 (0.67) |
0.751 0.576 0.448 0.284 |
Data were analyzed by Mann-Whitney test for continuous variables with 2 groups. Fisher and χ2 tests were used when 2 or ≥3 groups of categorical variables were compared, respectively. *p<0.05, **p<0.01, ***p<0.001. N, number; μ, mean value. SD, standard deviation. Y, years. W/o, without. NC: normal cognition; SCD, subjective cognitive decline; MCI, mild cognitive impairment; MoCA: Montreal Cognitive Assessment; CCQ, Cognitive Complaint questionnaire; IQCODE: Informant Questionnaire on Cognitive Decline in the Elderly; BDI, Beck Depression Inventory; BAI: Beck Anxiety Inventory. §Some participants reported ≥2 antecedents, therefore the percentages add up to >100. The intervals of confidence of APOE allele frequencies for the group with MBI were (IC95%) ε2=0.62-8.77, ε3=104.96-150.02 and ε4=9.90-27.22. In the group without MBI were, as follows: (IC95%) ε2=2.81-14.42, ε3=232.17-296.78 and ε4=20.24-42.83.
Table 3.
Domains of the Mild Behavioral Impairment-Checklist (MBI-C) compared by APOEε4 carrier status of participants.
Table 3.
Domains of the Mild Behavioral Impairment-Checklist (MBI-C) compared by APOEε4 carrier status of participants.
| MBI-C scoring (μ±SD) |
Carrier of APOEε4 allele | Number of copies of APOEε4 allele | |||||
|---|---|---|---|---|---|---|---|
| Yes (N=48) |
No (N=198) |
p- value |
0(N=198) | 1 (N=44) |
2 (N=4) |
p-value | |
| Total MBI-C | 9.46±12.58 | 7.21±11.17 | 0.109 | 7.21±11.17 | 8.55± 11.70 | 19.50±19.28 | 0.114 |
| Decreased motivation | 1.75±2.92 | 1.33 ±2.92 | 0.129 | 1.33±2.92 | 1.61±2.80 | 3.25±2.87 | 0.039*↟ |
| Affective and emotional dysregulation | 2.50±3.81 | 2.24±3.67 | 0.716 | 2.24±3.67 | 2.34±3.74 | 4.25±4.79 | 0.456 |
| Impulse dyscontrol | 4.21±5.40 | 2.72 ±4.06 | 0.054 | 2.72±4.03 | 3.70±4.85 | 9.75 ±8.66 | 0.069 |
| Social inappropriateness | 0.56±1.17 | 0.57 ±1.24 | 0.848 | 0.57±1.23 | 0.55±1.19 | 0.75 ±0.58 | 0.626 |
| Abnormal perception or thought content |
0.44±1.54 | 0.36 ±1.19 | 0.932 | 0.36±1.19 | 0.34±1.44 | 1.50±2.38 | 0.063↡ |
Data were analyzed by Mann-Whitney test or Kruskal-Wallis and post-hoc test, accordingly. *p<0.05. μ, mean value. SD, standard deviation. ↟Comparison between 0 vs 2 alleles, p=0.013. ↡Comparison between 0 vs 2 alleles, p= 0.027* and 1 vs 2, p= 0.021.*.
Table 4.
Association between variables of interest and presence of mild behavioral impairment.
| Variable | Odds Ratio [CI 95%] | p-value |
|---|---|---|
| NC SCD |
0.340 [0.199 - 0.581] 2.883 [1.348 - 6.166] |
< 0.001*** 0.006** |
| MCI Age≥70 years Age <70 years Subjective Cognitive Complaint (by CCQ) Informant Cognitive Complaint (by IQCODE) |
1.882 [1.082 - 3.272] 0.550 [0.325 - 0.929] 1.819[1.076 - 3.074] 4.706 [2.569 - 8.623] 15.889 [7.729 - 32.665] |
0.025* 0.025* 0.025* < 0.001*** < 0.001*** |
| Antecedent of depression | 2.379 [1.399 - 4.047] | < 0.001*** |
| Depression (by BDI) Antecedent of anxiety |
4.905 [2.595 - 9.271] 1.815 [1.032 - 3.192] |
< 0.001*** 0.039* |
| Anxiety (by BAI) | 2.833 [1.625 - 4.939] | < 0.001*** |
CI: confidence interval; NC: normal cognition; SCD, subjective cognitive decline; MCI, mild cognitive impairment; CCQ, Cognitive Complaint Questionnaire; IQCODE: Informant Questionnaire on Cognitive Decline in the Elderly; BDI, Beck Depression Inventory; BAI: Beck Anxiety Inventory. Cut-off values for BDI and BAI were 10 and 6, respectively. *p<0.05, **p<0.01, ***p<0.001.
Table 5.
Principal component analysis (PCA) applied to cognitive status of Mexican older adults.
| Variable | Component | ||
|---|---|---|---|
| 1 | 2 | 3 | |
| Eigenvalue | 2.74 | 1.55 | 1.15 |
| % Variance Component | 34.3 | 19.3 | 14.4 |
| % Variance Variable CCQ BDI MBI-C BAI IQCODE MoCA Years of education Age |
20.276 20.146 20.113 18.293 15.323 3.800 1.328 0.719 |
1.940 1.982 0.204 2.865 2.337 28.340 29.767 32.564 |
1.359 14.992 19.506 20.181 35.246 0.313 3.173 5.231 |
CCQ, Cognitive Complaint Questionnaire; BDI, Beck Depression Inventory; MBI-C, Mild Behavioral Impairment-Checklist; BAI: Beck Anxiety Inventory; IQCODE: Informant Questionnaire on Cognitive Decline in the Elderly; MoCA: Montreal Cognitive Assessment.
Disclaimer/Publisher’s Note: The statements, opinions and data contained in all publications are solely those of the individual author(s) and contributor(s) and not of MDPI and/or the editor(s). MDPI and/or the editor(s) disclaim responsibility for any injury to people or property resulting from any ideas, methods, instructions or products referred to in the content. |
© 2025 by the authors. Licensee MDPI, Basel, Switzerland. This article is an open access article distributed under the terms and conditions of the Creative Commons Attribution (CC BY) license (http://creativecommons.org/licenses/by/4.0/).
Copyright: This open access article is published under a Creative Commons CC BY 4.0 license, which permit the free download, distribution, and reuse, provided that the author and preprint are cited in any reuse.


