
Submitted:
12 December 2025
Posted:
15 December 2025
You are already at the latest version
Abstract
This dataset provides synchronized multimodal behavioral measurements from 36 mice across four experimental groups: wild-type and rTg4510 tauopathy mice, each tested with or without doxycycline-mediated suppression of mutant tau expression. At six months of age, all animals underwent three standardized behavioral paradigms: home-cage monitoring, ten-day trace eyeblink conditioning, and contextual fear conditioning. Individual-level data include locomotor activity, rearing duration, conditioned response metrics, eyelid closure latencies, and contextual freezing percentages. All measurements are linked by unique mouse identifiers, enabling cross-task analyses without preprocessing or imputation. The dataset is accompanied by a complete data dictionary, processing workflow diagram, and validation analyses demonstrating cross-paradigm correlations. Cross-task associations are illustrated in main figures, with additional early-phase acquisition and temporal processing correlations provided in supplementary appendices. Provided in open CSV format with detailed metadata, this resource supports behavioral phenotyping, machine learning applications, and investigations of learning mechanisms in tauopathy models.
Keywords:
rTg4510
; tauopathy
; doxycycline
; trace eyeblink conditioning
; contextual fear conditioning
; spontaneous activity
; cross-task analysis
; behavioral phenotyping
; mouse model
1. Summary
The rTg4510 mouse is one of the most widely used models of tauopathy, characterized by forebrain expression of mutant human P301L tau under the control of a tetracycline-responsive promoter. Extensive characterization using spatial learning tasks has demonstrated progressive neurofibrillary tangle formation, neuronal loss, and memory impairment; importantly, these phenotypes can be modulated by doxycycline-mediated suppression of tau expression [1,2] .
We recently reported that rTg4510 mice exhibit deficits in non-spatial associative learning, including trace eyeblink conditioning and contextual fear memory, and that doxycycline treatment partially prevents these impairments . However, that study focused on group-level comparisons, and individual-level data enabling cross-task correlation analyses were not provided. Such individual-level integration is critical for investigating behavioral heterogeneity and response variability to therapeutic interventions. While non-spatial learning deficits have been characterized in other AD mouse models [4,5], publicly available datasets linking multiple learning domains at the individual level remain scarce.
The present data descriptor addresses this gap by providing complete individual-level behavioral measurements from 35 mice across four experimental groups: wild-type (WT) and rTg4510 mice, each with or without doxycycline treatment from 4 to 6 months of age. All animals were tested at 6 months in three standardized paradigms: (1) one-hour home-cage activities monitoring quantifying spontaneous behaviors, (2) 10-day trace eyeblink conditioning [6,7], and (3) contextual fear conditioning [8,9] evaluating hippocampal-amygdala-dependent memory. Each measurement is linked by unique mouse identifiers, enabling cross-task correlation analyses at the individual level.
The dataset is provided in raw, unprocessed form with explicit documentation of two missing observations. Data files include a master CSV integrating all variables, domain-specific files for each behavioral paradigm, and a complete data dictionary. Example validation analyses demonstrate group-dependent correlation patterns between the conditioned eyeblink response timing and fear memory, illustrating the dataset’s capacity to reveal individual differences [10,11,12] and cross-task relationships. Such individual-level integration is critical for investigating behavioral heterogeneity and variability across learning domains. All data are released under an open license to support secondary analyses, computational modeling, and integration with complementary datasets.
2. Data Description
2.1. Overview of the Dataset
This dataset contains individual-level behavioral measurements obtained from four experimental groups of mice at six months of age:
1. WT without DOX (wild-type mice without doxycycline treatment)
2. WT with DOX (wild-type mice with doxycycline treatment)
3. rTg4510 without DOX (tauopathy model without doxycycline treatment)
4. rTg4510 with DOX (tauopathy model with doxycycline treatment)
Initial analyses of group-level behavioral outcomes from this cohort have been published . The present data descriptor provides complete individual-level data to enable secondary analyses, cross-task correlation studies, and alternative analytical approaches. The dataset architecture and file organization are illustrated in Figure 1, which shows the progression from raw behavioral recordings through standardized CSV files to the unified master dataset. This hierarchical structure ensures transparency in data processing and facilitates reuse across different analytical frameworks.
The complete dataset contains 36 mice (n=9 per group). However, two mice have incomplete data across behavioral domains: one WT without DOX mouse lacks eyeblink conditioning data, and one WT with DOX mouse lacks fear conditioning data. For cross-task analyses requiring complete individual-level linkage across all three behavioral modalities, the dataset was restricted to 34 mice with measurements in all domains (n=8, 8, 9, 9 for WT without DOX, WT with DOX, rTg4510 without DOX, and rTg4510 with DOX, respectively). All figures and statistical summaries in this descriptor are based on these 34 mice unless otherwise specified.
This figure illustrates the data transformation pipeline from raw behavioral recordings to the publicly available dataset. Raw data from three independent behavioral paradigms (home-cage activities monitored by video, trace eyeblink conditioning recorded via electromyography, and contextual fear conditioning assessed by video) were extracted into structured CSV files for each modality. Individual-level identifiers were used to link measurements across tasks, and missing values were encoded as NA. The three domain-specific files were integrated into a master dataset containing 36 mice and 14 behavioral variables. The complete dataset is deposited in Zenodo (DOI: 10.5281/zenodo.17864815) under a CC BY 4.0 license. For cross-task analyses requiring complete measurements across all behavioral domains, the dataset can be restricted to 34 mice (n=8, 8, 9, 9 for WT without DOX, WT with DOX, rTg4510 without DOX, and rTg4510 with DOX, respectively).
2.2. Behavioral Modalities
The dataset integrates measurements from three independent behavioral domains:
Spontaneous home-cage activity
One-hour continuous monitoring yielded five behavioral metrics:
• Distance traveled (meters)
• Rearing duration (time ratio)
• Grooming duration (time ratio)
• Hanging duration (time ratio)
• Jumping duration (time ratio)
All home-cage measures were extracted from video recordings and analyzed using HomeCageScan without any additional smoothing or preprocessing. Figure 2 displays the distributions of these five metrics across the four experimental groups, illustrating both central tendencies and within-group variability.
Box plots with overlaid scatter points show raw individual values for five spontaneous behaviors: distance traveled (m), rearing (time ratio), grooming (time ratio), hanging (time ratio), and jumping (time ratio). Each panel displays data from the four experimental groups (WT without DOX, WT with DOX, rTg4510 without DOX, rTg4510 with DOX). Box plots represent the interquartile range with median line; whiskers extend to 1.5 × the IQR. Individual data points are overlaid to show within-group variability. This visualization illustrates group-level central tendencies and individual variability without statistical comparison.
Trace eyeblink conditioning
Animals underwent ten consecutive daily training sessions. For each session, the following variables were recorded:
• Conditioned response percentage (CR%, Days 1–10)
• Peak latency of eyelid closure (milliseconds, extracted for Days 4 and 10)
Peak latency was defined as the temporal delay from conditioned stimulus (CS) onset to the maximum amplitude of the conditioned eyelid response. One WT without DOX mouse lacks eyeblink data due to a technical issue during acquisition; this animal is included in all other measurements.
Contextual fear conditioning
Following a single training session, freezing behavior was assessed at two retention intervals:
• Freezing percentage at 1-hour retention test (Fear_1h)
• Freezing percentage at 1-day retention test (Fear_1day)
Freezing was quantified using an automated motion-threshold algorithm with consistent parameters across all animals. One WT with DOX mouse lacks fear conditioning data; all other variables for this animal are complete.
2.3. Data Structure and File Organization
The deposited dataset consists of the following files:
Master_Dataset.csv
• Wide-format table containing all behavioral variables for every mouse
• Each row represents one individual animal
• Missing values are explicitly encoded as NA
• Includes group labels (Genotype, DOX) and unique animal identifiers (Mouse_ID)
HomeCage_Activity.csv
• Mouse_ID, Genotype, DOX
• Distance, Rearing, Grooming, Hanging, Jumping
TraceEBC_CR.csv
• Mouse_ID, Genotype, DOX
• CR_Day1, CR_Day2, ..., CR_Day10
TraceEBC_Latency.csv
• Mouse_ID, Genotype, DOX
• Latency_Day4, Latency_Day10
FearConditioning.csv
• Mouse_ID, Genotype, DOX
• Fear_1h, Fear_1day
Data_Dictionary.csv
• Machine-readable version of Table 1
• Variable names, descriptions, units, per-group sample sizes, and notes
All files use UTF-8 encoding and comma-separated value (CSV) format. Column names correspond exactly to the variable names listed in Table 1.
2.4. Variable Definitions and Data Dictionary
Table 1 provides a complete data dictionary listing all variables, their units, per-group sample sizes, missing value status, and methodological notes. Key variable categories include:

Table 1.
Data Dictionary for the Behavioral Dataset.
| Variable | Description | Unit | N (per group) | Missing | Notes |
| Group | Experimental condition: WT without DOX, WT with DOX, rTg4510 without DOX, rTg4510 with DOX |
– |
9/9/9/9 | None | Categorical |
| Distance | Distance traveled in 1-h home-cage monitoring | meters | 9/9/9/9 | None | General locomotor activity |
| Rearing | Fraction of time spent rearing during home-cage monitoring | % (time) | 9/9/9/9 | None | Vertical exploration |
| Grooming | Fraction of time spent grooming during home-cage monitoring | % (time) | 9/9/9/9 | None | Self-care behavior |
| Hanging | Fraction of time spent in hanging posture during home-cage monitoring | % (time) | 9/9/9/9 | None | Cage-top behavior |
| Jumping | Fraction of time spent jumping during home-cage monitoring | % (time) | 9/9/9/9 | None | Vertical locomotion |
| CR_day4 | Percentage of conditioned responses on Day 4 of tEBC | % | 8/9/9/9 | 1 (WT without DOX) | Early-phase learning |
| CR_day10 | Percentage of conditioned responses on Day 10 of tEBC | % | 8/9/9/9 | 1 (WT without DOX) | Late-phase learning |
|
Latency_ day4 |
Peak latency of eyelid response on Day 4 | ms | 8/9/9/9 | 1 (WT without DOX) | Early temporal processing |
|
Latency_ day10 |
Peak latency of eyelid response on Day 10 | ms | 8/9/9/9 | 1 (WT without DOX) | Late temporal refinement |
| Fear_1h | Freezing during 1-hour retention test | % | 9/8/9/9 | 1 (WT with DOX) | Short-term memory retention |
| Fear_day1 | Freezing during 1-day retention test | % | 9/8/9/9 | 1 (WT with DOX) | Long-term memory retention |
| Mouse_ID | Individual identifier linking all tasks | – | 8–9 | None | Individual identifier |
| Age | Age at testing | months | 6 | None | Fixed at 6 months |
Complete list of all variables with descriptions, units, per-group sample sizes (N in order: WT without DOX / WT with DOX / rTg4510 without DOX / rTg4510 with DOX), missing value status, and functional notes. Variables include group identifiers, five home-cage activities measures, eyeblink conditioning metrics at two time points (Days 4 and 10), and contextual fear memory at two retention intervals (1 hour and 1 day). Sample sizes reflect the complete dataset (36 mice total). Missing values: one WT without DOX mouse lacks eyeblink conditioning data; one WT with DOX mouse lacks fear conditioning data. For cross-task analyses requiring complete measurements across all behavioral domains, the dataset can be restricted to 34 mice (n=8, 8, 9, 9 for the four groups, respectively).
Group identifiers:
• Genotype: WT or rTg4510
• DOX: without DOX or with DOX
• Mouse_ID: unique identifier linking all measurements
Home-cage activities:
• Distance: total distance traveled during one-hour monitoring (meters)
• Rearing, Grooming, Hanging, Jumping: proportion of time engaged in each behavior (0–1 scale)
Trace eyeblink conditioning:
• CR_Day1 to CR_Day10: percentage of trials with conditioned responses (0–100%)
• Latency_Day4, Latency_Day10: peak latency from CS onset to maximum eyelid closure (milliseconds)
Contextual fear conditioning:
• Fear_1h: freezing percentage during 1-hour retention test (0–100%)
• Fear_1day: freezing percentage during 1-day retention test (0–100%)
Note: Some automated freezing scores exceed 100% due to detection algorithm sensitivity; these values are retained without normalization to preserve data authenticity.
2.5. Data Distributions and Quality
Figure 3 presents the distributions of four primary behavioral variables across the four experimental groups: distance traveled, rearing duration, CR percentage on Day 10 (CR10), and freezing percentage on the 1-day retention test (Fear_1day). Box plots illustrate the range, median, and quartiles for each measure, with individual data points overlaid to show within-group variability. This visualization is provided for descriptive purposes only and does not include inferential statistics.
Box plots show raw individual values for four key behavioral variables: (A) distance traveled in the home cage (meters), (B) rearing time (proportion of recording time), (C) conditioned response percentage on Day 10 of trace eyeblink conditioning (CR10), and (D) freezing percentage during the 1-day retention test in contextual fear conditioning. Each panel displays data from the four experimental groups (WT without DOX, WT with DOX, rTg4510 without DOX, rTg4510 with DOX). Box plots represent the interquartile range with median; whiskers extend to 1.5× the IQR, and individual data points are overlaid. No statistical comparisons are performed; the figure illustrates the shape and distribution of raw behavioral data for each modality.
Figure 4 displays a subject × measure heatmap showing raw values for the four primary variables across all individual animals. Rows correspond to animals ordered by experimental group, and columns correspond to behavioral measures. Missing values appear as blank cells. This representation enables rapid inspection of data completeness and individual-level correspondence across behavioral domains.
Each row corresponds to a single mouse, ordered by group (WT without DOX, WT with DOX, rTg4510 without DOX, rTg4510 with DOX). Columns represent the four primary behavioral measures: distance traveled, rearing time, conditioned response percentage on Day 10 (CR10), and freezing percentage during the 1-day retention test. Raw values are visualized without normalization or scaling; color intensity reflects magnitude. Missing data appear as blank entries. This heatmap provides an overview of dataset completeness, within-group and between-group variability, and cross-task linkage at the individual level.
2.6. Missing Data
Missing values are limited to two animals and are explicitly documented:
One WT without DOX mouse: lacks all tEBC data (CR and latency values)
One WT with DOX mouse: lacks contextual fear conditioning data (Fear_1h and Fear_1day)
All other measurements are complete for these animals, and all other animals have complete datasets across all modalities. The transparent encoding of missing values (as NA) allows straightforward implementation of listwise or pairwise deletion strategies during analysis.
2.7. Cross-Task Structure and Validation
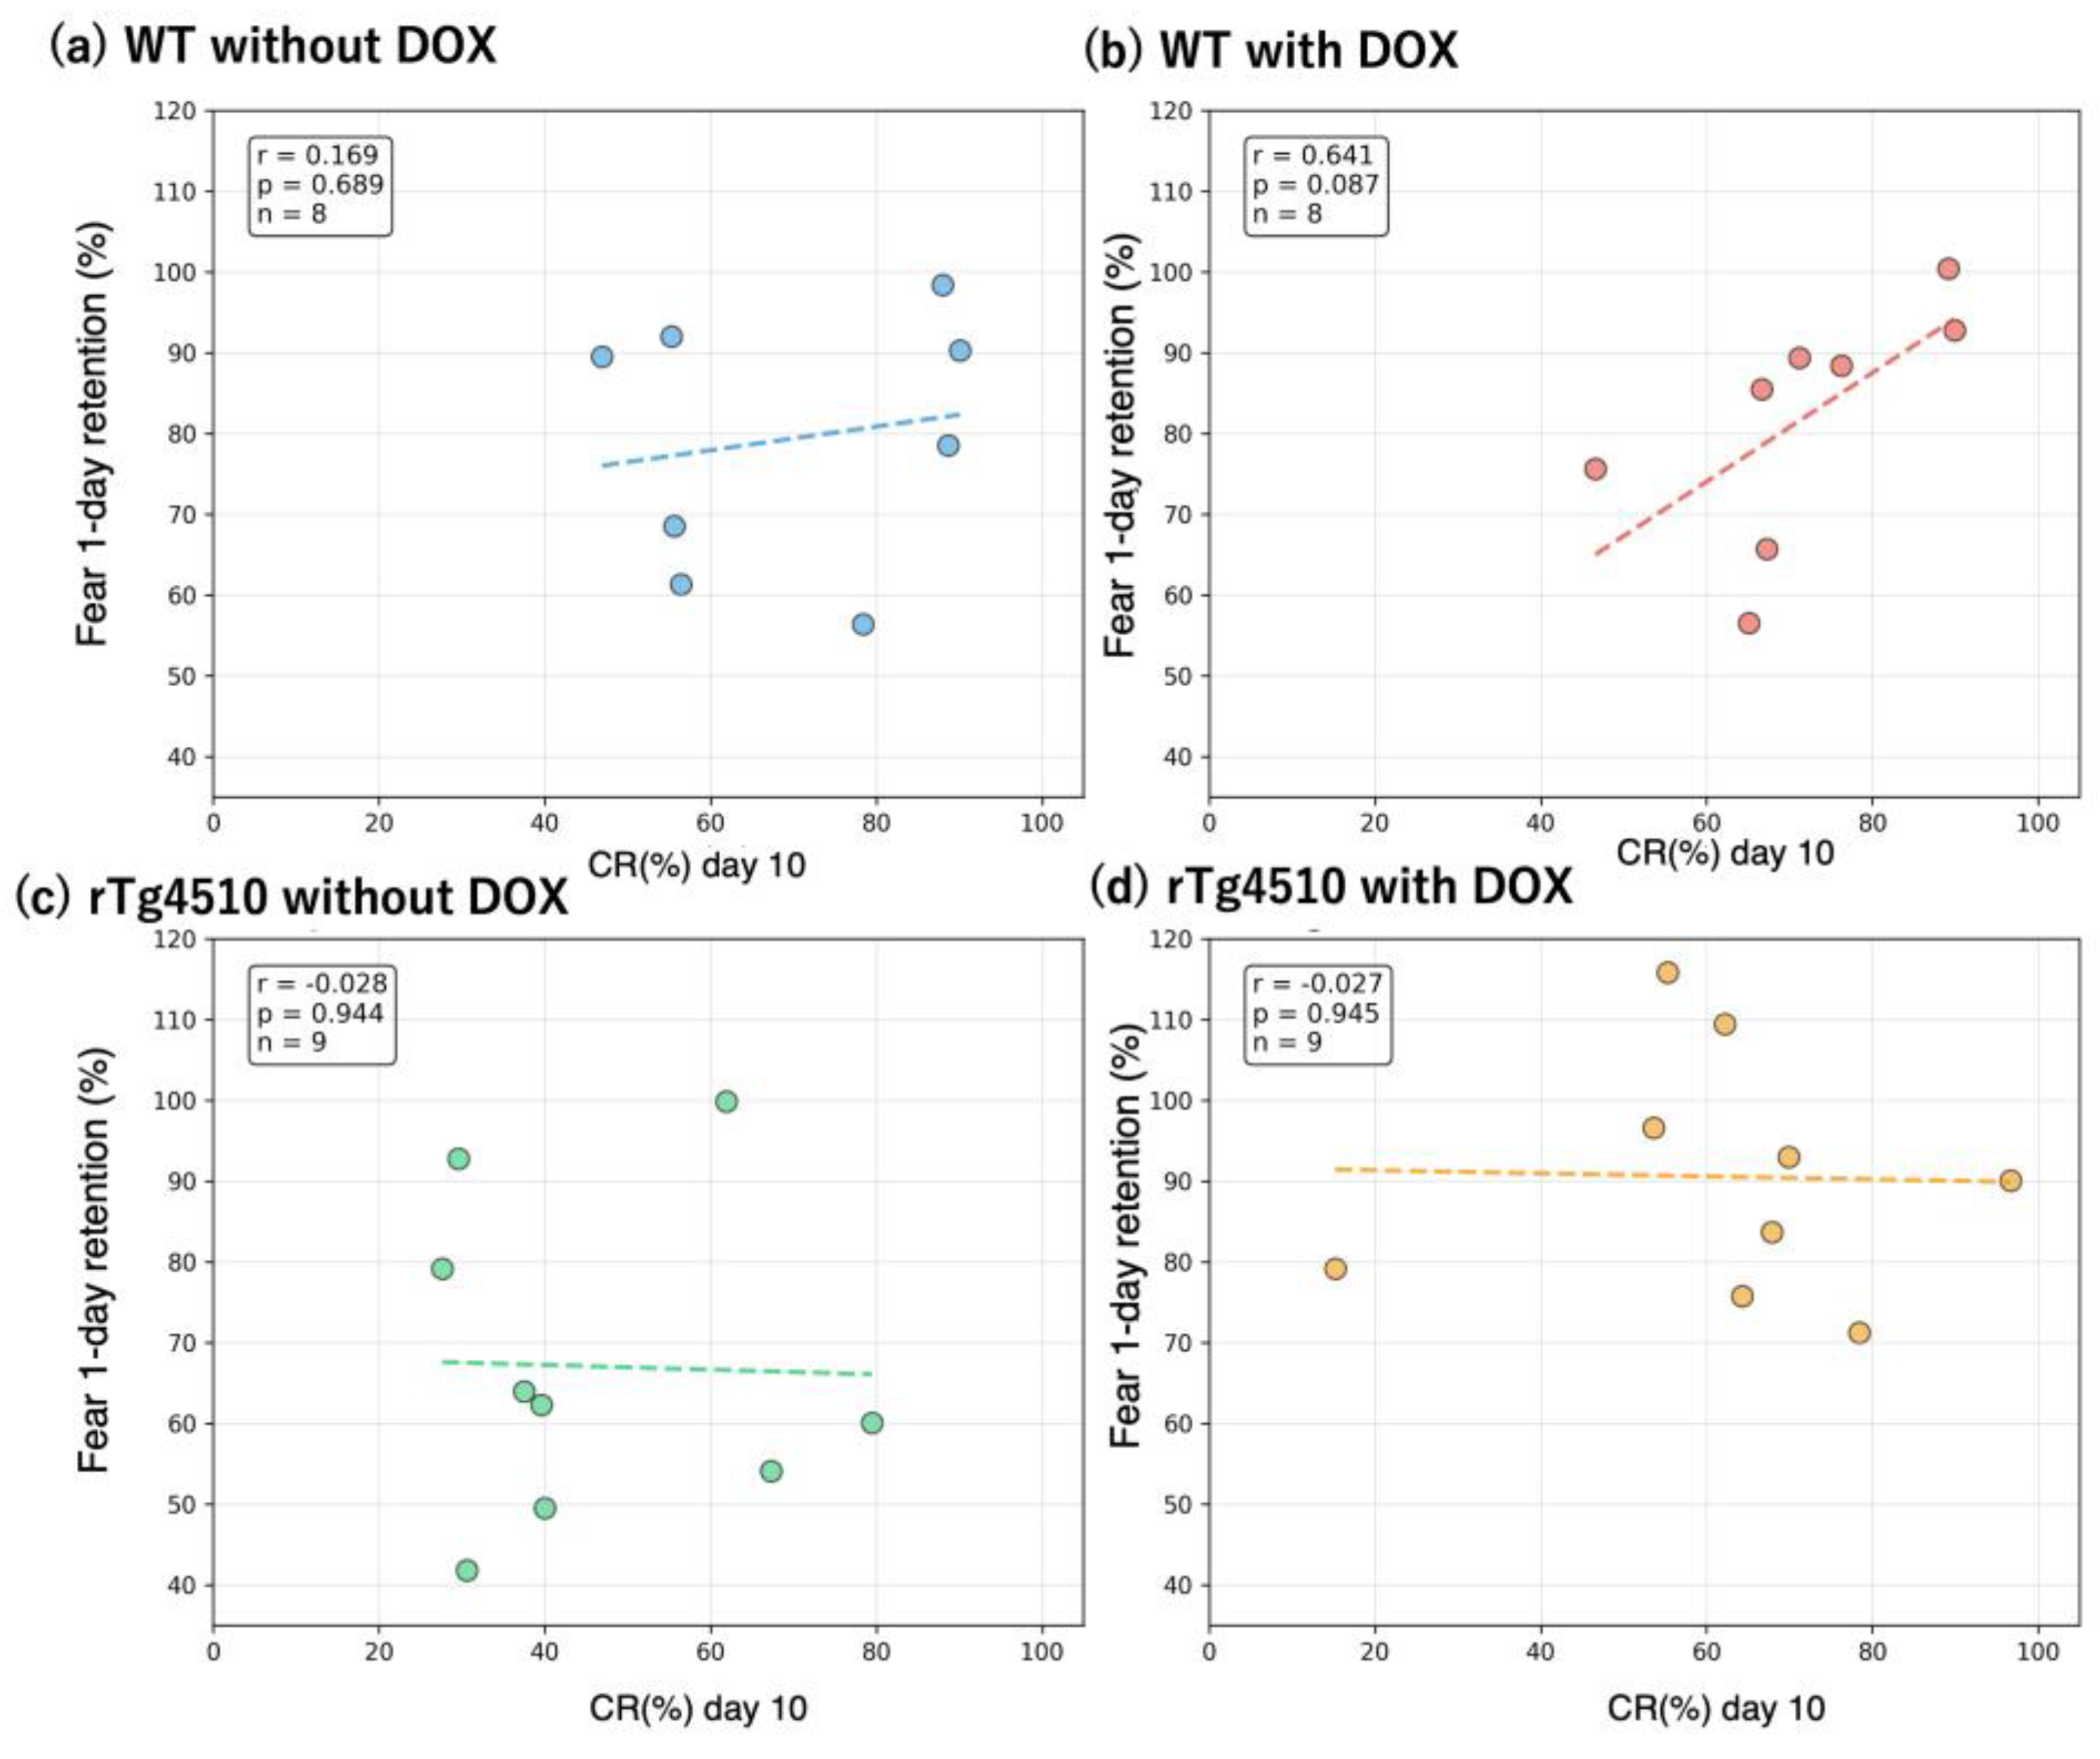
Because all behavioral measurements are linked at the individual level, the dataset enables investigation of cross-task relationships. As an example, Figure 5 displays group-wise correlations between CR percentage on Day 10 (CR10) and freezing percentage on the 1-day retention test (Fear_1day). The four panels illustrate that the strength and direction of associations between eyeblink conditioning and contextual fear memory differ across genotype and treatment conditions.
Scatterplots show the relationship between conditioned response percentage on Day 10 of trace eyeblink conditioning (CR10, x-axis) and freezing percentage during the 1-day retention test in contextual fear conditioning (y-axis). Each panel represents one experimental group: (a) WT without DOX, (b) WT with DOX, (c) rTg4510 without DOX, and (d) rTg4510 with DOX. Each point represents a single mouse. Pearson correlation coefficients (r) are indicated within each panel after listwise deletion of missing values. No inferential comparisons are performed; this figure illustrates an example of cross-task relationships that can be explored using this dataset.
• Appendix Figure A1: Correlations between CR percentage on Day 4 and 1-day freezing
• Appendix Figure A2: Correlations between peak latency on Day 4 and 1-day freezing
• Appendix Figure A3: Correlations between peak latency on Day 10 and 1-day freezing
These analyses are included solely to demonstrate the dataset's capacity for cross-paradigm investigation and are not presented as inferential findings. Detailed interpretation appears in Section 3 (Technical Validation).
2.8. Data Formats and Compatibility
All data are provided in widely compatible CSV format with the following specifications:
• Encoding: UTF-8
• Delimiter: comma (,)
• Decimal separator: period (.)
• Missing values: NA
• Row structure: Each row = one animal
• Column structure: Each column = one variable or one measurement day
This format ensures compatibility with R, Python, MATLAB, Excel, and other statistical or data analysis environments. No proprietary software is required to access or analyze the dataset.
2.9. Reproducibility and Reusability
The dataset is structured to support multiple analytical approaches:
• Cross-task correlation analyses: Individual-level linkage enables examination of relationships between independent learning systems
• Individual difference modeling: Complete behavioral profiles support clustering, classification, and latent variable analyses
• Treatment and genotype comparisons: Four-group design allows examination of DOX effects and genotype-dependent phenotypes
• Temporal dynamics: Daily CR measurements and dual retention timepoints enable investigation of learning trajectories
• Machine learning applications: Multivariate structure supports supervised and unsupervised learning algorithms
All measurements are provided in their original, unprocessed form without smoothing, normalization, or imputation. This approach maximizes transparency and allows researchers to apply their own preprocessing pipelines according to specific analytical needs.
3. Methods
3.1. Animals and Experimental Design
Six-month-old male and female rTg4510 mice and wild-type (WT) mice were used in this study. The rTg4510 line expresses human P301L mutant tau under control of a tetracycline-responsive promoter, enabling doxycycline (DOX)-mediated suppression of transgenic tau expression. Animals were assigned to four experimental groups based on genotype and DOX treatment:
1. WT without DOX (n = 9)
2. WT with DOX (n = 9)
3. rTg4510 without DOX (n = 9)
4. rTg4510 with DOX (n = 9)
Mice in DOX-treated groups received doxycycline-containing chow (200 mg/kg) ad libitum from 4 to 6 months of age. All animals were housed under a 12:12 h light–dark cycle at 22–24°C with food and water available ad libitum. Behavioral testing was conducted in the following sequence to minimize task interference: (1) home-cage activity monitoring, (2) tEBC, and (3) contextual fear conditioning. All procedures were approved by the Institutional Animal Care and Use Committee of Teikyo University and conducted in accordance with institutional and national guidelines for animal research.
3.2. Home-Cage Activity Monitoring
Spontaneous home-cage behavior was recorded for one hour using a standard overhead video camera, and all recordings were saved as MPEG video files. Behavioral categories were quantified using HomeCageScan (CleverSys Inc.), which automatically classifies behaviors from video recordings [13,14,15]. All metrics (distance traveled, rearing, grooming, hanging, and jumping) represent the direct output of HomeCageScan without any additional smoothing or preprocessing applied by the experimenters.
Five behavioral metrics were quantified:
• Distance traveled: Total distance (meters) computed from centroid displacement across video frames
• Rearing: Proportion of time spent in vertical exploration posture
• Grooming: Proportion of time engaged in self-grooming behavior
• Hanging: Proportion of time in cage-hanging posture
• Jumping: Proportion of time engaged in jumping movements
All proportional metrics are expressed as time ratios (0–1 scale). Missing values due to video occlusion or detection uncertainty were retained as NA. No smoothing, imputation, or normalization was applied to preserve data authenticity.
3.3. Trace Eyeblink Conditioning
Trace eyeblink conditioning (tEBC) was conducted over 10 consecutive days using a well-established trace paradigm [3,4].
Conditioning protocol:
• Conditioned stimulus (CS): 250 ms tone (1 kHz, 80 dB)
• Trace interval: 500 ms stimulus-free period
• Unconditioned stimulus (US): 100 ms corneal electrical shock (0.2 mA, 100 Hz, square pulses)
• Intertrial interval: 20–40 s (variable)
• Trials per session: 100 trials
•Training duration: 10 consecutive days (Days 1–10)
Response detection:
A conditioned response (CR) was defined as an eyelid closure exceeding a fixed amplitude threshold during the trace interval (between CS offset and US onset). Detection thresholds and filtering parameters were identical across all animals to ensure consistency.
Extracted variables:
• CR percentage (CR%): Proportion of trials with CRs for each training day (Days 1–10)
• CR peak latency: Time (milliseconds) from CS onset to maximum eyelid deflection during CR trials, extracted for Days 4 and 10
One WT without DOX mouse lacked reliable eyelid recordings due to technical failure during acquisition; all values for this animal are encoded as NA in the t tEBC dataset.
3.4. Contextual Fear Conditioning
Contextual fear conditioning was performed in a standard conditioning chamber (30 × 30 × 35 cm) equipped with a stainless steel grid floor and physical movement tracking system (FreezeScan).
Training protocol:
• Habituation: 2 min exploration period
• Footshock: Single 2 s shock at 0.7 mA
• Post-shock period: 30 s before removal from chamber
Retention testing:
Freezing behavior was assessed at two time points:
• 1-hour retention test: 2 min exposure to the same context
• 1-day retention test: 2 min exposure to the same context
Freezing was quantified automatically using a motion-threshold detection algorithm (FreezeScan) with consistent parameters across all animals. Freezing percentage was calculated as the proportion of time spent in a freezing posture (absence of movement except respiration) during the test period.
Extracted variables:
• Fear_1h: Freezing percentage during 1-hour retention test
• Fear_1day: Freezing percentage during 1-day retention test
One WT with DOX mouse lacks contextual fear conditioning data due to equipment malfunction; values for this animal are encoded as NA.
3.5. Data Integration and Organization
All behavioral measurements were linked at the individual animal level using unique mouse identifiers (Mouse_ID). This structure enables direct cross-task analyses without requiring data alignment or matching procedures.
File organization:
The dataset is provided as multiple CSV files to facilitate selective loading and analysis:
- Master_Dataset.csv: Complete wide-format table with all variables
- HomeCage_Activity.csv: Distance traveled and behavioral time ratios
- TraceEBC_CR.csv: CR percentages for Days 1–10
- TraceEBC_Latency.csv: Peak latency values for Days 4 and 10
- FearConditioning.csv: Freezing percentages at 1 h and 1 day
- Data_Dictionary.csv: Machine-readable variable reference corresponding to Table 1
Data processing:
No preprocessing, smoothing, normalization, or imputation was applied to any behavioral measurements. All values represent direct outputs from acquisition systems or automated detection pipelines. Missing values are explicitly encoded as NA and documented in the Data Description section.
File format specifications:
Encoding: UTF-8
Delimiter: Comma (,)
Decimal separator: Period (.)
Missing values: NA
Row structure: Each row represents one individual animal
Column structure: Each column represents one variable or one measurement day
3.6. Statistical Analyses for Technical Validation
Cross-task correlation analyses were performed to validate internal consistency and demonstrate the dataset's capacity for cross-paradigm investigation. Pearson correlation coefficients were computed between eyeblink conditioning metrics (CR percentage, peak latency) and contextual fear memory (1-day freezing percentage) within each experimental group.
Analyses were conducted separately for:
CR percentage on Day 4 vs. Fear_1day (Appendix Figure A1)
Peak latency on Day 4 vs. Fear_1day (Appendix Figure A2)
Peak latency on Day 10 vs. Fear_1day (Appendix Figure A3)
CR percentage on Day 10 vs. Fear_1day (Figure 5)
Missing values were handled by listwise deletion on a per-analysis basis. Correlation analyses are presented solely to demonstrate data quality and cross-task relationships; they are not intended as inferential conclusions about mechanisms or treatment effects. All visualization and analysis code is available in the data repository.
3.7. Software and Equipment
Home-cage monitoring: Video acquisition and automated behavioral classification using [HomeCageScan system (CleverSys, Inc., Reston, VA]
Trace eyeblink conditioning: Trace eyeblink conditioning was performed using a fully custom-built EMG-based acquisition and stimulus-control system. Eyelid muscle activity was recorded using fine-wire EMG electrodes and amplified with a commercial differential amplifier. The amplified EMG signals were digitized via an A/D converter operating under a DOS/V environment. All stimulus timing, including tone CS presentation, trace-interval control, and periorbital electrical US delivery, was executed by in-house software running on a Microsoft Windows 3.1–based system. Conditioned responses (CRs) were defined as increases in EMG activity exceeding a fixed threshold within the trace interval. Detailed procedures for EMG recording, filtering, and CR detection have been described previously in our earlier report [3,4].
Fear conditioning: Standard conditioning chamber with automated freezing detection using FreezeScan TM1.0 system (Clever Sys, Inc., Reston, VA).
Data processing: Raw behavioral outputs from each system (HomeCageScan, EMG-based tEBC system, and contextual fear conditioning software) were manually exported and organized into CSV files. No additional preprocessing, smoothing, or normalization was applied
Statistical analysis: Technical validation analyses were performed by computing Pearson correlation coefficients between eyeblink conditioning measures and contextual fear memory within each experimental group. All correlation analyses (r values) and descriptive statistics were conducted using GraphPad Prism (GraphPad Software, San Diego, CA).
Visualization: Initial plots (e.g., scatterplots and summary graphs) were generated using GraphPad Prism. Final figure layouts, labels, and graphical adjustments were completed manually using Microsoft PowerPoint. No smoothing, transformation, or additional data preprocessing was applied during figure preparation.
4. Technical Validation
4.1. Quality Control and Measurement Consistency
All behavioral measurements were conducted under standardized conditions with consistent parameters across animals and sessions. Home-cage activities were recorded continuously for one hour using identical monitoring systems. tEBC employed fixed CS-US parameters and detection thresholds across all training days. Contextual fear conditioning used uniform shock intensity (0.7 mA) and automated freezing detection with consistent motion thresholds. Missing values are limited to two animals and explicitly documented: one WT without DOX mouse lacks eyeblink conditioning data due to technical failure, and one WT with DOX mouse lacks fear conditioning data due to equipment malfunction. All other measurements are complete. No preprocessing, smoothing, or imputation was applied to any behavioral variables, ensuring data authenticity and transparency.
4.2. Cross-Task Relationships
To validate the dataset's capacity for cross-paradigm investigation, we examined correlations between eyeblink conditioning metrics and contextual fear memory at the individual level. Group-wise analyses revealed distinct patterns:
Early acquisition (CR Day 4 vs Fear 1day, Appendix Figure A1): Weak or inconsistent correlations across all groups, indicating that early-phase CR acquisition does not robustly predict contextual memory performance.
Early temporal processing (Latency Day 4 vs Fear 1day, Appendix Figure A2): Variable patterns across groups, with rTg4510 without DOX showing a positive trend suggesting altered coordination between temporal processing and fear memory.
Late temporal processing (Latency Day 10 vs Fear 1day, Appendix Figure A3): Striking divergence emerged, with WT without DOX showing negative correlation (faster CR timing associated with stronger fear memory) while rTg4510 with DOX showed positive correlation, indicating DOX-dependent reorganization of behavioral coupling.
Late acquisition (CR Day 10 vs Fear 1day,Figure 5): Group-dependent correlation patterns confirm meaningful individual differences and group-specific behavioral organization.
Across all analyses, no systematic confounds attributable to home-cage locomotor activity were observed, confirming that cross-task relationships reflect domain-specific learning processes rather than general motor or arousal differences. Notably, substantial individual variability was observed within each group, particularly in the rTg4510 with DOX condition, where some animals showed learning performance comparable to wild-type mice while others exhibited marked deficits. This heterogeneity underscores the value of individual-level data for investigating response variability to therapeutic interventions.
The dataset's individual-level structure enables investigation of cross-task relationships, an approach that has proven valuable for understanding behavioral variability and learning mechanisms [10,11]. While group-level analyses remain standard in behavioral neuroscience, individual-difference approaches can reveal patterns obscured by averaging and provide insights into response heterogeneity [11,12]. The present dataset provides one of the few publicly available resources linking cerebellar-dependent and hippocampal-amygdala-dependent learning at the individual level in a neurodegenerative model.
4.3. Data Quality Summary
The technical validation demonstrates that this dataset: (1) maintains internal consistency across measurement modalities, (2) captures substantial individual variability suitable for secondary analyses, (3) supports cross-task investigation through reliable individual-level linkage, and (4) exhibits group-specific correlation patterns consistent with biological phenotypic variation. The transparent encoding of limited missing values and absence of preprocessing ensure that the dataset can be readily adapted to diverse analytical frameworks and research questions.
5. User Notes
5.1. Potential Applications
This dataset supports investigations across multiple domains:
Cross-task behavioral profiling: The individual-level linkage between spontaneous activity, tEBC and contextual fear memory enables examination of relationships between independent learning systems within the same animals.
Tauopathy research: The inclusion of rTg4510 mice with and without doxycycline treatment allows investigation of how tau pathology and its suppression affect non-spatial associative learning and behavioral organization.
Individual difference modeling: The dataset structure supports clustering analyses, dimensionality reduction, and latent variable modeling to identify behavioral subtypes across genotype and treatment conditions.
Computational modeling: The combination of trial-by-trial eyeblink conditioning data with contextual fear memory outcomes provides a foundation for computational models of temporal associative learning and circuit-level dysfunction.
5.2. Analytical Strategies
Because the dataset is provided in raw, unprocessed form, users have flexibility to implement diverse analytical approaches:
Alternative detection criteria: Users can redefine conditioned response thresholds or apply different freezing detection algorithms according to their research needs.
Temporal dynamics: Daily CR measurements enable investigation of acquisition trajectories, learning curves, and within-animal stability across training sessions.
Multivariate approaches: The dataset supports regression modeling with interaction terms, mixed-effects models, and machine learning algorithms for prediction or classification.
All data files are provided in standard CSV format, compatible with R, Python, MATLAB, and spreadsheet software. The dataset can be integrated with complementary data types (histopathological, genetic, physiological) to build comprehensive models of tauopathy and behavioral dysfunction.
Author Contributions
Conceptualization, Y.K.; methodology, R.K. and Y.K.; formal analysis, R.K. and Y.K; investigation, Y.K.; data curation, Y.K. and R.K.; writing—original draft preparation, Y.K.; writing—review and editing, R.K. and Y.K.; visualization, Y.K.; project administration, Y.K.; funding acquisition, Y.K. All authors have read and agreed to the published version of the manuscript.
Funding
The original behavioral experiments were funded by JSPS KAKENHI grant 16K08215 (Principal Investigator: Yutaka Kirino; Co-Investigator: Y.K.). Data re-analysis and manuscript preparation were supported by JSPS KAKENHI grants 22K06618 and 25K10188 to Y.K. The APC was funded by KAKENHI grant 25K10188.
Institutional Review Board Statement
The original animal experiments from which this dataset was derived were approved by the Institutional Animal Investigation Committee of Tokushima Bunri University (protocol code KP19-75-001, approved on 1 March 2019). No new animal experiments were conducted for this data descriptor.
Informed Consent Statement
Not applicable.
Data Availability Statement
The complete behavioral dataset, including all raw individual-level measurements for home-cage activities, tEBC, and contextual fear conditioning, is publicly available in Zenodo at https://doi.org/10.5281/zenodo.17864815. The dataset comprises 36 mice (n=9 per group) with complete measurements for 34 mice across all three behavioral domains. All files are provided in their original, unprocessed form to ensure full reproducibility and transparency.
The repository includes:
- Master CSV file containing all behavioral variables linked by individual mouse identifiers (36 mice × 14 variables)
- Data dictionary with complete variable definitions, units, and sample sizes
- README file describing experimental protocols, file structure, and data formats
All files are released under a Creative Commons Attribution 4.0 International (CC BY 4.0) license and can be downloaded without restriction.
Acknowledgments
The authors thank Yutaka Kirino and other members of the original research team for their contributions to data collection. During the preparation of this manuscript, the authors used Claude (Anthropic, version Sonnet 4.5) and ChatGPT (OpenAI) for the purposes of data visualization code generation, manuscript structure optimization, and language editing. The authors have reviewed and edited the output and take full responsibility for the content of this publication.
Conflicts of Interest
The authors declare no conflicts of interest.
Abbreviations
The following abbreviations are used in this manuscript:
| WT | Wild-type |
| DOX | Doxycycline |
| tEBC | Trace Eyeblink Conditioning |
| CR | Conditioned Response |
| CS | Conditioned Stimulus |
| US | Unconditioned Stimulus |
Appendix A
Appendix Figure A1.
Group-wise correlations between early conditioned response rate and contextual fear memory.
Appendix Figure A1.
Group-wise correlations between early conditioned response rate and contextual fear memory.
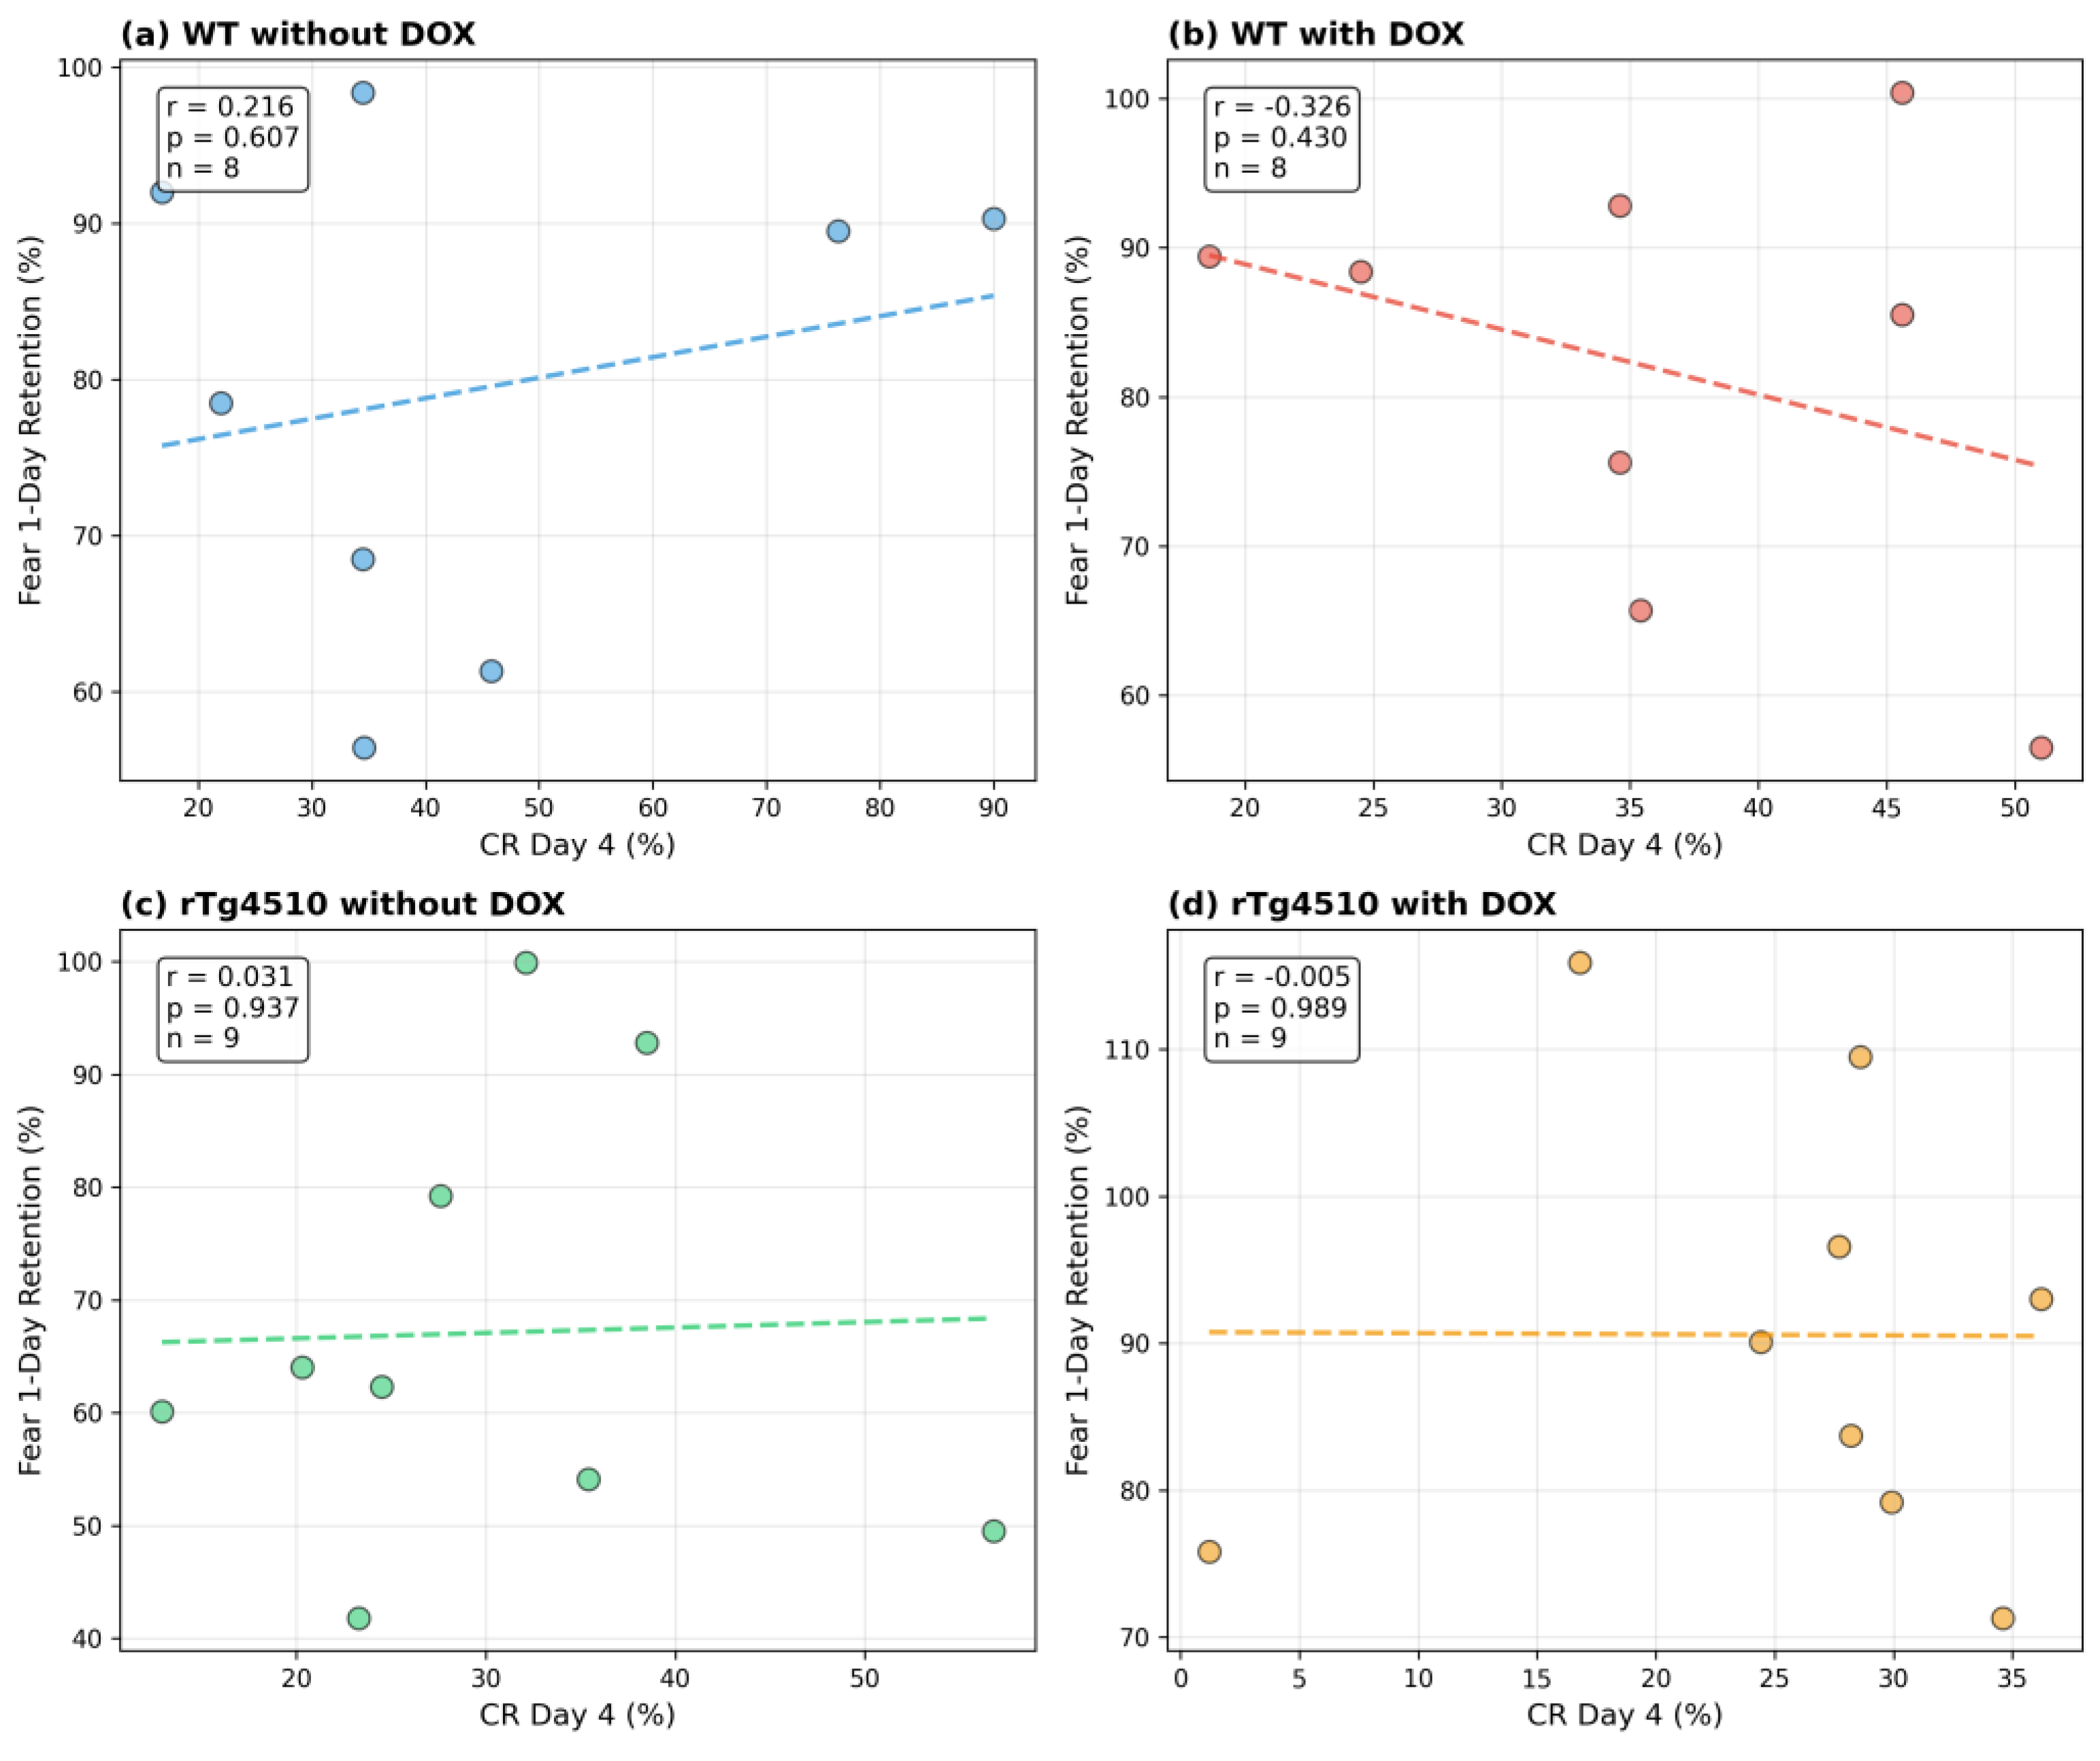
Scatterplots show the relationship between conditioned response percentage on Day 4 of trace eyeblink conditioning (CR Day 4, x-axis) and freezing percentage during the 1-day retention test in contextual fear conditioning (y-axis). Each panel represents one experimental group: (a) WT without DOX, (b) WT with DOX, (c) rTg4510 without DOX, and (d) rTg4510 with DOX. Each point represents a single mouse. Pearson correlation coefficients (r) are indicated within each panel after listwise deletion of missing observations. Early CR rate did not provide a robust or consistent predictor of contextual freezing across genotypes or treatment conditions.
.
Appendix Figure A2.
Group-wise correlations between early CR peak latency and contextual fear memory.
Appendix Figure A2.
Group-wise correlations between early CR peak latency and contextual fear memory.
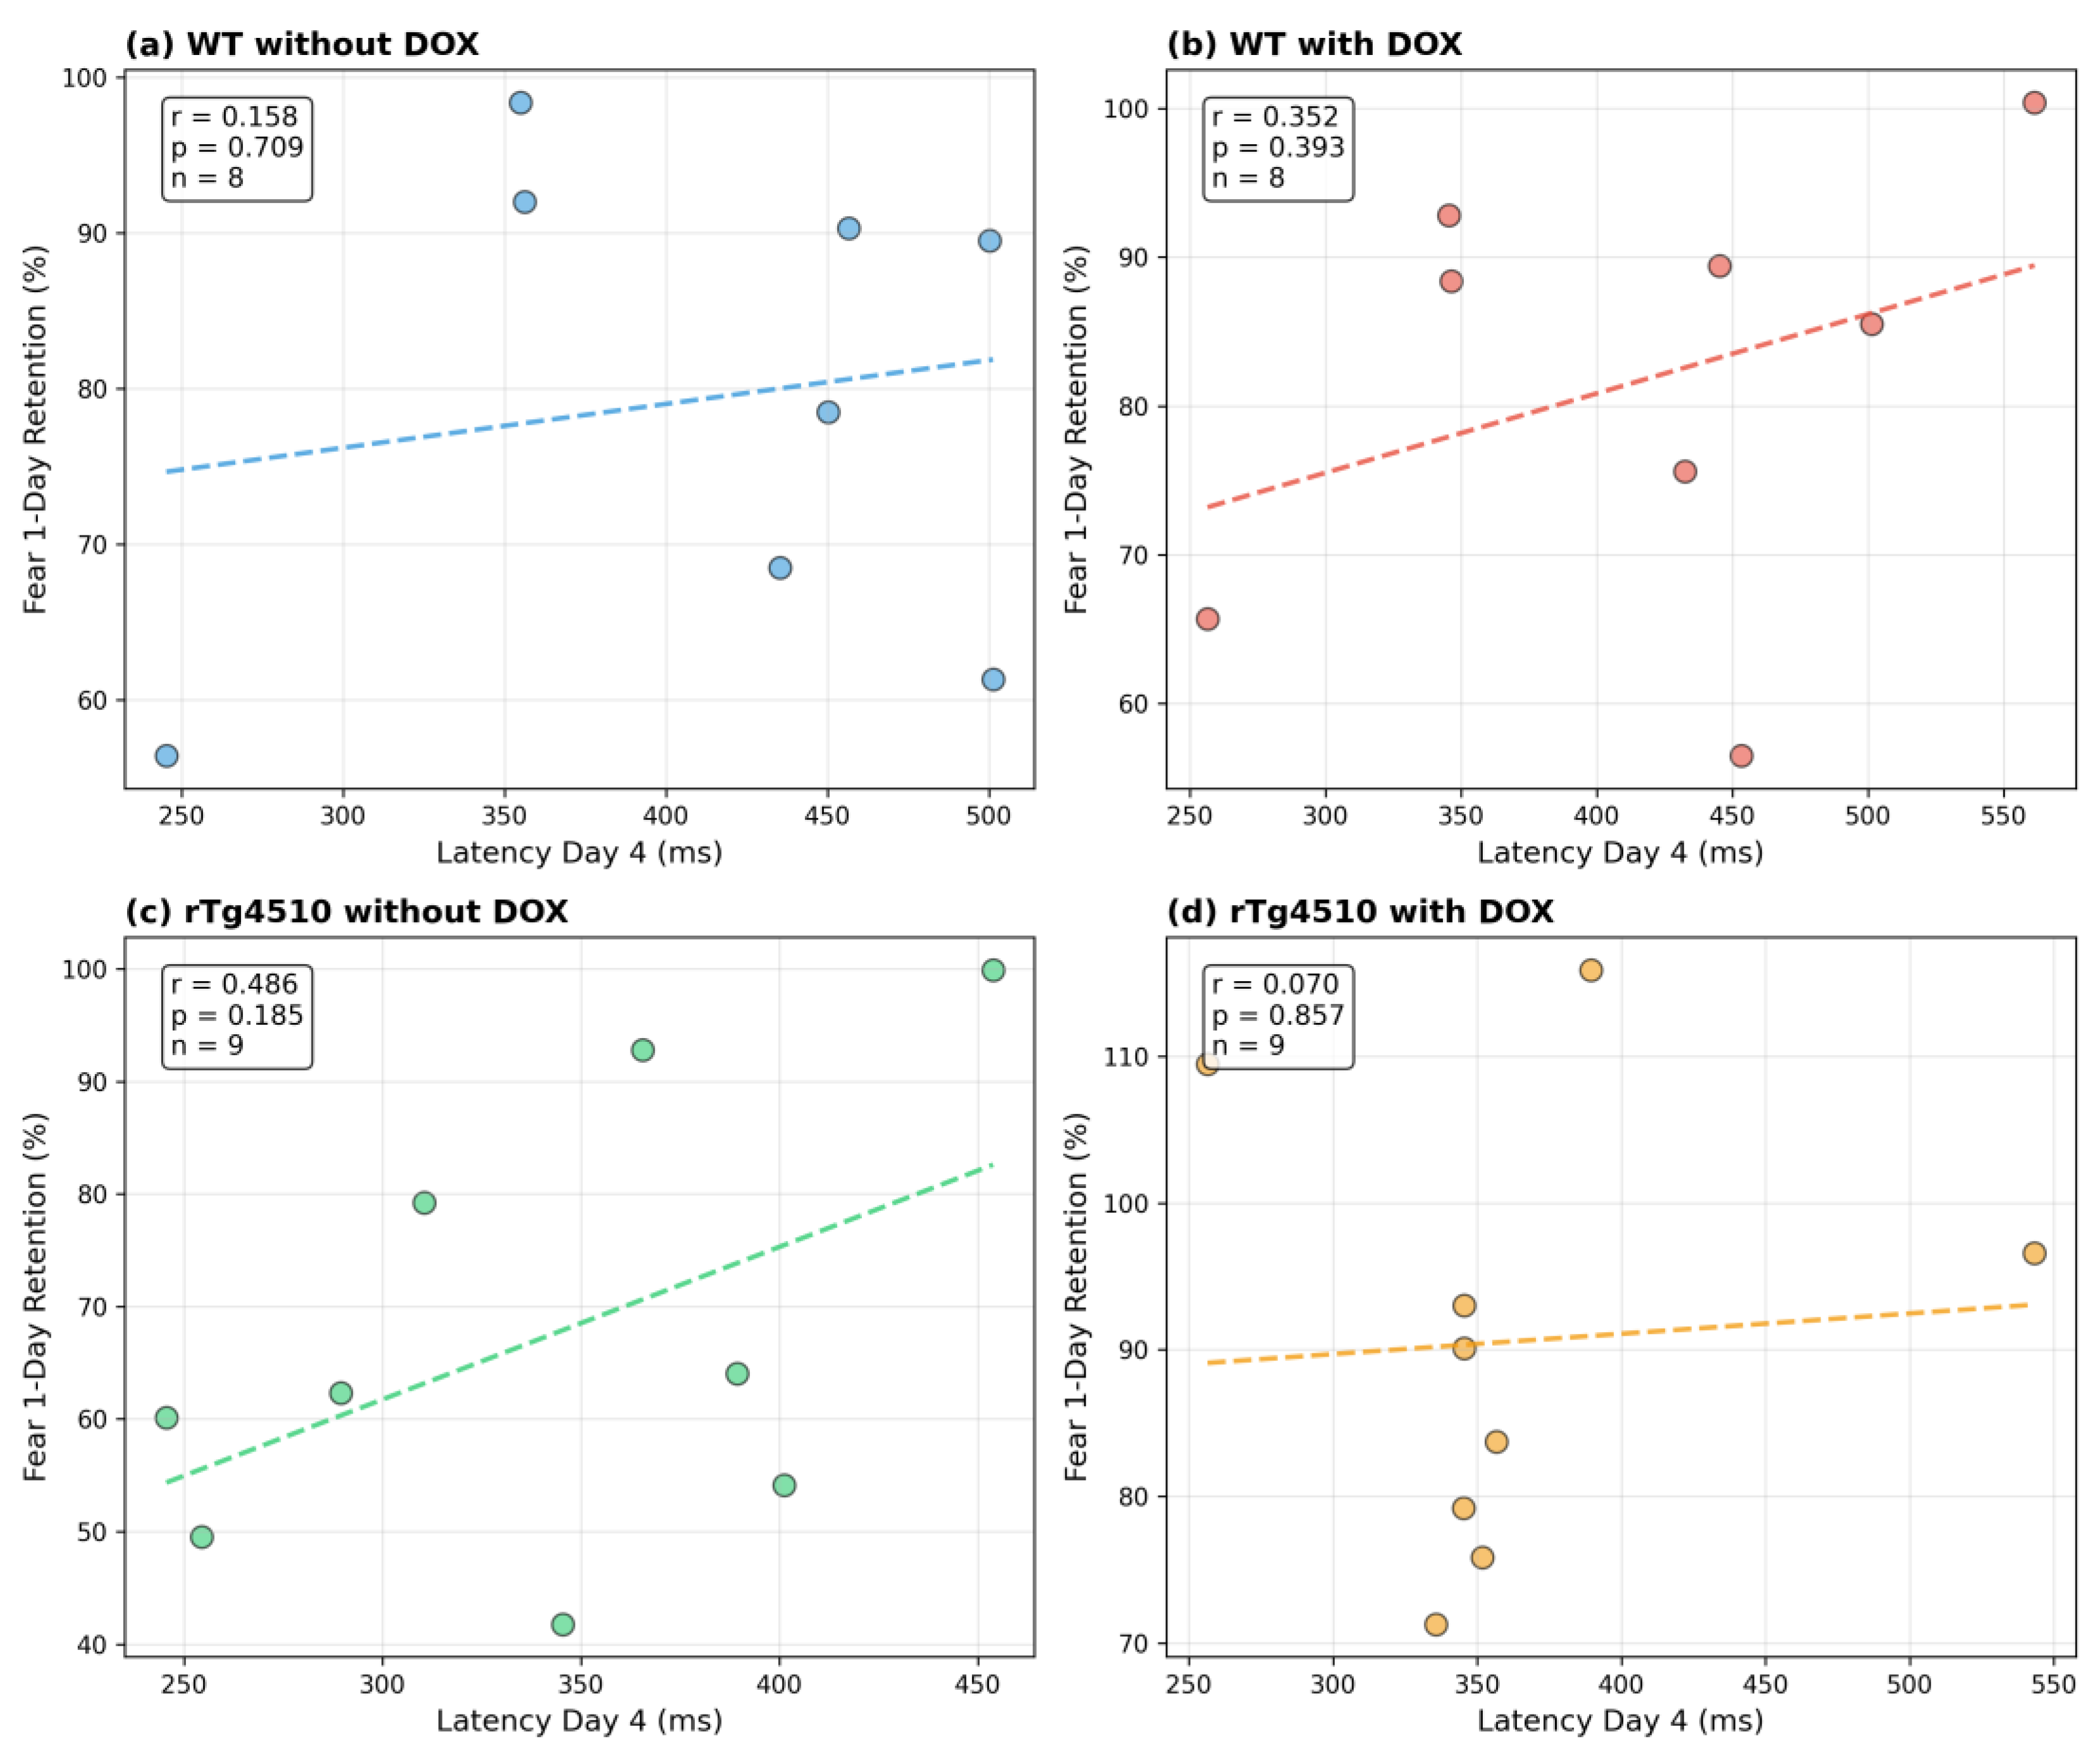
Scatterplots show the relationship between CR peak latency on Day 4 of trace eyeblink conditioning (measured from CS onset to eyelid response peak, x-axis) and freezing percentage during the 1-day contextual fear retention test (y-axis). Each panel represents one experimental group: (a) WT without DOX, (b) WT with DOX, (c) rTg4510 without DOX, and (d) rTg4510 with DOX. Each point represents a single mouse, with listwise deletion applied for missing eyeblink data. Pearson's r is shown in each panel. WT groups exhibit weak relationships, whereas rTg4510 without DOX displays a positive trend, suggesting that early temporal processing may differentially relate to contextual memory in the presence of tau pathology.
Appendix Figure A3.
Group-wise correlations between late CR peak latency and contextual fear memory.
Appendix Figure A3.
Group-wise correlations between late CR peak latency and contextual fear memory.
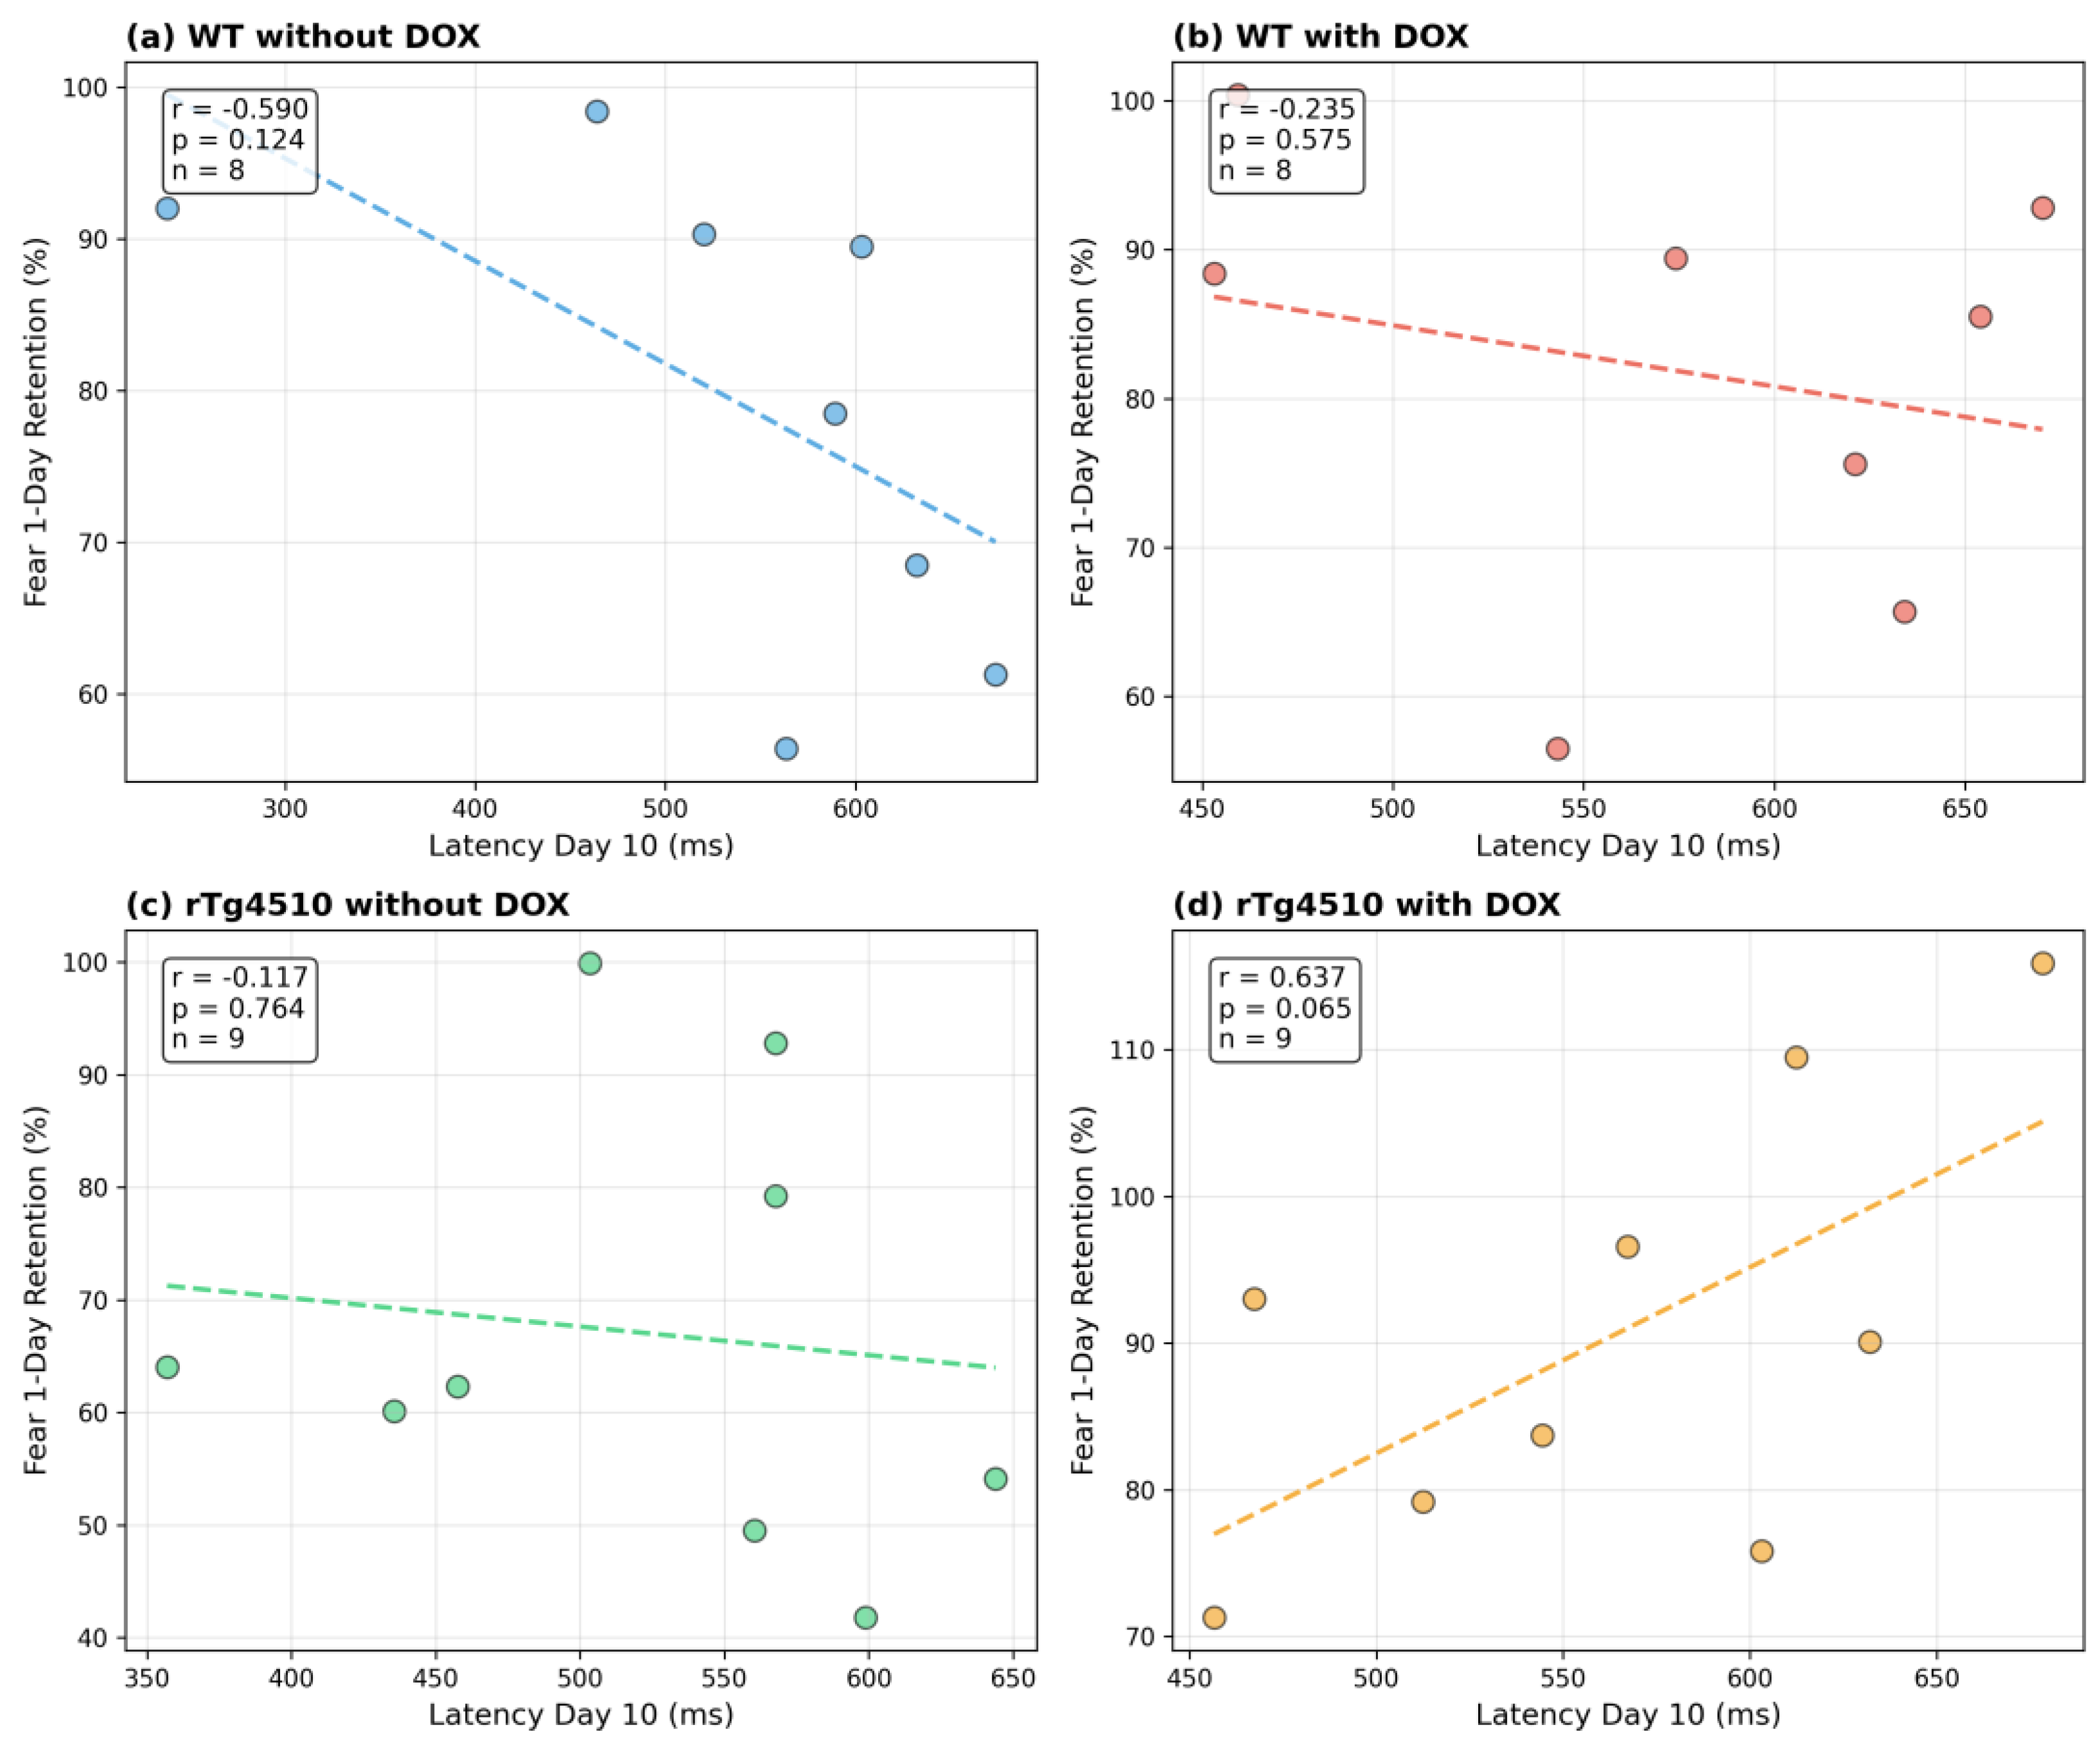
Scatterplots show the relationship between CR peak latency on Day 10 of trace eyeblink conditioning (x-axis) and freezing percentage during the 1-day contextual fear retention test (y-axis). Each panel represents one experimental group: (a) WT without DOX, (b) WT with DOX, (c) rTg4510 without DOX, and (d) rTg4510 with DOX. Each point represents a single mouse. Pearson correlation coefficients are computed from complete data pairs. WT without DOX mice show a negative correlation (shorter latencies associated with stronger contextual freezing), whereas rTg4510 with DOX mice show a positive correlation (longer latencies associated with higher freezing). This sign reversal suggests DOX-dependent reorganization of temporal processing in associative learning.
References
- Santacruz, K.; Lewis, J.; Spires, T.; Paulson, J.; Kotilinek, L.; Ingelsson, M.; Guimaraes, A.; DeTure, M.; Ramsden, M.; McGowan, E.; Hutton, M.; Ashe, K.H. Tau suppression in a neurodegenerative mouse model improves memory function. Science 2005, 309, 476–481. [Google Scholar] [CrossRef]
- Ramsden, M.; Kotilinek, L.; Forster, C.; Paulson, J.; McGowan, E.; SantaCruz, K.; Guimaraes, A.; Yue, M.; Lewis, J.; Carlson, G.A.; Hutton, M.; Ashe, K.H. Age-dependent neurofibrillary tangle formation, neuron loss, and memory impairment in a mouse model of human tauopathy (P301L). Proc. Natl. Acad. Sci. USA 2005, 102, 1389–1394. [Google Scholar] [CrossRef] [PubMed]
- Kishimoto, Y.; Kubota, T.; Nakashima, K.; Kirino, Y. rTg4510 tauopathy mice exhibit non-spatial memory deficits prevented by Doxycycline treatment. Brain Sci.. 2025, 15, 1183. [Google Scholar] [CrossRef] [PubMed]
- Kishimoto, Y.; Kirino, Y. Presenilin 2 mutation accelerates the onset of impairment in trace eyeblink conditioning in a mouse model of Alzheimer's disease overexpressing human mutant amyloid precursor protein. Neurosci. Lett. 2013, 538, 15–19. [Google Scholar] [CrossRef] [PubMed]
- Kishimoto, Y.; Fukumoto, K.; Nagai, M.; Mizuguchi, A.; Kobashi, Y. Early contextual fear memory deficits in a double-transgenic amyloid-β precursor protein/Presenilin 2 mouse model of Alzheimer's disease. Int. J. Alzheimers Dis. 2017, 2017, 8584205. [Google Scholar] [CrossRef] [PubMed]
- McGlinchey-Berroth, R.; Carrillo, M.C.; Gabrieli, J.D.; Brawn, C.M.; Disterhoft, J.F. Trace eyeblink conditioning in humans: Hippocampal function and aging. Neurobiol. Aging 1997, 18, 693–700. [Google Scholar] [CrossRef]
- Christian, K.M.; Thompson, R.F. Neural substrates of eyeblink conditioning: Acquisition and retention. Nat. Rev. Neurosci. 2003, 4, 121–130. [Google Scholar] [CrossRef]
- Kim, J.J.; Fanselow, M.S. Modality-specific retrograde amnesia of fear. Science 1992, 256, 675–677. [Google Scholar] [CrossRef]
- Fanselow, M.S. Contextual fear, gestalt memories, and the hippocampus. Behav. Brain Res. 2000, 110, 73–81. [Google Scholar] [CrossRef]
- Matzel, L.D.; Sauce, B.; Wass, C. The architecture of intelligence: Converging evidence from studies of humans and animals. Curr. Dir. Psychol. Sci. 2013, 22, 342–348. [Google Scholar] [CrossRef]
- Sauce, B.; Matzel, L.D. The causes of variation in learning and behavior: Why individual differences matter. Front. Psychol. 2018, 9, 64. [Google Scholar] [CrossRef] [PubMed]
- Crabbe, J.C.; Wahlsten, D.; Dudek, B.C. Genetics of mouse behavior: Interactions with laboratory environment. Science 1999, 284, 1670–1672. [Google Scholar] [CrossRef] [PubMed]
- Jhuang, H.; Garrote, E.; Yu, X.; Khilnani, V.; Poggio, T.; Steele, A.D.; Serre, T. Automated home-cage behavioral phenotyping of mice. Nat. Commun. 2010, 1, 68. [Google Scholar] [CrossRef] [PubMed]
- Steele, A.D.; Jackson, W.S.; King, O.D.; Lindquist, S. The power of automated high-resolution behavior analysis revealed by its application to mouse models of Huntington's and prion diseases. Proc. Natl. Acad. Sci. USA 2007, 104, 1983–1988. [Google Scholar] [CrossRef] [PubMed]
- Kishimoto, Y.; Higashihara, E.; Fukuta, A.; Nagao, A.; Kirino, Y. Early impairment in a water-finding test in a longitudinal study of the Tg2576 mouse model of Alzheimer’s disease. Brain Research 2013, 1491, 117–126. [Google Scholar] [CrossRef] [PubMed]
Figure 1.
Overview of the dataset structure and processing workflow.
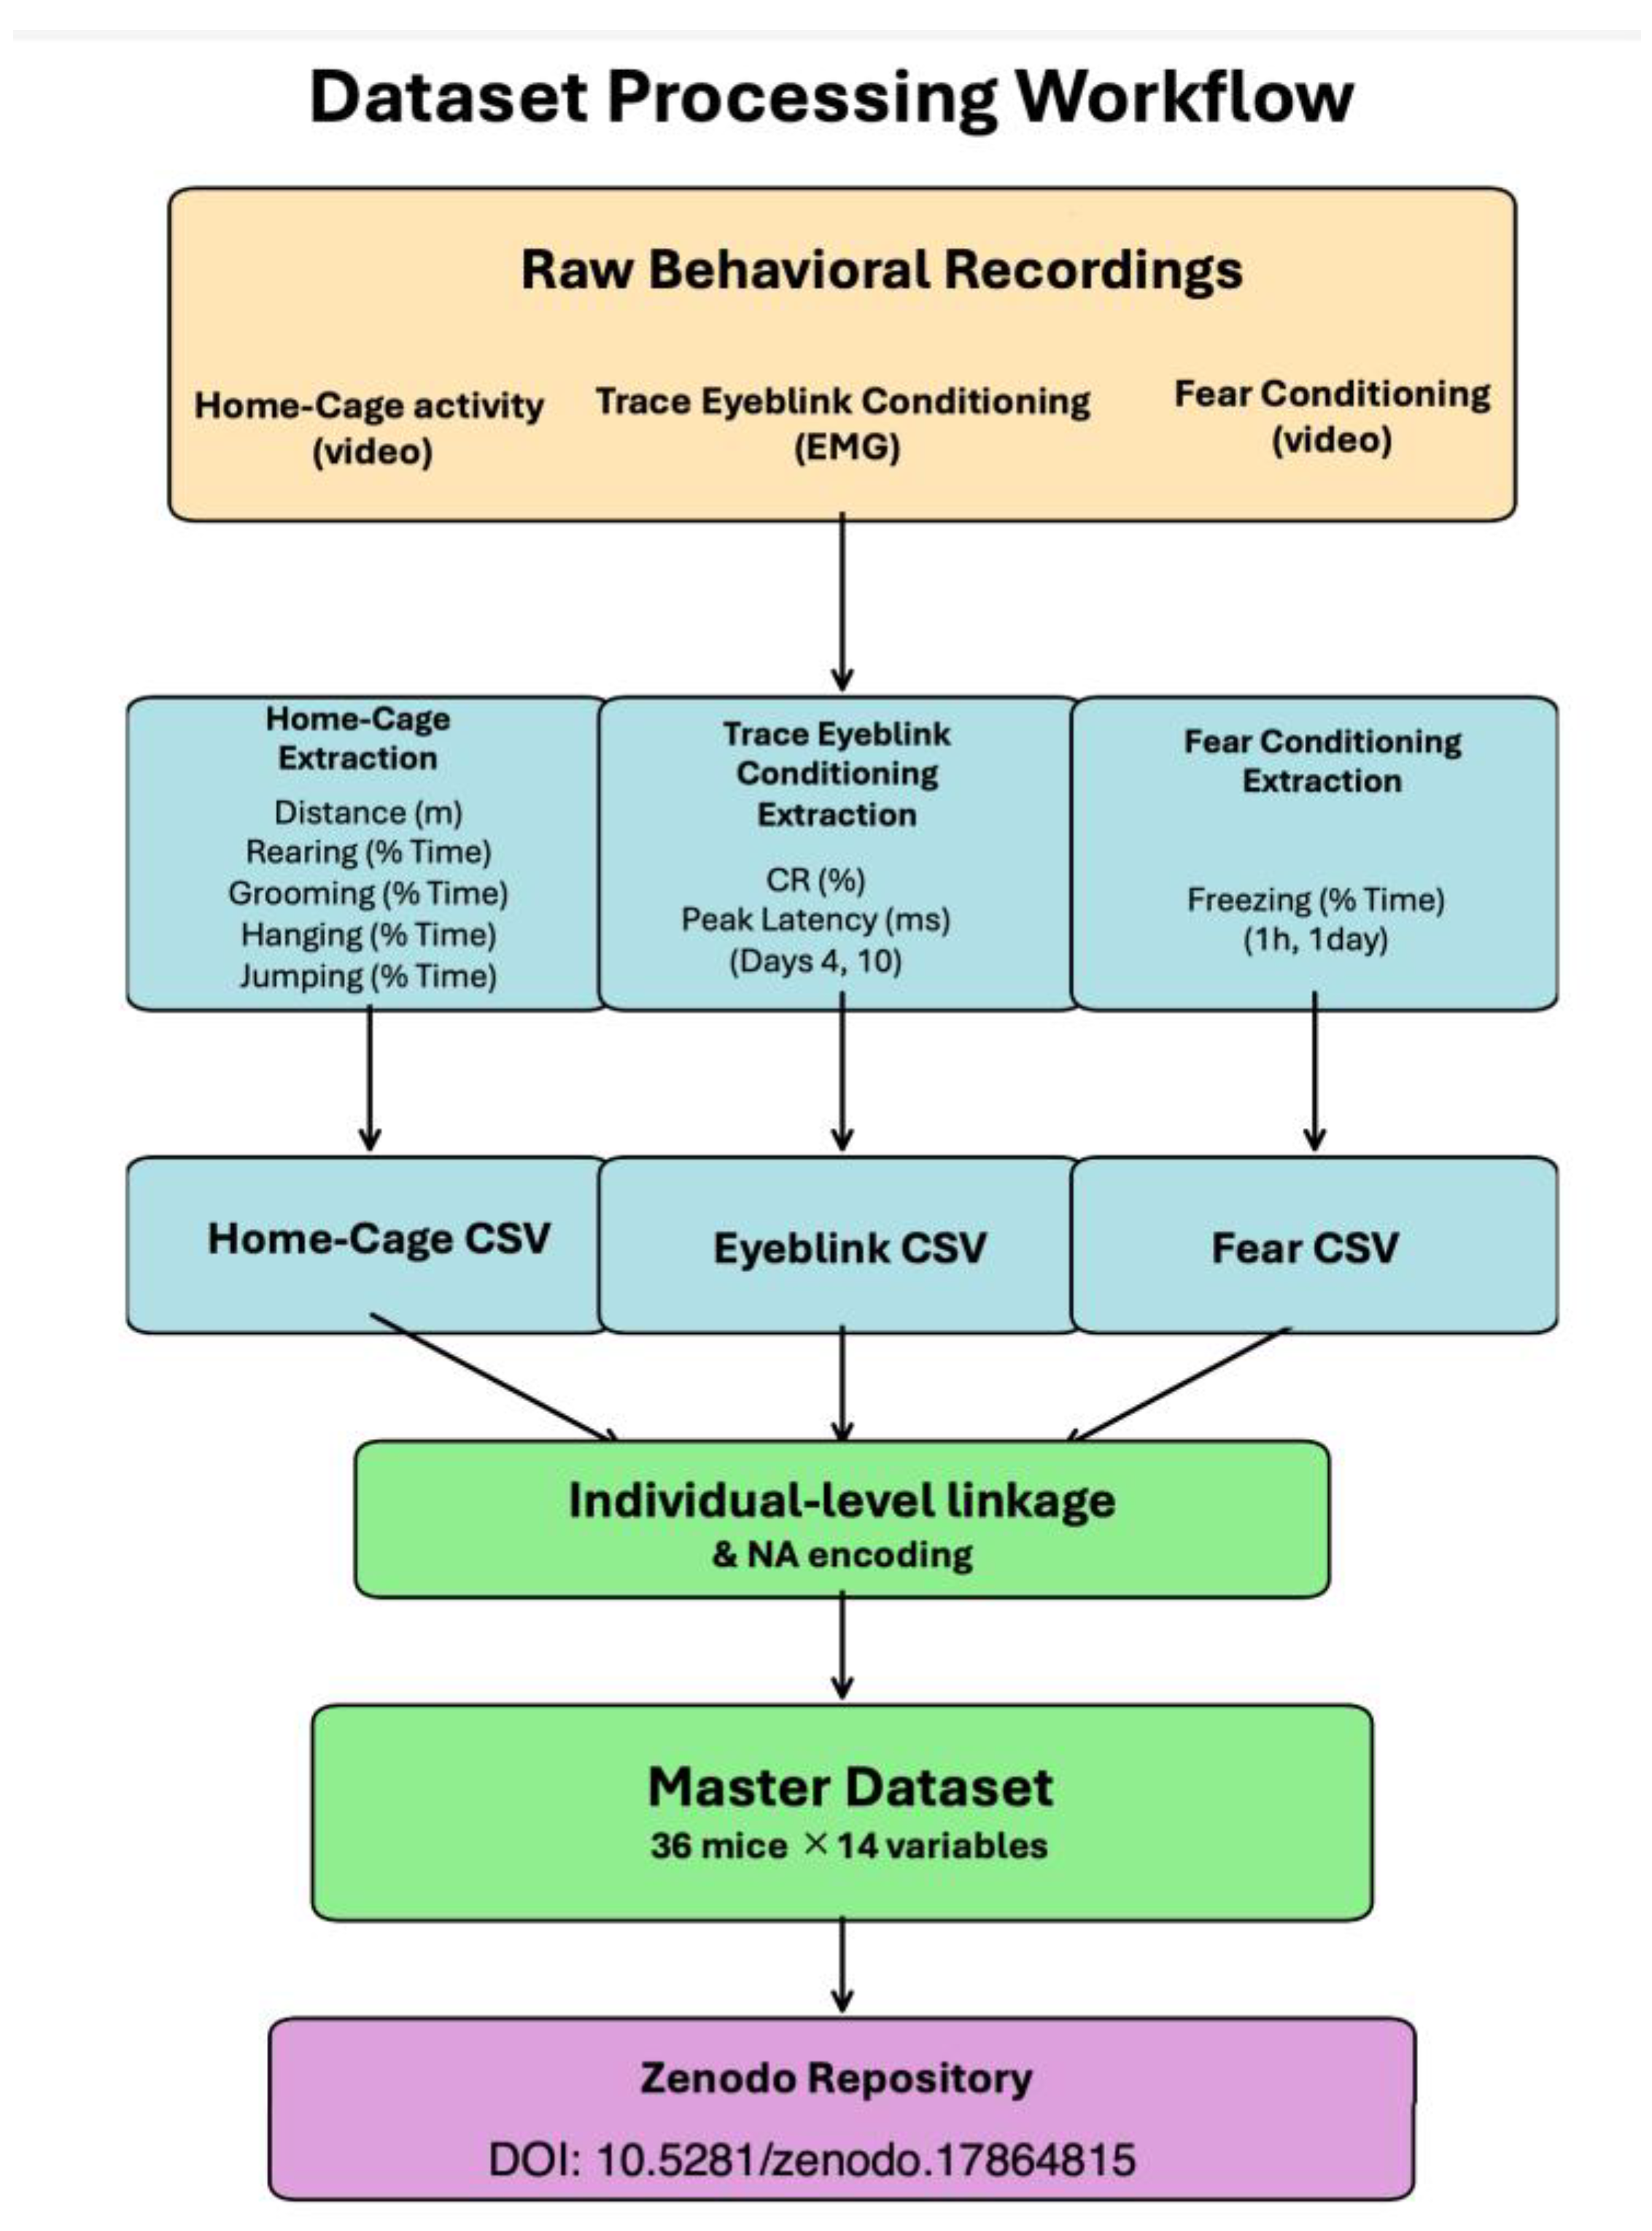
Figure 2.
Distributions of home-cage behavioral measures across experimental groups.
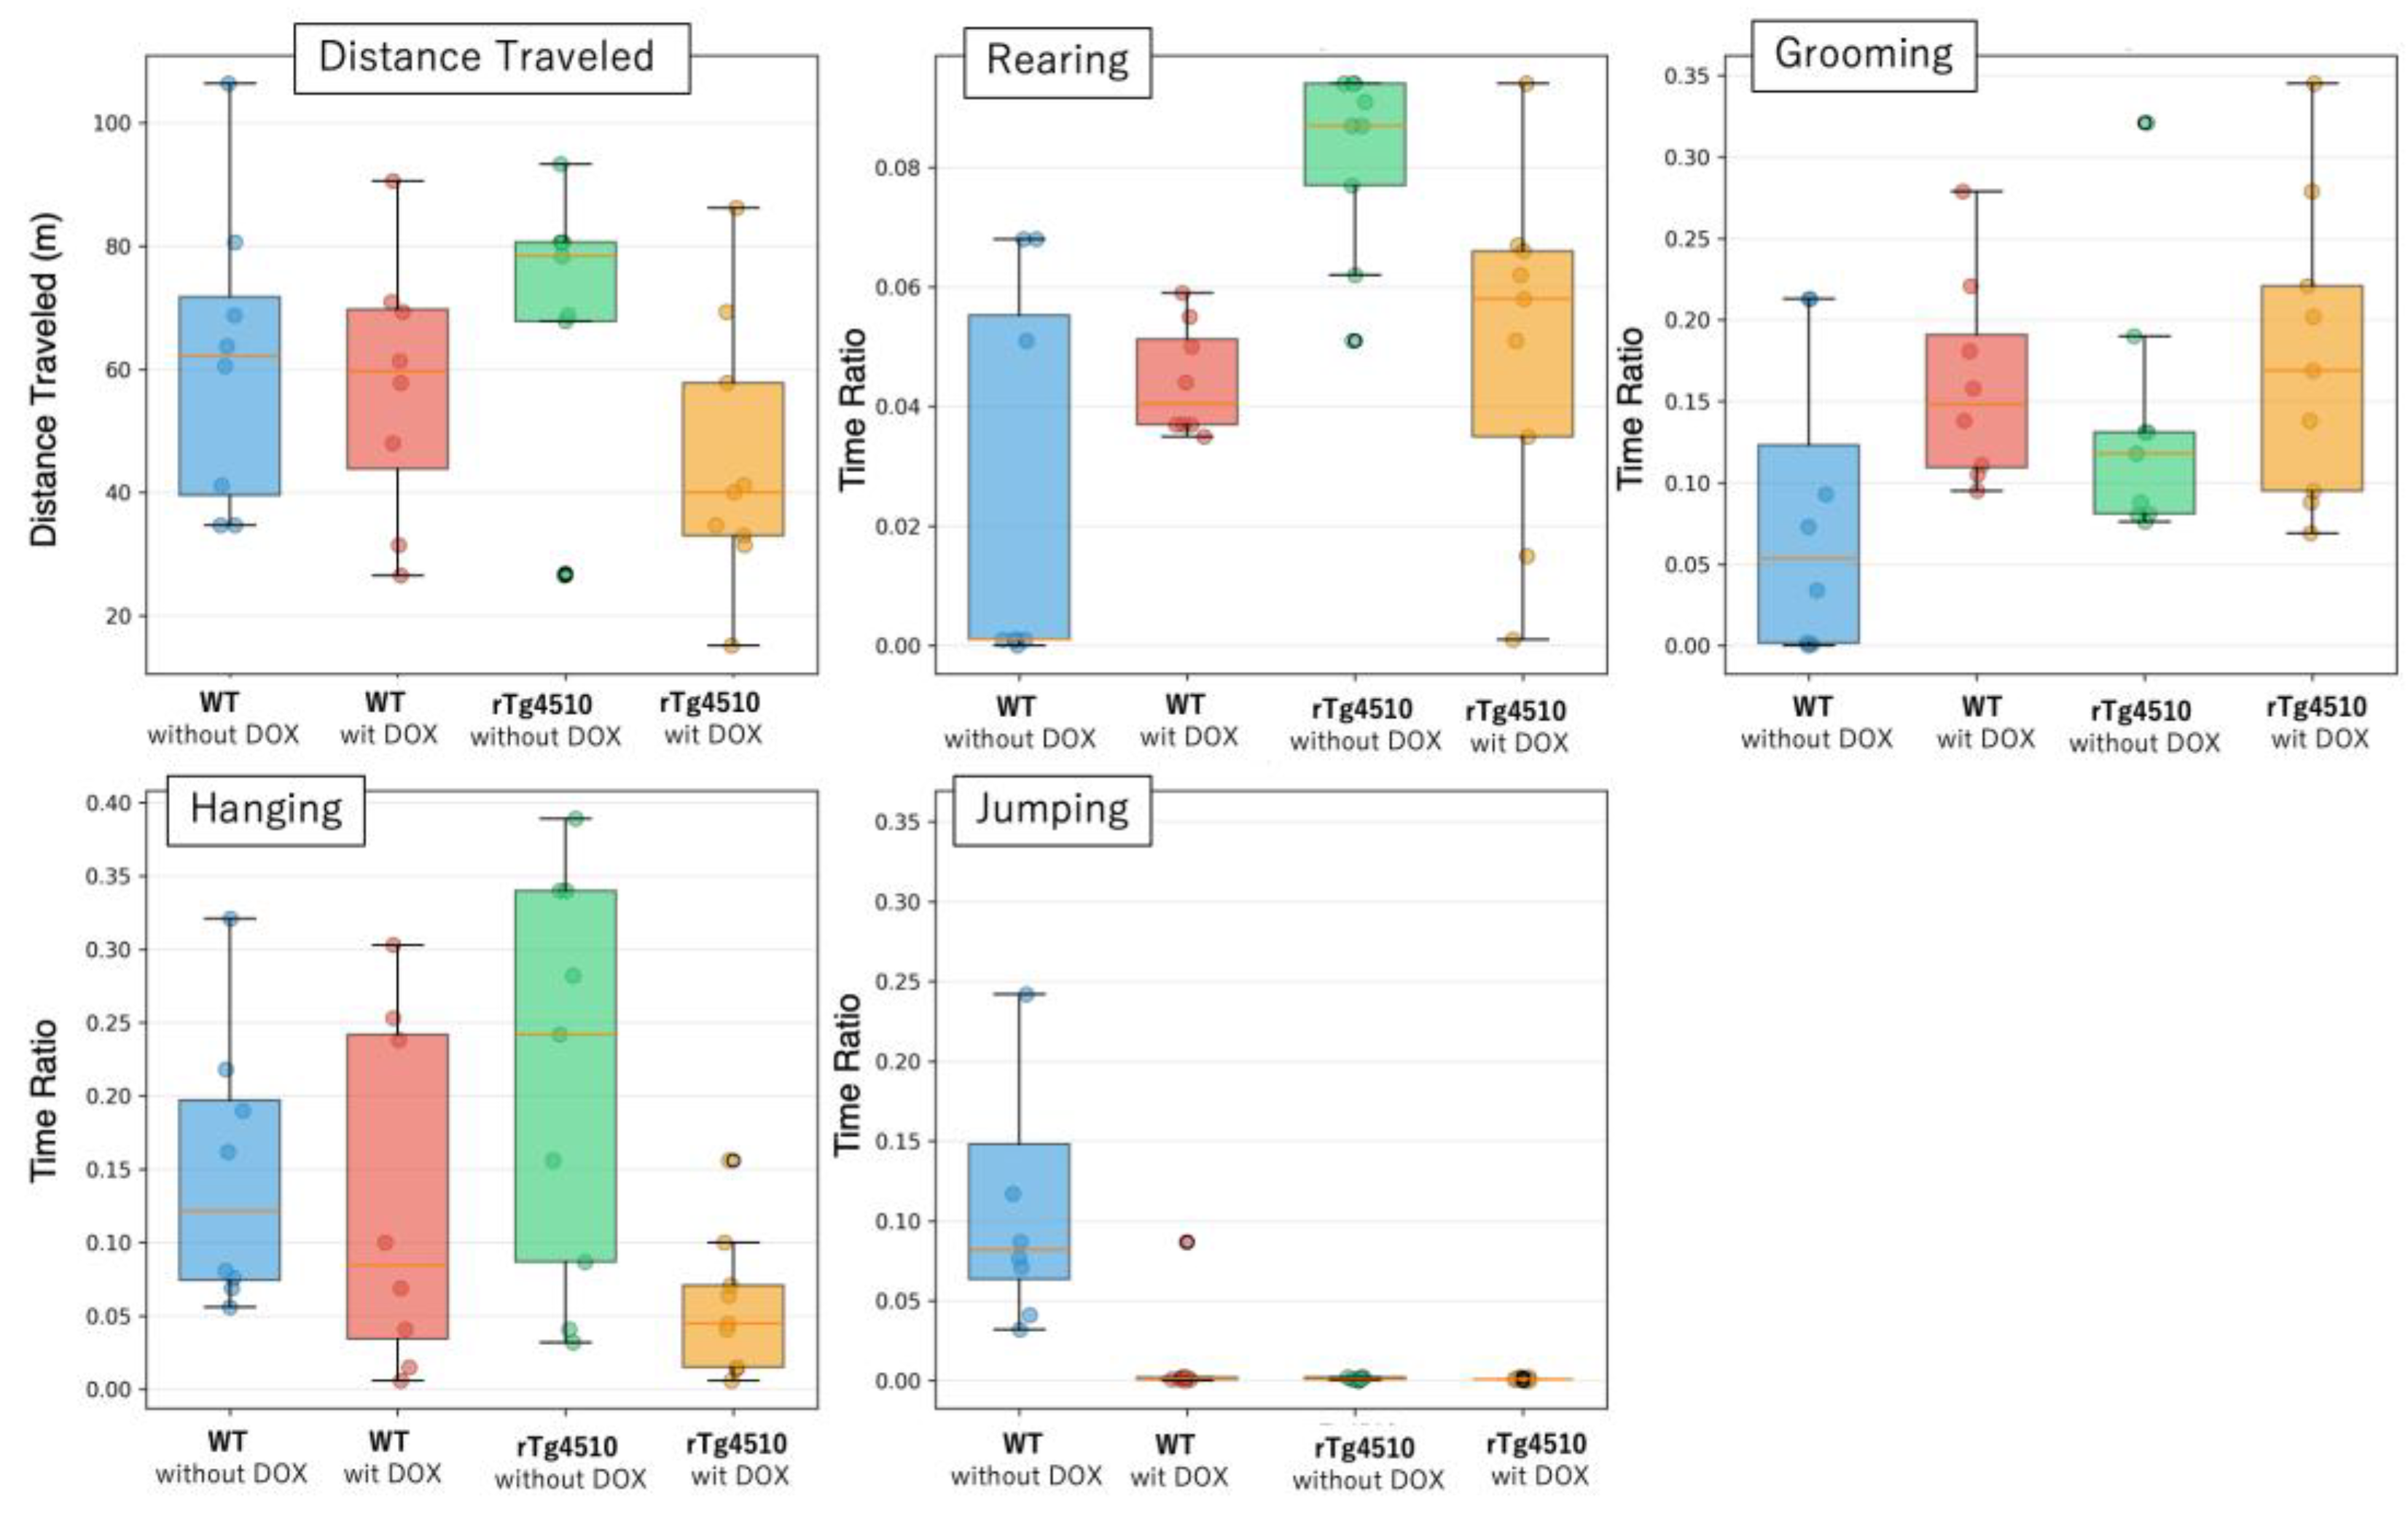
Figure 3.
Distributions of primary behavioral measures across experimental groups.
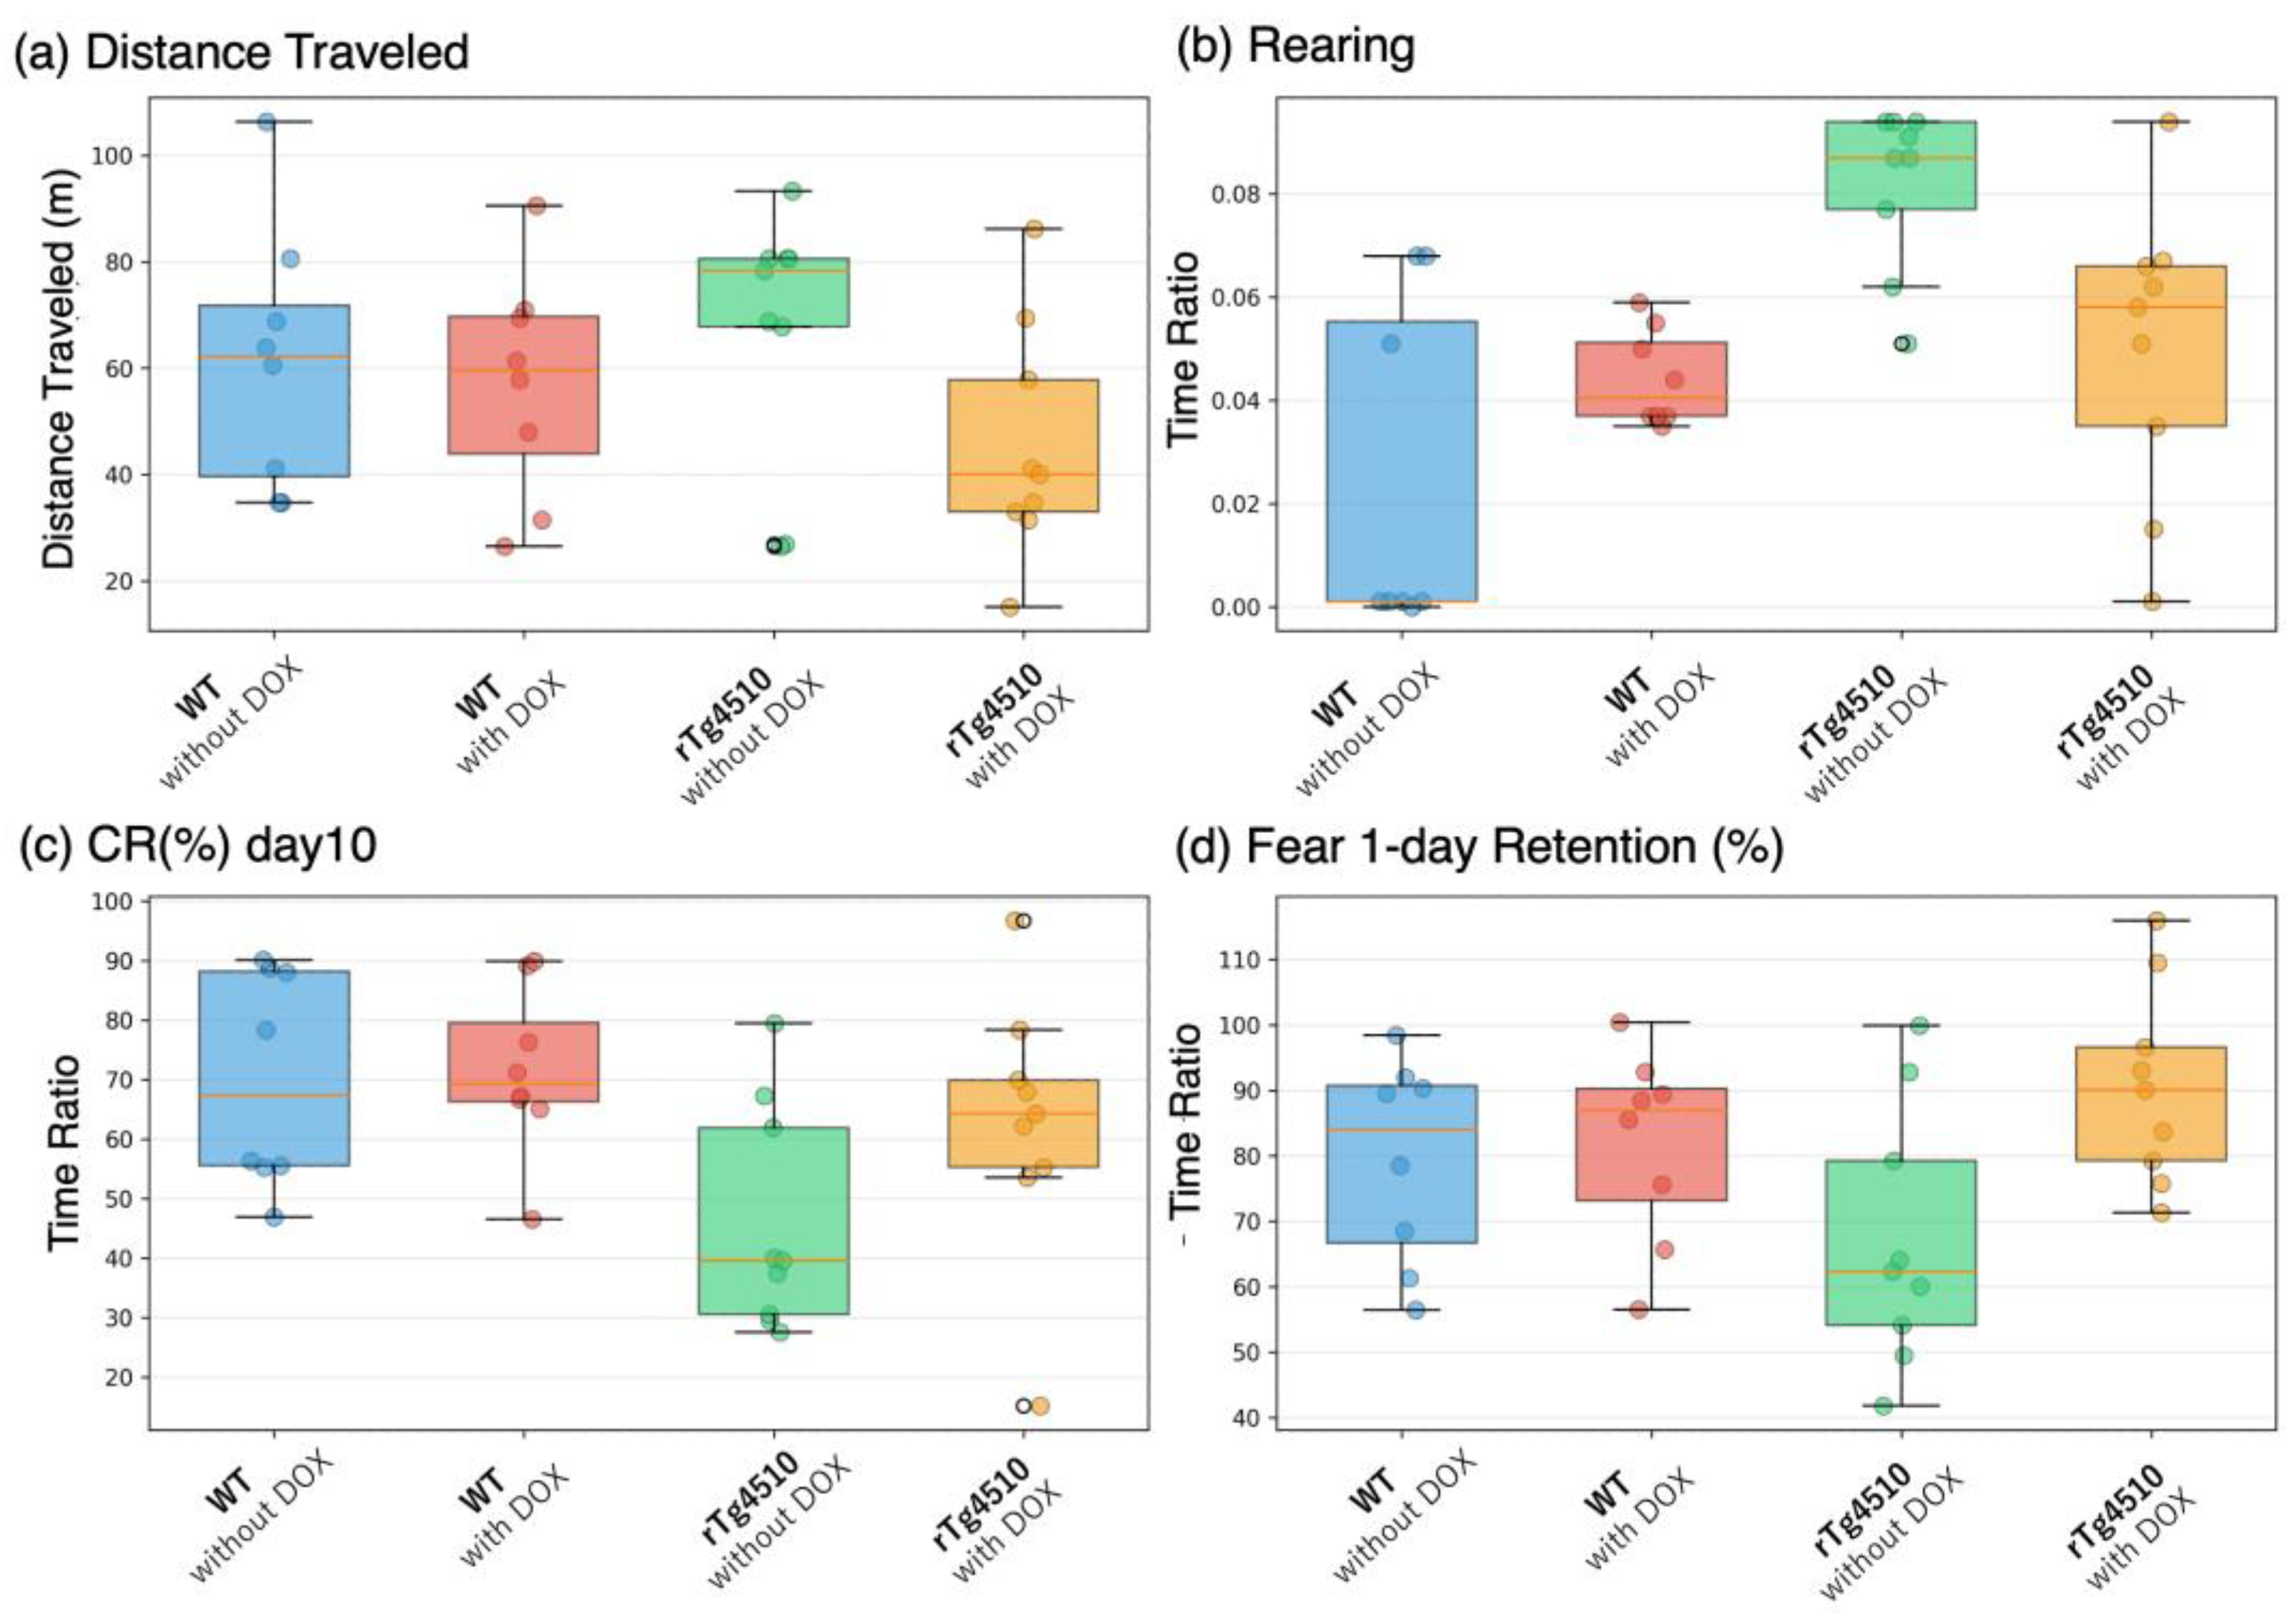
Figure 4.
Individual-level heatmap showing the full behavioral dataset across experimental groups.
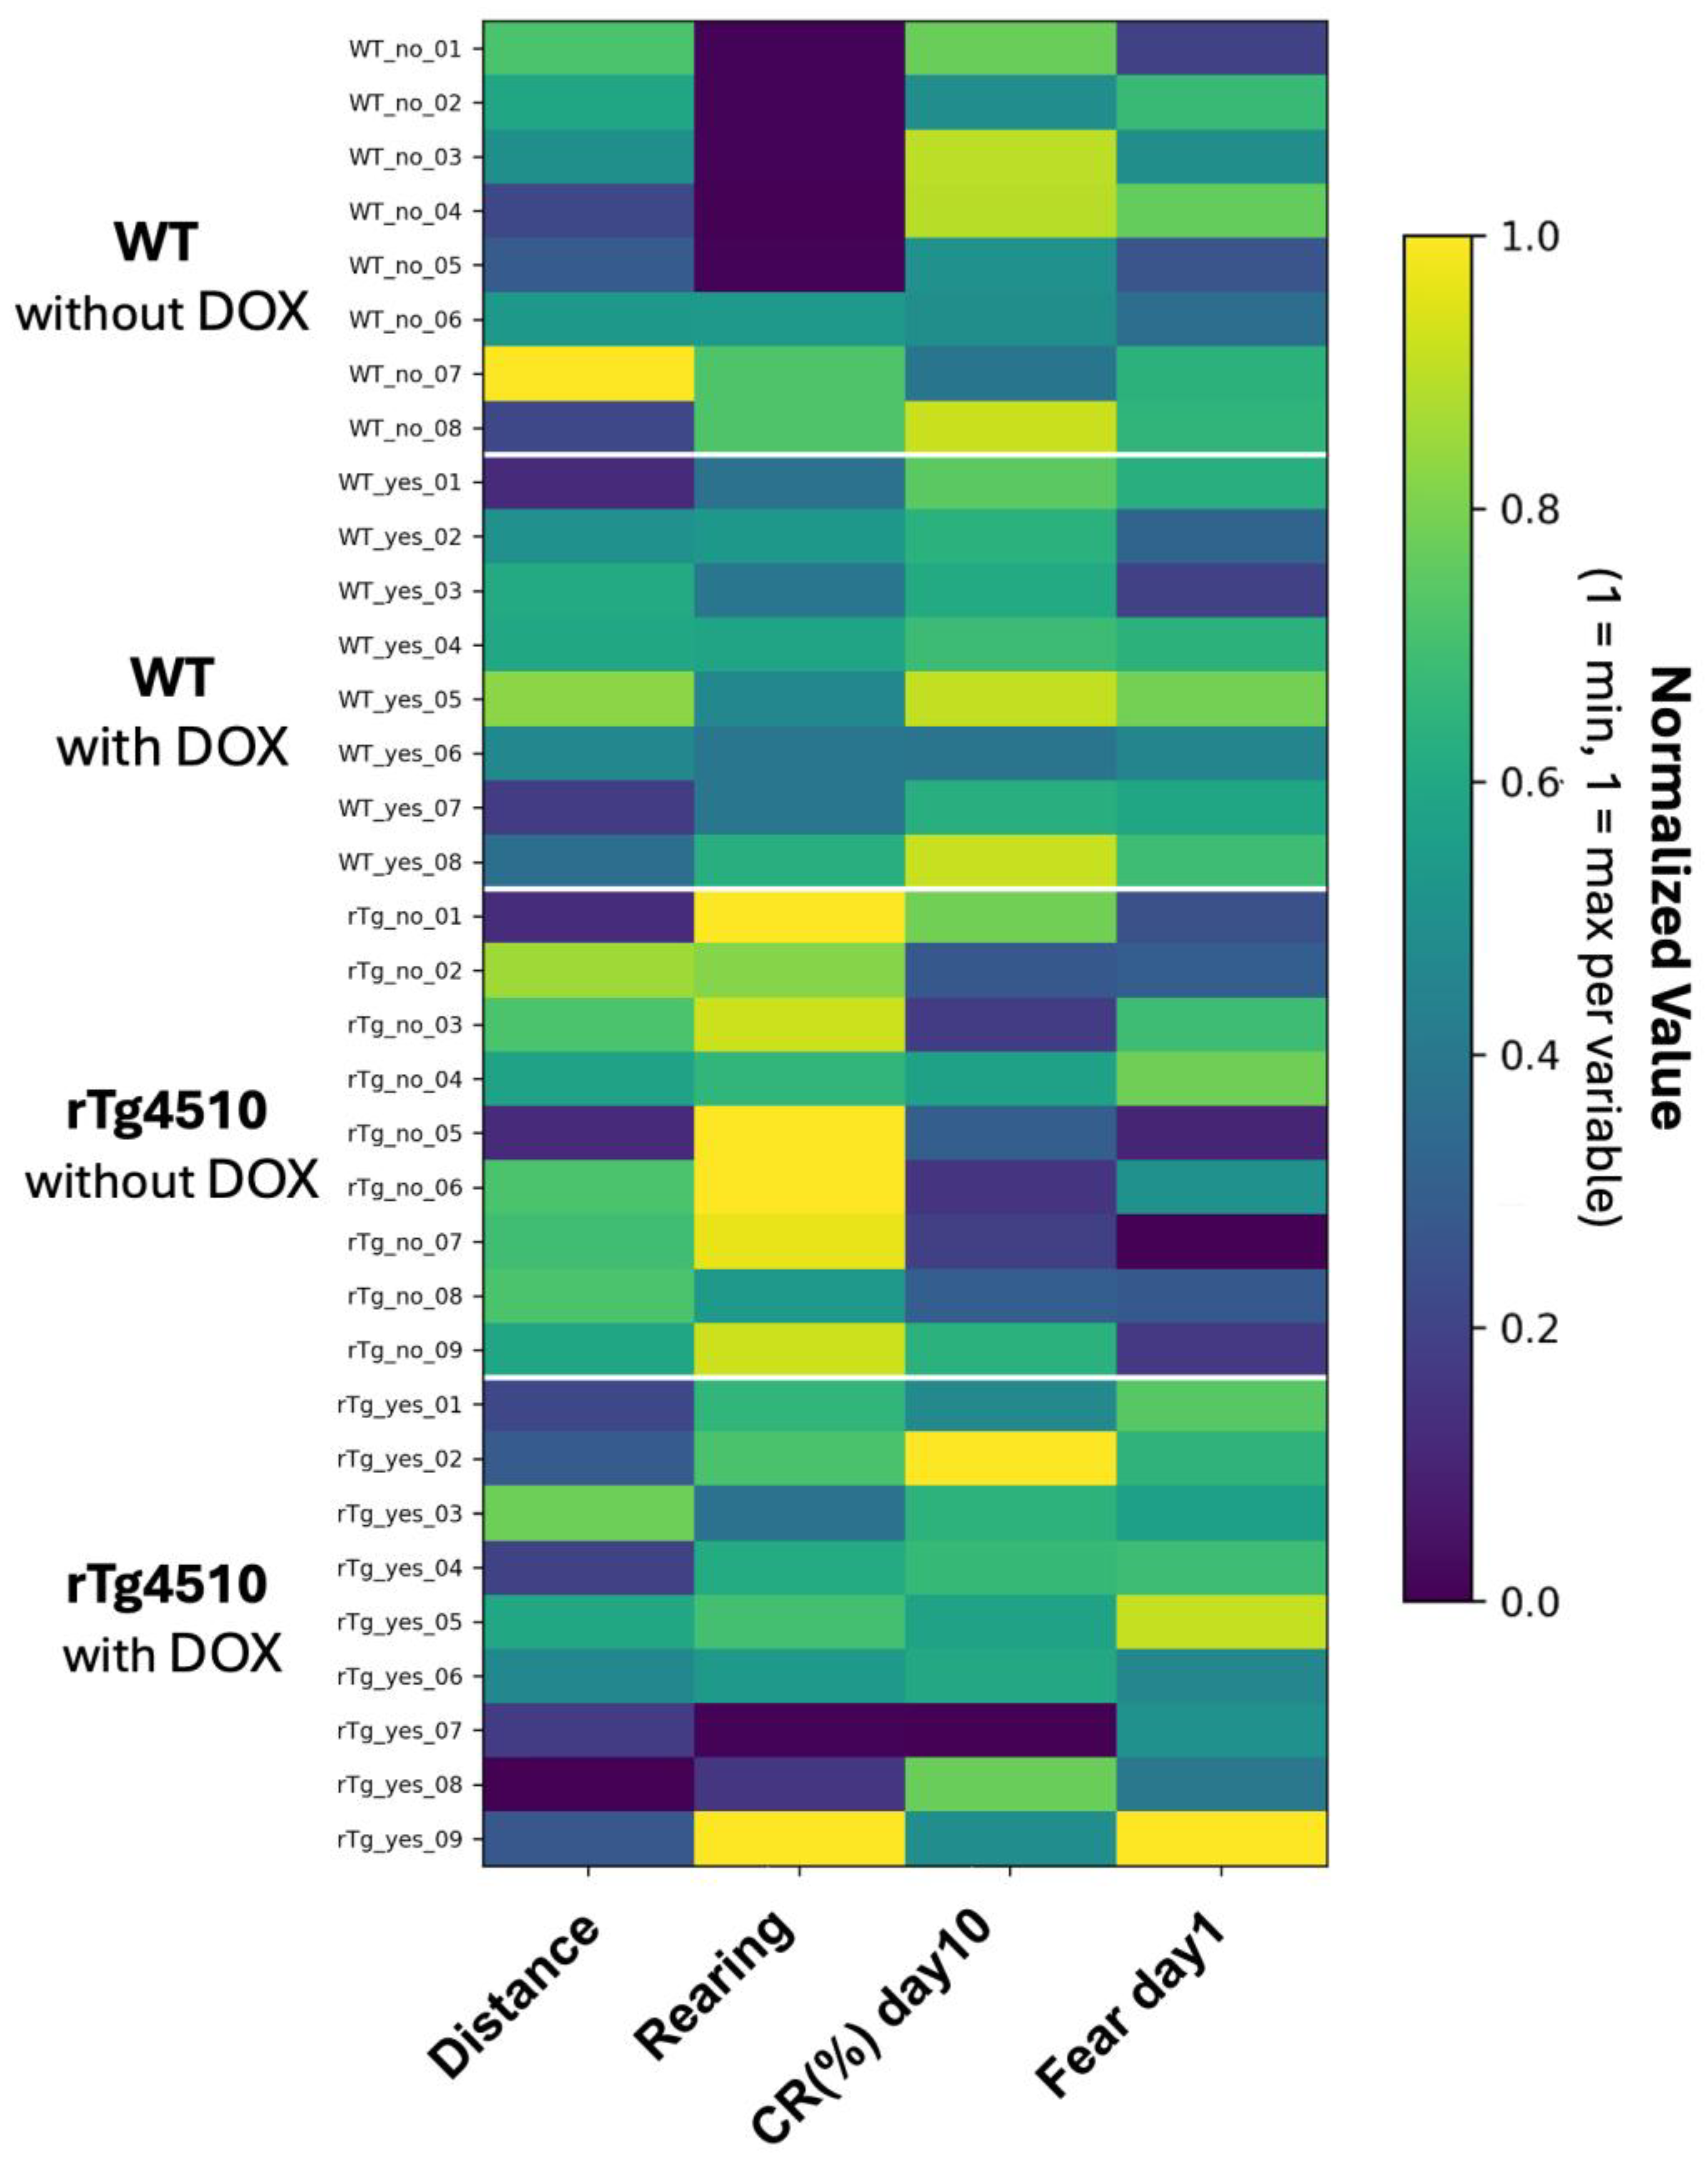
Figure 5.
Group-wise correlations between late-phase eyeblink conditioning and contextual fear memory.
Figure 5.
Group-wise correlations between late-phase eyeblink conditioning and contextual fear memory.
Disclaimer/Publisher’s Note: The statements, opinions and data contained in all publications are solely those of the individual author(s) and contributor(s) and not of MDPI and/or the editor(s). MDPI and/or the editor(s) disclaim responsibility for any injury to people or property resulting from any ideas, methods, instructions or products referred to in the content. |
© 2025 by the authors. Licensee MDPI, Basel, Switzerland. This article is an open access article distributed under the terms and conditions of the Creative Commons Attribution (CC BY) license (http://creativecommons.org/licenses/by/4.0/).
Copyright: This open access article is published under a Creative Commons CC BY 4.0 license, which permit the free download, distribution, and reuse, provided that the author and preprint are cited in any reuse.


