Submitted:
11 December 2025
Posted:
14 December 2025
You are already at the latest version
Abstract
The design of multifunctional biomaterials that offer both structural support and bio-chemical cues is essential for enhancing tissue regeneration. In this study, hybrid nan-ofibrous scaffolds composed of poly(L-lactide-co-ε-caprolactone) (PLCL) and bioactive factors secreted by Wharton’s jelly-derived mesenchymal stem cells (WJ-MSCs) were fabricated via co-electrospinning. Nanofibers were produced in both aligned and ran-dom configurations following an optimized protocol developed at the Institute for Bi-oengineering of Catalonia (IBEC). Morphological and topographical features were characterized using light microscopy and atomic force microscopy (AFM), while fiber orientation was quantitatively assessed through Fast Fourier Transform (FFT) analysis. The controlled release kinetics of FITC-labeled bioactive compounds were evaluated, and human adipose-derived MSCs (AD-MSCs) were used as a cell model to evaluate scaffold biocompatibility, in respect to cell viability, adhesion, proliferation, and mi-gration. FFT analysis was also applied to quantify the orientation of AD-MSCs when cultured on the nanofibers, revealing higher cellular anisotropy and alignment on ori-ented scaffolds. We further show that aligned nanofibers supported cell viability and proliferation, as well as directed migration as wound closure assays showed signifi-cantly faster healing on aligned nanofibers compared to random ones. These results emphasize the synergistic effects of nanofiber alignment and biochemical functionali-zation in modulating cell behavior and promoting tissue regeneration, underscoring the potential of PLCL-based hybrid nanofibers for advanced wound healing applications.
Keywords:
hybrid PLCL nanofibers
; electrospinning
; mesenchymal stem cells
; Wharton’s jelly
; secretome
; AFM
; wound healing
; tissue regeneration
1. Introduction
Chronic, non-healing wounds remain a critical clinical problem and a major burden on healthcare systems worldwide. Conditions such as diabetic ulcers, burns, pressure injuries, and venous leg ulcers are associated with impaired tissue repair, recurrent infections, prolonged treatment period, affecting millions of patients and generating substantial morbidity and healthcare costs [1]. Conventional wound care approaches, comprising of various dressings, topical agents, and surgical interventions, are often insufficient because they primarily offer physical protection without providing biomimetic stimuli required for effective tissue regeneration [2]. Consequently, there is an urgent need to develop bioengineered materials that actively modulate the wound microenvironment to accelerate repair and restore tissue functionality [3].
Tissue engineering offers various promising strategies to recreate the structure and function of native tissues. Among them nanofibers fabrication techniques, such as electrospinning, have emerged as a versatile approach to produce nanofibrous scaffolds that closely mimic the extracellular matrix (ECM) architecture [4]. Moreover, nanofibers exhibit a high surface-to-volume ratio and tunable porosity and orientation, all of them strongly influencing cellular interaction [5].
As a material appropriate for electrospinning poly(L-lactide-co-ε-caprolactone) (PLCL) has garnered considerable attention as a biodegradable and biocompatible copolymer, making it highly suitable for a wide range of biomedical applications [6]. Its unique composition combines the rigidity of poly(lactic acid) (PLA) with the elasticity of poly(ε-caprolactone) (PCL), enabling the fabrication of scaffolds that closely mimic the mechanical properties of soft tissues [7,8]. Notably, PLCL has been approved by the U.S. Food and Drug Administration (FDA), highlighting its safety profile and translational potential [9]. However, despite its favorable mechanical characteristics, synthetic PLCL is inherently bioinert and thus requires functionalization with bioactive compounds to enhance cellular interactions [10]. In this context, electrospinning technology offers a versatile platform for embedding bioactive molecules within the polymeric nanofiber matrix, thereby improving its biological performance.
In parallel, mesenchymal stem cells (MSCs) play a central role in biomaterial-based regenerative therapies due to their multipotent ability to self-renew and differentiate into various mesodermal lineages. Originally isolated from bone marrow, MSCs have since been identified in multiple anatomical sources, including adipose tissue, placenta, tooth pulp, and umbilical cord [11]. While their differentiation capacity was initially considered the primary mechanism of action, current evidence underscores the importance of their paracrine signaling as the dominant contributor to tissue repair [12].
The MSC secretome, comprising a rich array of soluble bioactive molecules and extracellular vesicles, plays a pivotal role in coordinating regenerative processes. This includes angiogenic factors such as vascular endothelial growth factor (VEGF) and basic fibroblast growth factor (bFGF), which stimulate neovascularization; proliferative and migratory cues like epidermal growth factor (EGF) and hepatocyte growth factor (HGF) and immunomodulatory agents such as transforming growth factor-β (TGF-β) and interleukin-10 (IL-10), which regulate inflammation and immune responses [13]. In addition, the secretome contains extracellular matrix (ECM) proteins and adhesive molecules (like fibronectin, laminin fragments, etc.) [14] that support cellular attachment, as well as antimicrobial peptides such as LL-37 and β-defensins [15,16], which contribute to infection control and various messenger RNAs (mRNAs), which have proven pivotal in the intracellular communication. Therefore, integrating the biomimetic properties of PLCL nanofibers with the characteristic bioactivity of the MSC secretome could yield an ideal wound dressing material (or regenerative patch) - capable of delivering bioactive factors in a sustained manner while serving as a substrate that guides the directional migration of autologous stem cells toward the site of injury.
Our recent study [17] demonstrated that the secretome derived from Wharton’s Jelly mesenchymal stem cells (WJ-MSCs) selectively enhances the functional activity of adipose-derived MSCs (AD-MSCs), while preserving the quiescent state of dermal fibroblasts. This targeted paracrine modulation highlights the sophisticated regulatory capacity of the WJ-MSC secretome and supports its potential for the development of precision regenerative therapies. We hypothesize that integrating WJ-MSC–derived bioactive molecules into electrospun nanofibrous scaffolds would yield a construct with diverse multifunctional properties. Specifically: (i) The PLCL polymer will offer structural support that closely mimics the mechanical characteristics of native soft tissues. (ii) The scaffold will serve as a versatile platform for spatial organization of both adhesive and soluble bioactive factors. (iii) It will establish a finely tuned microenvironment for the controlled release of paracrine signaling molecules, thereby promoting tissue regeneration.
This study aims to fabricate bioactive hybrid PLCL nanofibers incorporating secretome-derived molecules from umbilical cord MSCs using electrospinning. The resulting scaffold was evaluated for its morphology, release kinetics, and in vitro bioactivity using other sourced human AD-MSCs as the cellular model. Further assessments of cell adhesion, proliferation, and migration were conducted to elucidate how scaffold alignment influences AD-MSCs functional behavior.
2. Materials and Methods
2.1. Eelectrospining
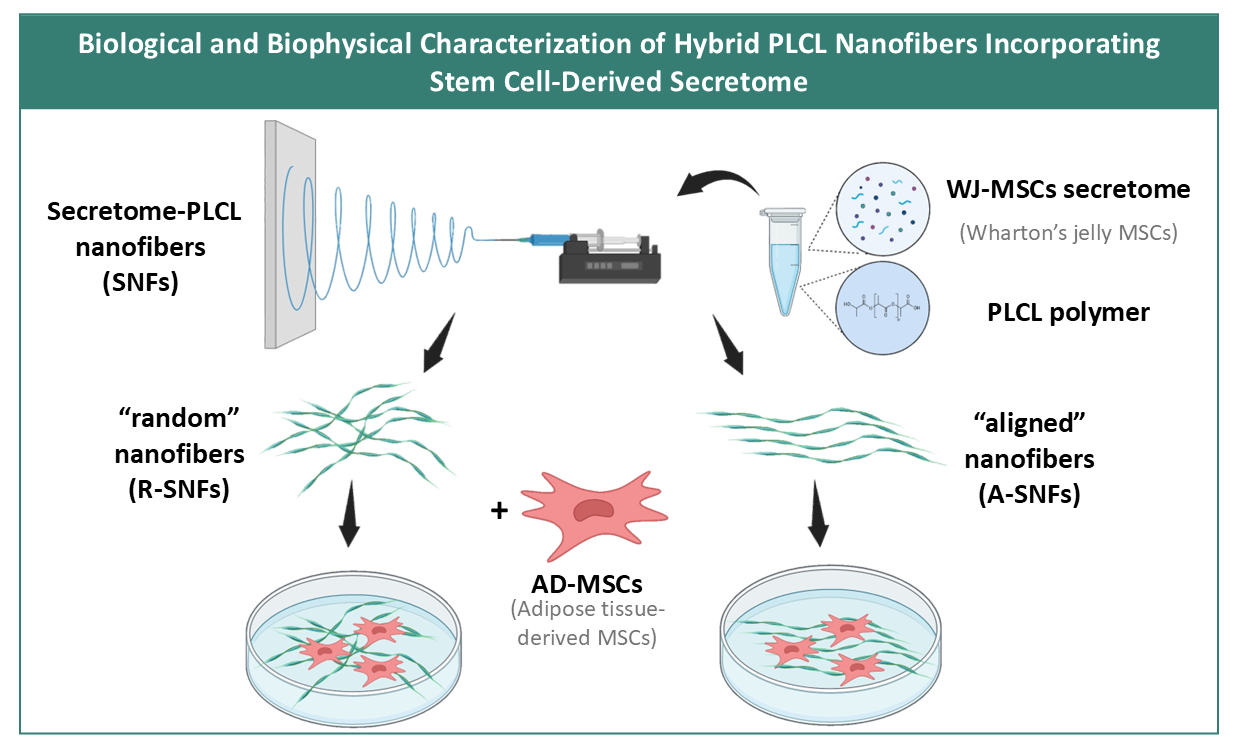
Poly(L-lactide-co-ε-caprolactone) (PLCL) (Sigma-Aldrich, USA) was dissolved in hexafluoroisopropanol (HFIP) (Sigma-Aldrich, USA) at 120 mg/ml at room temperature. Lyophilized Wharton’s jelly mesenchymal stem cells (WJ-MSCs) secretome was provided by Tissue Bank BulGen (Sofia, Bulgaria) and dissolved in HFIP at 0.3 mg/ml. PLCL and WJ-MSCs secretome were mixed in 1:1 proportion (Figure 1). Nanofibers were fabricated using the Spinbox electrospinning device (Bionicia Fluidnatek SLU, Spain) equipped with rotating drum. Randomly deposited bioactive hybrid secretome PLCL nanofibers (R-SNFs) were obtained by electrospining the polymer - WJ-MSCs secretome solution for 10-15 min onto regular glass coverslips (12×12 mm, ISOLAB Laborgeräte GmbH, Eschau, Germany) placed on the grounded Spinbox plate. The applied voltage was 10 kV and the flow rate was 1.5 μl/min for synthesizing random secretome nanofibers (R-SNFs) and 4 μl/min for aligned secretome nanofibers (A-SNFs). The A-SNFs were obtained onto a rotating drum. The protocol for their synthesis was developed in the Institute of Bioengineering of Catalonia (IBEC). As a control were obtained 12% w/v plane PLCL nanofibers (CNFs) electrospun under the same conditions and in both conformations.
2.2. Fast Fourier Transformation Analysis (FFT) with ImageJ
The nanofibers were observed under phase-contrast microscope (Leica DM 2900, Leica Microsystems, Switzerland) at magnification 20X and typical images were obtained. They were analyzed with ImageJ, software version 1.54p (Wayne Rasband, National Institute of Mental Health, NIH, Bethesda, MD, USA) where Fast Fourier transformation analysis (FFT) was applied to characterize the alignment of the fibers. The frequency distribution from the FFT output was visualized by overlaying a circular projection using the Oval Profile plug-in in ImageJ (authored by Bill O’Connnell). This process involved measuring the radial sum of pixel intensities at 1ᴼ intervals from 0ᴼ to 180ᴼ. All FFT data were normalized to a baseline and expressed in arbitrary units to enable direct comparison across datasets.
FFT analysis was also applied to analyze the adhering stem cells alignment. For that purpose, AD-MSCs were seeded at a concentration of 3x10⁴ cells per well in 6 well plate, containing aligned and random SNFs deposited on regular 12x12 mm glass coverslips as above and cultured in standard conditions (as detailed below) for 24 h. Cells seeded on glass coverslips without nanofibers were used as a control. To view the living cells, the samples were incubated with 2 µM Calcein AM (Thermo Fisher Scientific) in DMEM/F12 culture medium (Sigma-Aldrich, USA) supplemented with 1% antibiotic-antimitotic solution (Sigma-Aldrich, USA) for 30 minutes at 37 °C, allowing viable cells to be selectively stained producing bright green fluorescence. After staining, fluorescent images were captured using a fluorescence microscope (Thunder Imager Live Cell, Leica Microsystems, Switzerland) under standardized exposure settings. These images further underwent the same FFT processing pipeline as for the nanofibers to evaluate the overall orientation and alignment of the cells relative to the substrate.
2.3. Atomic Force Microscopy (AFM)
Random and aligned PLCL nanofibers have been deposited on regular glass coverslips (12x12 mm, ISOLAB Laborgeräte GmbH, Eschau, Germany) and observed by Atomic force microscopy (AFM) which was generously performed by the Laboratory of Park Systems UK for subsequent characterization. Topography measurements were carried out in non-contact mode (NCM) nanomechanical PinPoint mode.
2.4. FITC Labeling of WJ-MSCs Bioactive Molecules and Purification by Gel Permeation Chromatography (GPC)
Fluorescein isothiocyanate (FITC) labeling followed by Gel Permeation Chromatography (GPC) was performed to evaluate the successful incorporation of the secretome into the PLCL nanofibers. The WJ-MSCs secretome was dissolved in 1 ml carbonate-bicarbonate buffer (pH~9) (Sigma-Aldrich, USA) to a final protein concentration of 0.6 mg/ml. Then 7 μl 10 mg/ml FITC (Sigma-Aldrich, USA) were added to a final concentration of 70 μg/ml. The solution was incubated for 1 h at room temperature in the dark. Following the labeling reaction, excess unreacted FITC was removed by GPC using a size-exclusion column. The purified FITC-labeled protein fractions were collected and stored at 4ᴼC in the dark until further use.
2.5. Protein Release Assay
To evaluate the amount of protein released from the SNFs, protein release assay was performed. The previously FITC-labeled bioactive molecules were used to create secretome-PLCL nanofibers. Protein release was assessed by incubating the labeled samples in phosphate buffered saline (PBS, pH 7.4) (Sigma-Aldrich, USA) at 37ᴼC for 7 days. The amount of released FITC-labeled protein was quantified by measuring the fluorescence intensity (excitation: 495 nm/emission: 519 nm) using a spectrofluorometer (FP-8050, Jasco Inc., USA).
2.6. Cell Culturing
Human adipose tissue derived mesenchymal stem cells (AD-MSCs) used for the experiments were obtained by Tissue Bank BulGen (Sofia, Bulgaria) with informed consent from donors prior to liposuction. Cells were cultured in DMEM/F12 medium supplemented with 10% fetal bovine serum (FBS) (both from Sigma-Aldrich, USA) and 1% antibiotic-antimycotic solution (Sigma-Aldrich, USA) in humidified thermostat at 37 °C, 5% CO₂. Medium was replaced every 2 to 3 days until cells reached ~90% confluence and then passaged using 0.05% trypsin/0.6 mM EDTA (Sigma-Aldrich, USA). Cells used for experiments were between passages 4 and 6.
2.7. Live-Dead Analysis
AD-MSCs were seeded at a concentration of 3x10⁴ cells per well in a 6 well plate onto aligned and random SNFs deposited on regular glass 12x12 coverslips as above, which were previously sterilized with 70% ethanol (Sigma-Aldrich, USA). The seeded samples were cultured in DMEM/F12, supplemented with 10% FBS and 1% antibiotic-antimitotic solution (all from Sigma-Aldrich, USA) under standard conditions (37 °C, 5% CO₂) for 24, 48, 72 h. To evaluate cell viability at each time point, live and dead cells were simultaneously stained using Cellstain Double Staining Kit (Sigma-Aldrich, Cat. No. 04511) according to the manufacturer’s instructions. Briefly, the staining solution was prepared fresh and applied to each sample, followed by incubation at 37 °C for 15 min in the dark. Fluorescent images were then acquired using a fluorescence microscope (Thunder Imager Live Cell, Leica Microsystems, Switzerland) with appropriate filter sets to differentiate live (green fluorescence) and dead (red fluorescence) cells.
2.8. Cell Adhesion and Overall Morphology
To investigate the initial cell adhesion and overall cell morphology the control PLCL and SNFs nanofibers were cultured with AD-MSCs. The nanofibers were sterilized with ethanol 70% (Sigma-Aldrich, USA) and pre-wetted in DMEM/F12 culture medium (Sigma-Aldrich, USA), supplemented with 1% antibiotic-antimitotic solution (Sigma-Aldrich, USA) overnight. AD-MSCs were seeded onto the control PLCL and SNFs nanofibers loaded on regular glass coverslips (12×12 mm, ISOLAB Laborgeräte GmbH, Eschau, Germany) at density of 3x10⁴ cells/cm2 and cultured in serum free medium DMEM/F12 at 37 ᴼC in a humidified incubator with 5% CO2 for 2 h to allow cell attachment. After that 10% FBS (Sigma-Aldrich, USA) was added. Cell attachment was observed under phase-contrast microscope and then fixed with 4% paraformaldehyde (Sigma-Aldrich, USA) for 10 min at room temperature. After that the cells were permeabilized with 0.5% Triton X-100 (Sigma-Aldrich, USA) for 5 min, and stained with FITC-Phaloidin (Invitrogen, Thermo Fisher Scientific, USA) (dilution 1:100) for 30 min to visualize actin cytoskeleton. The nuclei were counterstained with Hoechst 33258 (1:2000) (Sigma-Aldrich, USA) before being washed and mounted with Mowiol (Polysciences, Inc.). Representative pictures of the adhered cells were then taken using fluorescent microscope (Thunder Imager Live Cell, Leica Microsystems, Switzerland) and the corresponding software. In order to determine the overall cell shape, the CellProfiler software version 4.2.8 [18] was used.
2.9. Cell Proliferation Assay
AD-MSCs were seeded at a concentration of 3x10⁴ cells per 6 well plate onto aligned and random SNFs deposited on sterile regular glass coverslips (12×12 mm, ISOLAB Laborgeräte GmbH, Eschau, Germany), which were previously sterilized with 70% ethanol (Sigma-Aldrich, USA). The cells were then cultured in DMEM/F12 (Sigma-Aldrich, USA) supplemented with 1% antibiotic-antimitotic solution (Sigma-Aldrich, USA) under standard conditions (37 °C, 5% CO₂) in the 6 well plates. To assess cell proliferation, samples were analyzed at 24, 48, and 72 h of culture. At each time point, cells were fixed with 4% paraformaldehyde (Sigma-Aldrich, USA) and subsequently stained with Hoechst 33258 (1:2000 dilution, Sigma-Aldrich) to visualize cell nuclei. Fluorescence images were acquired using a fluorescence microscope (Thunder Imager Live Cell, Leica Microsystems, Switzerland) equipped with a 10x objective. Quantification of cell number was performed using CellProfiler software to enable objective and reproducible counting of nuclei. The doubling time was calculated by using the following formula:
where Nb is the initial cell density, Ne is the final cell density and T is the time passed between the two measurements.
Doubling Time = [T×(ln2)] / [ln(Ne/Nb)],
2.10. Visualization of Focal Adhesions
The cells were seeded as described above. To visualize focal adhesions, fixed and permeabilized samples were saturated with 10% FBS in phosphate-buffered saline (PBS) (both from Sigma-Aldrich, USA) for 15 min. and immunofluorescent stained for vinculin using mouse monoclonal anti-vinculin antibody (V9264, Sigma Aldrich, USA) dissolved in 10% FBS in PBS for 30 min followed by Alexa Fluor 555 Goat anti-mouse IgG (BioLegend) as a secondary antibody (30 min). To simultaneously visualize actin, FITC-phalloidin (Invitrogen, Thermo Fisher Scientific, USA) was added to the secondary antibody solution at a final concentration of 1:100. Fluorescent images were acquired using a fluorescence microscope (Thunder Imager Live Cell, Leica Microsystems, Switzerland) with 20x objective.
2.11. Artificial Wound Healing (Scratch) Assay
AD-MSCs was seeded in 12-well plates (Corning, USA) and cultured in DMEM/F12 medium supplemented with 10% FBS and 1% antibiotic-antimitotic solution (all from Sigma-Aldrich, USA). After reaching cell density around 90% a linear scratch was made across the cell monolayer using a sterile 200 µL pipette tip. The CNFs and SNFs were synthesized on round holders designed for the experiment. The nanofibers were placed on top of the cell monoleyer after the linear scratch was made. Cell monolayers without nanofibers were used as controls. The cells were incubated in DMEM/F12 medium (Sigma-Aldrich, USA) with 1% antibiotic-antimitotic solution (Sigma-Aldrich, USA) without fetal bovine serum (FBS) and observed using the live cell chamber of the inverted fluorescent microscope (Thunder Imager Live Cell, Leica Microsystems, Switzerland) in time-laps mode (each 15 min) during 24 h. Images of the scratched area were captured in a selected time points (0 and 24 h) with 10x objective under phase-contrast. The closure of the scratched area was quantified using ImageJ software version 1.54p (Wayne Rasband, National Institute of Mental Health, NIH, Bethesda, MD, USA) with a plugin for high throughput image analysis of in vitro scratch assays [19] and the percentage of wound closure was calculated as:
where A0 is the wound area at 0 h and At is the area at time t.
% Closure = [(A0 - At) / A0]×100,
2.12. Statistical Analysis
Statistical analysis was done using GraphPad Prism 8 (GraphPad Software, USA). Results were displayed as column bar graphs, as scatter plots with each point representing an independent replicate, as line graphs, or as percentage stacked bar chart. For all data the Shapiro-Wilk test for normality was performed and then the homogeneity of variances of the data was assessed using Bartlett’s test. The method for determining statistical significance, the statistical significance itself and the number of replicates are all included in the figures’ legends.
3. Results
3.1. Characterization of Hybrid Secretome-PLCL Nanofibers
To fulfill the main goal of this study, we embedded secretome derived from Wharton’s Jelly mesenchymal stem cells (WJ-MSCs) into electrospun poly(L-lactide-co-ε-caprolactone) (PLCL) nanofibers. Our previous research [17]demonstrated that this secretome notably boosts the proliferation and migration of MSCs from other sources. The integration followed a modified version of the established protocol for producing hybrid fibrinogen/PLCL nanofibers, originally developed at the Institute for Bioengineering of Catalonia (IBEC). PLCL and lyophilized secretome were separately dissolved in hexafluoroisopropanol (HFIP) and mixed in a 1:1 ratio, resulting in final concentrations of 60 mg/mL for PLCL and 0.15 mg/mL for the secretome-corresponding to 6% w/v for secretome-functionalized nanofibers (SNFs) and 12% w/v for control PLCL nanofibers. Randomly oriented and aligned nanofibers were produced via direct electrospinning onto a grounded electrode or a rotating drum collector, respectively, as outlined in the Methods section.
As shown on Figure 2A, B control PLCL nanofibers (CNFs) exhibited uniform morphology across both random (R-CNFs) and aligned (A-CNFs) configurations. Incorporation of the WJ-MSC secretome (SNFs) however resulted in a significant reduction in average fiber diameter, discernible even under low-mag (20X) phase contrast images (Figure 2G, H). More precise size determination was performed by AFM as shown below in Paragraph 3.
3.1.1. Fast Fourier Transform (FFT) Analysis
FFT analysis was conducted to evaluate the alignment of nanofibers. Radial intensity profiles were extracted from the FFT patterns to assess fiber orientation (Figure 2C–J). Aligned nanofibers exhibited strongly anisotropic features in the frequency domain, with a most of the intensity confined within an angular range of approximately 20°, observed for both control (CNFs; Figure 2D, F) and secretome-loaded nanofibers (SNFs; Figure 2J, L). In contrast, randomly oriented nanofibers displayed isotropic FFT patterns lacking any dominant angular distribution, consistent with the random morphology of control CNFs (Figure 2C, E) and secretome-loaded SNFs (Figure 2I, K).
3.1.2. Release Kinetics of Secretome from Nanofibers
To confirm the successful incorporation of the secretome into the PLCL nanofiber matrix, FITC-labeled secretome was used to fabricate hybrid nanofibers in both random and aligned configurations. Fluorescence imaging demonstrated a clear fluorescence signal within nanofibers, confirming the presence of secretome-associated biomolecules (Figure 3 A, B). Though some microscopic clusters might be observed on these samples, suggesting the irregular distribution of the incorporated secretome, the fluorescent signal generally followed the morphological pattern of the fibers in both random or aligned configuration.
The fluorescence assay further revealed a sustained release of fluorescently labeled secretome products from the SNFs for up to 48 h, followed by a plateau corresponding to a diffusion equilibrium with the surrounding medium (Figure 3C). Control PLCL nanofibers without incorporated secretome exhibited negligible florescence.
3.1.3. Atomic Force Microscopy (AFM) Analysis of Nanofiber Morphology and Mechanical Properties
Atomic force microscopy (AFM) analysis (Figure 4A) confirmed that hybrid nanofibers (SNFs) retained their structural integrity compared to control nanofibers (CNFs). Incorporation of the WJ-MSC secretome resulted in a pronounced reduction in fiber dimensions (Figure 4B,C(a)), with the mean cross-sectional area decreasing by approximately two orders of magnitude relative to control fibers (Table 1). This reduction is consistent with the lower polymer concentration used during electrospinning (6% w/v for SNFs vs. 12% w/v for control plane PLCL NFs).
Cross-sectional profiling revealed also a notable difference in nanofiber geometry (Figure 4B). Secretome-functionalized nanofibers (SNFs) exhibited a more elongated cross-sectional shape, resulting in a higher aspect ratio compared to the more circular profiles observed in control PLCL nanofibers (CNFs) (Table 1). This morphological shift suggests that secretome incorporation alters fiber formation, potentially due to changes in blend density. Mechanical analysis further showed that SNFs had a higher apparent Young’s modulus than CNFs, increasing from 0.99 to 1.49 (Figure 4C(a), Table 1). Although increased stiffness is typically associated with higher polymer content, which is not the case here, we attribute this difference to the influence of the underlying substrate to which the fibers adhere.
3.2. Cellular Interaction
3.2.1. Overall Morphology and Spreading of AD-MSCs Adhering to Secretome-Containing Nanofibers
Immunofluorescence staining conducted five h post-incubation demonstrated effective cell attachment on both random and aligned nanofibers, with distinct morphological patterns (Figure 5). Cells exhibited a stellate shape on random nanofibers (Figure 5A) and a spindle-like morphology on aligned nanofibers (Figure 5C). The presence of vinculin-positive clusters (Figure 5B, D) at the cell periphery indicates the formation of strong focal adhesions, while the pronounced actin stress fibers across both substrates suggest efficient cell spreading and well-organized cytoskeletal architecture. These findings confirm that secretome-functionalized nanofibers support mesenchymal stem cell (MSC) adhesion. Additionally, the emergence of elongated cell morphology on aligned nanofibers further implies that MSCs actively sense and respond to the nanofiber orientation.
3.2.2. Morphometry Analysis of Cell Spreading and Elongation
Considering the heterogeneity in cell morphology, CellProfiler software was further employed to analyze the main difference in cell spreading area of individually measured cells (Figure 6A,B).
Quantitative analysis demonstrated that the average cell spreading area was significantly greater (p < 0.05) on randomly oriented SNFs, revealing area of approximately 500 μm², compared to 320 μm² on aligned fibers (Figure 6C). This finding suggests that the random fiber configuration offers multidirectional attachment sites, allowing cells to spread in various directions. Conversely, the aligned nanofibers seem to restrict the spreading area, encouraging an elongated morphology following the fibers axis.
3.3. Stem Cells Culture on Secretome PLCL Nanofibers
To better understand how stem cells interact with hybrid SNFs over time, we ran a 3-day lab experiment. This test aimed to confirm that the secretome-containing nanofibers are compatible and biologically active during extended culture - an essential aspect of tissue regeneration.
3.3.1. Aligned Nanofibers Sustain AD-MSC Viability During Extended Culture
Cell viability is a critical parameter influencing cellular behavior. To evaluate the impact of secretome-functionalization of nanofibers (SNFs) and the effect of their orientation, the viability of AD-MSCs cultured on SNFs was monitored at 24, 48, and 72 h (Figure 7A). During the first two days, no significant differences in viability were observed, although cells on randomly oriented SNFs consistently showed slightly lower viability. By day 3, AD-MSCs cultured on aligned SNFs (A-SNFs) maintained high viability, whereas those on randomly oriented SNFs (R-SNFs) exhibited an already significant increase in apoptotic cells (Figure 7B). These findings suggest that nanofiber alignment plays a key role in supporting cell vitality during extended culture.
3.3.2. FFT Analysis of Cell Orientation
After 24 h of culture, cells on A-SNFs displayed a pronounced unidirectional alignment, resulting in elongated morphologies (Figure 8A(g)). This contrasted with the disordered cellular arrangement observed on R-SNFs and control glass substrates (Figure 8A(d) and (a), respectively). Interestingly, stem cells on R-SNFs tended to cluster (Figure 8A(d)), suggesting a propensity for homotypic interactions. Fast Fourier Transform (FFT) analysis supported these findings, revealing a distinct anisotropic frequency domain for cells on A-SNFs (Figure 8A(h)), in contrast to the more isotropic patterns seen on control and R-SNF surfaces (Figure 8A(b) and (e)). The radial intensity profile for A-SNFs was concentrated within an angular range of approximately 60° (Figure 8A(i)), indicating strong cellular alignment in accordance with the nanofiber orientation. In comparison, cells on R-SNFs and the control substrate exhibited diffuse, isotropic FFT profiles lacking directional preference (Figure 8A(c) and (f)).
Quantitative morphometric analysis at 24 h of incubation revealed a significant decrease in cell spreading area (CSA) and a corresponding increase in aspect ratio (AR) for AD-MSCs cultured on A-SNFs, indicating a more elongated cell morphology compared to both R-SNFs and control substrates (Figure 8B and C). Notably, cells on R-SNFs also exhibited a moderate reduction in CSA relative to the control (plain glass substrate), though this effect was less pronounced than that observed with aligned nanofibers.
3.3.3. Nanofiber Alignment Supports AD-MSC Proliferation
Quantitative analysis of AD-MSC proliferation at 24, 48, and 72 h (Figure 9) revealed a significant increase in cell density on aligned nanofibers (A-SNFs), particularly evident at the 72-hour mark (Figure 9A). This was accompanied by a notable reduction in cell doubling time (Figure 9B), estimated to be approximately fourfold shorter than on R-SNFs and about half that of the control glass substrate, suggesting an enhanced proliferation rate. In contrast, cells cultured on randomly oriented nanofibers (R-SNFs) exhibited markedly slower proliferation, with an estimated doubling time of around 130 h – substantially longer than the approximate 70 h for the control and 25 h for A-SNFs.
3.3.4. The Nanofiber Configuration Modulates Cell Cycle Progression of AD-MSC
To assess whether nanofiber architecture influences the proliferation dynamics of AD-MSCs, cell cycle distribution was evaluated after 48 h of culture on plain substrates, randomly oriented SNFs (R-SNFs), and aligned SNFs (A-SNFs) using image-based fluorometric analysis of individual cells (Figure 10). Cells cultured on plain glass and R-SNFs exhibited similar profiles, with a dominant population in the G1 and S phases and a smaller fraction in G2/M (Figure 10A and B). In contrast, AD-MSCs grown on A-SNFs (Figure 10C) showed a pronounced shift in cell cycle dynamics, marked by a decreased proportion of cells in G1 and an approximately fivefold increase in the G2/M population compared to the control (Figure 10D). Additionally, the S phase fraction was reduced nearly fourfold relative to both the control and R-SNFs, indicating accelerated progression through DNA synthesis and entry into mitosis. These results suggest that aligned nanofiber configuration enhances proliferative activity by promoting G1 phase exit and facilitating cell cycle progression.
3.3.5. Spheroids Formation
As shown above, AD-MSCs cultured on randomly oriented secretome-functionalized nanofibers (R-SNFs) exhibited reduced viability and slower proliferation compared to those grown on aligned nanofibers (A-SNFs) and control surfaces, particularly evident at the 72-hour time point (Figure 7 and Figure 9 above). Continued incubation up to six days in a follow-up experiment confirmed this trend, as live/dead staining consistently revealed a lower proportion of viable cells on R-SNFs - a pattern already evident on day 3 in previous experiments (Figure 7B). Since the fibers were electrospun using the same method and duration, and potential cytotoxicity differences can likely be excluded, this prompted a closer examination of cell morphology during the extended 6-day culture period.
By day 1, cells on R-SNFs began forming visible clusters (Figure 11A(a,d)), which progressed into early spheroid structures by day 3 (Fig, 11(b,e)), culminating in mature spheroids by day 6 (Figure 11(c,f)). These 3D aggregates were frequently associated with increased cell death, particularly in their cores by day 3. By day 6, mature spheroids displayed pronounced central apoptosis, likely due to restricted nutrient and oxygen diffusion within the dense structures (Figure 11B).
These observations suggest that while random nanofiber substrates facilitate spheroid formation, they may also create micro environmental limitations that compromise long-term cell survival.
3.4. In Vitro Wound Healing Assay
As shown in Figure 12, in vitro wound healing (scratch) assays with AD-MSCs demonstrated that aligned secretome-functionalized PLCL nanofibers (A-SNFs) significantly enhanced cell migration (Figure 12A) and accelerated wound closure (Figure 12B and C) compared to control substrates. In contrast, randomly oriented nanofibers resulted in slower cell movement and delayed wound area closure.
These findings underscore the importance of fiber alignment in providing directional cues that support coordinated cell migration and promote efficient wound healing.
4. Discussion
This study presents a comprehensive biological and biophysical evaluation of hybrid poly(L-lactide-co-ε-caprolactone) (PLCL) nanofibers functionalized with secretome derived from Wharton’s Jelly mesenchymal stem cells (WJ-MSCs). By combining the structural versatility of electrospun PLCL with the regenerative bioactivity of stem cell-derived secretome, we aimed to develop a multifunctional scaffold capable of guiding cell behavior and enhancing tissue regeneration.
Electrospinning of PLCL under optimized conditions yielded nanofibers with uniform morphology in both random and aligned configurations. Incorporation of the WJ-MSC secretome led to a marked reduction in fiber diameter, observable even under low-magnification microscopy and confirmed by AFM. This reduction is consistent with the lower polymer concentration used for the hybrid secretome-PLCL nanofibers (SNFs) (6% w/v) compared to the control PLCL nanofibers (12% w/v), and aligns with previous findings on polymer blend effects on fiber morphology [20].
Fast Fourier Transform (FFT) analysis revealed that aligned nanofibers exhibited strong anisotropy, with intensity confined within a narrow angular range (~20°), while randomly oriented fibers displayed isotropic patterns. These results confirm the successful control of fiber orientation, a critical parameter for directing cell alignment and behavior [21].
Fluorescence imaging of FITC-labeled secretome confirmed successful incorporation into the nanofiber matrix, although some heterogeneity in distribution was observed. Importantly, AFM analysis demonstrated that SNFs retained structural integrity, supporting their suitability for cell culture applications.
4.1. Cell Adhesion, Morphology, and Spreading
Immunofluorescence staining at 5 h post-seeding showed that AD-MSCs adhered effectively to both random and aligned SNFs. Cells on random fibers adopted a stellate morphology, while those on aligned fibers exhibited spindle-like shapes, with prominent actin stress fibers and vinculin-positive focal adhesions. These observations indicate robust cytoskeletal organization and suggest that nanofiber orientation influences cell morphology and adhesion dynamics [22].
Quantitative analysis of cell spreading area revealed that AD-MSCs on random SNFs exhibited significantly larger spreading areas (~500 μm²) compared to those on aligned SNFs (~320 μm²). This suggests that random fibers provide multidirectional anchoring points, while aligned fibers constrain spreading and promote elongation along the fiber axis [23].
4.2. Cell Alignment, Viability, and Proliferation
After 24 h of culture, FFT analysis of cell orientation confirmed that AD-MSCs on aligned SNFs displayed strong unidirectional alignment, with radial intensity profiles concentrated within ~60°, in contrast to the disordered patterns on random SNFs and control substrates. Morphometric analysis further showed reduced cell spreading area and increased aspect ratio on aligned fibers, indicating a more elongated morphology.
Viability assays over 72 h demonstrated that aligned SNFs supported sustained AD-MSC viability, while random SNFs showed increased apoptosis by day 3. This trend persisted through day 6, with live/dead staining revealing mature spheroid formation on random SNFs accompanied by central apoptosis - likely due to limited nutrient and oxygen diffusion within dense 3D aggregates. These findings align with prior reports on diffusion limitations in spheroid cultures [24].
Aligned SNFs significantly enhanced AD-MSC proliferation, as demonstrated by increased cell counts and shortened doubling times over a 72-hour culture period. Cell cycle analysis revealed a marked shift toward the G2/M phase in cells grown on aligned SNFs, with a fivefold increase compared to control substrates, accompanied by a notable reduction in the S phase population. These findings suggest that aligned nanofibers promote proliferative activity by facilitating exit from the G1 phase and accelerating progression through the cell cycle. This observation aligns with the results reported by Amores de Sousa et al. [25], who showed that functionalization and alignment of electrospun nanofibers enhanced neural stem cell proliferation and increased the proportion of cells in both the S and G2/M phases, indicative of accelerated mitotic entry.
4.3. In Vitro Wound Healing and Migration
In vitro scratch assays demonstrated that aligned SNFs significantly enhanced AD-MSC migration and accelerated wound closure compared to random SNFs and control substrates. These results highlight the critical role of fiber alignment in providing directional cues that promote coordinated cell movement - an essential feature for effective tissue regeneration [26,27].
5. Conclusions
Together, these findings underscore the synergistic effects of biochemical functionalization and fiber alignment in modulating stem cell behavior. The hybrid SNFs not only support cell adhesion, viability, and proliferation but also guide migration and promote wound healing. The ability to fine-tune nanofiber architecture and integrate bioactive secretome components offers a promising strategy for developing next-generation wound dressings and regenerative scaffolds. Future studies should explore in vivo performance, long-term degradation, and the potential for clinical translation.
Author Contributions
Conceptualization, G.A.; methodology G.A. and D.G..; methodology, cel culture, writing, and software analysis, T.S. and L.T.; data curation, T.S. and L.T.; writing - original draft preparation, writing G.A.; and editing, G.A. and S.T.; supervision, G.A.; resources, S.K. I.B-T.; funding acquisition, G.A., R.K.-P., S.T and D.D. All authors have read and agreed to the published version of the manuscript.
Funding
This research was funded by the European Union NextGeneration EU, through the National Recovery and Resilience Plan of the Republic of Bulgaria, project BG-RRP-2.004-0003 and further sup-ported by Medical University-Pleven, Bulgaria (internal MU-project 22/2023). The financial support of the project BG16RFPR002-1.014-0002-C001 “Center of competence in personalized medicine, 3D and telemedicine, robotic assisted and minimally invasive surgery” funded by the PRIDST 2021–2027 and co-funded by the EU, is also acknowledged.
Institutional Review Board Statement
This study was conducted according to the guidelines of the Declaration of Helsinki and approved by the Institutional Ethics Committee of Medical University - Pleven (approval 745-KENID, approval date 5 June 2023).
Data Availability Statement
The original contributions presented in this study are included in the article. Further inquiries can be directed at the corresponding author.
Acknowledgments
We acknowledge support through Leonardo da Vinci Center of Competence in Personalized Medicine, 3D and Telemedicine, Robotic and Minimally Invasive Surgery, Pleven, Bulgaria.
Conflicts of Interest
The authors declare no conflicts of interest.
Abbreviations
The following abbreviations are used in this manuscript:
| PLCL | Poly(L-lactide-co-ε-caprolactone) |
| WJ-MSCs | Wharton’s jelly-derived mesenchymal stem cells |
| AFM | Atomic Force Microscopy |
| FFT | Fast Fourier Transform |
| AD-MSCs | Adipose-Derived MSCs |
| ECM | Extracellular Matrix |
| PLA | Poly(Lactic Acid) |
| FDA | Food and Drug Administration |
| MSCs | Mesenchymal Stem Cells |
| VEGF | Vascular Endothelial Growth Factor |
| bFGF | Basic Fibroblast Growth Factor |
| EGF | Epidermal Growth Factor |
| TGF-β | Transforming Growth Factor-β |
| mRNA | Messenger RNA |
| HFIP | Hexafluoroisopropanol |
| R-NFs | Random Nanofibers |
| A-NFs | Aligned Nanofibers |
| NCM | Non-Contact Mode |
| FITC | Fluorescein Isothiocyanate |
| GPC | Gel Permeation Chromatography |
| PBS | Phosphate-Buffered Saline |
| FBS | Fetal Bovine Serum |
References
- J. S. Boateng and K. H. Matthews, “Wound healing dressings and drug delivery systems: a review,” J Pharm Sci, vol. 97, no. 8, pp. 2892–2923, Aug. 2008. [CrossRef]
- S. Guo and L. A. DiPietro, “Factors Affecting Wound Healing,” J Dent Res, vol. 89, no. 3, pp. 219–229, Feb. 2010. [CrossRef]
- D. Chouhan and B. B. Mandal, “Silk biomaterials in wound healing and skin regeneration therapeutics: From bench to bedside,” Acta Biomater, vol. 103, pp. 24–51, Feb. 2020. [CrossRef]
- K. Ye and H. Kuang, “Electrospun Nanofibers for Tissue Engineering with Drug Loading and Release,” Pharmaceutics, vol. 11, no. 4, p. 182, Apr. 2019. [CrossRef]
- J. Xue and T. Wu, “Electrospinning and Electrospun Nanofibers: Methods, Materials, and Applications,” Chem Rev, vol. 119, Mar. 2019. [CrossRef]
- M. Zhang and Z. Chang, “Synthesis of Poly(l-lactide-co-ε-caprolactone) Copolymer: Structure, Toughness, and Elasticity,” Polymers (Basel), vol. 13, no. 8, Apr. 2021. [CrossRef]
- M. Dhayer and V. Barral, “Material and biological characterization of 3D knitted bioresorbable poly (D,L-lactide) (PLA) and polycaprolactone (PCL) scaffolds for soft tissue regeneration: from fabrication to in vivo performance,” J Biol Eng, vol. 53, Jun. 2025. [CrossRef]
- M. Eryildiz and A. Karakus, “Development and Characterization of PLA/PCL Blend Filaments and 3D Printed Scaffolds,” Journal of Materials Engineering and Performance , vol. 34, no. 14, Jul. 2025. [CrossRef]
- C. for D. and R. H. U.S. Food and Drug Administration, “Polycaprolactone (PCL) Safety Profile,” 2021.
- M. Wang and T. Dai, “BMP-2 loaded Bioactive PLLA/PCL Blended nanofibers for synergistic influences on osteogenic differentiation of rat bone marrow-derived mesenchymal stem cells via TGF-β/Smad2/3 signaling pathway,” J Drug Deliv Sci Technol, vol. 105, Mar. 2025. [CrossRef]
- R. Margiana and A. Markov, “Clinical application of mesenchymal stem cell in regenerative medicine: a narrative review,” Stem Cell Res Ther, vol. 13, no. 1, Jul. 2022. [CrossRef]
- B. Zhang and X. Tian, “Mesenchymal Stem Cell-Derived Extracellular Vesicles in Tissue Regeneration,” Cell Transplant, Mar. 2020. [CrossRef]
- J. W. Prado-Yupanqui and L. Ramírez-Orrego, “The Hidden Power of the Secretome: Therapeutic Potential on Wound Healing and Cell-Free Regenerative Medicine-A Systematic Review,” Int J Mol Sci, vol. 26, no. 5, Feb. 2025. [CrossRef]
- E. Novoseletskaya and O. Grigorieva, “Mesenchymal Stromal Cell-Produced Components of Extracellular Matrix Potentiate Multipotent Stem Cell Response to Differentiation Stimuli,” Front Cell Dev Biol, vol. 8, Sep. 2020. [CrossRef]
- A. Krasnodembskaya and Y. Song, “Antibacterial Effect of Human Mesenchymal Stem Cells Is Mediated in Part from Secretion of the Antimicrobial Peptide LL-37,” Stem Cells, vol. 12, Dec. 2010. [CrossRef]
- F. Alcayaga-Miranda and J. Cuenca, “Antimicrobial Activity of Mesenchymal Stem Cells: Current Status and New Perspectives of Antimicrobial Peptide-Based Therapies,” Front Immunol, Mar. 2017. [CrossRef]
- T. Stoyanova and L. Topalova, “Selective Paracrine Modulation of Stromal Cells: Wharton’s Jelly MSC Secretome Enhances Adipose-Derived MSC Functionality While Maintaining Dermal Fibroblast Quiescence,” Int J Mol Sci, vol. 26, no. 20, Oct. 2025. [CrossRef]
- D. R. Stirling and M. J. Swain-Bowden, “CellProfiler 4: improvements in speed, utility and usability,” BMC Bioinformatics, vol. 22, Sep. 2021. [CrossRef]
- A. Suarez-Arnedo and F. T. Figueroa, “An image J plugin for the high throughput image analysis of in vitro scratch wound healing assays,” PLoS One, vol. 15, no. 7, Jul. 2020. [CrossRef]
- D. Gugutkov and J. Gustavsson, “Electrospun fibrinogen–PLA nanofibres for vascular tissue engineering,” J Tissue Eng Regen Med, vol. 25, May 2016. [CrossRef]
- S. Wang and S. Zhong, “Effects of fiber alignment on stem cells–fibrous scaffold interactions,” J Mater Chem B, no. 16, Mar. 2015. [CrossRef]
- C. A. Bashur and L. A. Dahlgren, “Effect of fiber diameter and orientation on fibroblast morphology and proliferation on electrospun poly(D,L-lactic-co-glycolic acid) meshes,” Biomaterials, vol. 27, no. 33, Nov. 2006. no. 33). [CrossRef]
- C.-Y. Huang and K.-H. Hu, “Comparison of cell behavior on pva/ pva-gelatin electrospun nanofibers with random and aligned configuration,” Sci Rep, Dec. 2016.
- N.-E. Ryu and S.-H. Lee, “Spheroid Culture System Methods and Applications for Mesenchymal Stem Cells,” Cells, vol. 8, no. 12, Dec. 2019. [CrossRef]
- M. C. Amores de Sousa and C. A. V Rodrigues, “Functionalization of Electrospun Nanofibers and Fiber Alignment Enhance Neural Stem Cell Proliferation and Neuronal Differentiation,” Front Bioeng Biotechnol, Oct. 2020. [CrossRef]
- F. Yang and R. Murugan, “Electrospinning of nano/micro scale poly(L-lactic acid) aligned fibers and their potential in neural tissue engineering,” Biomaterials, vol. 15, May 2005. [CrossRef]
- D. Gugutkov and C. Gonzalez-Garcia, “Fibrinogen organization at the cell-material interface directs endothelial cell behavior,” J Bioact Compat Polym, vol. 26, no. 4, Jul. 2011. [CrossRef]
Figure 1.
Schematic illustration of the electrospinning setup and formation of hybrid secretome PLCL nanofibers. The electrospinning mixture is composed from Wharton’s jelly secretome and PLCL polymer then the secretome nanofibers (SNFs) were synthesized in two conformations – random (R-SNFs) and aligned (A-SNFs).
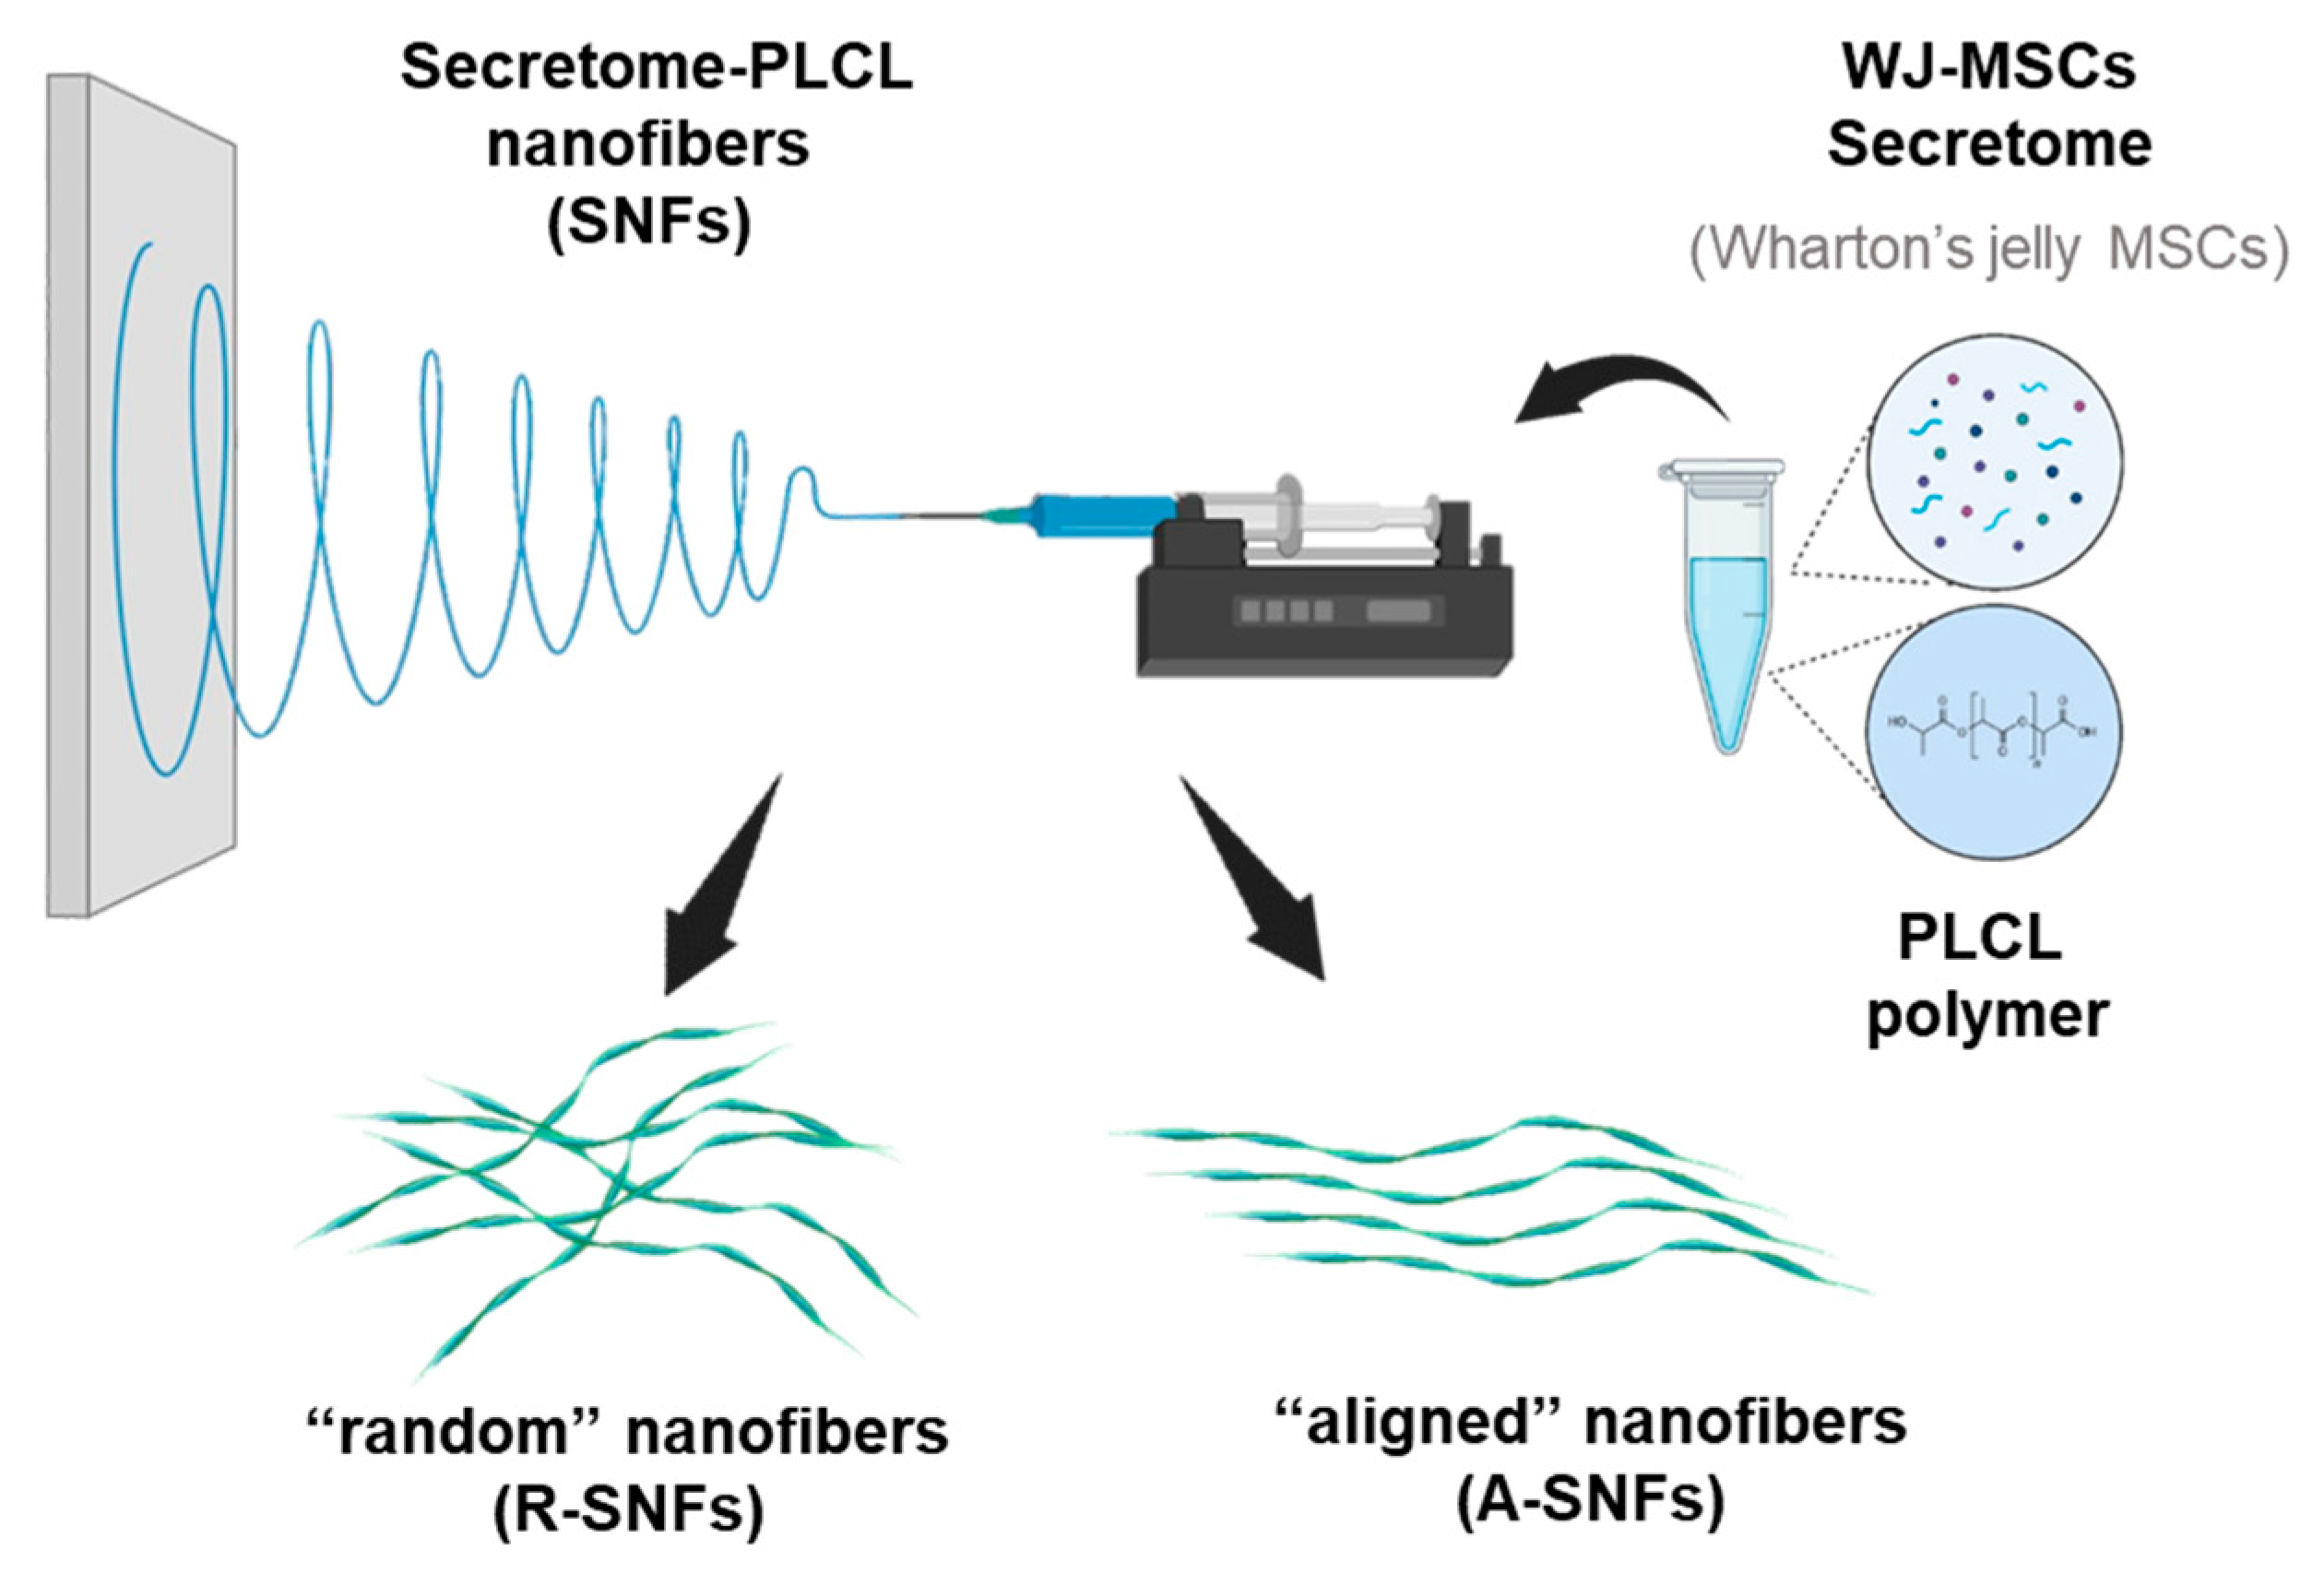
Figure 2.
Overall morphology and Fast Fourier Transform (FFT) analysis of nanofiber alignment. Phase contrast images (A-B) of control random R-CNFs (A) and aligned A-CNFs (B) orientations, versus hybrid random R-SNFs (G) and aligned A-SNFs (H) configurations respectively. Corresponding FFT images for the control nanofibers (CNFs) with random R-CNFs (C) and aligned A-CNFs (D) configurations versus hybrid NFs with random R-SNFs (I) and aligned A-SNFs (J). The bottom row presents radial intensity profiles showing the degree of alignment for R-CNFs (E) and A-CNFs (F) versus hybrid SNFs in random R-SNFs (K) and aligned A-SNFs (L) configurations. Scale bar on A-H: 20 µm.
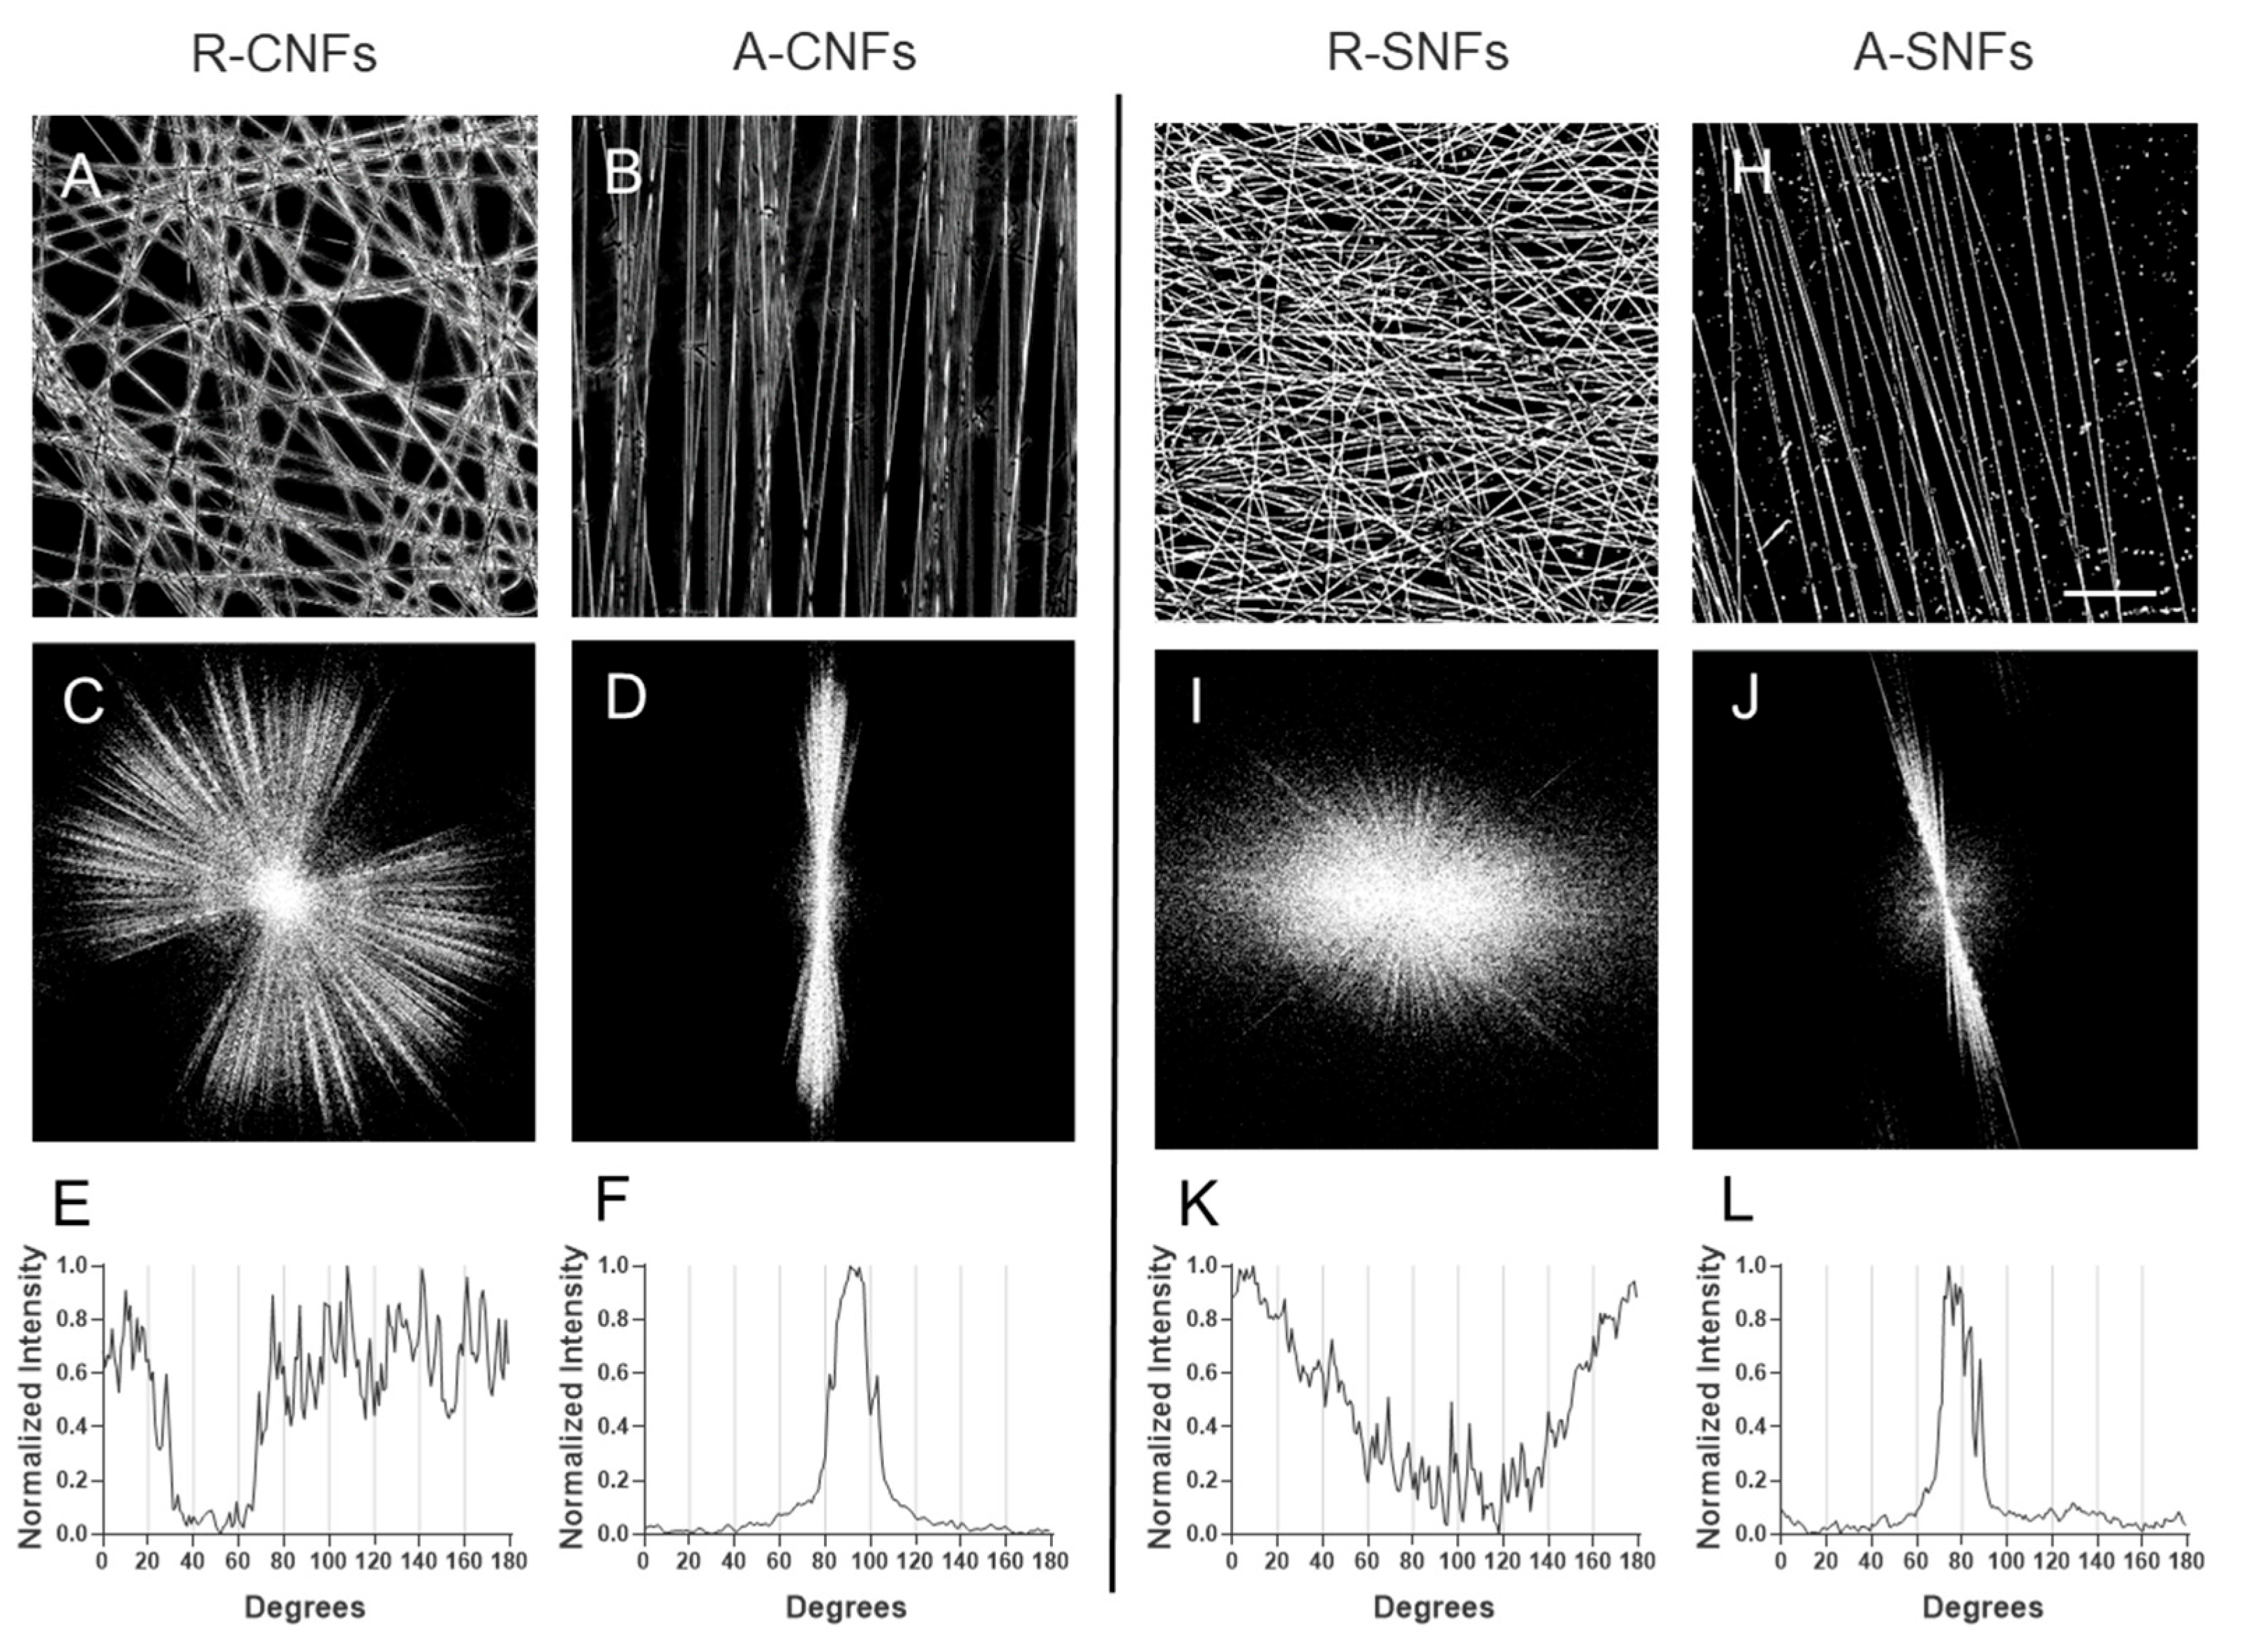
Figure 3.
Distribution and release profile of FITC-labeled secretome from hybrid nanofibers (NFs). Fluorescence microscopy images of randomly oriented (A) and aligned (B) nanofibers incorporating FITC-labeled secretome illustrate biomolecule distribution. Panel (C) shows the quantitative release profile of FITC fluorescence, expressed in Relative Fluorescence Units (RFU), from control PLCL nanofibers (CNFs), secretome-loaded nanofibers without FITC labeling (SNFs), and FITC-labeled secretome-loaded nanofibers (S(FITC)NFs) in the supernatant (PBS) over time (days). Data are presented as mean ± standard deviation (SD) (n = 4). Statistical significance was assessed using repeated measures ANOVA, followed by Tukey’s multiple comparisons test with *** indicating p ≤ 0.01. Scale bars in A and B: 20 μm.
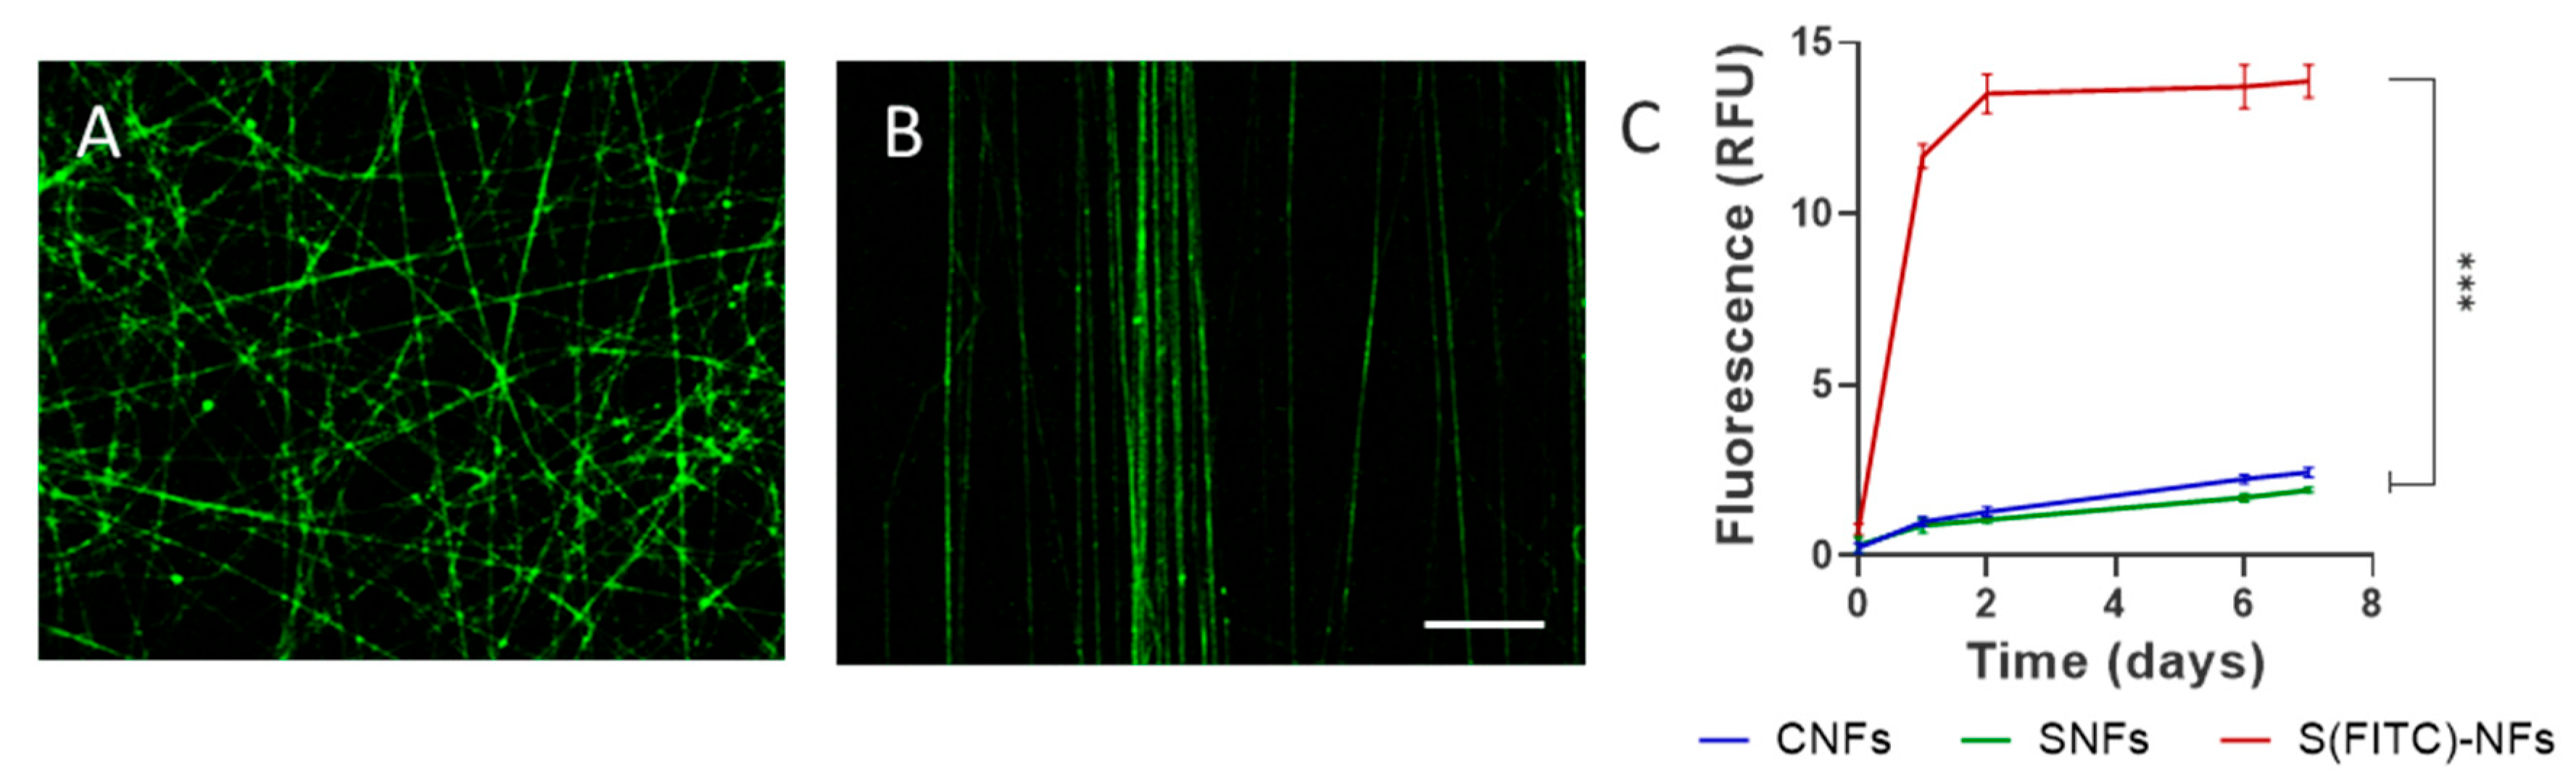
Figure 4.
Atomic force microscopy (AFM) characterization of nanofibers. (A) Representative AFM images of control nanofibers (CNFs; panels a-c) and secretome-functionalized nanofibers (SNFs; panels d–f). Panels (a, d) show topographical scans (50 µm × 50 µm); (b, e) display 10× cross-sectional profiles; (c, f) present 40× cross-sectional profiles. (B) Quantitative AFM-based measurements of fiber diameter for CNFs (a) and SNFs (b), with further details provided in panel (C (b)) and Table 1. (C a) Young’s modulus values obtained from AFM analysis. Data are expressed as mean ± SD (n = 5). Statistical significance was assessed using unpaired T-test and is indicated as p ≤ 0.01 (**) and p ≤ 0.001 (***).
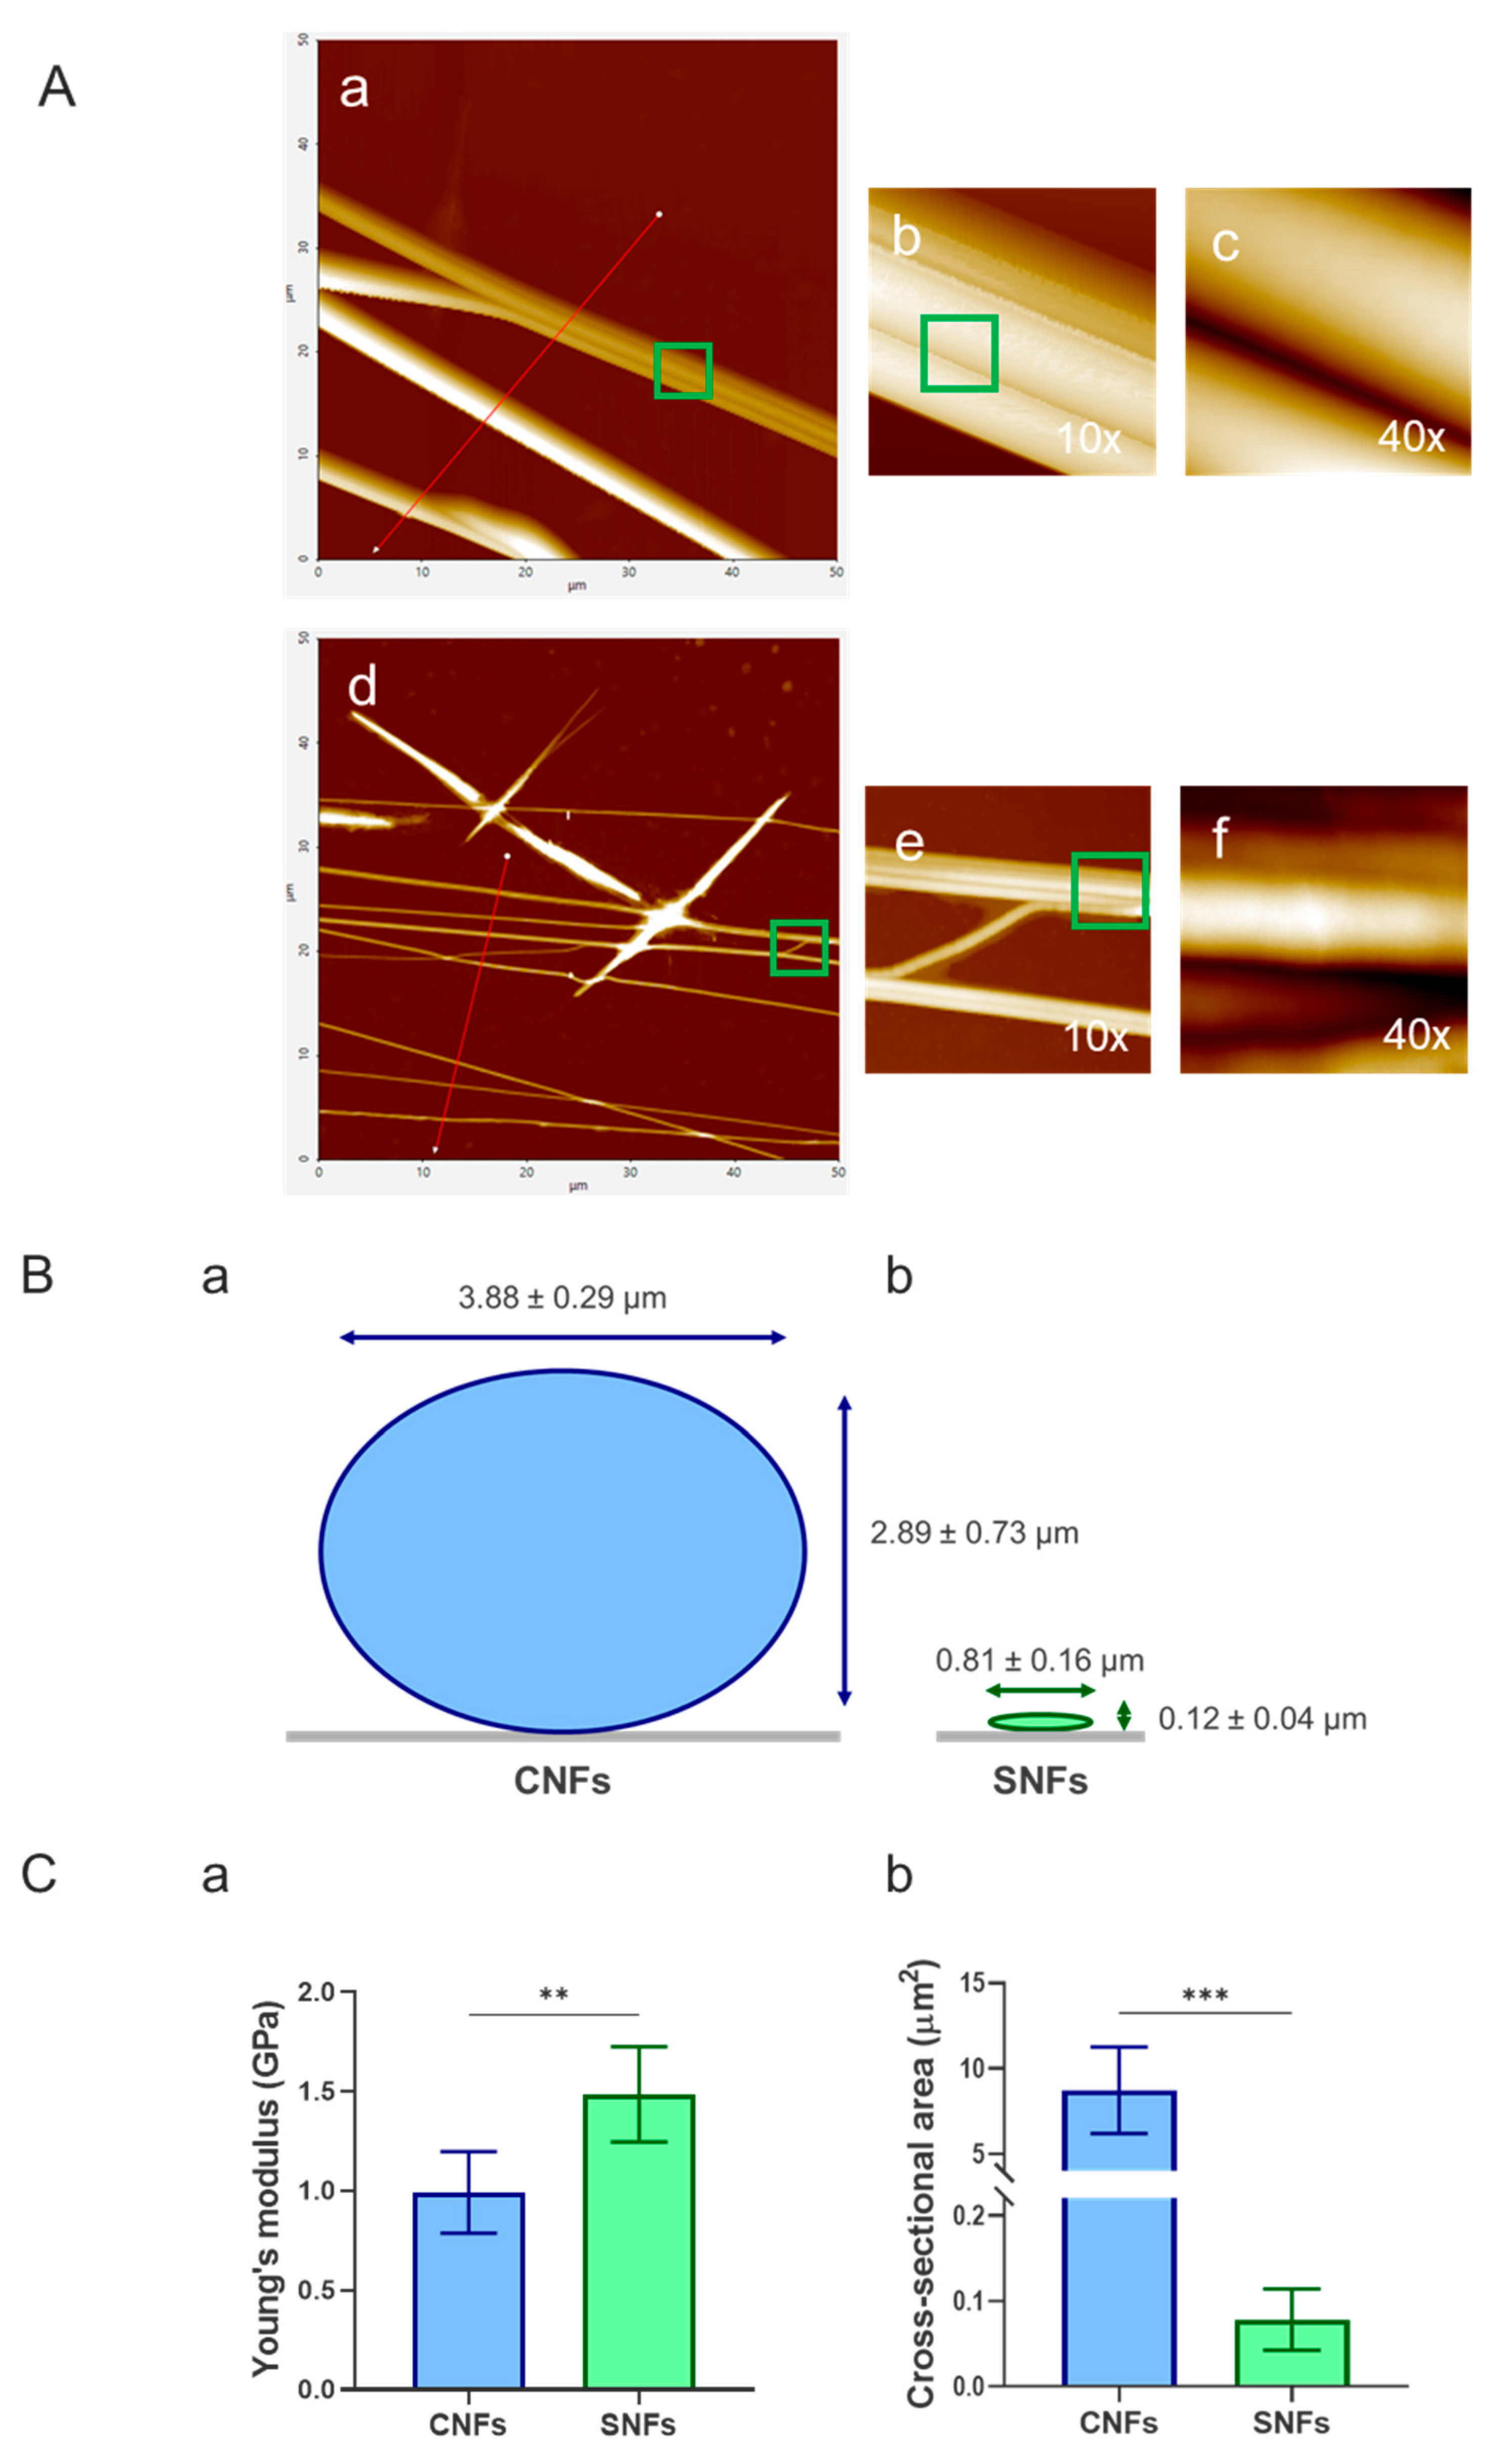
Figure 5.
Immunostaining of vinculin clusters and actin filaments in MSCs cultivated for 5h on (A, B) – random and (C, D) - aligned secretome nanofibers (SNFs). Panels A and C show contrast-enhanced images highlighting the actin cytoskeleton (green), while panels B and D display the same fields with the additional visualization of vinculin (red). Nuclei are shown in blue in all images. Scale bar: 20 µm.
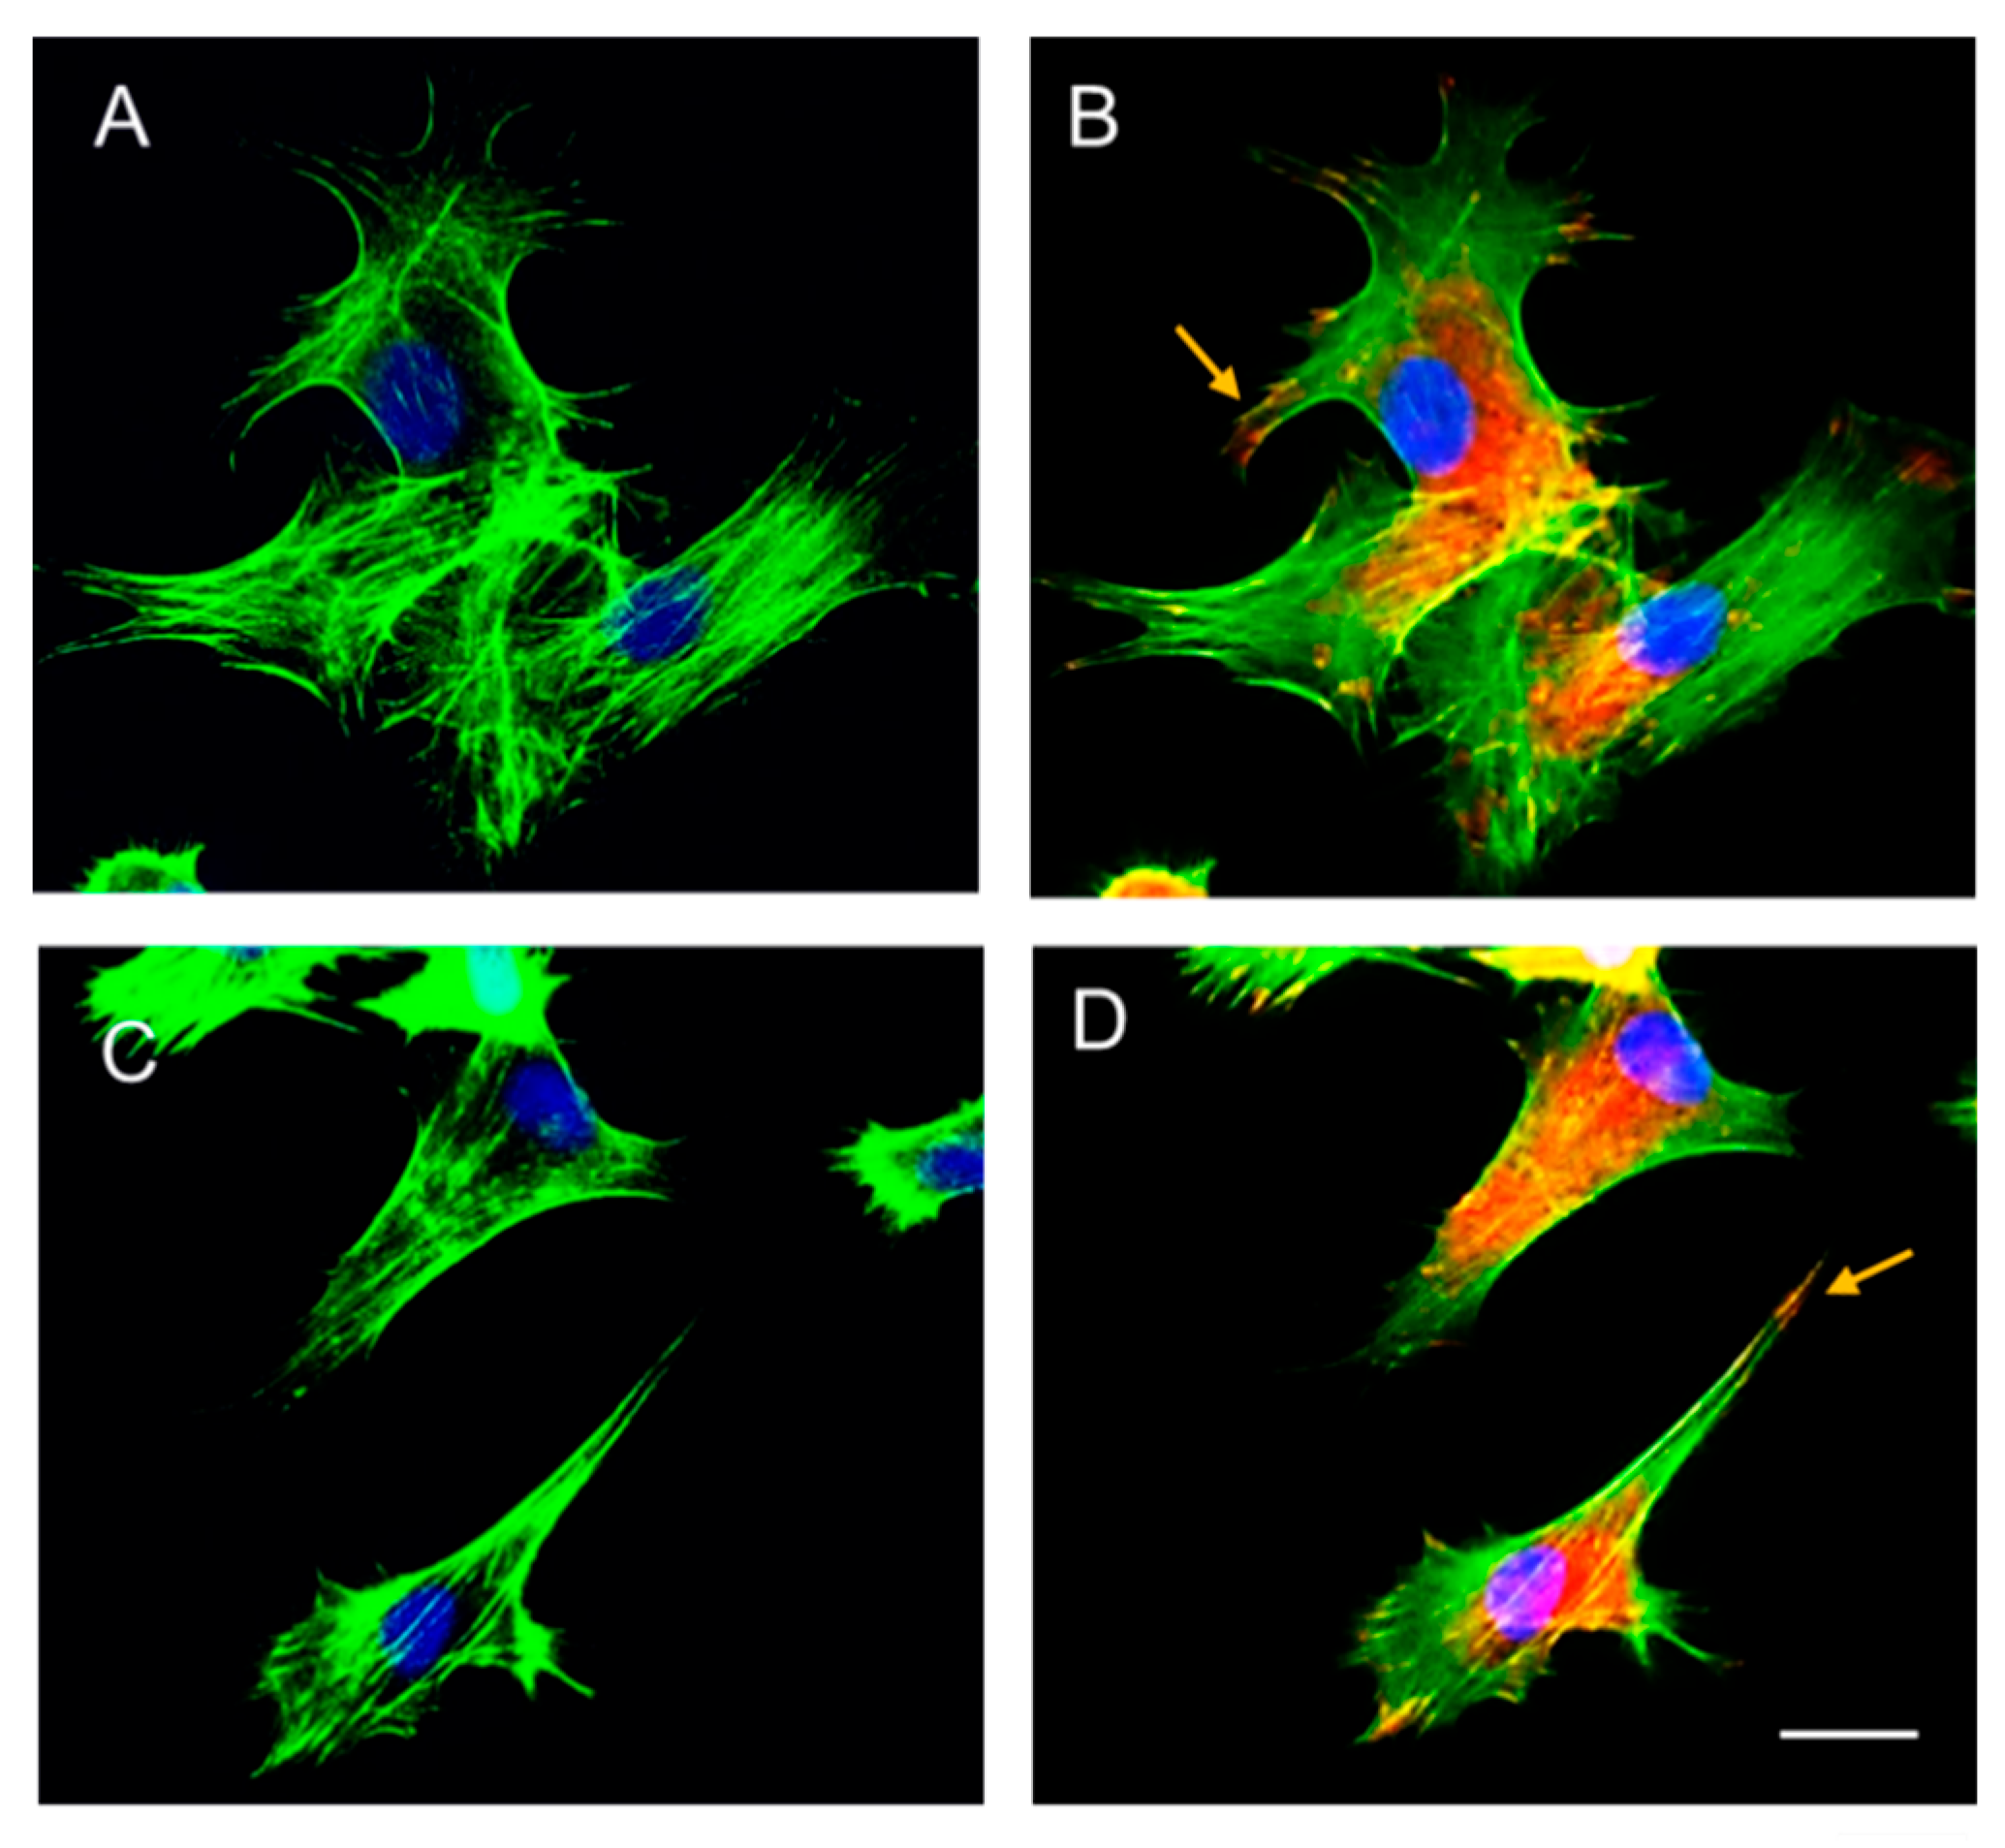
Figure 6.
Quantitative morphometric analysis of the mean cell spreading area (Area in μm2) calculated from the perimeter of AD-MSCs cultured for 5 h on S-NFs. The data are presented as mean ± SD (n = 40). Statistical significance was assessed using Kolmogorov-Smirnov test. Asterix de-notes statistical significance of p ≤ 0.05 (*). Scale bar: 20 μm.
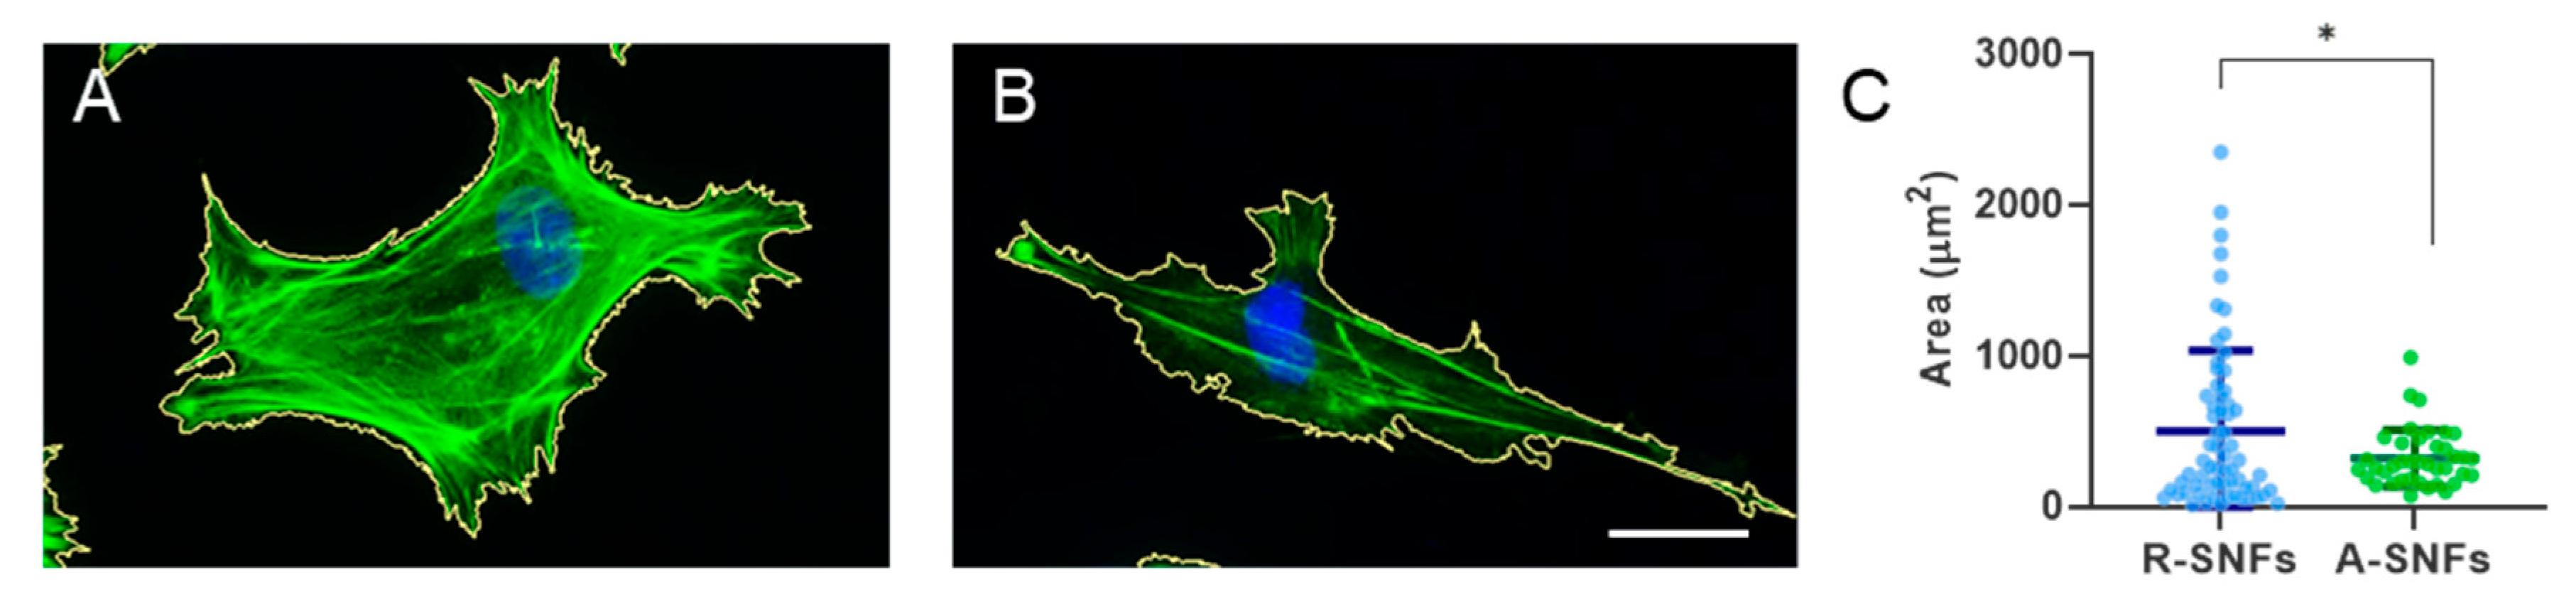
Figure 7.
Aligned nanofibers maintain AD-MSC viability during extended culture. (A) Representative fluorescence micrographs of AD-MSCs cultured on plain glass (control), random secretome nanofibers (R-SNFs), and aligned ones (A-SNFs) for 72 h. Live cells are stained with Calcein AM (green) and dead cells with propidium iodide (red). (B) Quantitative analysis of cell viability (%) at 24, 48, and 72 h. Data are presented as mean ± SEM (n = 4). Statistical analysis was performed using two-way ANOVA, followed by Tukey’s multiple comparisons test. Asterisks de notes statistical significance of p ≤ 0.001 (***). Scale bar on panel A = 50 µm.
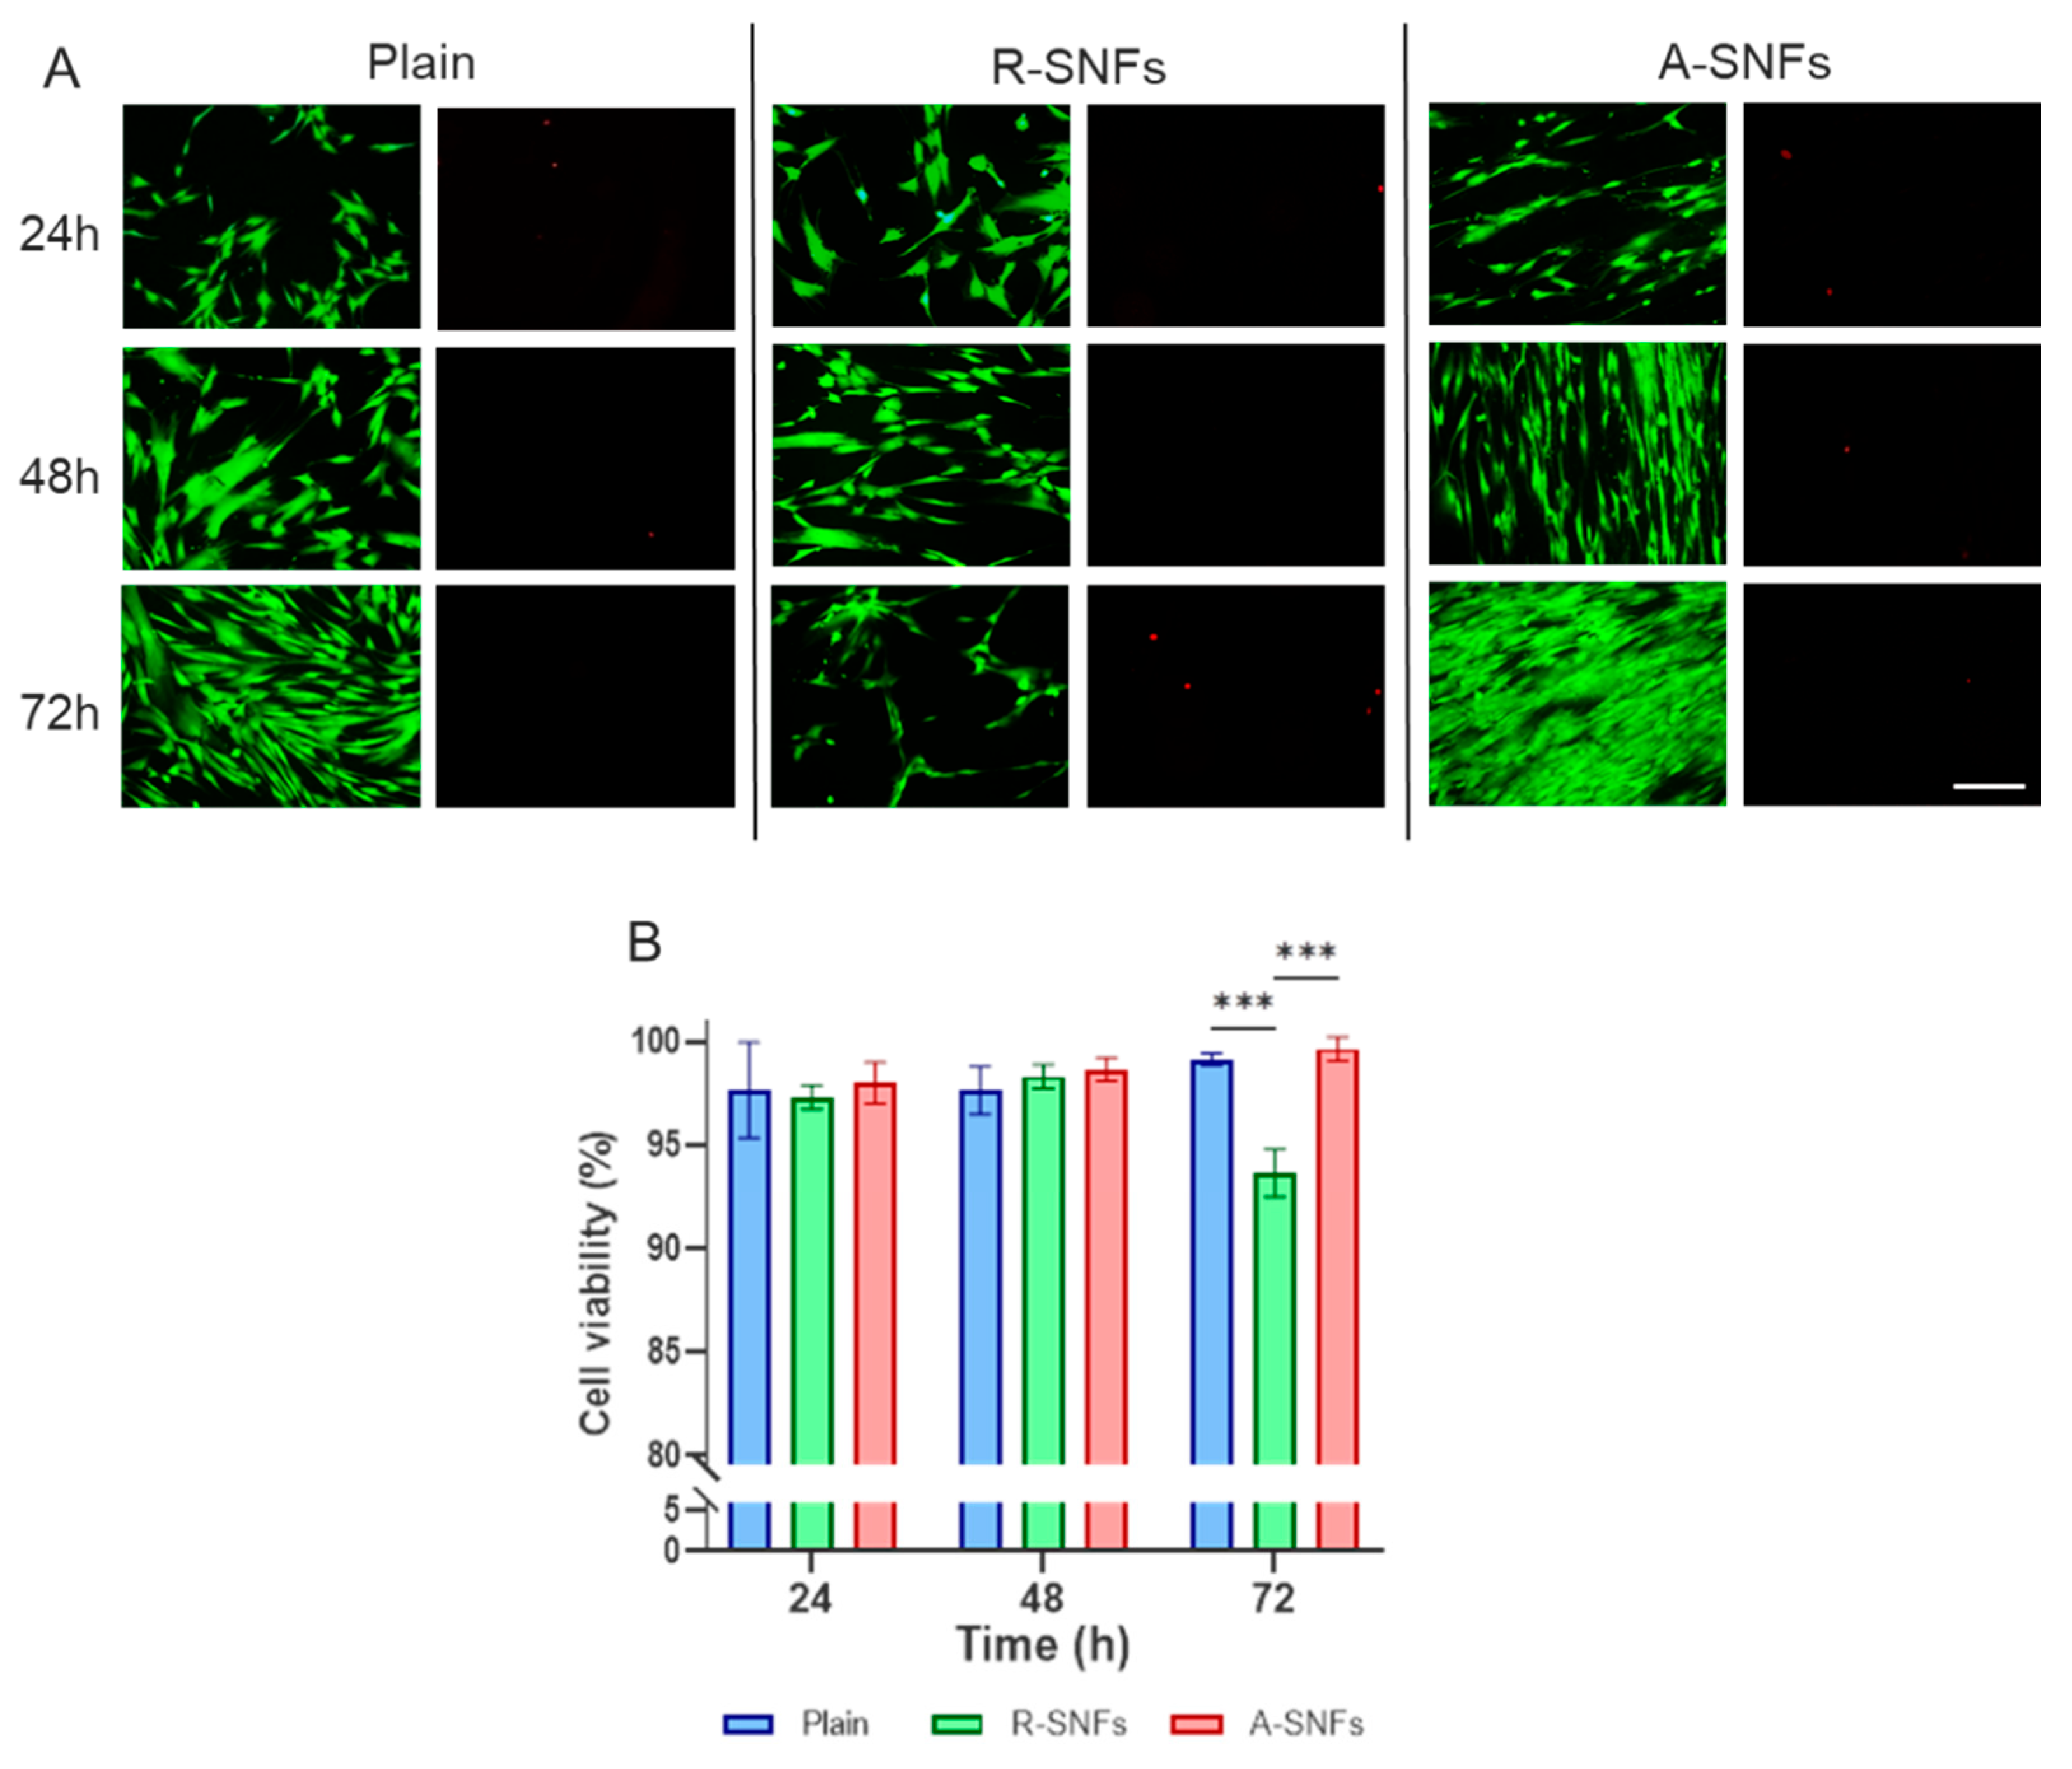
Figure 8.
Aligned nanofibers guide directional orientation and promote elongated morphology in AD-MSCs at 24 h of incubation. (A) Fast Fourier Transform (FFT) analysis of AD-MSC orientation. Representative high-contrast fluorescent images of calcein-stained cells and corresponding analyses are shown for control glass substrates (a–c), randomly oriented secretome nanofibers (R-SNFs; d–f), and aligned secretome nanofibers (A-SNFs; g–i). Panels a, d, and g display cell morphology; panels b, e, and h show the corresponding FFT images; and panels c, f, and i present radial intensity profiles. (B) Quantification of cell spreading area (CSA) at 24 h of culture. (C) Quantification of cell aspect ratio (AR) for the same cell populations. Data are presented as mean ± SD (n = 300). Statistical significance was assessed using Kruskal-Wallis test and Dunn’s multiple comparisons test. Asterisks de notes statistical significance of p ≤ 0.001 (***). Scale bar for panels A a, d, and g is 50 μm.
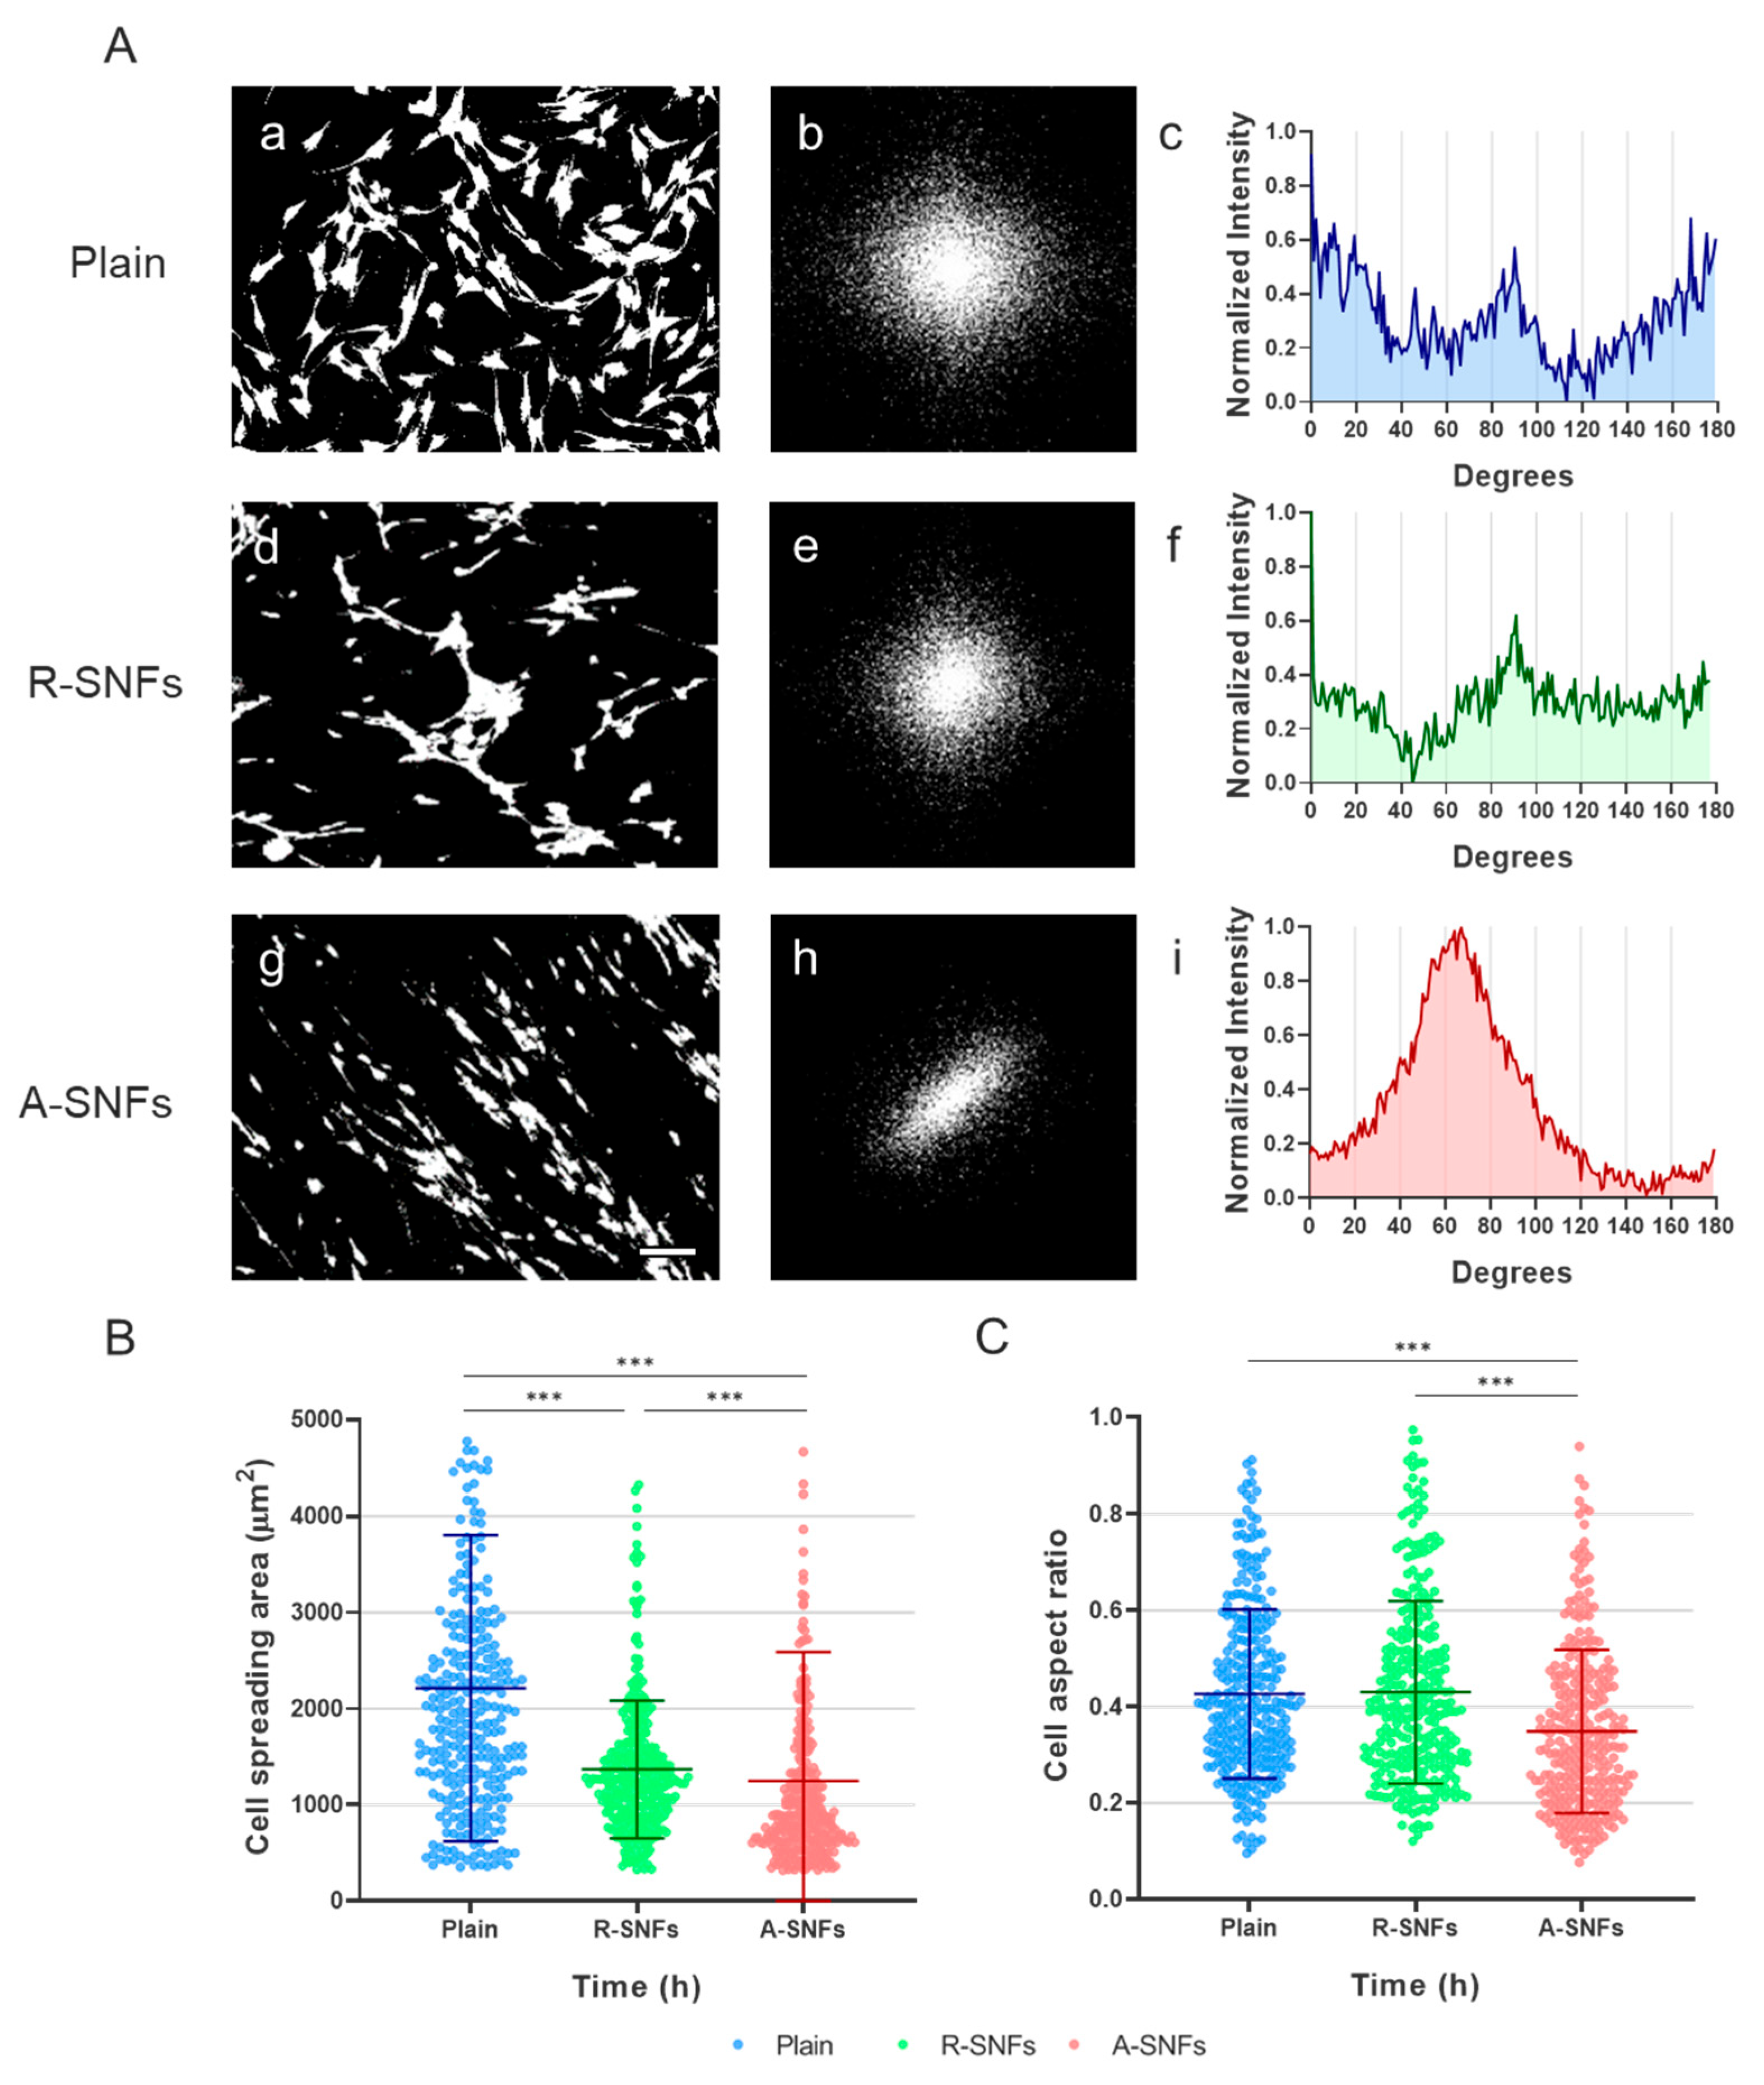
Figure 9.
Aligned nanofibers promote stem cell proliferation compared to random nanofibers configurations (A) Proliferation dynamics of AD-MSCs on control plain glass and the secretome PLCL nanofibers (SNFs) over 24, 48, and 72 h, presented as the number of cells per field. (B) Cell doubling time over the 72-hour culture period. Data are presented as mean ± SD (n = 4). Statistical significance was assessed using one-way ANOVA, followed by Tukey’s multiple comparisons test. Asterisks de notes statistical significance of p ≤ 0.05 (*), p ≤ 0.01 (**) and p ≤ 0.001 (***). For graph (A) it was the analysis was performed at the final time point (72h).
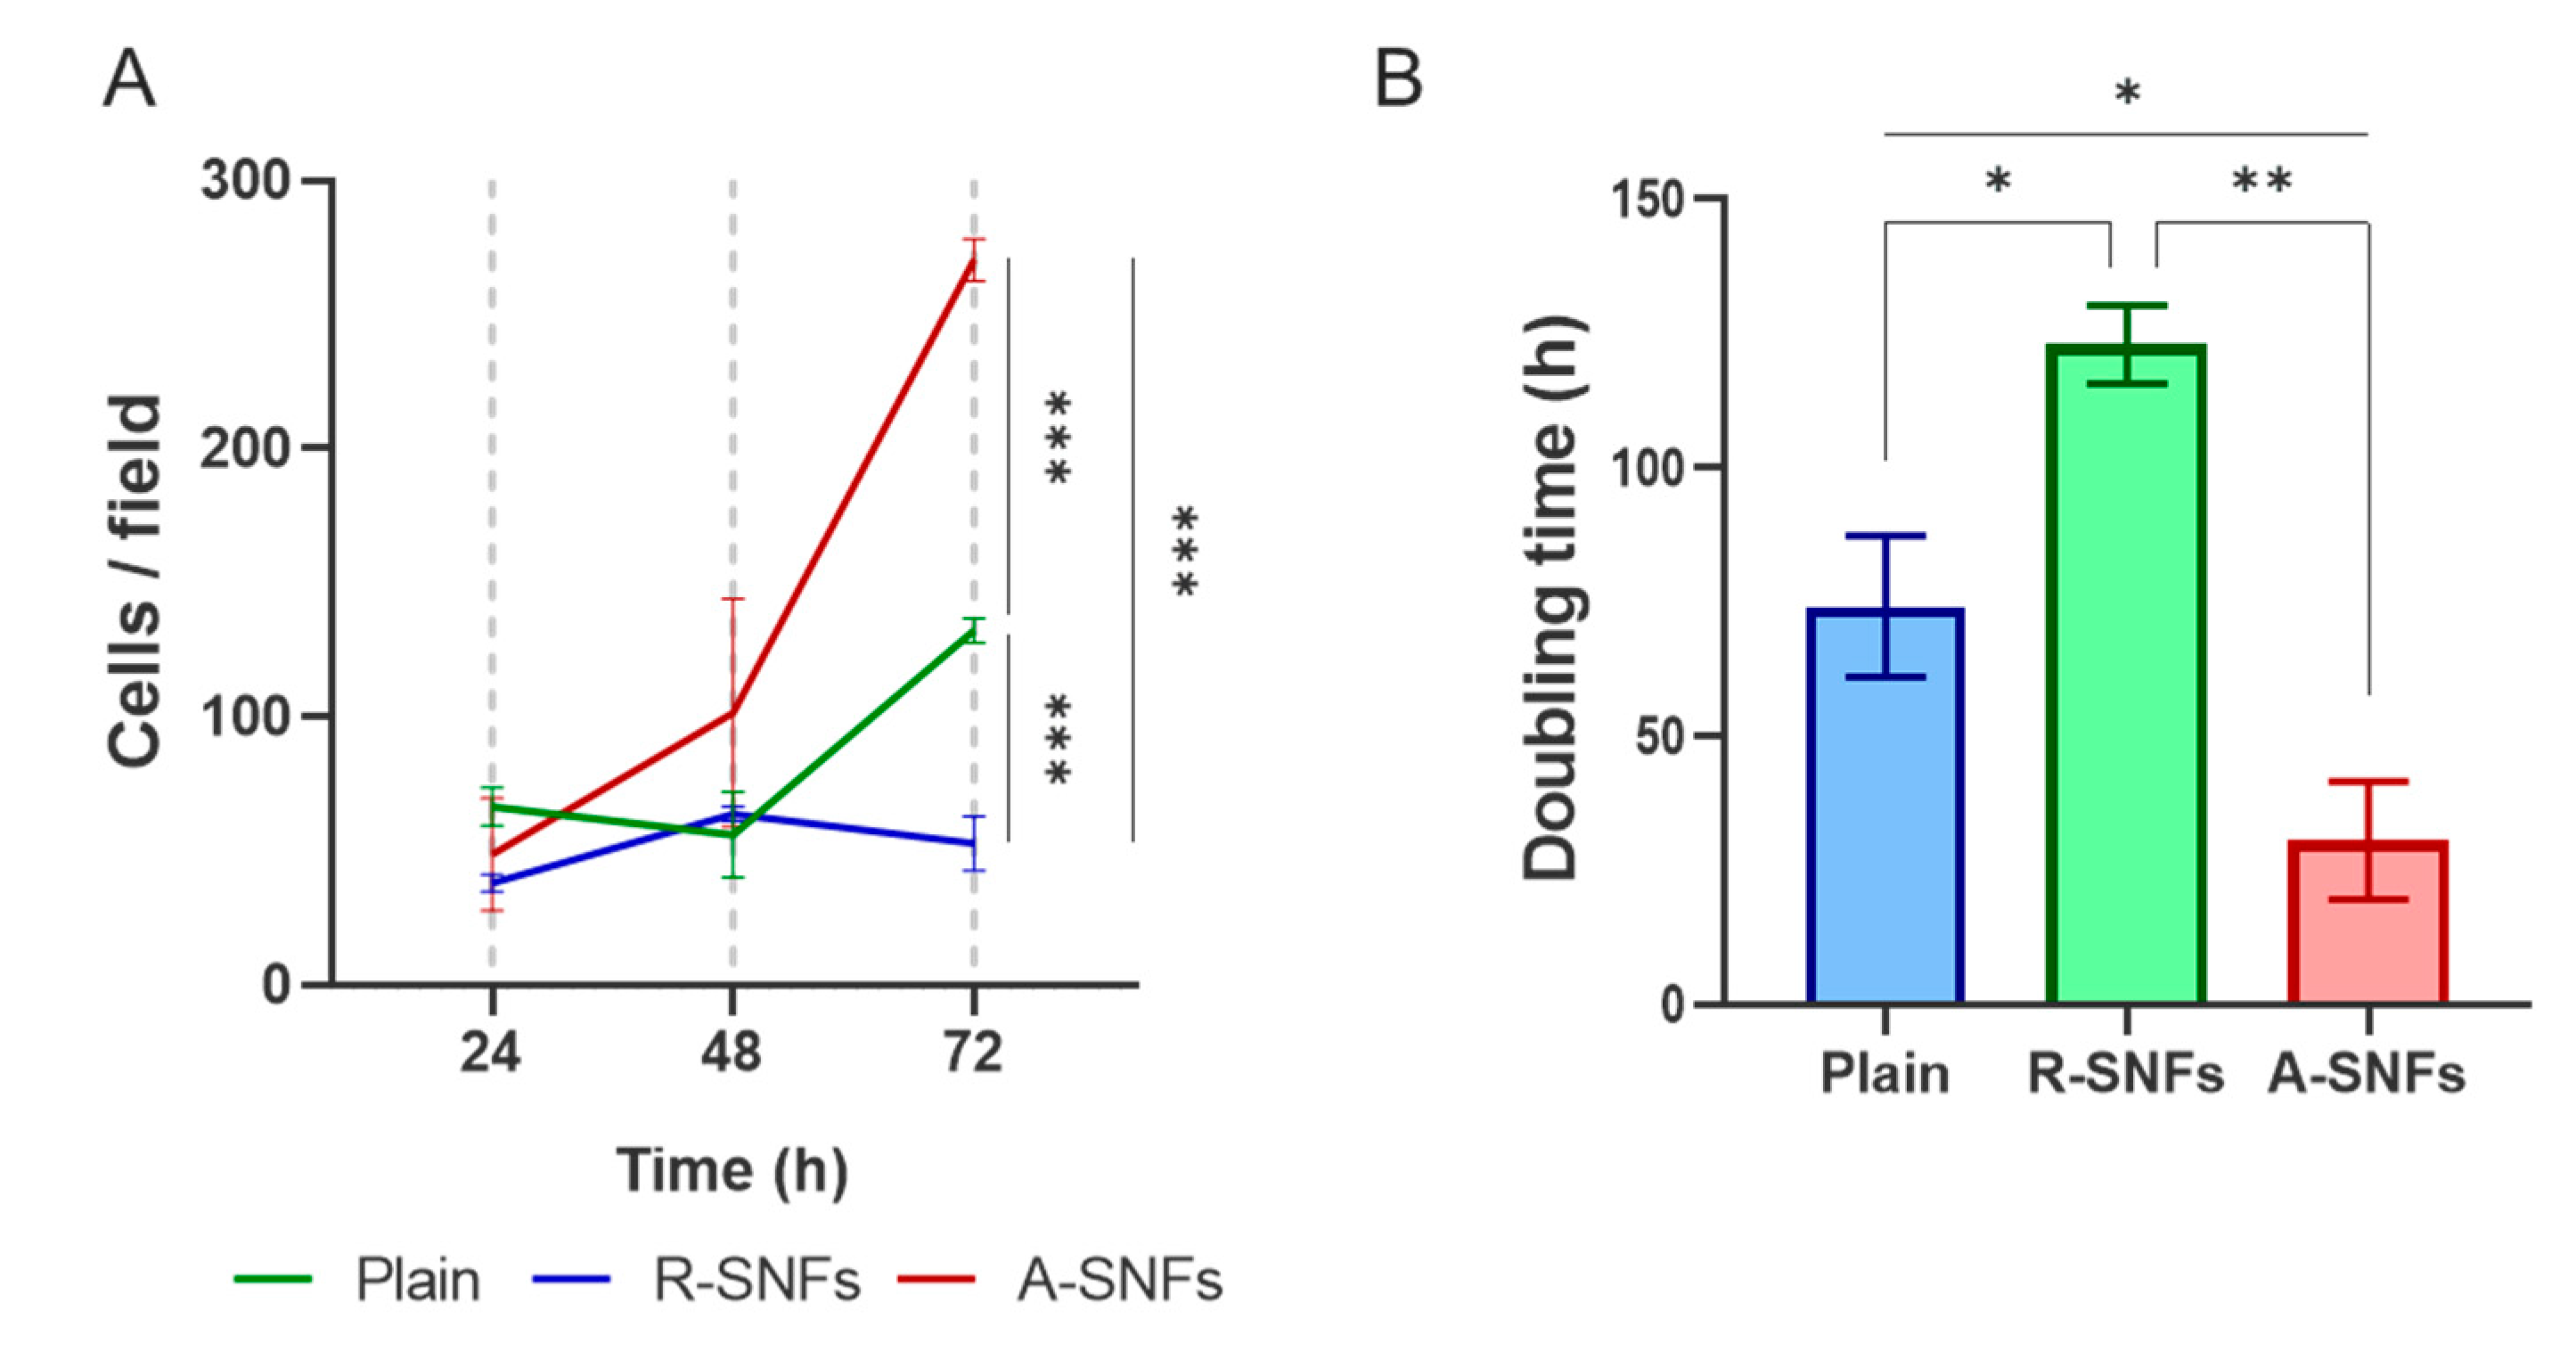
Figure 10.
Aligned SNFs modulate cell cycle phase distribution of AD-MSCs after 48 h of culture. (A–C) Representative histograms illustrating cell cycle profiles of AD-MSCs cultured for 48 h on (A) plain glass substrate, (B) randomly oriented secretome-functionalized PLCL nanofibers (R-SNFs), and (C) aligned nanofibers (A-SNFs). Data are shown as event count versus fluorescence intensity. (D) Quantitative summary of the percentage of cells in G1, S, and G2/M phases under each condition.
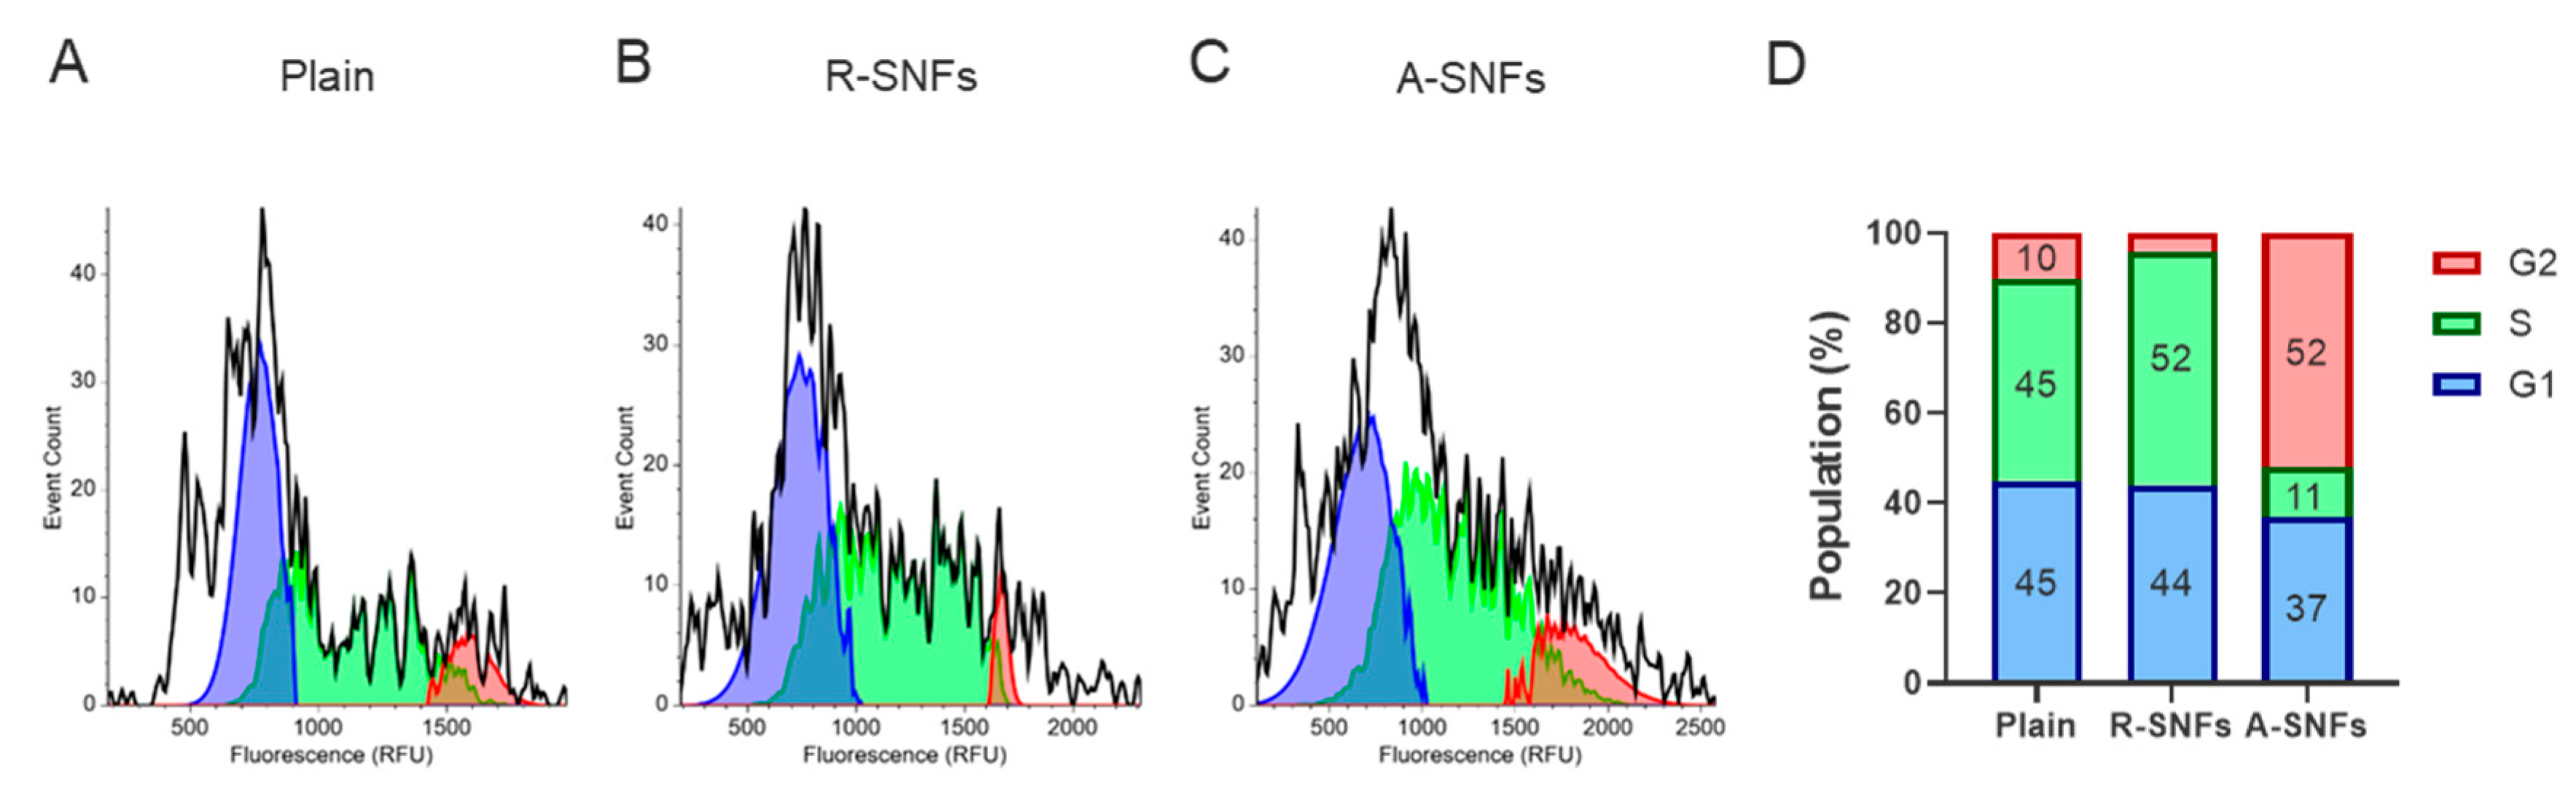
Figure 11.
Random nanofibers induce spheroid formation. (A) Phase contrast (a-c) and fluorescence (d-f) images of spheroids formed after 6 days cultivation of AD-MSCs on SNFs. (B) Live-dead assay of the spheroids (a-c) at day 6. Scale bars = 100 μm.
Figure 11.
Random nanofibers induce spheroid formation. (A) Phase contrast (a-c) and fluorescence (d-f) images of spheroids formed after 6 days cultivation of AD-MSCs on SNFs. (B) Live-dead assay of the spheroids (a-c) at day 6. Scale bars = 100 μm.
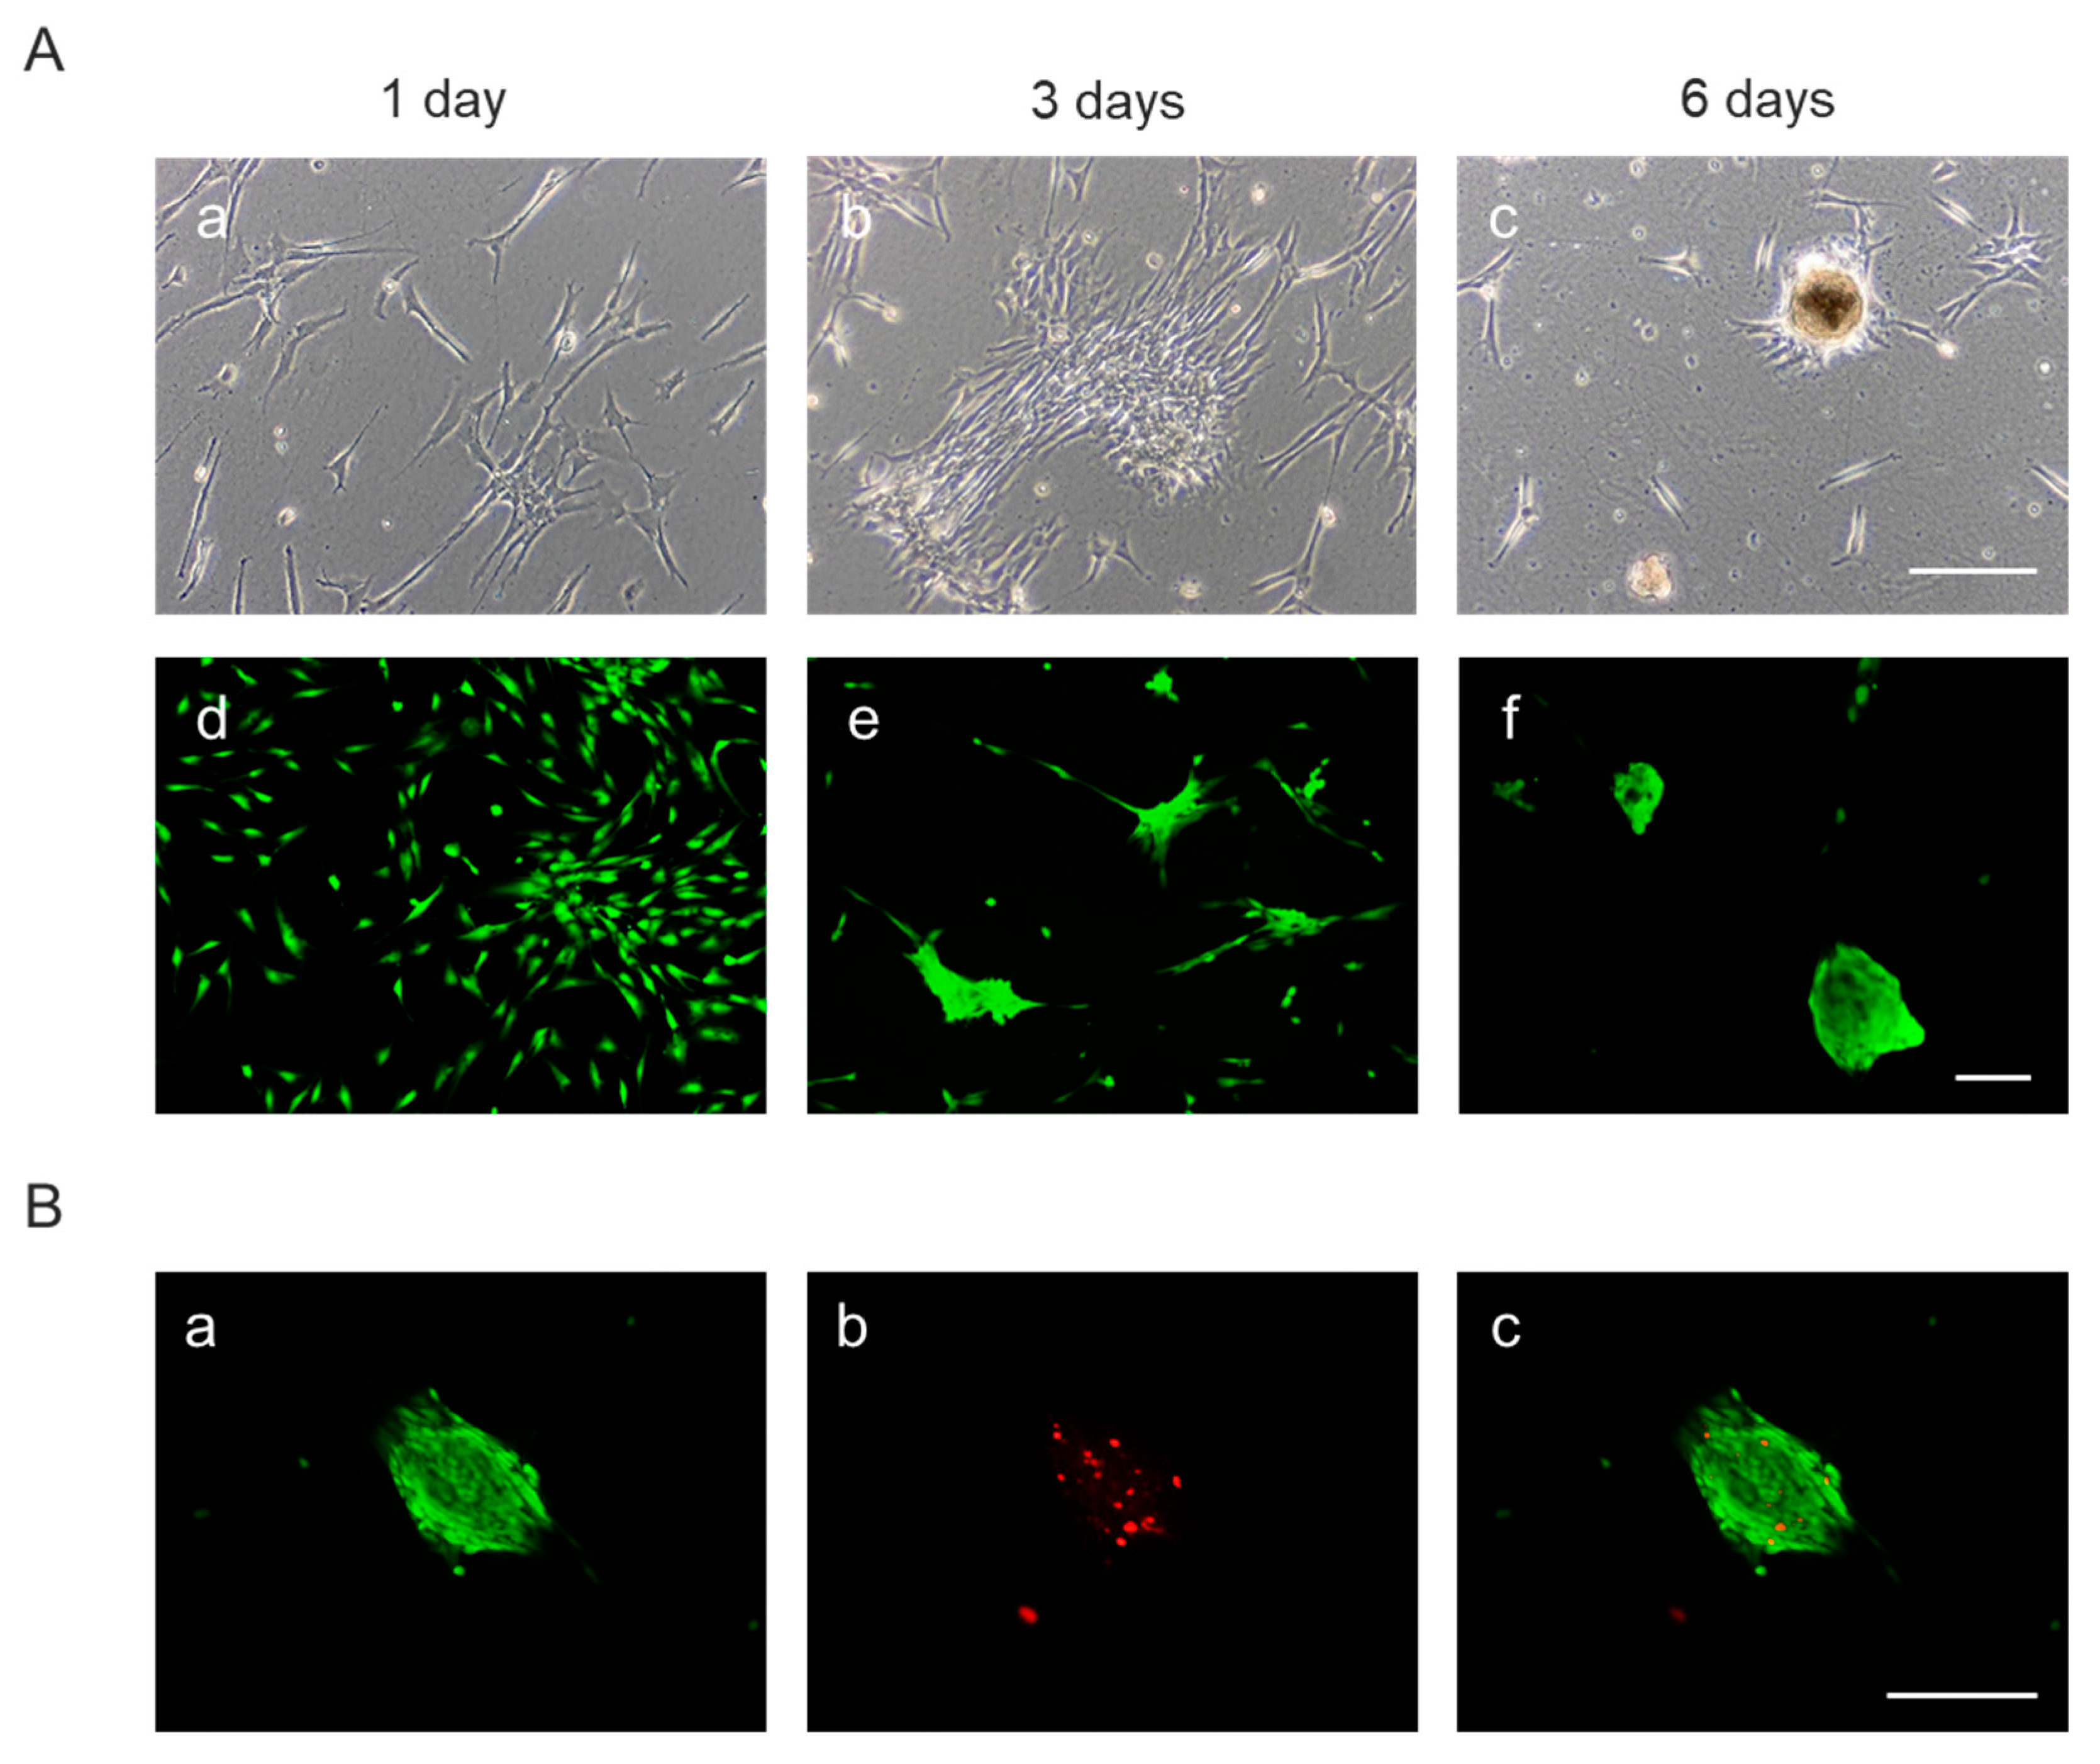
Figure 12.
Aligned secretome PLCL nanofibers promote AD-MSC migration, while random fibers inhibit it. (A) Phase-contrast images of of AD-MSCs at 0 h (left) and 24 h (right). The initial wound area is marked by a orange line, which also delineates the closed region at the endpoint. (B) Graph showing the percentage of wound closure after 24 h. (C) Quantitative analysis of the migration speed over time. Data are color-coded: control with no nanofibers (blue), cell monolayers with random SNFs (green), and with aligned SNFs (red). Statistical significance was assessed using one-way ANOVA, followed by Tukey’s multiple com-parisons test. Asterisks de notes statistical significance of p < 0.05 (**), and p < 0.001 (***). Scale bar: 100 µm.
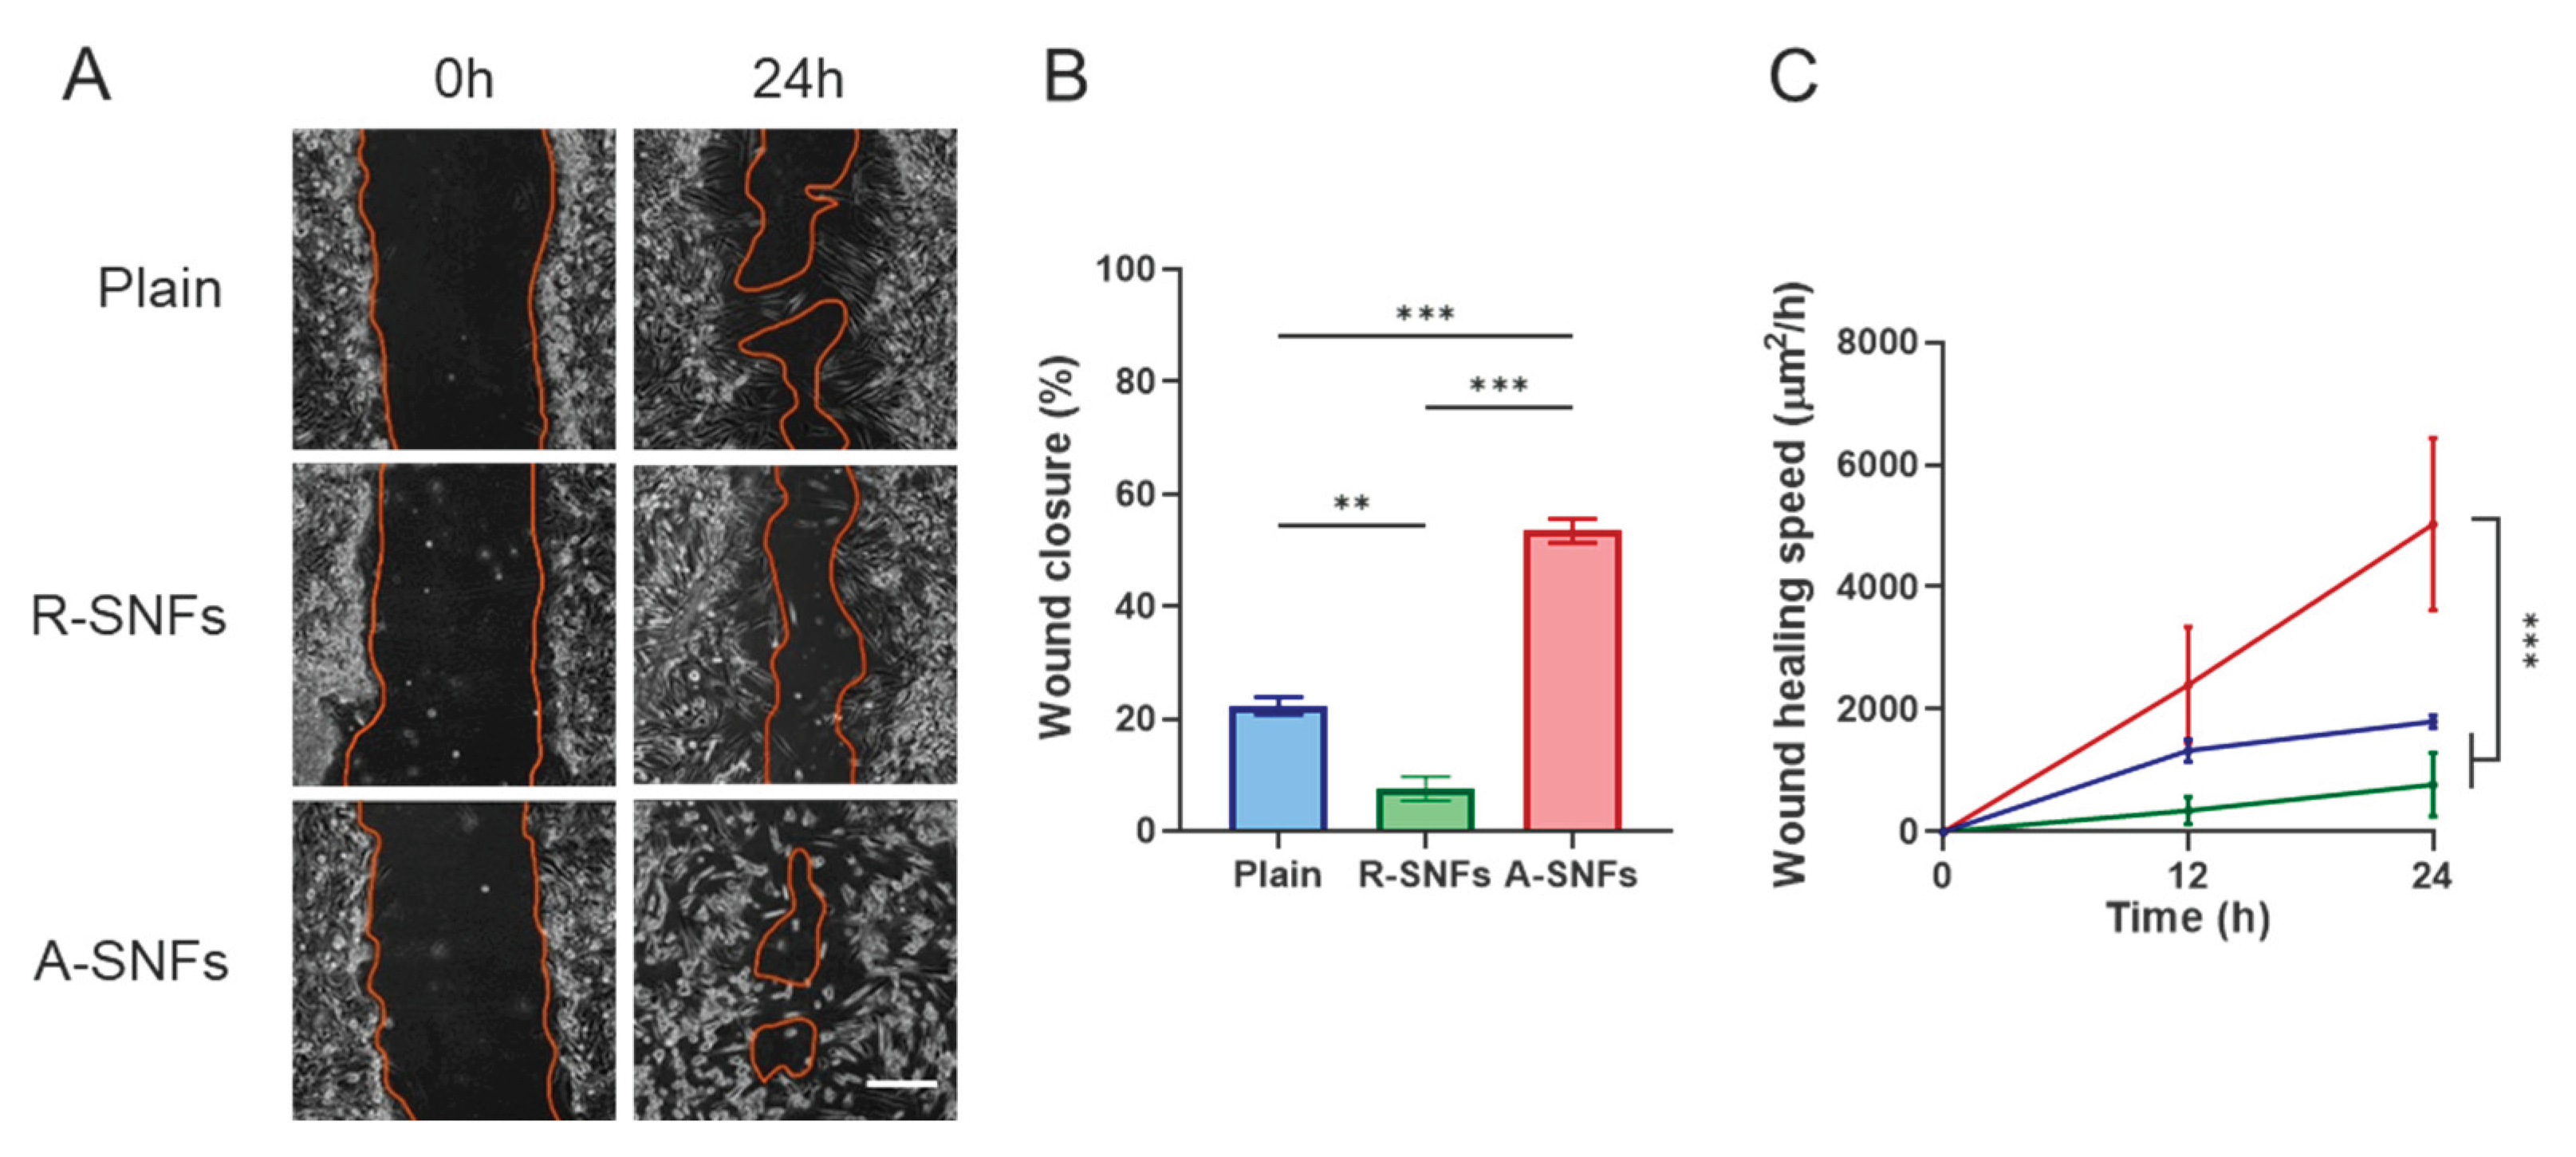

Table 1.
Summary the quantitates of (a) Young’s modulus and (b) cross-sectional area, derived from AFM images, presented as mean ± SD.
Table 1.
Summary the quantitates of (a) Young’s modulus and (b) cross-sectional area, derived from AFM images, presented as mean ± SD.
| Young’s modulus (GPa) | Size Hight (µm) | Size Width (µm) | Aspect ratio | |
|---|---|---|---|---|
| CNFs | 0.99 ± 0.18 | 2.89 ± 0.73 | 3.88 ± 0.29 | 0.75 ± 0.21 |
| SNFs | 1.49 ± 0.22 | 0.12 ± 0.04 | 0.81 ± 0.16 | 0.15 ± 0.06 |
Disclaimer/Publisher’s Note: The statements, opinions and data contained in all publications are solely those of the individual author(s) and contributor(s) and not of MDPI and/or the editor(s). MDPI and/or the editor(s) disclaim responsibility for any injury to people or property resulting from any ideas, methods, instructions or products referred to in the content. |
© 2025 by the authors. Licensee MDPI, Basel, Switzerland. This article is an open access article distributed under the terms and conditions of the Creative Commons Attribution (CC BY) license (http://creativecommons.org/licenses/by/4.0/).
Copyright: This open access article is published under a Creative Commons CC BY 4.0 license, which permit the free download, distribution, and reuse, provided that the author and preprint are cited in any reuse.


