Submitted:
11 December 2025
Posted:
12 December 2025
You are already at the latest version
Abstract
To improve the accuracy of cable temperature anomaly prediction and ensure power supply reliability, this paper proposes a multi-scale spatiotemporal model called MSST-Net, addressing the multi-scale temporal characteristics and spatial correlations of cable temperature data. Based on the monthly periodicity of cable temperature data, we preprocessed monitoring data from the KN1 and KN2 sections of Guangzhou's underground utility tunnel from 2023 to 2024: using the Isolation Forest algorithm to remove outliers, applying Min-Max normalization to eliminate dimensional differences, and selecting five key features including current load, voltage, and ambient temperature using Spearman's correlation coefficient. Subsequently, we designed a multi-scale dilated causal convolutional module (DC-CNN) to capture local features, combined with a spatiotemporal dual-path Transformer to model long-range dependencies, and introduced relative position encoding to enhance temporal perception. The Sparrow Search Algorithm (SSA) was employed for global optimization of hyperparameters. Compared with five other mainstream algorithms, MSST-Net demonstrated higher accuracy in cable temperature prediction, achieving a coefficient of determination (R²), mean absolute error (MAE), and root mean square error (RMSE) of 0.942, 0.442°C, and 0.596°C, respectively. Compared to the basic Transformer model, the root mean square error of cable temperature was reduced by 0.425°C. This model exhibits high accuracy in time series prediction and provides a reference for accurate short- and medium-term temperature forecasting of cables in underground utility tunnels.
Keywords:
underground utility tunnels
; temperature prediction
; spatio-temporal transformer
; multi-scale convolution
1. Introduction
With the advancement of new power system construction, cable lines, as the core carriers of urban grid energy transmission, directly affect power supply reliability through their operating status. Statistical data shows that approximately 67% of grid faults can be attributed to long-term cable overheating, as abnormal temperatures accelerate insulation medium aging and increase the risk of thermal breakdown [1,2]. Therefore, accurate perception and prediction of cable temperature hold significant engineering value for ensuring transmission safety.
Traditional cable temperature monitoring methods mainly rely on fixed threshold alarms and single-point temperature measurement technology, which have limitations in practical applications: fixed thresholds are difficult to adapt to dynamic temperature changes in complex environments, easily leading to false alarms or missed detections [3,4]; single-point temperature measurement cannot reflect the overall temperature distribution of the cable, making it difficult to effectively identify local overheating risks. To address these issues, researchers have proposed various technical solutions. In terms of sensing technology, Szultka, S et al. applied distributed optical fiber sensing technology to achieve continuous monitoring of cable temperature fields and node-based measurement using fiber gratings, providing a foundation for obtaining full-domain temperature distribution [5]; Zhao, Y proposed an intelligent cable optical fiber temperature measurement system based on the digital twin concept, which effectively suppresses errors introduced by dispersion and attenuation through interpolation compensation and dual-end loop demodulation technology, achieving ±1°C temperature measurement accuracy and providing high-precision sheath temperature data for cable temperature inversion [6].
The development of artificial intelligence technology has brought significant progress to cable temperature monitoring and prediction. In early research, addressing the issue of high false alarm rates in traditional cable tunnel accident monitoring due to reliance on single-parameter thresholds, Ji C et al. proposed an accident prediction model based on fuzzy theory and grid search-optimized support vector regression (FT-GS-SVR), which improved prediction accuracy through data standardization and global parameter optimization [7]. In cable temperature prediction, researchers have explored various hybrid model architectures. Duell, J et al. designed a DC-CNN-PE-SSA-Informer hybrid model that combines dilated causal convolutional networks (DC-CNN) to capture local temporal features, uses an Informer module with improved positional encoding to extract long-term dependencies, and employs sparrow search algorithm (SSA) for parameter optimization; finite element simulations verified its superior prediction accuracy over traditional models [8]. Szczegielniak, T et al. used an improved whale optimization algorithm (IWOA) to optimize convolutional neural network (CNN) hyperparameters, constructing a cable group conductor temperature prediction model that showed significant improvements in MAE and RMSE metrics after training on multi-physics coupling data [9]. Additionally, long short-term memory networks (LSTM) have become important tools for temperature prediction due to their gating mechanisms' advantages in capturing dynamic nonlinear temporal features. Bassan, F.R et al. combined the grey wolf optimizer (GWO) with LSTM to build a GWO-LSTM model, achieving high-accuracy prediction of transient temperatures in directly buried cables [10]; Navarrete-Rajadel, P et al. proposed an LSTM anomaly prediction algorithm based on particle swarm optimization support vector machine (PSO-SVM), enhancing the reliability of temperature anomaly judgment through integrated multi-dataset training [11].
In the integration of physical modeling and digital twin technology, Huang, J et al. proposed a digital twin modeling method for the temperature field of distribution network cables based on a reduced-order model [12]. They utilized singular value decomposition (SVD) and response surface interpolation to construct a steady-state temperature field reduced-order model, reducing single reconstruction and prediction times to 8.1 seconds and 3.6 seconds respectively, significantly improving computational efficiency; Dou, X. et al. combined the finite element method with backpropagation (BP) neural networks, using sample data generated by finite element models to train neural networks, achieving indirect prediction of cable core temperature [13]. For special application scenarios, Cavus, M et al. constructed a transient thermal circuit model for three-core cables, inversely calculating nuclear power plant cable core temperatures based on the Levenberg-Marquardt algorithm, solving the difficulty of direct core temperature measurement in high-voltage environments [14]; Wu, M et al. focused on cable terminals as weak points, proposing a thermal defect warning method based on temperature rise trend analysis, providing a new approach for local thermal fault monitoring [15].
Cable temperature variation is influenced by the nonlinear coupling of multiple factors such as load fluctuations and environmental temperature and humidity, exhibiting multi-scale temporal characteristics and spatial correlations. To address this, this paper proposes a multi-scale spatio-temporal attention network model called MSST-Net, which integrates multi-scale convolutional modules with spatio-temporal attention mechanisms to enhance the capture capability of multi-granularity features of cable temperature; introduces the Sparrow Search Algorithm (SSA) to achieve automated hyperparameter configuration, improving model efficiency and robustness; and optimizes sequence position awareness using relative position encoding techniques to enhance model prediction accuracy.
2. Materials and Methods
2.1. Experimental Data
This study focuses on the KN1 and KN2 sections in the central-northern area of Guangzhou's utility tunnel (Figure 1). The total length of this comprehensive utility tunnel is 1.619 kilometers, including a dedicated power channel section (0.547 km) and a parallel dual-transmission section (1.072 km). It covers 13 monitoring areas in the planned core functional zone and is crucial for ensuring regional power supply.
Figure 2 shows the temperature data collected over the past two years from January 1, 2023, to December 31, 2024, with a sampling interval of 60 minutes, and each data point represents the daily average temperature. From Figure 2, it can be observed that the temperature data exhibits distinct periodic characteristics, showing repetitive patterns over time, primarily driven by seasonal factors, making it suitable for time series forecasting.
2.2. Data Preprocessing
Raw sensor data is susceptible to environmental interference or equipment fluctuations, often resulting in outliers and missing values. To address this, preprocessing is required, with the workflow shown in Figure 3.
First, use the Isolation Forest algorithm to remove outliers. This method isolates data points by constructing multiple random trees, automatically detecting anomalies, reducing manual intervention, and ensuring data reliability.
To address the dimensional differences among multi-source monitoring parameters such as temperature, current, and voltage, Min-Max normalization is performed to unify all parameters within the [0,1] interval, thereby eliminating model weight imbalance caused by numerical magnitude differences and enhancing prediction stability. Based on 74,160 sets of normalized data, a 3:1 ratio is used to divide them into a training set (55,620 sets) and a test set (18,540 sets), which are used for model training and generalization capability validation respectively.
To optimize input features, analyze the correlation between cable status and environmental factors. Cable temperature changes are not only affected by its own current and voltage but also related to parameters such as ambient temperature, humidity, oxygen concentration, and vibration amplitude in the utility tunnel. The Spearman correlation coefficient is used to evaluate the monotonic relationship between cable temperature and environmental factors. The Spearman correlation coefficient ranges from [−1,1], and the closer its absolute value is to 1, the stronger the monotonic correlation between variables. The relationship between the absolute value of the correlation coefficient and the degree of correlation is shown in Table 1.
The Spearman correlation coefficients between cable temperature and current load, voltage, ambient temperature, ambient humidity, vibration amplitude, zone position, row number, and wire number were calculated, with the results shown in Figure 4. Current load exhibited a very strong correlation with cable temperature, voltage, ambient temperature, and ambient humidity showed strong correlations, vibration amplitude showed a moderate correlation, while zone position, row number, and wire number showed weak correlations. Therefore, five factors—current load, voltage, ambient temperature, ambient humidity, and vibration amplitude—were selected as the final model inputs to reduce noise interference and improve prediction efficiency.
2.3. MSST-Net Model Construction
This paper proposes the MSST-Net model to address key challenges in cable temperature prediction. The model is specifically designed for the three-dimensional characteristics of power cable monitoring data, with historical input sequences including current load, voltage, ambient temperature, ambient humidity, and vibration amplitude. Among these, sudden fluctuations in current load (such as short-circuit events) can cause second-level temperature spikes, while diurnal variations in ambient temperature exhibit hourly-level gradual trends. Additionally, the thermal conduction network formed by physical connections between multiple measurement points increases spatial dependency.
To address the three major challenges in cable temperature prediction—insufficient capture of local features, difficulty in modeling long-range dependencies, and high cost of hyperparameter tuning—this paper proposes a multi-scale spatiotemporal model called MSST-Net. It employs a multi-scale convolutional module to fuse local features with different receptive fields, compensating for the limitations of traditional Transformers in capturing local patterns. A dual-path spatiotemporal attention mechanism is designed to simultaneously model the temporal evolution patterns of temperature sequences and their spatial correlation characteristics. Relative position encoding is introduced to enhance the model's sensitivity to temporal positions, overcoming the generalization bottleneck of absolute position encoding. The Sparrow Search Algorithm is integrated to achieve automatic hyperparameter optimization, reducing tuning costs and improving model generalization. The model architecture is illustrated in Figure 5.
2.3.1. Multi-Scale Convolution Module
The dynamic evolution of cable temperature is influenced by the coupling of multi-scale physical processes: short-circuit faults or sudden load increases can trigger instantaneous mutations at the second scale, periodic line switching operations cause temperature fluctuations at the minute scale, while environmental factors form trends at the hour scale. Traditional single-scale convolutional models struggle to capture such cross-temporal features. This paper proposes a parallel dilated causal convolutional DC-CNN, as shown in Figure 6, which models through three differentiated branches: the 1×3 convolutional kernel focuses on instantaneous temperature rises caused by minute-scale current mutations, the 1×5 convolutional kernel captures gradual temperature changes resulting from hour-scale load fluctuations, and the 1×7 convolutional kernel perceives long-term trends from daily periodic environmental temperature variations. Each convolutional branch is followed by a ReLU activation function to enhance the model's fitting capability for nonlinear temperature evolution patterns. Features extracted from different scales are concatenated and fused, then passed through a batch normalization layer to eliminate distribution differences in sensor data, ultimately outputting unified multi-scale features.
To meet real-time prediction requirements, the convolution operation is constrained by a masking matrix to access only historical data, ensuring that the cable temperature prediction value yₜ at time t depends solely on historical detection data from the input sequence [t−k, t], as shown in Equation (1).
where d is the dilation rate; represents the input at step id before time t; is a lower triangular mask matrix, and =0 when id > t; ⊙ is the Hadamard product.
2.3.2. Spatio-Temporal Transformer
To effectively model the spatial heat conduction relationships between measurement points and the long-term temporal dependencies among variables, this paper proposes a spatiotemporal decoupled Transformer architecture, which first independently models temporal dynamics, then decouples spatial correlations, avoiding the parameter redundancy and overfitting risks associated with traditional spatiotemporal joint attention mechanisms.
As shown in Figure 7, the temporal attention branch calculates dependencies among time steps within columns to capture the temporal evolution characteristics of cable temperature, as shown in Equation (2). The spatial attention branch calculates the correlations among multiple monitoring points, as shown in Equation (3). A relative position encoding matrix is introduced in the spatiotemporal attention layer to enhance the model's perception of temporal positions. The obtained dual-branch spatiotemporal features Ht and Hs are output after weighted fusion, as shown in Equation (4). This design achieves precise thermal dynamic modeling through a physically-guided dual-path architecture.
where ,d is the dimension, k is the number of attention heads, used for normalization to prevent gradient disappearance; is the relative position encoding matrix.
Considering that sudden load current changes may cause spikes in cable temperature, using Mean Squared Error (MSE) would excessively penalize large errors, leading to an overly conservative model. Therefore, this paper adopts Mean Absolute Error (MAE) as the loss function, as shown in Equation (5). MAE is more robust to outliers, helping the model maintain stable prediction performance under sudden operating conditions, which better aligns with the actual operating characteristics of cable temperature.
where N is the number of cable monitoring points; T is the future time step of prediction; is the true temperature value of the i-th monitoring point at the j-th time step; is the predicted temperature value of the i-th monitoring point at the j-th time step.
2.3.3. Joint Hyperparameter Optimization Based on SSA
The MSST-Net model contains multiple hyperparameters, such as combinations of convolutional kernel sizes and dilation rates, learning rates, hidden dimensions, etc. These parameters exhibit strong coupling relationships. For example, the structural configuration of the multi-scale convolutional module directly affects the residual dynamic characteristics that the subsequent Transformer module needs to model, making traditional grid search or random search inefficient for optimization. Therefore, this paper adopts the Sparrow Search Algorithm (SSA) for global joint optimization of hyperparameters.
Figure 8 shows the hyperparameter automatic optimization process of the cable temperature prediction model based on SSA. In the initialization phase, a set of hyperparameter combinations (such as CNN architecture, learning rate, hidden dimensions) are randomly generated to form the initial "population". Individuals in the population are divided into discoverers, followers, and sentinels, and the hyperparameter combinations are updated according to role rules. After each update, the model's fitness under the current hyperparameter configuration is evaluated using the validation set. When the early stopping mechanism is satisfied (reaching the maximum iteration count of 200 or when the error no longer significantly decreases), the loop terminates, and the current optimal hyperparameter combination is output, including the optimal convolution combination, learning rate, and hidden dimensions. If the termination conditions are not met, iterative optimization continues.
2.3.4. Test Environment Configuration
Based on Python 3.8.12 and PyTorch 1.12 framework, using Intel Xeon E5-2690 V4 processor and NVIDIA RTX 3080 Ti graphics card with 12GB VRAM, accelerated computation through CUDA 11.4.0 and cuDNN 8.2.4. The hyperparameters optimized by SSA are shown in Table 2, with batch size Batch_size=32 and training epochs Epochs=200.
2.3.5. Evaluation Metrics
The coefficient of determination (R²) and root mean square error (RMSE) were used as evaluation metrics for prediction accuracy. The calculation formula for R² is as follows:
where SSE is the sum of squared residuals; SST is the total sum of squares.
The calculation formula of Root Mean Square Error (RMSE) is as follows:
where n is the sample size.
3. Results
3.1. SSA Hyperparameter Optimization Results
Run the Sparrow Search Algorithm (SSA) optimization process on the validation set, with a population size of 30 and a maximum of 100 iterations. The optimization process eventually converges, and the optimal hyperparameter combination is shown in Table 2.
As shown in Table 2, the SSA algorithm achieves systematic reconstruction of the parameter space through the collaborative optimization of the model architecture and training strategy, ensuring training robustness while expanding model capacity. The convolution kernel combination adopts a deep heterogeneous structure {3-1, 5-2, 7-4}, enhancing the ability to extract multi-scale features from mid-to-high layers; the learning rate is adjusted to 3.2×10⁻⁴ to improve convergence stability; the hidden dimension is expanded to 216 to alleviate the representation bottleneck; the number of attention heads is reduced to 6 to eliminate redundant computation, and combined with an increased Dropout rate of 0.25 to build a regularization constraint.
3.2. Comparative Analysis of Model Predictions
To validate the cable temperature prediction performance of MSST-Net, the same dataset was used for comparison with mainstream advanced algorithms in recent years, including ARIMA, LSTM, CNN-LSTM, STGNN, and Transformer. The models were trained using the training set and their prediction performance was verified on the test set. Among them, ARIMA is a univariate time series prediction model; CNN-LSTM combines CNN for extracting local spatiotemporal features with LSTM for modeling long-term dependencies; STGNN is a standard spatiotemporal graph neural network. R², MAE, and RMSE were selected as evaluation metrics.
The model has an input time step of 28 and a feature dimension of 5, predicting cable temperature data for the next time step (60 minutes). After training is completed, the prediction accuracy is evaluated using the test set. Figure 9 shows the prediction results of each model in the high-temperature region of the test set, where the black curve represents the actual temperature values, and the blue-green curve represents the MSST-Net predicted values.
Table 3 shows that the traditional univariate ARIMA model performs the worst, as it struggles to capture the nonlinear dynamic characteristics in cable temperature evolution and the spatial coupling effects between measurement points. Deep learning methods such as LSTM and CNN-LSTM significantly outperform ARIMA, indicating their superior ability in representing complex thermodynamic processes. Among them, CNN-LSTM further improves prediction performance by integrating spatiotemporal features. Although the STGNN model, which incorporates spatial structural information, shows improvement over baseline models, its fixed adjacency matrix cannot adapt to the dynamic thermal conduction relationships in cable systems under varying operating conditions. The Transformer model, based on self-attention mechanisms, demonstrates good predictive capability but is prone to overfitting under non-stationary conditions such as sudden load current changes, leading to increased prediction volatility. The proposed MSST-Net shows better alignment with actual temperature curves and higher prediction accuracy, with R², MAE, and RMSE values of 0.942, 0.442°C, and 0.596°C respectively. Compared to Transformer, MAE and RMSE are reduced by 0.768°C and 0.425°C, respectively, validating the effectiveness of its multi-scale convolutional feature extraction and spatiotemporal decoupling design.
Figure 10 shows the box plots of the absolute prediction residuals for the six models. It can be seen that the box plot length of MSST-Net is significantly smaller than those of ARIMA, LSTM, and CNN-LSTM, and the absolute error values are concentrated around 0.442. The maximum absolute error value is also significantly smaller than other models, indicating that the distribution of its absolute residuals is more concentrated and the prediction results are more stable.
4. Discussion
This study proposes the MSST-Net model, which effectively addresses key challenges in cable temperature prediction through multi-scale feature extraction, spatiotemporal dependency modeling, and SSA-driven automated hyperparameter optimization.
The performance improvement of the model primarily stems from its targeted design. The multi-scale convolutional module successfully captures features of cable temperature variations across different time scales—such as second-level abrupt changes and hour-level gradual fluctuations—by utilizing differentiated receptive fields, thereby overcoming the limitations of traditional single-scale models. The decoupled spatiotemporal modeling strategy, which separately processes temporal dependencies and spatial correlations, significantly enhances the model's generalization capability.
Furthermore, the SSA-based automated hyperparameter optimization strategy effectively improves model efficiency, significantly reduces the cost of manual parameter tuning, and enhances engineering practicality.
The limitation of this study lies in the model's strong dependence on the quality of historical data. Future research will explore the integration of more external environmental factors and further improve the model's robustness in scenarios with missing data.
5. Conclusions
For underground utility tunnel cable data, the MSST-Net model is proposed, which achieves precise prediction of cable temperature through multi-scale feature extraction, spatio-temporal dependency modeling, and SSA-driven automated hyperparameter tuning, effectively addressing issues such as inadequate local feature capture and difficulties in spatio-temporal dependency modeling. Comparative analysis with models such as ARIMA, LSTM, CNN-LSTM, STGNN, and Transformer shows that MSST-Net achieves a coefficient of determination (R²) of 0.942, mean absolute error (MAE) of 0.442°C, and root mean square error (RMSE) of 0.596°C on real datasets, verifying its accuracy in time series prediction. Compared with other models, MSST-Net can better adapt to cable data characteristics and exhibits superior prediction performance and generalization capability.
Author Contributions
Writing—original draft, Software, Investigation, Methodology, Validation, Data curation, Z.X.; Supervision, Conceptualization, Writing—review and editing, Resources, Project administration, Funding acquisition, Y.L. and Z.S.; Investigation, Methodology, Visualization, W.X. and C.L.; Formal analysis, Software, Validation, C.M.; Data curation, Formal analysis, Writing—review and editing, Resources, H.L.; All authors have read and agreed to the published version of the manuscript.
Funding
This work was funded by the Science and Technology Project of Southern Power Grid Company, Research on the Key Technology of Highly Refreshed Digital Twins and Large Depth Cable Detection in Power Conduit Corridors-Subject 1: Research on Key Technology of Highly Refreshed Digital Twins in Power Conduit Corridors, 256 with the grant number 030117KC23110003.
Data Availability Statement
No new data were created or analyzed in this study. Data sharing is not applicable to this article.
Conflicts of Interest
All authors declared that there are no conflicts of interest.
References
- Nie, Y.; Chen, D.; Zheng, S.; Xu, X.; Wang, X.; Wu, Z. Simulation and Calculation of Temperature Field and Current-Carrying Capacity of Power Cables under Different Laying Methods. Energies 2024, 17, 4611. [Google Scholar] [CrossRef]
- Zhang, H.; Yu, S.; Liu, Z.; Cheng, X.; Zeng, H. Research on the Improvement of Cable Ampacity in Dense Cable Trench. Energies 2024, 17, 2579. [Google Scholar] [CrossRef]
- Song, Q; Ma, M; Guo, W; et al. Health state diagnosis of air duct for photovoltaic inverter based on PSO-SVM classifier. Microelectronics Reliability 2023, 150, 115084. [Google Scholar] [CrossRef]
- Atoccsa, B.A.; Puma, D.W.; Mendoza, D.; Urday, E.; Ronceros, C.; Palma, M.T. Optimization of Ampacity in High-Voltage Underground Cables with Thermal Backfill Using Dynamic PSO and Adaptive Strategies. Energies 2024, 17, 1023. [Google Scholar] [CrossRef]
- Szultka, S.; Czapp, S.; Tomaszewski, A.; Tariq, H. Calculation of Maximum Permissible Load of Underground Power Cables–Numerical Approach for Systems with Stabilized Backfill. Applied Sciences 2024, 14, 9233. [Google Scholar] [CrossRef]
- Zhao, Y.; Si, W.; Fu, C.; Yang, C.; Yang, J. Steady-State Temperature Prediction for Cluster-Laid Tunnel Cables Based on Self-Modeling in Natural Convection. Energies 2024, 17, 5510. [Google Scholar] [CrossRef]
- Ji, C; Wang, L; Hou, W; et al. Research on Accident Prediction of Cable Tunnel Based on FT-GS-SVR Algorithm. Journal of Electrical Engineering & Technology 2025, 20, 889–902. [Google Scholar]
- Duell, J.; King, R.; Priede, J.; Davison, J.; Nesbitt, A. Opportunities to Improve Marine Power Cable Ratings with Ocean Bottom Temperature Models. Energies 2023, 16, 5454. [Google Scholar] [CrossRef]
- Szczegielniak, T.; Jabłoński, P.; Kusiak, D. Analytical Approach to Current Rating of Three-Phase Power Cable with Round Conductors. Energies 2023, 16, 1821. [Google Scholar] [CrossRef]
- Bassan, F.R.; Rosolem, J.B.; Floridia, C.; Penze, R.S.; Aires, B.N.; Roncolatto, R.A.; Peres, R.; Júnior, J.R.N.; Fracarolli, J.P.V.; da Costa, E.F.; et al. Multi-Parameter Optical Monitoring Solution Applied to Underground Medium-Voltage Electric Power Distribution Networks. Sensors 2023, 23, 5066. [Google Scholar] [CrossRef] [PubMed]
- Navarrete-Rajadel, P.; Llovera-Segovia, P.; Fuster-Roig, V.; Quijano-López, A. A Sensor for Multi-Point Temperature Monitoring in Underground Power Cables. Sensors 2025, 25, 5490. [Google Scholar] [CrossRef] [PubMed]
- Huang, J.; Wei, Q.; Wang, T.; Ding, J.; Yu, L.; Wang, D.; Yu, Z. Spatio-Temporal Feature Fusion-Based Hybrid GAT-CNN-LSTM Model for Enhanced Short-Term Power Load Forecasting. Energies 2025, 18, 5686. [Google Scholar] [CrossRef]
- Dou, X.; Yang, R.; Dou, Z.; Zhang, C.; Xu, C.; Li, J. A Load Forecasting Model Based on Spatiotemporal Partitioning and Cross-Regional Attention Collaboration. Sustainability 2025, 17, 8162. [Google Scholar] [CrossRef]
- Cavus, M.; Allahham, A. Spatio-Temporal Attention-Based Deep Learning for Smart Grid Demand Prediction. Electronics 2025, 14, 2514. [Google Scholar] [CrossRef]
- Wu, M.; Feng, W.; Li, X.; Liu, Y.; Cao, C. Short-Term Power Load Forecasting Using an Improved Model Integrating GCN and Transformer. Applied Sciences 2025, 15, 7003. [Google Scholar] [CrossRef]
Figure 1.
Knowledge city underground utility tunnel.
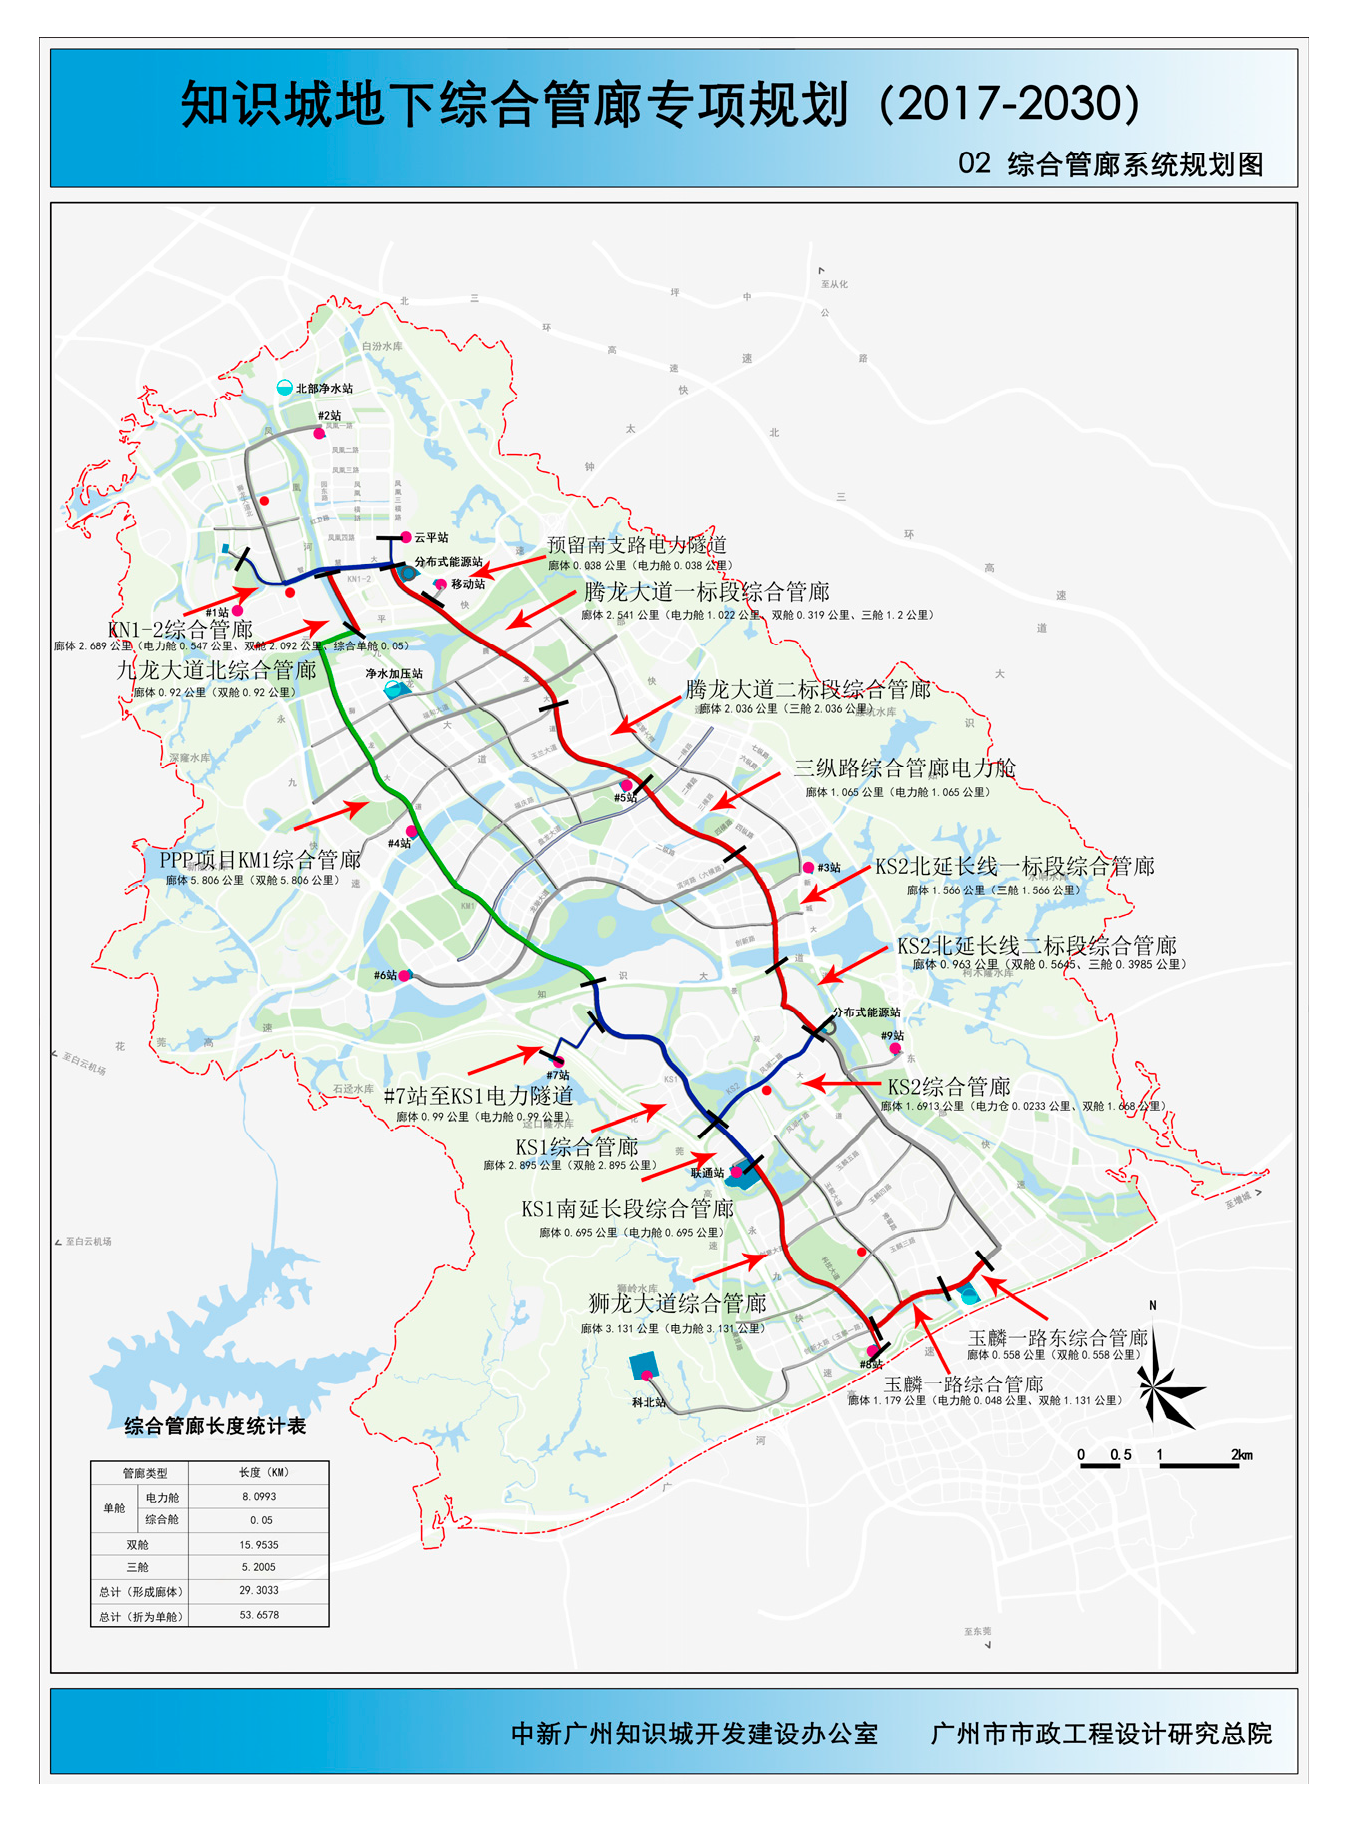
Figure 2.
Temperature data for the 2023-2024 fiscal year.
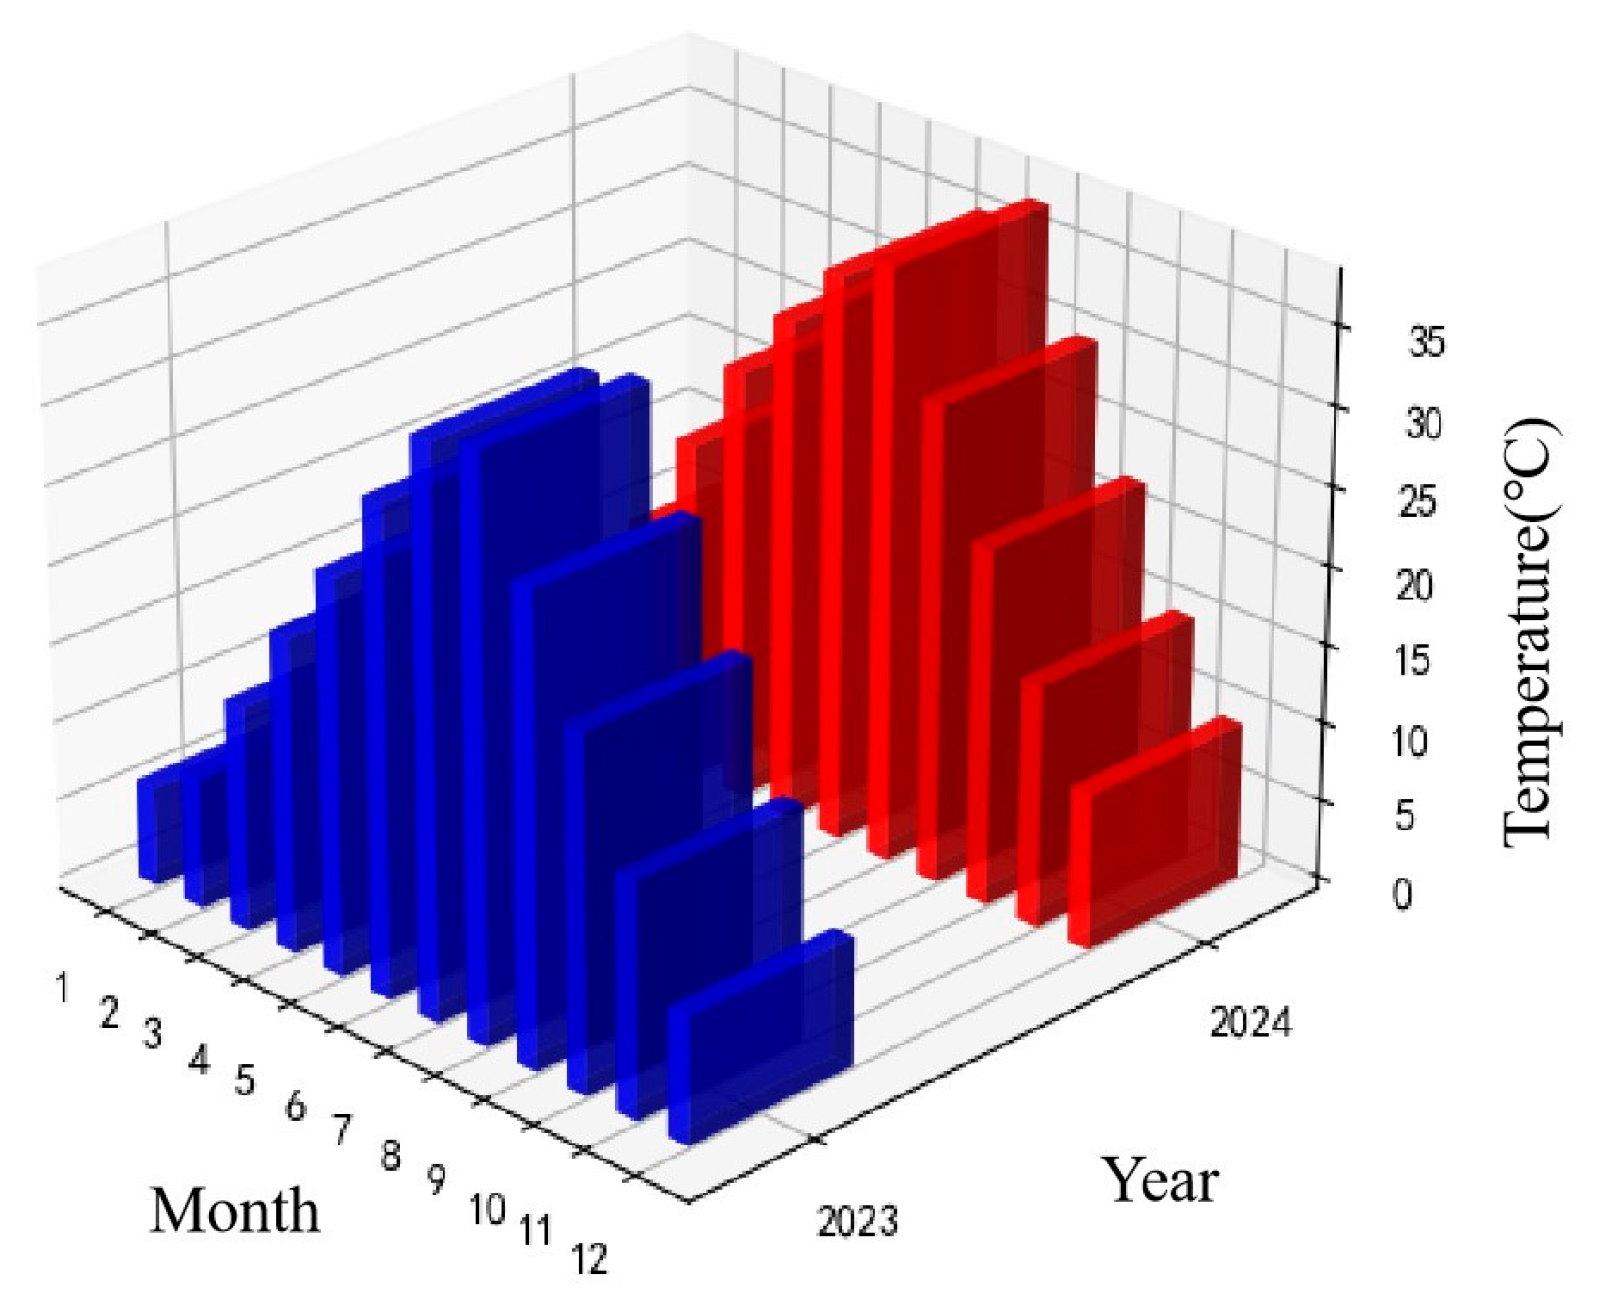
Figure 3.
Figure 3. Data preprocessing workflow.
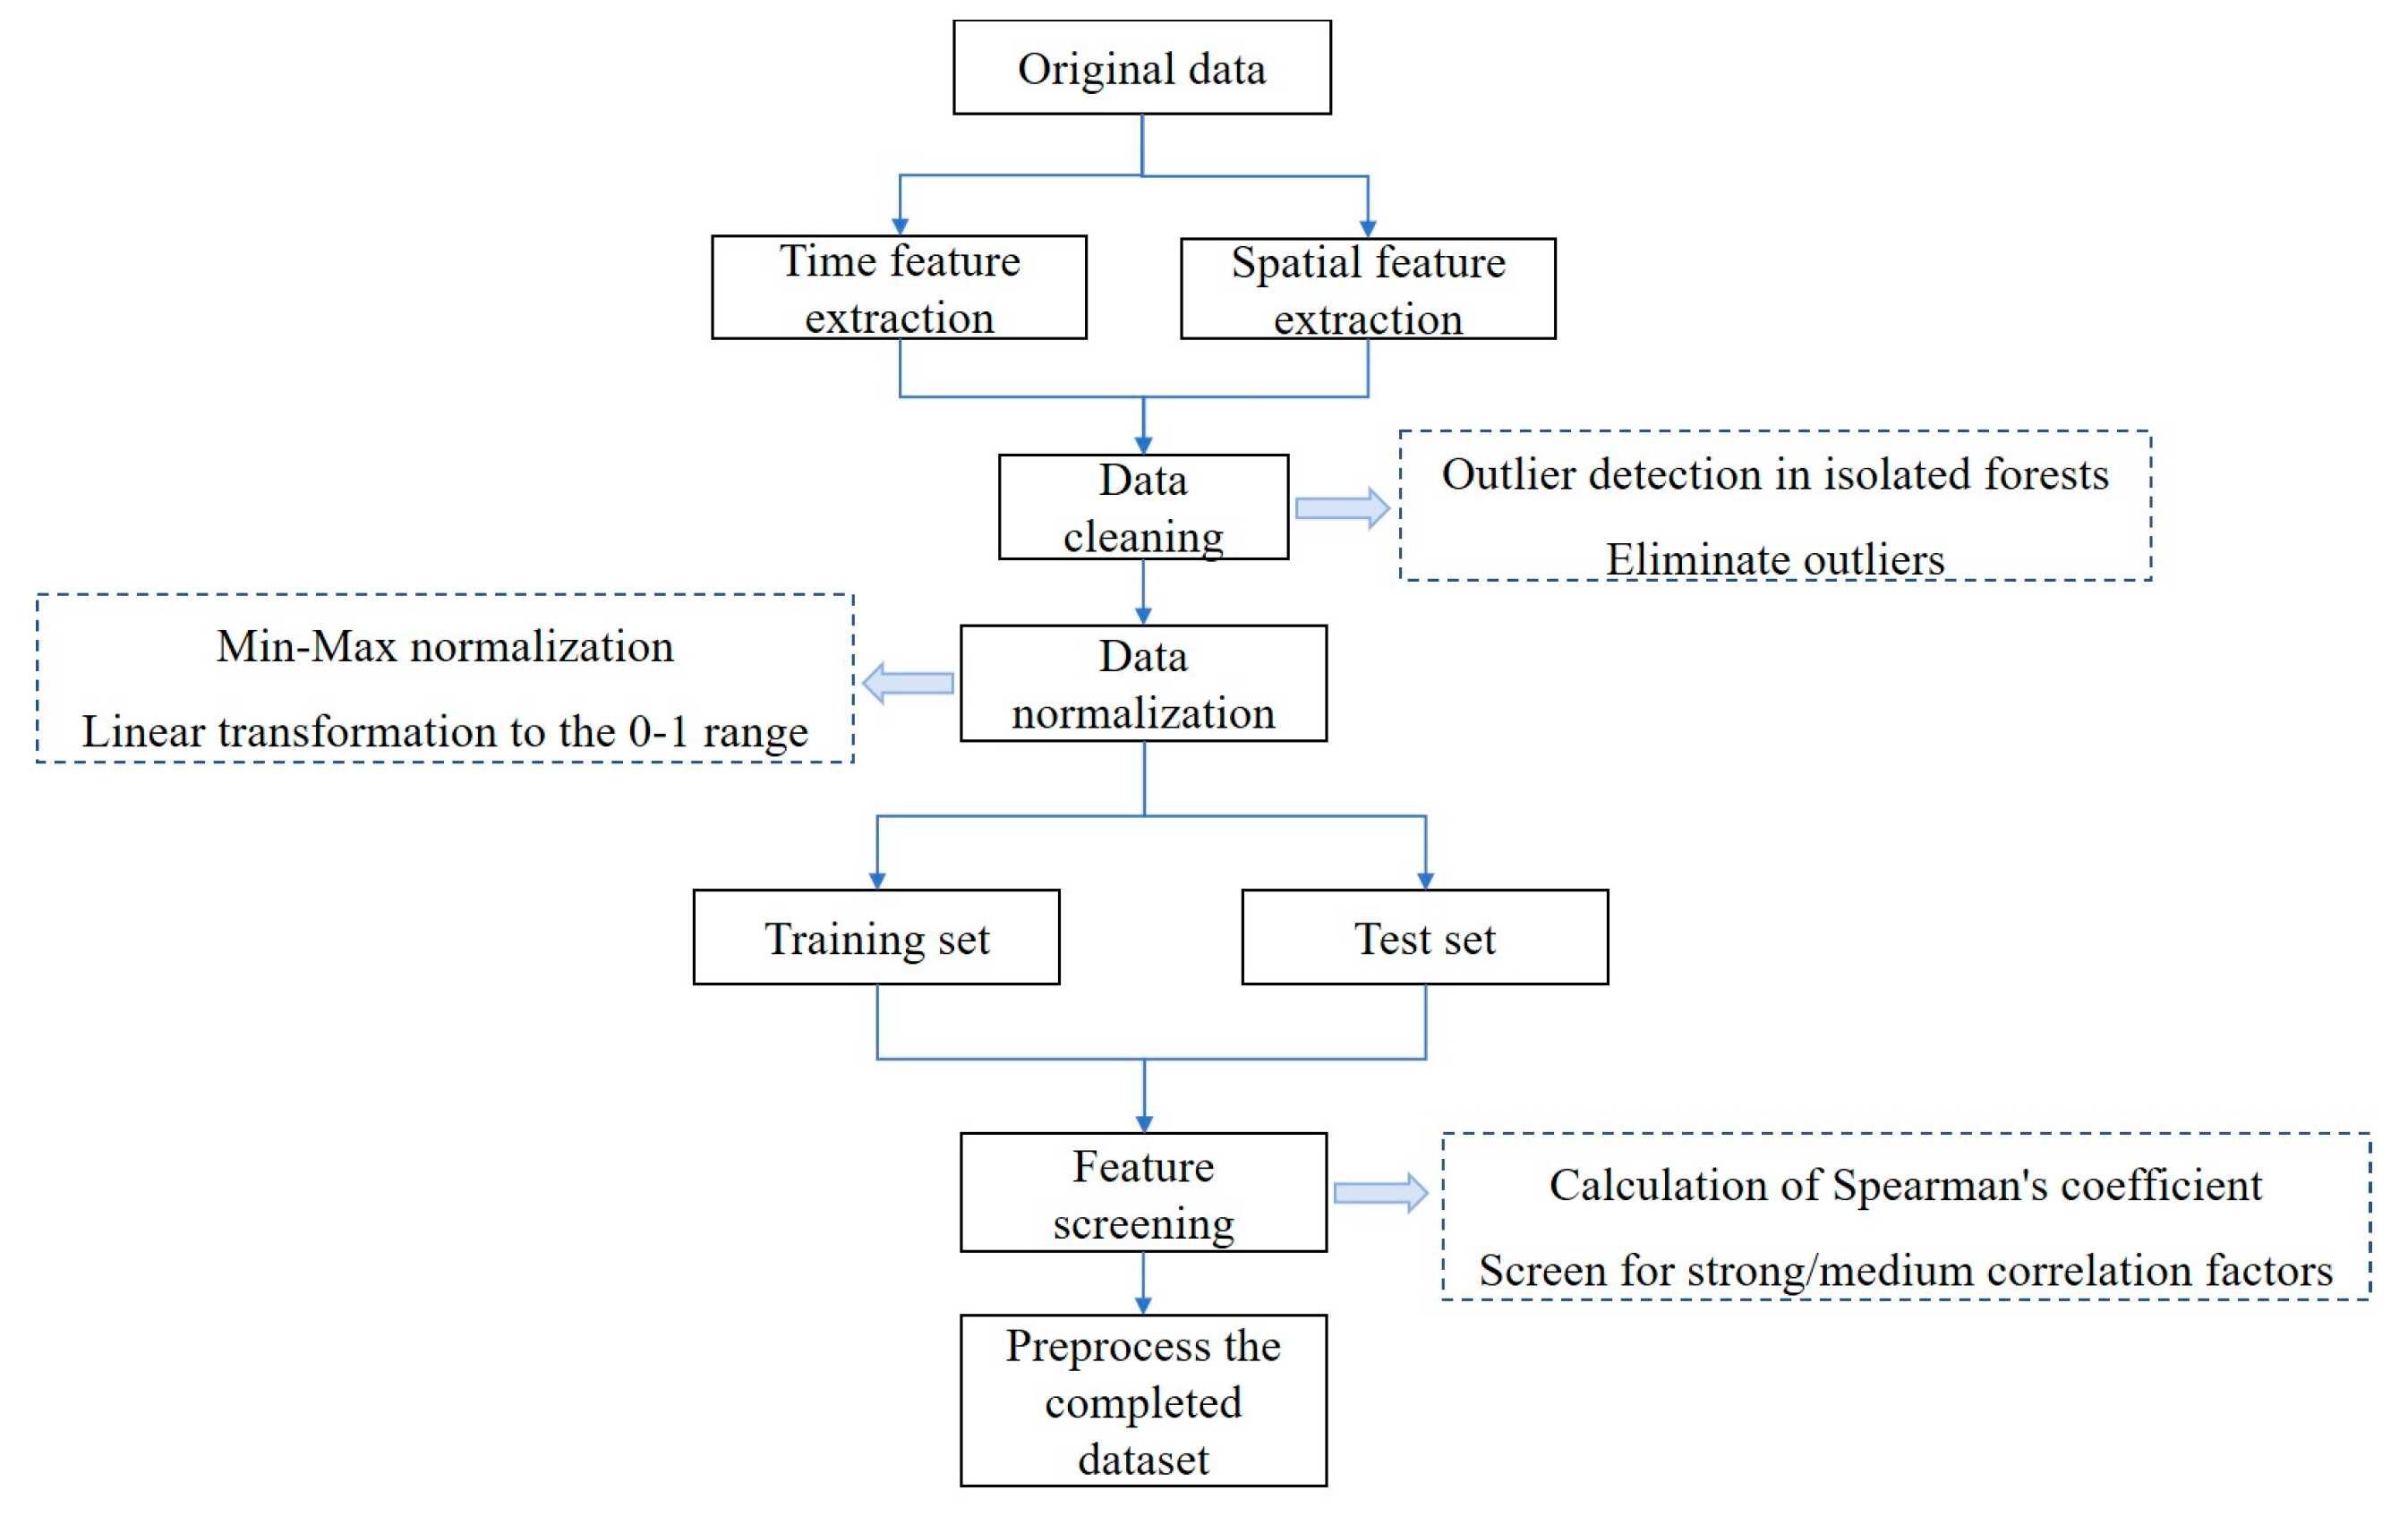
Figure 4.
Correlation between cable temperature and different environmental factors.
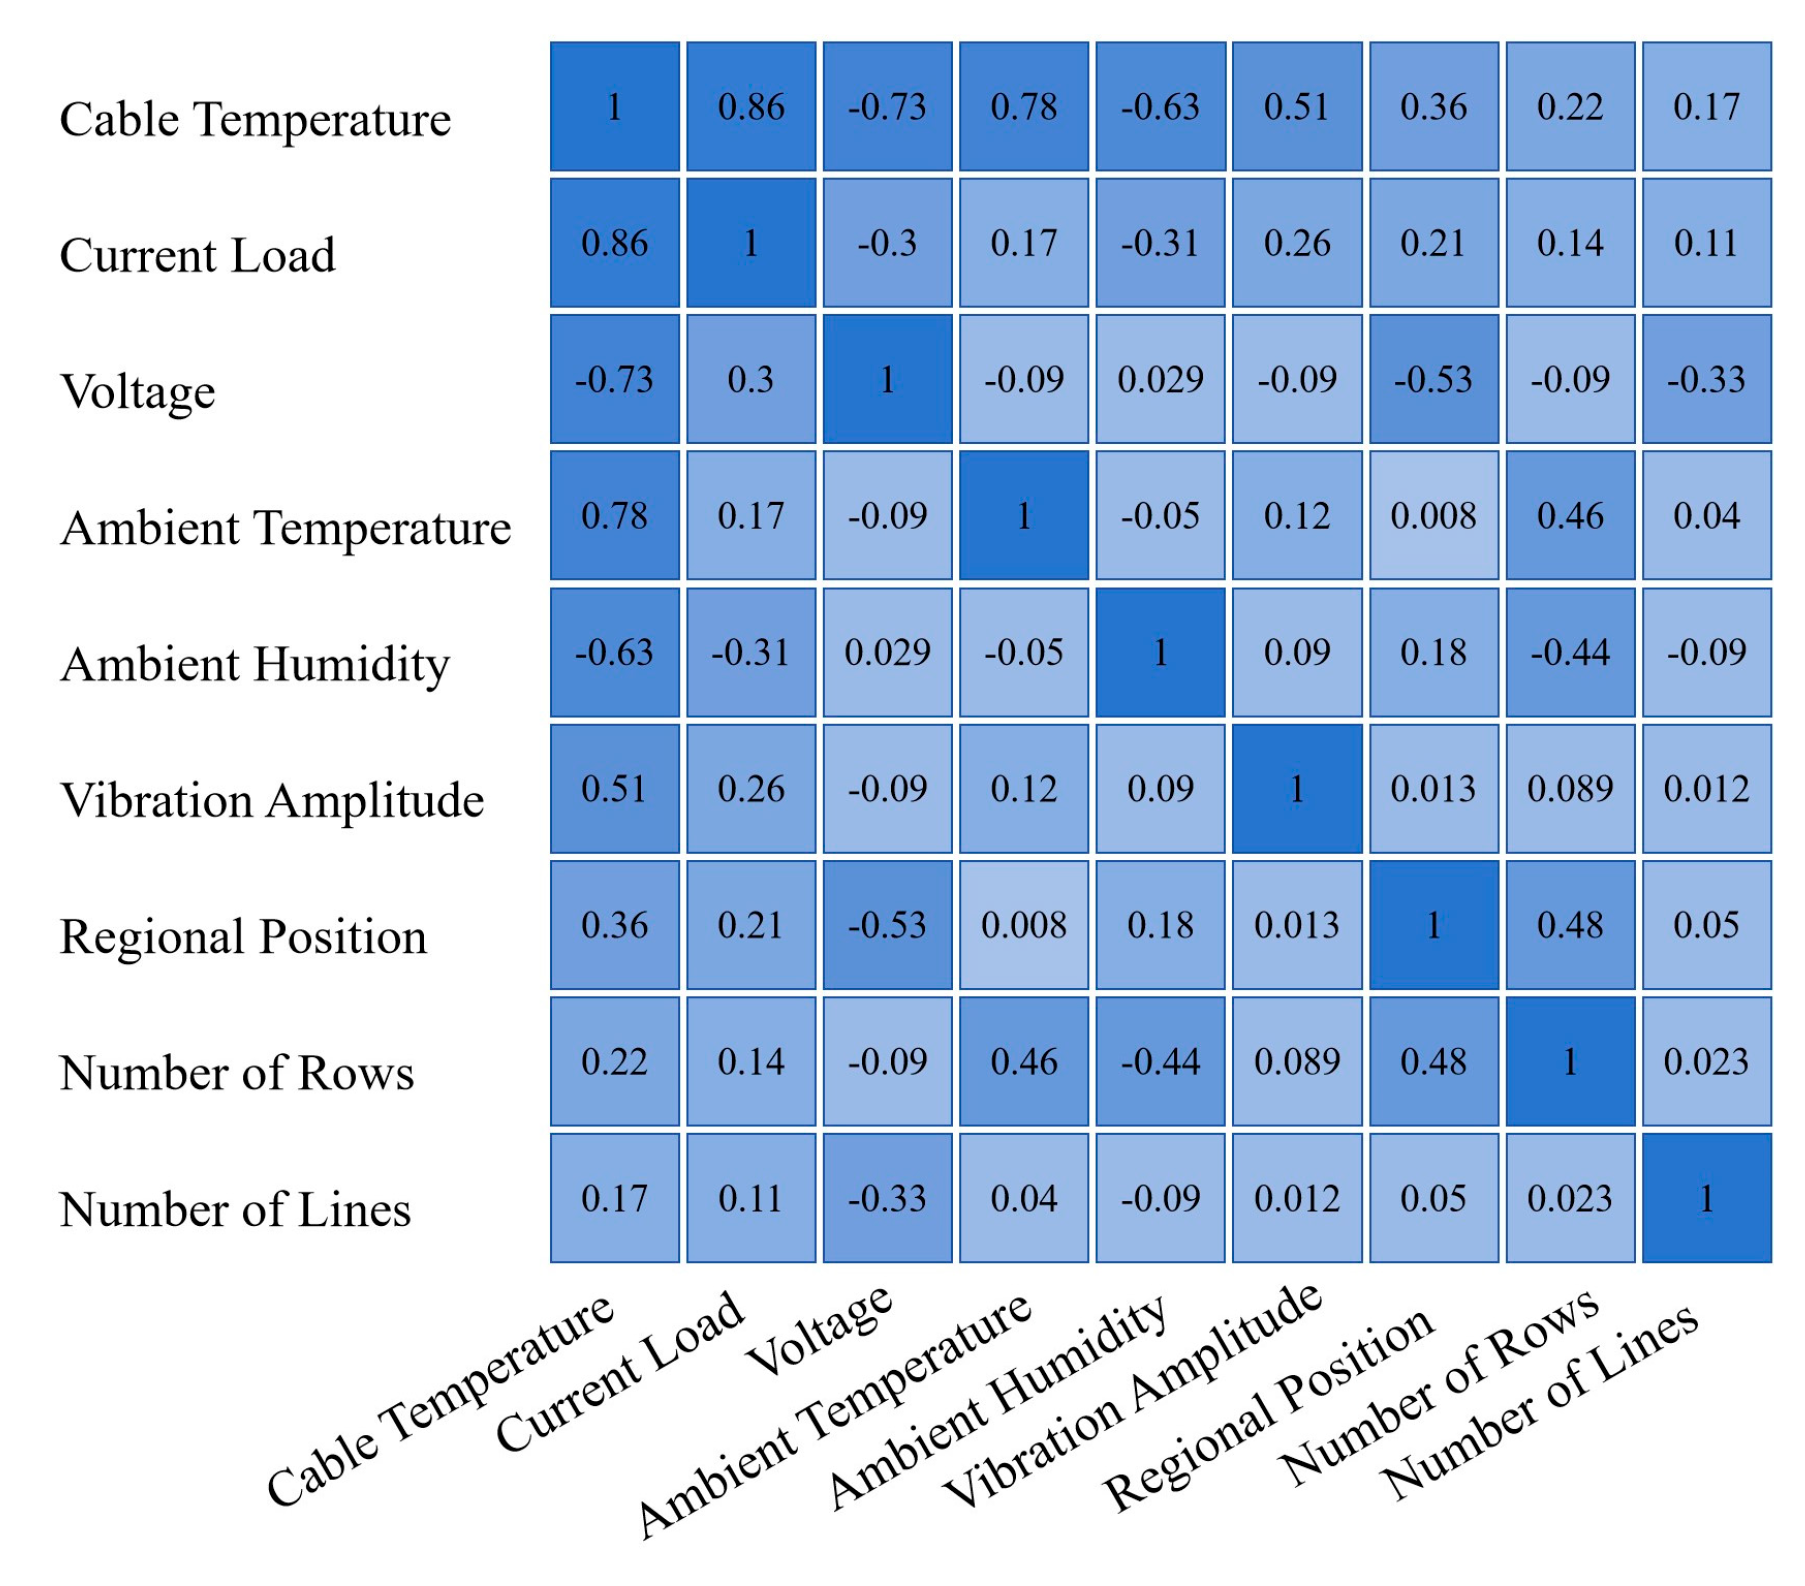
Figure 5.
Model framework of MSST-Net.
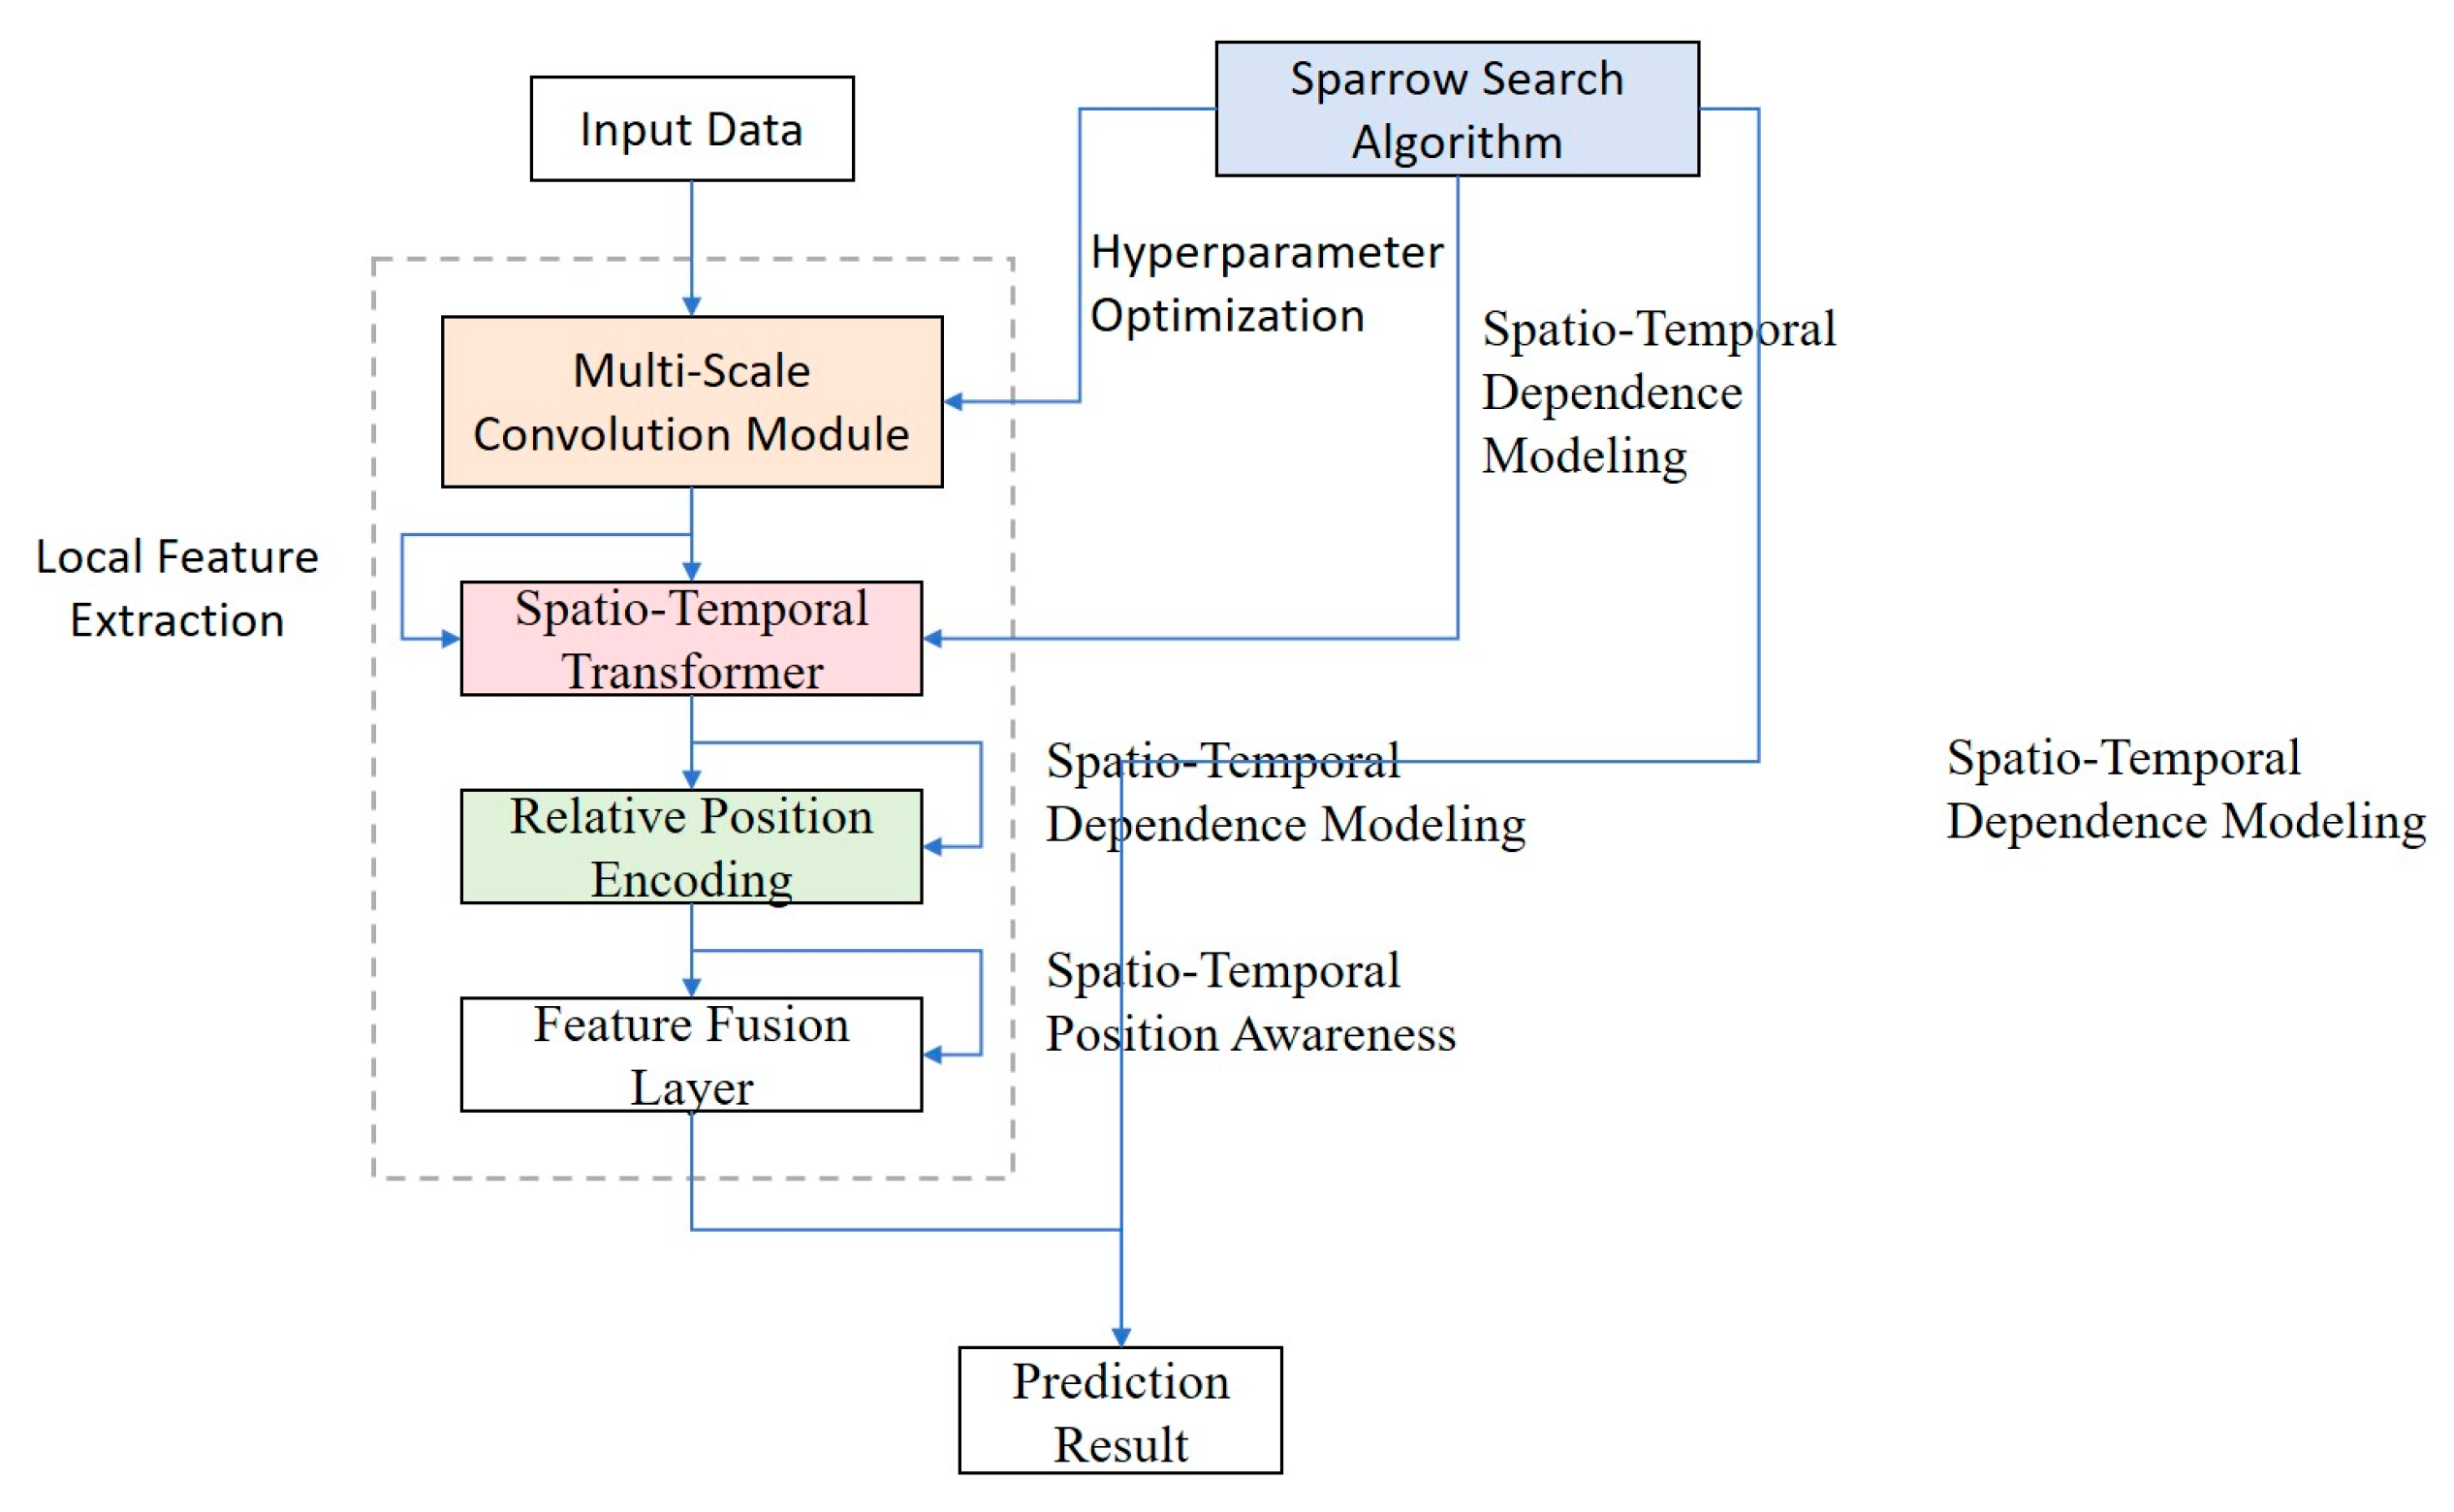
Figure 6.
Multi-Scale convolution module.
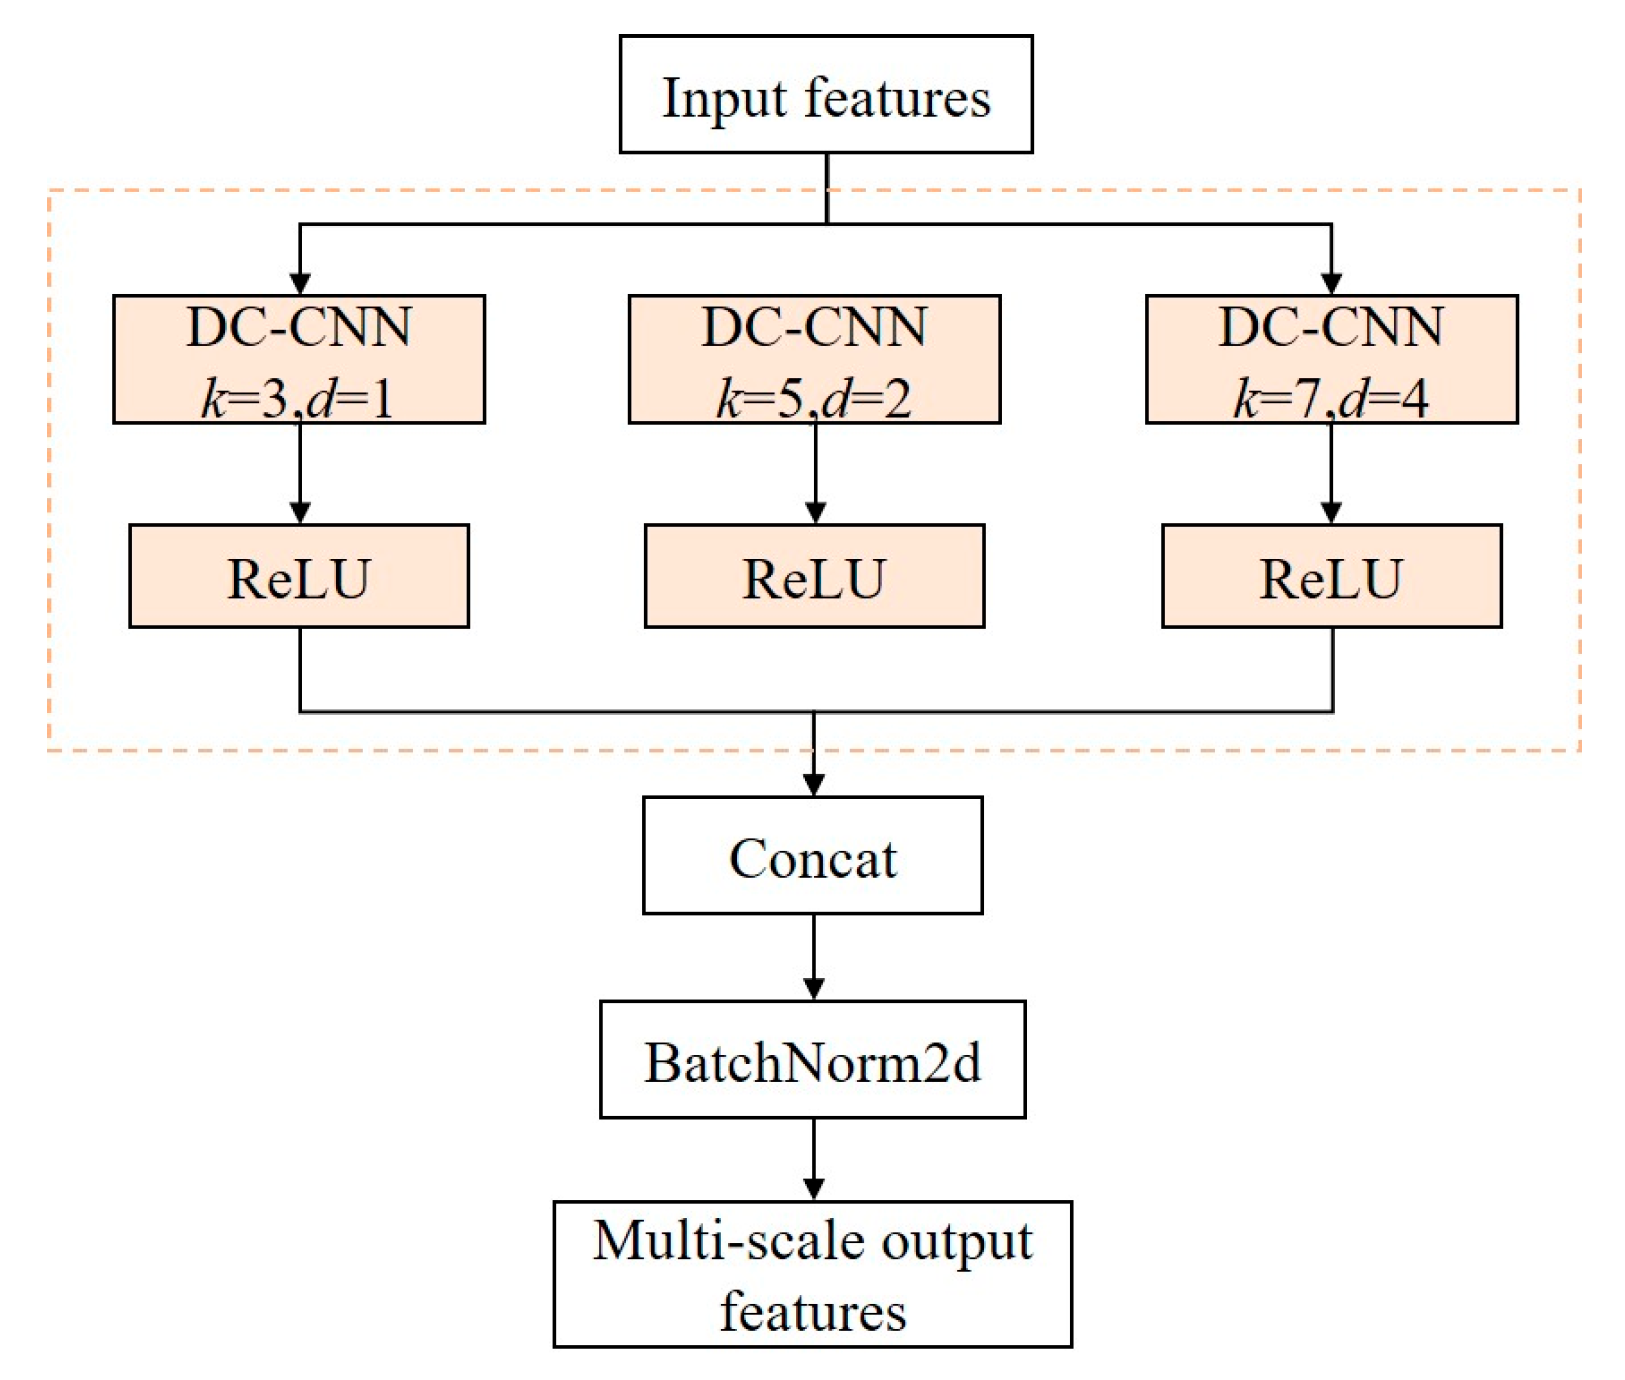
Figure 7.
Spatio-temporal transformer.
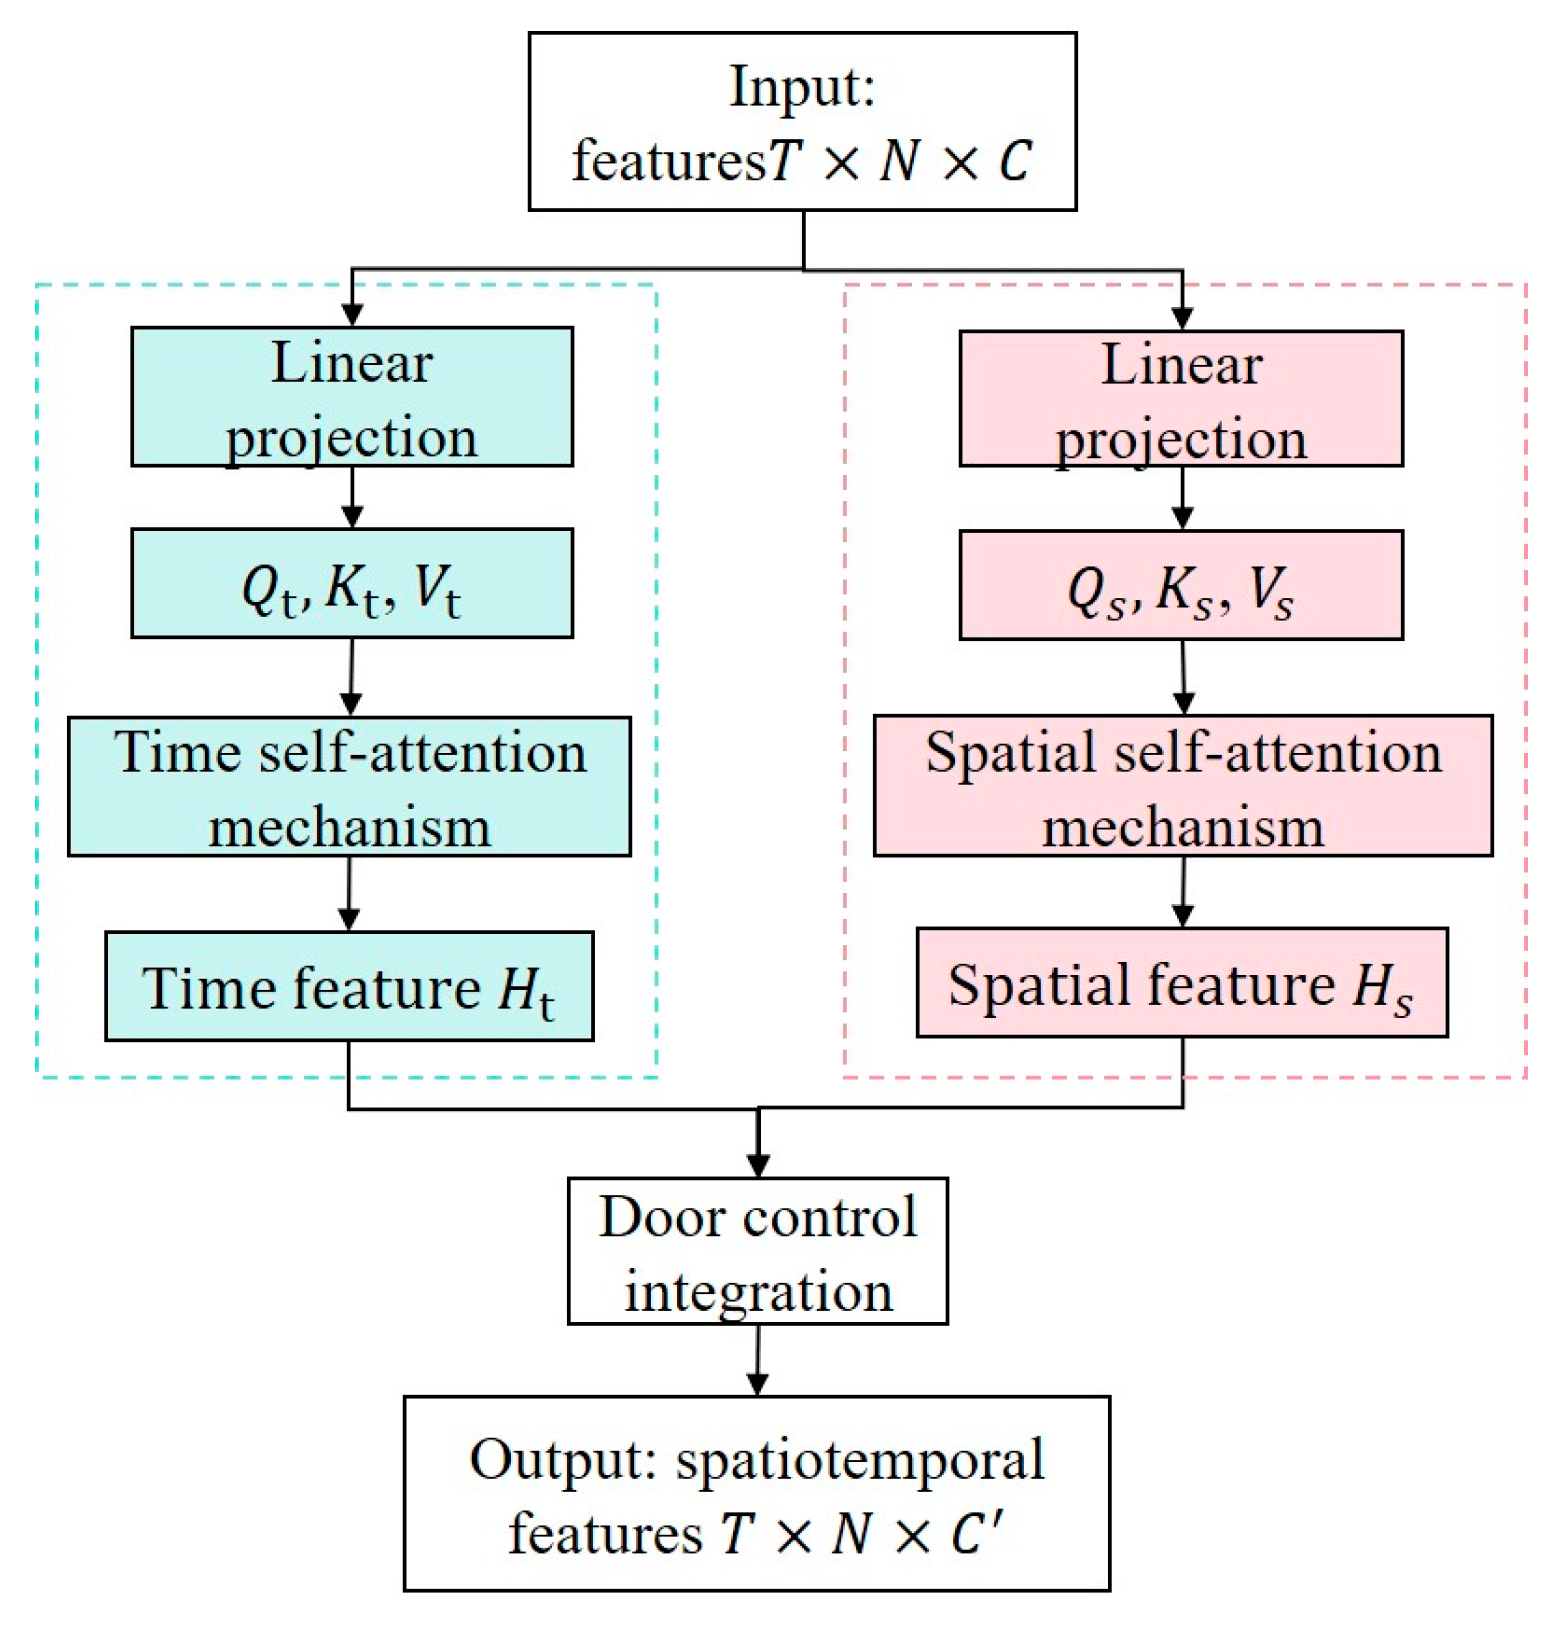
Figure 8.
SSA hyperparameter optimization flowchart.
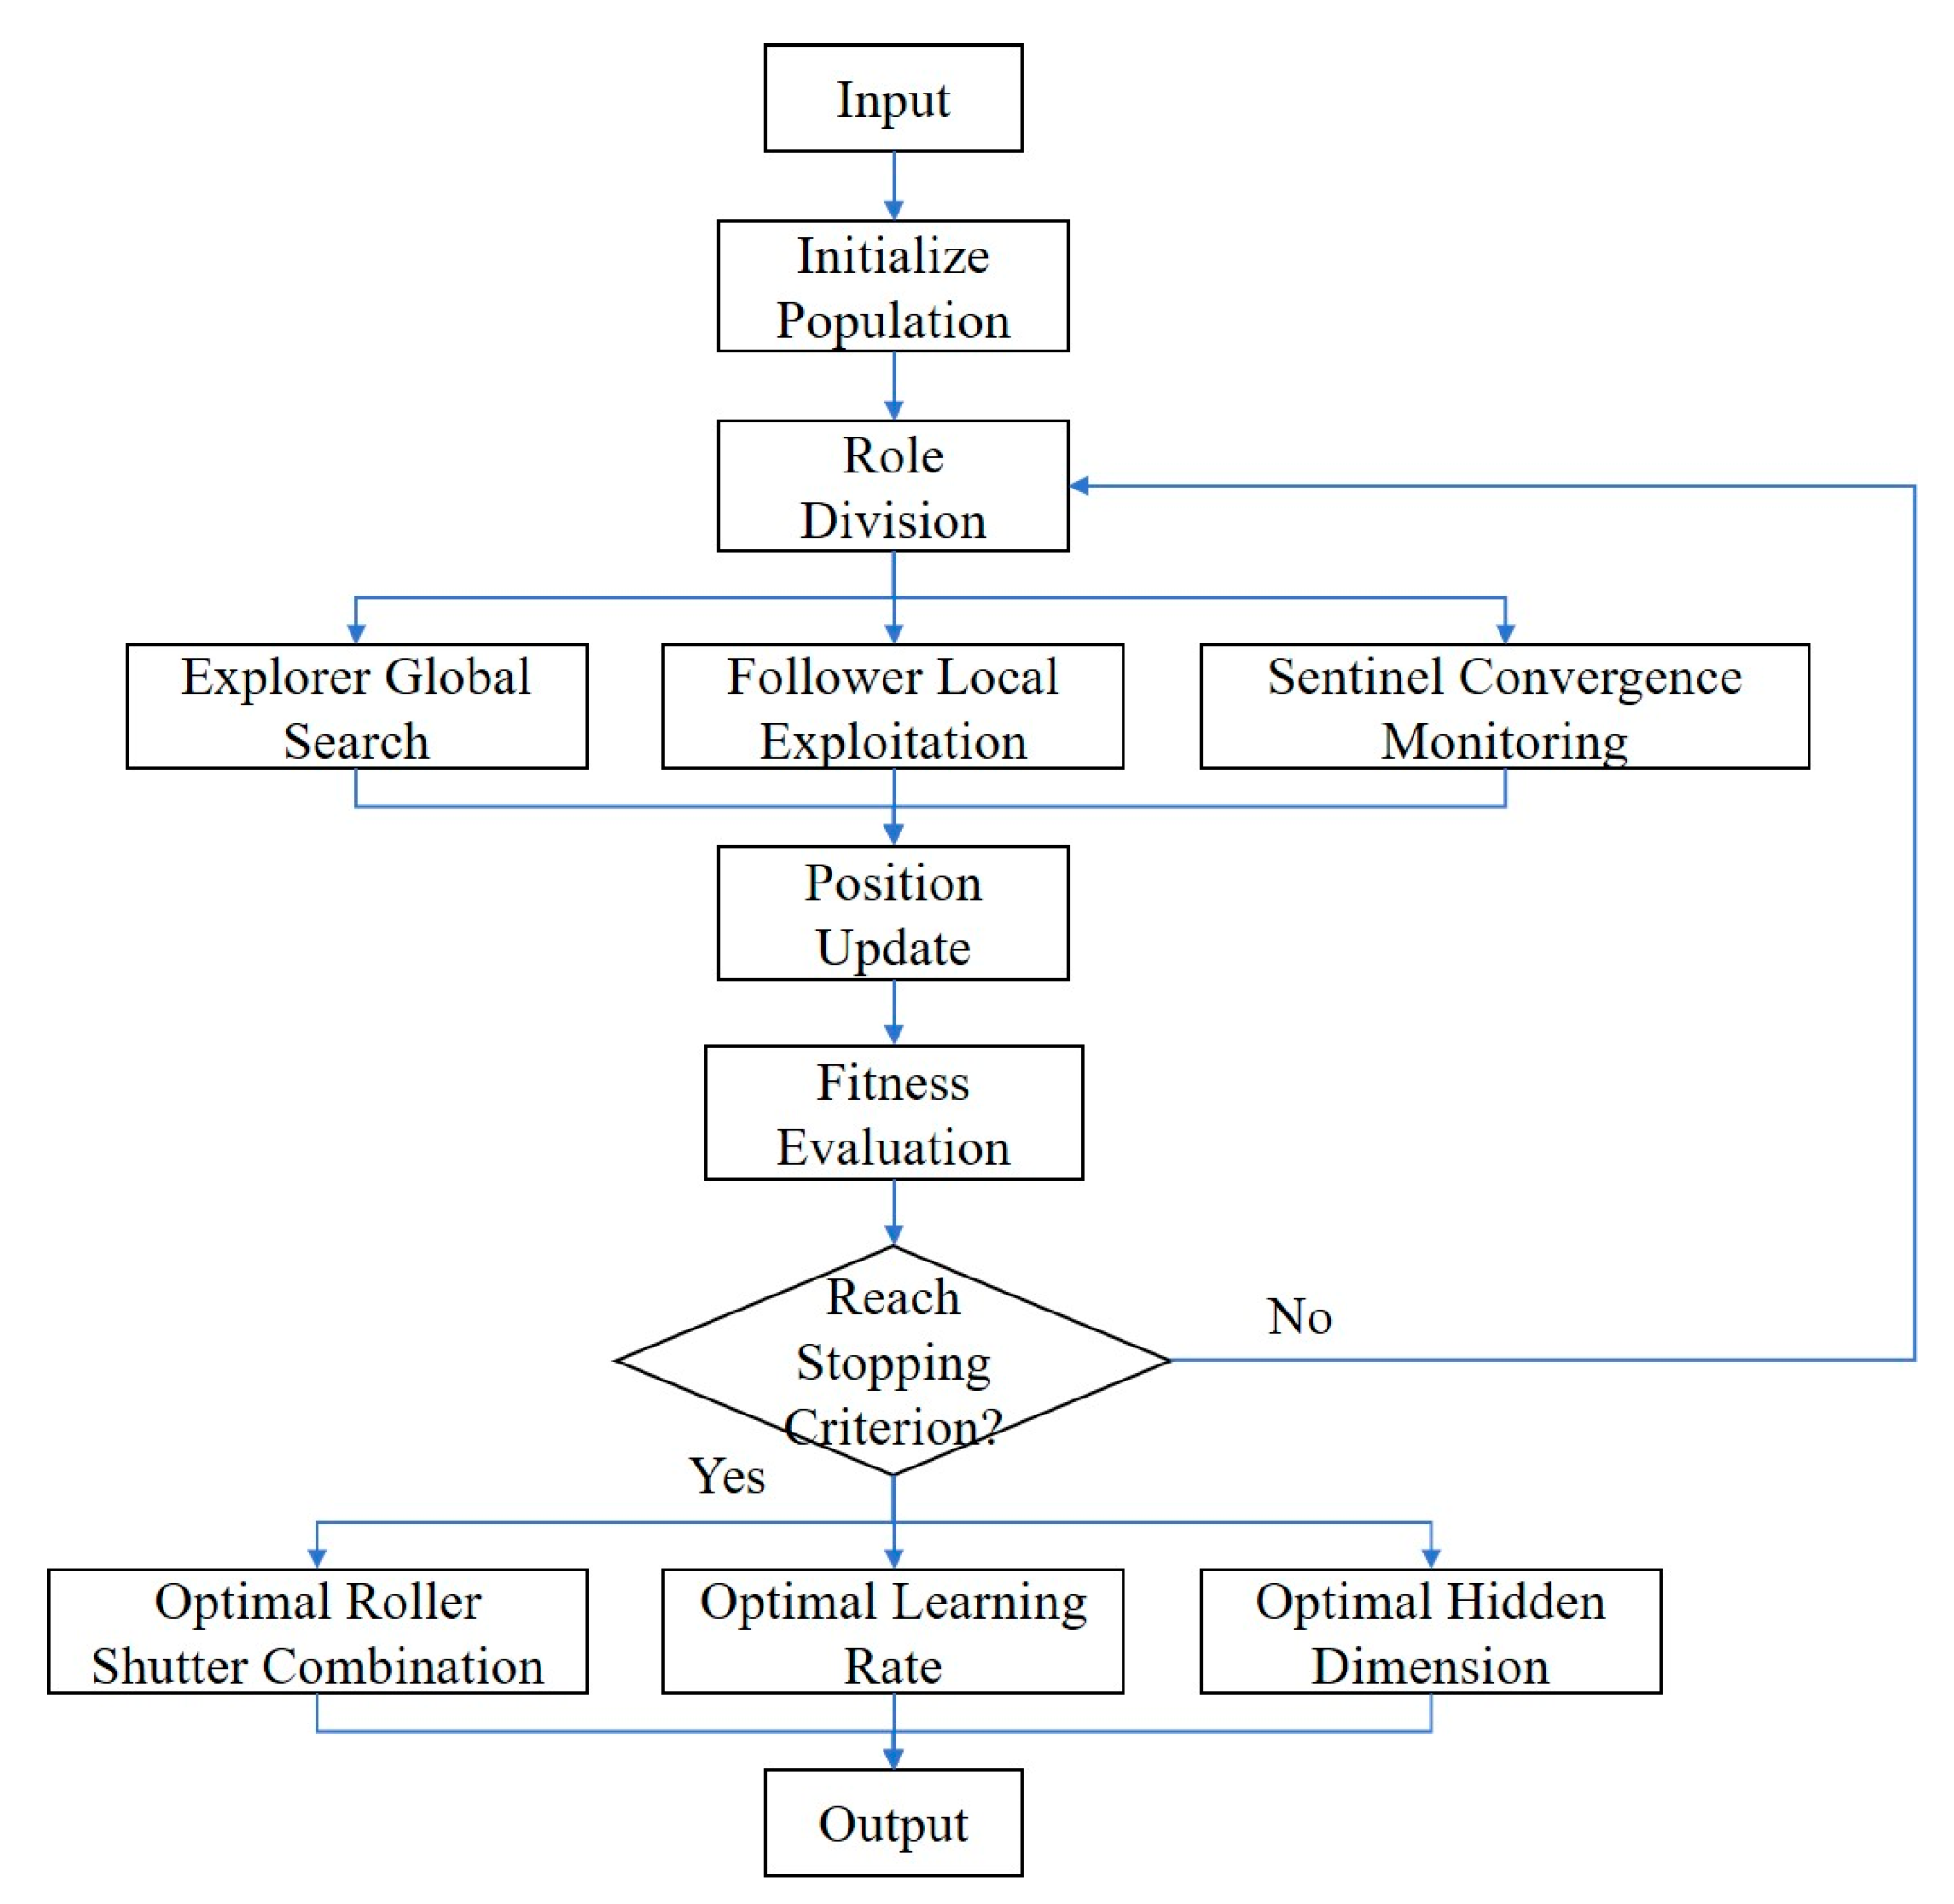
Figure 9.
Variation curves of cable temperature prediction values by different models.
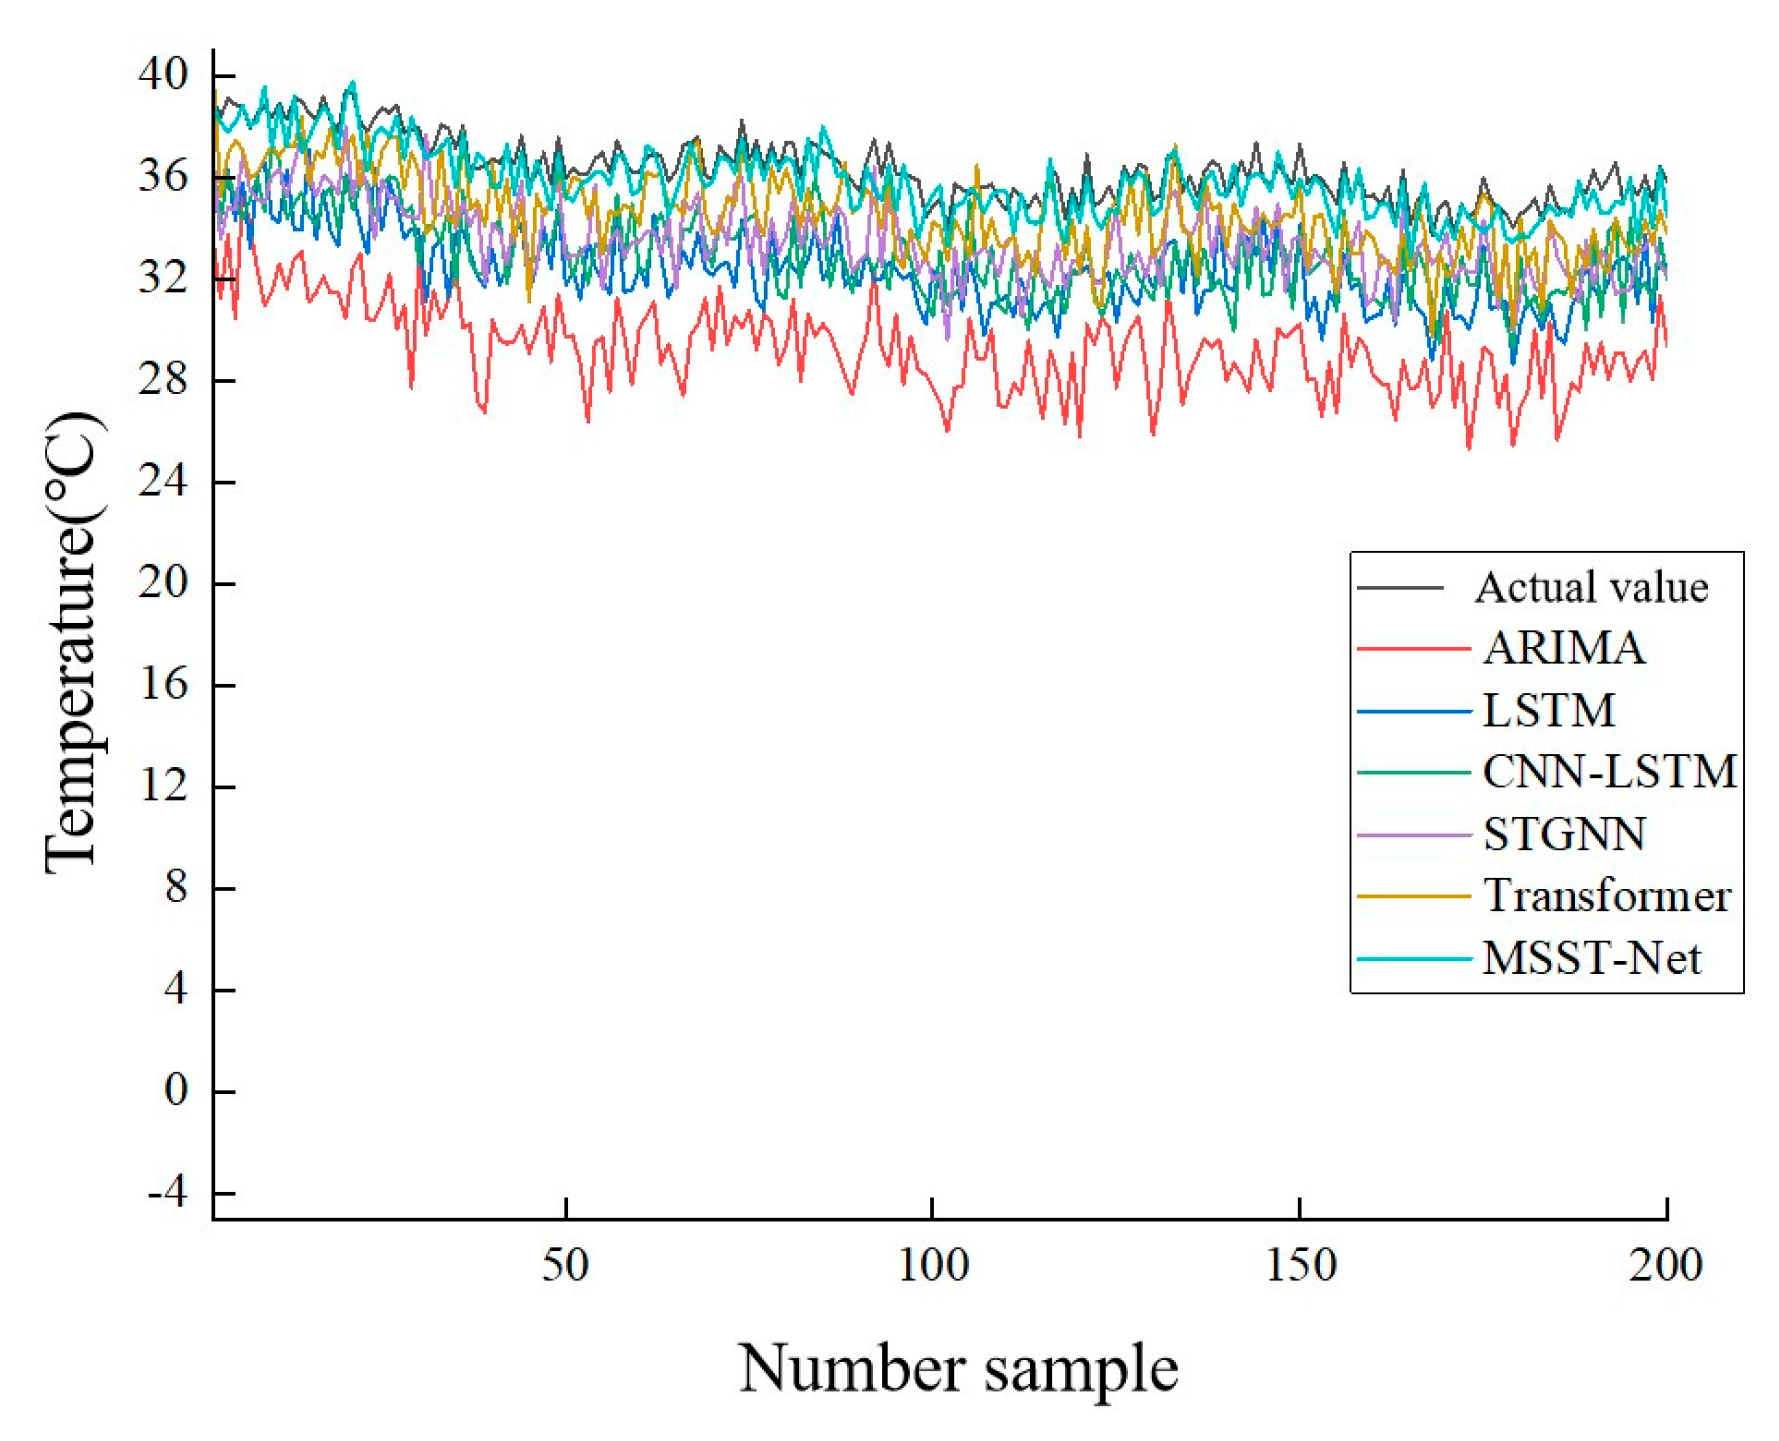
Figure 10.
Absolute error values of cable temperature prediction by different models.
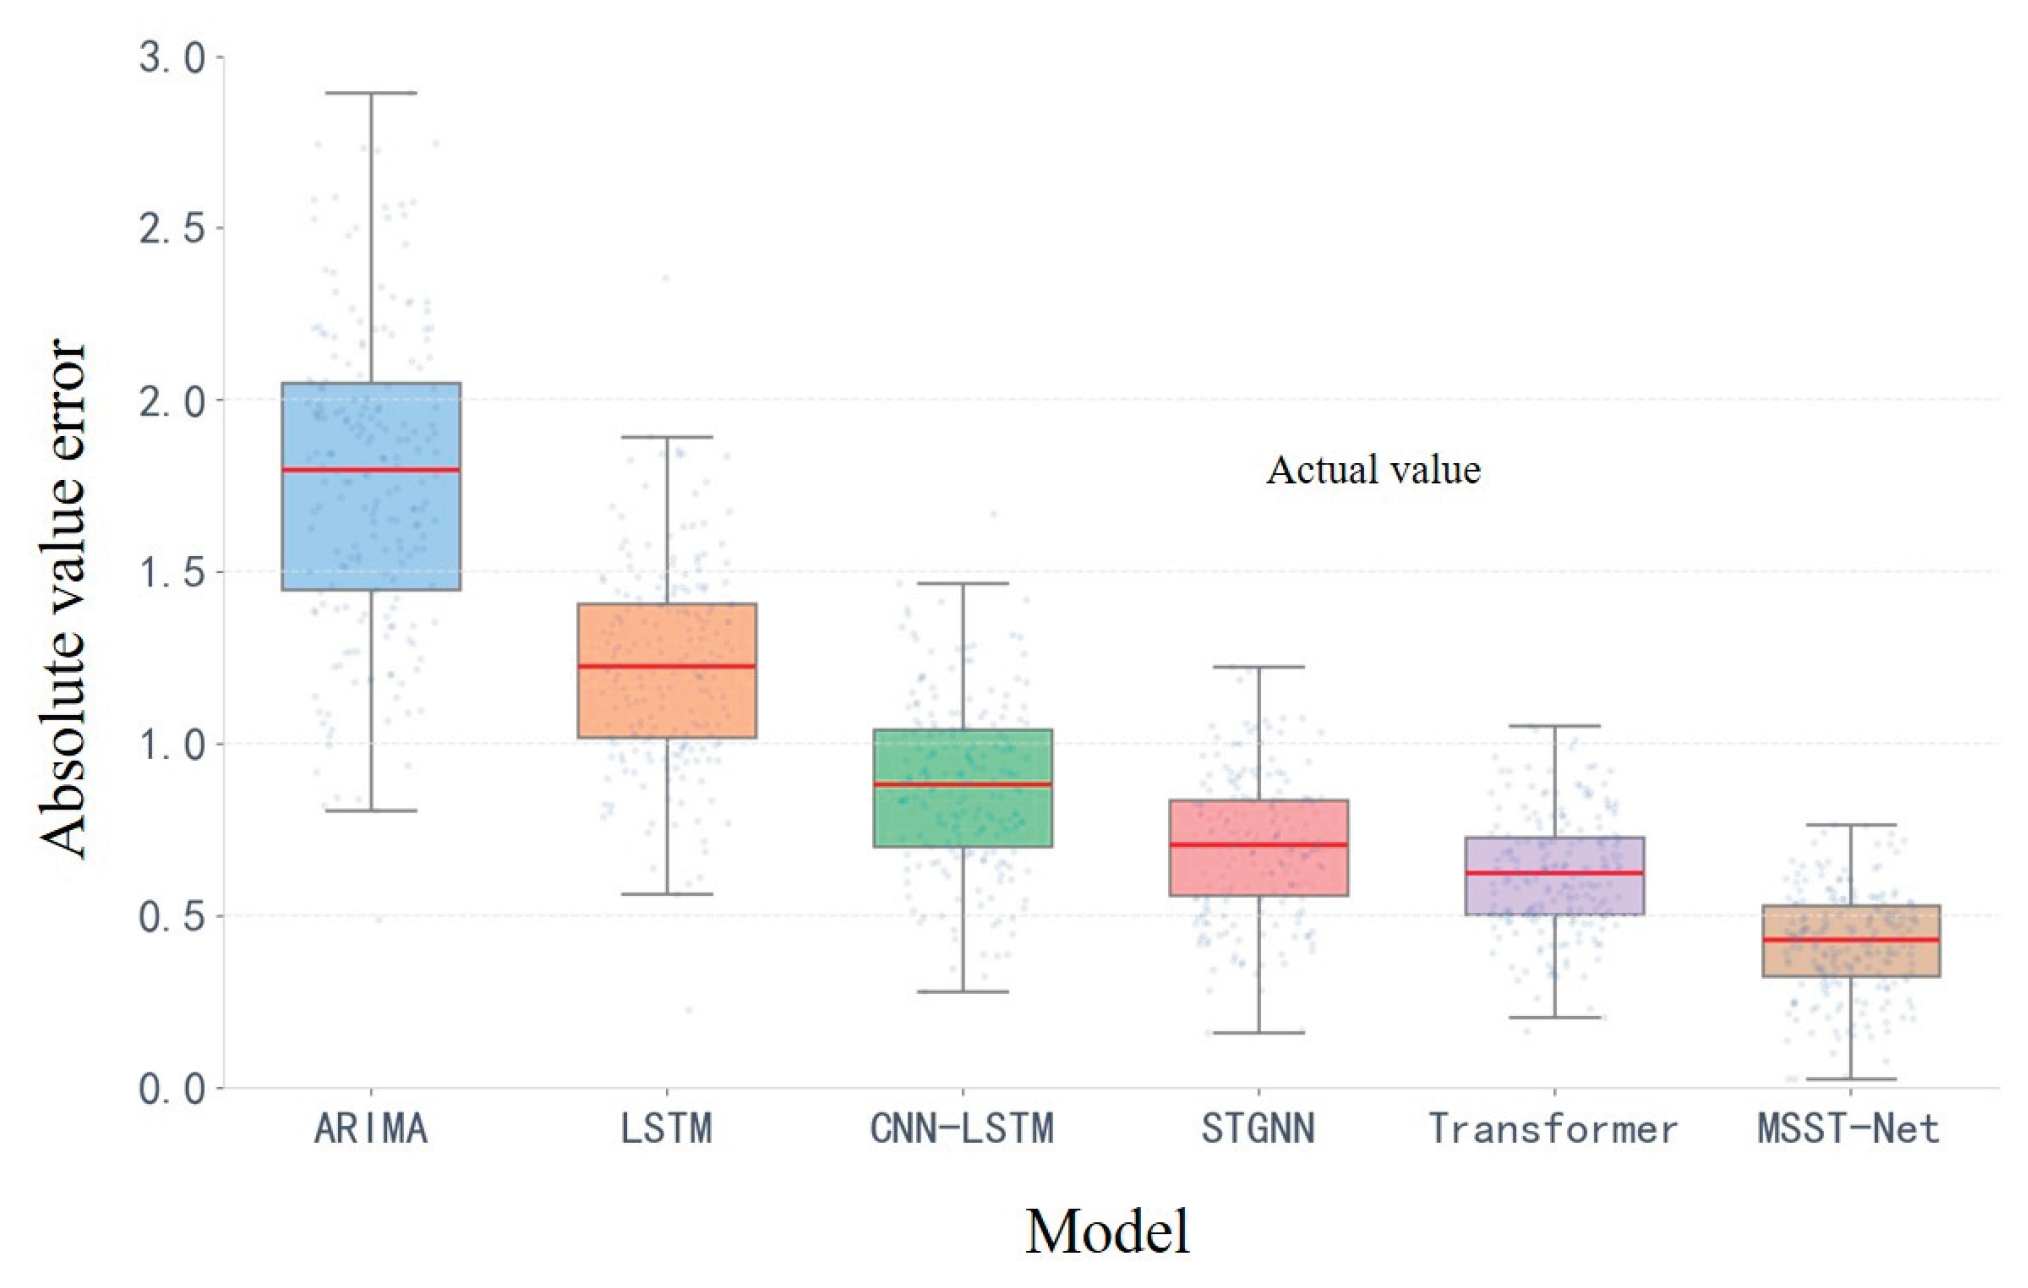

Table 1.
Relationship between absolute value of correlation coefficient and correlation degree.
| Absolute Coefficient Correlation Degree | Absolute Coefficient Correlation Degree |
|---|---|
| (0.8, 1] | Extremely strong |
| (0.6, 0.8] | Strong |
| (0.4, 0.6] | Moderate |
| (0.2, 0.4] | Weak |
| (0, 0.2] | Extremely weak |
Table 2.
Optimal Hyperparameters.
| Parameter | Default Value Before Optimization | Value After SSA Optimization |
|---|---|---|
| Convolution Kernel Combination | {3-1,5-1,7-1} | {3-1,5-2,7-4} |
| Learning Rate | 0.0001 | 3.2×10⁻⁴ |
| Hidden Dimension | 128 | 216 |
| Number of Attention Heads | 8 | 6 |
| Dropout Rate | 0.1 | 0.25 |
Table 3.
Comparison of prediction errors across different models.
| Model | R2 | MAE | RMSE |
|---|---|---|---|
| ARIMA | 0.882 | 2.153 | 2.531 |
| LSTM | 0.874 | 1.786 | 2.456 |
| CNN-LSTM | 0.892 | 1.596 | 1.105 |
| STGNN | 0.902 | 1.215 | 1.102 |
| Transformer | 0.911 | 1.210 | 1.021 |
| MSST-Net | 0.942 | 0.442 | 0.596 |
Disclaimer/Publisher’s Note: The statements, opinions and data contained in all publications are solely those of the individual author(s) and contributor(s) and not of MDPI and/or the editor(s). MDPI and/or the editor(s) disclaim responsibility for any injury to people or property resulting from any ideas, methods, instructions or products referred to in the content. |
© 2025 by the authors. Licensee MDPI, Basel, Switzerland. This article is an open access article distributed under the terms and conditions of the Creative Commons Attribution (CC BY) license (http://creativecommons.org/licenses/by/4.0/).
Copyright: This open access article is published under a Creative Commons CC BY 4.0 license, which permit the free download, distribution, and reuse, provided that the author and preprint are cited in any reuse.


