1. Introduction
Ethiopia, situated in the Horn of Africa, is one of the world’s top 25 biodiversity-rich countries and harbors two global biodiversity hotspots: The Horn of Africa and the Eastern Afromontane (EBI, 2014; Temesgen et al., 2018). Its wide altitudinal range, from 116 m below sea level in the Danakil Depression to 4,620 m at Mount Ras Dashen, coupled with diverse climatic and topographic conditions, supports a rich array of flora and fauna, including high levels of endemism (EBI, 2014). Despite this richness, the country’s biodiversity is under significant threat from multiple factors, including habitat conversion, climate change, overexploitation of natural resources, pollution, demographic pressures, and the introduction of invasive alien plant species (IAPS) (EBI, 2014; Shiferaw, 2018). These threats endanger ecosystem health and diminish ecosystem services, like water regulation, soil fertility, carbon sequestration, and livelihoods that depend on natural resources.
Invasive alien plants are increasingly recognized globally as major drivers of biodiversity loss, ecosystem degradation, and socio-economic disruption (Wakshum et al., 2018; Shonga, 2014). Once established outside their native ranges, invasive plants can rapidly colonize new habitats, outcompete native species for resources, and alter ecosystem processes such as nutrient cycling, hydrology, and fire regimes (Kuma, et al., 2021). Human activities, including trade, transport, migration, and modern agricultural expansion, have accelerated the introduction and spread of invasive plants, allowing them to overcome natural barriers and invade diverse ecosystems, from rangelands and agricultural areas to wetlands and urban environments (Rai, 2015; Kueffer, 2017; Rai et al., 2020). In Ethiopia, invasive species such as Parthenium hysterophorus, Cryptostegia grandiflora, Prosopis juliflora, and Lantana camara are increasingly affecting biodiversity, ecosystem services, and human livelihoods (Belayneh et al., 2016; Shiferaw, 2018).
Cryptostegia grandiflora, commonly known as rubber vine, is an aggressive woody climbing shrub capable of growing over trees up to 30 m high, and is common in disturbed areas where temporary or permanent water is available, such as along gullies, rivers, creeks, and waterholes (Global Invasive Species Database, 2018; PIER, 2003). In Ethiopia, it is regarded as one of the most problematic invasive plant species, with extensive distribution in regions such as East Shewa and Afar (Tesfaye et al., 2019). Cryptostegia grandiflora poses increasing ecological and socio-economic risks. The species exhibits rapid growth, prolific seed production, remarkable tolerance to diverse environmental conditions, and the ability to establish in a variety of disturbed and natural habitats (Joylynn and Elizabeth, 2008). These traits allow Cryptostegia grandiflora to dominate invaded landscapes, suppress native vegetation, alter ecosystem functions, and reduce pasture productivity, posing significant ecological and economic challenges.
Climate change is expected to exacerbate the impacts of Cryptostegia grandiflora by creating more favorable conditions for its establishment, growth, and dispersal, potentially facilitating its expansion into previously uninvaded areas (Kriticos, et al., 2003). Understanding its current and future distribution is critical for designing effective prevention, monitoring, and control strategies (Beaury et al., 2020; Thamaga and Dube, 2019). In particular, knowledge of high-risk areas and the environmental factors driving their distribution will allow resource managers to prioritize interventions and allocate efforts where they are most needed, ultimately protecting native biodiversity and ecosystem services (EBI, 2014; Temesgen et al., 2018).
Species distribution models (SDMs) provide an efficient means of modeling species’ geographic ranges, enabling early detection before widespread establishment in new areas (Ruiz-Navarro et al., 2016; Rathore et al., 2019). By integrating species occurrence records with environmental predictors such as temperature, precipitation, soil type, elevation, and land use, SDMs generate spatially explicit predictions of suitable habitats and invasion risk, enabling early detection and informed management interventions. Ecological niche modeling (ENM), a specialized form of SDMs, identifies the environmental conditions that define a species’ niche and projects its current and future potential distribution under changing climate scenarios (Araújo and New, 2007). For invasive species such as Cryptostegia grandiflora, these tools can guide monitoring, control, and restoration efforts. However, in Ethiopia, only limited SDM/ENM-based assessments have been conducted for Cryptostegia grandiflora, and the environmental factors shaping its potential distribution remain insufficiently understood. This lack of comprehensive predictive information restricts early intervention and reduces the effectiveness of management planning. Therefore, this study aims to address these knowledge gaps by: (1) assessing the current and projected future climate suitability and potential distribution of Cryptostegia grandiflora in Ethiopia under different climate change scenarios, and (2) identifying potential habitat shifts and invasion risks to guide strategic management and mitigation efforts. By providing spatially explicit predictions and identifying environmental drivers of invasion, this research contributes to informed decision-making to protect native biodiversity and ecosystem services from the threats posed by this highly invasive species.
2. Research Methods and Design
2.1. Study Site Description
The study was conducted in Ethiopia, a landlocked country in the Horn of Africa, situated between 3°–15° N and 33°–48° E (FAO, 2003). It is bordered by Kenya to the south, Djibouti and Somalia to the east, Eritrea to the north, Sudan to the northwest, and South Sudan to the west. Ethiopia covers approximately 1.12–1.14 million km² and has an estimated population of 126.5 million as of 2023, with over 85% residing in rural areas and relying heavily on natural resources for agriculture, livelihoods, and food security (World Bank, 2023; USAID, 2008). The landscape is dominated by extensive highlands and plateaus divided by the Great Rift Valley, with altitudes ranging from 116 meters below sea level in the Danakil Depression to 4,620 meters above sea level at Mount Ras Dashen. This topographic variation creates diverse macro- and micro-climatic conditions that support Ethiopia’s exceptional biodiversity and high levels of endemism. Rainfall varies from approximately 250 mm in lowland regions (<1,500 m) to over 2,200 mm in highlands (>1,500 m), and temperatures range from near freezing in high-altitude areas to 50 °C in lowland Qola zones. The country’s ecosystems include equatorial rainforests in the southwest, Afro-alpine vegetation on high mountains, and arid to semi-arid lowlands in the east and northeast (World Bank, 2021).
2.2. Cryptostegia grandiflora Occurrence Data
Occurrence records of
Cryptostegia grandiflora were obtained from the Global Biodiversity Information Facility (GBIF;
www.gbif.org). Records with duplicates or missing coordinates were removed, and the resulting dataset was used for species distribution modeling. Following Eckert
et al. (2020), locations closer than 10 km to other presence points were removed to reduce spatial autocorrelation and avoid the influence of erroneous absences. For species distribution modeling (SDM), geographic independence of occurrence data is essential, as spatial clustering can bias model calibration and evaluation. Such clustering may lead to overfitting, reduced predictive performance for spatially independent data, and artificially inflated model performance metrics (Boria
et al., 2014; Brown
et al., 2017). Therefore, only spatially filtered, independent occurrence points were used to generate robust predictions of the current and potential distribution of
Cryptostegia grandiflora under present and future climate scenarios.
2.3. Predictor Bioclimatic Variables
To ensure robust modeling of the potential distribution of
Cryptostegia grandiflora, predictor variables were carefully selected based on the species’ environmental niche and ecological requirements. A total of 19 bioclimatic variables were initially obtained from WorldClim version 2 (
http://worldclim.org/version2) at a 30-arc-second resolution, representing current climatic conditions (
Table 1).
Future climate projections were derived from three downscaled global climate models (GCMs) from the Coupled Model Intercomparison Project Phase 6 (CMIP6): The Hadley Centre Global Environmental Model 3.1 (HadGEM3-GC31-LL), the Goddard Institute for Space Studies Model E2.1-H (GISS-E2-1-H), and the Euro-Mediterranean Centre on Climate Change Earth System Model 2 (CMCC-ESM2). These GCMs were selected due to their demonstrated performance in the Ethiopian environment and their climatic dissimilarity, which reduces interdependence among model predictions. Two shared socio-economic pathway (SSP) scenarios, SSP2-4.5 and SSP5-8.5, were used to assess future climate suitability, representing projected global temperature increases of approximately 2.4 °C and 4.9 °C above pre-industrial levels by 2100, respectively, with corresponding atmospheric CO₂ concentrations of 650 and 1370 ppm (Christensen et al. 2007; Moss et al. 2010; Rogelj et al. 2012).
The selection of bioclimatic variables for modeling was based on three criteria: biological significance for Cryptostegia grandiflora establishment and invasion, statistical significance in predicting species occurrence, and minimal collinearity among predictors. To reduce redundancy and assess collinearity, Variance Inflation Factors (VIFs) were calculated for all 19 variables. Variables exceeding a predefined VIF threshold were excluded through a stepwise procedure. The excluded variables were: Bio1 (Annual Mean Temperature), Bio3 (Isothermality), Bio5 (Max Temperature of Warmest Month), Bio6 (Min Temperature of Coldest Month), Bio8 (Mean temperature of wettest quarter), Bio10 (Mean Temperature of Warmest Quarter), Bio11 (Mean Temperature of Coldest Quarter), Bio12 (Annual precipitation), Bio13 (Precipitation of Wettest Month), Bio16 (Precipitation of Wettest Quarter), and Bio17 (Precipitation of Driest Quarter). Consequently, eight bioclimatic variables were included in the final model for mapping the distribution of Cryptostegia grandiflora using R statistical software.
2.4. Modeling Species Distribution and Evaluation of Model Performance
Several methods are available for fitting species distribution models (SDMs), differing in their ability to predict species distributions and identify important environmental predictors (Hernández, 2018; Kosicki, 2020; Valavi
et al., 2021). To improve prediction accuracy, an ensemble approach combining multiple algorithms is recommended, as a single model may not provide optimal performance (Araújo and New, 2007). In this study, three modeling techniques were evaluated: Maximum Entropy (MaxEnt), Generalized Linear Models (GLMs), and Random Forest (RF) (
Table 2)
The ensemble model was constructed using the simple average consensus method to minimize uncertainty in species distribution projections. One ensemble model was selected from the weighted averages of the best-performing individual models. Model predictive performance was assessed using both bootstrap and subsampling replication procedures (Naimi and Araújo, 2016), as ensemble forecasting reduces uncertainty associated with individual models (Araújo and New, 2007). Presence and pseudo-absence data were randomly split into training (70%) and testing (30%) datasets for model calibration and validation, respectively (Araújo and New, 2007). Habitat suitability was categorized into three classes: highly suitable, moderately suitable, and non-suitable areas under two future climate scenarios (SSP2-4.5 and SSP5-8.5). Model performance was evaluated using the area under the curve (AUC) of the receiver operating characteristic (ROC), the true skill statistic (TSS), and the deviance statistic (Phillips et al., 2006). AUC values range from 0 to 1, with >0.9 indicating excellent performance, 0.7–0.9 moderate performance, 0.5–0.7 low performance, and 0.5 indicating no better than random prediction (Elith et al., 2006). TSS values range from −1 to +1, where +1 indicates perfect agreement between predictions and observations, 0 or lower indicates random prediction. TSS data were interpreted using the following ranges: 0.4 was a poor value, 0.4–0.8 was helpful, and >0.8 was good to excellent (Zhang et al., 2015; Allouche et al., 2006). All analyses, including species distribution modeling and performance evaluation, were performed using the SDM package in R statistical software v.4.2.2.
2.5. Change Detection
To assess the effect of future climate change on the potential distribution of
Cryptostegia grandiflora, habitat suitability changes between current and future climate conditions under two scenarios (SSP2-4.5 and SSP5-8.5) were evaluated. Habitat suitability was classified into three categories: (a) highly suitable, (b) moderately suitable, and (c) non-suitable. Changes in suitable habitat were assessed by quantifying spatial gain, loss, and changes in the distribution for each suitability class. The raster-based analyses were conducted in R using raster, rgdal, and geosphere packages. The extent of change was determined by computing current and future suitable habitat areas, and two metrics were derived: the percentage change in non-suitable areas, and the percentage of lost and gained habitat by 2040 and 2060 (Simberloff
et al., 2013; Bellard
et al., 2018). Changes in suitability were expressed using the following index (Sintayehu
et al., 2020).
where SCH represents suitable area change, FSA = future suitable area, and CSA = current suitable area. Positive SCH values indicate habitat gains, whereas negative values indicate habitat losses.
Where, VCH = vulnerability changes, FSA = future suitable area, and CSA = current suitable area
3. Results
3.1. Model Performance
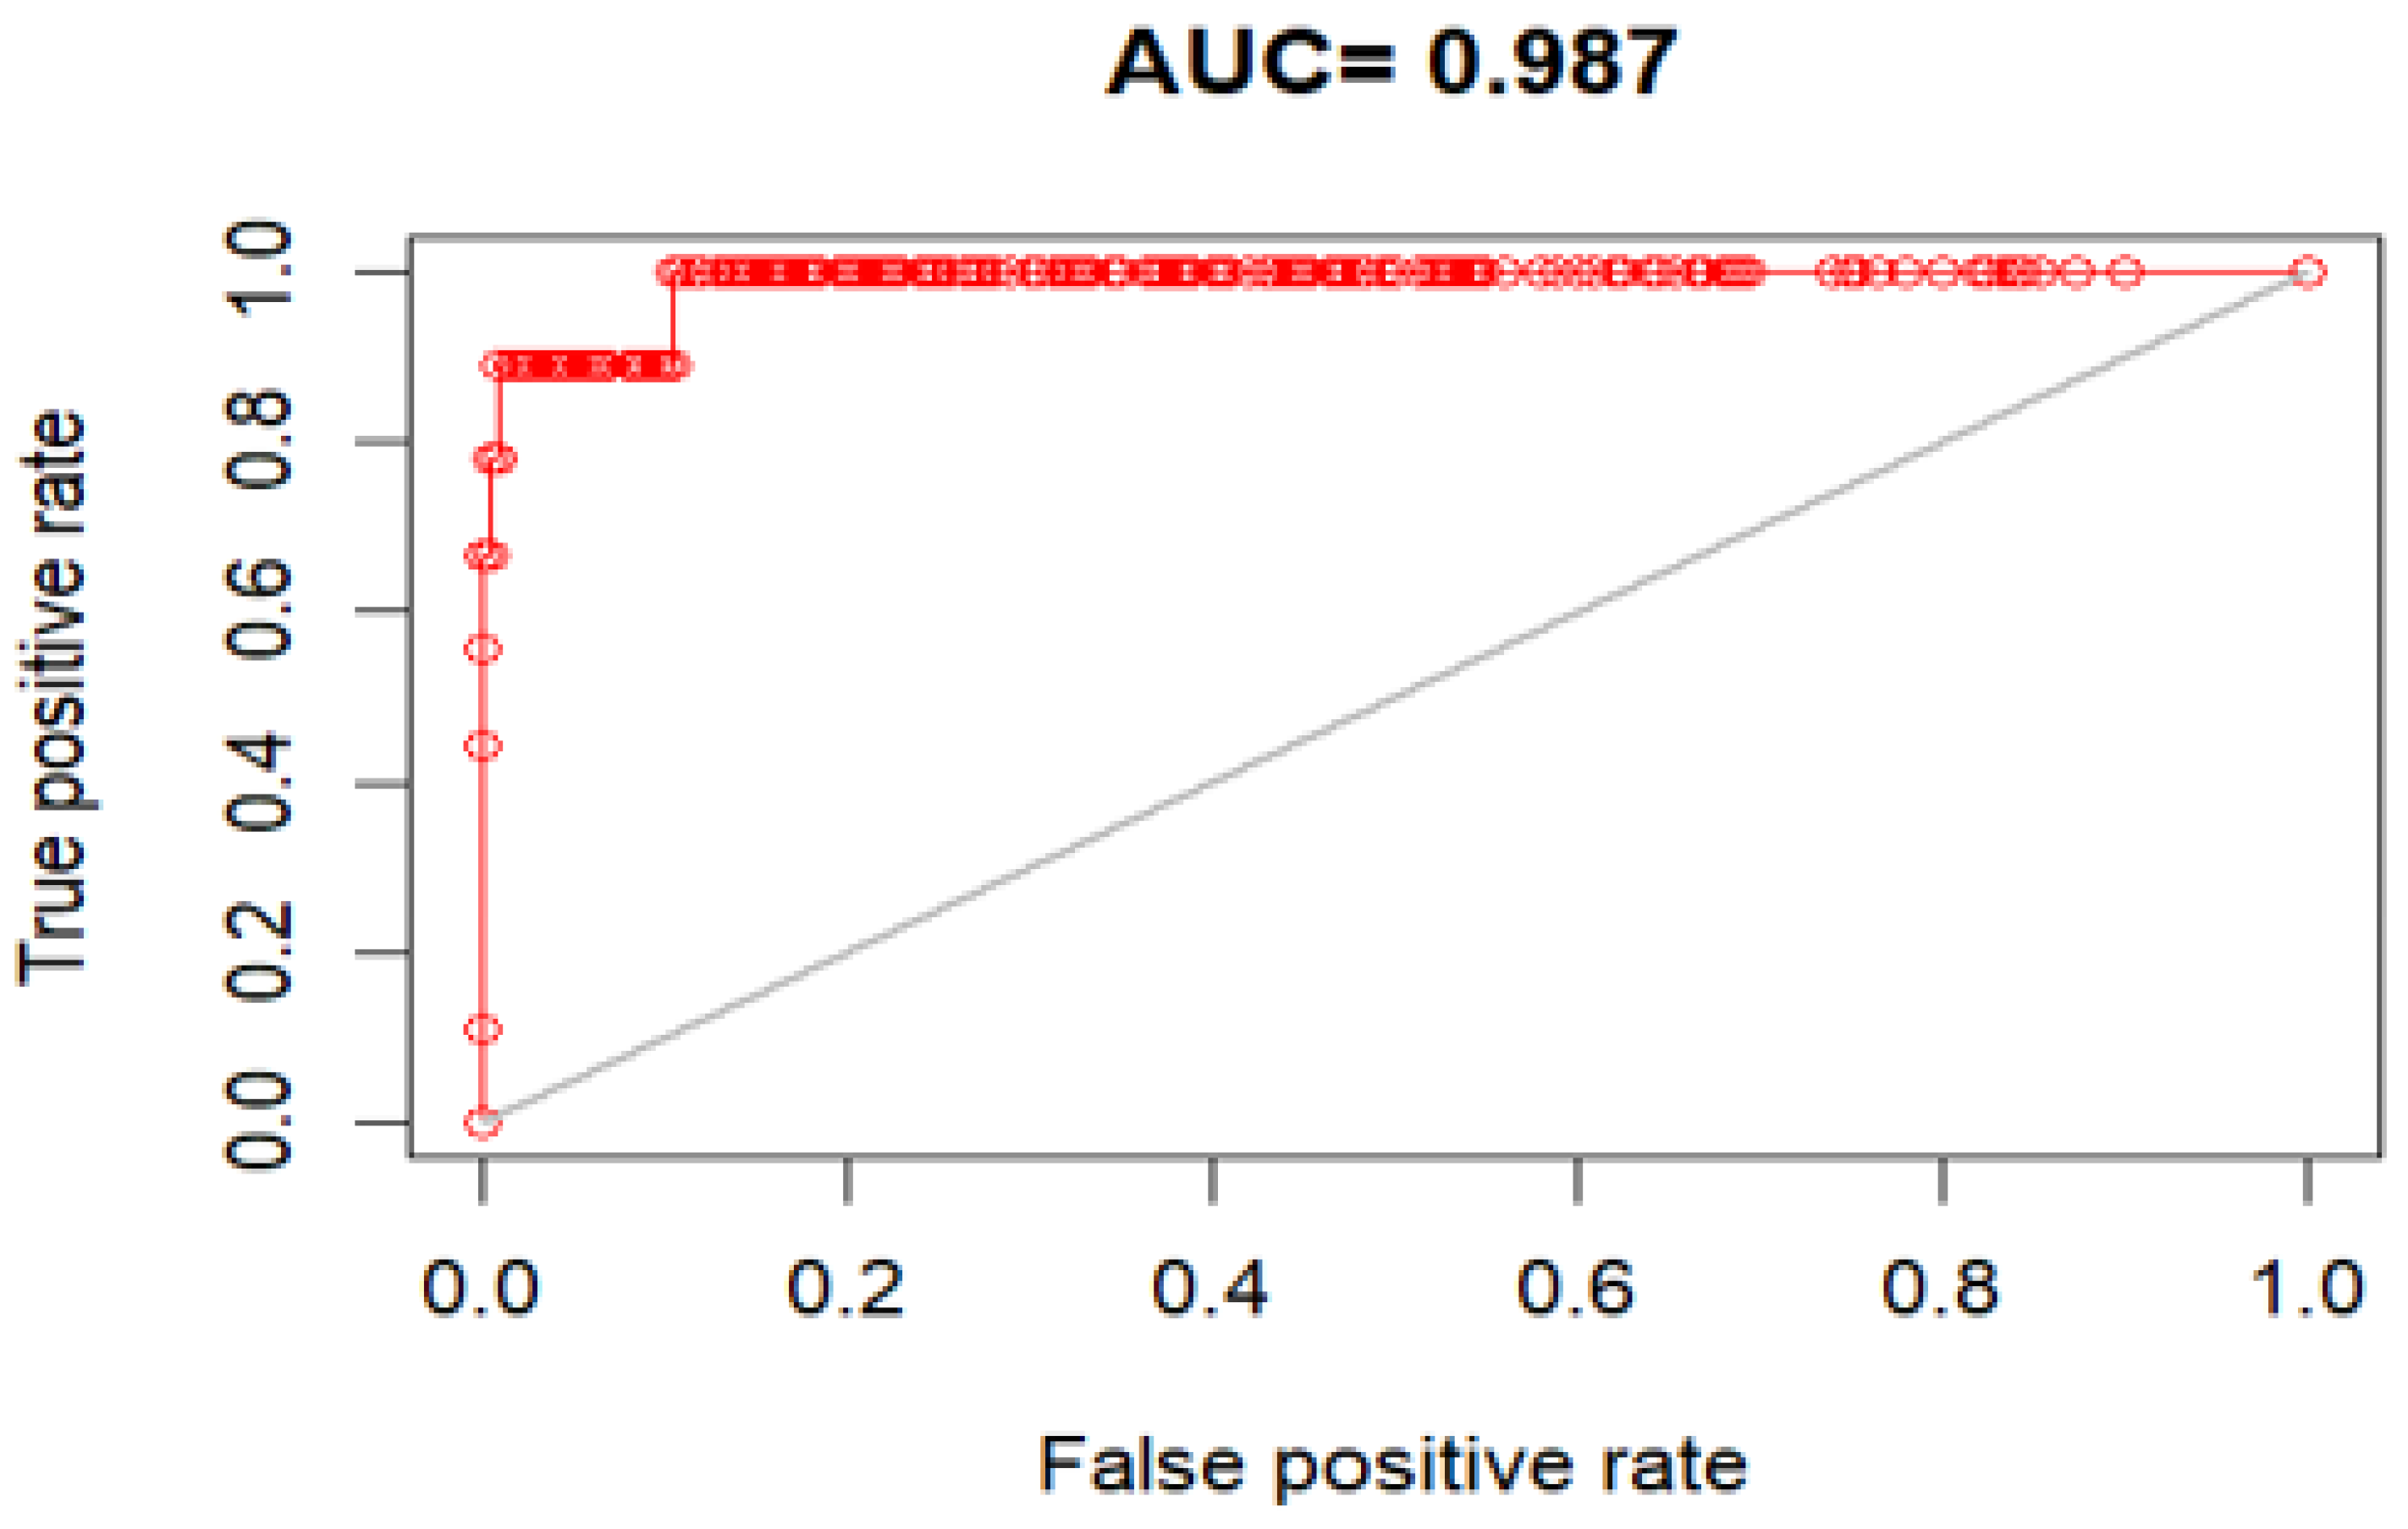
The predictive performance of the species distribution models (SDMs) for
Cryptostegia grandiflora, assessed using the Area Under the Curve (AUC), True Skill Statistic (TSS), and deviance statistic, demonstrated excellent predictive ability. The overall mean AUC was 0.96, with values of 0.98 for RF, 0.97 for MaxEnt, and 0.93 for GLM (
Table 1,
Figure 1).
TSS values also indicated high model performance, with a mean of 0.88, reflecting a perfect agreement between predictions and observations. GLM achieved a TSS of 0.83, RF and MaxEnt reached 0.89 and 0.92, respectively. Deviance values were similarly low across all models, with RF showing the best fit (0.12), followed by MaxEnt (0.13) and GLM (0.21). GLM showed relatively lower predictive performance (TSS = 0.83), whereas RF (TSS = 0.89) and MAXENT (TSS = 0.92) achieved the highest accuracy (
Table 1). Consequently, the ensemble model used for the final projections was constructed using these three best-performing algorithms.
3.2. Variable Importance Analysis
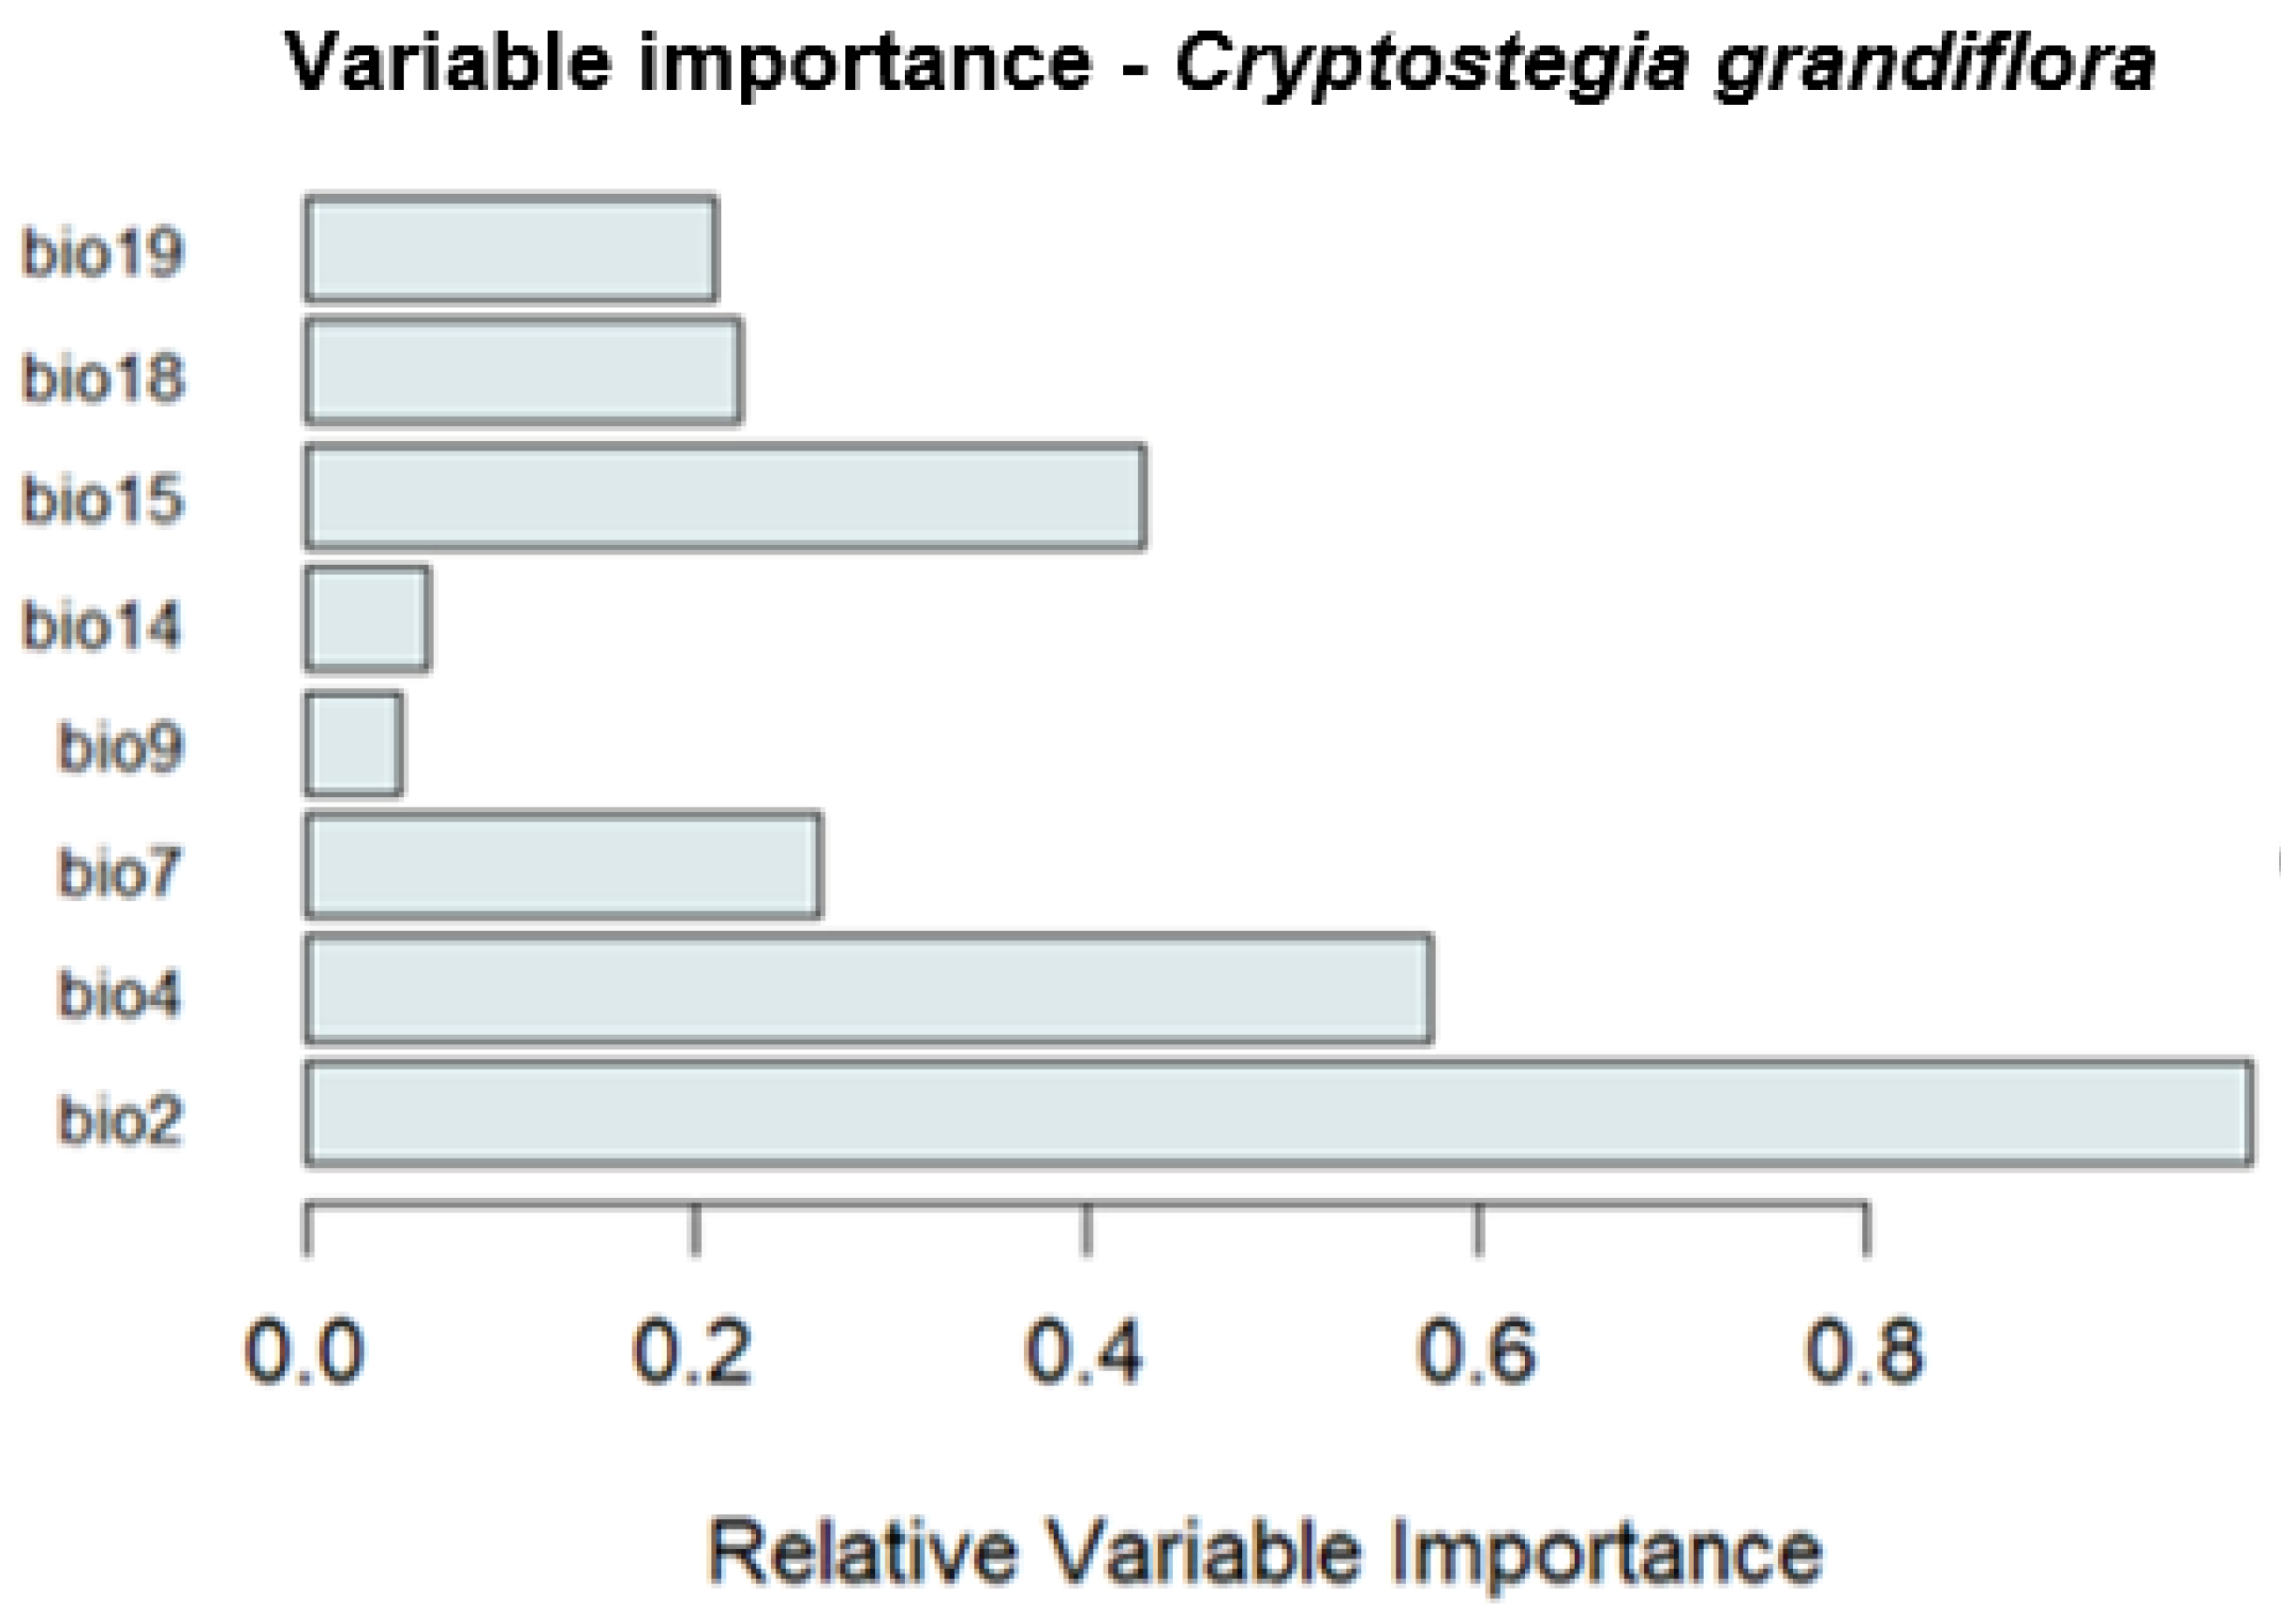
Variable importance analysis revealed that Mean diurnal temperature range (Bio2) was the most influential predictor shaping the potential distribution of
Cryptostegia grandiflora, followed by temperature seasonality (Bio4) and precipitation seasonality (Bio15) (
Figure 2). Conversely, mean temperature of the driest quarter (Bio9) and precipitation of the driest month (Bio14), had the least influence on the model, suggesting a limited role in determining the species’ suitable habitats. Other environmental variables showed comparatively minor influence on determining the species’ basic ecological niche (
Figure 2).
3.3. Current Distributions of Cryptostegia Grandiflora
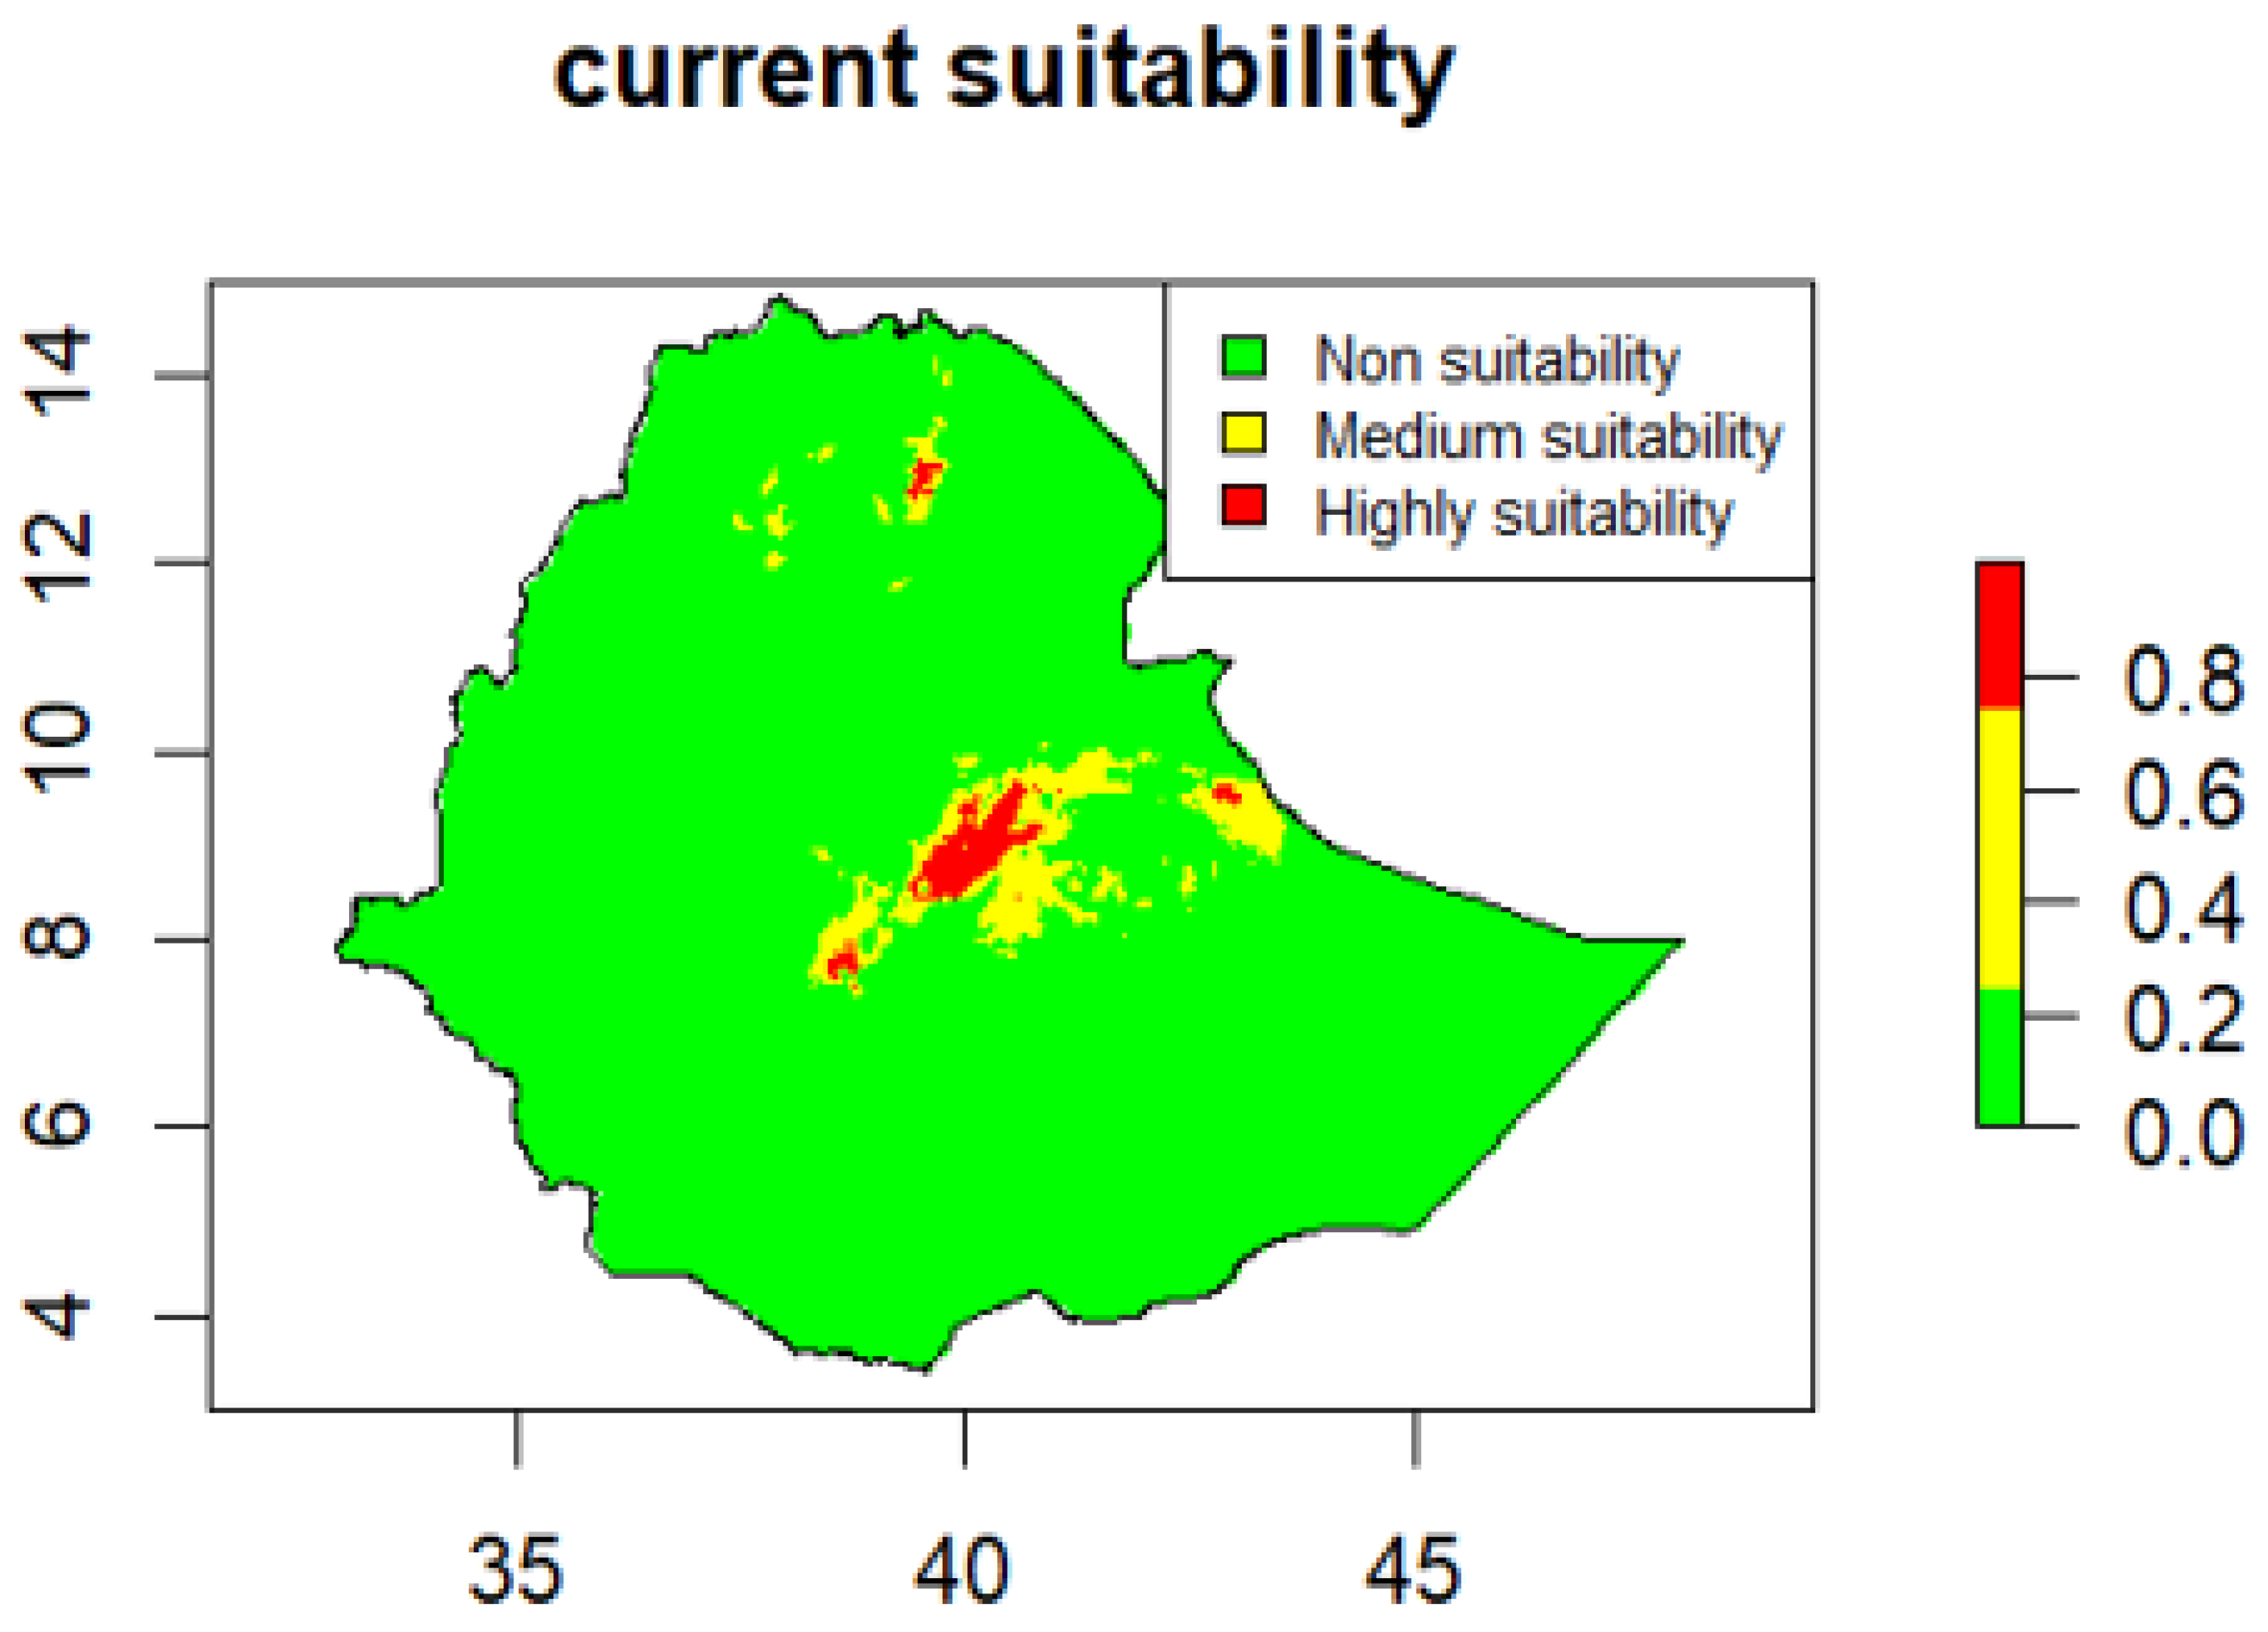
According to model projections, the vast majority of Ethiopia is climatically unsuitable for
Cryptostegia grandiflora, accounting for 98.04% of the total land area. Only small and spatially fragmented areas are classified as moderately suitable (1.76%) or highly suitable (0.20%) (
Table 3).
Under current climatic conditions, suitable habitats for
Cryptostegia grandiflora are highly spatially restricted and are concentrated mainly in central Ethiopia, particularly within the central Highland-Rift Valley transition zone (
Figure 3). Moderate to high suitability is observed in central Oromia, especially in East Shewa, extending southward into West Arsi. Smaller, isolated patches of suitability occur in northern Arsi and parts of the Addis Ababa–Shewa highlands, as well as in the northern highlands, notably southern Tigray. Eastern Ethiopia exhibits moderate suitability, largely confined to eastern Oromia (East Hararghe) and marginal areas adjacent to Harari. In addition, small, localized pockets of moderate suitability are identified in northeastern Amhara. In contrast, most lowland and arid regions, including Afar, the Somali Region, and the southern lowlands, show low suitability under current climatic conditions. Western Ethiopia, encompassing Benishangul-Gumuz and Gambela, along with much of western and Southern Oromia, also displays no suitable habitat for
Cryptostegia grandiflora (
Figure 3).
3.3. Future Predicted Distributions of Cryptostegia Grandiflora
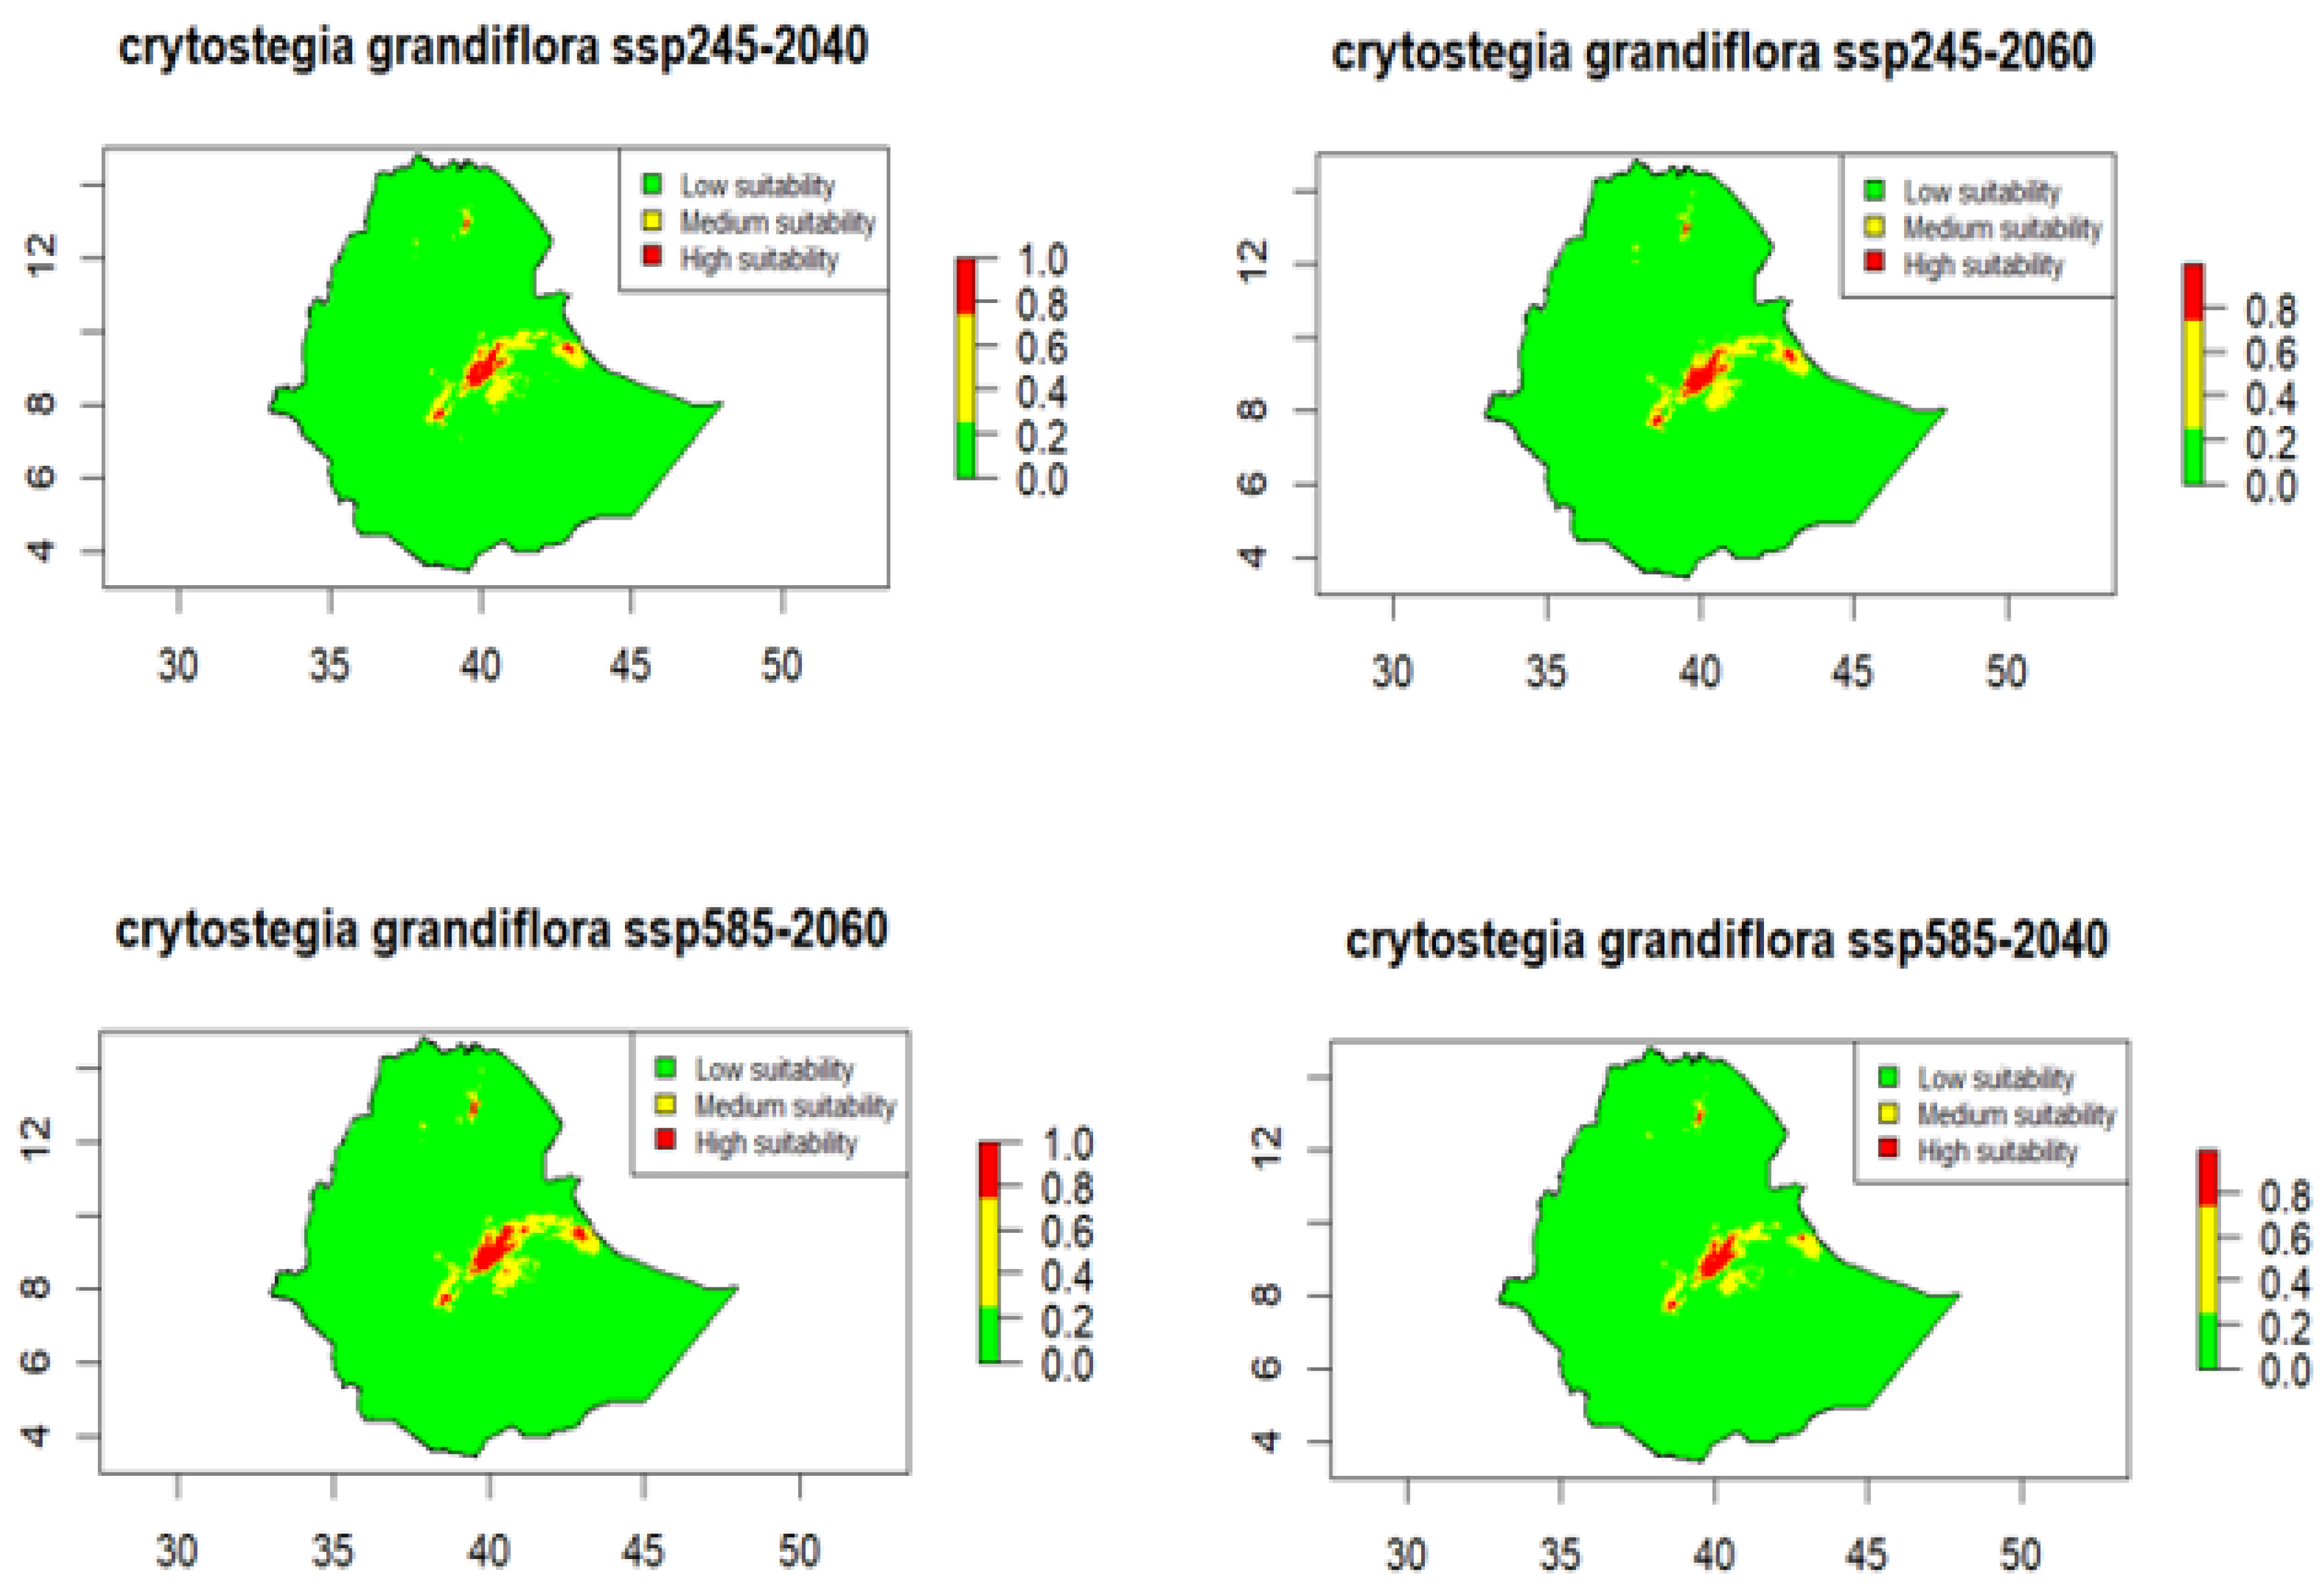
The projected suitability maps for
Cryptostegia grandiflora under SSP2-4.5 and SSP5-8.5 for 2040 and 2060 reveal consistent patterns, indicating a potential range expansion while most of Ethiopia remains within the low-suitability category (
Figure 4). Areas of high suitability are concentrated in eastern and central Ethiopia (
Figure 4). In eastern Ethiopia, these occur mainly in eastern Oromia (East and parts of West Hararghe) and marginally in the Harari Region, with smaller patches in western Somali zones. In central Ethiopia, high-suitability cores are along the Main Ethiopian Rift-East Shewa extending southward into the West and northern Arsi Zone. Small, isolated high-suitability patches also appear in southern Tigray and central Afar. Moderate-suitability areas generally surround the high-suitability cores, extending into adjacent parts of eastern Oromia, western Somali, and central Afar. Most of Ethiopia remains unsuitable habitat for the species, including Benishangul-Gumuz, Gambela, much of western and southwestern Oromia, the Borena and Guji lowlands, the northern and northwestern Amhara highlands, and the majority of southern lowlands (
Figure 4).
By 2040, the area of highly suitable habitat is projected to increase substantially relative to current conditions, rising by 162.0% under SSP2-4.5 and by 131.2% under SSP5-8.5 (
Table 4). During the same period, moderately suitable areas expand by 21.3% and 12.0% under SSP2-4.5 and SSP5-8.5, respectively, while unsuitable areas decline by 45.6% and 45.8%. By 2060, these trends will intensify further: highly suitable habitat increases by 232.3% under SSP2-4.5 and 226.6% under SSP5-8.5. Moderate suitability continues to increase by 21.4% under SSP2-4.5 and by 37.0% under SSP5-8.5, and unsuitable areas decrease by 46.2% and 46.5% under SSP2-4.5 and SSP5-8.5, respectively (
Table 4).
According to the model predictions,
Cryptostegia grandiflora shows a high potential for expansion into areas that are currently unsuitable. By 2040, the area of highly suitable habitat is projected to increase by 61.8% and 56.8% under the SSP2-4.5 and SSP5-8.5 climate scenarios, respectively, while moderate suitability areas also show increases of 17.6% and 10.7%. By 2060, highly suitable habitats will further increase by 69.9% (SSP2-4.5) and 69.4% (SSP5-8.5)
, with moderate suitability rising by 17.6% and 27.0%
, respectively. Concurrently, areas currently classified as not suitable for
Cryptostegia grandiflora decrease by 83.7% (SSP2-4.5) and 84.6% (SSP5-8.5) by 2040 relative to current conditions. This decline becomes more pronounced by 2060, with reductions of 85.9% under SSP2-4.5 and 86.8% under SSP5-8.5
, indicating a progressive shift of previously unsuitable areas toward moderate and high suitability over time (
Table 5).
4. Discussion
4.1. Effects of Climatic Variables on the Spatial Distribution of Cryptostegia Grandiflora
Variable importance analysis revealed that mean diurnal temperature range (Bio2), temperature seasonality (Bio4), and precipitation seasonality (Bio15) were the most influential predictors shaping the potential distribution of Cryptostegia grandiflora. These findings suggest that the species’ occurrence is highly sensitive to seasonal and daily temperature fluctuations, as well as the timing and variability of rainfall. Moderate daily temperature ranges and pronounced seasonal variability provide favorable conditions for physiological processes such as growth, flowering, and seed production, while precipitation seasonality generates intermittent moisture pulses that facilitate establishment in semi-moist and disturbed habitats (Zhang et al., 2018; Zeppel et al., 2014). Conversely, variables such as mean temperature of the driest quarter (Bio9) and precipitation of the driest month (Bio14) had relatively minor influence, indicating that Cryptostegia grandiflora can tolerate temporary drought periods if other conditions, such as soil moisture and thermal regimes, remain suitable.
The ecological preferences of Cryptostegia grandiflora align with these patterns. The species predominantly occurs in warm, frost-free to mildly seasonal climates, often establishing in riparian corridors, disturbed sites, and pasture margins. It thrives at low to mid-elevations (approximately 500–1,800 m.a.s.l.), where moderate temperatures and manageable seasonal variations coincide with the key predictors (Bio2, Bio4, Bio15). Its tolerance of diverse soil types, as long as moisture is available, allows it to colonize degraded rangelands, floodplains, and semi-natural pasturelands, contributing to the concentration of high suitability areas in central and southeastern Ethiopia. These ecological patterns are consistent with findings from Luizza et al. (2014), which showed that seasonal rainfall and proximity to water sources strongly influenced Cryptostegia grandiflora occurrence in arid regions of Ethiopia’s Afar. These indicate that climatic variability coupled with localized moisture availability can create corridors for rapid growth, prolific seed production, and high dispersal capacity, enabling invasive vines to expand into new habitats and densify existing populations. In addition to environmental variables, the spread of Cryptostegia grandiflora is further shaped by biotic interactions, land-use practices, and anthropogenic disturbances, all of which are known to exacerbate invasion dynamics (Zeleke et al., 2017; Sintayehu et al., 2020; Gebretsadik et al., 2013).
4.2. Suitable Habitat for Cryptostegia Grandiflora in the Current Climate Conditions
The modeling result indicates that Cryptostegia grandiflora currently occupies only a limited climatic niche in Ethiopia. Suitability is not broadly distributed but instead reflects strong environmental filtering, with the species confined to ecologically intermediate zones where climatic conditions fall within its physiological tolerance limits. This pattern indicates that Cryptostegia grandiflora tends to avoid climatic extremes, prolonged drought, extreme heat, and frost, which limit its establishment in both very hot, arid lowlands and cooler, wetter highlands, consistent with its known ecological tolerances. The species exhibits its highest climatic suitability in subtropical transition zones characterized by moderate temperatures, seasonal rainfall, and high climatic variability. These conditions provide sufficient seasonal moisture and favorable thermal regimes to support establishment and growth, while remaining within the species’ tolerance limits. Such climatic requirements align with observations from other relevant studies, where Cryptostegia grandiflora is most successful in seasonally dry, moderately warm environments and is constrained by environmental extremes (Parsons and Cuthbertson, 1992; Mackey, 1996).
This study demonstrated that the establishment and spread of Cryptostegia grandiflora would be greatly affected by climate change, with limited suitable areas in Ethiopia. However, according to Kriticos et al. (2003), once established, the species can form dense stands in localized areas, suppressing native vegetation and altering community structure. Invasion by this species has become a major driver of biodiversity loss in the affected regions, with many important plant species declining due to both competition and habitat degradation (Tesfaye et al., 2019). These results highlight that while the current climatic niche is restricted, the species’ ecological flexibility and resilience to extreme environmental conditions, such as drought, heat, and soil salinity, make even small suitable patches vulnerable to dense colonization and local ecosystem impact.
4.3. Projection of Suitable Habitat for Cryptostegia Grandiflora in The Future Climate Change Under Four Representative Concentration Pathways
Invasive species such as Cryptostegia grandiflora are highly adaptable, capable of withstanding a wide range of environmental conditions and rapidly adjusting to new climatic regimes, allowing their ecological niche to expand beyond historical limits (Hellmann et al., 2008). The Ensemble Model projections in this study indicate that future climate conditions will increasingly favor Cryptostegia grandiflora in central and southeastern Ethiopia, forming a stable central–eastern belt of high suitability by 2040 and 2060. Its ecological traits, including the ability to thrive in warm, frost-free to mildly seasonal climates, colonize riparian corridors, disturbed sites, and pasture margins, and tolerate diverse soils when moisture is sufficient, reinforce this expansion. Disturbance-driven landscapes, common across rangelands and agricultural frontiers, provide additional pathways for establishment and spread, further supporting the projected expansion under both SSP2-4.5 and SSP5-8.5 climate scenarios
The projections also indicate a gradual expansion of suitable habitats into areas currently considered marginal or unsuitable, signaling broader ecological concerns. As climate change alters temperature and rainfall regimes, native vegetation communities may experience increased stress, reducing their competitive ability against highly adaptable invaders like Cryptostegia grandiflora. This pattern aligns with previous findings that climate change disproportionately favors invasive species, accelerating their spread in regions undergoing ecological transition (Hellmann et al., 2008; Podda et al., 2017). In Ethiopia, where land degradation, overgrazing, and shifting rainfall patterns already exert pressure on ecosystems, the additional stress imposed by an expanding invasive species could intensify ecosystem instability and biodiversity loss.
The predicted increase in areas classified as highly suitable for Cryptostegia grandiflora has critical implications for rangelands, pastoral ecosystems, and agricultural zones. This species is among the most problematic weeds due to its invasiveness, rapid spread, and significant economic and ecological impacts (Zeleke et al., 2017). Dense infestations can replace productive native species, reducing the availability of grazing resources, while their toxicity poses direct risks to livestock. Field observations from already invaded districts indicate that Cryptostegia grandiflora can smother native shrubs and grasses, hinder livestock movement, reduce forage availability, and alter habitat structure for wildlife (Tesfaye et al., 2019). If suitability continues to expand toward major pastoral regions, the resulting decline in grazing resources may heighten livelihood vulnerability among communities that depend on livestock production. Similar outcomes have been documented in other areas, where invasive species have reduced rangeland carrying capacity and contributed to local resource conflicts (Sintayehu et al., 2020; Gebretsadik et al., 2013). These patterns indicate that highly adaptable invasive species can exploit expanding suitable habitats under changing climates, amplifying ecological degradation and socio-economic challenges in affected regions.
4.4. Management Implications for Cryptostegia Grandiflora
The habitat suitability maps and future projections indicate that Cryptostegia grandiflora is currently confined to a limited number of environmentally favorable areas in Ethiopia, with suitability remaining spatially concentrated rather than widespread. However, model projections show an expansion in the extent and intensity of suitability within these same climatic zones under future climate scenarios, increasing the likelihood of population growth and local spread. These patterns suggest that riparian zones, disturbed landscapes, and highland–lowland transition areas represent key environments where monitoring and early management would be most effective in limiting establishment before dense infestations develop.
Climate-informed habitat suitability mapping provides a valuable tool for identifying current and future invasion hotspots. Integrating model projections with systematic field surveys can improve early detection and allow rapid response before populations reach high-density stands. Once woody invasive species such as Cryptostegia grandiflora become well established, control measures become increasingly costly, labor-intensive, and ecologically disruptive, underscoring the importance of prevention and early containment. The species’ ecological traits, combined with the projected expansion of climatically suitable habitats under future climate scenarios, indicate that climate change is likely to further enhance its invasion potential. Regions projected to experience increasing suitability should be targeted for long-term monitoring, adaptive management, and policy attention. In pastoral and rangeland systems, early management is particularly critical, as dense infestations can reduce forage availability, restrict livestock movement, and threaten local livelihoods.
Effective management of Cryptostegia Grandiflora requires an integrated approach that combines scientific forecasting, land-use planning, and community engagement. Raising awareness among local communities, land managers, and policymakers, and incorporating invasion risk assessments into regional land management strategies, can greatly enhance prevention and control efforts. Such proactive and coordinated measures are essential to limit further spread and mitigate the ecological and socio-economic impacts of Cryptostegia grandiflora in Ethiopia.
5. Conclusion
In this study, ensemble modeling was used to map the range of Cryptostegia grandiflora in Ethiopia and to provide new insight into the species’ resilience to climate change. The most influential predictors shaping the potential distribution of Cryptostegia grandiflora were mean diurnal range, temperature seasonality, and Precipitation seasonality. The results indicate that, although suitable habitats are limited and highly fragmented, the species’ ecological flexibility and resilience to extreme environmental conditions allow it to establish and persist beyond its current range. Future projections suggest a substantial expansion of climatically suitable areas, particularly in central and southeastern Ethiopia, under both SSP2-4.5 and SSP5-8.5 scenarios. This expansion may threaten rangelands, pastoral systems, and agricultural zones by reducing forage availability, altering habitat structure, and increasing socio-economic vulnerability. The potential for further spread is increased by human-mediated dispersal and its use for various purposes, such as hedging, fodder, and edible fruits, combined with its tolerance to drought. These results provide a basis for the rapid identification of potential invasion hotspots and can inform targeted management strategies for Cryptostegia grandiflora. However, further research is needed to assess whether the species can establish in climatically suitable areas where it is not yet recorded. We recommend detailed studies on the effects of climate change on the distribution of Cryptostegia grandiflora across Ethiopia and Africa under multiple Representative Concentration Pathways (RCPs), to support long-term invasive species management and biodiversity conservation.
Data Availability Statement
The data used in this study are confidential.
Acknowledgments
Portions of this manuscript were revised for clarity and grammar using ChatGPT (OpenAI), with all content reviewed and verified by the authors. The authors sincerely thank Tewodros Kabtamu for his assistance and support during the preparation of this manuscript. .
Conflicts of Interest
The authors declare no conflict of interest.
References
- Allouche, O.; Tsoar, A.; Kadmon, R. Assessing the accuracy of species distribution models: Prevalence, kappa and the true skill statistic (TSS). Journal of Applied Ecology 2006, 43(6), 1223–1232. [Google Scholar] [CrossRef]
- Araújo, M. B.; New, M. Ensemble forecasting of species distributions. Trends in Ecology & Evolution 2007, 22(1), 42–47. [Google Scholar] [CrossRef]
- Beaury, E.M.; Fusco, E.J.; Jackson, M.R. Incorporating climate change into invasive species management: insights from managers. Biol Invasions. 2020, 22, 233–252. [Google Scholar] [CrossRef]
- Belayneh, B.; Taye, T.; Rezene, F. Spatial distribution and abundance of invasive alien plant species in Gamo Gofa Zone, Ethiopia. International Journal of Innovative Research and Development 5 2016, 23–33. [Google Scholar]
- Bellard, C.; Jeschke, J. M.; Leroy, B.; Mace, G. M. Insights from modeling studies on how climate change affects invasive alien species geography. Ecology and Evolution 2018, 8(11), 5688–5700. [Google Scholar] [CrossRef]
- Chippendale, J. F. The potential economic returns to research into rubber vine (Cryptostegia grandiflora R. Br.) in North Queensland. Unpublished master’s thesis, University of Queensland, Brisbane, Australia, 1991. [Google Scholar]
- Christensen, J. H.; Hewitson, B.; Busuioc, A.; Chen, X.; Gao, X.; Held, R.; Whetton, P. Solomon, S., et al., Eds.; Regional climate projections. In Climate Change 2007: The physical science basis; Cambridge University Press, 2007; pp. 847–940. [Google Scholar]
- Elith, J.; Graham, C. H.; Anderson, R. P.; Dudík, M.; Ferrier, S.; Guisan, A.; Lehmann, A. Novel methods improve prediction of species’ distributions from occurrence data. Ecography 2006, 29(2), 129–151. [Google Scholar] [CrossRef]
- Ethiopian Biodiversity Institute (EBI). Sixth national report on the implementation of the NBSAP (2015–2020).; Ethiopian Biodiversity Institute, 2021. [Google Scholar]
- Gebretsadik, G.; Animut, G.; Tegegne, F. Assessment of the potential of cactus pear (Opuntia ficus-indica) as livestock feed in Northern Ethiopia. Livestock Research for Rural Development 2013, 25(2), Article 21. [Google Scholar]
- Global Invasive Species Database. Cryptostegia grandiflora species profile. 2018.
- Hejda, M.; Pyšek, P.; Jarošík, V. Impacts of invasive plants on the species richness, diversity and composition of invaded communities. Journal of Ecology 2009, 97(3), 393–403. [Google Scholar] [CrossRef]
- Hellmann, J. J.; Byers, J. E.; Bierwagen, B. G.; Dukes, J. S. Five potential consequences of climate change for invasive species. Conservation Biology 2008, 22(3), 534–543. [Google Scholar] [CrossRef] [PubMed]
- Hernández, O. G.; Guisan, A.; Thuiller, W. Habitat suitability and distribution models: With applications in R.; Cambridge University Press, 2017. [Google Scholar]
- Invasive Species Compendium. Cryptostegia grandiflora datasheet.; CABI, 2014. [Google Scholar]
- Jemal, T.; Tessema, T. Abundance and distribution of invasive alien plant species in Illu Ababora Zone, Ethiopia. Journal of Agricultural Science and Food Technology 2015, 1(7), 94–100. [Google Scholar]
- Kosicki, J. Z. Generalised additive models and random forest approach as effective methods for predictive species density and functional species richness. Environmental and Ecological Statistics 27 2020, 273–292. [Google Scholar] [CrossRef]
- Kriticos, D. J.; Sutherst, R.W.; Brown, J.R.; Adkins, S.W.; Maywald, G.F. Climate change and biotic invasions: a case history of a tropical. Biological Invasions 2003, 5, 145–165. [Google Scholar] [CrossRef]
- Kueffer, C. Plant invasions in the Anthropocene. 2017, 358(6364), 724–725. [Google Scholar] [CrossRef]
- Kuma, M.; Achiso, Z.; Chinasho, A.; Yaya, D.; Tessema, S. Floristics and diversity of invasive alien plant species in Humbo District, South Ethiopia. International Journal of Ecology 2021 2021, 1–10. [Google Scholar] [CrossRef]
- Luizza, M. W.; Young, H.; Kuroiwa, C.; Evangelista, P.; Worede, A.; Bussmann, R. W.; Weimer, A. Local knowledge of plants and their uses among women in the Bale Mountains, Ethiopia. Ethnobotany Research and Applications 11 2013, 315–339. [Google Scholar]
- Mackey, A. P. Rubber vine (Cryptostegia grandiflora) in Queensland.; Queensland Department of Natural Resources, 1996. [Google Scholar]
- Moss, R. H.; Edmonds, J. A.; Hibbard, K. A.; Manning, M. R.; Rose, S. K.; van Vuuren, D. P.; Wilbanks, T. J. The next generation of scenarios for climate change research and assessment. Nature 2010, 463(7282), 747–756. [Google Scholar] [CrossRef]
- Naimi, B.; Araújo, M. B. sdm: A reproducible and extensible R platform for species distribution modelling. Ecography 2016, 39(4), 368–375. [Google Scholar] [CrossRef]
- Parsons, W. T.; Cuthbertson, E. G. Noxious weeds of Australia.; Inkata Press, 1992. [Google Scholar]
- Phillips, S. J.; Anderson, R. P.; Schapire, R. E. Maximum entropy modeling of species geographic distributions. Ecological Modelling 2006, 190(3–4), 231–259. [Google Scholar] [CrossRef]
- Podda, L.; Santo, A.; Leone, C.; Mayoral, O.; Bacchetta, G. Seed germination, salt stress tolerance and seedling growth of Opuntia ficus-indica. Flora 229 2017, 50–57. [Google Scholar] [CrossRef]
- Rai, P. K. Paradigm of plant invasion: A multifaceted review on sustainable management. Environmental Monitoring and Assessment 187 2015, 759. [Google Scholar] [CrossRef] [PubMed]
- Rai, P. K.; Kim, K.-H.; Lee, S. S.; Lee, J.-H. Molecular mechanisms in phytoremediation of environmental contaminants and prospects of engineered transgenic plants and microbes. Science of the Total Environment 705 2020, 135858. [Google Scholar] [CrossRef]
- Rathore, P.; Roy, A.; Karnatak, H. Modelling the vulnerability of Taxus wallichiana to climate change scenarios. Ecological Indicators 102 2019, 199–207. [Google Scholar] [CrossRef]
- Rogelj, J.; Meinshausen, M.; Knutti, R. Global warming under old and new scenarios using IPCC climate sensitivity range estimates. Nature Climate Change 2012, 2(4), 248–253. [Google Scholar] [CrossRef]
- Ruiz-Navarro, A.; Gillingham, P. K.; Britton, J. R. Predicting shifts in the climate space of freshwater fishes. Biological Conservation 203 2016, 33–42. [Google Scholar] [CrossRef]
- Shiferaw, W.; Demissew, S.; Bekele, T. Invasive alien plant species in Ethiopia: ecological impacts on biodiversity a review paper. International Journal of Molecular Biology. 2018, 3(4), 169–176. [Google Scholar] [CrossRef]
- Shonga, E. New pests challenging the current pest management support system and need for reinvigorate the system. In Proceedings of the 21st Annual Conference, Addis Ababa, Ethiopia; 2014. [Google Scholar]
- Simberloff, D.; Martin, J. L.; Genovesi, P.; Maris, V.; Wardle, D. A.; Aronson, J.; Vilà, M. Impacts of biological invasions: What’s what and the way forward. Trends in Ecology & Evolution 2013, 28(1), 58–66. [Google Scholar] [CrossRef]
- Sintayehu, D. W.; Dalle, G.; Bobasa, A. F. Impacts of climate change on current and future invasion of Prosopis juliflora in Ethiopia. Heliyon 2020, 6(8), e04596. [Google Scholar] [CrossRef]
- Tesfaye, B.; Seifu, A.; Ayenew, A. Impacts of invasive plant Cryptostegia grandiflora on species diversity. International Journal of Agriculture Innovations and Research 2019, 7(5), 1–10. [Google Scholar]
- Thamaga, KH; Dube, T. Understanding seasonal dynamicsof invasive water hyacinth (Eichhornia crassipes) in the GreaterLetaba river system using Sentinel-2 satellite data. GIScience and Remote Sensing 2019, 56(8), 1355–1377. [Google Scholar] [CrossRef]
- Valavi, R.; Elith, J.; Lahoz-Monfort, J. J. Modelling species presence-only data with random forests. Ecography 44 2021, 1731–1742. [Google Scholar] [CrossRef]
- Zeleke, W.; Merawi, E.; Bekele, T.; Goshu, B.; Emishaw, Y.; Ayehune, A. Medicinal plants: Traditional knowledge and practices in Ethiopia. International Journal of Ecotoxicology and Ecobiology 2017, 2(2), 56–60. [Google Scholar]
- Zeppel, M. J. B.; Wilks, J. V.; Lewis, J. D. Impacts of extreme precipitation and seasonal changes in precipitation on plants. Biogeosciences 2014, 11, 3083–3093. [Google Scholar] [CrossRef]
- Zhang, L.; Liu, S.; Sun, P.; Wang, T.; Wang, G.; Zhang, X.; Wang, L. Consensus forecasting of species distributions. PLoS ONE 2015, 10(3), e0120056. [Google Scholar] [CrossRef]
- Zhang, W.; Brandt, M.; Tong, X.; Tian, Q.; Fensholt, R. Impacts of the seasonal distribution of rainfall on vegetation productivity across the Sahel. Biogeosciences 15 2018, 319–330. [Google Scholar] [CrossRef]
|
Disclaimer/Publisher’s Note: The statements, opinions and data contained in all publications are solely those of the individual author(s) and contributor(s) and not of MDPI and/or the editor(s). MDPI and/or the editor(s) disclaim responsibility for any injury to people or property resulting from any ideas, methods, instructions or products referred to in the content. |
© 2025 by the authors. Licensee MDPI, Basel, Switzerland. This article is an open access article distributed under the terms and conditions of the Creative Commons Attribution (CC BY) license (http://creativecommons.org/licenses/by/4.0/).