
Submitted:
09 December 2025
Posted:
11 December 2025
You are already at the latest version
Abstract
The North American Prairies are a region of critical importance to continental hydroclimate and agriculture, exhibiting high sensitivity to variability in atmospheric moisture transport. This study investigates the seasonal and interannual variability of integrated moisture flux over the Prairie region (246°–264°E, 49°N–53°N) using the National Centers for Environmental Prediction (NCEP) Reanalysis dataset from 1979 to 2022. We employ a combination of composite analysis and Empirical Orthogonal Function (EOF) analysis to identify the dominant modes of variability and their associated large-scale synoptic drivers. Our results confirm a strong seasonal reversal: winter moisture flux is predominantly zonal (westerly), contributing an average of 26.2% to total inbound flux, while summer flux is primarily meridional (southerly), contributing a dominant 72.6%. Composite analysis of extreme moisture years reveals that anomalously high moisture winters are associated with an intensified Aleutian Low and a strengthened pressure gradient off the North American west coast, facilitating enhanced westerly flow. Conversely, a strengthened continental high-pressure system characterizes anomalously low moisture winters by. During summer, high moisture years are driven by an enhanced southerly component of flow, likely linked to a strengthened Great Plains Low-Level Jet (GPLLJ). The first EOF mode for winter explains 36.4% of the variance in eastward flux and is characterized by a pattern consistent with the El Niño Southern Oscillation (ENSO) teleconnection pattern. These findings underscore the control of Pacific-centric circulation patterns on Prairie hydroclimate and have significant implications for predicting seasonal water availability.
Keywords:
moisture flux
; Great Plains
; prairies
; NCEP reanalysis
; composite analysis
; EOF analysis
; synoptic climatology
; drought
; precipitation
1. Introduction
The Great Plains of North America, and the Prairie region within it, constitute a vast expanse that plays a pivotal role in the continent's climate system and serves as a global breadbasket, making its hydroclimate a subject of critical importance [1]. Due to its distance from the oceans, this region is characterized by significant seasonal and interannual variability in precipitation, which directly influences water resources, ecosystem dynamics, and socio-economic stability, particularly through the occurrence of devastating droughts and floods [2,3]. This hydroclimatic variability is not merely a local phenomenon but is largely governed by the complex four-dimensional transport of atmospheric moisture, a process driven by the interplay between large-scale atmospheric circulation patterns and regional thermodynamic conditions [4,5].
The moisture flux into the Prairies is modulated by prominent hemispheric-scale teleconnection patterns such as the El Niño Southern Oscillation (ENSO), Pacific-North American (PNA) pattern, the North Atlantic Oscillation (NAO), and the Pacific Decadal Oscillation (PDO) [6,7]. These patterns influence the intensity, position, and persistence of key semi-permanent atmospheric features, including the Aleutian Low, the North Pacific High, and the Bermuda-Azores High, which vary throughout the year and dictate the primary pathways and intensity of moisture transport [8,9]. During the winter (DJF) months, the region predominantly experiences strong zonal (westerly) flow associated with the mid-latitude jet stream, which advects moisture from the Pacific Ocean [10]. However, this Pacific-sourced moisture is often relatively lacking by the time it reaches the lee of the Rocky Mountains [11]. In stark contrast, the summer (JJA) season sees a marked shift to vigorous meridional (southerly) flow, driven primarily by the development of the Great Plains Low-Level Jet (GPLLJ), which effectively channels warm, moist, high-enthalpy air northward from the Gulf of Mexico [12,13]. This fundamental seasonal reversal is the primary driver of the region's hydroclimate, dictating the timing, type, and efficiency of precipitation.
Understanding the dynamics and anomalies of these moisture transport patterns is crucial for predicting and mitigating the impacts of climatic extremes, such as multi-year droughts and catastrophic floods, which have profound socio-economic and environmental impacts on the region [14,15]. While numerous previous studies have examined precipitation and temperature trends, a detailed, mechanistic analysis of the moisture flux vectors themselves—their direction, magnitude, convergence, and anomalies—using long-term reanalysis data provides a more fundamental understanding of the drivers behind these hydroclimatic extremes [16]. It allows for the direct diagnosis of atmospheric dynamics rather than just the surface manifestations.
In this study, we use NCEP-DOE Reanalysis II data from 1979 to 2022 to investigate the seasonal and interannual variability of integrated moisture flux over the Prairies. Our specific objectives are to: (1) quantify the seasonal climatology and precise contribution of westerly (Pacific) versus southerly (Gulf of Mexico) moisture transport to the regional water budget; (2) identify years with extreme moisture flux anomalies and composite the associated synoptic-scale conditions for key variables including sea level pressure (SLP), geopotential height, surface air temperature, precipitation, and cloud cover; and (3) identify the dominant spatial modes of moisture flux variability using EOF analysis for both winter and summer seasons to isolate the principal patterns of variability. By synthesizing these analyses, we aim to elucidate the principal atmospheric mechanisms and circulation anomalies responsible for periods of moisture surplus and deficit in this critically important region, thereby enhancing predictive understanding.
2. Materials and Methods
2.1. Study Area and Data
This study focuses on the Prairie region of the North American Great Plains, defined by the longitudinal bounds 246°E to 264°E (approximately 114°W to 96°W) and the latitudinal bounds 49°N to 53°N. This area encompasses the agriculturally vital Canadian Prairies (southern Alberta, Saskatchewan, and Manitoba) and parts of the northern U.S. Plains, a region highly sensitive to variations in moisture supply and historically prone to significant droughts, such as the Dust Bowl of the 1930s and the severe drought of the 1980s [17]. The region's climate is classified as semi-arid to sub-humid continental, with precipitation being the primary limiting factor for agricultural productivity [18].
The primary data source is the NCEP–DOE AMIP-II Reanalysis (Reanalysis-2) dataset [19]. This globally gridded dataset provides a long-term, physically consistent representation of the global atmosphere, generated by a state-of-the-art analysis/forecast system that assimilates vast amounts of historical observational data from diverse sources. We utilized monthly mean data on specific humidity and horizontal wind components (u and v) across multiple pressure levels (1000, 925, 850, 700, 600, 500, 400, 300 hPa) from 1979 to 2022 to capture the vertical structure of moisture transport. Additionally, we used surface fields including sea level pressure (SLP), 2-meter air temperature, precipitation rate, and total cloud cover for composite analysis. The data is provided on a 2.5° × 2.5° global grid.
2.2. Moisture Flux Calculation
The vertically integrated horizontal moisture flux (Q), often termed Integrated Vapor Transport (IVT), is a fundamental variable in meteorology, representing the total horizontal transfer of water vapor within the atmospheric column [20]. It was calculated as the mass-weighted integral of the product of specific humidity (Q) and the horizontal wind components (u, v). The zonal (QU) and meridional (QV) components of the IVT are given by:
where g is the acceleration due to gravity (9.8 m s⁻²), p is pressure, and the integration is performed from the surface pressure (ps) to the top of the atmosphere (pt ≈ 0 Pa). We calculated IVT for each model level before vertical integration.
The total inbound moisture flux for the defined Prairie box was quantitatively calculated by integrating the normal components of (QU, QV) along the western and southern boundaries, as these are the primary moisture source regions for the domain [21]. The western boundary integral represents Pacific-sourced westerly flux, while the southern boundary integral represents Gulf-sourced southerly flux. We computed anomalies for each year subtracting the long-term (1979-2022) seasonal (DJF/JJA) mean for each grid cell, thus isolating the interannual variability.
2.3. Composite and Difference Analysis
To investigate the synoptic-scale atmospheric conditions characteristic of extreme moisture years, we performed a composite analysis following established methodologies [22]. Years where the total integrated moisture flux anomaly exceeded one positive standard deviation from the mean were classified as positive anomaly years (Pos, wet extremes), and years where it was more than one negative standard deviation were classified as negative anomaly years (Neg, dry extremes). For winter, this included years like 1986, 1991, 2011 (Pos) and 1981, 1992, 2009 (Neg). We generated composite maps for SLP, 500-hPa geopotential height, 2m air temperature, precipitation, and cloud cover by separately averaging the fields for all Pos and all Neg groups for winter (DJF) and summer (JJA). Difference maps (Neg - Pos) were then created to highlight the key anomalous atmospheric features that physically differentiate dry and wet extremes. Statistical significance of the differences was assessed using a two-tailed Student's t-test at the 95% confidence level (p < 0.05).
2.4. Empirical Orthogonal Function (EOF) Analysis
EOF analysis, a form of Principal Component Analysis (PCA) widely used in climate science, was applied to isolate the dominant spatial modes of variability in the seasonal moisture flux fields, effectively reducing the dimensionality of the data [23,24]. The analysis decomposes the space-time field of moisture flux anomalies into orthogonal spatial patterns (EOFs) and associated uncorrelated time series (Principal Components, PCs). The analysis was performed separately on the eastward (QU) and northward (QV) components of the integrated moisture flux anomaly field for the winter and summer seasons. The analysis domain was extended beyond the Prairie box to capture the larger-scale circulation patterns that force regional variability. The EOFs were weighted by the square root of the cosine of latitude to account for the decreasing area of grid cells towards the poles. The first few EOF modes, which explain the largest fraction of the total variance, were retained for physical interpretation. The associated PC time series were regressed onto global atmospheric fields to identify the large-scale circulation patterns associated with each mode. They were also correlated with standard teleconnection indices (e.g., PDO, ENSO).
3. Results
3.1. Seasonal Variation in Moisture Flux
Our analysis revealed a pronounced and robust seasonal shift in the direction and magnitude of moisture flux over the Prairies, a dominating factor of the region's climate [25]. During winter, the moisture flux is predominantly zonal, corresponding to the prevailing strong westerly winds associated with the intensified and southward-shifted mid-latitude jet stream (Figure 1). The flux vectors are strong, coherent, and oriented west-to-east, indicating efficient moisture transport from the Pacific Ocean. This westerly flux, though often involving relatively dry air after orographic lifting over the Rockies, is crucial for delivering the majority of winter precipitation to the region, often falling as snow, which is critical for spring soil moisture recharge [26]. Quantification of the integrated flux data shows that the climatological mean westerly-southwesterly component contributes an average of ~ 90%, to the total inbound moisture for the domain. The interannual variance in the percentage of moisture remaining within the domain ranges from 17% to 68%.
In stark contrast, during summer, the primary direction of moisture flux shifts decisively to a meridional southerly flow (Figure 2). This dramatic shift is predominantly influenced by the thermal development of the North American Monsoon and, most importantly, the establishment of the nocturnal Great Plains Low-Level Jet (GPLLJ) [12,27]. The flux vectors show a strong northward component, channeling warm, moist, high precipitable water air from the Gulf of Mexico and the Caribbean into the heart of the continent. This southerly flow is the principal driver of summer convective precipitation, providing the necessary moisture for thunderstorms that deliver the majority of warm-season rainfall [28]. The integrated flux data confirms the dominance of this source, with the southerly component contributing a substantial 72.6% to the total inbound moisture, highlighting the Gulf of Mexico's critical role as the moisture source for the Prairies.
Time series of the winter westerly and southerly flux anomalies exhibit significant interannual variability, driven by changes in large-scale circulation (Figure 3). Significant positive anomalies (enhanced transport) occurred in winters like 1986, 1991, 2011, and 2020. These years are generally associated with strong negative phases of the PNA pattern or other patterns that enhance flow into the region. Conversely, strong negative anomalies (suppressed transport) marked winters like 1981, 1982, 1992, 1993, and the particularly extreme case of 2009. The total moisture flux anomaly is strongly correlated with both the westerly (r ~ 0.89) and southerly (r ~ 0.92) components, indicating that extreme seasons are typically coherent, with extreme conditions in both Pacific and Gulf-sourced transport due to large-scale circulation patterns affecting the entire region.
3.2. Composite Analysis of Extreme Years
3.2.1. Sea Level Pressure and Surface Air Temperature
In winter, the composite analysis for high moisture years (Pos) reveals a highly amplified circulation pattern over the North Pacific and North America (Figure 4). The most prominent feature is a significantly deepened and intensified Aleutian Low centered over the western Aleutians, which enhances the cyclonic flow and strengthens the westerly wind belt downstream. Concurrently, a prominent high-pressure anomaly is observed over the eastern North Pacific and off the coast of California. This specific dipole configuration — a deep low to the west and a strong high to the east—dramatically strengthens the meridional pressure gradient, funneling enhanced southwesterly flow into the Pacific Northwest and Prairies [29]. This pattern advects warmer, moister air from the subtropical Pacific, leading to above-average temperatures and precipitation. The difference map (Neg - Pos) reveals the opposite signature: a significant increase in SLP over much of Canada and the northern Great Plains during Neg winters. This robust positive anomaly indicates the presence of a strong, persistent continental high-pressure system or blocking ridge [30]. This block suppresses overall moisture influx by promoting northerly or northwesterly flow, advecting colder, drier Arctic air masses, and leads to below-average temperatures and precipitation. The cooling over the northern Plains is a direct thermodynamic response to this circulation pattern.
In summer, the composite analysis for Pos years shows a more obvious pattern (Figure 5). A key feature is a slight warming anomaly over the western Prairies and a slight cooling anomaly over the central and eastern Prairies. This temperature pattern is indicative of the varying influence of moisture transport and cloud cover: stronger moisture transport in the east leads to more clouds and precipitation, having a slight cooling effect, while the drier west experiences more sunshine and warming. The difference map (Neg - Pos) highlights the primary driver: a significant increase in SLP over the central United States during Neg summers. This high-pressure anomaly weakens the typical climatological low-pressure trough over the interior, thereby reducing the pressure gradient that drives the GPLLJ. This results in reduced southerly moisture flux from the Gulf of Mexico.
3.2.2. Precipitation and Cloud Cover
The composite analysis of precipitation and cloud cover provides a direct link between the synoptic-scale circulation anomalies and their hydrological impacts on the Prairies.
During winter, the composite for positive moisture flux years (Pos) reveals a coherent pattern of enhanced precipitation across the Canadian Prairies and the northern Great Plains, collocated with a region of increased cloud cover (Figure 6a). This is a direct consequence of the intensified southwesterly flow, which advects moist, unstable air into the region, fostering increased storm frequency and intensity. Conversely, the composite for negative years (Neg) shows a pronounced suppression of both precipitation and cloud cover over the same region (Figure 6, Top right).
The difference map (Neg - Pos) starkly highlights these contrasts (Figure 6, Bottom panel). Widespread, statistically significant negative precipitation anomalies (shaded contours) blanket the Prairie region, confirming the strong precipitation deficit characteristic of dry winters. Simultaneously, the cloud cover difference (non-shaded contours) shows a pronounced negative anomaly (dashed lines) centered over the study domain, indicating significantly clearer skies. This reduction in cloud cover contributes to the colder surface temperatures observed during these events via enhanced radiative cooling.
Consistent with the SLP patterns, the analysis of precipitation and cloud cover during winter revealed that Neg years are characterized by significantly decreased precipitation and reduced cloudiness across the Canadian Prairies. These conditions are a direct result of the strong high-pressure system, which promotes subsidence, inhibits cloud formation and precipitation, and allows for greater radiative cooling [31]. The reduced moisture influx and snowfall during these years exacerbate dry conditions, leading to lower spring soil moisture levels.
In summer, the composite pattern for Pos years shows a band of increased precipitation and cloud cover aligned along the eastern slopes of the Rockies and extending into the southern Prairies (Figure 7a). This pattern is consistent with the activation of the Great Plains Low-Level Jet (GPLLJ), which provides the necessary moisture and lift for convective precipitation. The Neg composite shows a marked reduction in this band, with drier and clearer conditions prevailing (Figure 7b).
The summer difference map (Neg - Pos) reveals a strong dipole in precipitation anomalies (Figure 7c). Significant negative precipitation anomalies (shaded contours) are focused over the southern Prairies, the primary region influenced by the GPLLJ. This is accompanied by a substantial negative cloud cover anomaly (dashed contours) over the same area, indicating fewer clouds. A weaker positive cloud cover anomaly (solid contours) is evident further north, suggesting a potential northward shift in the storm track or a change in convective regimes, leaving the core agricultural regions drier and sunnier, thereby exacerbating evaporative demand during critical growing-season months.
3.2.3. Sea Surface Temperature (SST)
The analysis of sea surface temperatures (SSTs) accompanying winter extremes reveals the crucial role of ocean-atmosphere coupling (Figure 8). The composite for Pos winters shows a characteristic SST anomaly pattern: a warming trend over the eastern tropical Pacific, particularly near the U.S. west coast, and a prominent horseshoe-shaped region of colder SSTs surrounding it, extending into the central subtropical Pacific and the Gulf of Alaska. This pattern is often associated with a positive phase of the Pacific Decadal Oscillation (PDO) and can influence the intensity and position of the Aleutian Low [32,33]. The warm SSTs off the coast can enhance latent heat flux, contributing to the development of the downstream high-pressure anomaly. The difference map (Neg - Pos, not shown) would show a cooling in the eastern Pacific and warming in the central Pacific, akin to a La Niña-like or negative PDO pattern, which is conducive to the development of the blocking high over North America. Furthermore, a significant cooling signal is evident in the Atlantic Ocean along the U.S. east coast and extending into the Labrador Strait during Pos winters, suggesting a possible connection with a negative phase of the North Atlantic Oscillation (NAO), which can reinforce blocking patterns over the Atlantic sector [34].
In summer, the SST difference map (Neg - Pos) reveals a broad cooling trend over the western Atlantic Ocean, except for the Gulf of Mexico, which remains relatively warm or neutral (Figure 9). This gradient is potentially important; a cooler western Atlantic may weaken the Bermuda High, reducing its ability to pump moisture into the continent, while a warm Gulf of Mexico ensures a continued, but potentially less effectively transported, moisture source [35].
3.3. EOF Analysis of Moisture Flux
3.3.1. Winter
The EOF analysis of the eastward moisture flux (QU) in winter revealed that the first mode is the dominant mode of variability, explaining 42.9% of the total variance (Figure 10). This mode exhibits a pronounced dipole pattern, characterized by strong positive inflow over the North Pacific and negative inflow over the South Pacific. This is a typical scenario for the positive phase of ENSO, where Prairies experiences a cold winter with a higher-than-normal snowfall. The associated principal component (PC) time series shows distinct interannual variability, with the most extreme negative phases occurring during strong El Niño winters and the positive phases during La Niña episodes. The second mode (20.4% variance) shows a spatial pattern that corresponds well with the Pacific Decadal Oscillation (PDO), with a strong moisture flux in the mid-latitudes, including the Prairies. It also exhibits a PC time series characterized by higher-frequency oscillations similar to Pacific Decadal Oscillation (PDO). The third mode (13.2% variance) shows a spatial pattern with higher moisture transport in the high latitudes and the Arctic. The timeseries of this pattern exhibits a trend with predominantly negative values before 2000, transitioning to more neutral/positive values thereafter, possibly due to the predominance of global warming in the last decades.
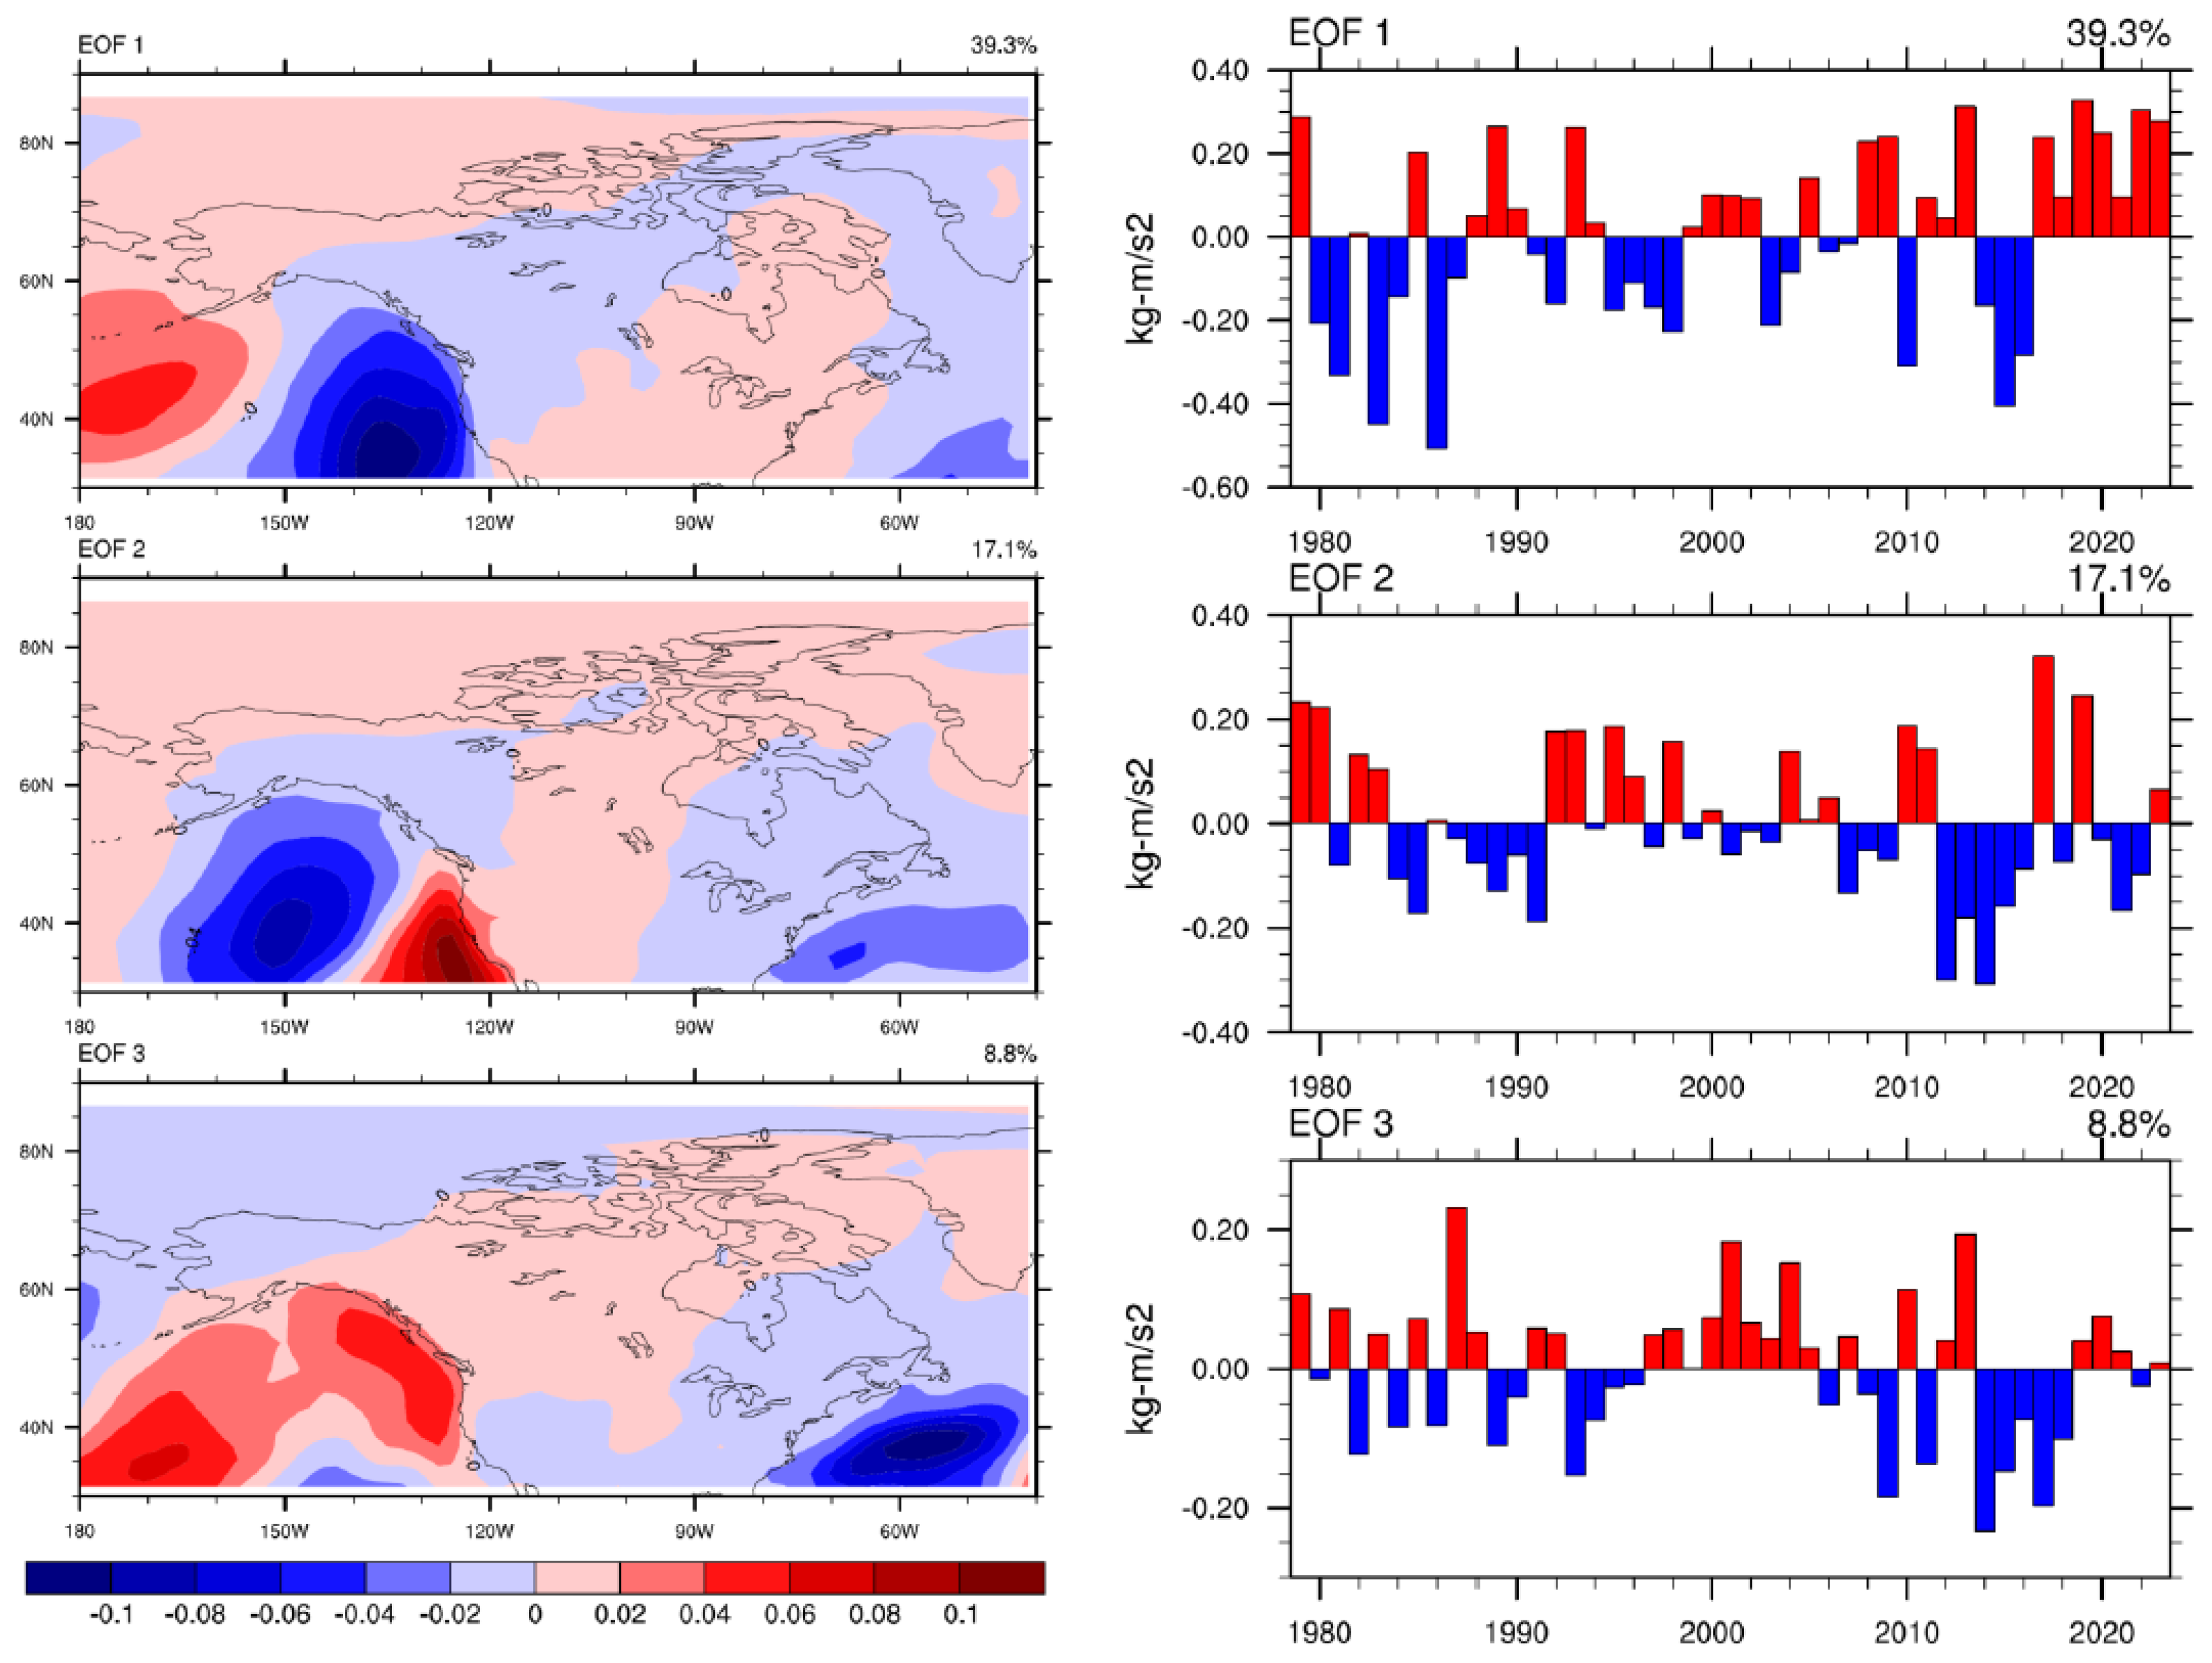
The winter northward moisture flux (VQ) is also dominated by its first EOF mode, which accounts for 39.3% of the variance (Figure 11). This mode displays a broad, coherent pattern of negative loadings across most of the North American continent, indicating a simultaneous reduction in southerly moisture transport into the Prairies during its negative phase. The corresponding PC time series (units: kg m⁻¹ s⁻¹) shows strong co-variability with the UQ's first PC, particularly evident in the concurrent positive and negative phases. This confirms that the dominant atmospheric circulation pattern simultaneously modulates both the zonal and meridional components of moisture transport. The second mode of VQ explains 17.1% of the variance and shows a distinct decadal-scale oscillation in its PC.
3.3.2. Summer
In summer, the EOF analysis of the northward moisture flux (QV) showed that the first mode is again dominant, accounting for 16.1% of the variability (Figure 10). Its spatial pattern shows a strong north-south dipole over the Great Plains: negative loadings over the northern Prairies and positive loadings over the southern Prairies and central U.S. This pattern captures the critical interannual variability in the strength and northward extent of the GPLLJ. The positive phase of this mode corresponds to years when the jet is strong and focused on the southern regions, leading to enhanced moisture transport there but potentially at the expense of the northern regions. This dipole is a key factor in causing seesaws in summer precipitation between the northern and southern Prairies. The PC time series reveals that the most extreme positive phases occurred in 1988 (+0.40), 1999 (+0.35), 2011 (+0.30), and 2020 (+0.40), indicating enhanced southerly moisture transport over the southern Prairies during these years. Conversely, strong negative phases in 1980 (-0.35), 1983 (-0.30), 2002 (-0.35), and 2021 (-0.30) correspond to periods of suppressed GPLLJ activity. The second mode (14.1% variance) and third mode (11.7%) show a greater transport along the Bering Strait into the Arctic. The timeseries of this mode exhibits a notable regime shift in its PC around the year 2000, transitioning from predominantly negative to positive values, suggesting the dominance of global warming in the recent decades, which is characterized by this pattern of anomalously high moisture transport into the higher latitudes and the Arctic due to changes in the North Pacific storm track.
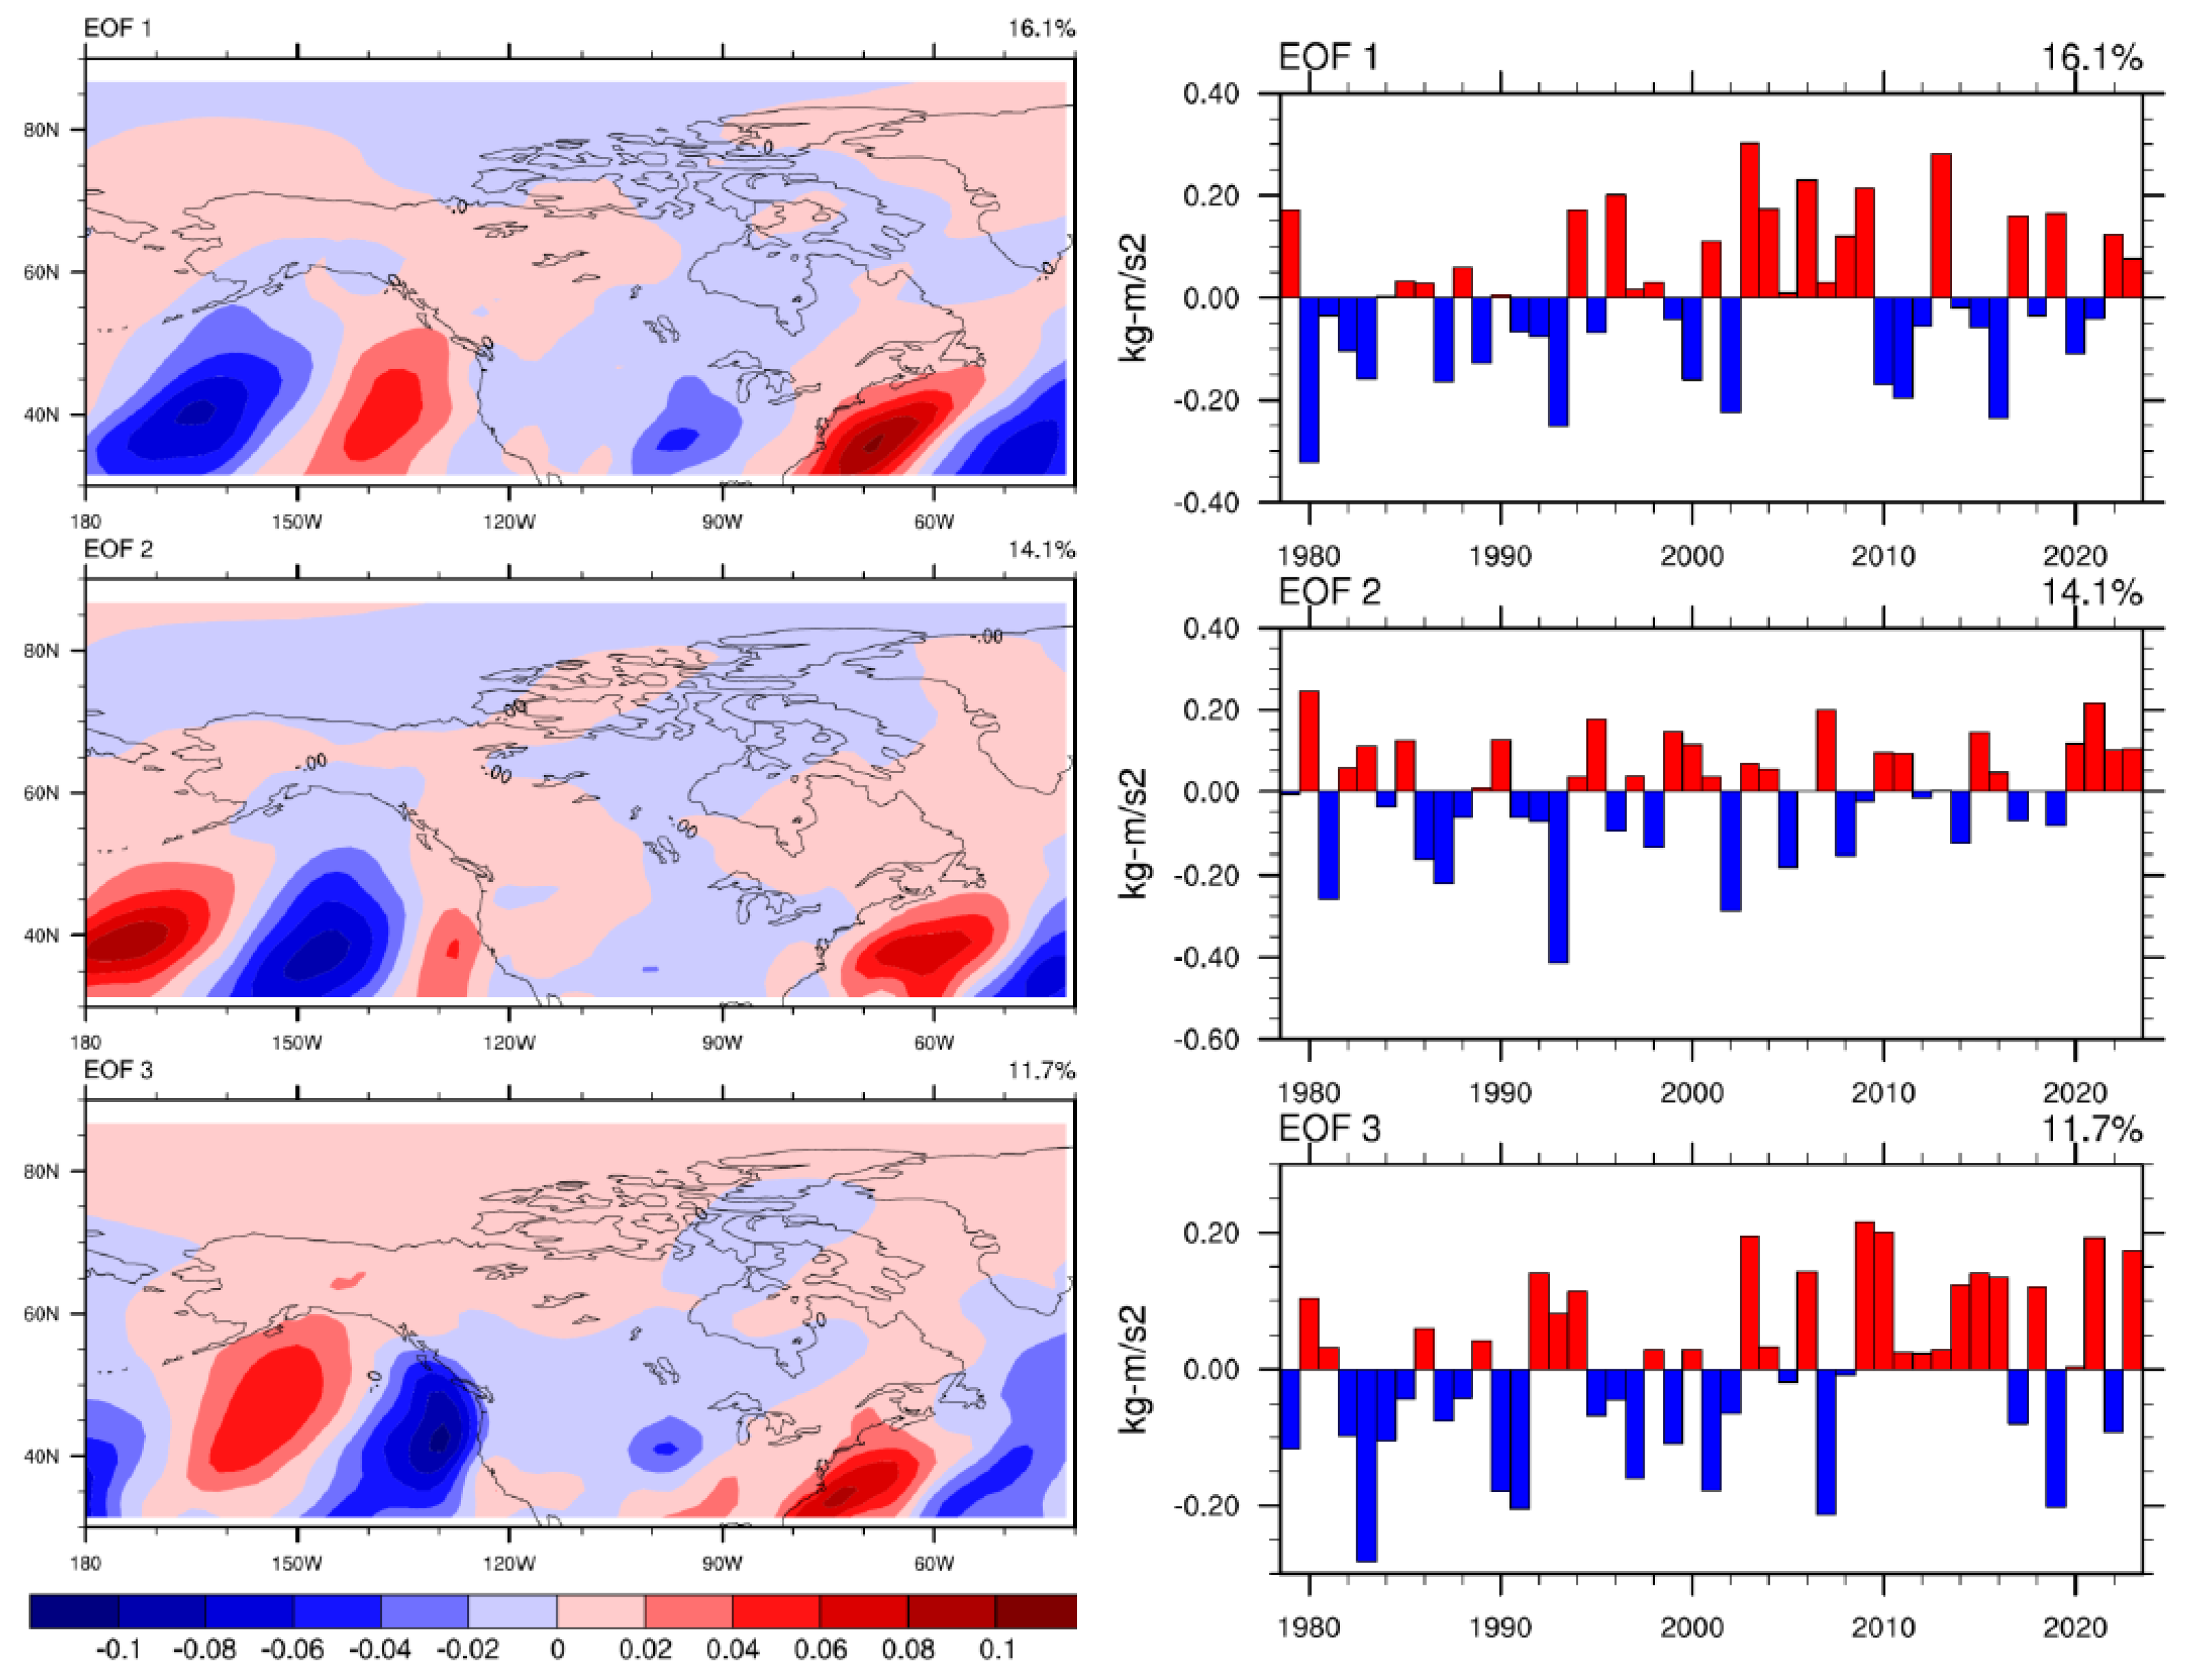
Figure 12.
EOF modes of the Meridional component (QV) of summer meridional moisture flux.
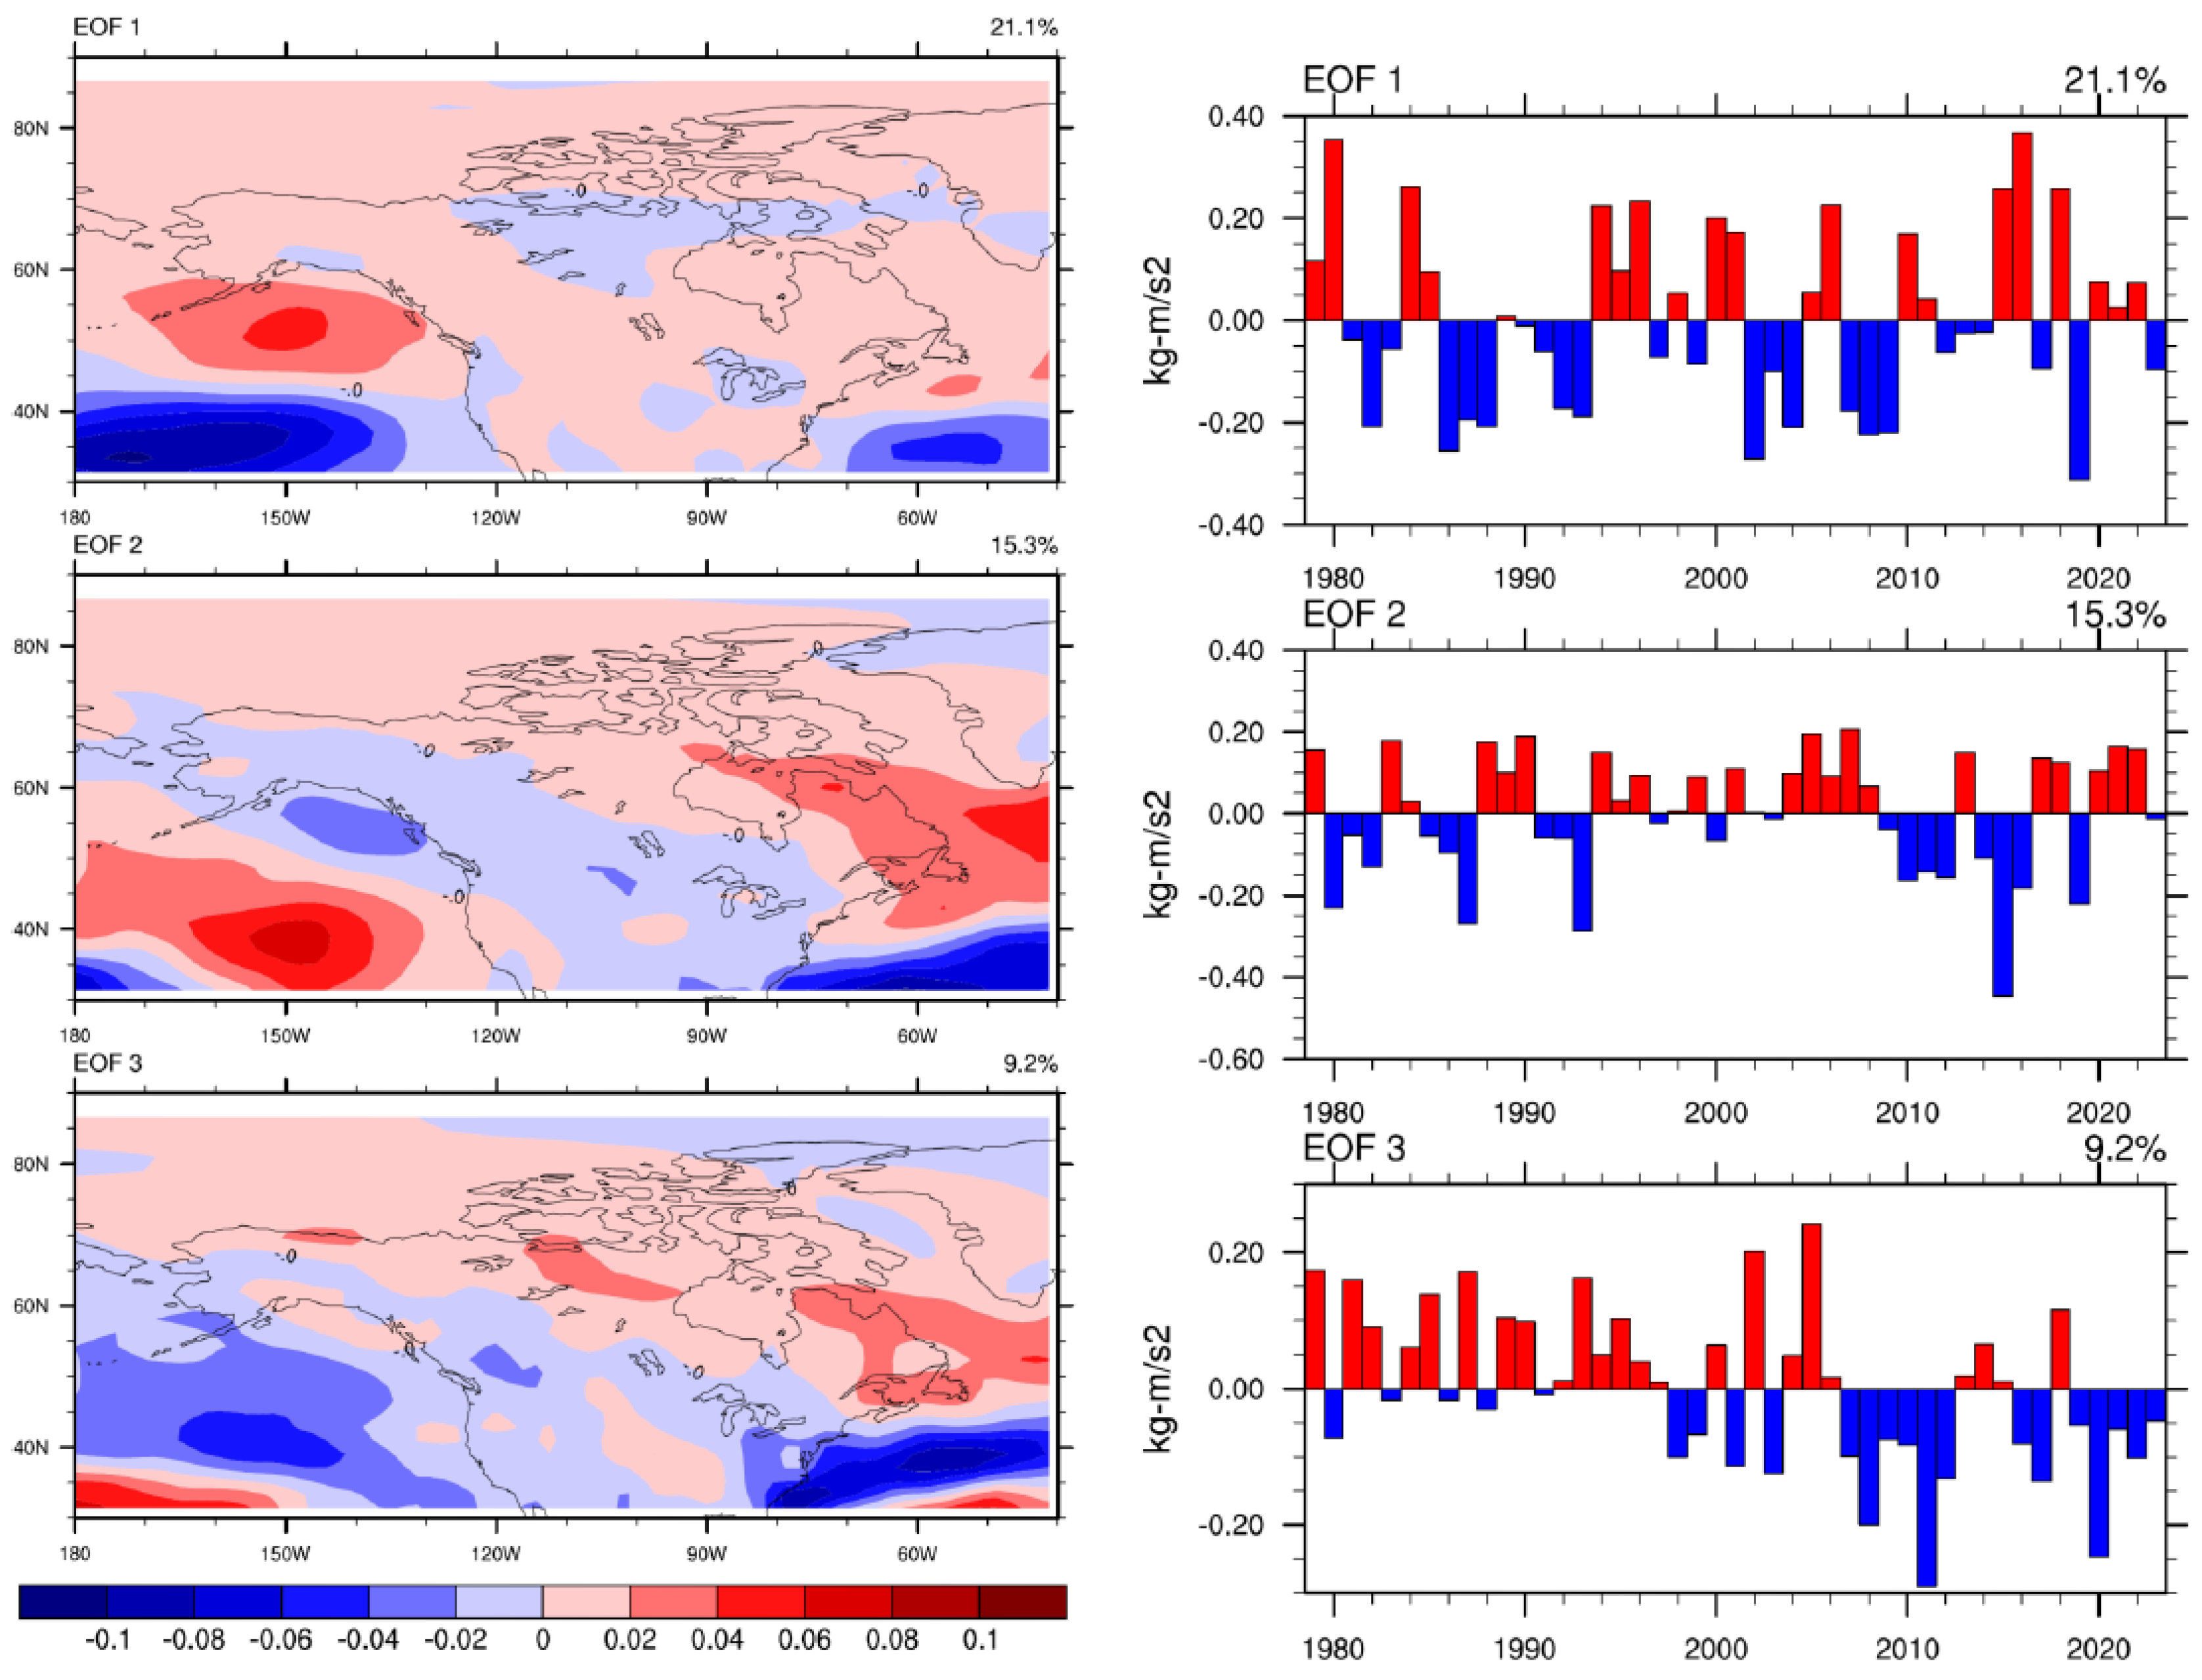
The first EOF mode of the summer eastward flux (QU) explains a smaller but still significant portion (21.1%) of the variance (Figure 11). Its pattern shows positive loadings over the northern Plains and Prairies, suggesting that during high moisture years, there is a greater contribution from westerly moisture flux. This may be related to more frequent penetration of mid-latitude disturbances or a slightly different storm track that brings Pacific moisture further inland during the summer months, supplementing the dominant Gulf moisture [36]. The PC time series shows distinct interannual variability with the strongest positive excursions in 1993 (+0.40), 2005 (+0.35), and 2014 (+0.30), indicating enhanced westerly moisture transport during these growing seasons. The second mode (15.3% variance) displays a PC with both interannual variability and a notable period of sustained positive values from 2010 to 2020, while the third mode (9.2% variance) shows higher frequency oscillations throughout the record.
Figure 13.
EOF modes of the eastward component (QU) of summer moisture flux.
4. Discussion
This study provides a comprehensive, mechanistic analysis of the dynamics governing moisture flux variability over the North American Prairies, quantifying the precise role of different sources and the atmospheric patterns that determine modes of moisture transport. The confirmed seasonal reversal between westerly-dominated winter and southerly-dominated summer transport is a well-established feature [10,12]. Still, our integrated flux calculation provides a precise quantification of the contribution of each component, underscoring the overwhelming dominance of southerly transport (72.6%) in summer as the primary moisture source for the region's water budget during the growing season. The westerly moisture transport in winter plays an essential role in the snow-based hydroclimate of the Prairie region. This highlights the region's vulnerability to any changes in the GPLLJ's strength or moisture pathways.
The composite analyses clearly and robustly link extreme moisture seasons to specific, recognizable synoptic patterns, moving beyond correlation to physical causation. The role of the North Pacific and North American Storm tracks, along with Aleutian Low and the Pacific-North American pressure gradient, in controlling winter moisture is paramount. The dominant factor for the interannual variation in moisture flux is the El Niño Southern Oscillation (ENSO). Also, our results show a lower frequency variability, which aligns with [6] and [29], who found that the negative PNA phase (a deep Aleutian Low, ridge off the west coast) is linked to warmer and wetter conditions in western Canada and the northern U.S. Plains. The continental high during negative winters, often manifesting as a blocking high over Alaska or northwestern Canada, acts as an effective mechanical blocker, preventing Pacific moisture from penetrating inland and favoring cold, dry Arctic outflow—this is a classic dynamical setup for Prairie drought [30,37]. The physical consistency between the SLP composites, temperature anomalies, and precipitation deficits lends strong support to this mechanism. The strong correlation between the first winter EOF mode of QU and the ENSO pattern suggests that this teleconnection is a primary remote driver of interannual hydroclimatic variability in the Prairies. This provides a crucial predictive link, as the ENSO, PDO and related Pacific SST patterns are often predictable with lead times of several months due to the slow evolution of the ocean [40,41]. The role of Atlantic SSTs, particularly the cold anomaly near Newfoundland, warrants further investigation in future studies as it may relate to NAO-driven blocking that can reinforce dry conditions [34].
The summer patterns emphasize the absolutely critical role of the GPLLJ. The composite difference maps show that deficits in summer moisture are not merely due to a passive lack of southerly flow but are actively forced by a large-scale reorganization of pressure fields that suppress it. The development of a high-pressure anomaly over the central U.S. during Neg summers weakens the necessary north-south pressure gradient, directly inhibiting the low-level jet [13,38]. The EOF analysis further refines this understanding, showing that the leading mode of summer meridional transport is defined by a north-south dipole. This explains the common observation that some summers can be excessively wet in the southern Prairies while being drought-stricken in the northern Prairies, and vice versa [39]. This spatial heterogeneity is a major challenge for regional water management. It is strongly influenced by the precise positioning and intensity of the GPLLJ and the associated steering of convective systems.
The third spatial mode of EOF of zonal winter moisture transport, as well as the second and third spatial modes of meridional summer moisture transport, show a post-2000 phase shift. The phase pattern and the phase shifts correspond well with the changes due to global warming, which is the dominant forcing of climate extremes in the recent decades. These EOF modes are characterized by an enhanced moisture transport into the Arctic and the higher latitudes due to the northward shift in extratropical cyclone activity due to the anomalous warming over the high latitude regions and the Arctic [42].
5. Conclusions
This study utilized a suite of diagnostic methods to elucidate the characteristics and drivers of moisture flux over the North American Prairies. The main conclusions are:
- The seasonal climatology is defined by a clear regime shift: westerly transport dominates in winter (~90% of inflow) by bringing the moisture from the Pacific Ocean, while southerly transport from the Gulf of Mexico dominates in summer (72.6% of inflow), making the region highly dependent on Gulf moisture in the growing season.
- Extreme moisture years are forced by large-scale, recognizable synoptic patterns such as ENSO and PDO. Anomalously wet (dry) winters are dynamically driven by an intensified Aleutian Low due to the position of the storm tracks and westerly jet stream, depending on the negative (positive) phase of ENSO. A secondary synoptic pattern behind the wet (dry) years includes a strengthened Pacific coast pressure gradient (negative (positive) PNA-like pattern), while a persistent continental high-pressure block forces dry winters. Wet summers are characterized by an enhanced and well-positioned GPLLJ, whereas dry summers feature a weakened jet due to a strengthened high-pressure system over the central U.S.
- The dominant mode of variability in winter moisture flux is closely tied to the ENSO and PDO teleconnection pattern, which explains a significant portion (41.4%) of the interannual variance in westerly transport. The leading mode of summer variability is a north-south dipole in southerly transport, explaining 42% of the variance and controlled by the intensity and position of the GPLLJ. However, the zonal variability in summer accounts for 46% of the variance, reflecting regional convective processes that predominate over circulation steering.
- The third spatial modes of EOF in winter zonal and summer meridional transport identify an increased moisture transport into the Arctic and high latitude regions especially through the Bering Strait. The timeseries of this mode exhibits a prominent phase shift after 2000, indicating the linkage between this pattern and the enhanced effects from global warming in the recent decades. Global warming is known to cause a northward shift in extratropical cyclone tracks in the North Pacific and North America, which corresponds well with this finding from the EOF analysis.
These findings significantly enhance our ability to diagnose the atmospheric causes of periods of moisture surplus and deficit in this economically and environmentally vital region. The results have direct implications for seasonal forecasting of water availability, agricultural productivity, and drought early warning systems. Future work should focus on using these identified dynamical patterns to assess the projected changes in moisture transport and drought risk over the Prairies under future climate scenarios using CMIP6 model output. Additionally, the role of land-atmosphere feedback in amplifying or dampening these circulation-driven anomalies warrants further investigation to fully understand the drivers of hydroclimatic extremes in this critical region.
Funding
This research in funded by ENMAX and NSERC.
Data Availability Statement
The NCEP Reanalysis 2 data provided by the NOAA PSL, Boulder, Colorado, USA, are available from their website at https://psl.noaa.gov/.
Acknowledgments
The authors acknowledge NOAA/OAR/ESRL PSL for providing the NCEP Reanalysis 2 data.
Conflicts of Interest
The authors declare no conflict of interest.
References
- Bonsal, B.R.; Wheaton, E. Atmospheric circulation comparisons between the 1999–2001 drought in the Canadian Prairies and the 1988 drought. Atmosphere-Ocean 2005, 43, 163–172. [CrossRef]
- Woodhouse, C.A.; Overpeck, J.T. 2000 years of drought variability in the central United States. Bulletin of the American Meteorological Society 1998, 79, 2693–2714. [CrossRef]
- Wheaton, E.; Wittrock, V.; Kulshreshtha, S.; Koshida, G.; et al. Canadian Prairie Droughts: A Review. Saskatchewan Research Council, Report No. 11602-46E08, 2008. (Technical report; no DOI.).
- Dirmeyer, P.A.; Brubaker, K.L. Characterization of the global hydrologic cycle from a back-trajectory analysis of atmospheric water vapor. Journal of Hydrometeorology 2007, 8, 20–37. [CrossRef]
- Gimeno, L.; Stohl, A.; Trigo, R.M.; Dominguez, F.; et al. Oceanic and terrestrial sources of continental precipitation. Reviews of Geophysics 2012, 50, RG4003. [CrossRef]
- Leathers, D.J.; Yarnal, B.; Palecki, M.A. The Pacific/North American teleconnection pattern and United States climate. Journal of Climate 1991, 4, 517–528. [CrossRef]
- St. George, S.; Wolfe, S.A. El Niño and the Pacific Decadal Oscillation: What do they mean for Canadian Prairie drought? Geoscience Canada 2009, 36, 17–24. https://journals.lib.unb.ca/index.php/GC/article/view/12653.
- Liu, J.; Stewart, R.E.; Szeto, K.K. Moisture Transport and Other Hydrometeorological Features Associated with the Severe 2000/01 Drought over the Western and Central Canadian Prairies. Journal of Climate 2004, 17, 305–319. [CrossRef]
- Mo, K.C.; Berbery, E.H. Drought and persistent wet spells over the United States. Journal of Climate 2011, 24, 1801–1820. [CrossRef]
- Smirnov, V.V.; Moore, G.W.K. Spatial and temporal structure of atmospheric water vapor transport in the Mackenzie River basin. Journal of Climate 2001, 14, 3392–3404. [CrossRef]
- Newman, M.; Compo, G.P.; Alexander, M.A. ENSO-forced variability of the Pacific Decadal Oscillation. Journal of Climate 2012, 25, 7341–7361. [CrossRef]
- Higgins, R.W.; Yao, Y.; Wang, X.L. Influence of the North American monsoon system on the U.S. summer precipitation regime. Journal of Climate 1997, 10, 2600–2622. [CrossRef]
- Helfand, H.M.; Schubert, S.D. Climatology of the Great Plains low-level jet and its contribution to the continental moisture budget. Journal of Climate 1995, 8, 784–806. [CrossRef]
- Hoerling, M.; Kumar, A. The perfect ocean for drought. Science 2003, 299, 691–694. [CrossRef]
- Bonsal, B.R.; et al. An assessment of Canadian Prairie drought: Past, present, and future. Climate Dynamics 2013, 41, 501–516. [CrossRef]
- Koster, R.D.; et al. Regions of strong coupling between soil moisture and precipitation. Science 2004, 305, 1138–1140. [CrossRef]
- Marchildon, G.P.; et al. Drought and institutional change in the Canadian Prairies. In Vulnerability and Adaptation to Drought; University of Calgary Press: Calgary, 2008; pp. 307–327. ISBN 9781552382301.
- Sauchyn, D.J.; Stroich, J.; Beriault, A. A paleoclimatic context for the drought of 1999–2001 in the northern Great Plains. The Geographical Journal 2003, 169, 158–167. [CrossRef]
- Kanamitsu, M.; et al. NCEP–DOE AMIP-II Reanalysis (R-2). Bulletin of the American Meteorological Society2002, 83, 1631–1643. [CrossRef]
- Ralph, F.M.; et al. Defining “Atmospheric River.” Bulletin of the American Meteorological Society 2018, 99, 837–839. [CrossRef]
- Dominguez, F.; Hu, H.; Martinez, J.A. Two-way land–atmosphere interactions based on coupled ERA5/GLDAS climatology. Journal of Climate 2022, 35, 2945–2964. [CrossRef]
- Thompson, D.W.J.; Wallace, J.M. The Arctic Oscillation signature. Geophysical Research Letters 1998, 25, 1297–1300. [CrossRef]
- von Storch, H.; Zwiers, F.W. Statistical Analysis in Climate Research; Cambridge University Press: Cambridge, UK, 1999. [CrossRef]
- Hannachi, A.; Jolliffe, I.T.; Stephenson, D.B. Empirical orthogonal functions in atmospheric science. International Journal of Climatology 2007, 27, 1119–1152. [CrossRef]
- Lawston, P.M.; Santanello, J.A.; Hanson, B. Irrigation signals using SMAP ET. Water Resources Research 2020, 56, e2020WR027509. [CrossRef]
- Li, Y.; Szeto, K.; Stewart, R.E.; et al. Extreme rainstorm of June 2013 over southern Alberta. Journal of Hydrometeorology 2017, 18, 2057–2078. [CrossRef]
- Weaver, S.J.; Ruiz, J.; Branstator, G. The connection between the North American monsoon and the Great Plains low-level jet. Journal of Climate 2009, 22, 3710–3727. [CrossRef]
- Higgins, R.W.; et al. The North American Monsoon. Bulletin of the American Meteorological Society 1997, 78, 2197–2213. [CrossRef]
- Bond, N.A.; Harrison, D.E. The PDO, air–sea interaction and winter patterns. Geophysical Research Letters 2000, 27, 2261–2264. [CrossRef]
- Lupo, A.R.; Smith, P.J. Climatological features of blocking anticyclones—Northern Hemisphere. Tellus A 1995, 47, 439–456. [CrossRef]
- Trenberth, K.E.; Guillemot, C.J. Physical processes involved in the 1988 drought and 1993 floods in North America. Journal of Climate 1996, 9, 1288–1298. [CrossRef]
- Mantua, N.J.; Hare, S.R.; Zhang, Y.; Wallace, J.M.; Francis, R.C. A Pacific interdecadal climate oscillation with impacts on salmon production. Bulletin of the American Meteorological Society 1997, 78, 1069–1079. [CrossRef]
- Zhang, Y.; Wallace, J.M.; Battisti, D.S. ENSO-like interdecadal variability: 1900–93. Journal of Climate 1997, 10, 1004–1020. [CrossRef]
- Hurrell, J.W. Decadal trends in the North Atlantic Oscillation: Regional temperatures and precipitation. Science1995, 269, 676–679. [CrossRef]
- Wang, C.; Lee, S.–K.; Enfield, D.B. Atlantic warm pool, Caribbean rainfall, and the intensity of the Atlantic hurricane season. Journal of Climate 2008, 21, 703–715. [CrossRef]
- Chang, E.K.M.; Lee, S.; Swanson, K.L. Storm track dynamics. Journal of Climate 2002, 15, 2163–2183. [CrossRef]
- Barriopedro, D.; García-Herrera, R.; Trigo, R.M. The role of blocking in Northern Hemisphere winter cold/warm extremes. Journal of Climate 2010, 23, 678–692. [CrossRef]
- Pu, B.; Dickinson, R.E. The Great Plains low-level jet response to springtime dryline position. Journal of Geophysical Research: Atmospheres 2014, 119, 2705–2724. [CrossRef]
- Barandiaran, D.; Wang, S.–Y.; Hilburn, K. Observed trends in the Great Plains low-level jet and moisture transport. Journal of Geophysical Research: Atmospheres 2013, 118, 9641–9651. [CrossRef]
- McPhaden, M.J.; Zebiak, S.E.; Glantz, M.H. ENSO as an integrating concept in Earth science. Science 2006, 314, 1740–1745. [CrossRef]
- Jin, F.–F.; Kim, S.T.; Bejarano, L. A nonlinear ENSO model and predictability. Journal of Climate 2006, 19, 2398–2415. [CrossRef]
- Basu, S.; Sauchyn, D. Winter storm activity across Canada at the end of the century: A CMIP5 multi-model projection. Atmosphere-Ocean 2023, 62, 183–191. [CrossRef]
Figure 1.
Climatological mean moisture flux vectors (IVT) for winter (DJF) over North America. The vectors indicate dominant, strong westerly flow associated with the mid-latitude jet stream, transporting moisture from the Pacific Ocean. The red box indicates the study domain (246°–264°E, 49°N–53°N).
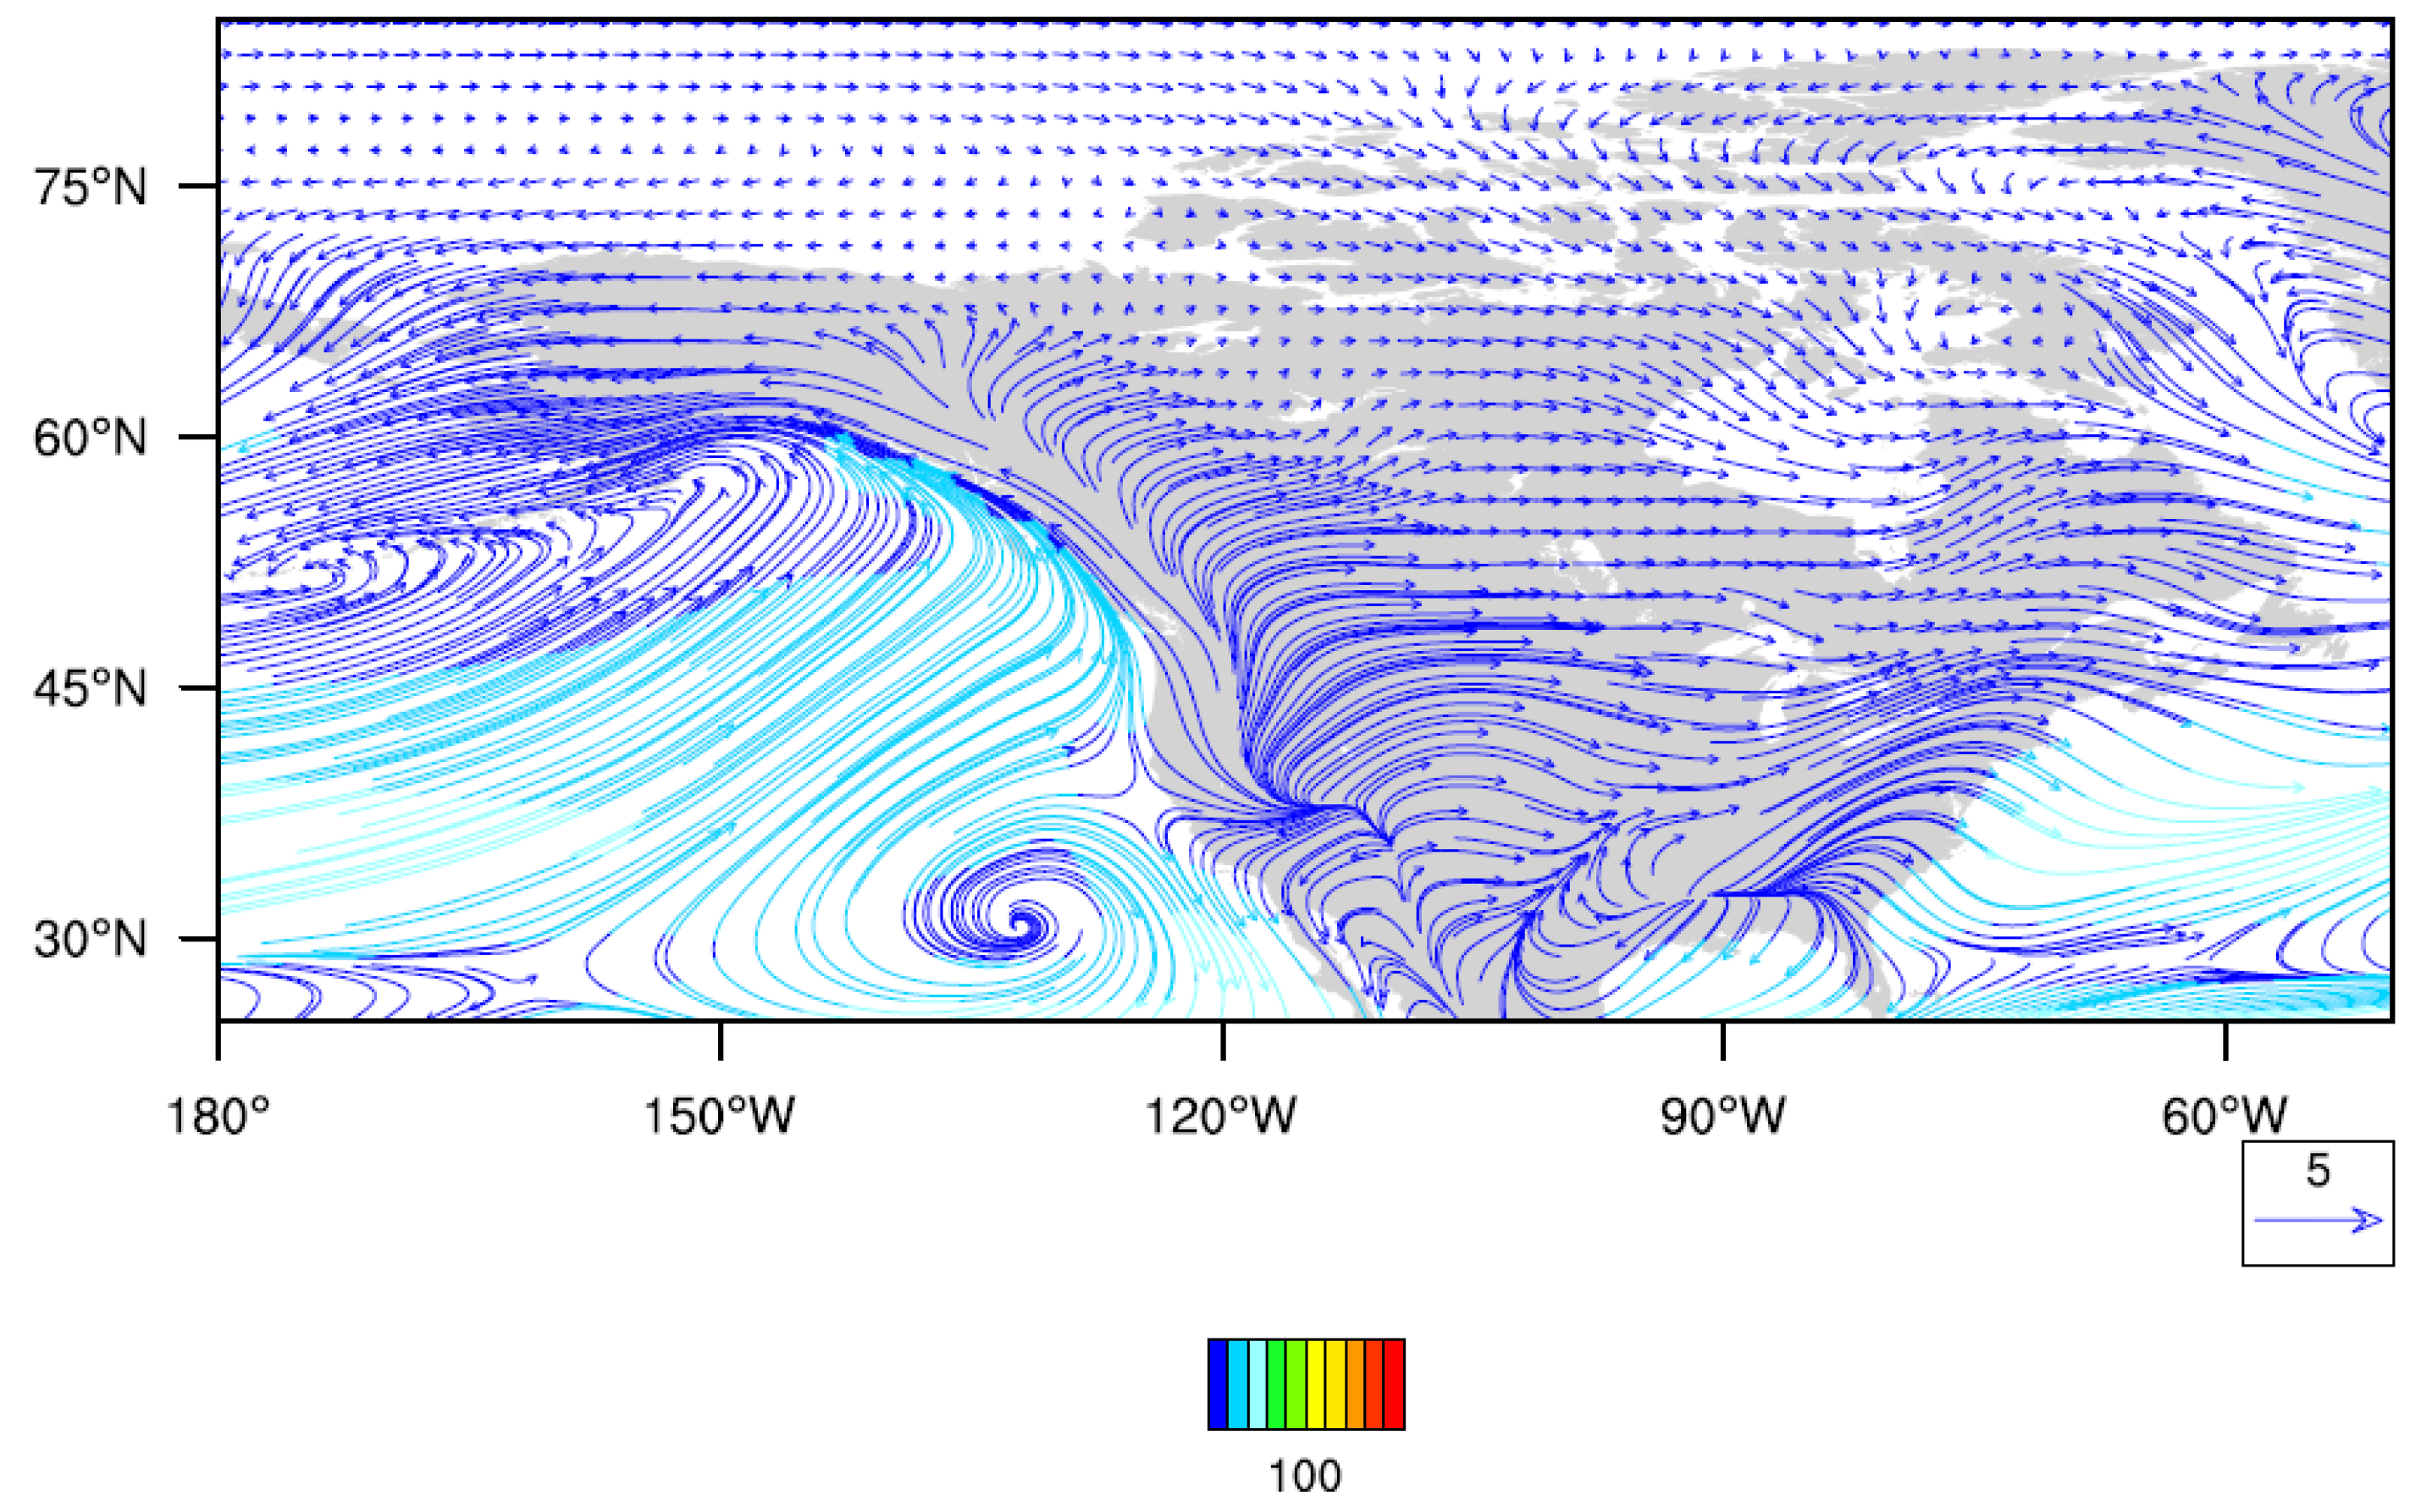
Figure 2.
Climatological mean moisture flux vectors (IVT) for summer (JJA) over North America. The vectors show a strong southerly component, driven by the North American Monsoon and the Great Plains Low-Level Jet, efficiently transporting moisture from the Gulf of Mexico. The red box indicates the study domain.
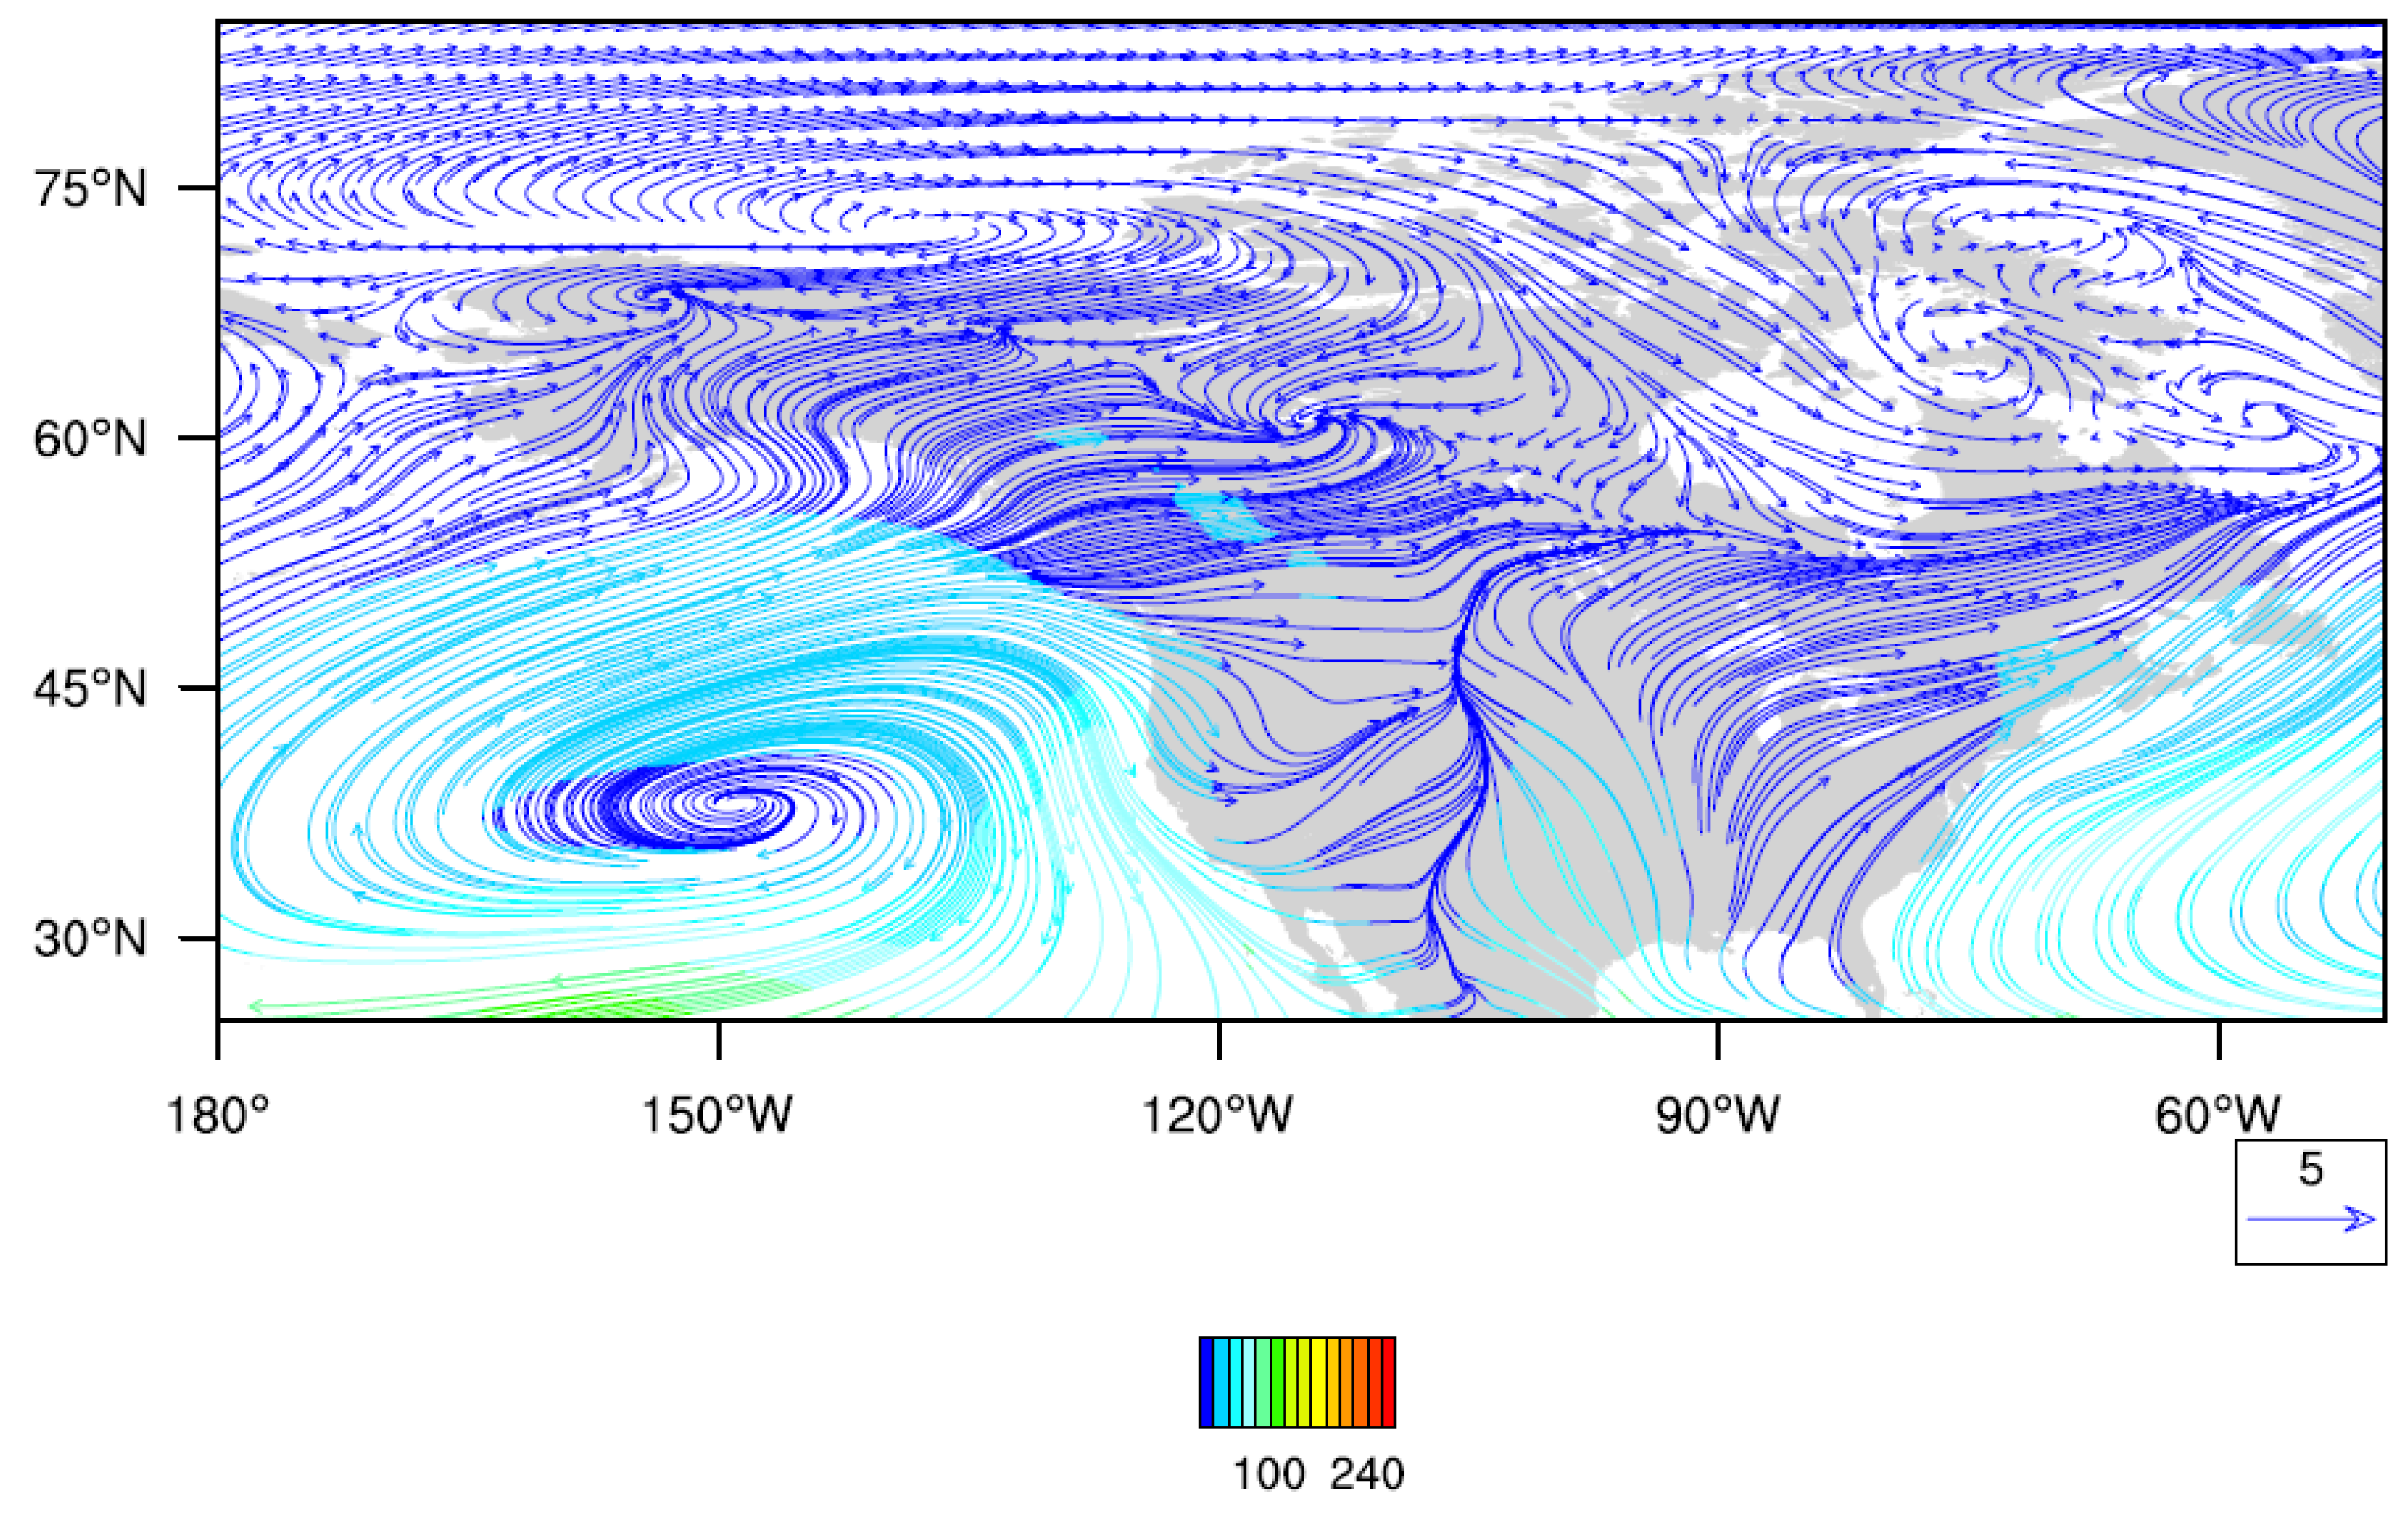
Figure 3.
Standardized anomalies of winter integrated moisture flux components (1979-2022). The dotted line (solid) is summer (winter).
Figure 3.
Standardized anomalies of winter integrated moisture flux components (1979-2022). The dotted line (solid) is summer (winter).
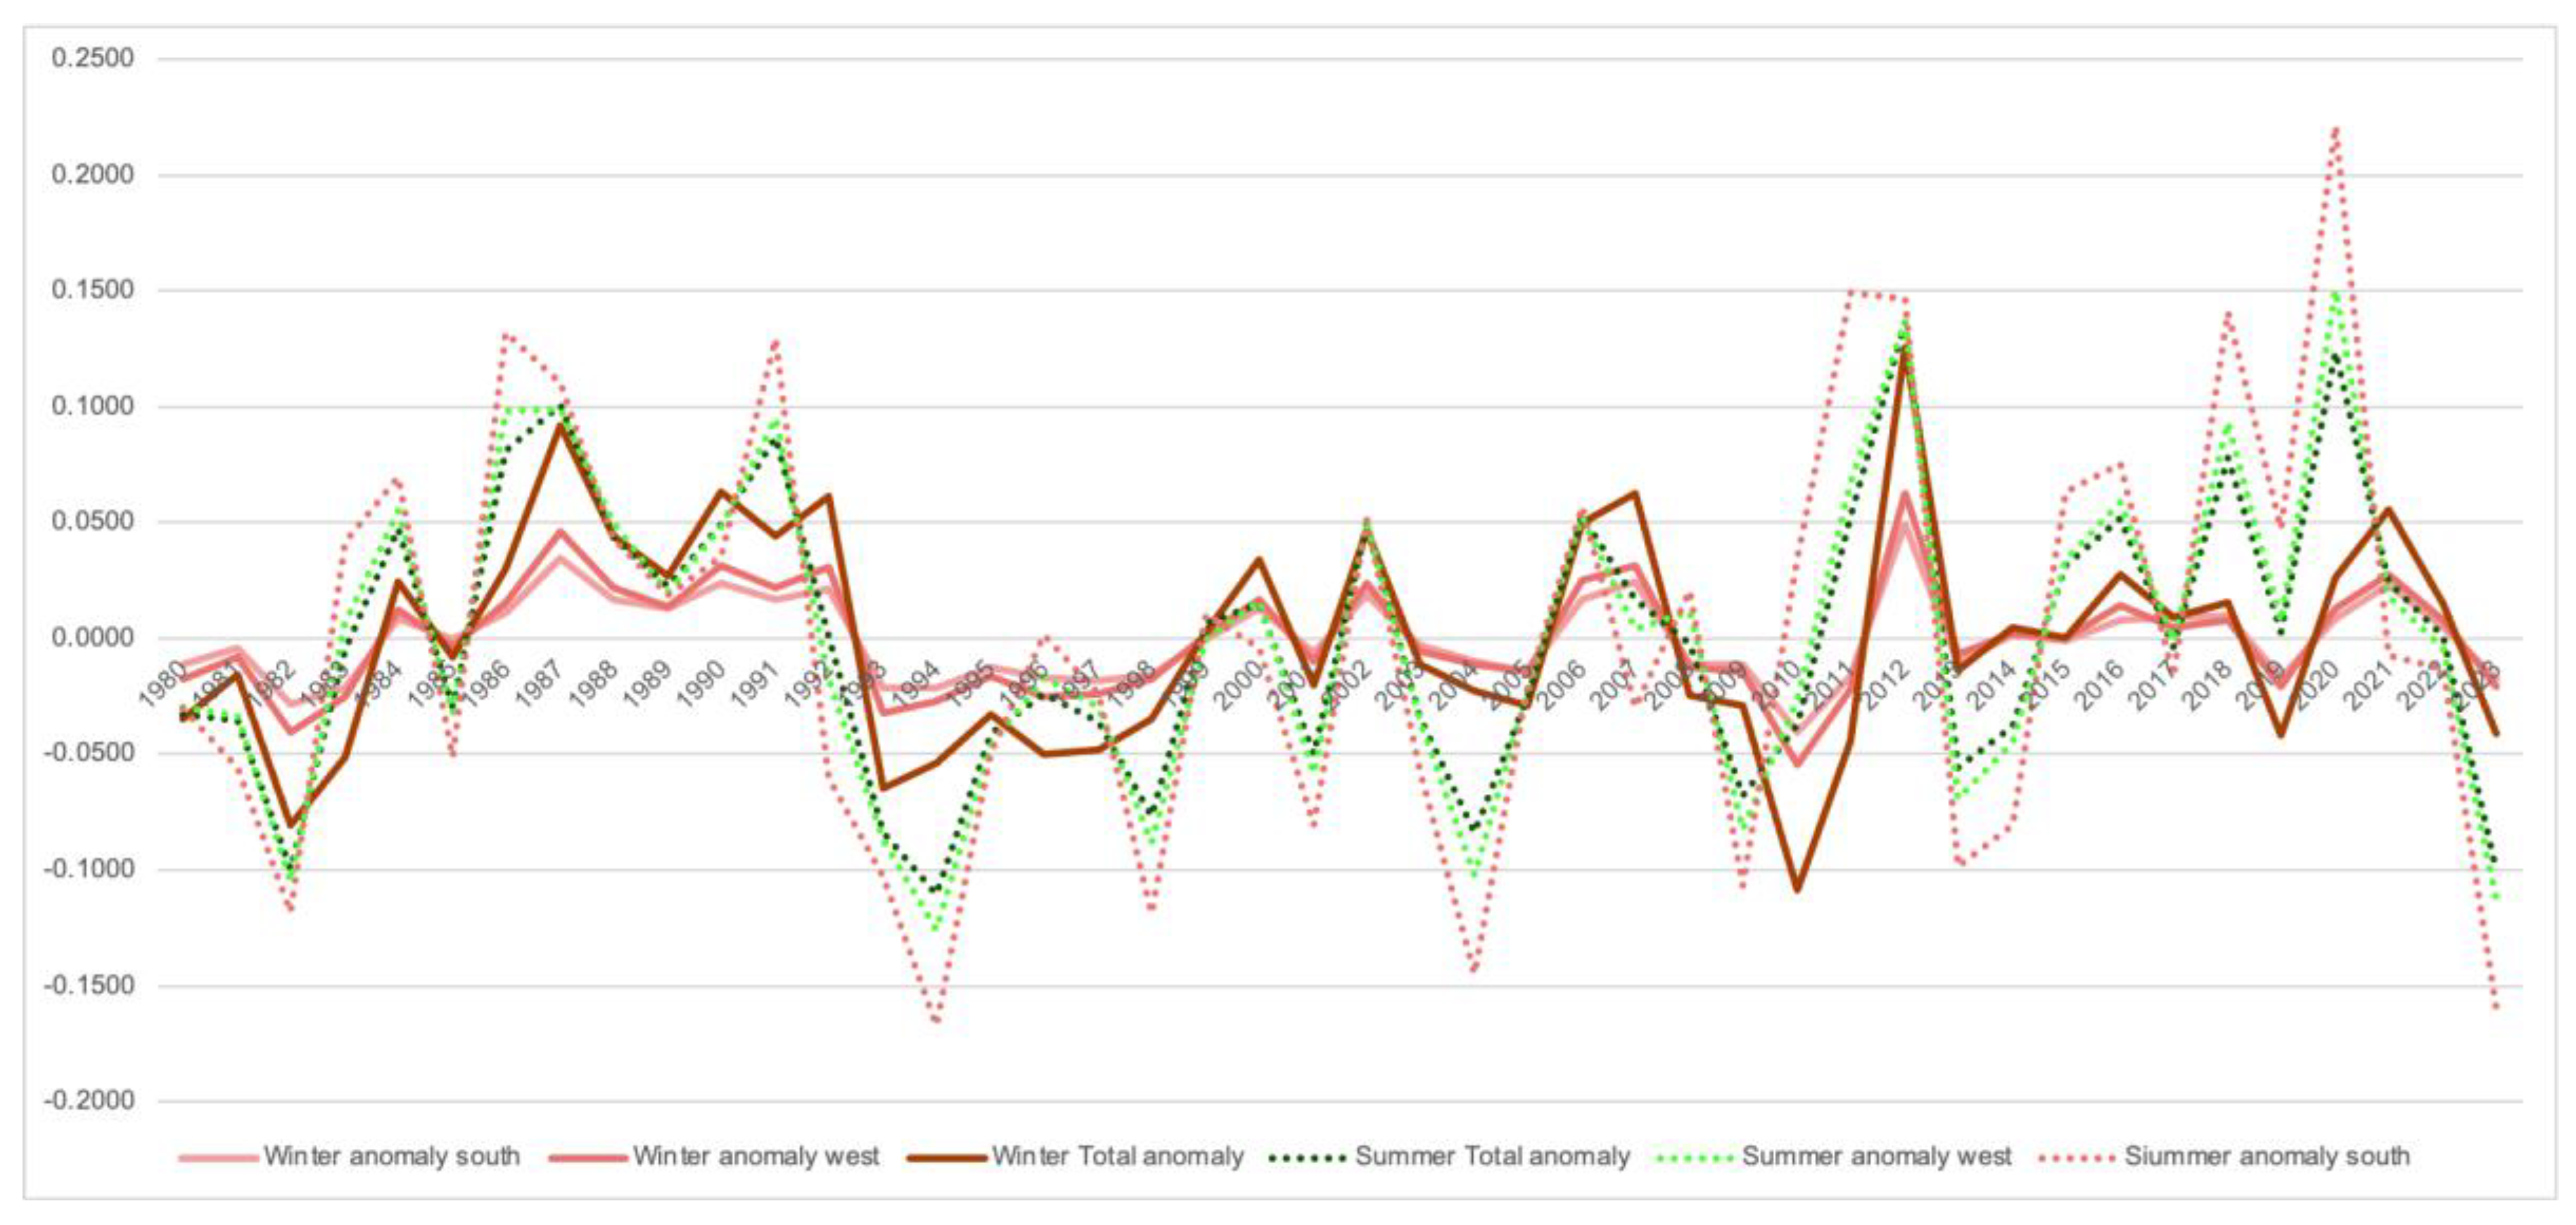
Figure 4.
Winter composite analysis for extreme moisture years. (a) Sea Level Pressure (SLP) for positive (Pos) years, (b) SLP composite for negative (Neg) years, (c) Difference in SLP (Neg - Pos) between composite means. The solid (dotted) contour lines are positive(negative) changes in SLP.
Figure 4.
Winter composite analysis for extreme moisture years. (a) Sea Level Pressure (SLP) for positive (Pos) years, (b) SLP composite for negative (Neg) years, (c) Difference in SLP (Neg - Pos) between composite means. The solid (dotted) contour lines are positive(negative) changes in SLP.
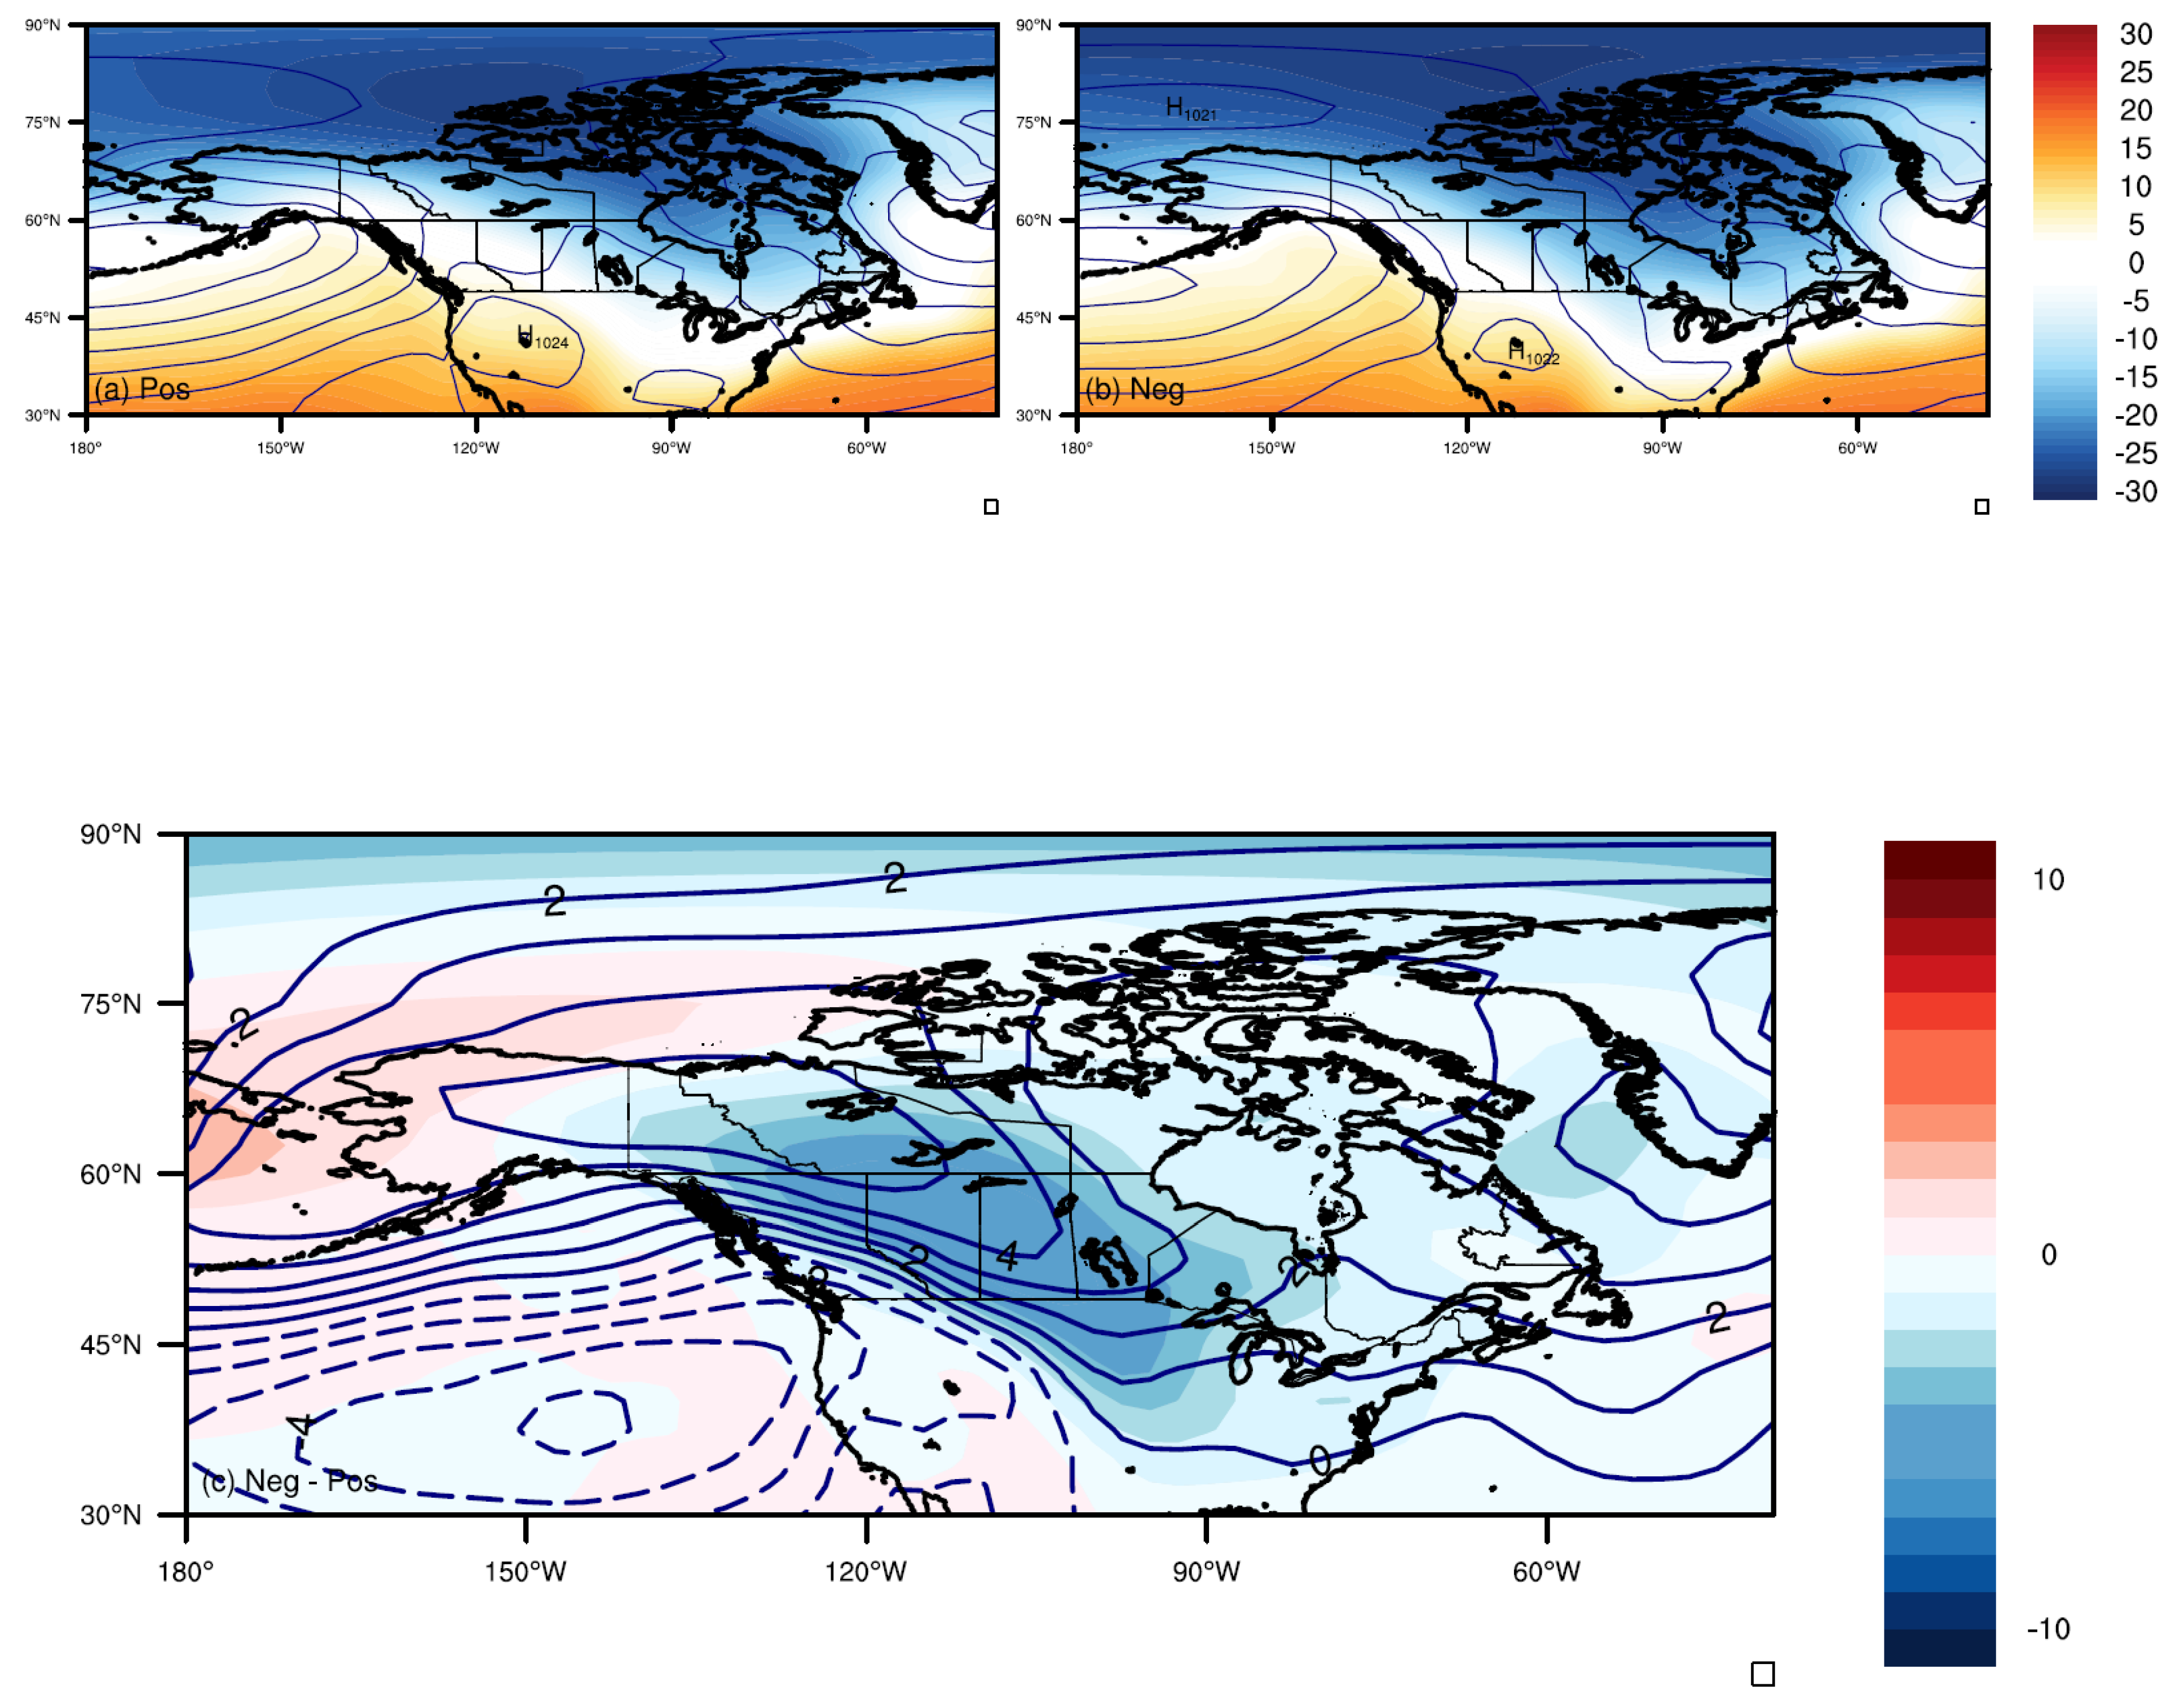
Figure 5.
Summer composite analysis for extreme moisture years. (a) Sea Level Pressure (SLP) and Surface Air Temperature (SAT) composite for positive (Pos) years, (b) SLP and SAT composites for negative (Neg) years, (c) Difference in SLP (Neg - Pos) between composite means.
Figure 5.
Summer composite analysis for extreme moisture years. (a) Sea Level Pressure (SLP) and Surface Air Temperature (SAT) composite for positive (Pos) years, (b) SLP and SAT composites for negative (Neg) years, (c) Difference in SLP (Neg - Pos) between composite means.
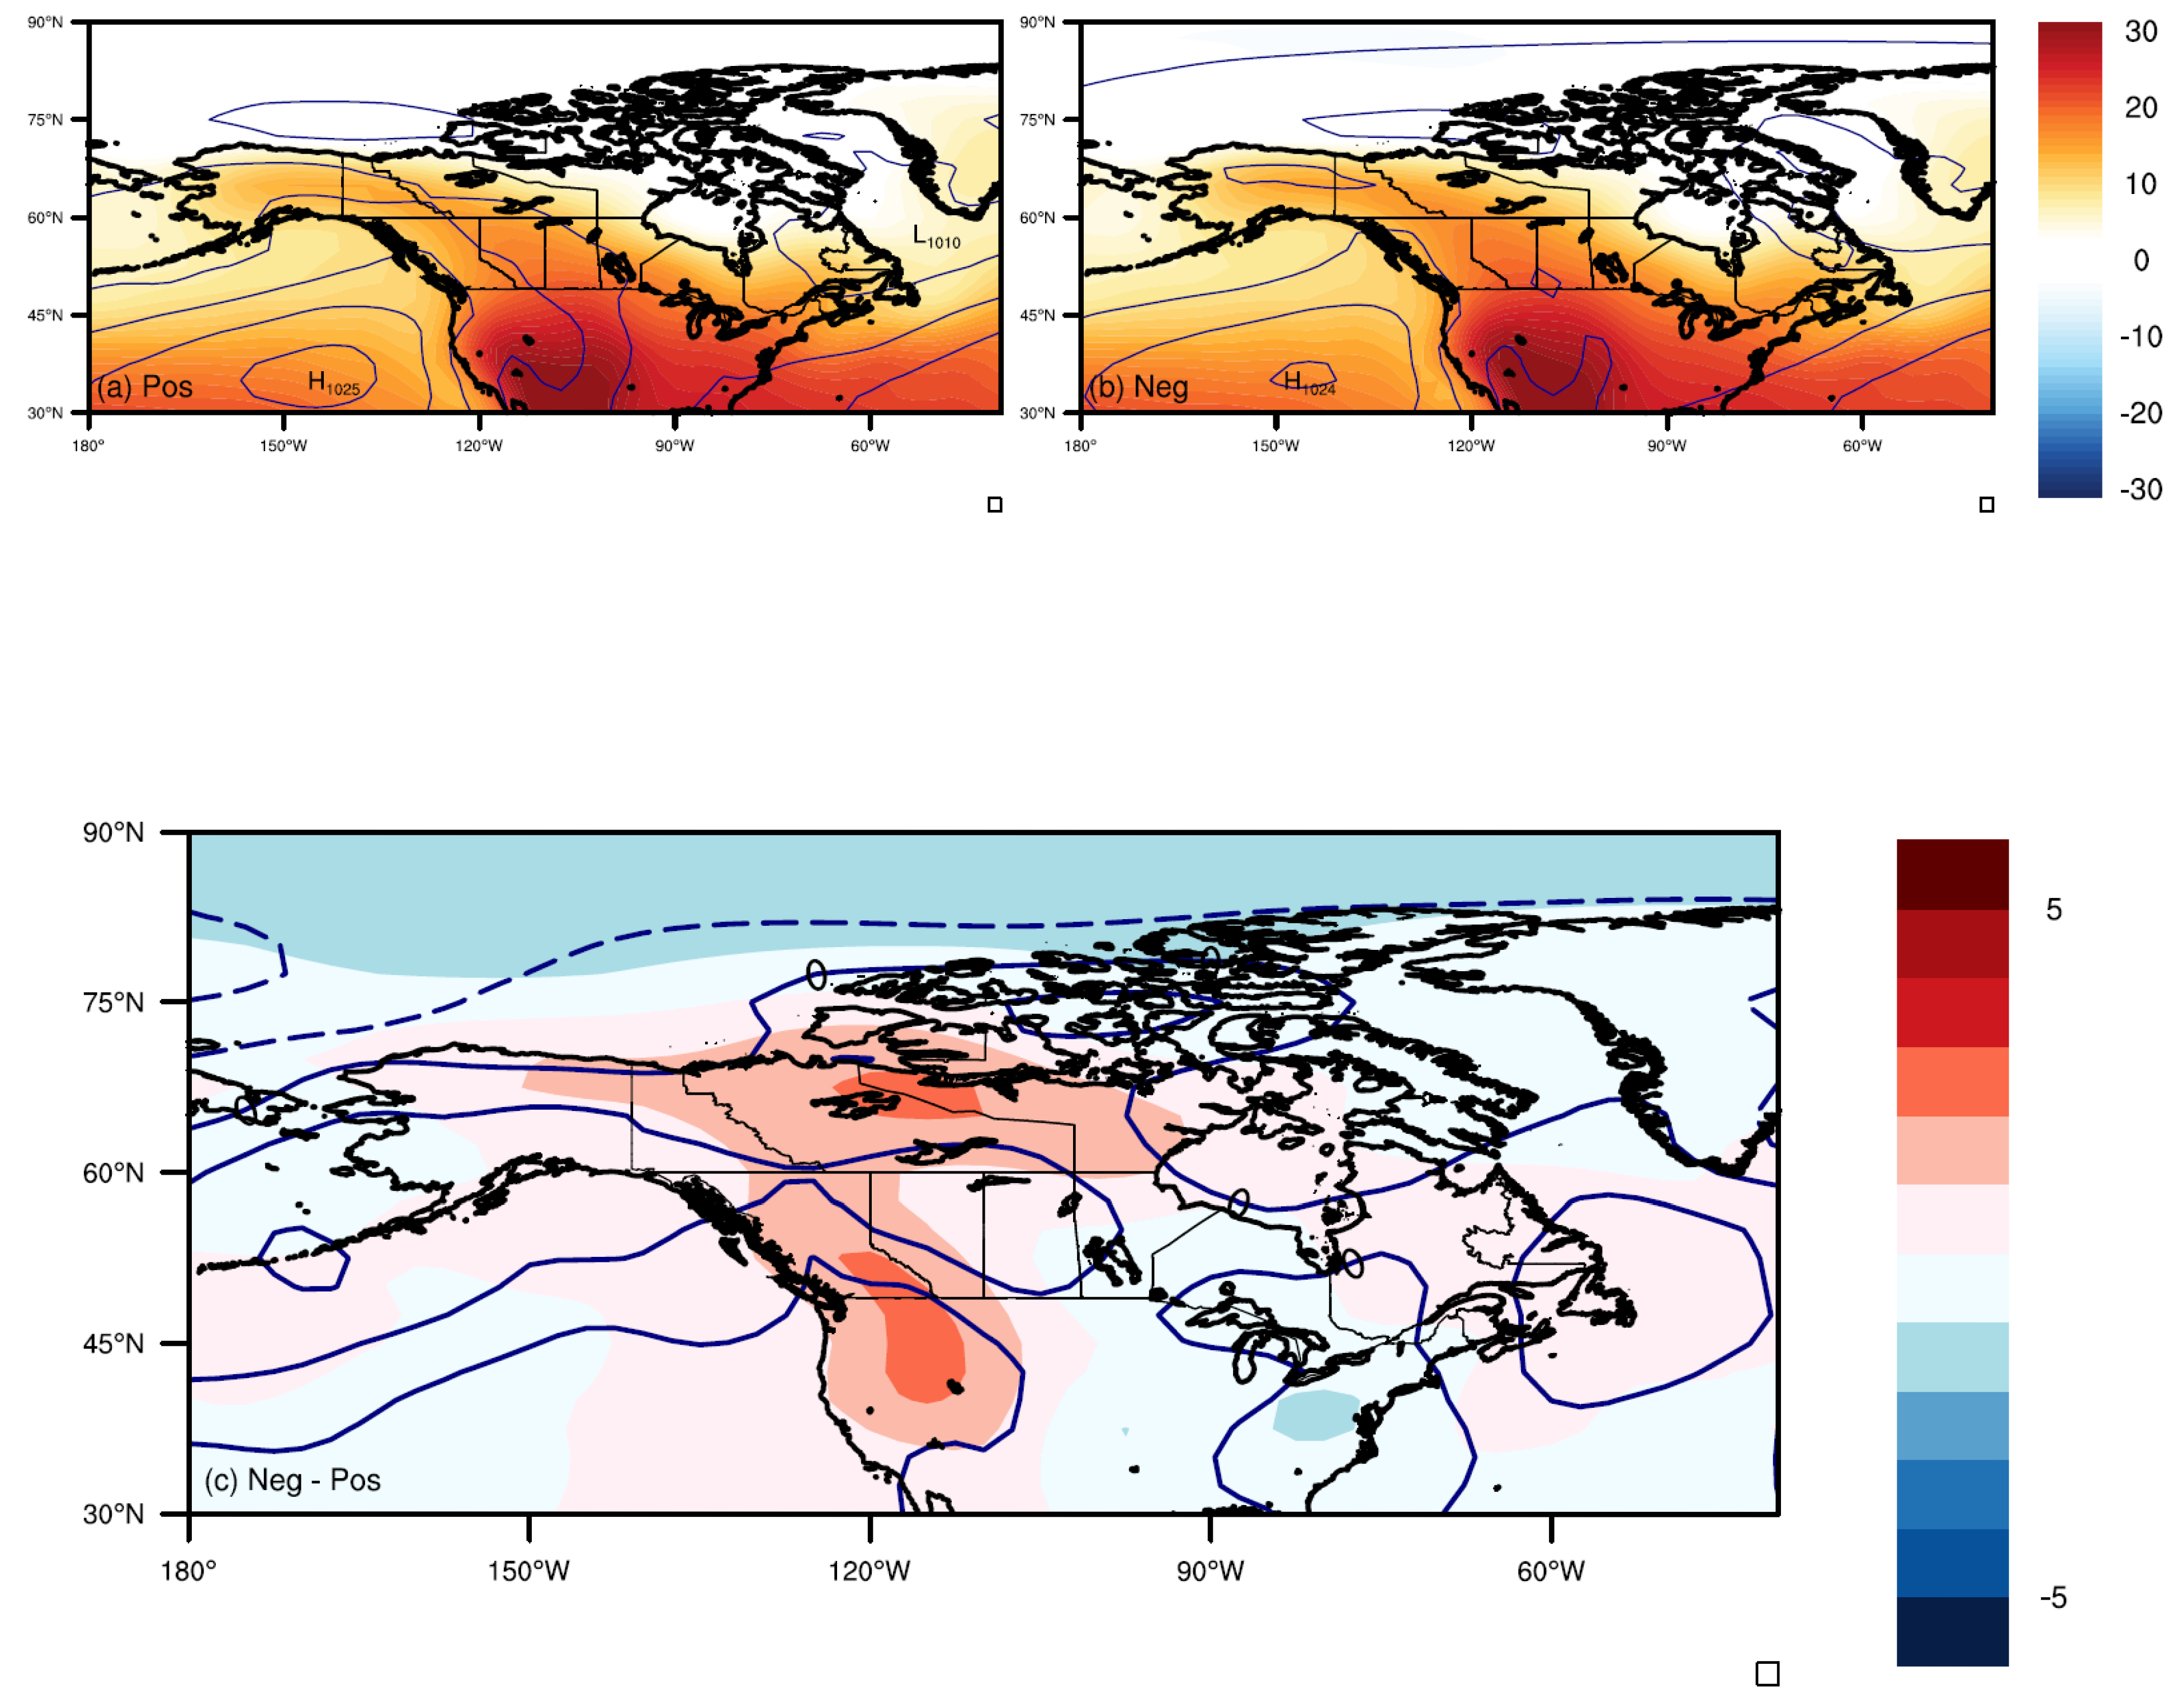
Figure 6.
Winter (DJF) composite analysis of precipitation and cloud cover for extreme moisture years. (a) Composite for positive moisture flux years (Pos), showing increased precipitation (shaded) and cloud cover (solid contours). (b) Composite for negative moisture flux years (Neg), showing decreased precipitation and cloud cover. (c) Difference map (Neg – Pos), illustrating negative precipitation anomalies (shaded) and positive (negative) cloud cover anomalies (solid (dashed) contours.
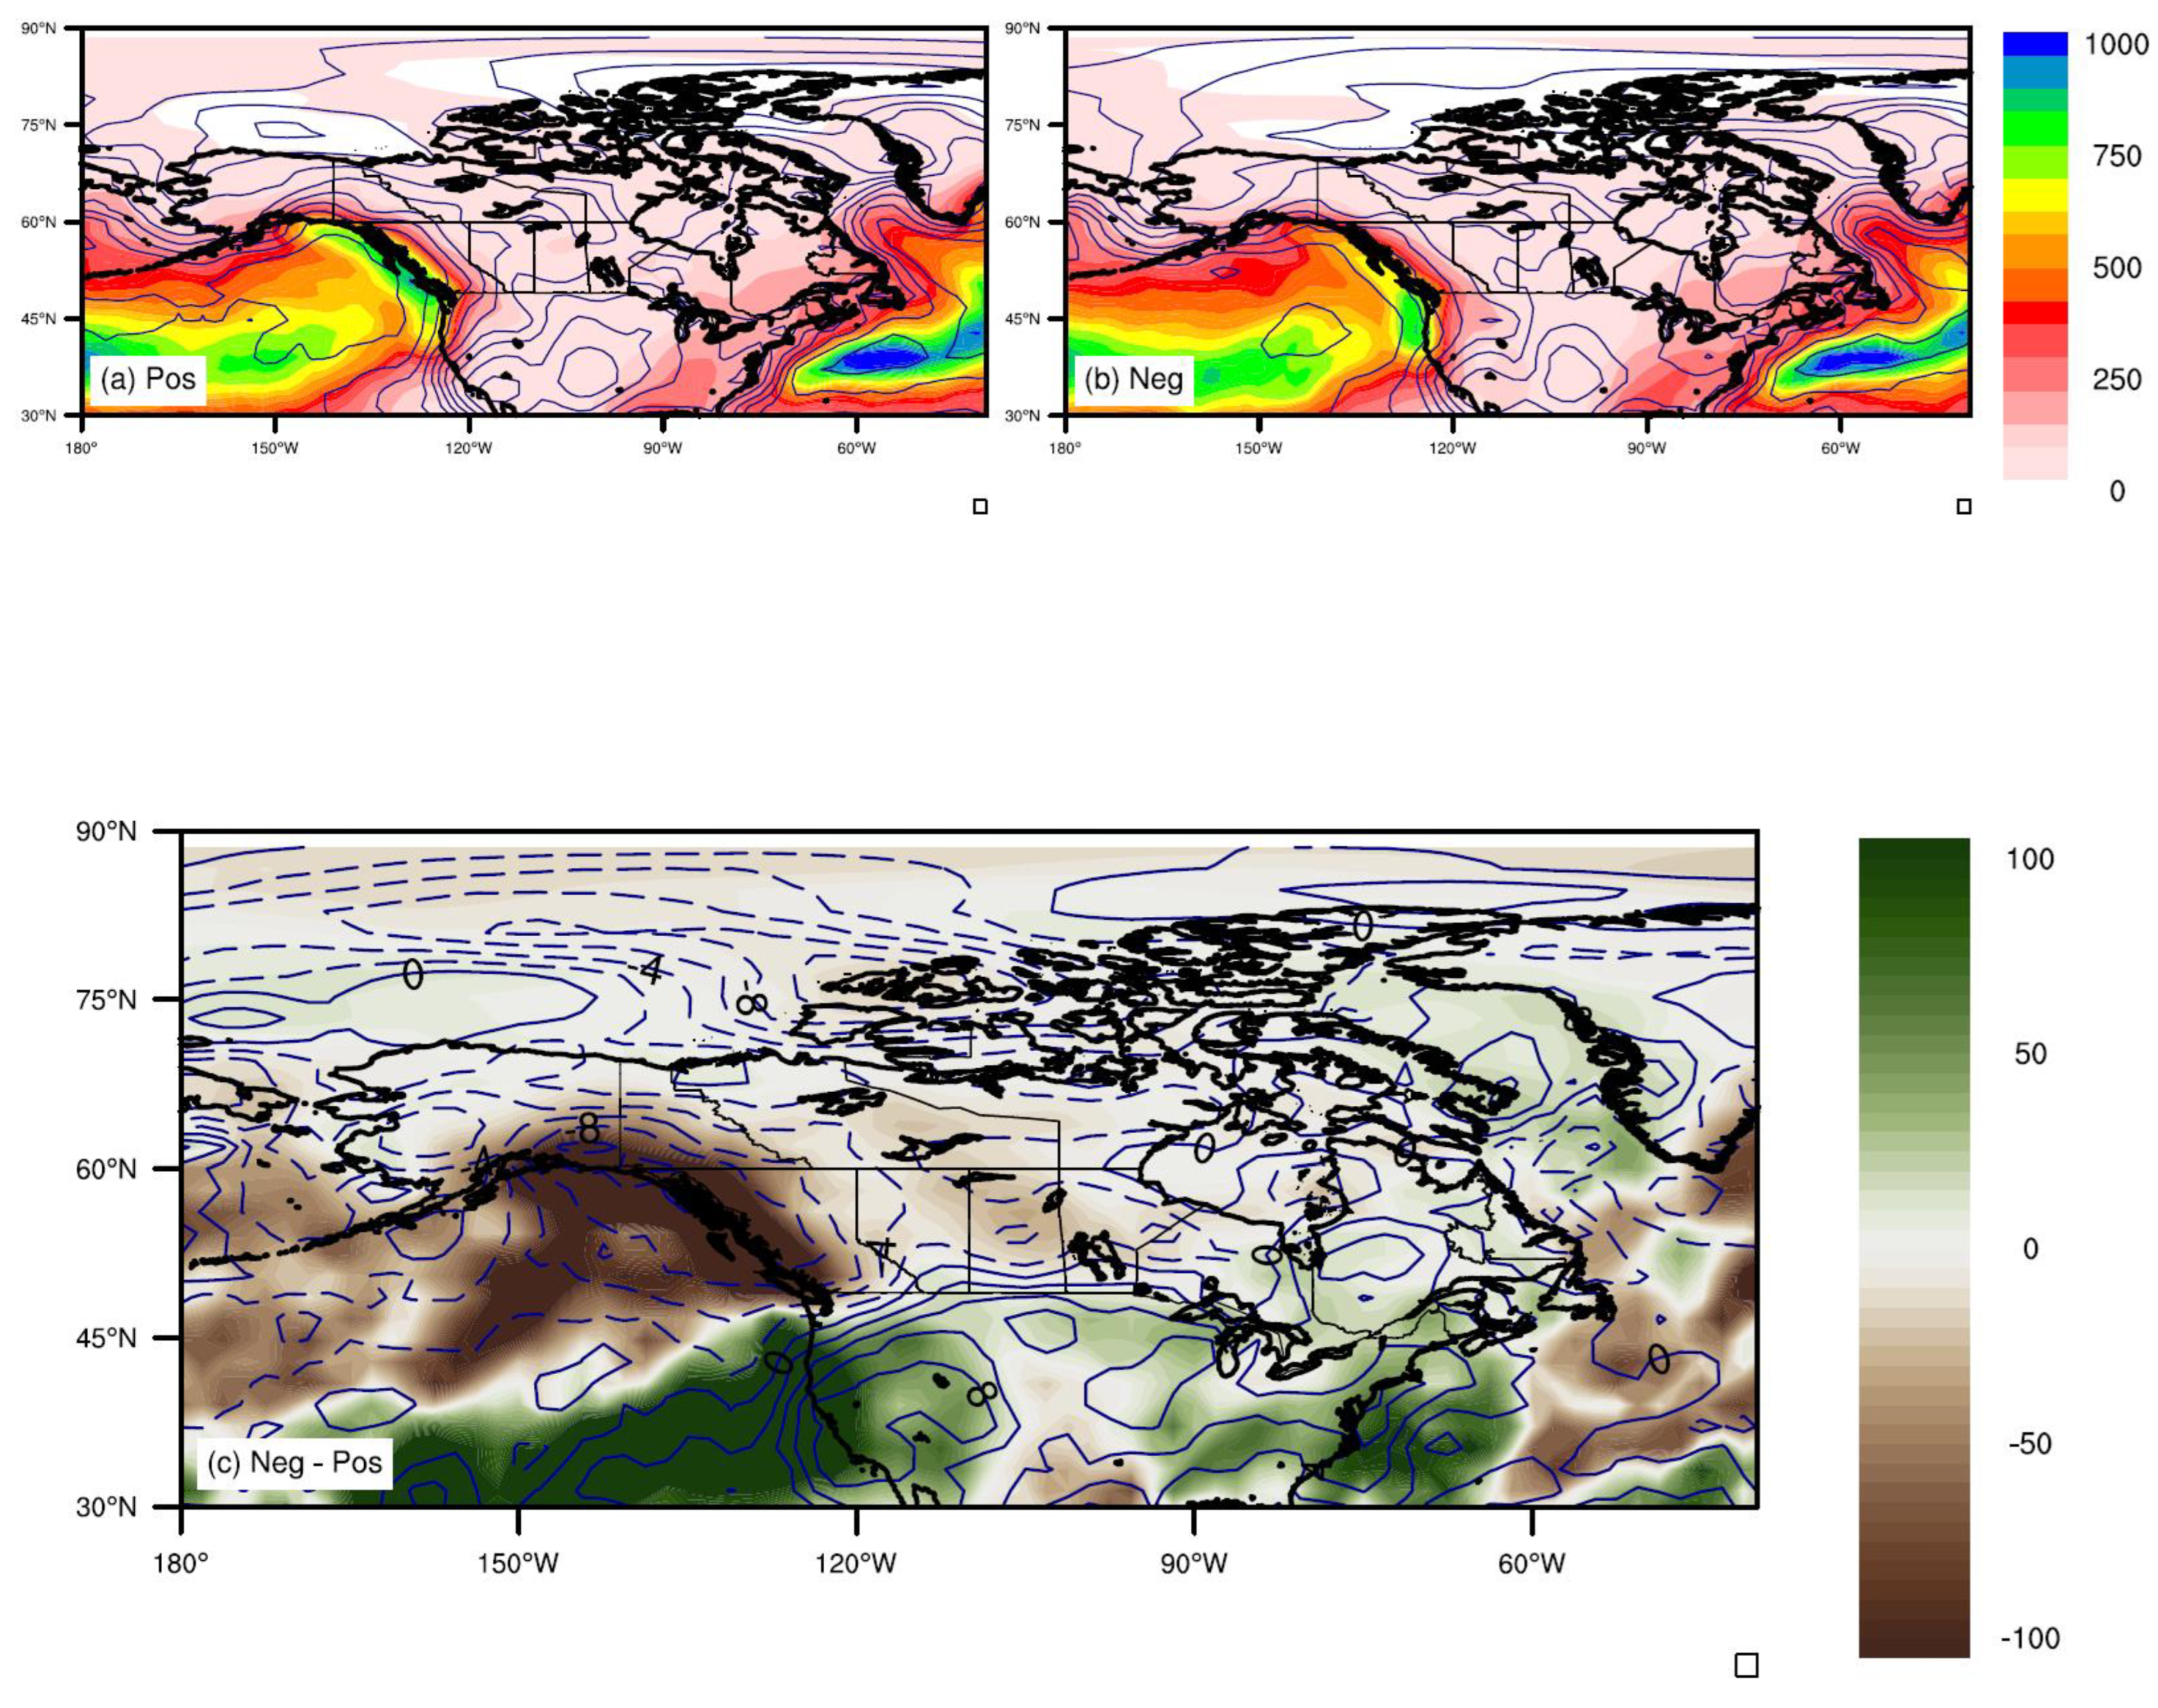
Figure 7.
Summer (JJA) composite analysis of precipitation and cloud cover for extreme moisture years. (a) Composite for positive moisture flux years (Pos), showing a band of increased precipitation (shaded) and cloud cover (solid contours) along the eastern slopes of the Rockies and southern Prairies. (b) Composite for negative moisture flux years (Neg), showing a reduction in precipitation and cloud cover. (c) Difference map (Neg – Pos), precipitation anomalies (shaded) and positive (negative) cloud cover anomalies (solid (dashed) contours.
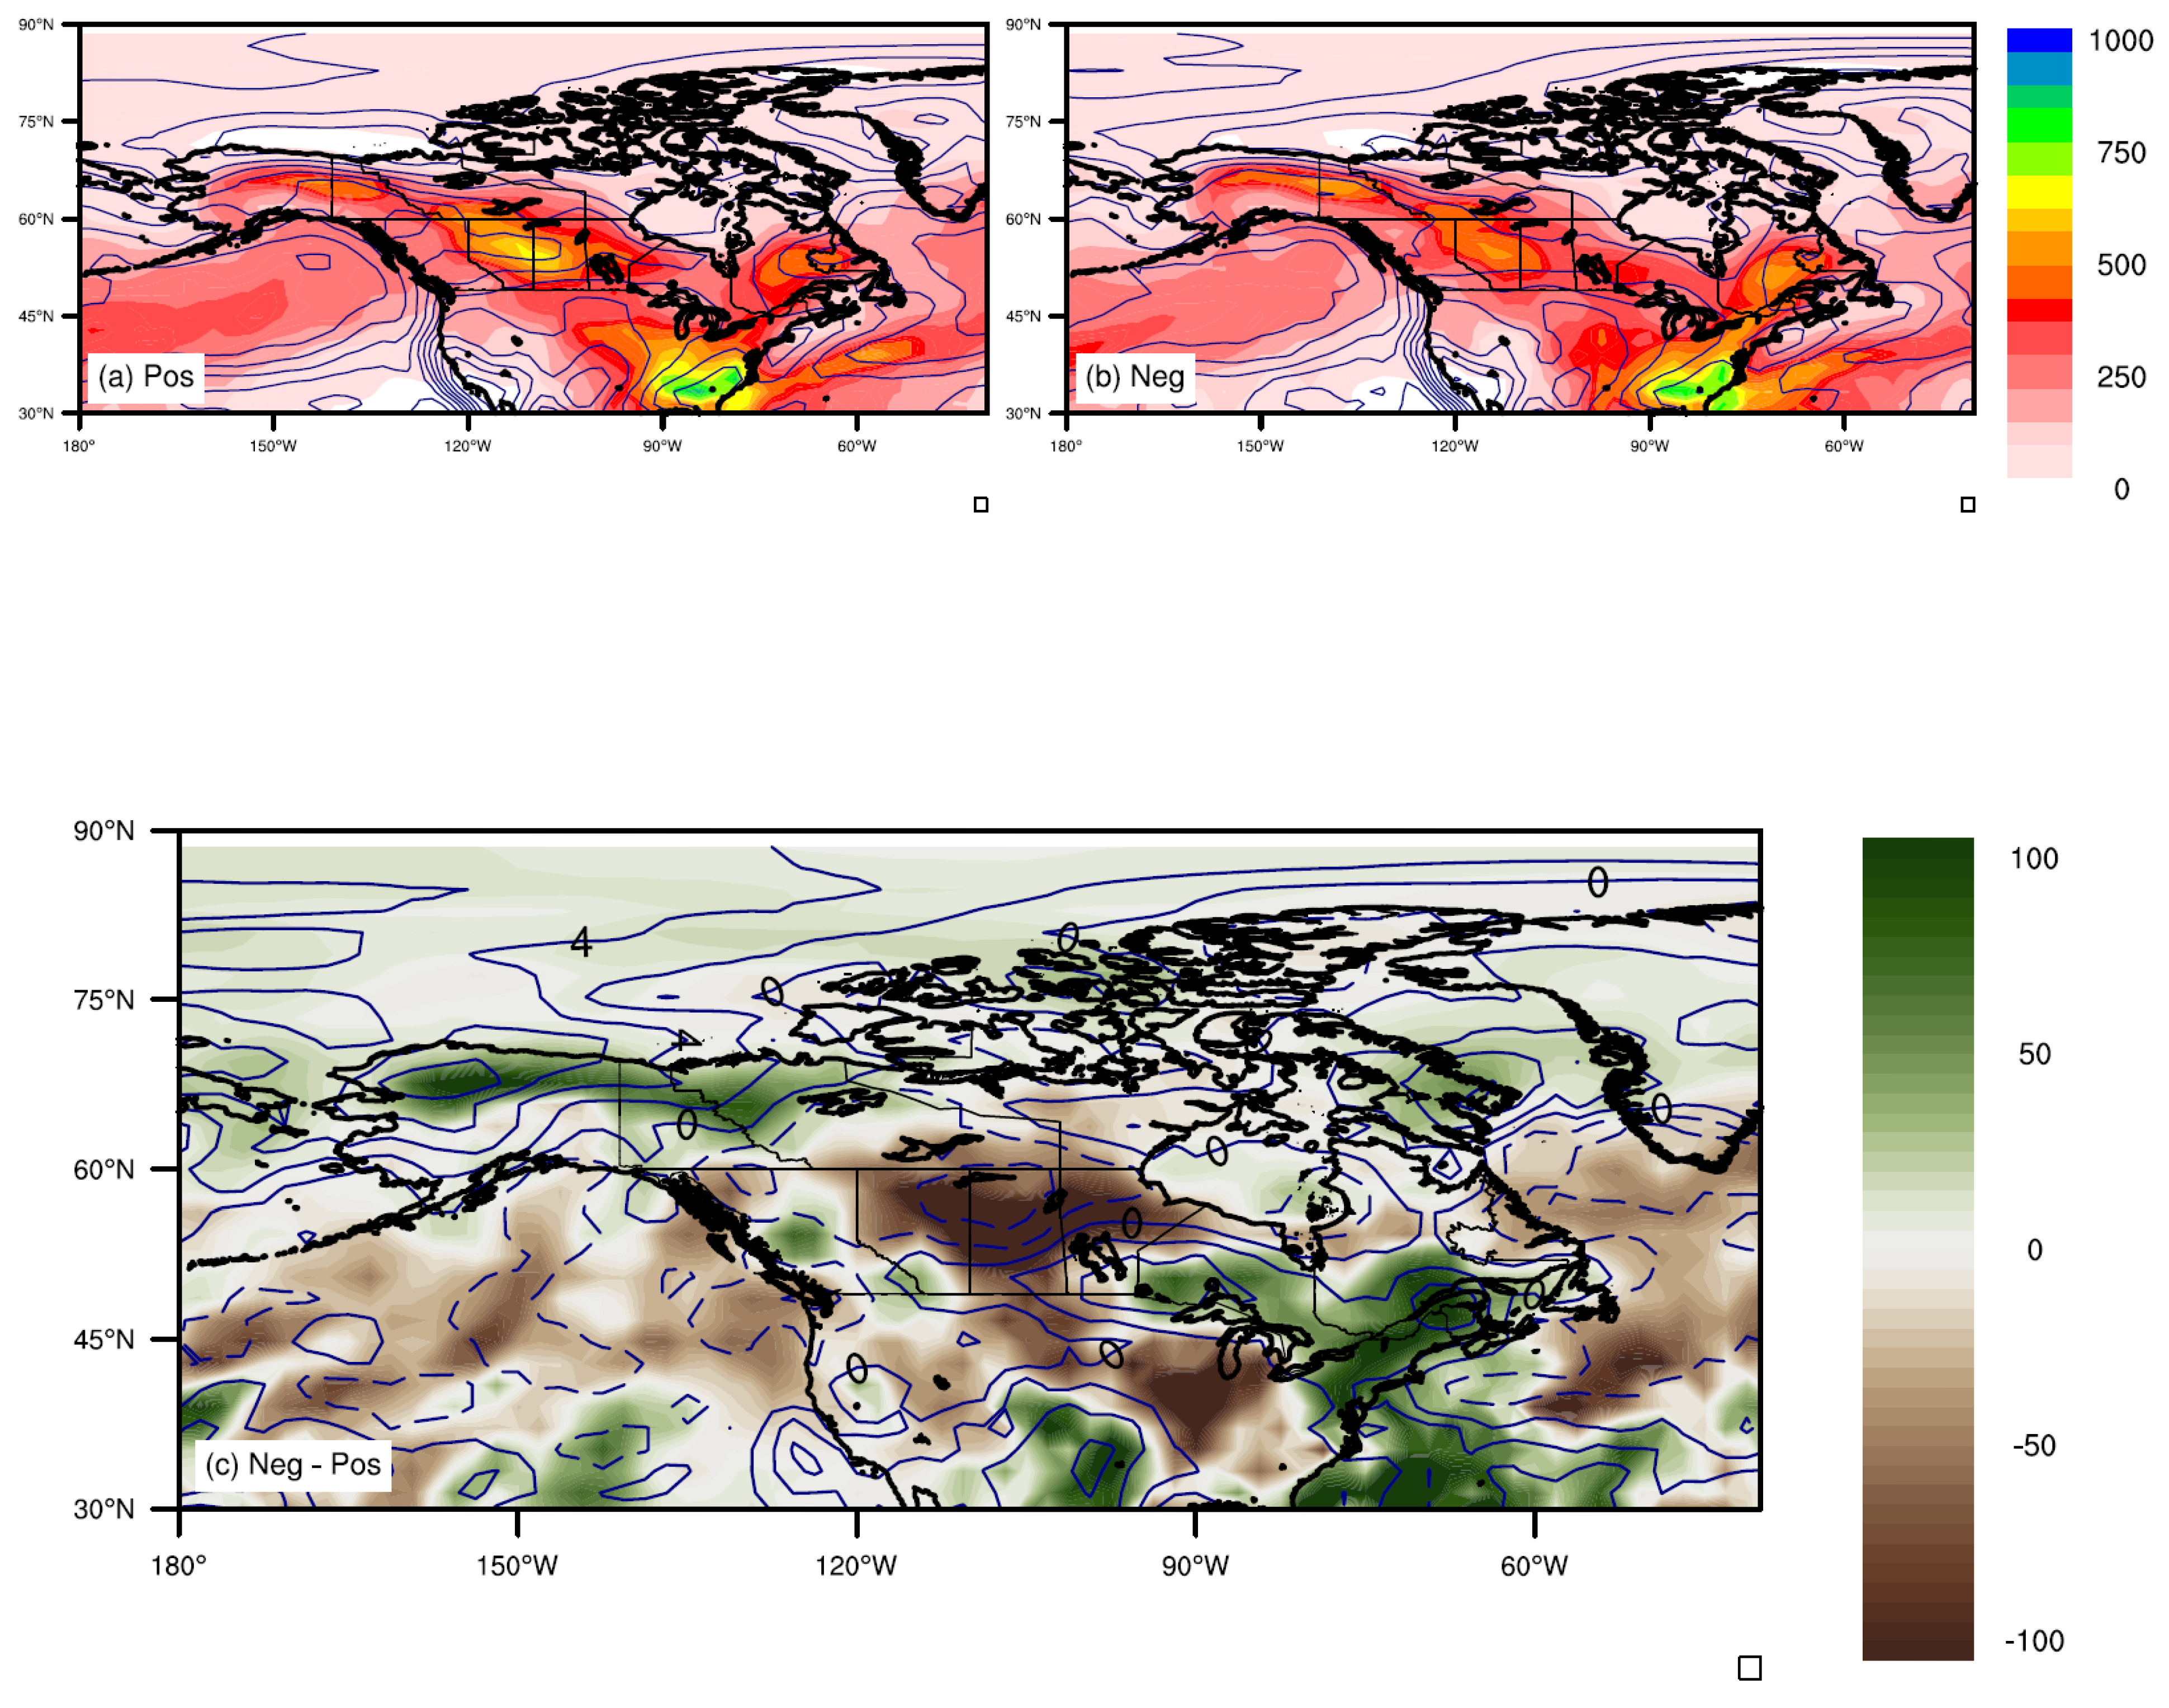
Figure 8.
Winter Sea Surface Temperature (SST) composite for (a) Positive (Pos) moisture years, (b) Negative (Neg) years, (c) Difference (Neg – Pos).
Figure 8.
Winter Sea Surface Temperature (SST) composite for (a) Positive (Pos) moisture years, (b) Negative (Neg) years, (c) Difference (Neg – Pos).
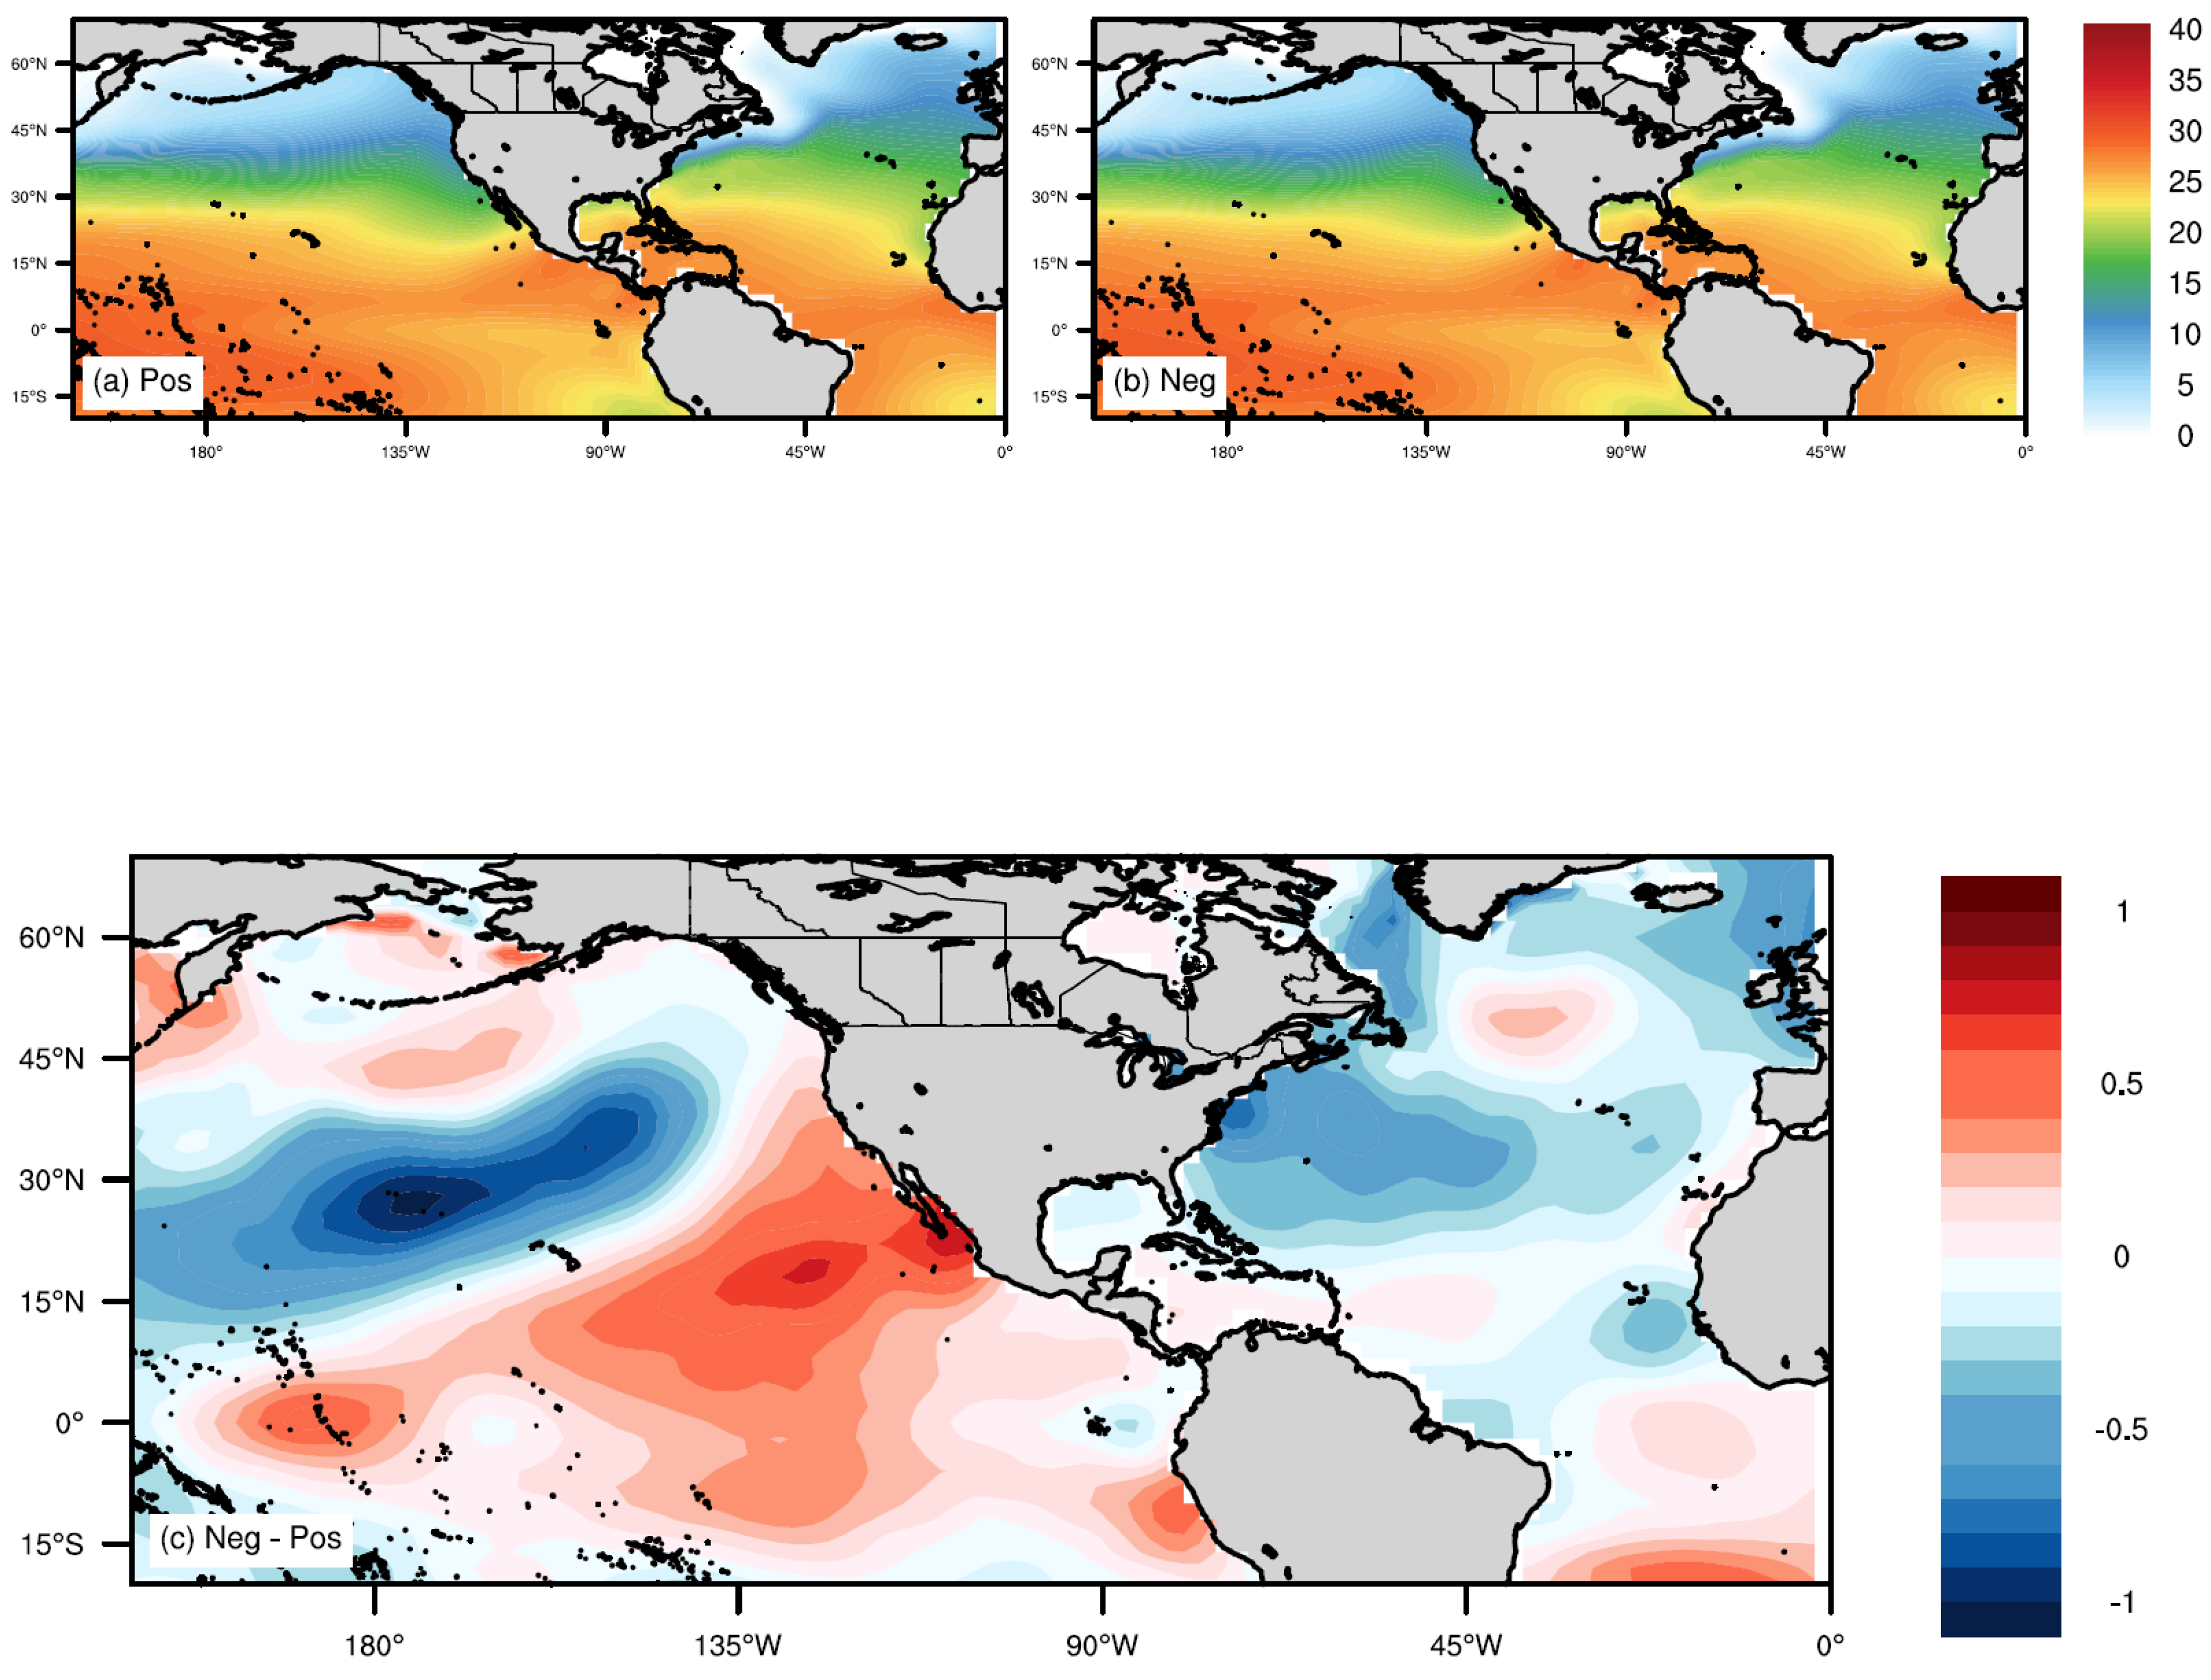
Figure 9.
Summer Sea Surface Temperature (SST) for (a) Pos, (b) Neg and (c) difference (Neg - Pos).
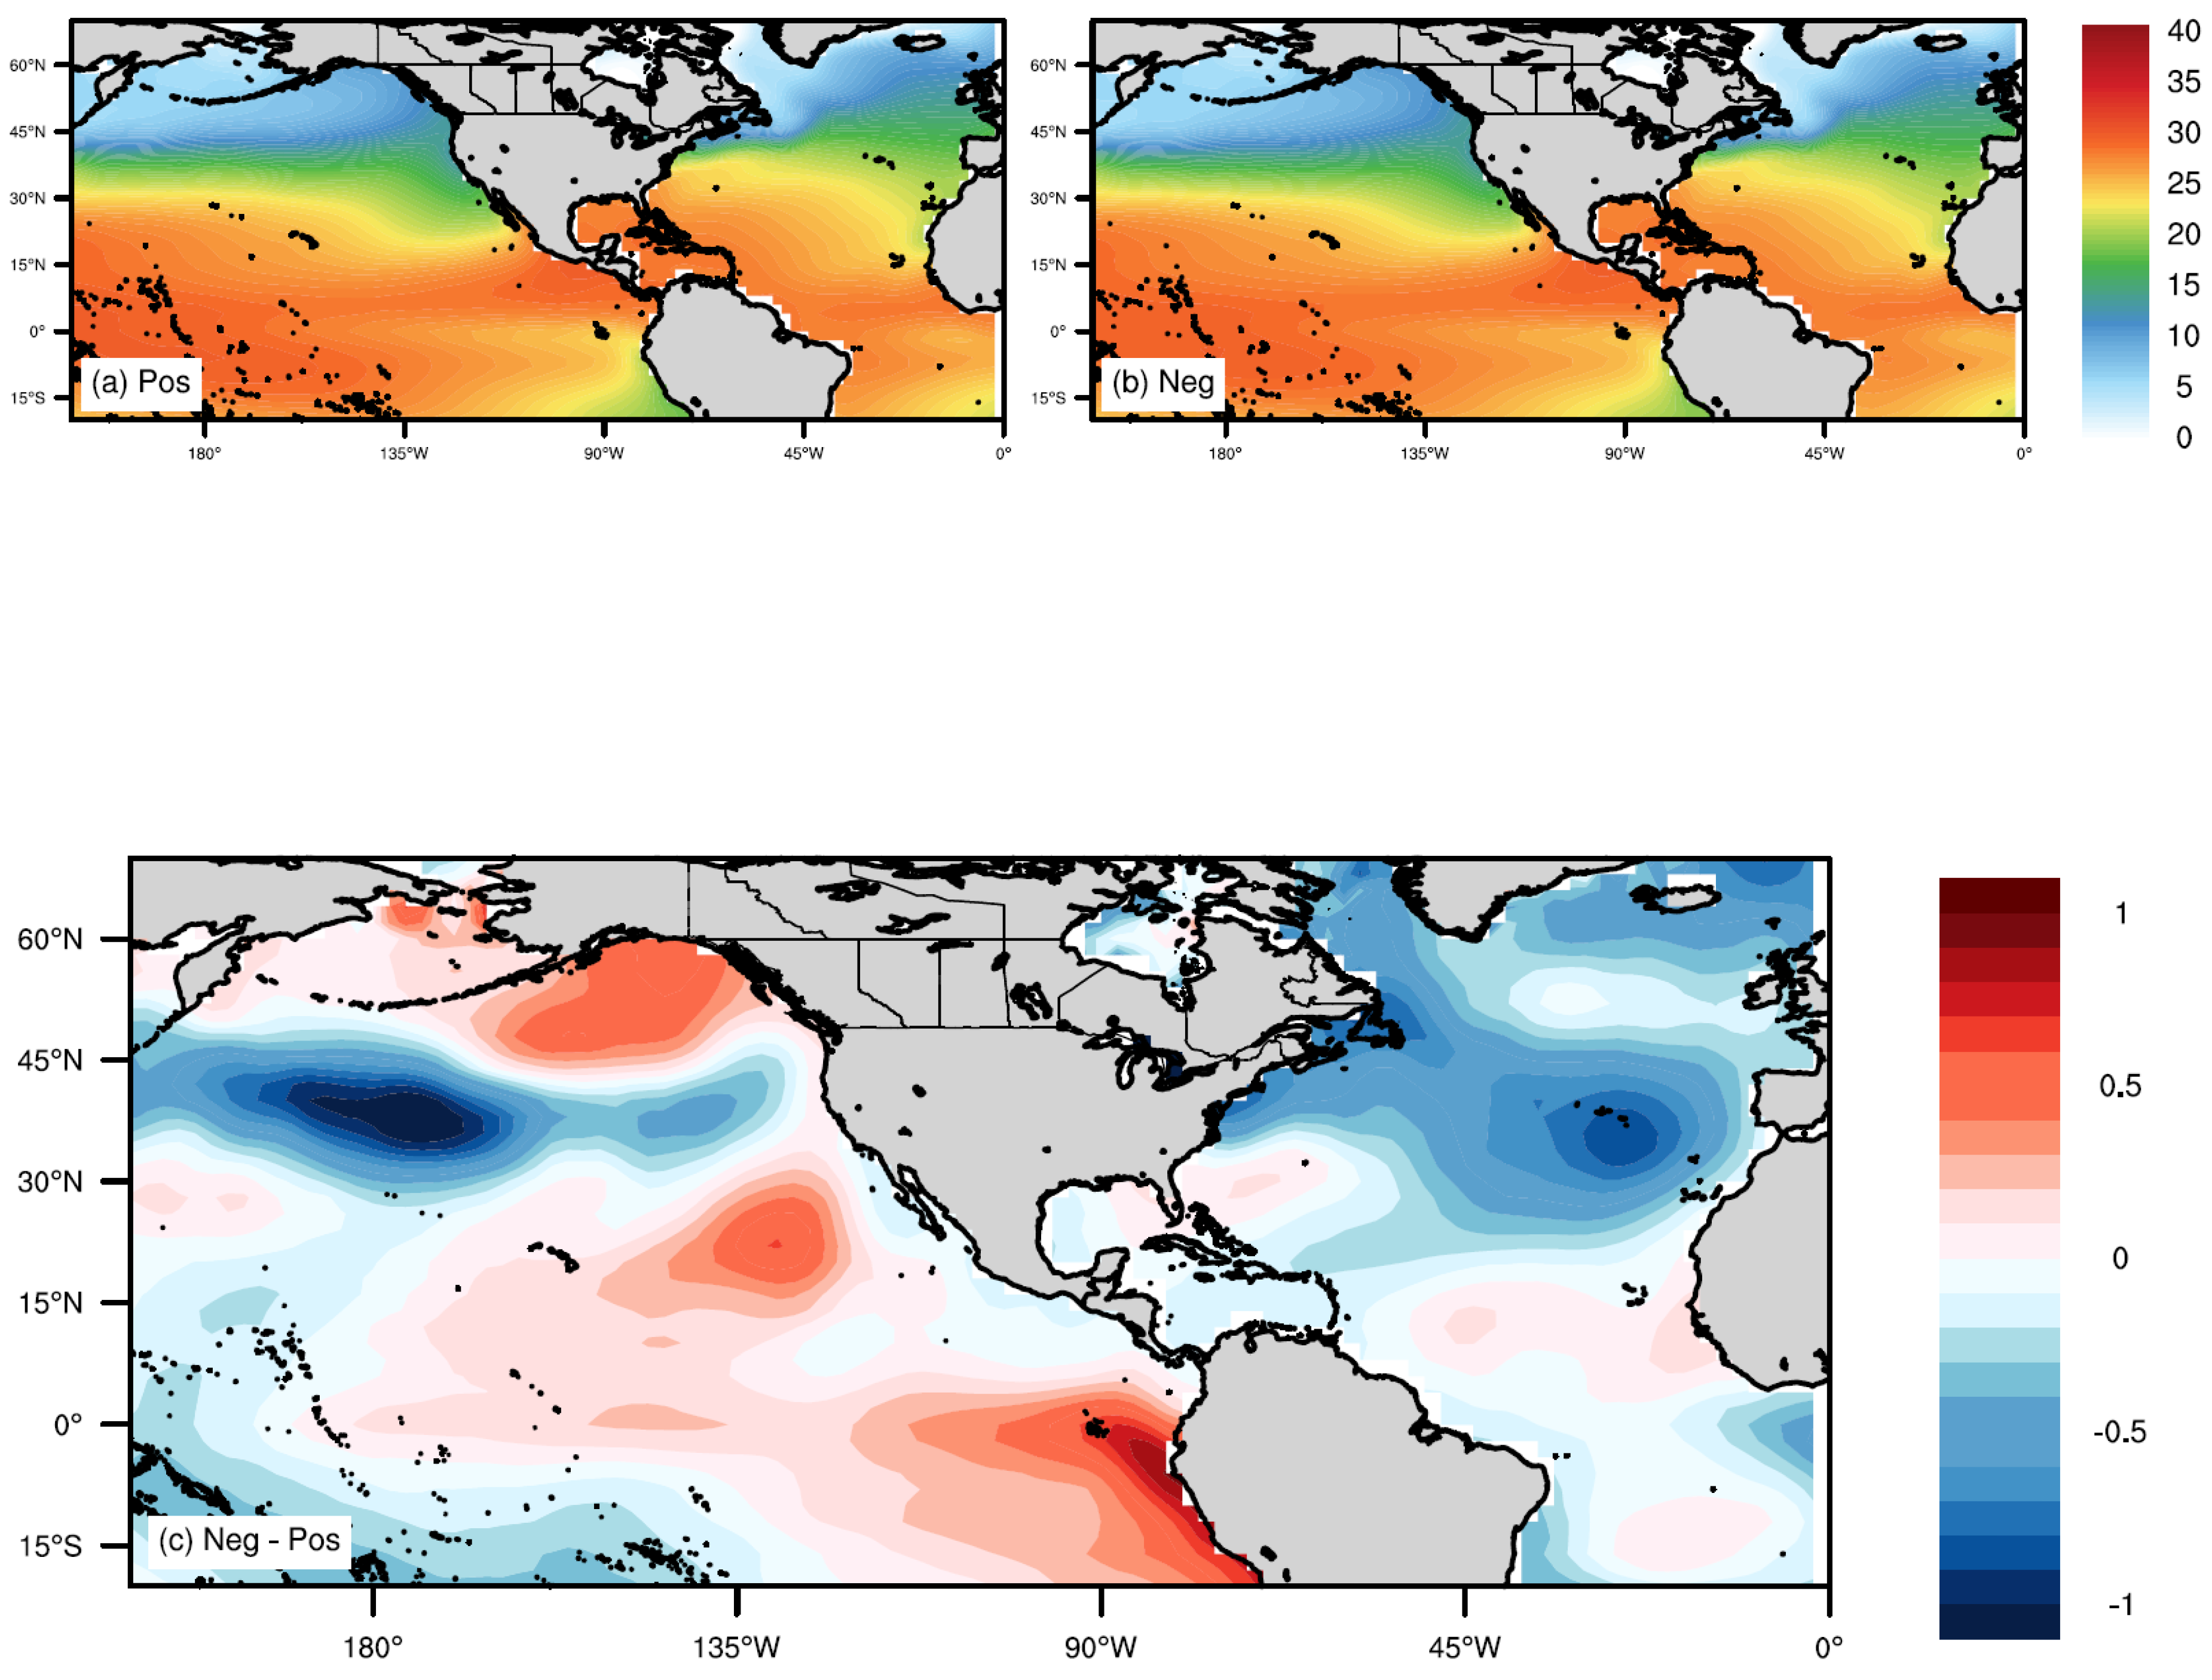
Figure 10.
EOF modes of the zonal component (QU) of winter moisture flux.
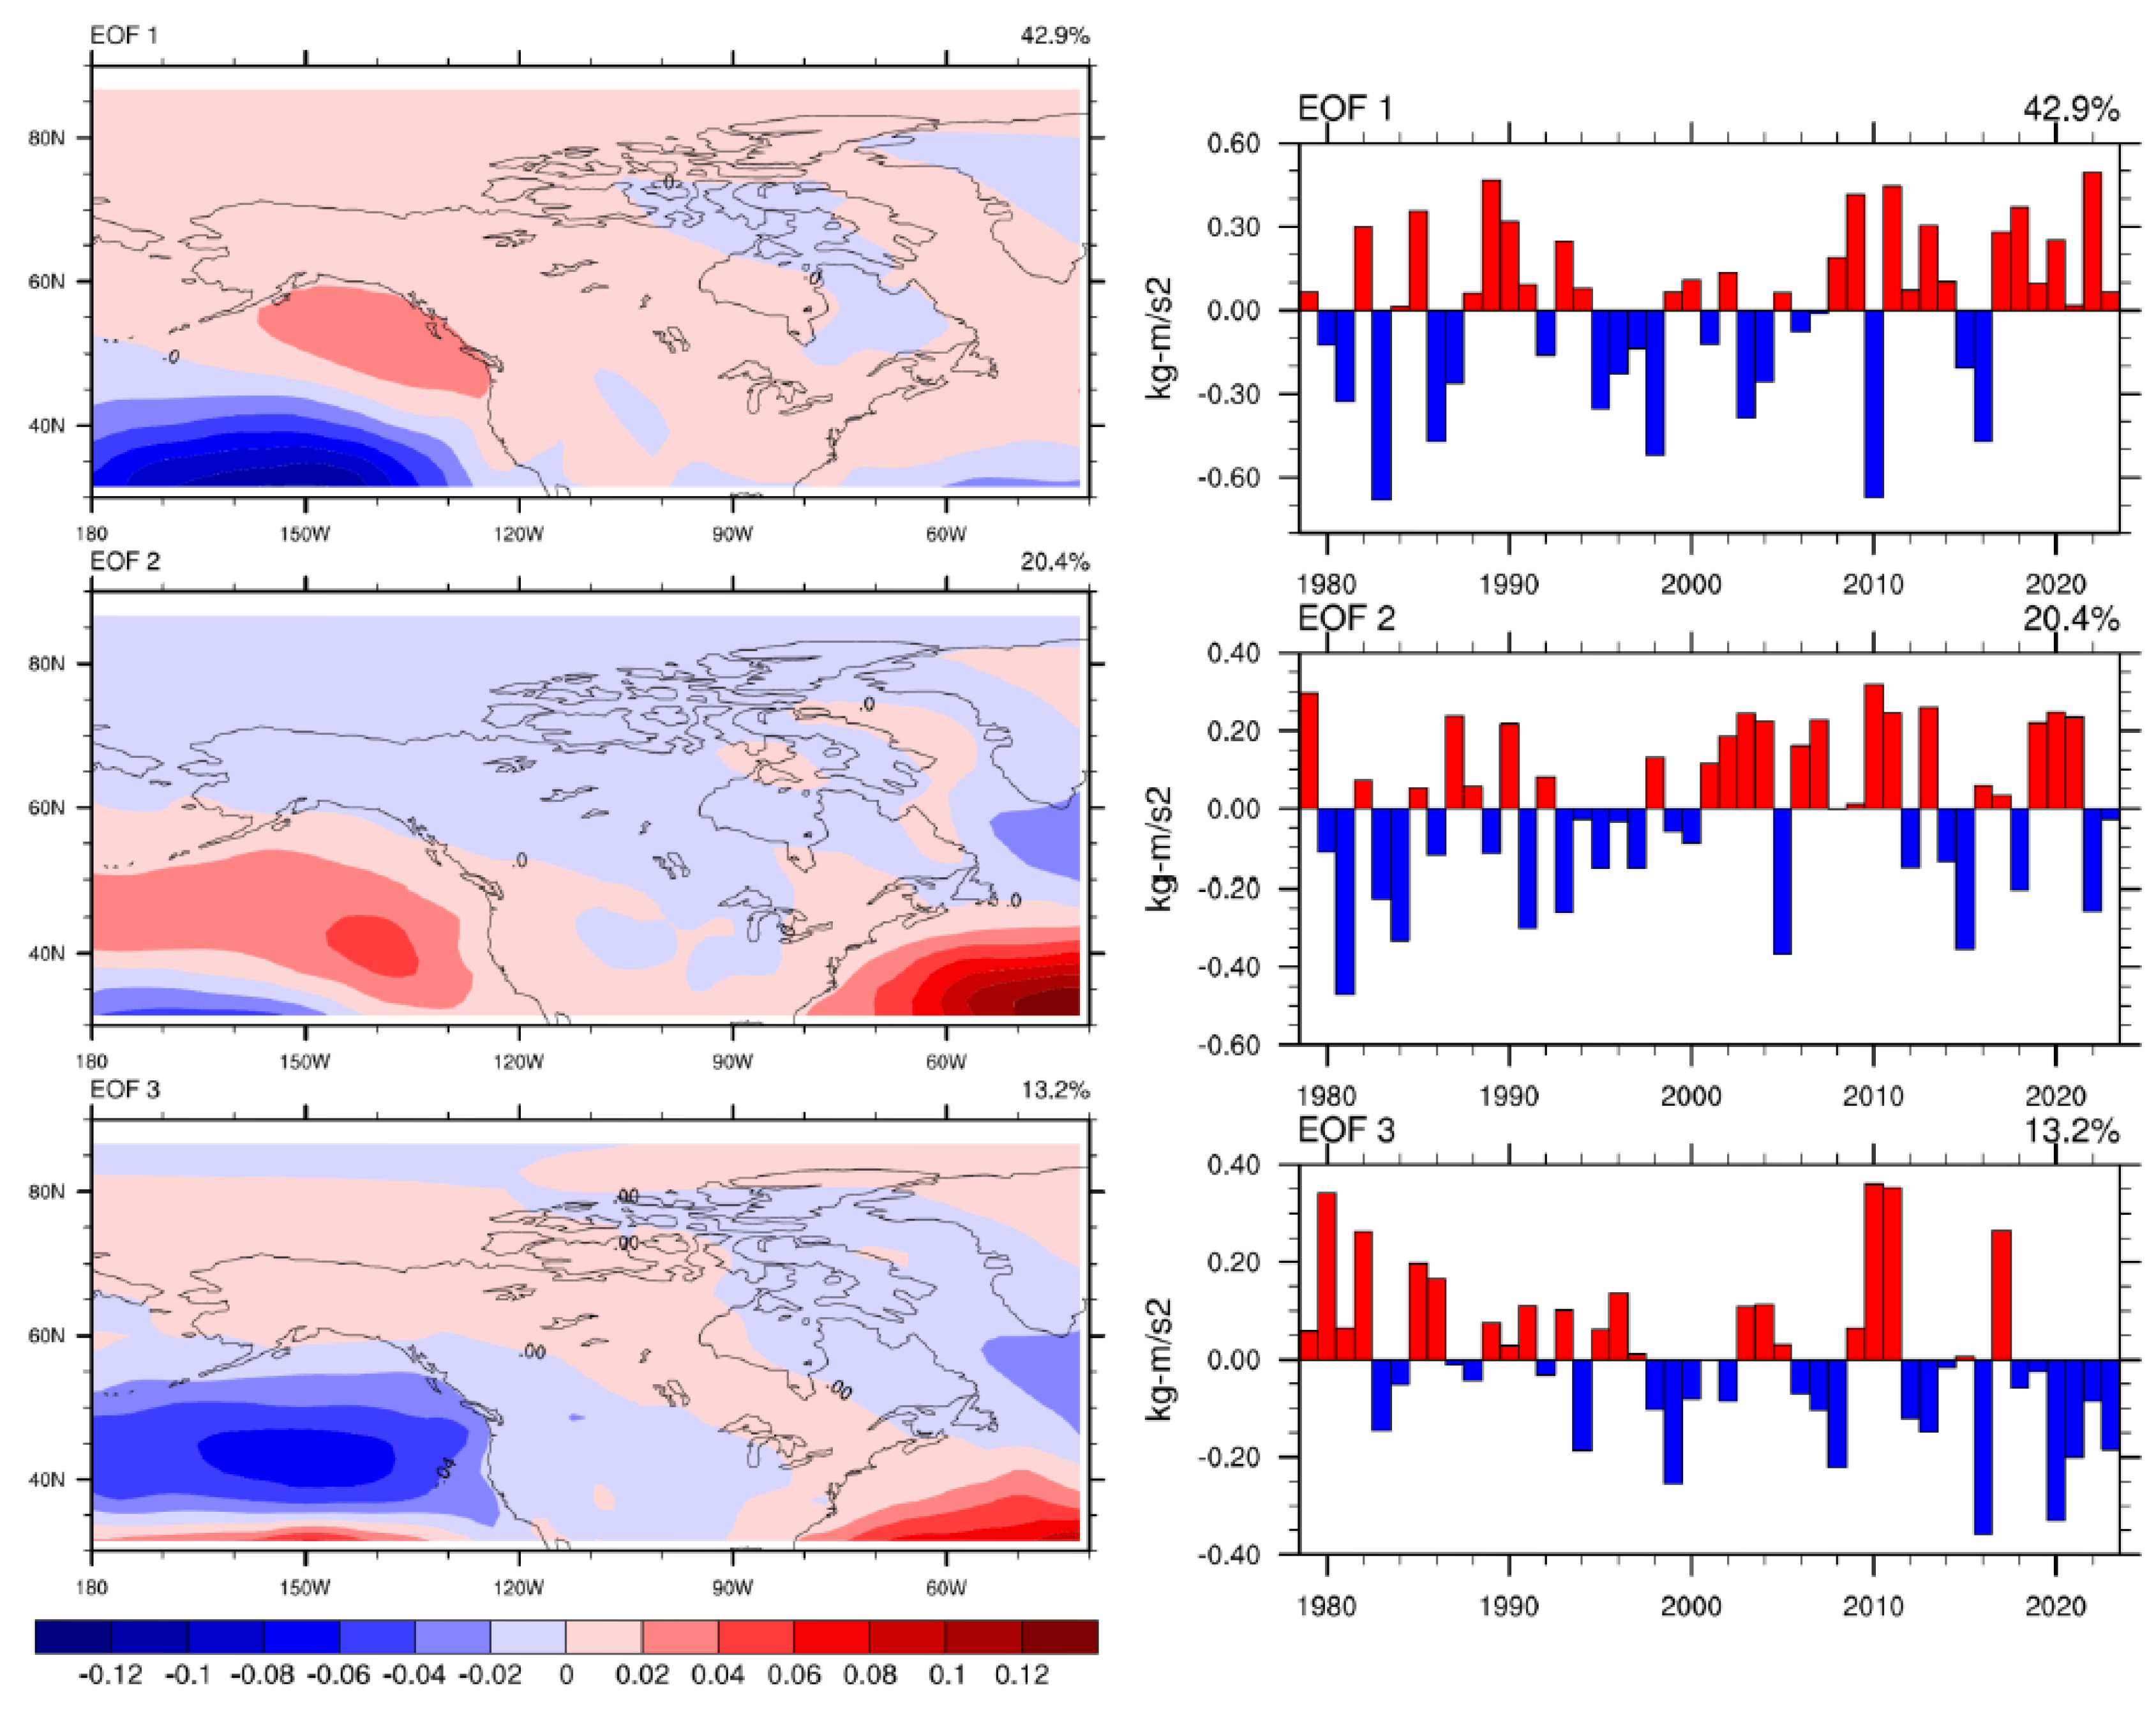
Figure 11.
EOF modes of the meridional component (QV) of winter moisture flux.
Disclaimer/Publisher’s Note: The statements, opinions and data contained in all publications are solely those of the individual author(s) and contributor(s) and not of MDPI and/or the editor(s). MDPI and/or the editor(s) disclaim responsibility for any injury to people or property resulting from any ideas, methods, instructions or products referred to in the content. |
© 2025 by the authors. Licensee MDPI, Basel, Switzerland. This article is an open access article distributed under the terms and conditions of the Creative Commons Attribution (CC BY) license (http://creativecommons.org/licenses/by/4.0/).
Copyright: This open access article is published under a Creative Commons CC BY 4.0 license, which permit the free download, distribution, and reuse, provided that the author and preprint are cited in any reuse.


