
Submitted:
09 December 2025
Posted:
10 December 2025
You are already at the latest version
Abstract
Urban green infrastructure is increasingly recognized as a critical buffer against ecological degradation, yet empirical evidence on the long-term stability of ecosystem services (ES) in rapidly urbanizing cities remains limited. Despite widespread assumptions that urbanization inevitably leads to irreversible ecological decline, few studies have quantitatively examined whether ES can persist, or even recover, over multi-decadal time horizons. This study investigates the long-term trajectories of eight urban ES in Seoul, South Korea, across nearly five decades (1978–2025) and eight congressional districts, providing one of the longest temporal assessments of urban ES in East Asia. Using i-Tree Canopy and high-resolution aerial imagery across four benchmark years (1978, 1989, 2010, 2025), this study quantified standardized indicators for carbon sequestration (CSeq), avoided runoff (AVRO), and removal of six atmospheric pollutants (O₃, NO₂, SO₂, CO, PM₁₀, PM₂.₅). Paired-sample t-tests and Cohen’s dz (effect size) were used to assess within-district temporal shifts and the magnitude of ecological change. Results reveal a pronounced period of early ecological stress during rapid industrialization (1978–1989), with negative standardized effect sizes across all services (dz between −0.65 and −0.72). However, these early losses were not sustained. Structural services such as CSeq and AVRO exhibited long-term functional stability, with effect sizes converging toward zero and the 1978–2025 change in CSeq showing no statistical difference (p = 0.784). Pollutant removal services followed an early-decline–followed-by-recovery trajectory, exemplified by CO removal shifting from a large early decline (dz= −0.72) to a modest positive effect in later decades dz = 0.31). These findings indicate that Seoul’s sustained urban greening and environmental policies were effective in preventing further deterioration and maintaining core ecological functions, even if they produced stabilization rather than significant long-term gains in ES delivery.
Keywords:
air quality regulation
; ecosystem services
; environmental governance
; long-term urbanization
; policy impacts
; temporal analysis
; urban green infrastructure
1. Introduction
Urbanization is one of the most profound land-use changes of the modern era, reshaping ecosystems, fragmenting green spaces, and straining the capacity of cities to provide essential environmental functions (Arshad et al., 2020; Pakhira et al., 2024; Patel & Raval, 2024). As more than half of the world’s population now lives in urban areas (Skeldon, 2025), green infrastructure is under mounting pressure, and its long-term sustainability is increasingly uncertain (Cuce et al., 2025; Khan et al., 2025). These regulating ES are vital for climate resilience, public health, and the livability of cities. Understanding their spatiotemporal dynamics is therefore critical in the context of on-going urbanization.
Among the most vital components of urban green infrastructure are trees, which underpin many of these regulating services. Numerous studies have shown that urban tree canopies contribute significantly to functions such as air purification, carbon storage, and runoff mitigation (Elze & Banzhaf, 2022; Mngadi et al., 2022; Tavares et al., 2019). However, urban growth frequently occurs at the expense of vegetated cover, leading to ecological degradation and the assumption that ecosystem service performance inevitably declines over time (Eigenbrod et al., 2011; Li et al., 2016; Wang et al., 2019). In some cities, including Seoul, long-term greening policies and urban forestry initiatives have been introduced to counteract these pressures, but their long-term ecological outcomes remain uncertain (Park & Youn, 2013; Sim et al., 2023). But is it really possible that the delivery of ES by green infrastructure remains stable amidst ongoing urbanization?
While a growing body of research has explored spatial variation in urban ES, much less is known about their long-term stability. Most studies assess ES performance at a single point in time, or over short intervals, often overlooking how cities evolve ecologically across decades (Assennato et al., 2022; Peng et al., 2017; Song & Deng, 2015). This gap is especially evident in East Asian megacities like Seoul, Korea, where rapid industrialization and urban transformation since the late 20th century have dramatically altered land use patterns (Jeong et al., 2019; Joo, 2018; Lee et al., 2022). Yet the long-term dynamics of urban ES in such contexts remain underexamined. Existing evaluation frameworks often rely on static proxies or expert judgment, limiting our understanding of actual biophysical changes and the resilience of urban nature over time.
To address this gap, this study applies the i-Tree Canopy model, a remote-sensing-based tool for estimating tree cover and associated ES, to analyze long-term ES dynamics across eight districts in Seoul. The model enables consistent, spatially explicit assessment of key services including carbon sequestration, avoided runoff, and air pollutant removal, using a combination of aerial imagery and randomized sampling. This approach offers a scalable and replicable method for evaluating long-term temporal changes in green infrastructure in highly urbanized areas.
Building on this framework, the study examines how multiple ES have shifted across four benchmark years spanning nearly five decades (1978, 1989, 2010, and 2025). The analysis addresses three core research questions: (1) How have key regulating ES varied over time based on both descriptive patterns and paired-sample statistical comparisons? (2) What is the magnitude and direction of these changes, as quantified through standardized effect sizes, and to what extent do services exhibit decline, stability, or recovery? and (3) How do ES co-vary in their temporal change, and what cross-service relationships emerge from long-term trajectories? By answering these questions, the study provides empirical evidence on the long-term resilience and variability of urban ES, offering insights relevant for green-infrastructure planning in rapidly urbanizing contexts.
2. Methods
2.1. Study Area
The study was conducted in Seoul, South Korea, using eight congressional districts as the spatial units of analysis (Figure 1). These districts were selected to represent distinct phases of the city's green space development. Each district corresponds to a specific phase of ecological transformation, ranging from post-war reforestation, greenbelt expansion and urban park development, integrated green space planning, to climate-adaptive urban forest infrastructure in the city.
Seoul is a high density megacity with persistent canopy cover albeit dominant share of impervious surfaces (Lee & Park, 2020). Remote sensing evidence from 1980 to 2018 indicates only a small decline in forest and tree cover across the Seoul Capital Area, falling from 52.7% to 50.9% during a period of major population growth (Lee et al., 2019). This stability reflects early zoning controls, the protection of mountainous terrain, and the integration of forest planning into the city’s development policies. In a city with limited forest cover and extensive built surfaces, policy decisions shape the structure and function of remaining green spaces (Park & Youn, 2013). The selected districts therefore provide a useful gradient for assessing how long-term land cover change influences ecosystem service performance under sustained urban pressure.
2.2. Data Acquisition
This study utilized the i-Tree Canopy v.7.1 tool, accessed through the i-Tree website (https://canopy.itreetools.org), to estimate tree canopy cover and its associated ecosystem service benefits in Seoul City. The analysis of regulating ecosystem services (ES) using i-Tree Canopy included several important user-defined steps, such as delineating site boundaries, classifying land cover, and conducting visual interpretation, as detailed in Figure 2.
2.2.1. Area of Interest and Landscape Typologies Delineation
A geographic boundary file was uploaded to define the area of interest, enabling the software to integrate with Google Earth and display a plan view of the eight chosen congressional districts in Seoul City, Korea. Shapefiles representing the administrative boundaries of the city were obtained from open data portal (https://github.com/southkorea/southkorea-maps). This served as the basis for delineating the area of interest. Land cover within these boundaries was categorized into eight classes, with a primary focus on two key types: tree over pervious, tree over impervious. Additional land cover types included grass/herbaceous cover, impervious road, impervious buildings, impervious other, soil/bare ground, and water, to ensure a comprehensive classification of surface conditions (Table S1).
2.2.2. Visual Interpretation of Sample Points
A total of 12,800 sample points were randomly distributed across the study area for each observation year, allocating 400 points per district for the years 1978, 1998, 2010, and 2025. Each point was manually classified based on the latest high-resolution aerial imagery (0.30-meter spatial resolution) sourced from Google Earth, and historical aerial imagery from V-World. is a national spatial information platform provided by the Ministry of Land, Infrastructure, and Transport of South Korea. This sample size substantially exceeds the commonly recommended threshold of 500 points for land cover validation in megacities, thereby enhancing the statistical robustness and spatial representativeness of the classification effort (Endreny et al., 2017).
2.3. Ecosystem Service Quantification
Using the i-Tree Canopy tool tree canopy cover and associated ES benefits with a specific focus on carbon sequestration, air pollution removal, and hydrological regulation were estimated. Within this framework, annual CSeq was estimated by applying tree growth rates and biomass equations relevant to urban tree species (Nowak et al., 2013). A correction factor of 0.80 was employed to adjust biomass outputs, addressing the tendency of generalized models to overestimate carbon storage in urban environments due to differences in tree morphology and growing conditions compared to natural forests (Nowak, 1994).
Estimates of pollution removal were derived using deposition coefficients embedded in the i-Tree Canopy system, referencing the pollutant capture rates established by the i-Tree Eco model (Hirabayashi et al., 2011; Nowak et al., 2006). These coefficients are applied to the proportion of tree canopy within the classified sample to generate annual estimates of pollutant removal for six EPA-designated criteria pollutants: carbon monoxide (CO), nitrogen dioxide (NO₂), ozone (O₃), sulfur dioxide (SO₂), PM₂.₅, and PM₁₀. While generalized, these estimates provide a standardized method for evaluating air quality benefits across extensive urban areas with limited ground-based data.
Hydrological regulation, specifically in terms of avoided runoff, was quantified by comparing the stormwater interception capacity of the existing tree canopy with a hypothetical non-vegetated baseline. The i-Tree Canopy tool estimates avoided runoff based on canopy cover percentage, average annual rainfall, and assumptions regarding interception, transpiration, and soil infiltration rates (Hirabayashi, 2015). Although not as process-specific as physically based hydrological models, this approach facilitates consistent and scalable assessments of vegetation-driven runoff reduction.
2.4. Statistical Analysis
Temporal changes in ES delivery were evaluated using paired-sample t-tests across the four benchmark years (1978, 1989, 2010, and 2025). Standardized per-hectare estimates for eight ES indicators obtained using the i-Tree Canopy framework subjected to six pairwise temporal comparisons, with year as the repeated measure and congressional district as the paired observational unit. Differences between years were tested using paired t-statistics, and the magnitude of temporal change was quantified using Cohen’s dz, a standardized effect size appropriate for within-unit designs. Ninety-five percent confidence intervals were calculated for all mean differences. Holm-adjusted p-values were used to control for inflated Type I error arising from multiple comparisons within each indicator. All analyses were performed in a reproducible Python environment using pandas for data management and custom SciPy-compatible routines for statistical calculations (Bressert, 2012; Wang et al., 2022). Effect sizes, confidence intervals, and multiple-comparison adjustments were computed programmatically. Statistical significance was assessed at the 0.05 level.
3. Results
3.1. Temporal Variation in Ecosystem Services
Descriptive examination of CSeq estimates across the four benchmark years: 1978, 1989, 2010, and 2025, reveals a pattern that does not align with the conventional expectation of steady ecosystem service decline under rapid urbanization. While several services show modest reductions during the early period of rapid urban expansion and industrialization (1978–1989), subsequent decades are marked by either stabilization or partial recovery (Figure 3). For CSeq, initial declines are observable but attenuate by 2010, with near-complete stabilization achieved by 2025. AVRO follows a similar trajectory, with early decreases giving way to consistent levels in later years. In contrast, pollutant removal services exhibit more fluctuation, particularly for CO, NO₂, and particulate matter, where early degradation is followed by divergent recovery patterns depending on the pollutant.
These descriptive trends are reinforced by inferential analysis. Paired-sample t-tests reveal that the early decline in CSeq between 1978 and 1989 (mean difference = −0.0467) does not reach statistical significance (p = 0.096), and the long-term difference from 1978 to 2025 is negligible (p = 0.784). AVRO yields similar results, with all paired comparisons across the study period producing non-significant differences after Holm correction, underscoring the system’s functional resilience.
Among the pollutant removal services, CO shows the most marked short-term change. The 1978–1989 comparison reveals a statistically borderline decline (mean = −0.0248, p = 0.049), paired with a relatively large effect size (dz = −0.72), suggesting a substantial reduction in CO removal capacity during the early industrial phase. However, subsequent contrasts: 1978–2010, 1978–2025, 1989–2010, and 1989–2025, are uniformly non-significant, suggesting that this early decrease did not persist over time. Other pollutants (NO₂, O₃, PM₁₀, PM₂.₅, and SO₂) show mixed directional changes in the early decades, but none exhibit consistent or statistically significant differences across the full set of paired comparisons.
3.2. Magnitude and Direction of Change Across Decades (Effect Size Analysis)
Effect size patterns reveal substantial variation in the magnitude and direction of temporal change across ES from 1978 to 2025. The largest shifts occurred during the 1978–1989 interval, during which several pollutant removal services registered notable negative standardized mean differences. CO removal exhibited the strongest early decline, with a large effect size (dz = −0.72), reflecting a pronounced reduction in removal capacity during this period even though corresponding p-values were marginal. Other atmospheric regulation functions, including NO₂ and SO₂ removal, showed small-to-moderate negative effect sizes in the same decade (typically −0.20 < dz < −0.40), indicating that pollutant removal services were more sensitive to early-period urban pressures than structural services.
On the other hand, CSeq and avoided runoff exhibited only small changes across all temporal comparisons. For both indicators, standardized differences remained below |0.35| in all decade-to-decade contrasts, including the full 1978–2025 interval, where effect sizes approached zero. These results indicate minimal long-term deviation from their historical baselines, with changes generally falling within the range of small-effect variability.
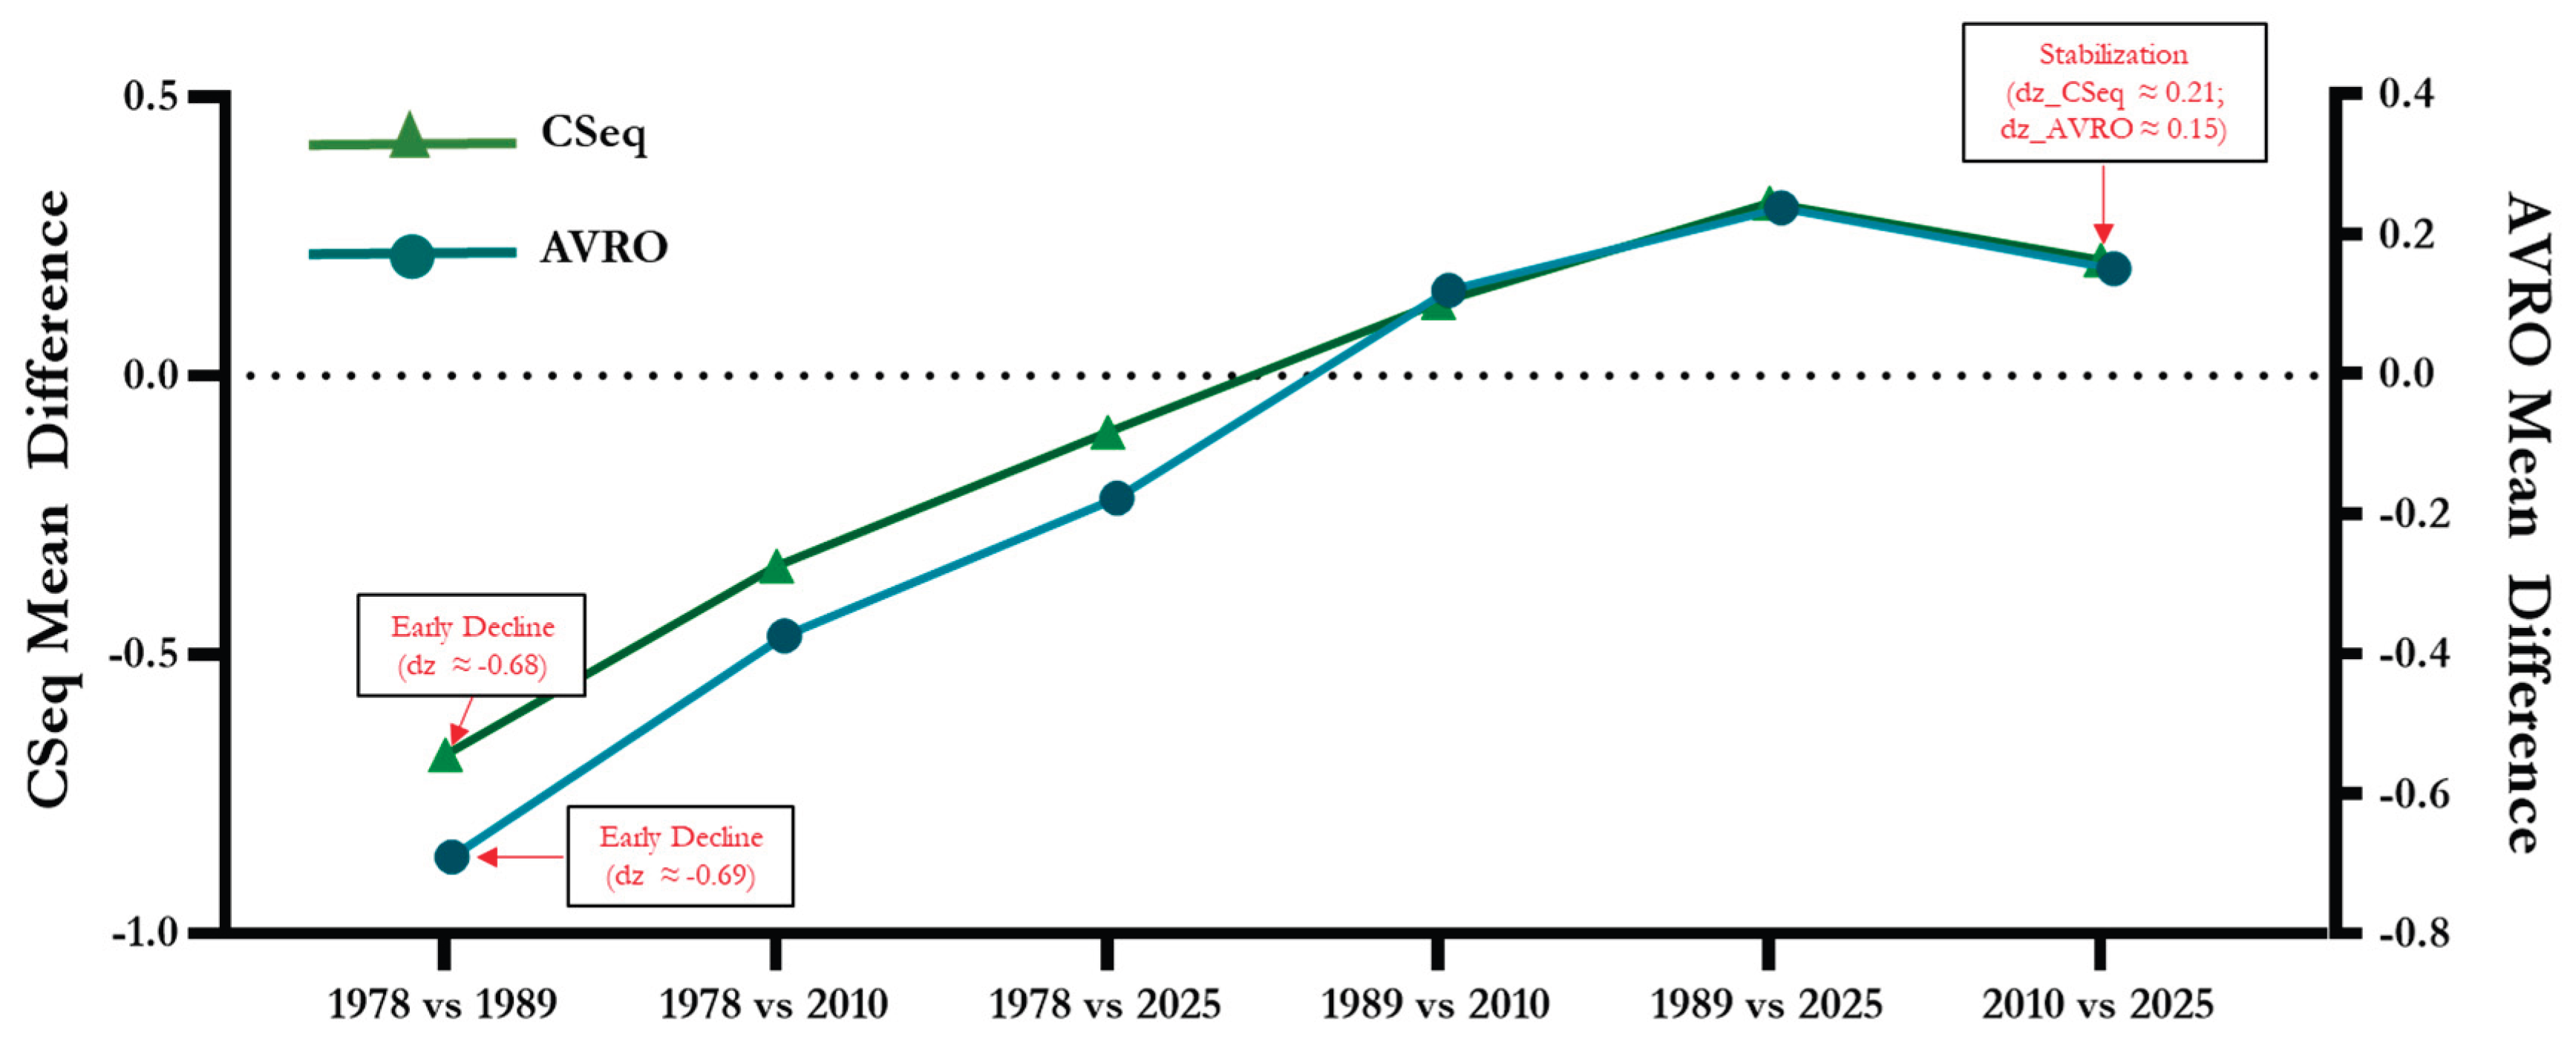
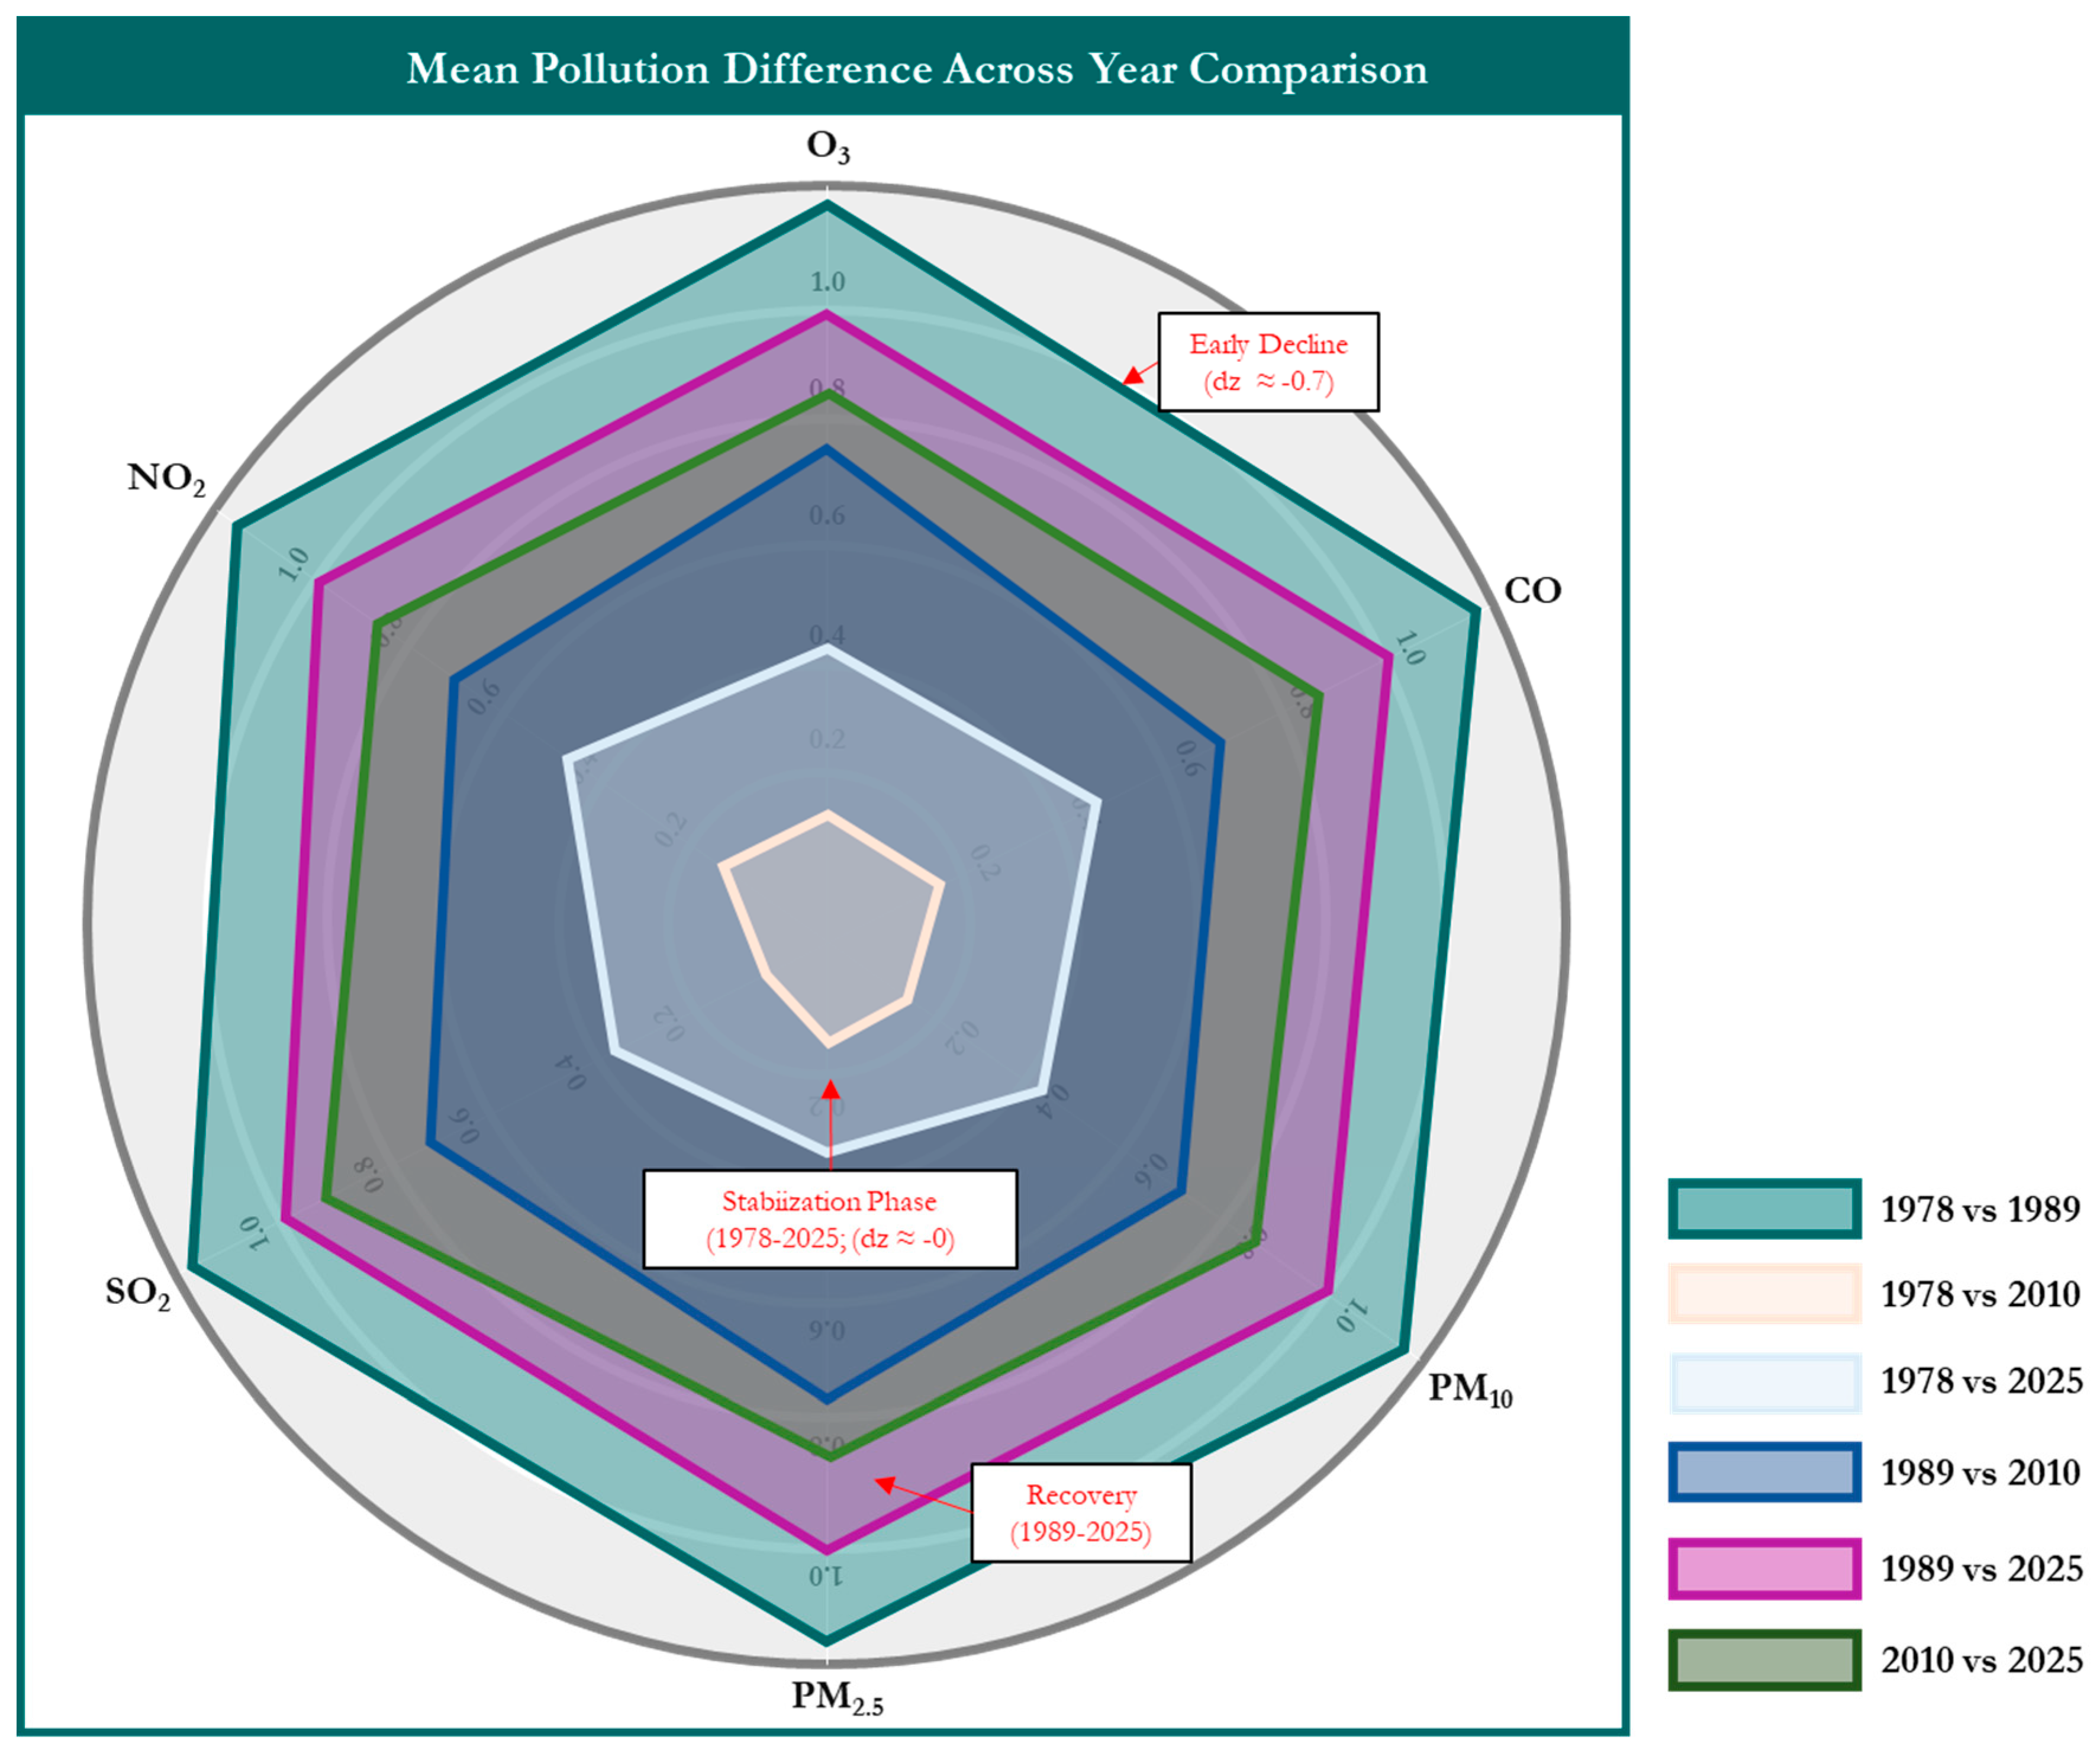
A recurring pattern across multiple services is the attenuation of early-period declines over subsequent decades. CO removal, for example, transitions from a large negative effect size in 1978–1989 (dz = −0.72) to a modest positive value in the 1989–2025 comparison (dz = 0.31), indicating a directional shift in long-term differences. Similar reductions in the magnitude of negative effect sizes were observed for other pollutant indicators between the early (1978–1989) and later (1989–2025) periods. Across all services, long-term effect sizes for the 1978–2025 contrast converge toward minimal or near-zero values, suggesting limited sustained directional change over the full study horizon.
3.3. Long-Term Trajectory Classification of Ecosystem Services
The long-term trajectories of ecosystem service delivery reveal three distinct patterns across the study period, reflecting how different services responded to Seoul’s rapid urbanization and subsequent greening initiatives (Figure 4; Table S2). The first pattern is a persistent decline, although this trend is not strongly evident in any of the analyzed ES. The clearest evidence of early decline appears in the 1978–1989 interval, where all eight ES showed negative mean differences, with effect sizes consistently in the medium-to-large range (−0.65 ≤ dz ≤ −0.72). Pollutant removal services were most affected: CO removal decreased by −0.0248 (dz = −0.72), NO₂ by −0.3108 (dz = −0.70), SO₂ by −0.0615 (dz = −0.65), and O₃ by −0.4556 (dz = −0.67). Even particulate-matter removal showed declines, with PM₁₀ and PM₂.₅ decreasing by −0.2684 and −0.0322, respectively (both dz ≈ −0.66). CSeq (−0.0467, dz = −0.68) and avoided runoff (−6.31, dz = −0.69) were similarly affected, indicating that the early phase of industrialization imposed broad ecological stress across most service categories. However, despite the extent of early decline, no ecosystem service exhibited a persistent, long-term downward trajectory. Subsequent decades do not reinforce the negative directionality of the early period; instead, mean differences for most services between 1978 and 2010 or 1978 and 2025 approach zero, and associated effect sizes drop to small or negligible levels. This flattening of temporal change suggests that the initial losses were not sustained and that ecosystem service delivery stabilized as urban greening and environmental regulation expanded from the 1990s onward.
The second trajectory focuses on long-term stability, which is characterized by the structural ES of CSeq and avoided runoff. Although these indicators showed moderate early declines (e.g., CSeq dz = −0.68; AVRO dz = −0.69 in 1978–1989), their subsequent comparisons reveal very small mean differences, with long-term (1978–2025) effect sizes approaching zero. This indicates that structural ecosystem functions tied to the persistence of tree canopy were largely maintained across decades, despite the city’s intense land-use change.
The third and most ecologically and policy significant trajectory is the early decline followed by recovery. This pattern was observed in several pollutant removal services. CO removal, for example, transitions from the strongest early decline (dz = −0.72) to a small positive effect by 1989–2025 (dz = 0.31), indicating partial rebound. Similar attenuation of early declines is observed for NO₂, SO₂, and O₃, where negative early effects diminish substantially or reverse in later decades. These recovery trajectories align closely with Seoul’s major policy shifts, including aggressive tree-planting programs, emission reductions, and air-quality controls introduced from the mid-1990s onward.
Figure 5.
Early decline and long-term stabilization of mean CSeq and AVRO difference across year comparison from 1978 to 2025.
Figure 5.
Early decline and long-term stabilization of mean CSeq and AVRO difference across year comparison from 1978 to 2025.
3.4. Cross-Ecosystem Service Correlation in Temporal Change
ES exhibited uniformly strong and statistically significant cross-service correlations across all temporal intervals analyzed (all p < 0.001). For the 1978–1989 interval, correlation coefficients among all ES ranged from 0.9718 to 0.9991. CSeq changes were strongly correlated with changes in pollutant-removal services, including NO₂ (r = 0.9924), SO₂ (r = 0.9969), and O₃ (r = 0.9976). Similarly, avoided runoff exhibited strong correlations with CO (r = 0.9943), PM₁₀ (r = 0.9867), and PM₂.₅ (r = 0.9919). All pairwise correlations exceeded 0.97, indicating near-uniform directionality of change across services during this early period. For the 1978–2010 interval, correlations remained consistently high, ranging from 0.9553 to 0.9994. CSeq changes were highly correlated with avoided runoff (r = 0.9960) and O₃ removal (r = 0.9970). Pollutant-removal services continued to show strong associations with one another, such as NO₂–PM₁₀ (r = 0.9994) and CO–PM₂.₅ (r = 0.9854). All services displayed correlation coefficients greater than 0.95, indicating persistent co-movement across the three-decade span. Between 1978–2025, the magnitude of cross-service correlations remained exceptionally high, with coefficients ranging from 0.9785 to 0.9968. CSeq again showed strong correlations with pollutant removal indicators, including NO₂ (r = 0.9957) and O₃ (r = 0.9967). Avoided runoff demonstrated strong relationships with SO₂ (r = 0.9953) and PM₂.₅ (r = 0.9904). All correlations exceeded 0.98, indicating highly consistent long-term co-variation across ES.
4. Discussions
4.1. Temporal Trajectories of Seoul’s Urban Ecosystem Services (1978–2025)
Contrary to the widespread assumption that rapid urbanization causes a continuous decline in urban ecological functions, the long-term trajectory of ES in Seoul reveals a more nuanced pattern. While global literature typically links urban expansion to the degradation of regulating services such as carbon sequestration, runoff mitigation, and pollutant removal (Aboelata & Sodoudi, 2019; de la Barrera & Henríquez, 2017; Indhanu et al., 2025; Wellmann et al., 2020), the present analysis shows that these services in Seoul have largely stabilized over time.
Although the 1978–1989 interval reflects a period of significant ecological stress (with measurable declines across most ES indicators), this initial downturn did not set a long-term trend. Instead, both descriptive and inferential results suggest a trajectory of temporal resilience. Core services like CSeq and AVRO, which are structurally tied to tree cover, showed early reductions but stabilized by 2010 and remained consistent through 2025. Across all decades, statistical comparisons yielded non-significant differences and small effect sizes, reinforcing the notion that Seoul’s tree-based services maintained continuity despite ongoing urban growth. This finding is consistent with previous research showing that urban forest cover in Seoul, despite initial losses due to urban expansion, recovered through greening policies, resulting in stable or improved ecological functionality (Choi & Kim, 2022; Hwang et al., 2022).
Pollutant removal services demonstrated greater initial sensitivity to urbanization pressures, particularly CO removal, which exhibited a large effect size decline (dz = −0.72) between 1978 and 1989. This decline highlights the environmental costs of early industrialization, characterized by a surge in emissions that outpaced regulatory control. This pattern is similar to those observed in comparative urban pollution studies in Korea and other rapidly urbanizing cities in Asia (Akhtar et al., 2024; Saxena, 2025; Zhuang et al., 2025). Yet this downturn proved temporary. From 1989 onward, effect sizes for CO and other pollutants shifted toward zero or mild positive values (dz = 0.31), and long-term comparisons showed no statistically significant differences.
The overall pattern suggests that while atmospheric services are initially more reactive to environmental stressors, they too reached functional stability over the long term. This aligns with broader urban resilience research, which highlights that atmospheric regulation functions, though vulnerable during early urban-industrial phases, can be restored with investments in vegetation cover and emission control (C.-F. Chen et al., 2025).
4.2. A Critical Period of Ecological Stress (1978–1989)
The decade spanning 1978 to 1989 marks Seoul’s most intense period of ecological disruption, with all eight ES indicators registering negative changes. This period coincides with Seoul’s peak industrial expansion, characterized by a sharp rise in impervious surface, fossil fuel use, and vehicle emissions; factors long associated with ecosystem degradation in East Asian urban context (Bai & Imura, 2000; Larkin et al., 2016; Oh et al., 2021). Effect sizes for most indicators fell within the medium-to-large range (−0.65 to −0.72), signaling substantial short-term reductions in both structural and atmospheric services.
Atmospheric regulation was particularly affected. CO removal exhibited the sharpest decline (dz = −0.72), underscoring the immediate sensitivity of air purification functions to emission surges. Similar trajectories have been observed in some cities where early industrialization led to acute air quality declines prior to regulatory interventions (Crippa et al., 2016; Mosley, 2014). Other pollutants followed a similar trajectory, with consistently negative but non-significant changes, suggesting a broader weakening of biogenic filtering capacity under high pollutant loads (Singkran, 2023).
On the other hand, services that rely on physical tree structures, like CSeq and AVRO, experienced a more modest decline. This is due to their structural stability, which results in a slower response to environmental changes. This pattern mirrors findings in Seoul and other Asian cities, where tree-related services showed resilience or slower degradation due to the longevity and structural buffering of mature vegetation (Chen et al., 2025). This divergence highlights a key ecological distinction: atmospheric services react quickly to environmental stress (Escobedo et al., 2011; Jim & Chen, 2008; Paoletti et al., 2010), while structural services exhibit a delayed, buffered response (Amer et al., 2023; Czaja et al., 2020).
4.3. Contextualizing ES Stabilization Alongside Shifts in Urban Greening Strategies
The long-term stabilization of ES in Seoul appears to reflect not only ecological resilience but also a gradual maturation of urban environmental policy. While the early stages of Seoul’s rapid industrialization saw measurable declines in ES performance, this degradation did not persist. Over subsequent decades, many services began to stabilize, suggesting the emergence of systemic resilience in the city’s green infrastructure. Although this study does not conduct a formal policy impact analysis, the temporal alignment between service stabilization and key shifts in environmental governance points to a meaningful connection. In particular, the evolution of urban forestry and green space policy in South Korea, as outlined by Park and Youn (2013), offers a useful lens through which to interpret these ecological patterns.
Accordingly, the first phase began in the early 1990s, when democratization and decentralization opened space for local green initiatives. Following the establishment of Parks and Open Space Divisions in metropolitan cities (1991–1993) and global environmental commitments such as the 1992 UNCED summit, Seoul shifted its focus from mountain afforestation to urban-scale greening (Choi & Kim, 2022). Projects like the redevelopment of Boramae Park and neighborhood park expansions under the Urban Parks Act marked this transition (Park et al., 2013). A second phase emerged in the mid-2000s, characterized by a policy turn toward climate resilience and low-carbon growth (Guahk, 2025; Mason, 2024). Initiatives such as the Han River Renaissance Plan (2007), the 2030 Seoul Green Space Master Plan (2015), and the implementation of the Framework Act on Low Carbon Green Growth (2010) reflect a systemic embrace of nature-based solutions to combat urban environmental stress. These efforts were supported by national frameworks like the Fourth and Fifth National Forest Plans, and the Basic Plan for Urban Forestry disclosed in 2007.
While these efforts likely contributed to the stabilization of ES, the inferential results suggest that their ecological impact was more preventive than transformative. Across nearly all indicators, long-term comparisons remained statistically non-significant, with effect sizes converging toward zero. This indicates that Seoul’s environmental policies helped halt further degradation but did not yet yield substantial gains in service delivery. This outcome aligns with long-standing public demand for expanding urban forests and recreational spaces in South Korea, which has remained a high policy priority from 1997 to 2023 (Sim et al., 2023).
4.4. Scope Limitations and Directions for Future Research
This study provides a long-term ecological perspective on Seoul’s green infrastructure and ES, however several limitations must be acknowledged. The analysis was based on the i-Tree Canopy framework, which, while recognized for its accessibility and consistency, relies heavily on manual classification of visual data. In this case, 12,800 sample points were interpreted over four observation years using high-resolution aerial imagery from Google Earth and historical datasets from V-World. Although the large sample size aimed to improve statistical reliability, the visual interpretation process is subjective, and classification consistency may vary based on imagery quality and seasonal differences. Another limitation is the scope of the study. While results indicate a strong temporal alignment between ES level stabilization and major greening and environmental policy reforms in Seoul (especially since the early 1990s), the research did not perform a formal policy impact analysis. Consequently, causal relationships between specific governance interventions and ecological outcomes are inferential rather than definitive. Addressing this gap requires a deeper understanding of what enables transformative ecological outcomes in urban contexts, including the integration of policy design, spatial planning, and biophysical thresholds that may enhance ecosystem service returns. Future research should focus on the conditions under which urban greening strategies can deliver significant, measurable gains in ES provision, moving from stabilization to ecological transformation.
5. Conclusions
The long-term assessment of Seoul’s urban ES (1978–2025) reveals a trajectory that complicates the conventional expectation of linear ecological decline under rapid urbanization. Although the early industrialization period (1978–1989) constituted a phase of pronounced ecological stress, with medium-to-large negative effect sizes across all eight indicators, the subsequent decades did not amplify these losses. Instead, structural services such as CSeq and avoided runoff displayed notable persistence, with long-term paired comparisons indicating non-significant differences by 2025 and effect sizes converging toward zero. Regulatory services followed a similar pattern of early decline followed by partial recovery, consistent with the timeline of major greening and air-quality initiatives introduced since the 1990s. Importantly, the statistical evidence suggests that these policies were effective in preventing further deterioration rather than generating substantial measurable gains: ecosystem service delivery remained functionally stable, but strong positive enhancements did not yet materialize. These findings illustrate how sustained urban greening and environmental governance can maintain core ecological functions amid intensive land-use change, even when long-term ecological improvements unfold gradually.
Supplementary Materials
The following supporting information can be downloaded at the website of this paper posted on Preprints.org.
Author Contributions
WPH – Conceptualization, Formal analysis, Data analysis, Writing – original draft; SJ – Data curation, JL – Data curation; EH – Data curation; BBP– Writing – review & editing.
Funding
This study was conducted with the support of the R&D program for Forest Science Technology (Project No. RS-2025-02219895) provided by Korea Forest Service (Korea Forestry Promotion Institute).
Declaration of Competing Interest
The authors declare that they have no financial or personal conflicts of interest that could have influenced the findings presented in this paper.
Data availability
Data will be made available on request.
Acknowledgments
Mr. Hintural is a scholar of the Asian Forest Cooperation Organization (AFoCO), a treaty-based intergovernmental organization that fosters regional and international collaboration in forestry to advance shared Sustainable Development Goals (SDGs) and broader forestry objectives.
References
- Aboelata, A.; Sodoudi, S. Evaluating urban vegetation scenarios to mitigate urban heat island and reduce buildings' energy in dense built-up areas in Cairo. Building and Environment 2019, 166, 106407. [Google Scholar] [CrossRef]
- Akhtar, M. Z.; Zaman, K.; Khan, M. A. The impact of governance indicators, renewable energy demand, industrialization, and travel & transportation on urbanization: A panel study of selected Asian economies. Cities 2024, 151, 105131. [Google Scholar] [CrossRef]
- Amer, A.; Franceschi, E.; Hjazin, A.; Shoqeir, J. H.; Moser-Reischl, A.; Rahman, M. A.; Tadros, M.; Pauleit, S.; Pretzsch, H.; Rötzer, T. Structure and Ecosystem Services of Three Common Urban Tree Species in an Arid Climate City. Forests 2023, 14(4), 671. [Google Scholar] [CrossRef]
- Arshad, A.; Ashraf, M.; Sundari, R. S.; Qamar, H.; Wajid, M.; Hasan, M.-u. Vulnerability assessment of urban expansion and modelling green spaces to build heat waves risk resiliency in Karachi. International Journal of Disaster Risk Reduction 2020, 46, 101468. [Google Scholar] [CrossRef]
- Assennato, F.; Smiraglia, D.; Cavalli, A.; Congedo, L.; Giuliani, C.; Riitano, N.; Strollo, A.; Munafò, M. The Impact of Urbanization on Land: A Biophysical-Based Assessment of Ecosystem Services Loss Supported by Remote Sensed Indicators. Land 2022, 11(2), 236. [Google Scholar] [CrossRef]
- Bai, X.; Imura, H. A comparative study of urban environment in East Asia: stage model of urban environmental evolution. International Review for Environmental Strategies 2000, 1(1), 135–158. Available online: https://www.researchgate.net/profile/Xuemei-Bai-2/publication/200044145_A_Comparative_Study_of_Urban_Environment_in_East_Asia_Stage_Model_of_Urban_Environmental_Evolution/links/596434b50f7e9b819497d602/A-Comparative-Study-of-Urban-Environment-in-East-Asia-Stage-Model-of-Urban-Environmental-Evolution.pdf.
- Bressert, E. SciPy and NumPy: an overview for developers. 2012. Available online: https://geofaculty.uwyo.edu/neil/teaching/Numerical_web/SciPyNumPy.pdf.
- Chen; Liao, J.; Liu, Y.; Huang, Y.; Li, Q.; Yi, X.; Wang, L.; Wu, L.; Shi, Z. Predicting Forest Carbon Sequestration of Ecological Buffer Zone in Urban Agglomeration: Integrating Vertical Heterogeneity and Age Class Dynamics to Unveil Future Trajectories. Forests 2025, 16(11), 1648. [Google Scholar] [CrossRef]
- Chen, C.-F.; Chen, Y.-W.; Lin, J.-Y. Rain gardens can be combined with urban planning strategies to increase urban resilience. Landscape and Ecological Engineering 2025, 21(4), 813–827. [Google Scholar] [CrossRef]
- Choi, J.; Kim, G. History of Seoul’s Parks and Green Space Policies: Focusing on Policy Changes in Urban Development. Land 2022, 11(4), 474. [Google Scholar] [CrossRef]
- Crippa, M.; Janssens-Maenhout, G.; Dentener, F.; Guizzardi, D.; Sindelarova, K.; Muntean, M.; Van Dingenen, R.; Granier, C. Forty years of improvements in European air quality: regional policy-industry interactions with global impacts. Atmos. Chem. Phys. 2016, 16(6), 3825–3841. [Google Scholar] [CrossRef]
- Cuce, P. M.; Cuce, E.; Santamouris, M. Towards Sustainable and Climate-Resilient Cities: Mitigating Urban Heat Islands Through Green Infrastructure. Sustainability 2025, 17(3). [Google Scholar] [CrossRef]
- Czaja, M.; Kołton, A.; Muras, P. The Complex Issue of Urban Trees—Stress Factor Accumulation and Ecological Service Possibilities. Forests 2020, 11(9), 932. [Google Scholar] [CrossRef]
- de la Barrera, F.; Henríquez, C. Vegetation cover change in growing urban agglomerations in Chile. Ecological Indicators 2017, 81, 265–273. [Google Scholar] [CrossRef]
- Eigenbrod, F.; Bell, V. A.; Davies, H. N.; Heinemeyer, A.; Armsworth, P. R.; Gaston, K. J. The impact of projected increases in urbanization on ecosystem services. Proceedings of the Royal Society B: Biological Sciences 2011, 278(1722), 3201–3208. [Google Scholar] [CrossRef]
- Elze, S.; Banzhaf, E. High-precision monitoring of urban structures to understand changes in multiple ecosystem services. Urban Forestry & Urban Greening 2022, 73, 127616. [Google Scholar] [CrossRef]
- Endreny, T.; Santagata, R.; Perna, A.; Stefano, C. D.; Rallo, R. F.; Ulgiati, S. Implementing and managing urban forests: A much needed conservation strategy to increase ecosystem services and urban wellbeing. Ecological Modelling 2017, 360, 328–335. [Google Scholar] [CrossRef]
- Escobedo, F. J.; Kroeger, T.; Wagner, J. E. Urban forests and pollution mitigation: Analyzing ecosystem services and disservices. Environmental Pollution 2011, 159(8), 2078–2087. [Google Scholar] [CrossRef]
- Guahk, Y. Sustainable Development and Local Government in South Korea: The Politics of Eco-city Transition; Taylor & Francis, 2025; Available online: https://books.google.co.kr/books?id=zDRcEQAAQBAJ&lpg=PA1952&ots=78hPXxyvLW&dq=Seoul%20Korea%20mid-2000s%2C%20characterized%20by%20a%20policy%20turn%20toward%20climate%20resilience%20and%20low-carbon%20growth&lr&pg=PA1952#v=onepage&q&f=false.
- Hirabayashi, S. i-Tree Eco United States county-based hydrologic estimates; US Department of Agriculture Forest Service, Pacific Southwest Research Station, Center for Urban Forest Research: Washington, DC, USA, 2015; Available online: https://www.itreetools.org/landscape/resources/Eco_US_county-based_hydrologic_estimates.pdf.
- Hirabayashi, S.; Kroll, C. N.; Nowak, D. J. Component-based development and sensitivity analyses of an air pollutant dry deposition model. Environmental Modelling & Software 2011, 26(6), 804–816. [Google Scholar] [CrossRef]
- Hwang, Y.; Ryu, Y.; Qu, S. Expanding vegetated areas by human activities and strengthening vegetation growth concurrently explain the greening of Seoul. Landscape and Urban Planning 2022, 227, 104518. [Google Scholar] [CrossRef]
- Indhanu, N.; Chalermyanont, T.; Chub-Uppakarn, T. Spatial assessment of land use and land cover change impacts on groundwater recharge and groundwater level: A case study of the Hat Yai basin. Journal of Hydrology: Regional Studies 2025, 57, 102097. [Google Scholar] [CrossRef]
- Jeong, S.-J.; Park, H.; Ho, C.-H.; Kim, J. Impact of urbanization on spring and autumn phenology of deciduous trees in the Seoul Capital Area, South Korea. International Journal of Biometeorology 2019, 63(5), 627–637. [Google Scholar] [CrossRef]
- Jim, C. Y.; Chen, W. Y. Assessing the ecosystem service of air pollutant removal by urban trees in Guangzhou (China). Journal of Environmental Management 2008, 88(4), 665–676. [Google Scholar] [CrossRef]
- Joo, Y.-M. Megacity Seoul: Urbanization and the development of modern South Korea; Routledge, 2018. [Google Scholar] [CrossRef]
- Khan, R.; Siddiqui, A. R.; Akhtar, M. N. Sustainable concrete solutions for green infrastructure development: A review. Journal of Sustainable Construction Materials and Technologies 2025, 10(1), 108–141. [Google Scholar] [CrossRef]
- Larkin, A.; van Donkelaar, A.; Geddes, J. A.; Martin, R. V.; Hystad, P. Relationships between Changes in Urban Characteristics and Air Quality in East Asia from 2000 to 2010. Environmental Science & Technology 2016, 50(17), 9142–9149. [Google Scholar] [CrossRef]
- Lee, C.; Lee, J.; Park, S. Forecasting the urbanization dynamics in the Seoul metropolitan area using a long short-term memory–based model. Environment and Planning B: Urban Analytics and City Science 2022, 50(2), 453–468. [Google Scholar] [CrossRef]
- Lee, P. S.-H.; Park, J. An effect of urban forest on urban thermal environment in Seoul, South Korea, based on Landsat imagery analysis. Forests 2020, 11(6), 1–16. Available online: https://scholarworks.bwise.kr/hanyang/handle/2021.sw.hanyang/145608. [CrossRef]
- Li, B.; Chen, D.; Wu, S.; Zhou, S.; Wang, T.; Chen, H. Spatio-temporal assessment of urbanization impacts on ecosystem services: Case study of Nanjing City, China. Ecological Indicators 2016, 71, 416–427. [Google Scholar] [CrossRef]
- Mason, W. Shifts in Climate Policy in Germany, South Korea, and the United States: The Impacts of Leadership, Political Polarization, and Policy-making. 2024. Available online: https://www.polisci.uci.edu/files/docs/theses/2023-24/2024_mason_william.pdf.
- Mngadi, M.; Odindi, J.; Mutanga, O.; Sibanda, M. Quantitative remote sensing of forest ecosystem services in sub-Saharan Africa’s urban landscapes: a review. Environmental Monitoring and Assessment 2022, 194(4), 242. [Google Scholar] [CrossRef] [PubMed]
- Mosley, S. Environmental History of Air Pollution and Protection. In The Basic Environmental History; Agnoletti, M., Neri Serneri, S., Eds.; Springer International Publishing, 2014; pp. 143–169. [Google Scholar] [CrossRef]
- Nowak, D. J. Atmospheric carbon dioxide reduction by Chicago’s urban forest. Chicago’s urban forest ecosystem: Results of the Chicago urban forest climate project 1994, 83–94. Available online: https://books.google.com/books?hl=en&lr=&id=UvJNeUO3Lt0C&oi=fnd&pg=PA83&ots=CB9KZty_-Z&sig=jjsoet_2D0WWqH6ItswAbDSCDKA.
- Nowak, D. J.; Crane, D. E.; Stevens, J. C. Air pollution removal by urban trees and shrubs in the United States. Urban Forestry & Urban Greening 2006, 4(3), 115–123. [Google Scholar] [CrossRef]
- Nowak, D. J.; Greenfield, E. J.; Hoehn, R. E.; Lapoint, E. Carbon storage and sequestration by trees in urban and community areas of the United States. Environmental Pollution 2013, 178, 229–236. [Google Scholar] [CrossRef]
- Oh, S.-G.; Son, S.-W.; Min, S.-K. Possible impact of urbanization on extreme precipitation–temperature relationship in East Asian megacities. Weather and Climate Extremes 2021, 34, 100401. [Google Scholar] [CrossRef]
- Pakhira, R.; Biswas, S.; Singh, H. Urbanization and Climate Change: Impacts, Adaption and Mitigation Strategies. In Urban Forests, Climate Change and Environmental Pollution: Physio-Biochemical and Molecular Perspectives to Enhance Urban Resilience; Singh, H., Ed.; Springer Nature Switzerland, 2024; pp. 47–72. [Google Scholar] [CrossRef]
- Paoletti, E.; Schaub, M.; Matyssek, R.; Wieser, G.; Augustaitis, A.; Bastrup-Birk, A. M.; Bytnerowicz, A.; Günthardt-Goerg, M. S.; Müller-Starck, G.; Serengil, Y. Advances of air pollution science: From forest decline to multiple-stress effects on forest ecosystem services. Environmental Pollution 2010, 158(6), 1986–1989. [Google Scholar] [CrossRef]
- Park, M.-S.; Joo, S. J.; Lee, C. S. Effects of an urban park and residential area on the atmospheric CO2 concentration and flux in Seoul, Korea. Advances in Atmospheric Sciences 2013, 30(2), 503–514. [Google Scholar] [CrossRef]
- Park, M. S.; Youn, Y.-C. Development of urban forest policy-making toward governance in the Republic of Korea. Urban Forestry & Urban Greening 2013, 12(3), 273–281. [Google Scholar] [CrossRef]
- Patel, J. B.; Raval, Z. The impacts of urbanization on ecological systems: a comprehensive study of the complex challenges arising from rapid urban growth. Research Review Journal of Indian Knowledge Systems 2024, 1(1), 1–10. [Google Scholar] [CrossRef]
- Peng, J.; Tian, L.; Liu, Y.; Zhao, M.; Hu, Y. n.; Wu, J. Ecosystem services response to urbanization in metropolitan areas: Thresholds identification. Science of The Total Environment 2017, 607-608, 706–714. [Google Scholar] [CrossRef] [PubMed]
- Saxena, V. Water Quality, Air Pollution, and Climate Change: Investigating the Environmental Impacts of Industrialization and Urbanization. Water, Air, & Soil Pollution 2025, 236(2), 73. [Google Scholar] [CrossRef]
- Sim, S. T.; Kim, B.; Jeon, D.; Park, J. Changes in Public Consciousness and Policy Suggestions on Korean Forest Policy. Journal of Korean Society of Forest Science 2023, 112(4), 530–543. [Google Scholar] [CrossRef]
- Skeldon, R. Migration, climate change and the futures of global population redistribution. New Zealand Economic Papers 2025, 59(1), 41–45. [Google Scholar] [CrossRef]
- Song, W.; Deng, X. Effects of Urbanization-Induced Cultivated Land Loss on Ecosystem Services in the North China Plain. Energies 2015, 8(6), 5678–5693. [Google Scholar] [CrossRef]
- Tavares, P. A.; Beltrão, N.; Guimarães, U. S.; Teodoro, A.; Gonçalves, P. Urban Ecosystem Services Quantification through Remote Sensing Approach: A Systematic Review. Environments 2019, 6(5), 51. [Google Scholar] [CrossRef]
- Wang, H.-I.; Manolas, C.; Xanthidis, D. Statistical analysis with Python. In Handbook of computer programming with Python; Chapman and Hall/CRC, 2022; pp. 373–408. Available online: https://www.taylorfrancis.com/chapters/edit/10.1201/9781003139010-9/statistical-analysis-python-han-wang-christos-manolas-dimitrios-xanthidis.
- Wang, J.; Zhou, W.; Pickett, S. T. A.; Yu, W.; Li, W. A multiscale analysis of urbanization effects on ecosystem services supply in an urban megaregion. Science of The Total Environment 2019, 662, 824–833. [Google Scholar] [CrossRef] [PubMed]
- Wellmann, T.; Schug, F.; Haase, D.; Pflugmacher, D.; van der Linden, S. Green growth? On the relation between population density, land use and vegetation cover fractions in a city using a 30-years Landsat time series. Landscape and Urban Planning 2020, 202, 103857. [Google Scholar] [CrossRef]
- Zhuang, J.; Khaskheli, M. B.; Shen, C.; Jafri, M. A. H.; Shamsi, I. H. A comparative study of economic activity and sustainable development in China and Three South Asian Countries. Discover Sustainability 2025, 6(1), 170. [Google Scholar] [CrossRef]
Figure 1.
The geographical location of Seoul, South Korea, along with its eight designated congressional districts.
Figure 1.
The geographical location of Seoul, South Korea, along with its eight designated congressional districts.
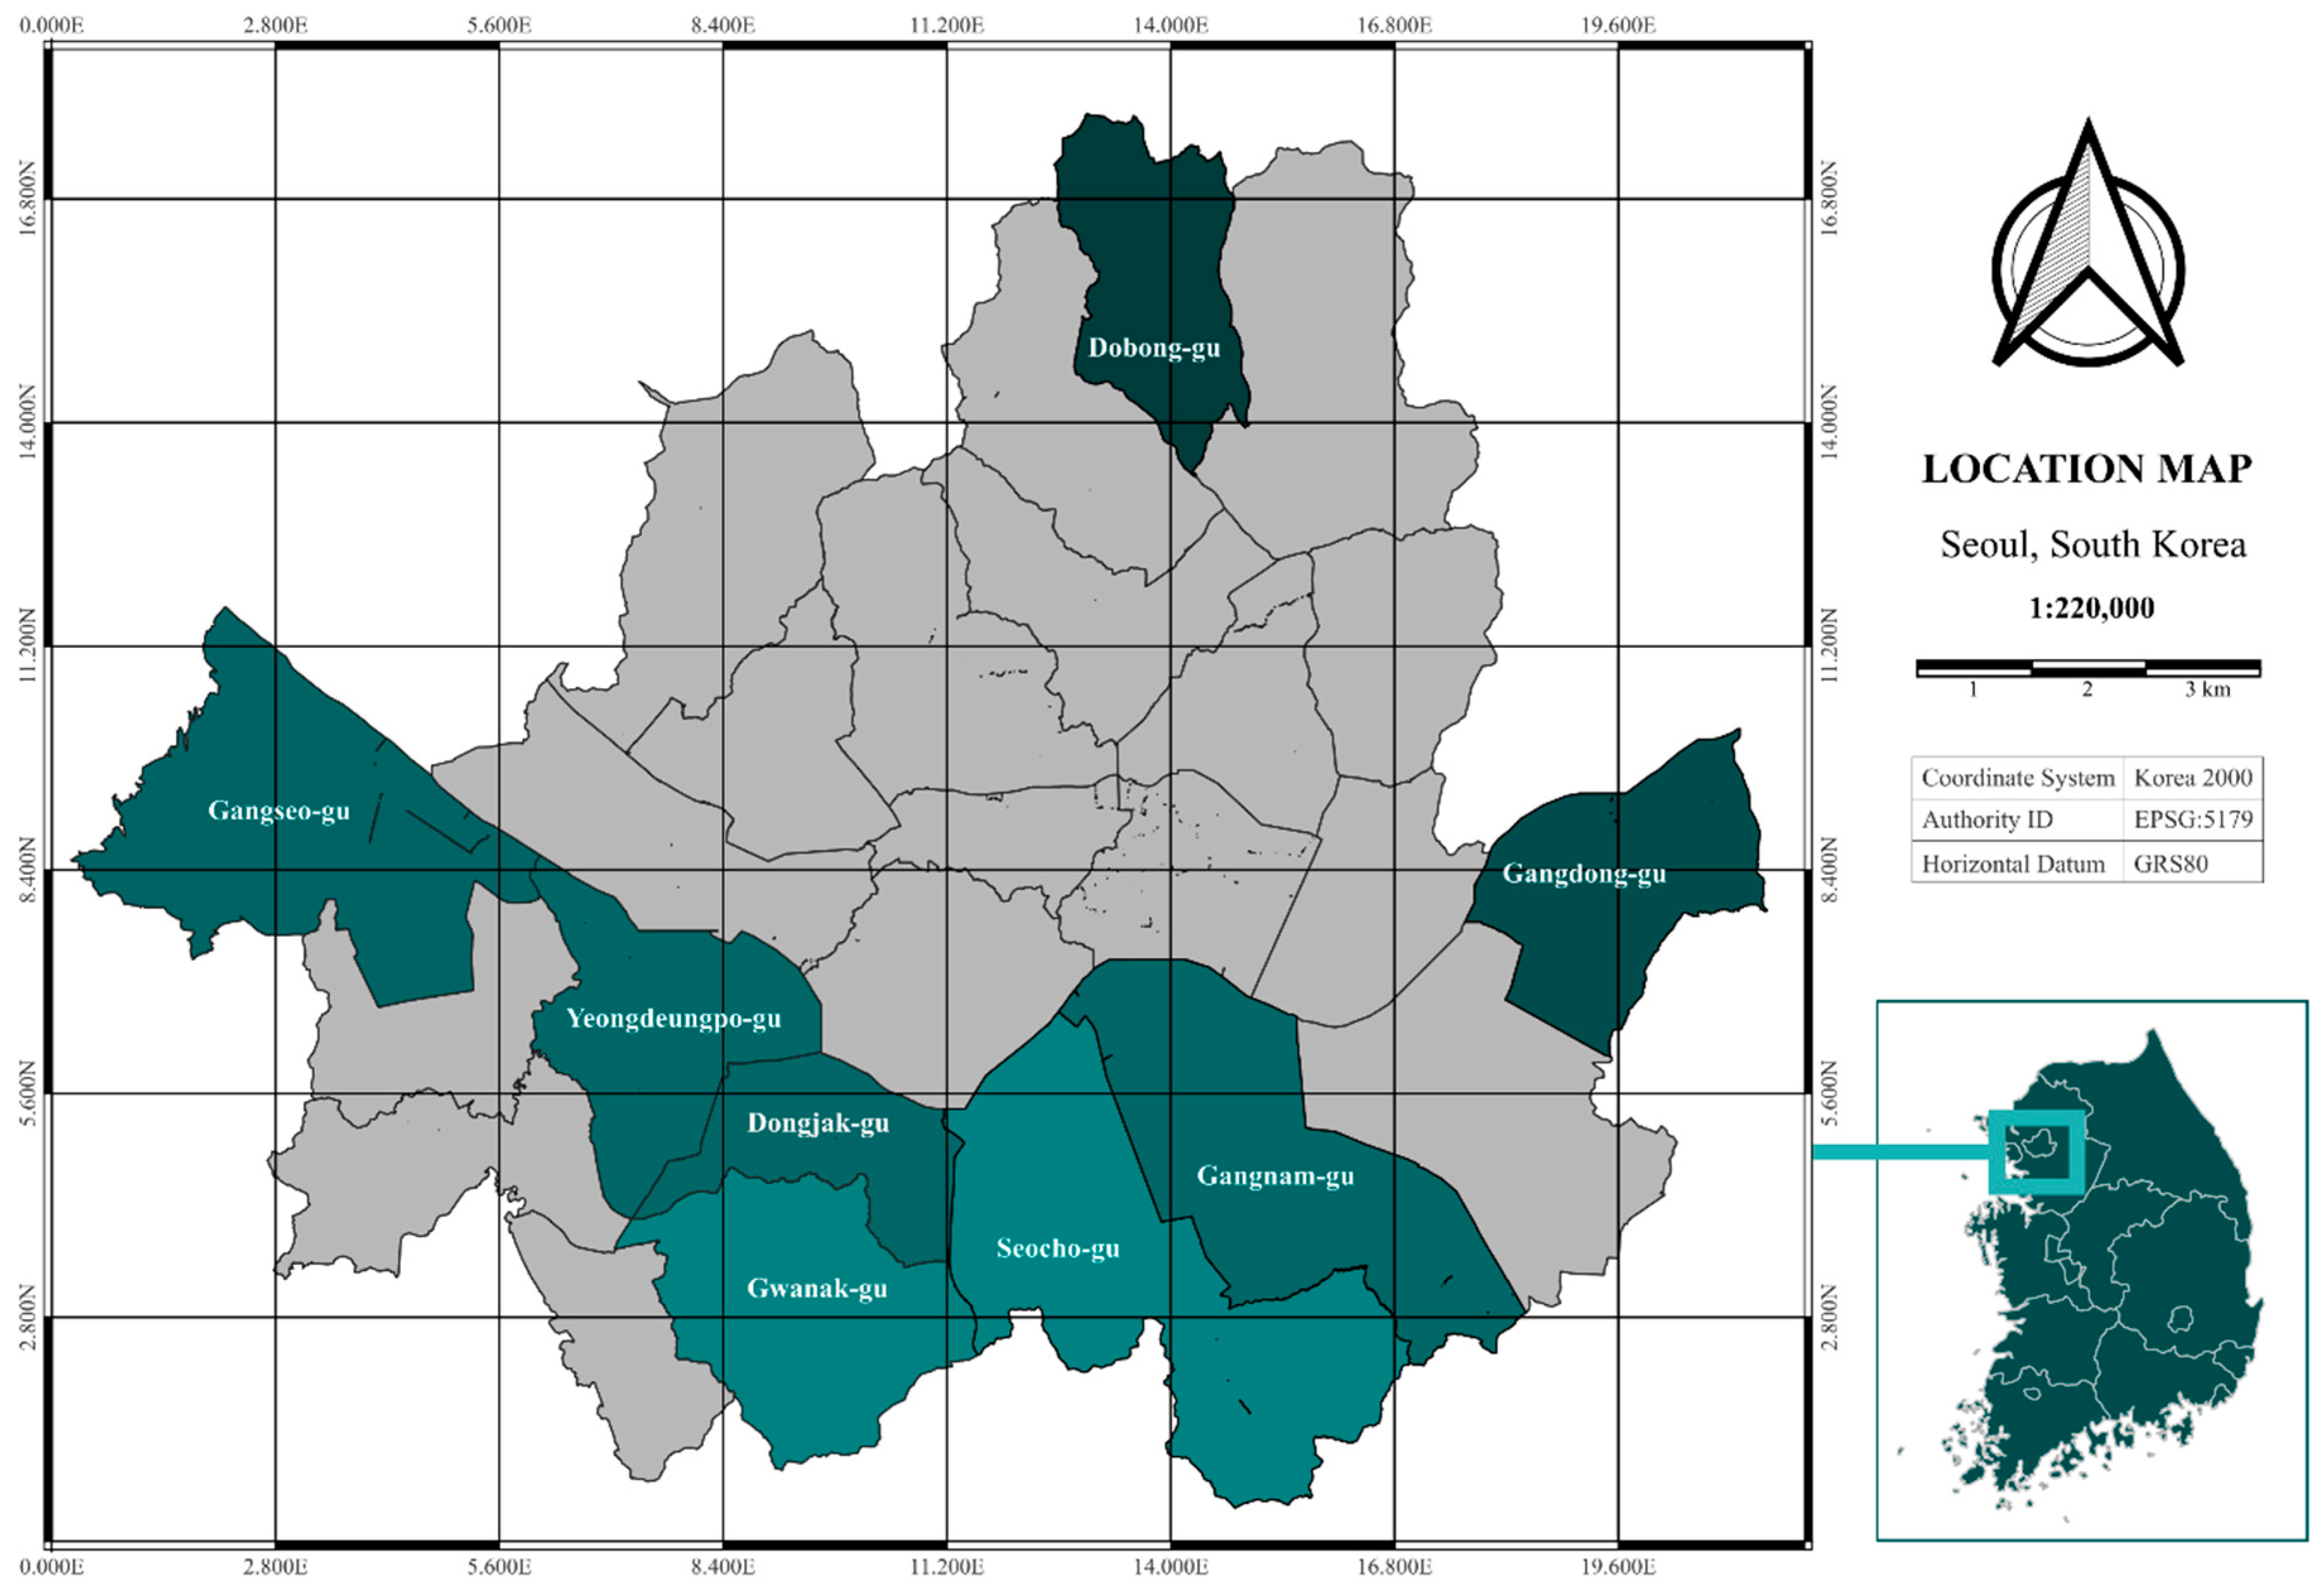
Figure 2.
Methodological flow for quantifying regulating ES from urban tree canopy across eight administrative districts of Seoul City.
Figure 2.
Methodological flow for quantifying regulating ES from urban tree canopy across eight administrative districts of Seoul City.
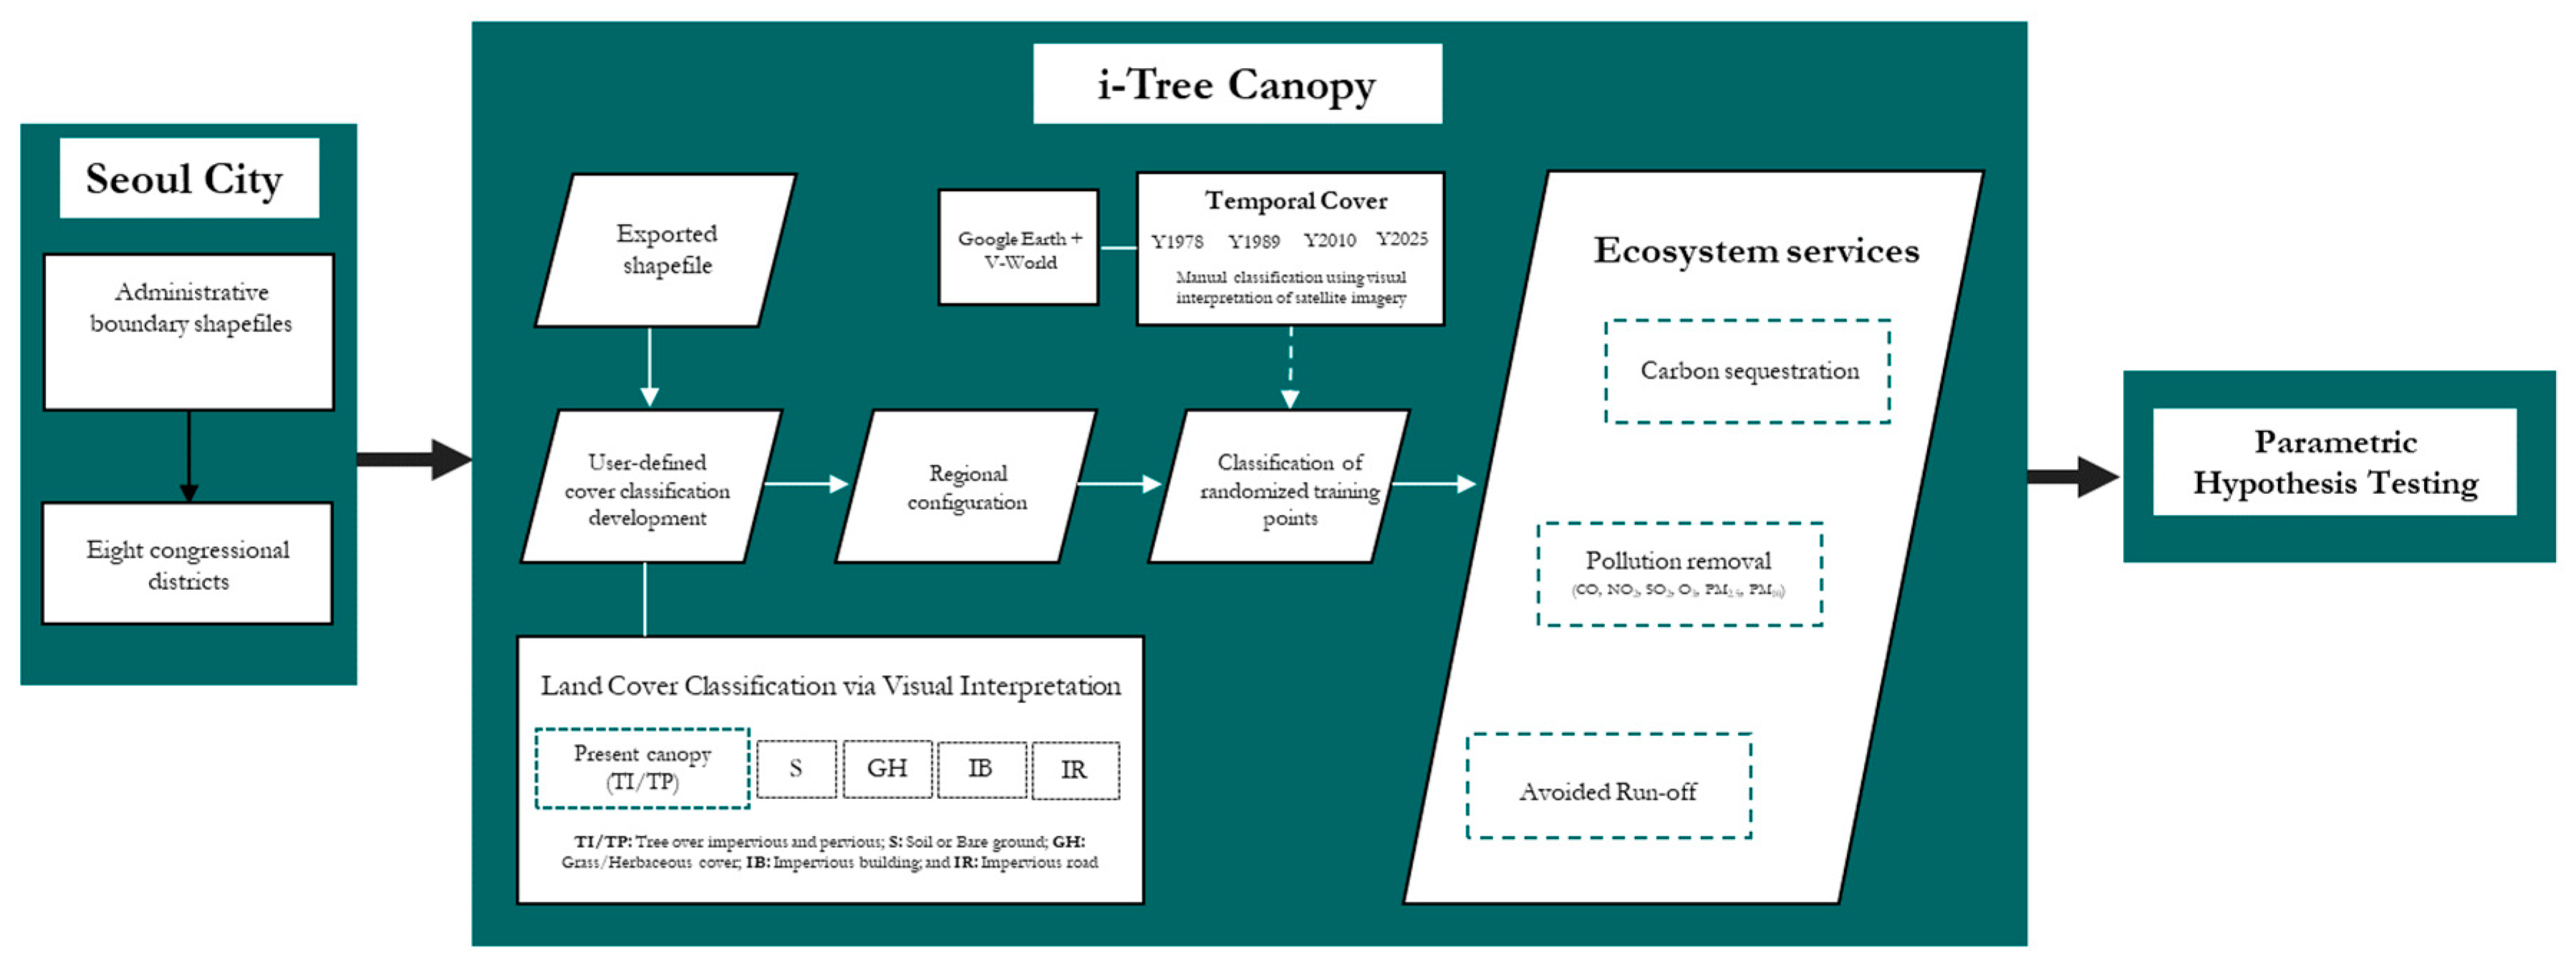
Figure 3.
Estimated temporal variation of ecosystem services. Different lowercase superscripts represent significant differences across temporal scales based on paired sample t-test (p < 0.05).
Figure 3.
Estimated temporal variation of ecosystem services. Different lowercase superscripts represent significant differences across temporal scales based on paired sample t-test (p < 0.05).
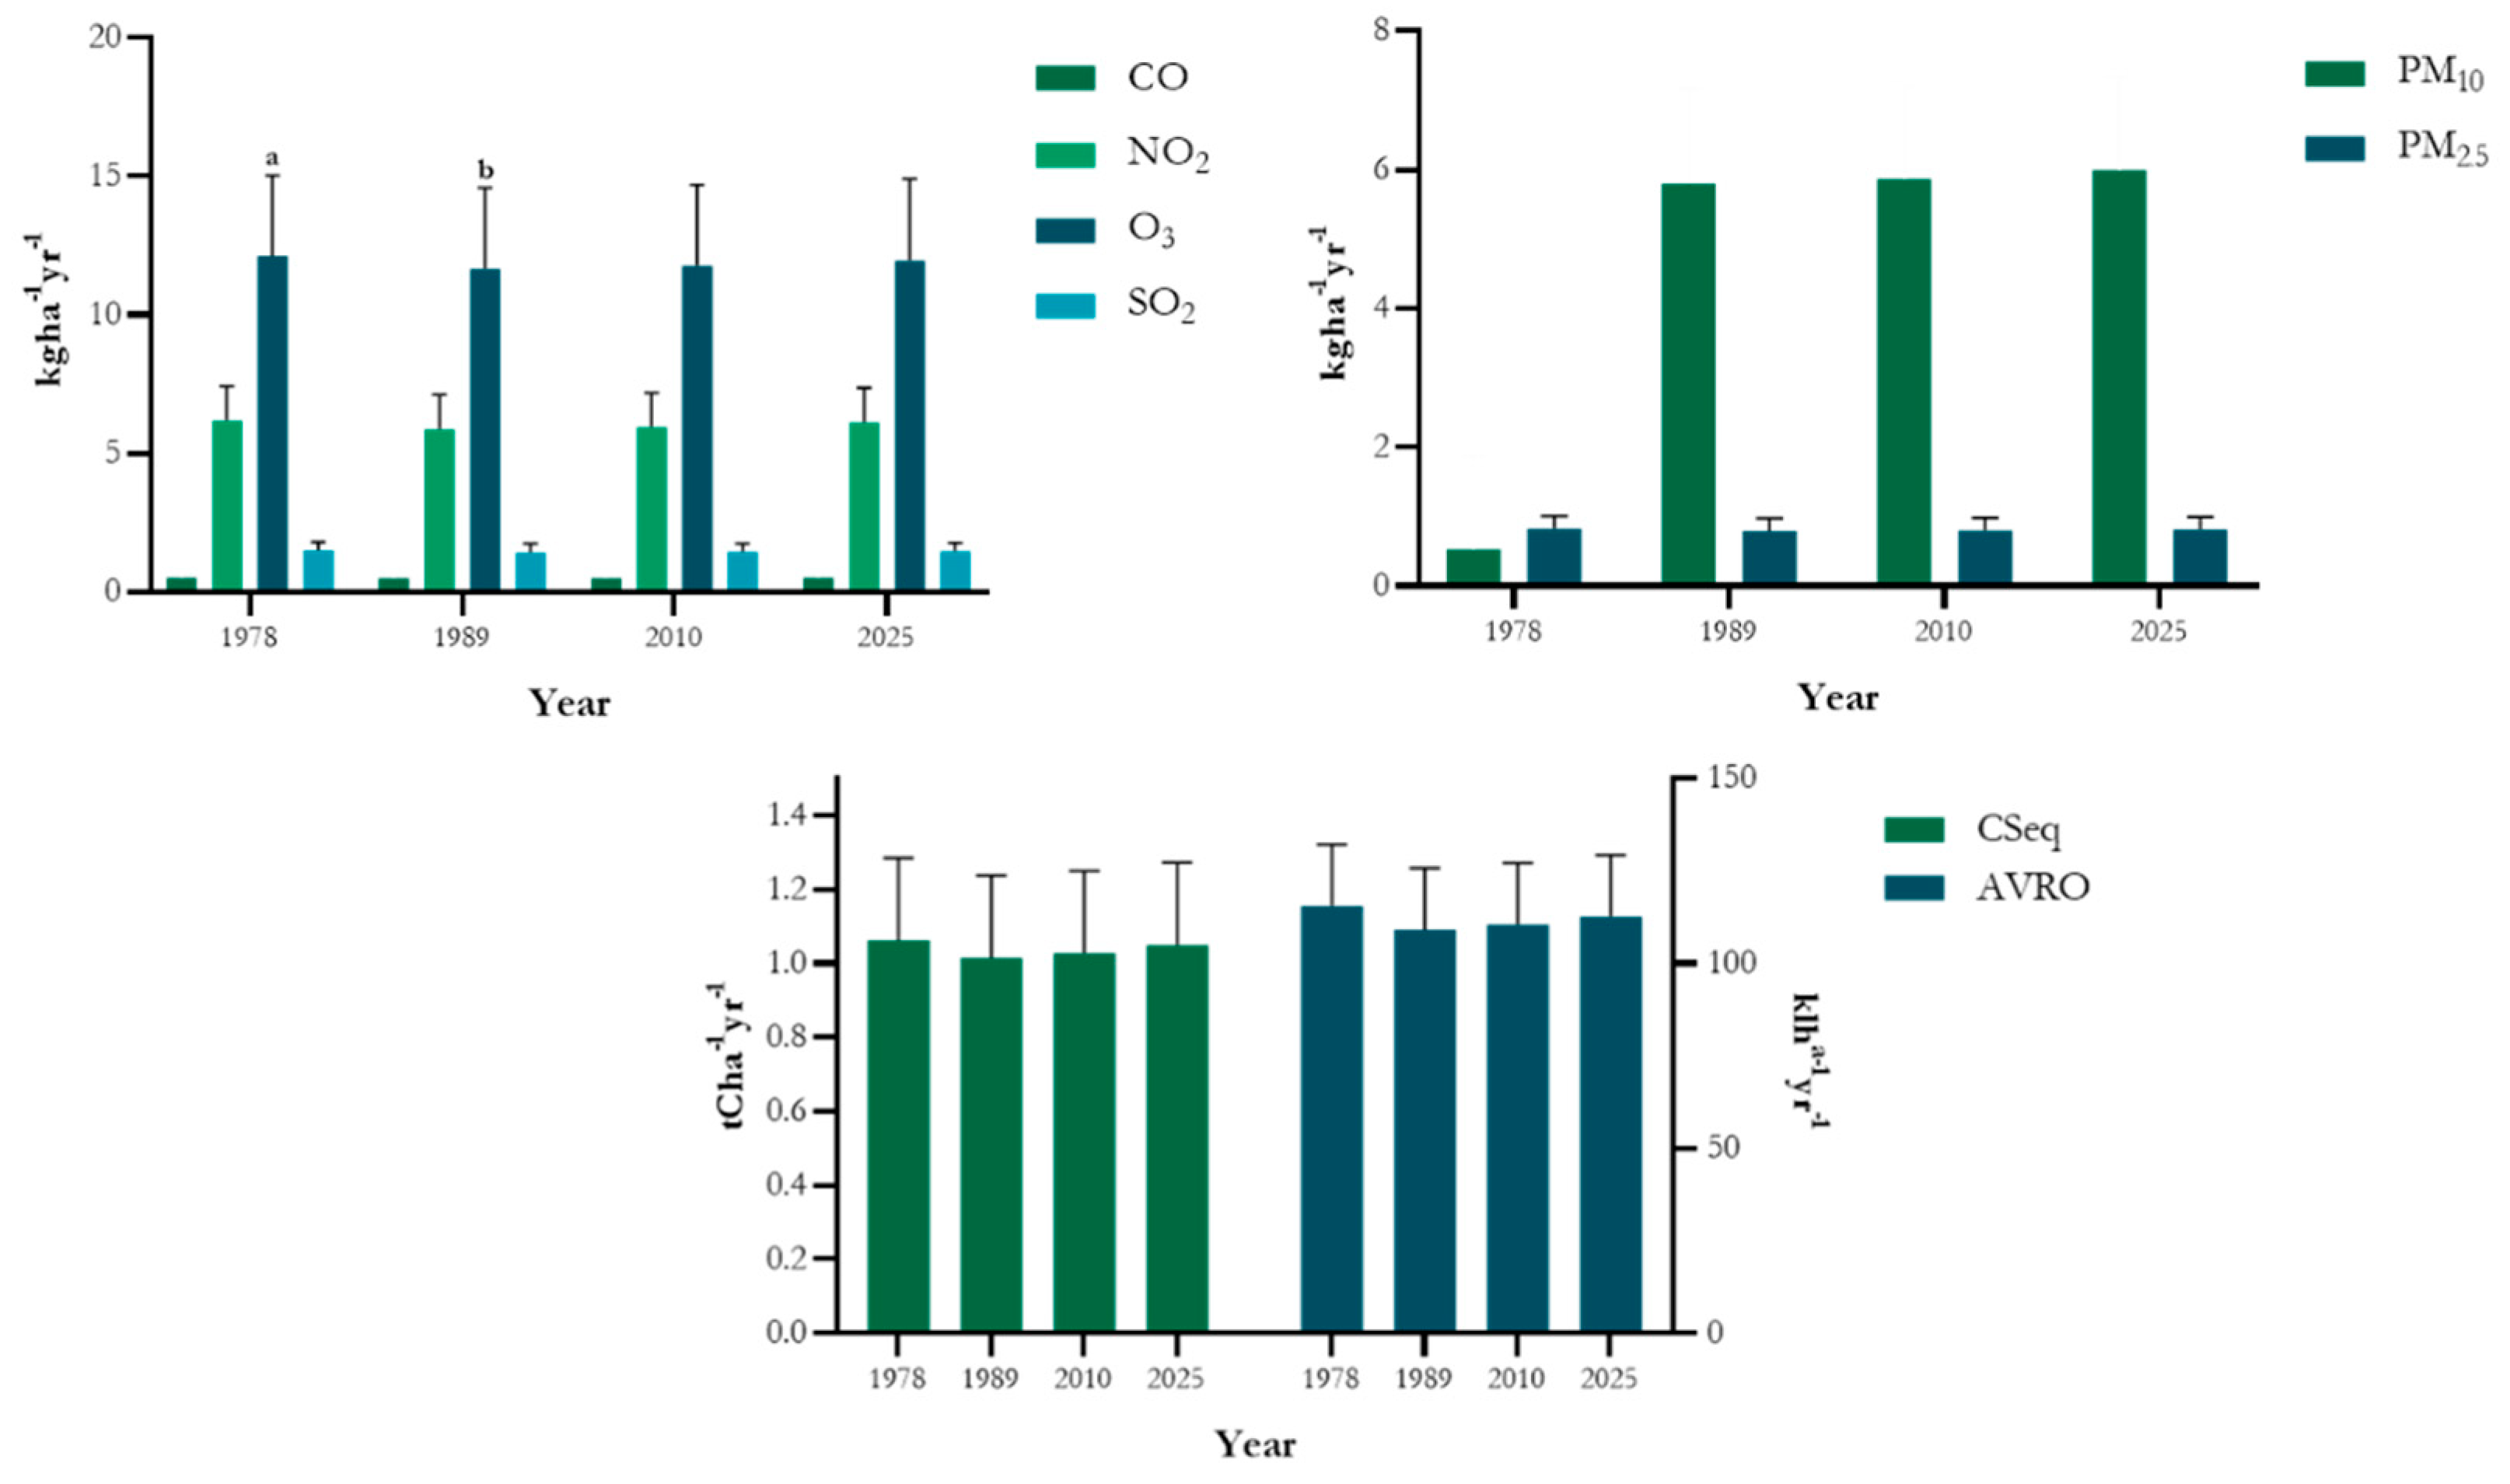
Figure 4.
Mean pollution mitigation services difference showing early decline and gradual recovery (1978–2025).
Figure 4.
Mean pollution mitigation services difference showing early decline and gradual recovery (1978–2025).
Disclaimer/Publisher’s Note: The statements, opinions and data contained in all publications are solely those of the individual author(s) and contributor(s) and not of MDPI and/or the editor(s). MDPI and/or the editor(s) disclaim responsibility for any injury to people or property resulting from any ideas, methods, instructions or products referred to in the content. |
© 2025 by the authors. Licensee MDPI, Basel, Switzerland. This article is an open access article distributed under the terms and conditions of the Creative Commons Attribution (CC BY) license (http://creativecommons.org/licenses/by/4.0/).
Copyright: This open access article is published under a Creative Commons CC BY 4.0 license, which permit the free download, distribution, and reuse, provided that the author and preprint are cited in any reuse.


